the Creative Commons Attribution 4.0 License.
the Creative Commons Attribution 4.0 License.
 | 02 Dec 2020
Measurement report: Important contributions of oxygenated compounds to emissions and chemistry of volatile organic compounds in urban air
Caihong Wu
Chaomin Wang
Sihang Wang
Wenjie Wang
Jipeng Qi
Baolin Wang
Hongli Wang
Chen Wang
Wei Song
Xinming Wang
Weiwei Hu
Shengrong Lou
Chenshuo Ye
Yuwen Peng
Zelong Wang
Yibo Huangfu
Yan Xie
Manni Zhu
Junyu Zheng
Xuemei Wang
Bin Jiang
Zhanyi Zhang
Min Shao
Volatile organic compounds (VOCs) play important roles in the tropospheric atmosphere. In this study, VOCs were measured at an urban site in Guangzhou, one of the megacities in the Pearl River Delta (PRD), using a gas chromatograph–mass spectrometer/flame ionization detection (GC–MS/FID) and a proton transfer reaction time-of-flight mass spectrometer (PTR-ToF-MS). Diurnal profile analyses show that stronger chemical removal by OH radicals for more reactive hydrocarbons occurs during the daytime, which is used to estimate the daytime average OH radical concentration. In comparison, diurnal profiles of oxygenated volatile organic compounds (OVOCs) indicate evidence of contributions from secondary formation. Detailed source analyses of OVOCs, using a photochemical age-based parameterization method, suggest important contributions from both primary emissions and secondary formation for measured OVOCs. During the campaign, around 1700 ions were detected in PTR-ToF-MS mass spectra, among which there were 462 ions with noticeable concentrations. VOC signals from these ions are quantified based on the sensitivities of available VOC species. OVOC-related ions dominated PTR-ToF-MS mass spectra, with an average contribution of 73 % ± 9 %. Combining measurements from PTR-ToF-MS and GC–MS/FID, OVOCs contribute 57 % ± 10 % to the total concentration of VOCs. Using concurrent measurements of OH reactivity, OVOCs measured by PTR-ToF-MS contribute greatly to the OH reactivity (19 % ± 10 %). In comparison, hydrocarbons account for 21 % ± 11 % of OH reactivity. Adding up the contributions from inorganic gases (48 % ± 15 %), ∼ 11 % (range of 0 %–19 %) of the OH reactivity remains `missing”, which is well within the combined uncertainties between the measured and calculated OH reactivity. Our results demonstrate the important roles of OVOCs in the emission and evolution budget of VOCs in the urban atmosphere.
- Article
(2409 KB) - Full-text XML
-
Supplement
(1471 KB) - BibTeX
- EndNote


Volatile organic compounds (VOCs) play important roles in the tropospheric atmosphere. The oxidation of VOCs by various oxidants contributes to the formation of ground-level ozone (O3) and secondary organic aerosols (SOAs; Louie et al., 2013; Ran et al., 2011), influencing both regional air quality and climate change (Fry et al., 2014). Some selected VOCs (e.g., benzene and formaldehyde) are harmful to human health, especially in urban environments (Simpson et al., 2013).
Oxygenated volatile organic compounds (OVOCs) are an important group of VOCs. OVOCs mainly consist of aldehydes and ketones, low molecular organic acids, and organic alcohols. The sources of OVOCs in the environment are complicated. They can be emitted from primary anthropogenic emissions such as vehicle exhaust (Gentner et al., 2013), biomass burning (Gilman et al., 2015), and industries (Kim et al., 2008) and also can be formed by the photo-oxidation of other VOCs in the atmosphere (Millet et al., 2015). Besides anthropogenic sources, biogenic emissions are reported to contribute significantly to many OVOCs species (Park et al., 2013). The oxidation of OVOCs by various oxidants and their direct photolysis can have an important effect on the radical budget and formations of secondary pollutants in the atmosphere (Mellouki et al., 2015).
The total OH reactivity can intuitively and effectively characterize the contributions of various VOCs to atmospheric chemical reactions, especially with respect to the generation of secondary pollutants (Yang et al., 2016). OVOCs have been reported as being a large contributor to the total OH reactivity in a variety of environments (Gilman et al., 2013; Pfannerstill et al., 2019). Aldehydes and other OVOCs were found to contribute 30 %–50 % of the modeled urban VOC reactivity (up to 30 s−1; Lou et al., 2010). In large cities, OVOCs contributed between 11 % and 24 % of OH reactivity (Mao et al., 2010; Kim et al., 2016). Even though there have been a great number of studies focusing on OH reactivity measurements, substantial differences between measured and calculated or modeled OH reactivity, termed the missing reactivity, were revealed in many field campaigns (Dolgorouky et al., 2012; Hansen et al., 2014; Praplan et al., 2017). Unmeasured primary and secondary organic species produced by photochemical oxidation in the atmosphere likely contributed to the missing reactivity (Karl et al., 2009; Wolfe et al., 2011; Ferracci et al., 2018). The unmeasured OVOC species have proved to contribute large fractions to the missing reactivity, based on previous observation studies (Kim et al., 2016) and model simulations (Lou et al., 2010; Whalley et al., 2016).
Proton transfer reaction mass spectrometry (PTR-MS) has been demonstrated to effectively detect many VOCs in the atmosphere with a fast response time and high sensitivity (Yuan et al., 2017; de Gouw and Warneke, 2007). The applications of time-of-flight mass spectrometry (ToF-MS) in PTR-MS in recent years provide significantly higher mass resolution and measurements of the whole mass spectra (Yuan et al., 2017), which offered the opportunity to quantify many more VOC species in the atmosphere (Cappellin et al., 2012), especially the numerous oxygenated VOCs species. However, it is unrealistic to experimentally calibrate all of the VOC species (hundreds to thousands) detected in the atmosphere. Moreover, gas standards are not commercially available or easy to make in the laboratory. Several parameterization methods have been established to estimate calibration factors of the uncalibrated species measured by PTR-ToF-MS, which facilitates the investigation of these compounds in different environments (Stockwell et al., 2015; Sekimoto et al., 2017; Koss et al., 2018; Holzinger et al., 2019). However, there is only a limited number of studies to conduct such analysis in urban air to better evaluate the roles of these oxygenated species (Karl et al., 2018; Sanchez et al., 2020).
In this study, we conducted intensive observations of VOC concentrations and the total OH reactivity at an urban site in southern China. We performed a systematic analysis on diurnal profiles to investigate the photochemical losses of various hydrocarbons and the secondary formation of OVOCs. After considering VOC signals from uncalibrated species in PTR-ToF-MS, we used the combined data set to analyze contributions of different VOC groups to total VOC concentrations. A photochemical age-based parameterization method was applied to quantify the contributions from different atmospheric processes to concentrations of OVOCs. In the end, we evaluated the contributions of measured VOCs by both conventional methods and newly quantified species from PTR-ToF-MS to OH reactivity in this region.
Field measurements were conducted at an observation site in Guangzhou (113.2∘ E, 23∘ N) from September to November 2018. The sampling site (∼ 25 m above ground level) is located on the ninth floor of a building on the campus of Guangzhou Institute of Geochemistry, Chinese Academy of Sciences, which is regarded as a typical urban site in Guangzhou (Fig. S1).
2.1 VOC measurements using PTR-ToF-MS
During the campaign, a commercial PTR-QiToF-MS (Ionicon Analytik GmbH, Innsbruck, Austria) with H3O+ chemistry and NO+ chemistry was used to measure VOCs in the atmosphere. PTR-QiToF-MS is equipped with a quadrupole ion guide for effective transfer of ions from the drift tube to the time-of-flight mass spectrometer, and Qi here stands for quadrupole interface. It has been shown that the new quadrupole interface greatly improves the sensitivity of VOC detection (Sulzer et al., 2014). Ambient air was continuously introduced through an 8 m long perfluoroalkoxy (PFA) Teflon tubing (1∕4 in. or 6.35 mm) into PTR-ToF-MS with an external pump (5.0 L/min; Fig. S2). The Teflon tubing was wrapped in a self-controlled heater wire (40 ∘C) to prevent air condensation inside the tubing. During the campaign, the PTR-ToF-MS automatically switched between H3O+ and NO+ chemistry every 10–20 min. The built-in PTR-manager software (Ionicon Analytik GmbH, Innsbruck, Austria) offers the possibility to program sequences in which the instrument switches between different settings. It takes ∼ 10 s for H3O+ and ∼ 20 s for NO+ to reequilibrate when the measurement automatically switches between these two modes. The ambient measurement data during the transition period (∼ 1 min) is not considered. In each ionization mode, background measurements were automatically performed by passing ambient air through a custom-built platinum catalytical converter heated to 365 ∘C for 3 min. The mass spectra of PTR-ToF-MS were recorded every 10 s.
When the PTR-ToF-MS was running in the H3O+ ionization mode, the drift tube was operated at a pressure of 3.8 mbar, a temperature of 50 ∘C, and a voltage of 920 V, resulting in an operating E∕N (E is the electric field, and N is the number density of the gas in the drift tube) ratio of ∼ 120 Td. In this condition, the fractions of water-clustered ions are small, and the fragmentation of most VOC product ions is not significant (Fig. S3; de Gouw and Warneke, 2007; Yuan et al., 2017). In this study, VOCs measured by H3O+ chemistry will be shown. The additional species measured by NO+ chemistry are discussed in a companion paper (Wang et al., 2020a). Higher alkanes measured by NO+ chemistry will be used in Sect. 3.4 for OH reactivity calculation.
A 16-component VOC gas standard (Apel Riemer Environmental Inc.) was used for daily calibrations under both dry (RH < 1 %) and ambient humidity during the campaign. As shown in Fig. S3, the obtained VOC sensitivities from automatical calibrations indicate quite stable instrumental performance during the campaign. An additional VOC gas standard with 23 components (Linde Spectra environmental gases) was used during the later period of this campaign. Some additional VOCs species, including organic acids and nitrogen-containing species, were calibrated in the laboratory using a liquid calibration unit (LCU; Ionicon Analytik GmbH, Innsbruck, Austria). The sensitivities of the calibrated species are listed in Table S1. Humidity dependencies of various VOCs were determined in the laboratory with absolute humidity in the range of 0–30 mmol/mol (relative humidity of 0 %–92 % at 25 ∘C), which fully covers the humidity range encountered during the entire campaign. Figure S4 shows the humidity dependence of selected VOCs (benzene, toluene, C8 aromatics, formaldehyde, acetaldehyde, and acetone) determined from laboratory experiments. We only observed significant humidity dependence for a few selected VOC species, including formaldehyde, benzene, methanol, ethanol, and furan, consistent with the results determined by other PTR-QiToF-MS instruments or similar quadrupole interfaced PTR-ToF-MS (Yuan et al., 2017; Koss et al., 2018; Kari et al., 2018). Humidity effects were taken into account during the calculation of the concentrations for these VOCs species.
2.2 Other measurements
A total of 56 nonmethane hydrocarbons (NMHCs) were measured using a gas chromatograph–mass spectrometer/flame ionization detector (GC–MS/FID) system coupled with a cryogen-free preconcentration device (Wang et al., 2014b). The system contains two-channel sampling and GC column separation which is able to measure C2–C5 hydrocarbons with the FID in one channel and measure C5–C12 hydrocarbons using MS detection in the other channel. The time resolution was 1 h, and ambient air was sampled during the first 5 min of each hour for both channels with a flow of 300 mL/min. The uncertainties for VOC measurements by GC–MS/FID are estimated to be 15 %–20 % (Wang et al., 2014b; Yuan et al., 2012a). In addition to PTR-ToF-MS, formaldehyde was also measured by a custom-built online instrument based on the Hantzsch reaction and absorption photometry from 16 October to 20 November 2018. A detailed description of this instrument can be found in Zhu et al. (2020).
Intercomparisons between different instruments for overlapped VOC species were carefully evaluated. Good agreements for toluene, styrene, C8 aromatics, and C9 aromatics between PTR-ToF-MS and GC–MS/FID were obtained during the campaign (Fig. S5). Formaldehyde measured by PTR-ToF-MS shows good correlation with the Hantzsch formaldehyde instrument (R=0.83), but concentrations measured by the Hantzsch formaldehyde instrument are significantly higher than PTR-ToF-MS (slope = 2.45). The reason for the large discrepancy is unknown. In the following discussions, formaldehyde measured by PTR-ToF-MS will be used. Total OH reactivity was measured by the comparative reactivity method (CRM; Sinha et al., 2008). The CRM system consists of three major components, namely an inlet and calibration system, a reactor, and a measuring system. Here, pyrrole (C4H5N) was used as the reference substance in CRM and was quantified by a quadrupole PTR-MS (Ionicon Analytik GmbH, Innsbruck, Austria). The calibration of the CRM system was conducted using the single-species gas standard with propane and propene, respectively (Huayuan Gas Ltd, China). Measured and calculated OH reactivity agreed well within the uncertainty for all calibrations. The OH reactivity measurement by the CRM method is interfered from high concentrations of ambient NO, which produce additional OH radicals via the recycling of HO2 radicals (Sinha et al., 2008; Dolgorouky et al., 2012; Michoud et al., 2015). A series of experiments were conducted in the field to quantify the interference from NO by introducing different levels of NO (0–100 parts per billion – ppb) and given amounts of VOC gas standard into the CRM reactor. A correction curve was derived from these NO interference experiments and was used to correct the obtained OH reactivity according to simultaneously measured ambient NO concentrations. The detection limits of the CRM methods in this campaign were around 5 s−1, and the total uncertainty was estimated to be about 20 %.
An iodide-adduct time-of-flight chemical ionization mass spectrometer (ToF-CIMS; Aerodyne Research, Inc.) coupled with a Filter Inlet for Gases and Aerosols (FIGAERO) inlet was used to measure oxygenated VOCs in ambient air (Wang et al., 2020b). The FIGAERO sampling assembly switches the airflow between two inlets, with one designed for gases and the other for chemicals thermally desorbed from aerosols, which provides the online measurements of species from both the gas phase and particle phase (Thornton et al., 2020; Lopez-Hilfiker et al., 2014). Air-quality-related trace gases (including O3, NO, NO2, NOx, CO, SO2, and CH4) together with meteorological data (i.e., temperature, solar radiation, precipitation, relative humidity, wind speed, and wind direction) were also continuously measured in this campaign. Photolysis frequencies of H2O2, HCHO, HONO, NO2, NO3, and O1D were obtained from measurements by a PFS-100 photolysis spectrometer (Focused Photonics Inc.).
3.1 Characteristics of selected VOCs
Diurnal variations in selected VOC species measured by PTR-ToF-MS are shown in Fig. 1. The time stamps are the middle time of the respective hourly data bin (e.g., 10 for data averaged between 09:30 and 10:30 local time – LT; hereinafter all times are given in LT).

Figure 1Diurnal variations in selected VOCs measured by PTR-ToF-MS during the campaign. Blue lines and shading represent averages and standard deviations, respectively.
Diurnal variations in hydrocarbons are controlled by multiple atmospheric processes, including variability in primary emissions, chemical removal by reactions with oxidants (e.g., OH radical, O3 and NO3), and boundary layer variations (de Gouw et al., 2017). As an abundant aromatic species, toluene had an average concentration of 1.8 ± 1.9 ppb during the campaign. Toluene concentrations varied little throughout the day, with lower concentrations during the nighttime. Another aromatic species, naphthalene, showed a similar diurnal profile to toluene, but daytime concentrations of naphthalene decreased more significantly than toluene relative to nighttime, which is as a result of higher reactivity for naphthalene ( cm3 molecule−1 s−1) than toluene ( cm3 molecule−1 s−1). The diurnal variations in aromatics with different reactivities, along with CO, are normalized to the midnight values for comparison, as shown in Fig. 2a. We can clearly observe higher daytime removal fractions for more reactive species. To further quantify this behavior, we determine the concentration ratios between measurements at 14:00 and at 06:00–08:00 for measured hydrocarbons during the campaign. The daytime removal fractions as a function of the OH rate constants of hydrocarbons are shown in Fig. 2b. Again, the daytime removal fractions that increase with larger OH rate constants are observed, with the largest daytime removal rate up to 70 %–80 % for highly reactive species, e.g., styrene and internal alkenes. Following the work of de Gouw et al. (2009), an exponential curve ( (1−exp(−kVOC[OH]t) is used to fit the data points in Fig. 2b, yielding an OH exposure of 7.2 ± 1.7×10¹⁰ molecule cm−3 s. The derived OH exposure corresponds to an average OH concentration of 3.3 ± 0.8×10⁶ molecule cm−3 between 08:00 and 14:00. The estimated OH concentration is in good agreement with the simulated average OH concentration during the same period, using an observation-constrained box model (3.4×10⁶ molecule cm−3; Fig. 2a) which is constrained using measurements of trace gases, VOCs, photolysis frequencies, and meteorological parameters with the Master Chemical Mechanism (MCM) v3.3.1 as the chemical mechanism (Wang et al., 2020b). The box model is run using the Framework for 0-D Atmospheric Modeling (F0AM) v3.1 (Wolfe et al., 2016). The encouraging result suggests that the variations in hydrocarbons with different reactivities in the daytime could provide an approach for estimating OH concentrations in the atmosphere.
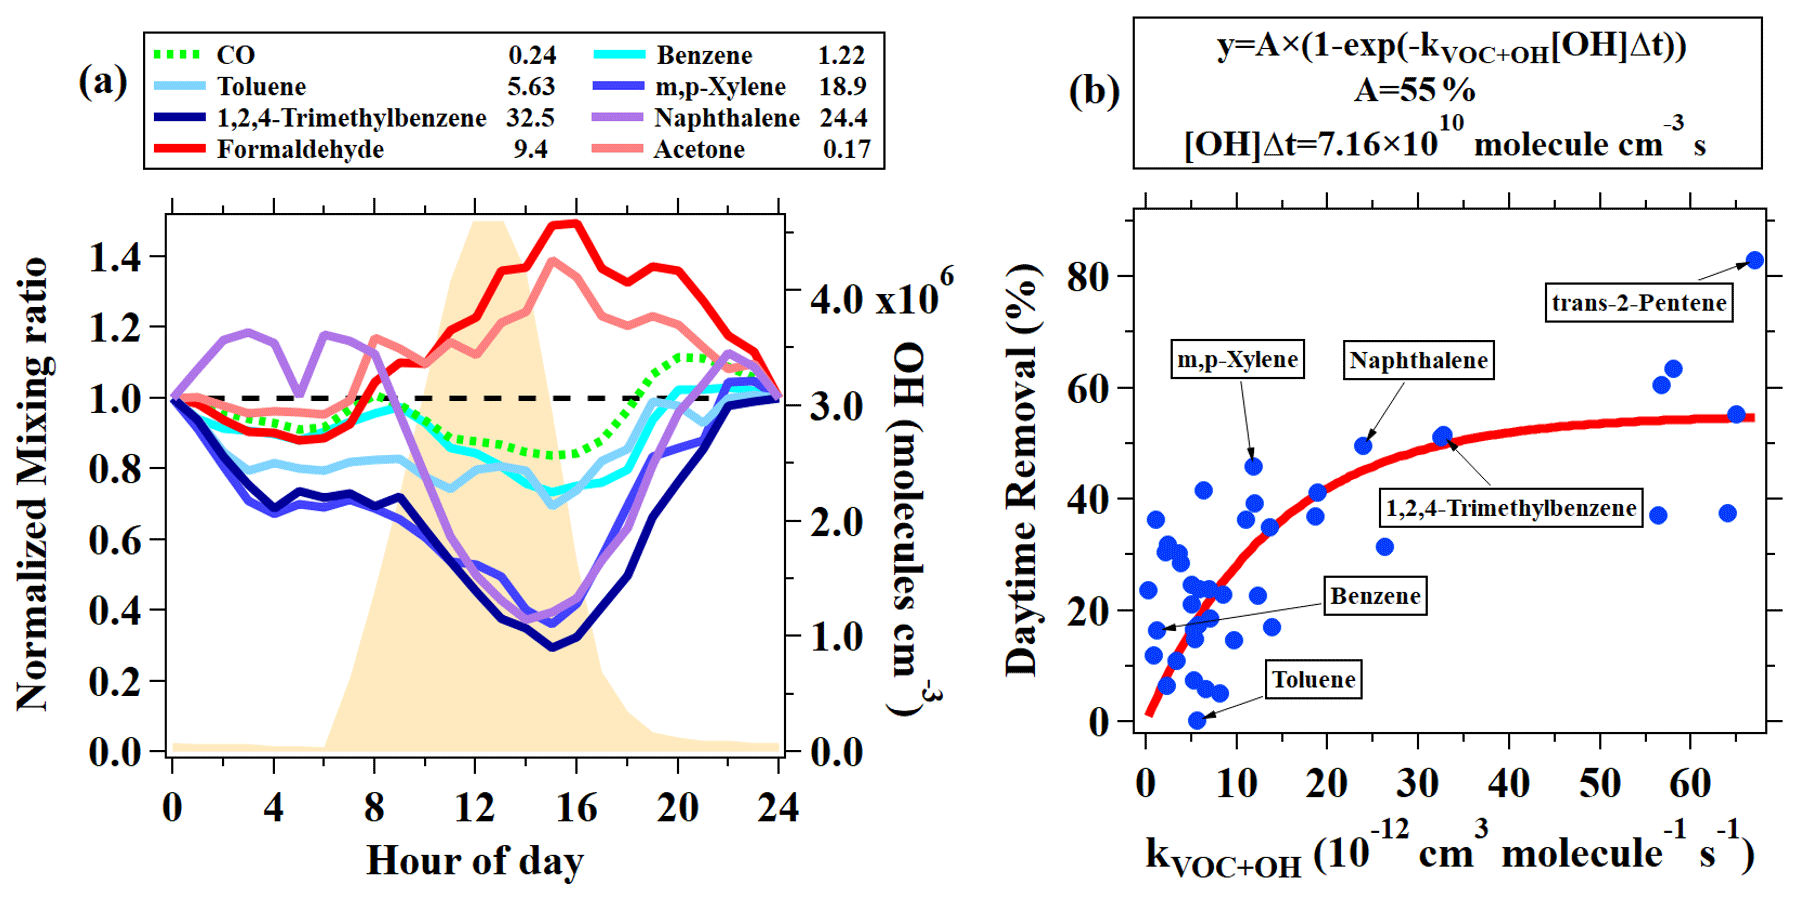
Figure 2(a) Normalized diurnal variations in CO, five aromatic hydrocarbons (benzene, toluene, m+p-Xylene, and 1,2,4-trimethylbenzene measured by GC–MS/FID and naphthalene measured by PTR-ToF-MS) and two OVOCs (formaldehyde and acetone measured by PTR-ToF-MS). The data are normalized to midnight values. The rate coefficients for the reactions with OH radicals are shown in the legend (in units of 10−12 cm3 molecule−1 s−1). The orange shading indicates the average diurnal variation in simulated OH with an observation-constrained box model. (b) Daytime removal fractions of hydrocarbons measured by GC–MS/FID and also naphthalene by PTR-ToF-MS as a function of their rate constants with OH. The daytime removal fractions for VOC species were calculated from the concentration ratio between measurements at 14:00 and at 06:00–08:00.
In addition to primary emissions, OVOCs can also be secondarily produced in the atmosphere from oxidations of other VOCs. Diurnal profiles of selected OVOCs, including formaldehyde, acetone, and methanol, are also shown in Figs. 1 and 2. Apparently, both formaldehyde and acetone had the highest concentrations in the afternoon, with daytime enhancement ratios of 1.61 and 1.45, respectively. The diurnal variations in formaldehyde and acetone indicate that secondary formation contributed significantly to their concentrations during the campaign. Different from formaldehyde and acetone, no daytime enhancement was observed for methanol. The diurnal profile of methanol follows well with other species with similarly low reactivity, e.g., CO and benzene, indicating that methanol is mainly contributed by primary emissions. In addition to the three common OVOC species, the diurnal profile of cresol, one of the first-generation oxidation products of toluene (Schwantes et al., 2017), is also shown in Fig. 1. As a highly reactive species (4.1– cm3 molecule−1 s−1 for different isomers), cresol concentrations show large enhancements in the afternoon, indicating strong secondary formation during the daytime. A minor peak of cresol is also observed in the evening, when other primary species also increased, possibly due to traffic emissions during this period. It implies that cresol may also be emitted by primary sources, e.g., vehicle exhausts.
Biogenic emissions are also an important source of VOCs in the atmosphere, with isoprene as one of the largest components (Guenther et al., 2012). According to Fig. 1, a regular diurnal profile is observed for isoprene, with the highest concentration around noon. The two oxidation products of isoprene, namely methyl vinyl ketone (MVK) and methacrolein (MACR), were measured as its sum by PTR-ToF-MS. MVK and MACR showed similar diurnal variation to isoprene, with a somewhat later peak time than isoprene.
Another interesting VOC species included in Fig. 1 is furan (C4H4O). Furan produces the ions with the same nominal mass as isoprene (m∕z 69) in PTR-MS, preventing its detection when using the traditional quadrupole PTR-MS. A number of PTR-ToF-MS applications have allowed the detection of furan in biomass burning plumes or in air strongly influence by biomass burning (Sarkar et al., 2016; Koss et al., 2018; Coggon et al., 2019). Here, the mass resolving power of our PTR-ToF-MS is > 3500 m ∕Δm for m∕z 50 and larger ions, which can separate well for the ion peaks of isoprene and furan (Fig. S7). An average concentration of 0.05 ± 0.03 ppb for furan was observed during the campaign. Diurnal variation in furan shows a peak concentration in the evening (∼ 20:00), with gradually decreased concentrations for the whole night, suggesting a strong evening source for furan and slow removal in the nighttime. The variations in furan concentrations during the daytime are small. Considering that furan is highly reactive ( cm3 molecule−1 s−1), it implies that furan is produced secondarily during the daytime.
3.2 Analysis of PTR-ToF-MS mass spectra
In addition to the typical individual VOCs discussed above, signals of many ions from different VOCs were observed in PTR-ToF-MS mass spectra during this campaign. A peak list with more than 1700 ions was used to perform high-resolution peak fittings by Tofware (version 3.0.3; Tofwerk AG, Switzerland) from the mass spectra of PTR-ToF-MS, among which 462 ions had noticeable concentrations in the atmosphere after performing background correction. A more detailed description of Tofware can be found elsewhere (Stark et al., 2015). As discussed in Sect. 2.2, a total of 31 VOC species were calibrated using either gas cylinders or liquid standards. For other measured VOCs, we used the method proposed in Sekimoto et al. (2017) to determine the relationship between VOC sensitivity and kinetic rate constants for proton transfer reactions of H3O+ with VOCs (detailed discussions in the Supplement). As shown in Fig. 3, a clear linear relationship was obtained. The fitted line in Fig. 3 is used to determine the sensitivities of the uncalibrated species. Following the discussions in Sekimoto et al. (2017), the uncertainties of the concentrations for uncalibrated species are around 50 %.
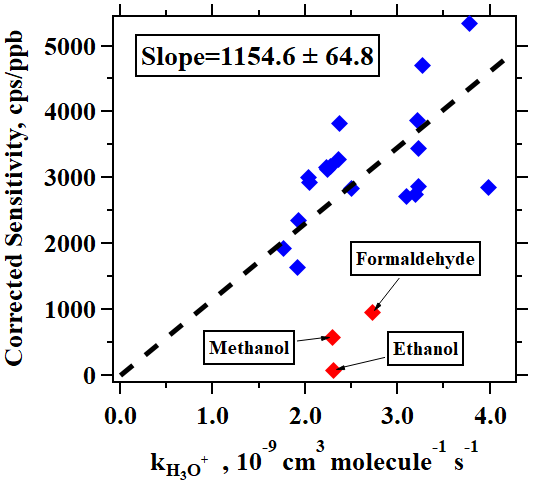
Figure 3Corrected sensitivities as a function of kinetic rate constants for proton transfer reactions of H3O+ with VOCs. The dashed line indicates the fitted line for blue points. The red points not used as these compounds (formaldehyde, methanol, and ethanol) are known to have lower sensitivities.
The average mass spectra of PTR-ToF-MS during this campaign, expressed in concentrations, is shown in Fig. 3. We divided the VOCs measured by PTR-ToF-MS into groups according to the oxygen atoms in the formula, i.e., CxHy, CxHyO1, CxHyO2, CxHyO≥3, and N∕S containing, representing hydrocarbon species (without S or N), OVOCs with one oxygen atom, OVOCs with two oxygen atoms, OVOCs with three or more oxygen atoms, and species containing nitrogen and/or sulfur, respectively. OVOC-related ions dominated the mass spectra of PTR-ToF-MS with an average contribution of 73 % ± 9 %, which mainly contained one oxygen atom (51 % ± 7 %) and two oxygen (21 % ± 6 %) compounds (Fig. 4a). OVOCs with one oxygen atom are mainly contributed by common OVOCs, e.g., formaldehyde, acetaldehyde, methanol, ethanol, acetone, MVK and MACR, and methyl ethyl ketone (MEK), which accounts for a total of 90 % of OVOCs with one oxygen atom (Fig. S7). The fraction of CxHyO≥3 in the PTR-ToF-MS mass spectra is quite low (1 % ± 1 %). The low contributions from OVOCs with three or more oxygen atoms are different from the concurrent observations of iodide ToF-CIMS during the campaign, which observed higher fractions of CxHyO≥3 than CxHyO2 in the mass spectra. These results indicate that OVOCs with more than two oxygen atoms may be underestimated by PTR-ToF-MS, possibly as a result of losses to the inlet of PTR-ToF-MS instrument used in this study (Riva et al., 2019).

Figure 4Average mass spectra obtained by PTR-ToF-MS from ambient measurements during the campaign. The different ion categories are discussed in the text in detail.
Diurnal variations and concentration ratios of daytime (06:00–18:00) relative to nighttime (18:00–06:00) for different categories of ions measured by PTR-ToF-MS are presented in Figs. 4b and 5, respectively. The CxHy and N∕S containing ions have similar diurnal profiles to hydrocarbons (Fig. 1), indicating that they are mainly from primary emissions. The different categories of OVOCs have similar diurnal profiles with higher concentrations in the daytime, and the enhancement ratio of concentration increases with the larger oxygen atom number, indicative of higher contributions from the secondary formation for these more oxidized species.
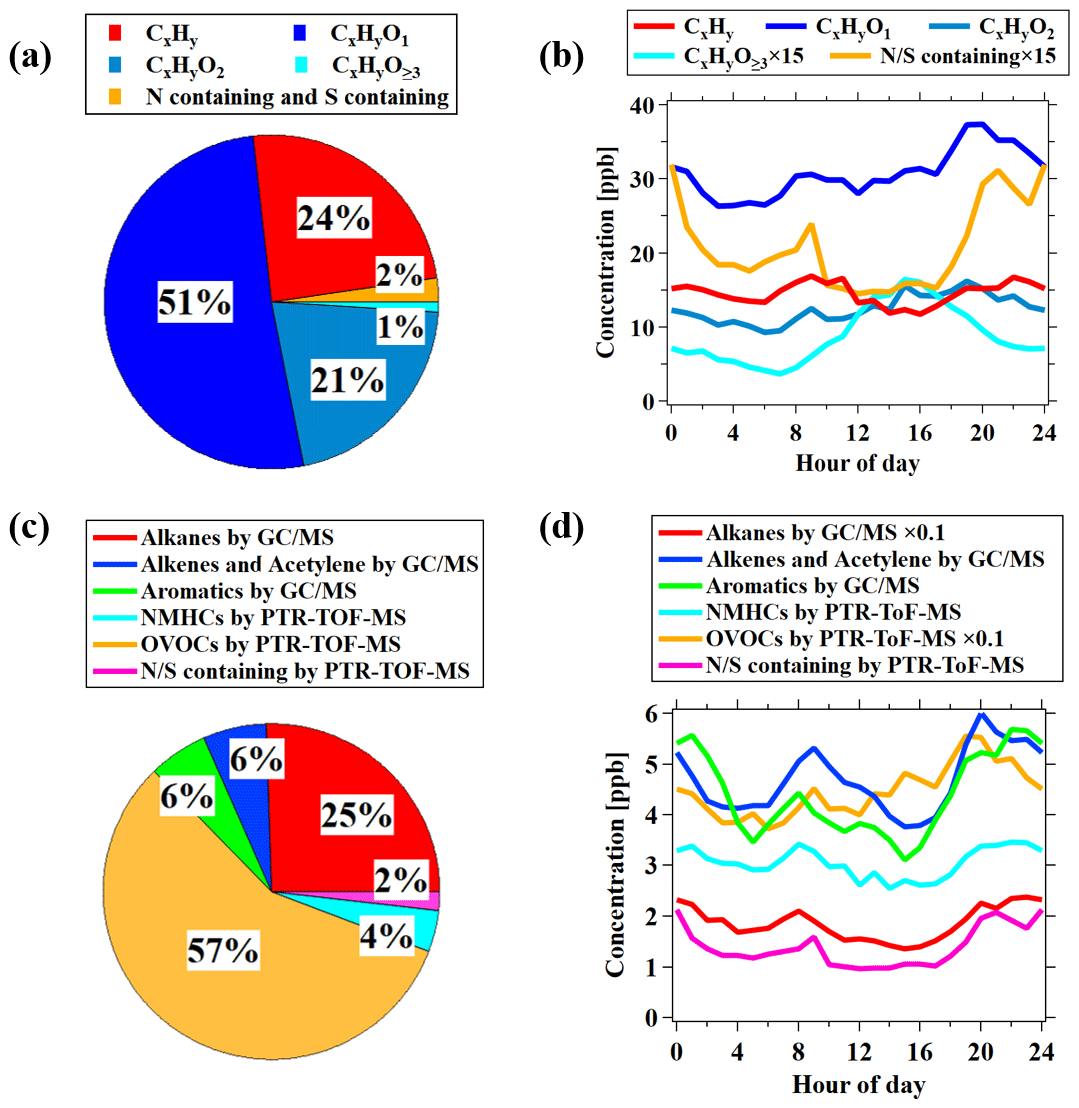
Figure 5(a) The average concentration percentage of each category measured by PTR-ToF-MS during the campaign. The different ion categories shown in (a) and (b) are discussed in the text in detail. (b) Diurnal variations in each category measured by PTR-ToF-MS during the campaign. (c) The average concentration percentage of each category of VOCs during the observation period. Alkanes, alkenes and acetylene, and aromatics were measured by GC–MS/FID, while OVOCs and N∕S-containing species were measured by PTR-ToF-MS. NMHCs measured by PTR-ToF-MS represents hydrocarbons measured by PTR-ToF-MS after removing overlapping species with GC–MS/FID (e.g., C6–C9 aromatics and isoprene). (d) Diurnal variations in each category of VOCs shown in (c) during the campaign.
Combining the measurements of different VOCs groups by GC–MS/FID and PTR-ToF-MS, we analyze their relative importance in VOCs speciation. The total concentration of OVOCs is 43.8 ± 27.4 ppb, which is significantly higher than alkanes (19.5 ± 1.4 ppb), alkenes and acetylene (4.7 ± 0.7 ppb), and aromatics (4.4 ± 0.5 ppb). The average contribution of OVOCs to the total measured VOCs is determined to be 57 % ± 10 % during the campaign (Fig. 4c–d). This result stresses that OVOCs are important components in VOCs in the urban atmosphere. The fraction of OVOCs in total the VOCs shown here is significantly higher than previous results, which usually demonstrates the dominant contribution from hydrocarbons to VOCs in urban air (Yang et al., 2018; Li et al., 2019). The higher OVOC fraction determined in the study is the result of taking into account the signals from uncalibrated species in mass spectra of PTR-ToF-MS. If only considering the six common OVOCs measured by PTR-MS, i.e., formaldehyde, acetaldehyde, methanol, acetone, MEK, and MVK and MACR (de Gouw et al., 2003; de Gouw and Warneke, 2007), the OVOC fraction in total VOCs would be only 39 % ± 7 %. It suggests the valuable information provided by PTR-ToF-MS in characterizing VOC compositions in urban air.
3.3 Source analysis of OVOCs
The variations in OVOC concentrations are influenced by the boundary layer effects, primary emissions, secondary formation, and chemical removal processes. Here, a photochemical age-based parameterization method (de Gouw, 2005; de Gouw et al., 2018; Yuan et al., 2012b) was used to quantify the contributions of primary anthropogenic emissions, secondary anthropogenic formation, biogenic emissions, and background to concentrations of various OVOCs. The photochemical age-based parameterization method for the source analysis of OVOCs is based on the following assumptions: (1) the amount of each OVOC emitted is proportional to an inert tracer (e.g., CO and acetylene C2H2); (2) the chemical removal of OVOCs is dominated by reactions with OH radicals; (3) the photochemical age can be calculated using the ratios of two hydrocarbons that react at different rates with OH radicals; and (4) biogenic sources of OVOCs are proportional to emissions of isoprene (de Gouw et al., 2005). Based on the above assumptions, the concentration of OVOCs can be expressed by Eq. (1) as follows:
where EROVOC and ERprecursor are emission ratios versus C2H2 for the OVOC and their precursors. and kprecursor are OH rate constants of C2H2 and OVOC precursors, respectively. is the rate constant of OVOC representing the combined loss to reaction with OH radicals and photolysis. [C2H2] is the concentration of acetylene, which is the tracer for primary anthropogenic sources. CO can also be used as the primary anthropogenic tracer, but the fitted results would be similar to acetylene, as there is a good correlation between CO and acetylene (R=0.93, slope = 6.62 ppb/parts per million – ppm; Fig. S10). ERbiogenic is the emission ratio of OVOCs to isoprene from biogenic emissions. Isoprenesource is calculated from concentrations of isoprene and its photochemical products of MVK and MACR (Apel et al., 2002; Stroud et al., 2001; see details in the Supplement). [background] is the background concentration of OVOCs. [OH]Δt is the OH exposure, which is calculated from the ratios between concentrations of m+p-Xylene and ethylbenzene (Yuan et al., 2013).
where kX and kE are rate constants of m+p-Xylene and ethylbenzene, respectively. is the initial concentration ratio of m+p-Xylene ∕ ethylbenzene in fresh emissions (4.0 ppb/ppb, Fig. S11). is the measured concentration ratio of m+p-Xylene ∕ ethylbenzene.
The chemical losses caused by photolysis cannot be ignored for many OVOCs, e.g., formaldehyde (de Gouw et al., 2018). Therefore, the effective rate constant is used to represent the combined loss of OH oxidation and photolysis, which can be considered as a correction factor (f) for their OH rate constant (Tables 1 and S2; see details in the Supplement for the calculation using Eq. 3).
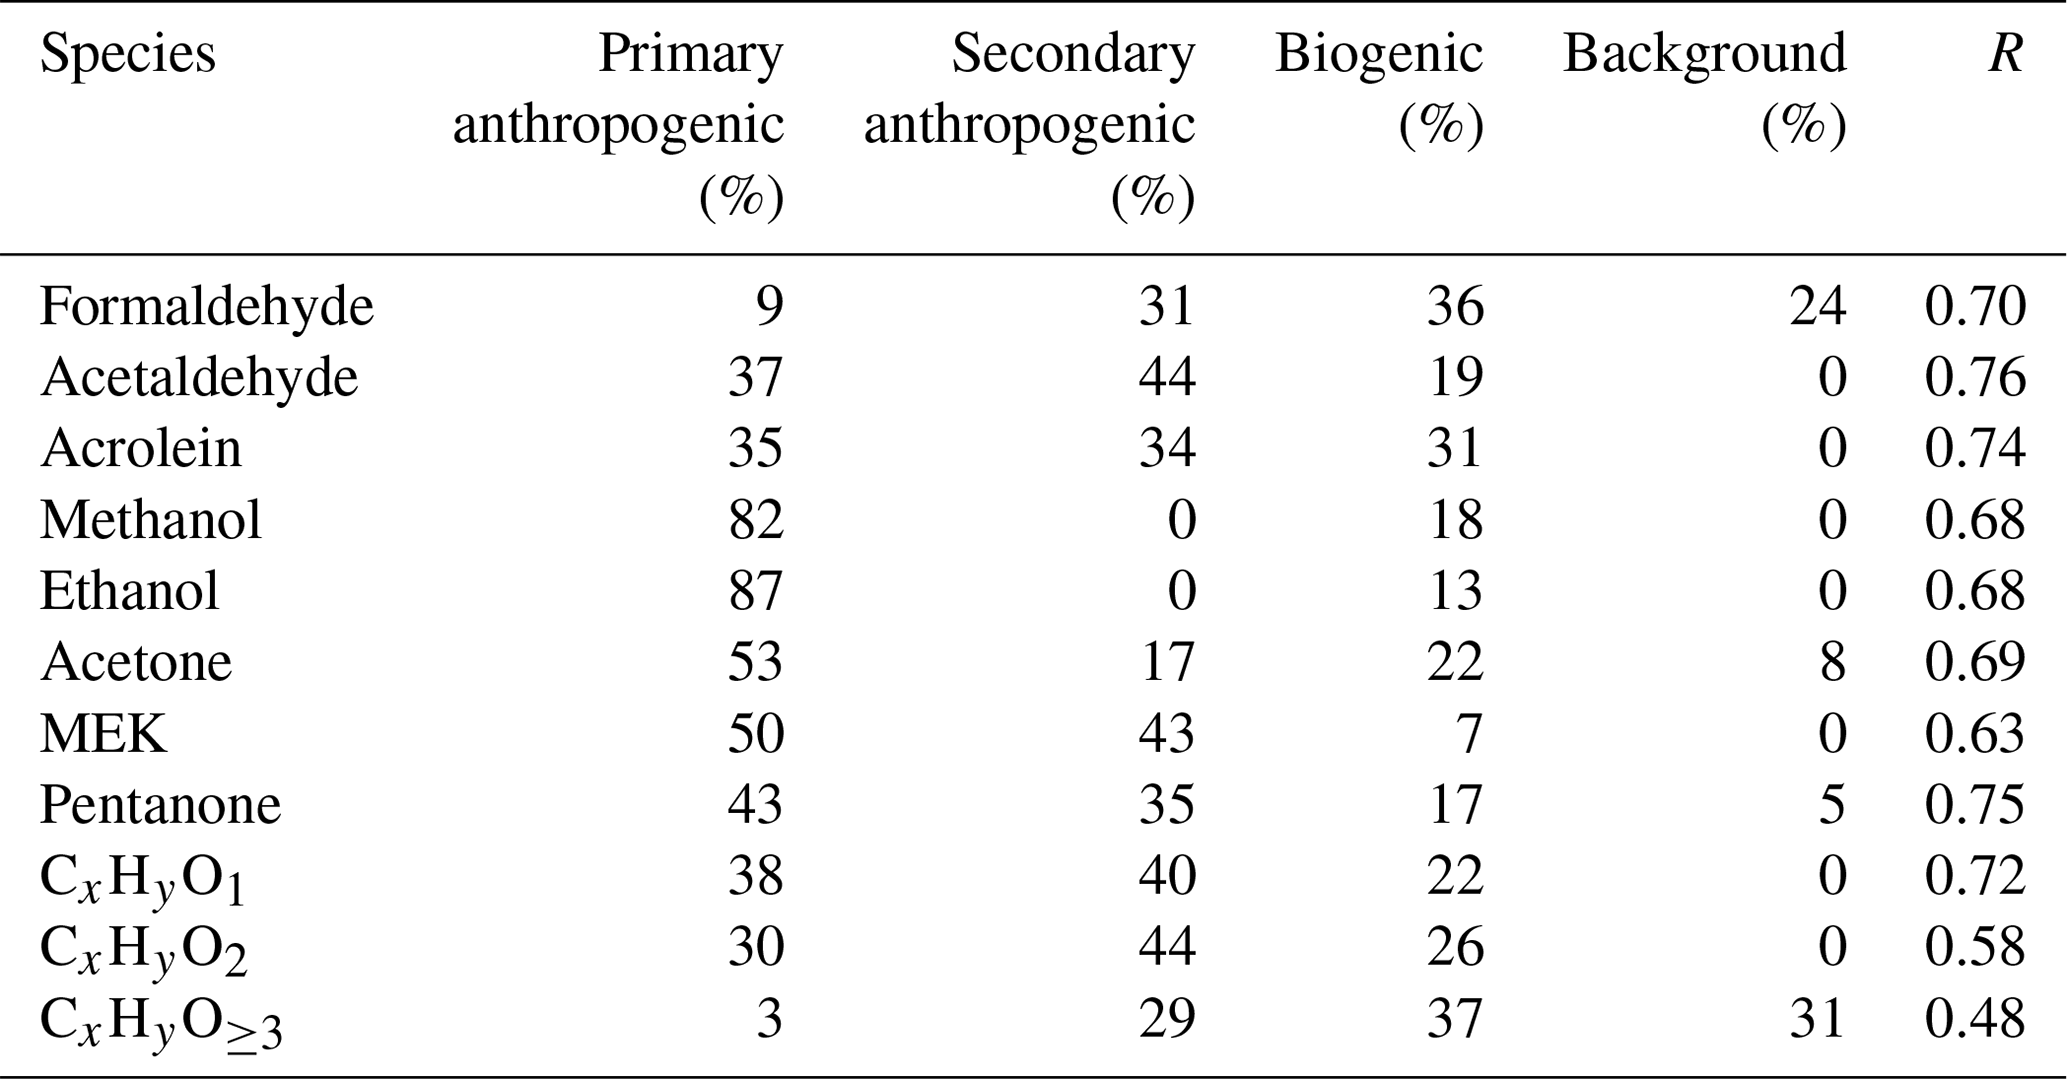
The fitting results, using Eq. (1) for formaldehyde and acetone, are shown in Fig. 6. The calculated concentrations of the two OVOCs from the four parts in Eq. (1) compared well with measured concentrations, with correlation coefficients of 0.70 and 0.69, respectively. Most of the formaldehyde concentrations are attributed to anthropogenic secondary (31 %) and biogenic sources (36 %), with minor contributions from primary anthropogenic emissions (9 %). The background level of formaldehyde was determined to be 0.16 ± 0.33 ppb, accounting for 24 % of its concentration. Acetone concentrations are dominated by anthropogenic primary emissions (53 %), consistent with previous studies (Yuan et al., 2012b; Wang et al., 2014a; Sahu and Saxena, 2015). The fitting results for other typical OVOCs are shown in Tables 2 and 3. The correlation coefficients between measured and calculated concentrations of OVOC species are relatively high (0.63–0.76). Overall, the contributions of secondary formation from anthropogenic emissions are important for aldehydes (31 %–44 %), while ketones are mainly from primary anthropogenic emissions with small contributions from secondary formation of anthropogenic sources. Alcohols have significant fractions from primary anthropogenic emissions with no observed anthropogenic secondary formation, which is in good agreement with the results in other regions (de Gouw et al., 2005; Yuan et al., 2012b). Biogenic sources account for 7 %–36 % of concentrations of different OVOCs, generally with larger fractions for aldehydes (19 %–36 %).
Table 1Rate constants of OVOCs representing the combined loss to OH and photolysis.
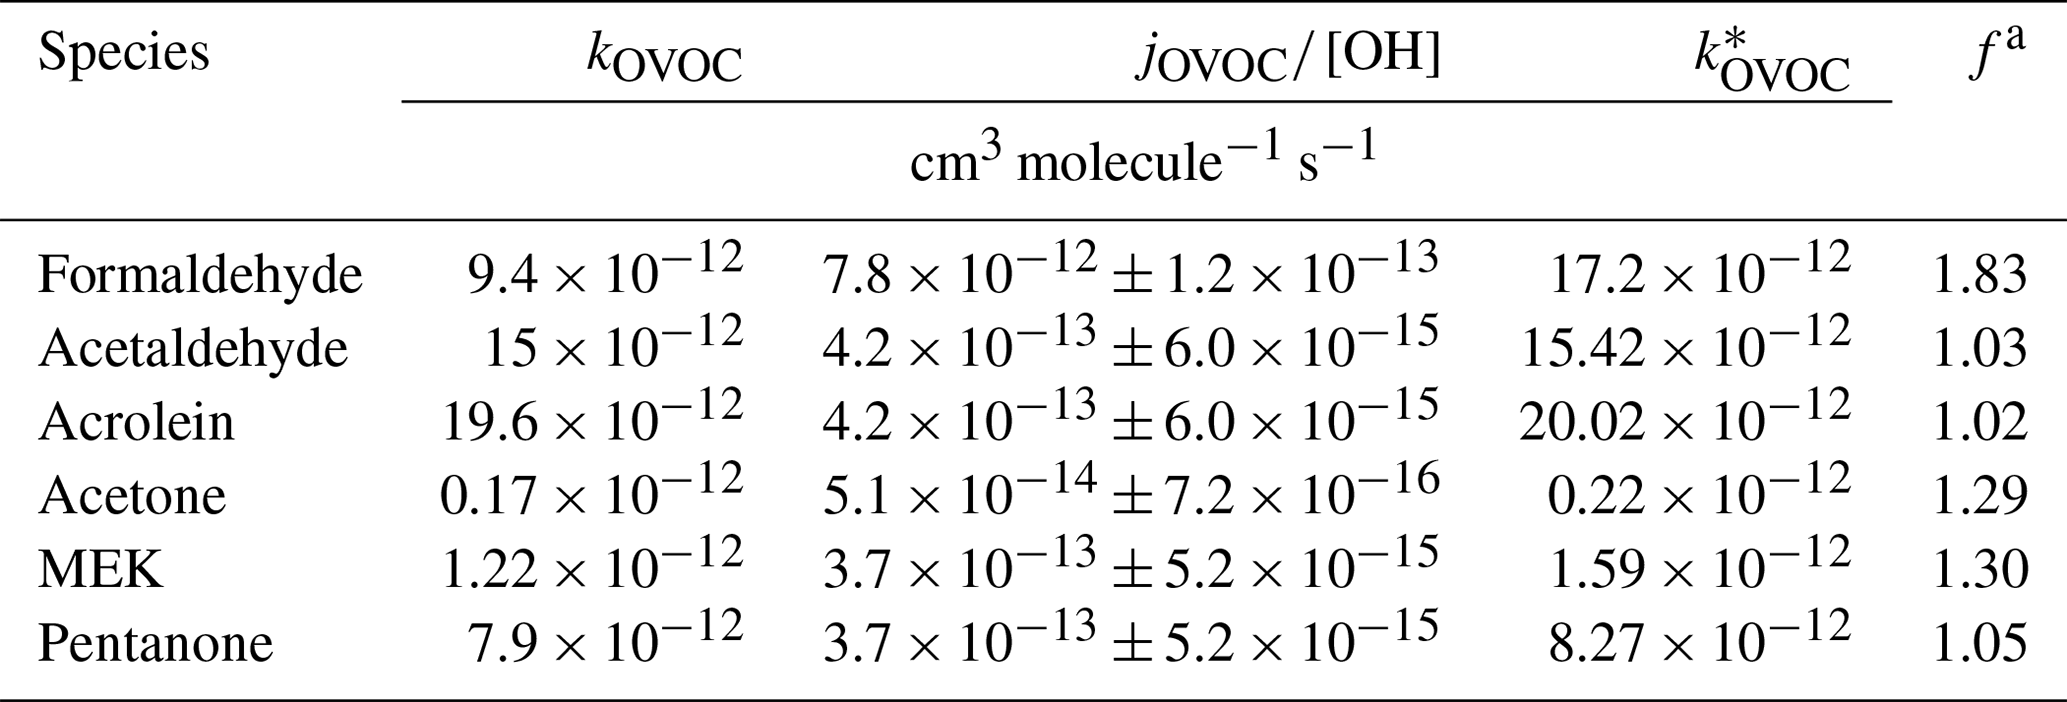
a f represents the ratio of the rate constant representing the combined losses of reactions with OH radical and photolysis () and the OH rate constant (kOVOC).
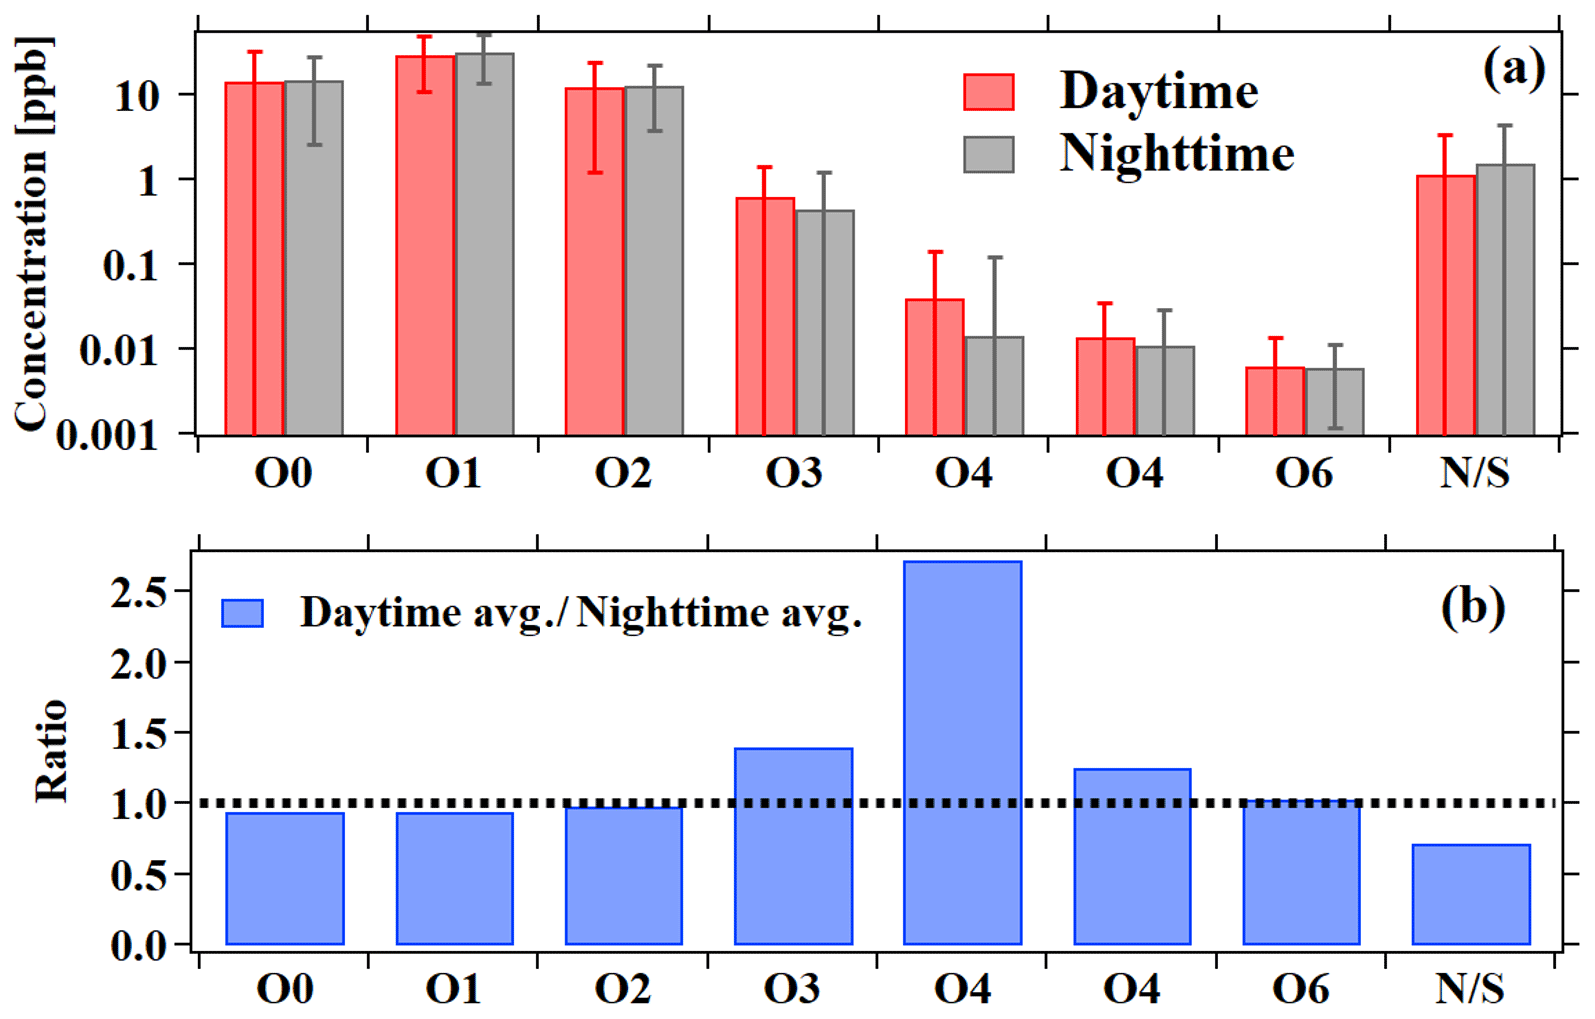
Figure 6Average mixing ratios for the different groups of ions measured by PTR-ToF-MS. Nighttime (18:00–06:00) averages are shown in black and daytime (06:00–18:00) averages in red, with the error bars indicating the standard deviations. The ratios between daytime and nighttime averages are shown in the lower panel in blue.
The photochemical age parameterization method has only been used for source analysis of individual OVOC species. Here, we attempt to use this method to explore the sources of different categories of OVOC ions in PTR-ToF-MS mass spectra, i.e., CxHyO1, CxHyO2 and CxHyO≥3. An effective OH rate constant of cm3 molecule−1 s−1 (the median for all OVOC ions in Table S4) was applied for different ion groups. The fitting results are also listed in Tables 2 and 3. It is observed that all categories of OVOCs have significantly secondary anthropogenic sources. OVOCs with one oxygen atom had similar contributions from primary emissions and secondary formation of anthropogenic sources. The determined results show that OVOCs with two oxygen atoms are more secondary than those with one oxygen atom. Primary anthropogenic emission only accounts for minor contribution to OVOCs with three or more oxygen atoms. These results are in accordance with the fact that primary emissions are more reducing. The fractions from biogenic sources to the OVOC categories are all significant, consistent with the results of individual OVOC species discussed above. It should be noted that a substantial fraction of OVOCs with three or more oxygen atoms is attributed to the background, which may be due to the tubing delay effects as the result of the gas wall partitioning of these lower volatility multifunctional species (Pagonis et al., 2017).
Table 2Parameters describing OVOC concentrations. Note: parts per billion by volume – ppbv.

a The parameters EROVOC, ERprecursor, kprecursor, ERbiogenic, and background are fitted to the measured concentration data according to Eq. (1). b As the fitting value of the parameter is negative, that parameter is set to zero and the fit is repeated. c Emission ratios relative to CO are calculated from emission ratios relative to acetylene multiplying the emission ratio of acetylene to CO (6.62 ppb/ppm); see Fig. S10.
Table 3Contribution fractions of OVOCs from different sources, and the correlation coefficient between calculated and measured OVOC concentrations.
3.4 OH reactivity
The oxidation and removal of VOCs depend on the reactivity of VOCs with both ozone and hydroxyl radicals during the daytime and the nitrate radical during the nighttime (Sarkar et al., 2016). VOC reactivity can visually and effectively characterize the contributions of various VOCs to atmospheric chemical reactions that are related to the formation of secondary pollutants. A number of previous studies showed significant missing reactivity between measured and calculated OH reactivities from measured air pollutants (Yang et al., 2016; Whalley et al., 2016). However, this missing fraction can also depend on the individual compounds that are taken into account for the calculated OH reactivity (Pfannerstill et al., 2019). The total OH reactivity is calculated as follows:
where kCO, kNO, , , , , and kvoci are the rate constants between OH radicals and CO, NO, NO2, SO2, O3, CH4, and VOC species, respectively. [CO], [NO], [NO2], [SO2], [O3], [CH4] and [VOCi] are the measured concentration of CO, NO, NO2, SO2, O3, CH4, and various VOC species, respectively.
The rate constants for various VOCs are taken from previous literature (Atkinson and Arey, 2003; Atkinson et al., 2004, 2006; Koss et al., 2018). For ions detected by PTR-ToF-MS, the rate constants of the determined or isomers to be assumed dominant are used, following the identification of these ions in previous studies (Koss et al., 2018; Gilman et al., 2015). We note that the uncertainties of rate constants for many ions detected by PTR-ToF-MS can be large (of the order of 100 %), especially for the uncalibrated species. The species taken into account for calculating OH reactivity and their reaction rate constants are listed in Tables S3 and S4, including all the hydrocarbons measured by GC–MS/FID and the 158 species measured by PTR-ToF-MS. The considered VOC species in the calculation of OH reactivity account for 91 % of the total VOC concentration shown in Fig. 4 and Table S4. Other VOC species from PTR-ToF-MS were not considered due to the lack of their rate constants with OH radicals. Figure 7 shows the comparison of measured OH reactivity with the CRM method and calculated OH reactivity during the campaign. The variations in the measured OH reactivity are generally controlled by anthropogenic species, as indicated by the strong correlation between measured OH reactivity with CO (R=0.63) and also the similar diurnal profile as anthropogenic VOC species (Figs. 7b and 1).
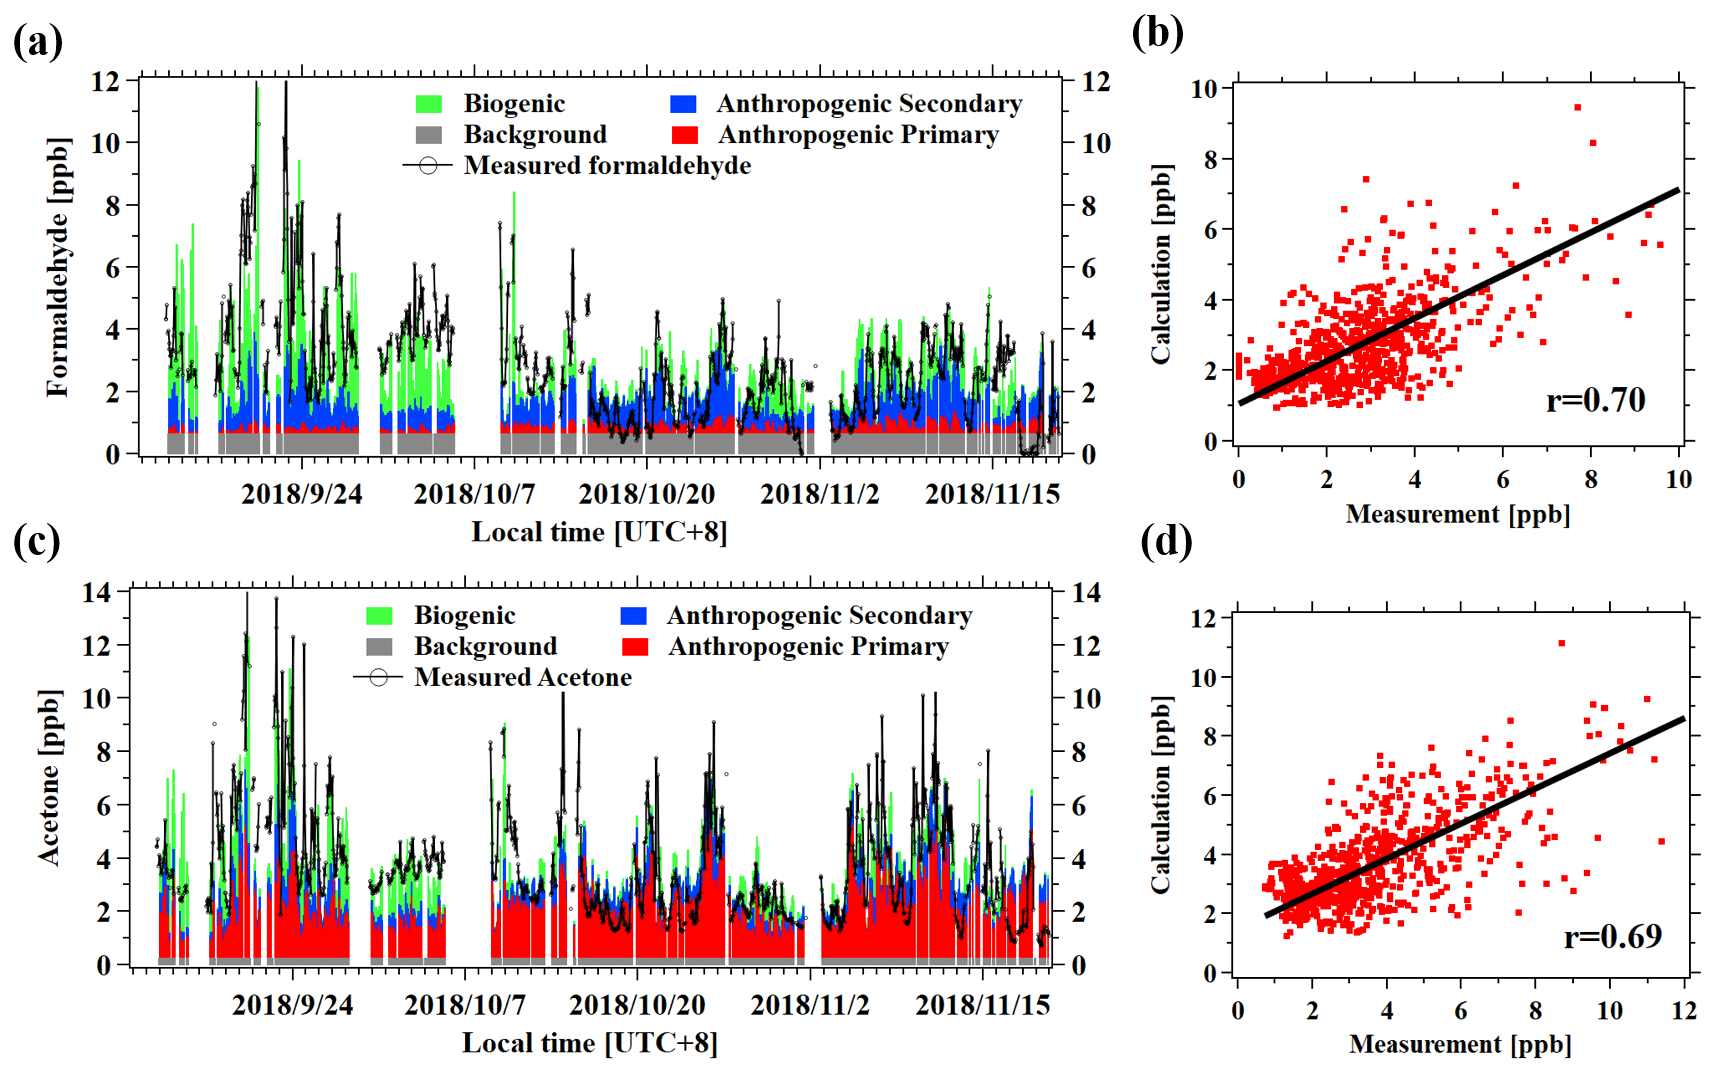
Figure 7(a) Time series of the measured and fitted concentrations of formaldehyde from different sources. The different colors represent the four different terms of Eq. (1). (b) Scatterplot of the calculated versus the measured formaldehyde concentrations. (c) Time series of the measured and fitted concentrations of acetone from different sources. (d) Scatterplot of the calculated versus the measured acetone concentrations.
On average, CH4 and inorganic gases, mainly NOx and CO, contribute 48 % ± 15 % of the measured OH reactivity. The hydrocarbons measured by the online GC–MS/FID account for 15 % ± 9 % of the measured OH reactivity. Another 8 % ± 5 % of the measured OH reactivity is contributed by a total of nine OVOC species calibrated for PTR-ToF-MS in this study, including the six common OVOCs quantified by PTR-MS instruments, acrolein, pentanone, and hexanones (Table S4). In total, the above three groups of compounds explain an average of 71 % of measured OH reactivity, leaving the remaining 29 % of the OH reactivity unaccounted for during the campaign. This fraction of unaccounted OH reactivity is generally comparable to the results in previous studies that took similar VOC species measured in the urban atmosphere into account (Yang et al., 2016).
As discussed in Sect. 3.2, concentrations of a large number of uncalibrated VOCs are quantified from the signals in PTR-ToF-MS mass spectra. After considering these VOCs with the calculated OH reactivity values, the hydrocarbon masses and OVOCs masses from PTR-ToF-MS can account for an additional 6 % ± 3 % and 11 % ± 6 % of the measured OH reactivity (Fig. 7). Note that the contribution of hydrocarbon masses from PTR-ToF-MS also includes the contributions from higher alkanes (1 %) measured by NO+ chemistry (Table S4). Nitrogen and sulfur-containing masses only represent a small fraction (1 % ± 1 %) in OH reactivity. Adding up these contributions, it significantly narrows the gap between the measured and calculated OH reactivity, leaving only 11 % of OH reactivity as missing during the campaign. Considering the large uncertainties for both concentrations (∼ 50 %) and rate constants of the uncalibrated species (of the order of 100 %), the missing reactivity can ranged in 0 %–19 %. Nevertheless, the determined missing reactivity would be well below the estimated uncertainty (20 %) for the OH reactivity measurements by the CRM method, indicating that gap between measured and calculated reactivity can be significantly narrowed after taking into account all of the species by PTR-ToF-MS. The results emphasize the important role of PTR-ToF-MS measurements in quantifying and characterizing reactive VOC species that can lead to ozone and SOA formation. On the basis of Fig. 7, which shows that the fraction of OVOCs in OH reactivity can be up to 19 % ± 11 %; this is comparable to the summed contribution from hydrocarbons measured by both GC–MS/FID and PTR-ToF-MS. These results also highlight the significant contribution of OVOCs in OH reactivity in urban air.
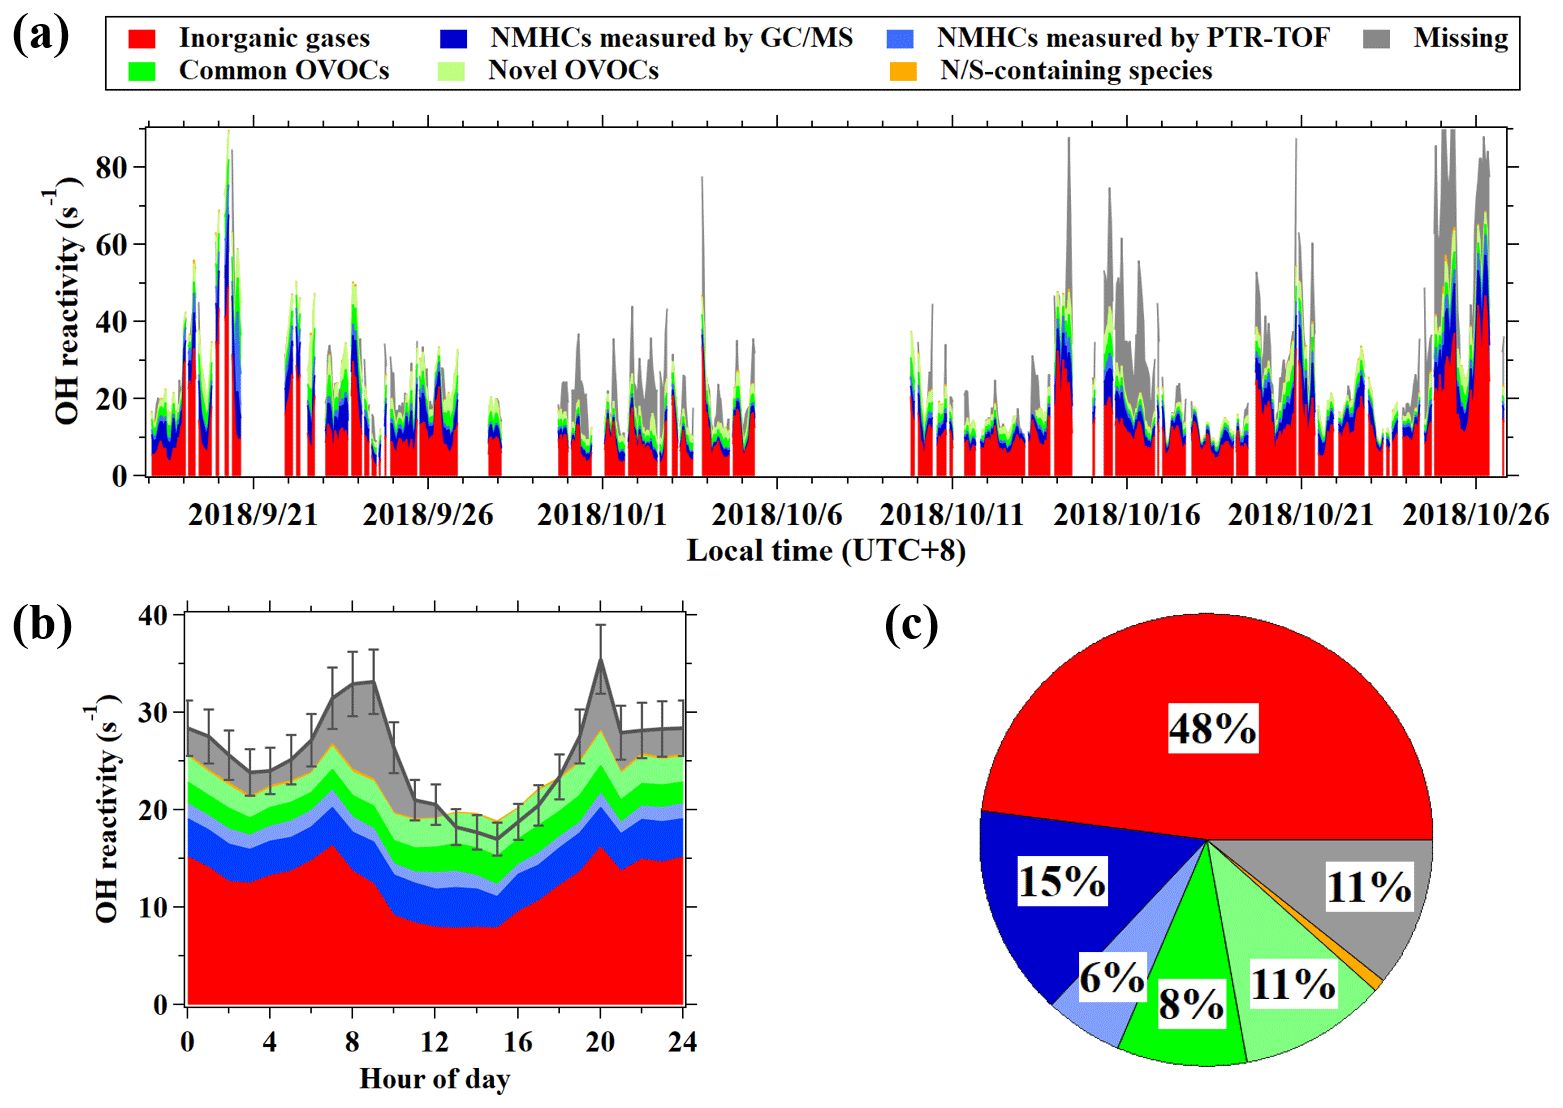
Figure 8(a) Time series of calculated and measured OH reactivity during the campaign. (b) Diurnal variation in hourly average results of the calculated reactivity and measured OH reactivity. (c) Composition of calculated OH reactivity during the campaign.
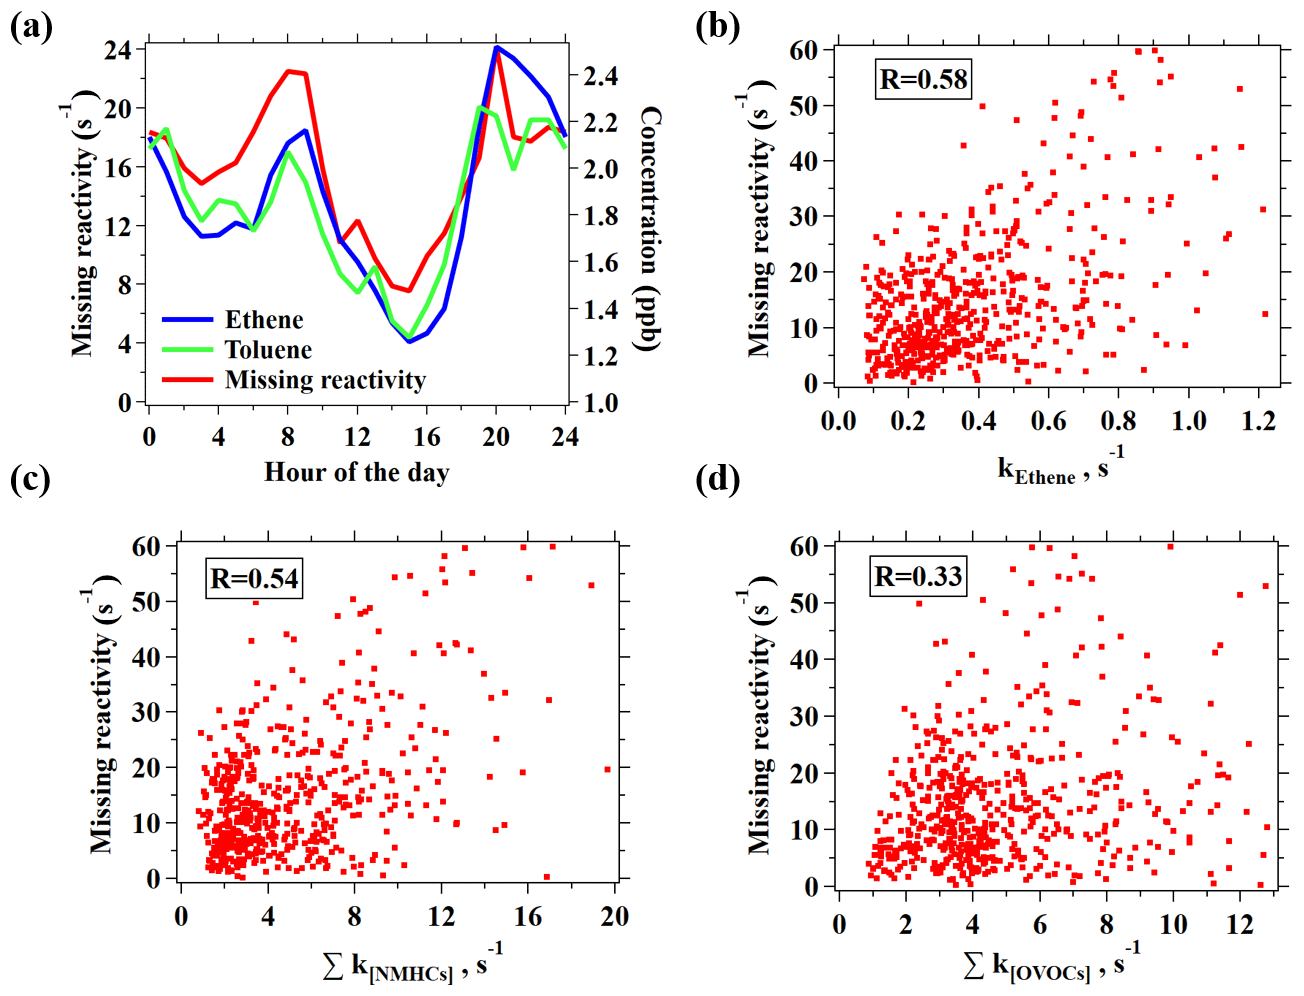
Figure 9(a) Diurnal variation in hourly averages for missing reactivity and ethene concentration. (b–d) Correlation plots of the missing reactivity versus the reactivity of ethene (b), NMHCs measured by GC–MS/FID, and PTR-ToF-MS (c) and OVOCs measured by PTR-ToF-MS, including common OVOCs and novel OVOCs (d).
In order to gain more knowledge on the potential sources of the potentially remaining missing OH reactivity, the diurnal variation in the missing reactivity is plotted in Fig. 8a, which illustrates the highest missing reactivity in the morning and evening. This diurnal profile is similar to many hydrocarbons (e.g., ethene and toluene) that are emitted by primary anthropogenic sources. Moderate correlations between the missing reactivity with the reactivities from ethene and NMHCs are also obtained (Figs. 8 and S14), while the correlation with OVOCs is substantially weaker, again suggesting that the missing reactivity is more likely due to primary emissions. As the measurement site is in downtown Guangzhou with strong influences from vehicle emissions, the unique diurnal variations with higher missing reactivity in the morning and evening rush hours indicates that vehicle emissions may play a role. Previous ambient measurement in Nashville, USA, and at a coastal site in the UK also implied that the missing reactivity might be due to reactive primary species from anthropogenic sources (e.g., alkenes or aromatics; Kovacs et al., 2003; Lee et al., 2009). A recent study on gasoline evaporation also suspected that branched alkenes that are not routinely detected by GC-MS may contribute significantly to OH reactivity (Wu et al., 2015). As most of the species measured by PTR-ToF-MS have been taken into account for the OH reactivity calculation, reducing the remaining missing reactivities would only be possible with the help from other VOC measurement techniques, e.g., the GC × GC method, which has already been shown to demonstrate the measurement of many novel hydrocarbons present in urban air (Xu et al., 2003; Dunmore et al., 2015).
In this study, we continuously measured VOCs and OH reactivity using state-of-the-art online instruments at an urban site in Guangzhou in September–November 2018. Diurnal profile analysis of hydrocarbons shows that more reactive hydrocarbons are associated with stronger chemical removal by OH radicals during the daytime. This relationship is used to estimate the daytime average OH radical concentration, obtaining good agreement with the simulation result of a box model. Diurnal profiles of OVOCs (e.g., formaldehyde and acetone) show a large enhancement in the afternoon, indicating contributions from the secondary formation during the daytime. A photochemical age-based parameterization method is used to analyze the sources of OVOC in the atmosphere. We find that secondary formation is generally important for aldehydes, while primary emissions from anthropogenic sources dominated the concentrations of ketones.
During the campaign, around 1700 ions were detected in PTR-ToF-MS mass spectra, among which 462 ions have noticeable concentrations in the atmosphere. We further quantify VOC concentrations from signals of 431 ions in the mass spectra of PTR-ToF-MS that are not explicitly calibrated, based on the calibrated sensitivities of more than 30 VOC species. The analyses indicate that OVOC-related ions dominated PTR-ToF-MS mass spectra, with an average contribution of 73 % ± 9 % that mainly consists of compounds with one (51 % ± 7 %) and two oxygen atoms (21 % ± 6 %). Source analyses of these different categories of OVOCs from PTR-ToF-MS also show that these OVOCs are contributed by both primary and secondary sources. Combining measurements from PTR-ToF-MS and GC–MS/FID, OVOCs contribute 57 % ± 10 % to the total concentration of VOCs, indicating the important roles of OVOCs.
Finally, we find that OVOCs measured by PTR-ToF-MS contribute greatly to the OH reactivity (19 % ± 11 %), with 8 % ± 5 % from common OVOCs that are explicitly calibrated and 11 % ± 6 % from other newly quantified OVOC signals in the mass spectra. In comparison, hydrocarbons account for 21 % of OH reactivity during the campaign, with 15 % ± 9 % from hydrocarbons measured by GC–MS/FID and 6 % ± 3 % by PTR-ToF-MS, respectively. Adding up the contributions from inorganic gases (48 % ± 15 %), the missing reactivity is estimated to be ∼ 11 % (range – 0 %–19 %), which is well within the combined uncertainties between the measured and calculated OH reactivity. Evidence from diurnal variations and correlation analysis indicates that the potentially remaining missing reactivity is most likely due to hydrocarbons from primary emitted by anthropogenic sources.
In summary, our VOC measurements at an urban site in Guangzhou demonstrate the important contributions of OVOCs to both total VOC concentrations and OH reactivity in the atmosphere. As urban emissions are transported downwind, contributions from OVOCs in the urban emissions should continuously increase (de Gouw et al., 2005). It highlights that OVOCs play important roles in VOC emissions and chemistry in urban air. In this study, concentrations of most OVOCs are quantified by a PTR-ToF-MS instrument, indicating the usefulness of PTR-ToF-MS in characterizing VOC emission and chemistry in the atmosphere. Nevertheless, our analysis on OH reactivity implies potential contributions from highly reactive hydrocarbons that are neither captured by GC–MS/FID nor PTR-ToF-MS, calling for other measurement techniques for VOCs to fill this gap.
Data are available from the authors upon request.
The supplement related to this article is available online at: https://doi.org/10.5194/acp-20-14769-2020-supplement.
BY designed the research. CaW, ChaW, SW, WW, JQ, BW, CW, and WS contributed to data collection. CHW performed the data analysis, with contributions from ChaW, ZW, and WW. CaW and BY prepared the paper, with contributions from the coauthors. All the authors reviewed the paper.
The authors declare that they have no conflict of interest.
The authors gratefully acknowledge the science team for their technical support and discussions during the campaigns in PRD.
This work was supported by the National Key R&D Plan of China (grant nos. 2018YFC0213904, 2019YFE0106300, and 2016YFC0202206), the National Natural Science Foundation of China (grant no. 41877302), Guangdong Natural Science Funds for Distinguished Young Scholar (grant no. 2018B030306037), Key-Area Research and Development Program of Guangdong Province (grant no. 2019B110206001), Guangdong Soft Science Research Program (grant no. 2019B101001005), and Guangdong Innovative and Entrepreneurial Research Team Program (grant no. 2016ZT06N263). Weiwei Hu and Wei Chen were supported by the National Natural Science Foundation of China (grant no. 41875156) and Natural Science Foundation of Guangdong (grant no. 2019A1515011153). This work was also supported by the Special Fund Project for Science and Technology Innovation Strategy of Guangdong Province (grant no. 2019B121205004).
This paper was edited by John Liggio and reviewed by three anonymous referees.
Apel, E. C., Riemer, D. D., Hills, A., Baugh, W., Orlando, J., Faloona, I., Tan, D., Brune, W., Lamb, B., Westberg, H., Carroll, M. A., Thornberry, T., and Geron, C. D.: Measurement and interpretation of isoprene fluxes and isoprene, methacrolein, and methyl vinyl ketone mixing ratios at the PROPHET site during the 1998 Intensive, J. Geophys. Res.-Atmos., 107, ACH 7-1–ACH 7-15, https://doi.org/10.1029/2000jd000225, 2002.
Atkinson, R. and Arey, J.: Atmospheric Degradation of Volatile Organic Compounds, Chem. Rev., 103, 4605–4638, https://doi.org/10.1021/cr0206420, 2003.
Atkinson, R., Baulch, D. L., Cox, R. A., Crowley, J. N., Hampson, R. F., Hynes, R. G., Jenkin, M. E., Rossi, M. J., and Troe, J.: Evaluated kinetic and photochemical data for atmospheric chemistry: Volume I – gas phase reactions of Ox, HOx, NOx and SOx species, Atmos. Chem. Phys., 4, 1461–1738, https://doi.org/10.5194/acp-4-1461-2004, 2004.
Atkinson, R., Baulch, D. L., Cox, R. A., Crowley, J. N., Hampson, R. F., Hynes, R. G., Jenkin, M. E., Rossi, M. J., Troe, J., and IUPAC Subcommittee: Evaluated kinetic and photochemical data for atmospheric chemistry: Volume II – gas phase reactions of organic species, Atmos. Chem. Phys., 6, 3625–4055, https://doi.org/10.5194/acp-6-3625-2006, 2006.
Cappellin, L., Karl, T., Probst, M., Ismailova, O., Winkler, P., Soukoulis, C., Aprea, E., Märk, T., Gasperi, F., and Biasioli, F.: On Quantitative Determination of Volatile Organic Compound Concentrations Using Proton Transfer Reaction Time-of-Flight Mass Spectrometry, Environ. Sci. Tech., 46, 2283–2290, https://doi.org/10.1021/es203985t, 2012.
Coggon, M. M., Lim, C. Y., Koss, A. R., Sekimoto, K., Yuan, B., Gilman, J. B., Hagan, D. H., Selimovic, V., Zarzana, K. J., Brown, S. S., Roberts, J. M., Müller, M., Yokelson, R., Wisthaler, A., Krechmer, J. E., Jimenez, J. L., Cappa, C., Kroll, J. H., de Gouw, J., and Warneke, C.: OH chemistry of non-methane organic gases (NMOGs) emitted from laboratory and ambient biomass burning smoke: evaluating the influence of furans and oxygenated aromatics on ozone and secondary NMOG formation, Atmos. Chem. Phys., 19, 14875–14899, https://doi.org/10.5194/acp-19-14875-2019, 2019.
de Gouw, J. and Warneke, C.: Measurements of volatile organic compounds in the earth's atmosphere using proton-transfer-reaction mass spectrometry, Mass Spectrom. Rev., 26, 223–257, https://doi.org/10.1002/mas.20119, 2007.
de Gouw, J., Middlebrook, A., Warneke, C., Goldan, P., Kuster, W., Roberts, J., Fehsenfeld, F., Worsnop, D., Pszenny, A., Keene, W., Marchewka, M., Bertman, S., and Bates, T.: Budget of organic carbon in a polluted atmosphere: Results from the New England Air Quality Study in 2002, J. Geophys. Res.-Atmos., 110, D16305, https://doi.org/10.1029/2004JD005623, 2005.
de Gouw, J. A.: Budget of organic carbon in a polluted atmosphere: Results from the New England Air Quality Study in 2002, J. Geophys. Res., 110, D16305, https://doi.org/10.1029/2004jd005623, 2005.
de Gouw, J. A., Goldan, P. D., Warneke, C., Kuster, W. C., Roberts, J. M., Marchewka, M., Bertman, S. B., Pszenny, A. A. P., and Keene, W. C.: Validation of proton transfer reaction-mass spectrometry (PTR-MS) measurements of gas-phase organic compounds in the atmosphere during the New England Air Quality Study (NEAQS) in 2002, J. Geophys. Res.-Atmos., 108, 4682, https://doi.org/10.1029/2003JD003863, 2003.
de Gouw, J. A., Welsh-Bon, D., Warneke, C., Kuster, W. C., Alexander, L., Baker, A. K., Beyersdorf, A. J., Blake, D. R., Canagaratna, M., Celada, A. T., Huey, L. G., Junkermann, W., Onasch, T. B., Salcido, A., Sjostedt, S. J., Sullivan, A. P., Tanner, D. J., Vargas, O., Weber, R. J., Worsnop, D. R., Yu, X. Y., and Zaveri, R.: Emission and chemistry of organic carbon in the gas and aerosol phase at a sub-urban site near Mexico City in March 2006 during the MILAGRO study, Atmos. Chem. Phys., 9, 3425–3442, https://doi.org/10.5194/acp-9-3425-2009, 2009.
de Gouw, J. A., Gilman, J. B., Kim, S. W., Lerner, B. M., Isaacman-VanWertz, G., McDonald, B. C., Warneke, C., Kuster, W. C., Lefer, B. L., Griffith, S. M., Dusanter, S., Stevens, P. S., and Stutz, J.: Chemistry of Volatile Organic Compounds in the Los Angeles basin: Nighttime Removal of Alkenes and Determination of Emission Ratios, J. Geophys. Res.-Atmos., 122, 11843–811861, https://doi.org/10.1002/2017jd027459, 2017.
de Gouw, J. A., Gilman, J. B., Kim, S.-W., Alvarez, S. L., Dusanter, S., Graus, M., Griffith, S. M., Isaacman-VanWertz, G., Kuster, W. C., Lefer, B. L., Lerner, B. M., McDonald, B. C., Rappenglück, B., Roberts, J. M., Stevens, P. S., Stutz, J., Thalman, R., Veres, P. R., Volkamer, R., Warneke, C., Washenfelder, R. A., and Young, C. J.: Chemistry of Volatile Organic Compounds in the Los Angeles Basin: Formation of Oxygenated Compounds and Determination of Emission Ratios, J. Geophys. Res.-Atmos., 123, 2298–2319, https://doi.org/10.1002/2017jd027976, 2018.
Dolgorouky, C., Gros, V., Sarda-Esteve, R., Sinha, V., Williams, J., Marchand, N., Sauvage, S., Poulain, L., Sciare, J., and Bonsang, B.: Total OH reactivity measurements in Paris during the 2010 MEGAPOLI winter campaign, Atmos. Chem. Phys., 12, 9593–9612, https://doi.org/10.5194/acp-12-9593-2012, 2012.
Dunmore, R. E., Hopkins, J. R., Lidster, R. T., Lee, J. D., Evans, M. J., Rickard, A. R., Lewis, A. C., and Hamilton, J. F.: Diesel-related hydrocarbons can dominate gas phase reactive carbon in megacities, Atmos. Chem. Phys., 15, 9983–9996, https://doi.org/10.5194/acp-15-9983-2015, 2015.
Ferracci, V., Heimann, I., Abraham, N. L., Pyle, J. A., and Archibald, A. T.: Global modelling of the total OH reactivity: investigations on the “missing” OH sink and its atmospheric implications, Atmos. Chem. Phys., 18, 7109–7129, https://doi.org/10.5194/acp-18-7109-2018, 2018.
Fry, M. M., Schwarzkopf, M. D., Adelman, Z., and West, J. J.: Air quality and radiative forcing impacts of anthropogenic volatile organic compound emissions from ten world regions, Atmos. Chem. Phys., 14, 523–535, https://doi.org/10.5194/acp-14-523-2014, 2014.
Gentner, D., Worton, D., Isaacman, G., Davis, L., Dallmann, T., Wood, E., Herndon, S., Goldstein, A., and Harley, R.: Chemical Composition of Gas-Phase Organic Carbon Emissions from Motor Vehicles and Implications for Ozone Production, Environ. Sci. Tech., 47, es401470e, https://doi.org/10.1021/es401470e 2013.
Gilman, J., Lerner, B., Kuster, W., and de Gouw, J.: Source Signature of Volatile Organic Compounds from Oil and Natural Gas Operations in Northeastern Colorado, Environ. Sci. Tech., 47, es304119a https://doi.org/10.1021/es304119a, 2013.
Gilman, J. B., Lerner, B. M., Kuster, W. C., Goldan, P. D., Warneke, C., Veres, P. R., Roberts, J. M., de Gouw, J. A., Burling, I. R., and Yokelson, R. J.: Biomass burning emissions and potential air quality impacts of volatile organic compounds and other trace gases from fuels common in the US, Atmos. Chem. Phys., 15, 13915–13938, https://doi.org/10.5194/acp-15-13915-2015, 2015.
Guenther, A. B., Jiang, X., Heald, C. L., Sakulyanontvittaya, T., Duhl, T., Emmons, L. K., and Wang, X.: The Model of Emissions of Gases and Aerosols from Nature version 2.1 (MEGAN2.1): an extended and updated framework for modeling biogenic emissions, Geosci. Model Dev., 5, 1471–1492, https://doi.org/10.5194/gmd-5-1471-2012, 2012.
Hansen, R. F., Griffith, S. M., Dusanter, S., Rickly, P. S., Stevens, P. S., Bertman, S. B., Carroll, M. A., Erickson, M. H., Flynn, J. H., Grossberg, N., Jobson, B. T., Lefer, B. L., and Wallace, H. W.: Measurements of total hydroxyl radical reactivity during CABINEX 2009 – Part 1: field measurements, Atmos. Chem. Phys., 14, 2923–2937, https://doi.org/10.5194/acp-14-2923-2014, 2014.
Holzinger, R., Acton, W. J. F., Bloss, W. J., Breitenlechner, M., Crilley, L. R., Dusanter, S., Gonin, M., Gros, V., Keutsch, F. N., Kiendler-Scharr, A., Kramer, L. J., Krechmer, J. E., Languille, B., Locoge, N., Lopez-Hilfiker, F., Materić, D., Moreno, S., Nemitz, E., Quéléver, L. L. J., Sarda Esteve, R., Sauvage, S., Schallhart, S., Sommariva, R., Tillmann, R., Wedel, S., Worton, D. R., Xu, K., and Zaytsev, A.: Validity and limitations of simple reaction kinetics to calculate concentrations of organic compounds from ion counts in PTR-MS, Atmos. Meas. Tech., 12, 6193–6208, https://doi.org/10.5194/amt-12-6193-2019, 2019.
Kari, E., Miettinen, P., Yli-Pirilä, P., Virtanen, A., and Faiola, C.: PTR-ToF-MS product ion distributions and humidity-dependence of biogenic volatile organic compounds, Int. J. Mass Spectrom., 430, 87–97, https://doi.org/10.1016/j.ijms.2018.05.003, 2018.
Karl, T., Guenther, A., Turnipseed, A., Tyndall, G., Artaxo, P., and Martin, S.: Rapid formation of isoprene photo-oxidation products observed in Amazonia, Atmos. Chem. Phys., 9, 7753–7767, https://doi.org/10.5194/acp-9-7753-2009, 2009.
Karl, T., Striednig, M., Graus, M., Hammerle, A., and Wohlfahrt, G.: Urban flux measurements reveal a large pool of oxygenated volatile organic compound emissions, P. Natl. Acad. Sci., 115, 1186–1191, https://doi.org/10.1073/pnas.1714715115, 2018.
Kim, K.-H., Hong, Y.-J., Pal, R., Jeon, E.-C., Koo, Y.-S., and Sunwoo, Y.: Investigation of carbonyl compounds in air from various industrial emission sources, Chemosphere, 70, 807–820, https://doi.org/10.1016/j.chemosphere.2007.07.025, 2008.
Kim, S., Sanchez, D., Wang, M., Seco, R., Jeong, D., Hughes, S., Barletta, B., Blake, D., Jung, J., Kim, D., Lee, G., Lee, M., Ahn, J., Lee, S.-D., Cho, G., Sung, M.-Y., Lee, Y.-H., Kim, D., and Hong, J.-H.: OH Reactivity in Urban and Suburban regions in Seoul, South Korea- An East Asian megacity in a rapid transition, Faraday Discuss., 189, 231–251, https://doi.org/10.1039/C5FD00230C, 2016.
Koss, A. R., Sekimoto, K., Gilman, J. B., Selimovic, V., Coggon, M. M., Zarzana, K. J., Yuan, B., Lerner, B. M., Brown, S. S., Jimenez, J. L., Krechmer, J., Roberts, J. M., Warneke, C., Yokelson, R. J., and de Gouw, J.: Non-methane organic gas emissions from biomass burning: identification, quantification, and emission factors from PTR-ToF during the FIREX 2016 laboratory experiment, Atmos. Chem. Phys., 18, 3299–3319, https://doi.org/10.5194/acp-18-3299-2018, 2018.
Kovacs, T. A., Brune, W., Harder, H., Martinez, M., Simpas, J., Frost, G., Williams, E., Jobson, T., Stroud, C., Young, V., Fried, A., and Wert, B.: Direct measurements of urban OH reactivity during Nashville SOS in summer 1999, J. Environ. Monitor., 5, 68–74, https://doi.org/10.1039/B204339D, 2003.
Lee, J. D., Young, J. C., Read, K. A., Hamilton, J. F., Hopkins, J. R., Lewis, A. C., Bandy, B. J., Davey, J., Edwards, P., Ingham, T., Self, D. E., Smith, S. C., Pilling, M. J., and Heard, D. E.: Measurement and calculation of OH reactivity at a United Kingdom coastal site, J. Atmos. Chem., 64, 53–76, https://doi.org/10.1007/s10874-010-9171-0, 2009.
Li, K., Li, J., Tong, S., Wang, W., Huang, R.-J., and Ge, M.: Characteristics of wintertime VOCs in suburban and urban Beijing: concentrations, emission ratios, and festival effects, Atmos. Chem. Phys., 19, 8021–8036, https://doi.org/10.5194/acp-19-8021-2019, 2019.
Lopez-Hilfiker, F. D., Mohr, C., Ehn, M., Rubach, F., Kleist, E., Wildt, J., Mentel, Th. F., Lutz, A., Hallquist, M., Worsnop, D., and Thornton, J. A.: A novel method for online analysis of gas and particle composition: description and evaluation of a Filter Inlet for Gases and AEROsols (FIGAERO), Atmos. Meas. Tech., 7, 983–1001, https://doi.org/10.5194/amt-7-983-2014, 2014.
Lou, S., Holland, F., Rohrer, F., Lu, K., Bohn, B., Brauers, T., Chang, C. C., Fuchs, H., Häseler, R., Kita, K., Kondo, Y., Li, X., Shao, M., Zeng, L., Wahner, A., Zhang, Y., Wang, W., and Hofzumahaus, A.: Atmospheric OH reactivities in the Pearl River Delta – China in summer 2006: measurement and model results, Atmos. Chem. Phys., 10, 11243–11260, https://doi.org/10.5194/acp-10-11243-2010, 2010.
Louie, P. K. K., Ho, J. W. K., Tsang, R. C. W., Blake, D. R., Lau, A. K. H., Yu, J. Z., Yuan, Z., Wang, X., Shao, M., and Zhong, L.: VOCs and OVOCs distribution and control policy implications in Pearl River Delta region, China, Atmos. Environ., 76, 125–135, 2013.
Mao, J., Ren, X., Chen, S., Brune, W. H., Chen, Z., Martinez, M., Harder, H., Lefer, B., Rappenglück, B., Flynn, J., and Leuchner, M.: Atmospheric oxidation capacity in the summer of Houston 2006: Comparison with summer measurements in other metropolitan studies, Atmos. Environ., 44, 4107–4115, https://doi.org/10.1016/j.atmosenv.2009.01.013, 2010.
Mellouki, A., Wallington, T. J., and Chen, J.: Atmospheric Chemistry of Oxygenated Volatile Organic Compounds: Impacts on Air Quality and Climate, Chem. Rev., 115, 3984–4014, https://doi.org/10.1021/cr500549n, 2015.
Michoud, V., Hansen, R. F., Locoge, N., Stevens, P. S., and Dusanter, S.: Detailed characterizations of the new Mines Douai comparative reactivity method instrument via laboratory experiments and modeling, Atmos. Meas. Tech., 8, 3537–3553, https://doi.org/10.5194/amt-8-3537-2015, 2015.
Millet, D. B., Baasandorj, M., Farmer, D. K., Thornton, J. A., Baumann, K., Brophy, P., Chaliyakunnel, S., de Gouw, J. A., Graus, M., Hu, L., Koss, A., Lee, B. H., Lopez-Hilfiker, F. D., Neuman, J. A., Paulot, F., Peischl, J., Pollack, I. B., Ryerson, T. B., Warneke, C., Williams, B. J., and Xu, J.: A large and ubiquitous source of atmospheric formic acid, Atmos. Chem. Phys., 15, 6283–6304, https://doi.org/10.5194/acp-15-6283-2015, 2015.
Pagonis, D., Krechmer, J. E., de Gouw, J., Jimenez, J. L., and Ziemann, P. J.: Effects of gas–wall partitioning in Teflon tubing and instrumentation on time-resolved measurements of gas-phase organic compounds, Atmos. Meas. Tech., 10, 4687–4696, https://doi.org/10.5194/amt-10-4687-2017, 2017.
Park, J. H., Goldstein, A. H., Timkovsky, J., Fares, S., Weber, R., Karlik, J., and Holzinger, R.: Active atmosphere-ecosystem exchange of the vast majority of detected volatile organic compounds, Science, 341, 643–647, https://doi.org/10.1126/science.1235053, 2013.
Pfannerstill, E. Y., Wang, N., Edtbauer, A., Bourtsoukidis, E., Crowley, J. N., Dienhart, D., Eger, P. G., Ernle, L., Fischer, H., Hottmann, B., Paris, J.-D., Stönner, C., Tadic, I., Walter, D., Lelieveld, J., and Williams, J.: Shipborne measurements of total OH reactivity around the Arabian Peninsula and its role in ozone chemistry, Atmos. Chem. Phys., 19, 11501–11523, https://doi.org/10.5194/acp-19-11501-2019, 2019.
Praplan, A. P., Pfannerstill, E. Y., Williams, J., and Hellén, H.: OH reactivity of the urban air in Helsinki, Finland, during winter, Atmos. Environ., 169, 150–161, https://doi.org/10.1016/j.atmosenv.2017.09.013, 2017.
Ran, L., Zhao, C. S., Xu, W. Y., Lu, X. Q., Han, M., Lin, W. L., Yan, P., Xu, X. B., Deng, Z. Z., Ma, N., Liu, P. F., Yu, J., Liang, W. D., and Chen, L. L.: VOC reactivity and its effect on ozone production during the HaChi summer campaign, Atmos. Chem. Phys., 11, 4657–4667, https://doi.org/10.5194/acp-11-4657-2011, 2011.
Riva, M., Rantala, P., Krechmer, J. E., Peräkylä, O., Zhang, Y., Heikkinen, L., Garmash, O., Yan, C., Kulmala, M., Worsnop, D., and Ehn, M.: Evaluating the performance of five different chemical ionization techniques for detecting gaseous oxygenated organic species, Atmos. Meas. Tech., 12, 2403–2421, https://doi.org/10.5194/amt-12-2403-2019, 2019.
Sahu, L. K. and Saxena, P.: High time and mass resolved PTR-TOF-MS measurements of VOCs at an urban site of India during winter: Role of anthropogenic, biomass burning, biogenic and photochemical sources, Atmospheric Research, 164–165, 84–94, https://doi.org/10.1016/j.atmosres.2015.04.021, 2015.
Sanchez, D., Seco, R., Gu, D., Guenther, A., Mak, J., Lee, Y., Kim, D., Ahn, J., Blake, D., Herndon, S., Jeong, D., Sullivan, J. T., Mcgee, T., and Kim, S.: Contributions to OH reactivity from unexplored volatile organic compounds measured by PTR-ToF-MS – A case study in a suburban forest of the Seoul Metropolitan Area during KORUS-AQ 2016, Atmos. Chem. Phys. Discuss., https://doi.org/10.5194/acp-2020-174, in review, 2020.
Sarkar, C., Sinha, V., Kumar, V., Rupakheti, M., Panday, A., Mahata, K. S., Rupakheti, D., Kathayat, B., and Lawrence, M. G.: Overview of VOC emissions and chemistry from PTR-TOF-MS measurements during the SusKat-ABC campaign: high acetaldehyde, isoprene and isocyanic acid in wintertime air of the Kathmandu Valley, Atmos. Chem. Phys., 16, 3979–4003, https://doi.org/10.5194/acp-16-3979-2016, 2016.
Schwantes, R. H., Schilling, K. A., McVay, R. C., Lignell, H., Coggon, M. M., Zhang, X., Wennberg, P. O., and Seinfeld, J. H.: Formation of highly oxygenated low-volatility products from cresol oxidation, Atmos. Chem. Phys., 17, 3453–3474, https://doi.org/10.5194/acp-17-3453-2017, 2017.
Sekimoto, K., Li, S.-M., Yuan, B., Koss, A., Coggon, M., Warneke, C., and de Gouw, J.: Calculation of the sensitivity of proton-transfer-reaction mass spectrometry (PTR-MS) for organic trace gases using molecular properties, Int. J. Mass Spectrom., 421, 71–94, https://doi.org/10.1016/j.ijms.2017.04.006, 2017.
Simpson, I. J., Marrero, J. E., Batterman, S., Meinardi, S., Barletta, B., and Blake, D. R.: Air quality in the Industrial Heartland of Alberta, Canada and potential impacts on human health, Atmos. Environ., 81, 702–709, https://doi.org/10.1016/j.atmosenv.2013.09.017, 2013.
Sinha, V., Williams, J., Crowley, J. N., and Lelieveld, J.: The Comparative Reactivity Method – a new tool to measure total OH Reactivity in ambient air, Atmos. Chem. Phys., 8, 2213–2227, https://doi.org/10.5194/acp-8-2213-2008, 2008.
Stark, H., Yatavelli, R. L. N., Thompson, S. L., Kimmel, J. R., Cubison, M. J., Chhabra, P. S., Canagaratna, M. R., Jayne, J. T., Worsnop, D. R., and Jimenez, J. L.: Methods to extract molecular and bulk chemical information from series of complex mass spectra with limited mass resolution, Int. J. Mass Spectrom., 389, 26–38, https://doi.org/10.1016/j.ijms.2015.08.011, 2015.
Stockwell, C. E., Veres, P. R., Williams, J., and Yokelson, R. J.: Characterization of biomass burning emissions from cooking fires, peat, crop residue, and other fuels with high-resolution proton-transfer-reaction time-of-flight mass spectrometry, Atmos. Chem. Phys., 15, 845–865, https://doi.org/10.5194/acp-15-845-2015, 2015.
Stroud, C. A., Roberts, J. M., Goldan, P. D., Kuster, W. C., Murphy, P. C., Williams, E. J., Hereid, D., Parrish, D., Sueper, D., Trainer, M., Fehsenfeld, F. C., Apel, E. C., Riemer, D., Wert, B., Henry, B., Fried, A., Martinez-Harder, M., Harder, H., Brune, W. H., Li, G., Xie, H., and Young, V. L.: Isoprene and its oxidation products, methacrolein and methylvinyl ketone, at an urban forested site during the 1999 Southern Oxidants Study, J. Geophys. Res.-Atmos., 106, 8035–8046, https://doi.org/10.1029/2000jd900628, 2001.
Sulzer, P., Hartungen, E., Hanel, G., Feil, S., Winkler, K., Mutschlechner, P., Haidacher, S., Schottkowsky, R., Gunsch, D., Seehauser, H., Striednig, M., Jürschik, S., Breiev, K., Lanza, M., Herbig, J., Märk, L., Märk, T., and Jordan, A.: A Proton Transfer Reaction-Quadrupole interface Time-Of-Flight Mass Spectrometer (PTR-QiTOF): High speed due to extreme sensitivity, Int. J. Mass Spectrom., 368, 1–5, https://doi.org/10.1016/j.ijms.2014.05.004, 2014.
Thornton, J., Mohr, C., Schobesberger, S., D'Ambro, E., Lee, B., and Lopez-Hilfiker, F.: Evaluating Organic Aerosol Sources and Evolution with a Combined Molecular Composition and Volatility Framework Using the Filter Inlet for Gases and Aerosols (FIGAERO), Accounts Chem. Res., 53, 1415–1426, https://doi.org/10.1021/acs.accounts.0c00259, 2020.
Wang, C., Wu, C., Wang, S., Qi, J., Wang, B., Wang, Z., Hu, W., Chen, W., Ye, C., Wang, W., Sun, Y., Wang, C., Huang, S., Song, W., Wang, X., Yang, S., Zhang, S., Xu, W., Ma, N., Zhang, Z., Jiang, B., Su, H., Cheng, Y., Wang, X., Shao, M., and Yuan, B.: Measurements of higher alkanes using NO+PTR-ToF-MS: significant contributions of higher alkanes to secondary organic aerosols in China, Atmos. Chem. Phys. Discuss., https://doi.org/10.5194/acp-2020-145, in review, 2020a.
Wang, M., Chen, W., Shao, M., Lu, S., Zeng, L., and Hu, M.: Investigation of carbonyl compound sources at a rural site in the Yangtze River Delta region of China, J. Environ. Sci., 28, 128–136, https://doi.org/10.1016/j.jes.2014.12.001, 2014a.
Wang, M., Zeng, L., Lu, S., Shao, M., Liu, X., Yu, X., Chen, W., Yuan, B., Zhang, Q., Hu, M., and Zhang, Z.: Development and validation of a cryogen-free automatic gas chromatograph system (GC-MS/FID) for online measurements of volatile organic compounds, Anal. Methods, 6, 9424–9434, https://doi.org/10.1039/C4AY01855A, 2014b.
Wang, Z., Yuan, B., Ye, C., Roberts, J., Wisthaler, A., Lin, Y., Li, T., Wu, C., Peng, Y., Wang, C., Wang, S., Yang, S., Wang, B., Qi, J., Wang, C., Song, W., Hu, W., Wang, X., Xu, W., Ma, N., Kuang, Y., Tao, J., Zhang, Z., Su, H., Cheng, Y., Wang, X., and Shao, M.: High Concentrations of Atmospheric Isocyanic Acid (HNCO) Produced from Secondary Sources in China, Environ. Sci. Tech., 54, 11818–11826, https://doi.org/10.1021/acs.est.0c02843, 2020b.
Whalley, L. K., Stone, D., Bandy, B., Dunmore, R., Hamilton, J. F., Hopkins, J., Lee, J. D., Lewis, A. C., and Heard, D. E.: Atmospheric OH reactivity in central London: observations, model predictions and estimates of in situ ozone production, Atmos. Chem. Phys., 16, 2109–2122, https://doi.org/10.5194/acp-16-2109-2016, 2016.
Wolfe, G. M., Thornton, J. A., Bouvier-Brown, N. C., Goldstein, A. H., Park, J.-H., McKay, M., Matross, D. M., Mao, J., Brune, W. H., LaFranchi, B. W., Browne, E. C., Min, K.-E., Wooldridge, P. J., Cohen, R. C., Crounse, J. D., Faloona, I. C., Gilman, J. B., Kuster, W. C., de Gouw, J. A., Huisman, A., and Keutsch, F. N.: The Chemistry of Atmosphere-Forest Exchange (CAFE) Model – Part 2: Application to BEARPEX-2007 observations, Atmos. Chem. Phys., 11, 1269–1294, https://doi.org/10.5194/acp-11-1269-2011, 2011.
Wolfe, G. M., Marvin, M. R., Roberts, S. J., Travis, K. R., and Liao, J.: The Framework for 0-D Atmospheric Modeling (F0AM) v3.1, Geosci. Model Dev., 9, 3309–3319, https://doi.org/10.5194/gmd-9-3309-2016, 2016.
Wu, Y., Yang, Y.-D., Shao, M., and Lu, S.-H.: Missing in total OH reactivity of VOCs from gasoline evaporation, Chinese Chem. Lett., 26, 1246–1248, https://doi.org/10.1016/j.cclet.2015.05.047, 2015.
Xu, X., Williams, C., Plass-Dülmer, H., Berresheim, H., Salisbury, G., Lange, L., and Lelieveld, J.: GC×GC measurements of C7-C11 aromatic and n-alkane hydrocarbons on Crete, in air from Eastern Europe during the MINOS campaign, Atmos. Chem. Phys., 3, 1461–1475, https://doi.org/10.5194/acp-3-1461-2003, 2003.
Yang, Y., Shao, M., Wang, X., Nölscher, A. C., Kessel, S., Guenther, A., and Williams, J.: Towards a quantitative understanding of total OH reactivity: A review, Atmos. Environ., 134, 147–161, https://doi.org/10.1016/j.atmosenv.2016.03.010, 2016.
Yang, Y., Liu, X., Zheng, J., Tan, Q., Feng, M., Qu, Y., An, J., and Cheng, N.: Characteristics of one-year observation of VOCs, NOx, and O3 at an urban site in Wuhan, China, J. Environ. Sci., 79, 297–310, https://doi.org/10.1016/j.jes.2018.12.002, 2018.
Yuan, B., Chen, W., Shao, M., Wang, M., Lu, S., Wang, B., Liu, Y., Chang, C. C., and Wang, B.: Measurements of ambient hydrocarbons and carbonyls in the Pearl River Delta (PRD), China, Atmos. Res., 116, 93–104, 2012a.
Yuan, B., Shao, M., Gouw, J. D., Parrish, D. D., Lu, S., Wang, M., Zeng, L., Zhang, Q., Song, Y., and Zhang, J.: Volatile organic compounds (VOCs) in urban air: How chemistry affects the interpretation of positive matrix factorization (PMF) analysis, J. Geophys. Res.-Atmos., 117, 24302, https://doi.org/10.1029/2012JD018236, 2012b.
Yuan, B., Hu, W. W., Shao, M., Wang, M., Chen, W. T., Lu, S. H., Zeng, L. M., and Hu, M.: VOC emissions, evolutions and contributions to SOA formation at a receptor site in eastern China, Atmos. Chem. Phys., 13, 8815–8832, https://doi.org/10.5194/acp-13-8815-2013, 2013.
Yuan, B., Koss, A. R., Warneke, C., Coggon, M., Sekimoto, K., and de Gouw, J. A.: Proton-Transfer-Reaction Mass Spectrometry: Applications in Atmospheric Sciences, Chem. Rev., 117, 13187–13229, https://doi.org/10.1021/acs.chemrev.7b00325, 2017.
Zhu, M., Dong, H., Yu, F., Liao, S., Xie, Y., Liu, J., Sha, Q., Zhong, Z., Zeng,L., and Zheng, J.: A New Portable Instrument for Online Measurements of Formaldehyde: From Ambient to Mobile Emission Sources, Environ. Sci. Tech. Lett., 7, 292–297, https://doi.org/10.1021/acs.estlett.0c00169, 2020.