the Creative Commons Attribution 4.0 License.
the Creative Commons Attribution 4.0 License.
 | 01 Dec 2020
Hectometric-scale simulations of a Mediterranean heavy-precipitation event during the Hydrological cycle in the Mediterranean Experiment (HyMeX) first Special Observation Period (SOP1)
Olivier Nuissier
Fanny Duffourg
Maxime Martinet
Véronique Ducrocq
Christine Lac
Offshore convection occurred over the Mediterranean sea on 26 October 2012 and was well documented during the first Special Observation Period (SOP1) of the Hydrological cycle in the Mediterranean Experiment (HyMeX). This paper analyses the triggering and organizing factors involved in this convection case study, and examines how they are simulated and represented at hectometric resolutions. For that purpose, a large-eddy simulation (LES) of this real case study is carried out with a 150 m horizontal resolution over a large domain encompassing the convective systems and the low-level flow feeding convection over the sea. This LES is then compared to a reference simulation performed with a 450 m grid spacing in the heart of the so-called “grey zone” of turbulence modelling.
An increase in horizontal resolution from 450 down to 150 m is unable, for this case study, to reduce significantly deficiencies of the simulation; this is more related to an issue of initial and lateral boundary conditions. Indeed, some of the triggering factors, such as a converging low-level flow driven by a surface low-pressure system, are simulated quite similarly for both simulations. However, differences for other mechanisms still exist since greater surface precipitation amounts are simulated at 450 m. It is found that the entrainment process, characterized by small eddies at the cloud edges, is strongly underestimated at 450 m horizontal resolution, missing the mixing with the environmental air. Therefore, too rapid a development of deep convection is simulated at this horizontal resolution, associated with fast-track microphysical processes and enhanced dynamics. By contrast, at 150 m horizontal resolution, the updraught cores are mainly resolved, as are the subsiding shell, while subgrid eddies, produced by dynamical processes, are localized at the cloud interior edges, better representing the entrainment process.
Furthermore, this first LES of a real Mediterranean precipitating case study highlights a convective organization with very fine-scale features within the converging low-level flow, features that are definitively out of range of models with kilometric horizontal resolutions.
- Article
(30840 KB) - Full-text XML
- BibTeX
- EndNote


Regularly during fall, heavy-precipitation events (HPEs) occur over the northwestern Mediterranean basin and more particularly over the mountainous coastal regions of France, Spain, and Italy. In most cases, large amounts of precipitation are recorded in less than 1 d (typically more than 200 mm in less than 24 h and sometimes in only a few hours) when a mesoscale convective system (MCS) develops and stays over the same area for several hours (Nuissier et al., 2008; Buzzi et al., 2014; Davolio et al., 2016; Duffourg et al., 2018, among others).
Several past case studies, especially within the framework of the Hydrological cycle in the Mediterranean Experiment (HyMeX) Special Observation Period (SOP1), have extensively investigated the mechanisms and physical processes associated with such high-impact events, based on numerical experiments with kilometric horizontal resolutions and dedicated observations (Ducrocq et al., 2016). Over the Western Mediterranean region, HPEs evolve often within a favourable synoptic pattern, including an upper-level trough centred over the Iberian Peninsula and/or high values of geopotential anchored over central Europe, driving a persistent low-level moist and conditionally unstable marine flow directed towards the coastal mountainous regions. Due to regional and local effects, the low-level flow is then deflected by neighbouring mountain ranges (Pyrénées, Massif Central, and the Alps) or islands such Corsica and Sardinia. In order to trigger deep convection, a lifting mechanism is needed to focus and finally release the conditional convective instability at the same location. Orographic lifting of the conditionally unstable low-level marine flow impinging the foothills neighbouring the Western Mediterranean is a well-studied mechanism for renewing convection triggering at the same location (Barthlott and Davolio, 2016; Duffourg et al., 2018). Lifting can also be due to local convergence in the low-level circulation induced by the orography of the region (Barthlott et al., 2016; Buzzi et al., 2014; Scheffknecht et al., 2016) or lee cyclogenesis (Jansa et al., 2001; Duffourg et al., 2016). A low-level cold pool, possibly forming under the MCS, can also lift the low-level flow at its leading edge (Ducrocq et al., 2008) and/or modify the low-level circulation locally and enhance convergence areas (Duffourg et al., 2016).
While these previous studies have shown that a horizontal resolution of about 1 km is able to simulate many of the observed features of Mediterranean HPEs, as well as their associated key physical mechanisms, they have difficulties representing the time at which convection is triggered and how it is organized. The increase in horizontal resolution to sub-kilometric grid spacings could be a way for improvement. Indeed, Verrelle et al. (2015) have shown, for an idealized convective case, that an increase in horizontal resolution of 500 m simulates stronger updraughts within convective cells associated with a greater cloudy coverage. Hanley et al. (2015) and Fiori et al. (2017) carried out numerical modelling HPE case studies over Italy with grid spacings ranging from 5 km to 200 m. Similar to idealized studies, they found that smaller convective cells with a stronger intensity are simulated with a horizontal resolution finer than 500 m. Scheffknecht et al. (2016) found that, when the horizontal grid spacing is reduced to 500 m, precipitation is more widespread, maximum values are lower, and individual convective cells are smaller. These previous studies concluded that surface precipitation amounts are enhanced and convective structures are better represented at a sub-kilometric scale.
Nevertheless, the increase in horizontal resolution may pose problems especially for the turbulence parameterization within the so-called “grey zone” (GZ), typically in the range of horizontal resolutions of about a few hundreds of metres and also depending on the model's effective resolution (Wyngaard, 2004). Indeed, there are still uncertainties about how turbulence should be modelled at these resolutions. Past studies have investigated the impact of a one-dimensional (1D) versus a three-dimensional (3D) representation of the turbulence at sub-kilometric horizontal resolution. Verrelle et al. (2015) showed that a 3D turbulence leads to stronger mixing and greater cloud cover. Machado and Chaboureau (2015) carried out simulations using 1D turbulence, which produced too many small cloud systems and rainy cells with a shorter lifespan. Additionally, Verrelle et al. (2017) compared kilometric deep-convection simulations, with up to 500 m resolution, to a large-eddy simulation (LES) and showed that subgrid turbulent kinetic energy at these resolutions was underestimated with the eddy-diffusivity turbulence scheme, due to an underestimation of thermal turbulence production, while resolved vertical velocities tend to be overestimated. Based on simulations carried out with 500 m grid spacings, Martinet et al. (2017) found that, for a specific case study of HyMeX SOP1 (IOP16a), it is not only cloud organization but also the simulated environment and processes governing convection that are strongly sensitive to the formulation of the mixing length. Indeed, when turbulent mixing is weak (i.e. weak subgrid turbulent kinetic energy), the resolved winds are increased, leading to greater low-level moisture advection, higher hydrometeor contents, marked low-level cold pools, and therefore more intense simulated convective systems.
This strong sensitivity obtained by Martinet et al. (2017) motivates the adoption of an LES-like approach, enabling a more suitable representation of turbulence within and at the edge of convective clouds and also within the atmospheric boundary layer. In an LES framework, eddies that contain most of the kinetic energy are resolved, whereas smaller eddies, which carry less than 20 % of the total kinetic energy, are represented by subgrid processes. Although several studies have demonstrated the need to use grid spacing of about 100 m to represent the convective flow correctly (Bryan et al., 2003; Petch, 2006; Stein et al., 2015; Zängl et al., 2015; Dauhut et al., 2015, 2016, among others), most of these works were carried out using an idealized framework and/or using a small domain. To the authors's knowledge no LES numerical simulation of a real case study of Mediterranean HPE over a large domain has previously been performed. The purpose of this paper is to evaluate and analyse the impact of increasing horizontal resolution for LES in a numerical simulation of Mediterranean HPE, using a true topography in addition to realistic initial and forcing conditions. The present study goes further analysing how the physical mechanisms and convective organization are represented from sub-kilometric horizontal resolutions down to LES. For that purpose, a large domain encompassing the convective systems as well as the low-level flow feeding convection over the sea is considered. The paper focuses on the same offshore convection case study described in Duffourg et al. (2016) and Martinet et al. (2017) (IOP16a), which took place on 26 October 2012 during the SOP1 of the HyMeX field programme (Ducrocq et al., 2014).
This article is organized as follows. A quick review of the case study and the mechanisms involved are provided in Sect. 2. The numerical model and the simulation setup are presented in Sect. 3. Both simulations with hectometric horizontal resolutions and LES, respectively, are compared in terms of rainfall field analysis and convection organization in Sect. 4. The physical processes at cloud scale leading to very deep convection and convection organization are assessed in Sect. 5. Finally, the study is summarized and conclusions are given in Sect. 6, where perspectives for future work are also suggested.
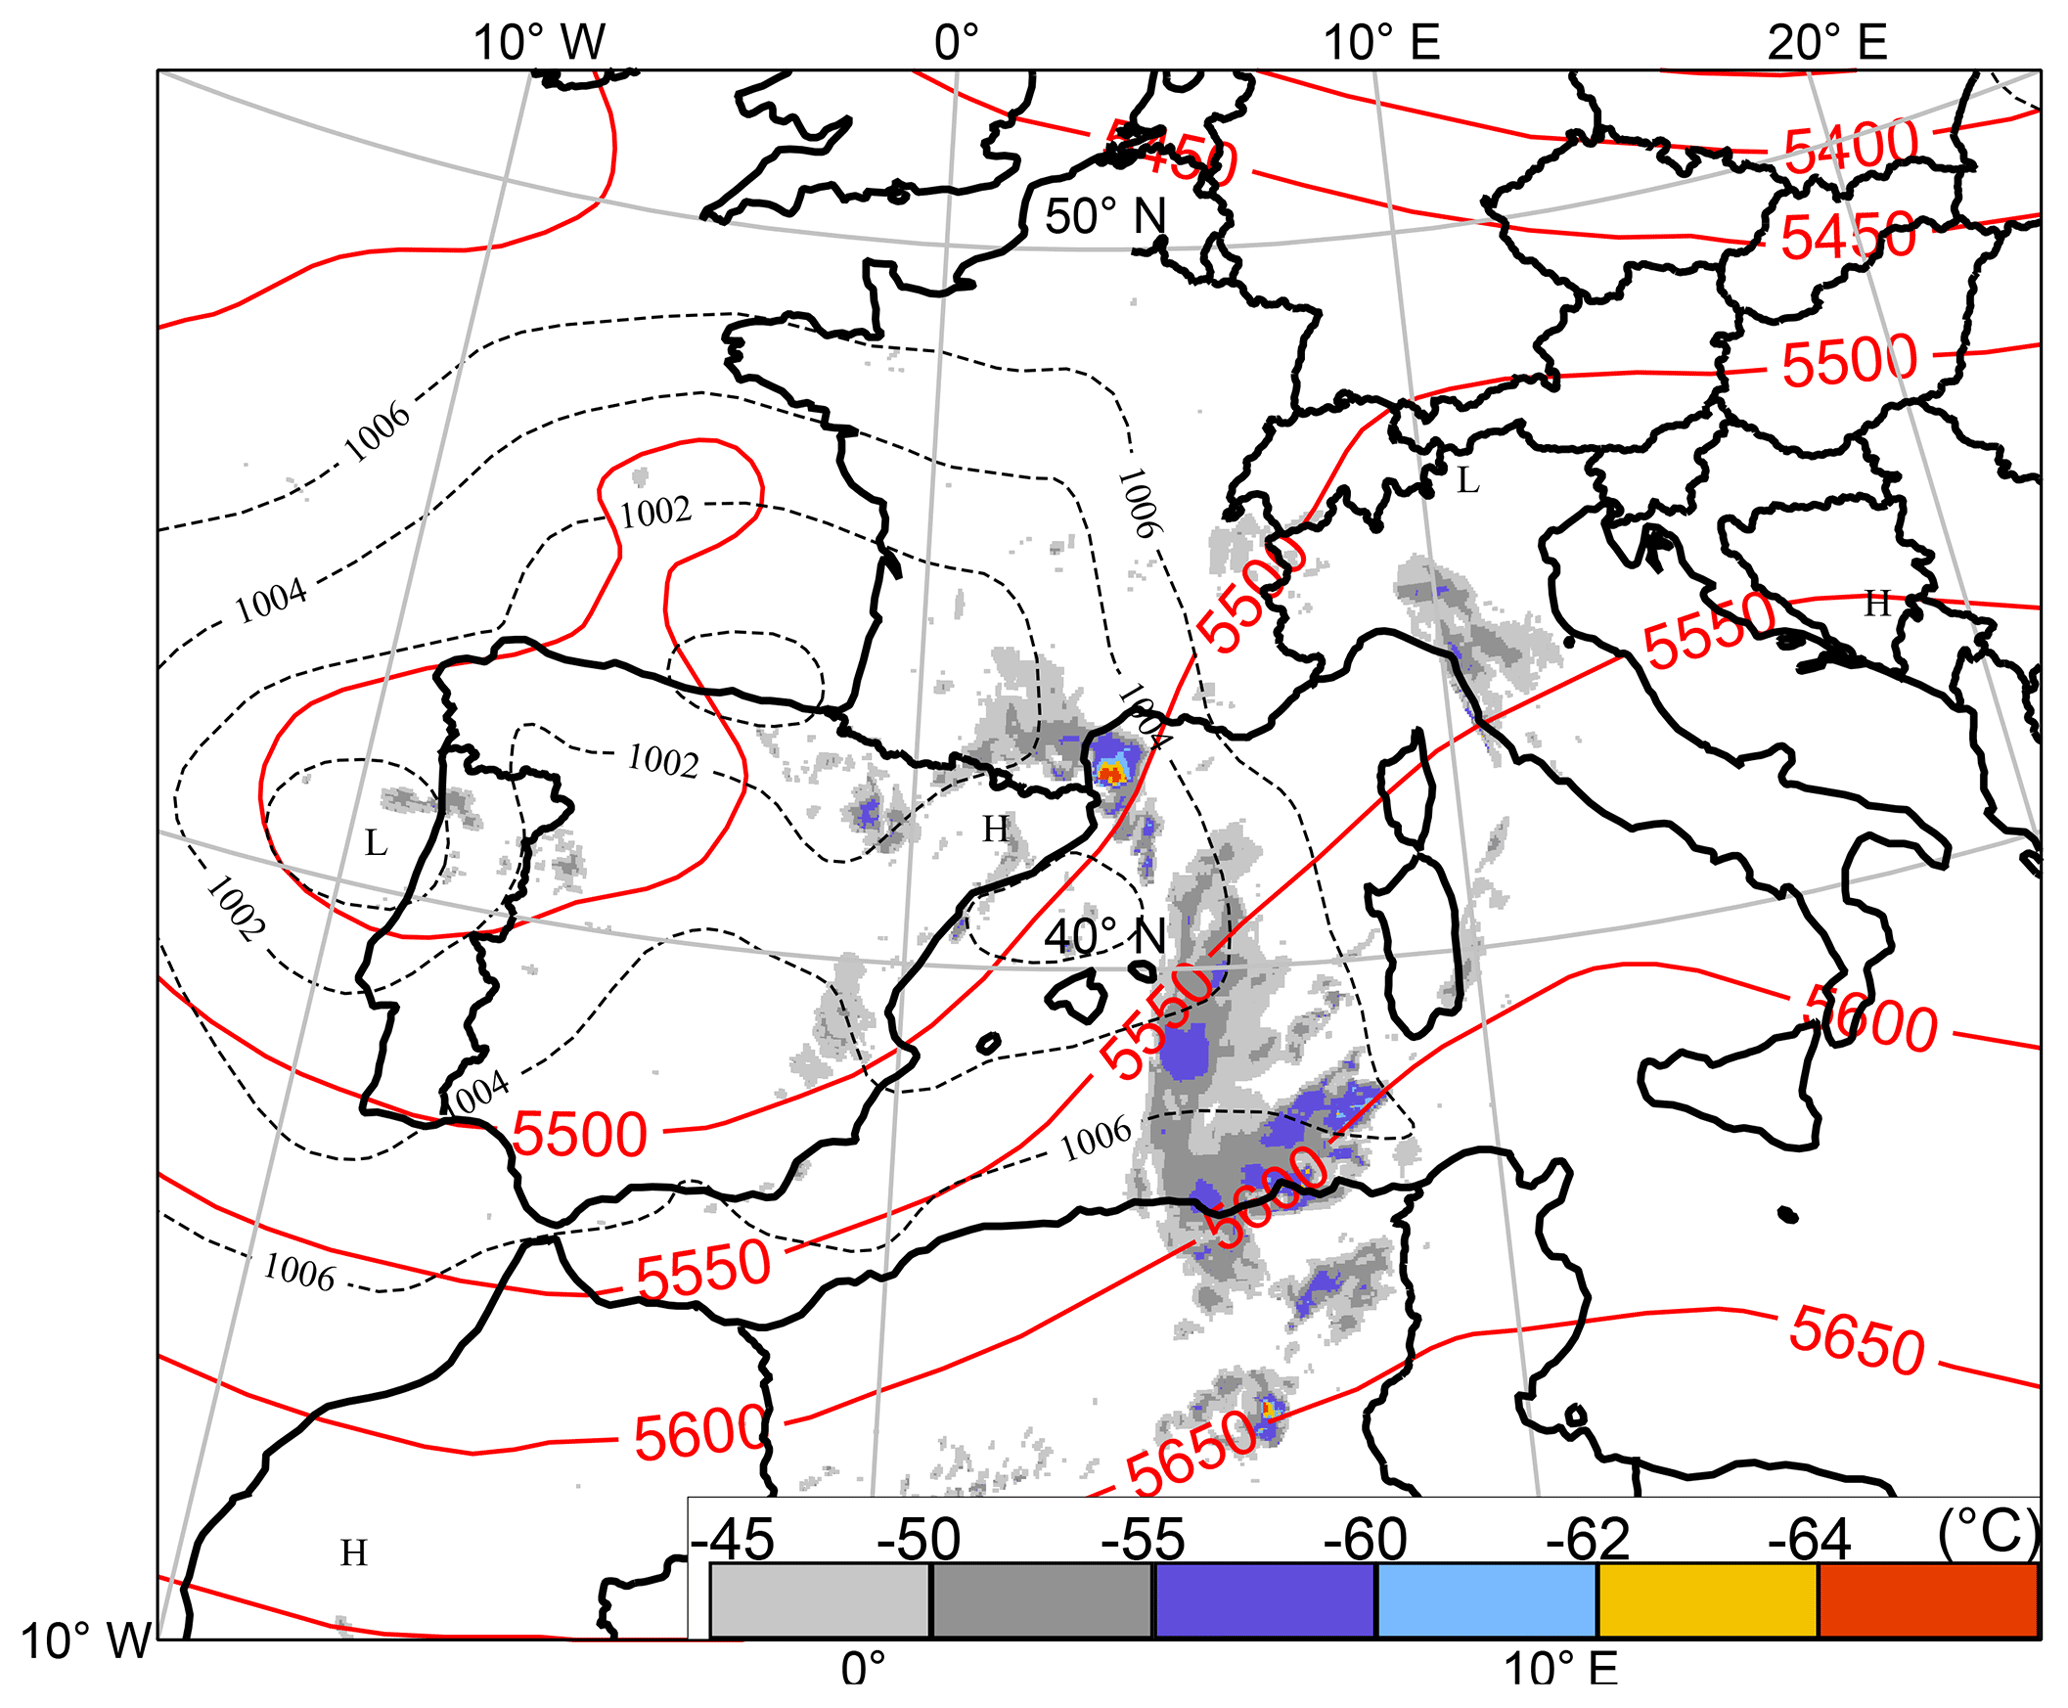
Figure 1ARPEGE analysis for IOP16a in terms of 500 hPa geopotential height (solid line, every 50 dam) and mean sea level pressure (dashed line, hPa) and Meteosat Second Generation infrared brightness temperature (∘C) (channel 9, 10.8 µm) (coloured areas) valid at 06:00 UTC on 26 October 2012.
2.1 Meteorological conditions
This section presents the HPE observed on 26 October 2012 and well documented during the HyMeX SOP1. During this event, a large part of the northwestern Mediterranean was affected by intense precipitation which locally led to flash flooding.
Figure 1 shows the synoptic-scale situation, valid at 06:00 UTC on 26 October 2012. The synoptic situation was characterized by a large deep upper-level low centred over Spain. A short-wave trough along with an associated potential vorticity anomaly (not shown) circulated ahead of the main system (i.e. offshore intense convective systems), passing over southeastern Spain, France, and then Italy. Moreover, a large low was also anchored over Spain as seen with the mean sea level pressure (Fig. 1).
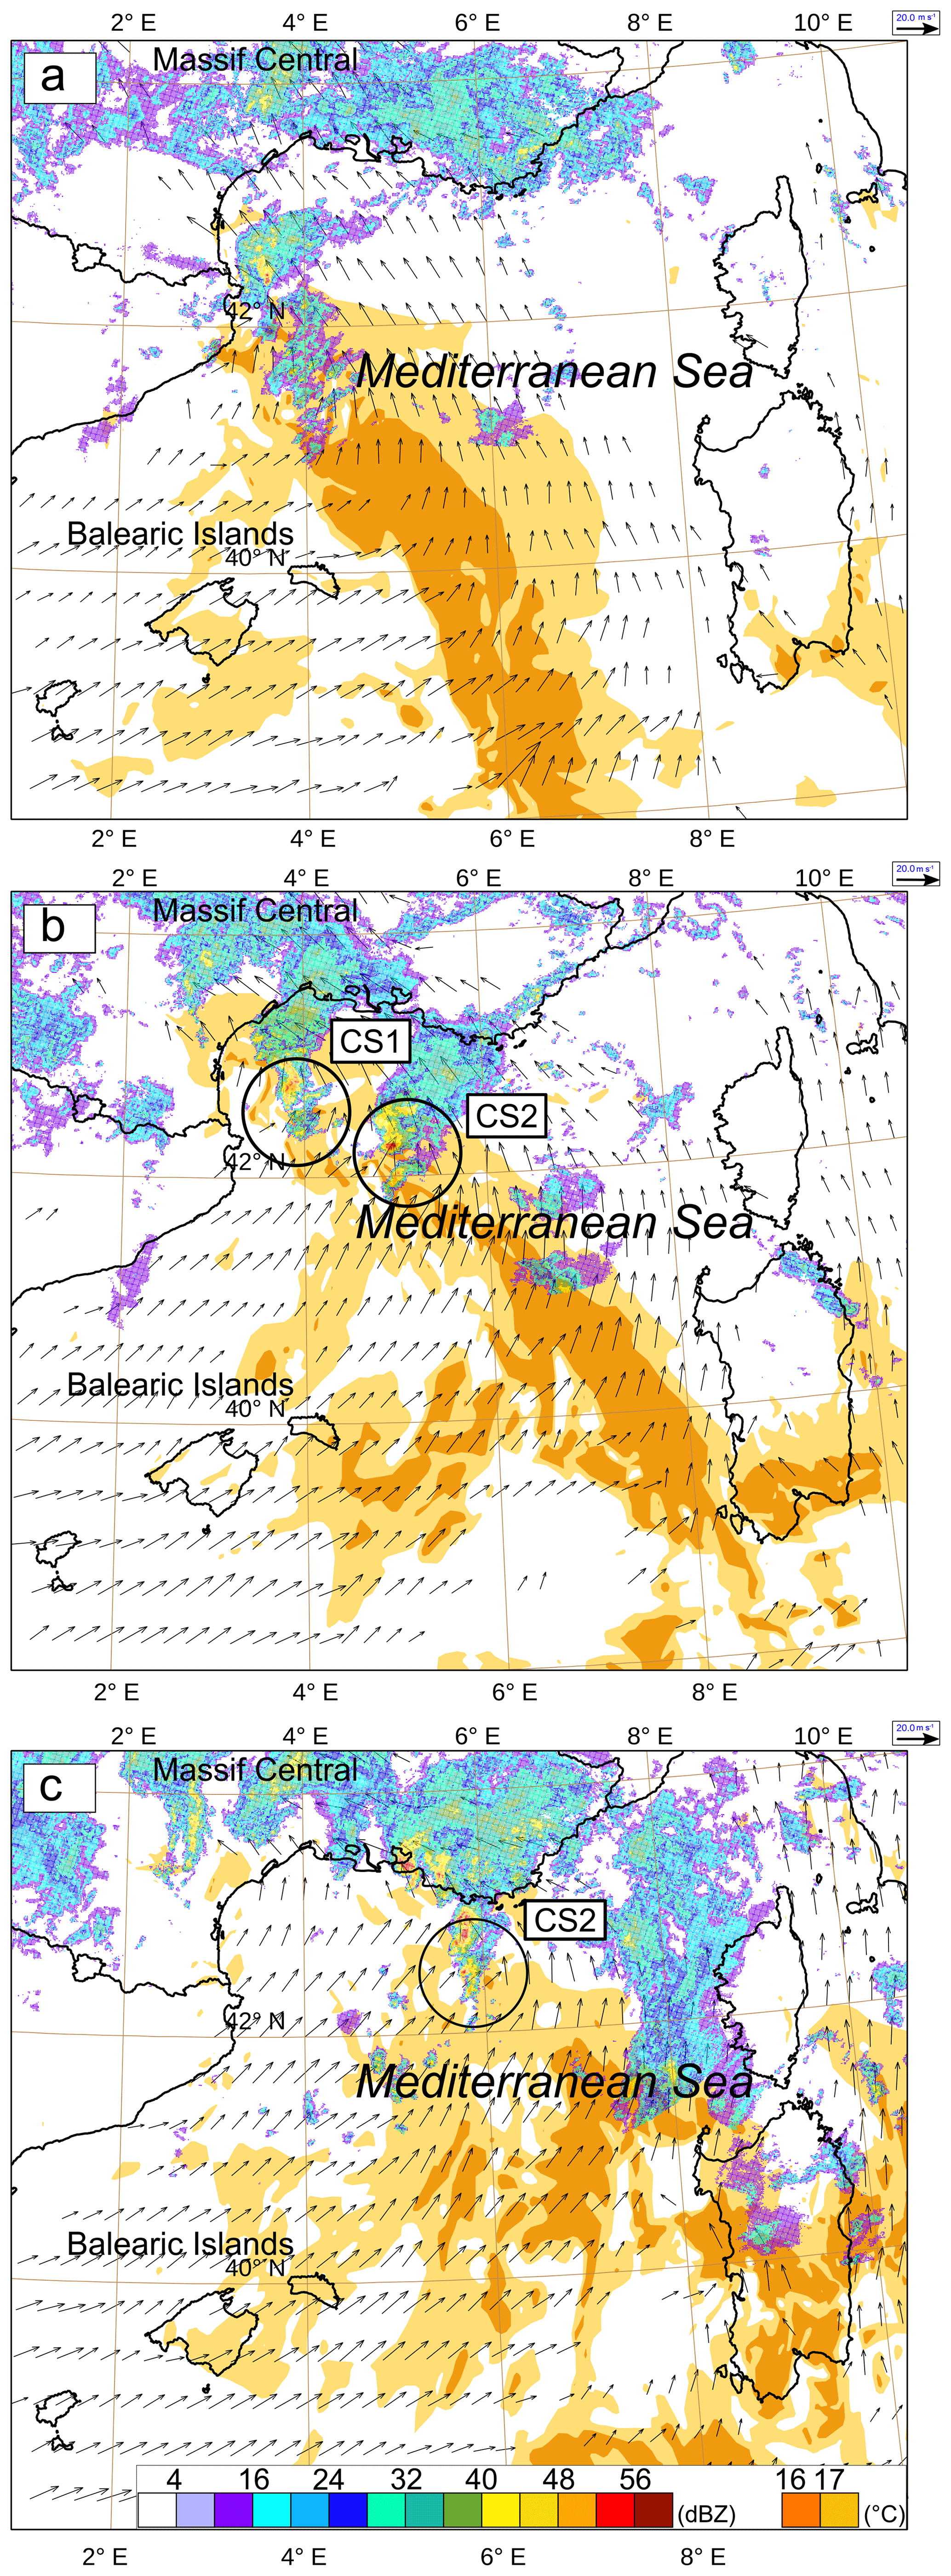
Figure 2Observed radar reflectivity (colour scale, dBZ) superimposed onto AROME analysis for IOP16a in terms of adiabatic wet-bulb potential temperature (coloured areas) and horizontal winds greater than 20 m s−1 (arrows) at 925 hPa valid at (a) 06:00 UTC, (b) 09:00 UTC, and (c) 12:00 UTC on 26 October 2012.
At low levels, Fig. 2 shows that deep convection was embedded within a very moist flow all along the system life cycle. A surface low pressure formed and strengthened downstream of the Iberian mountainous regions, between Spain and the Balearic Islands. It was strongly associated with the eastward propagation of the upper-level trough.
Such favourable meteorological conditions described above led to the generation of several convective systems over the Mediterranean Sea. The first convective cells appeared just east of the Spanish coast around 06:00 UTC on 26 October. Convection started to organize while moving northeastwards and forming an intense south–north-oriented line (marked CS1) (Fig. 2b). It appeared that, in addition to offshore convection, the meteorological situation was also favourable for orographic forcing over the southern slopes of the Massif Central throughout the day on 26 October 2012. The southernmost cells behind CS1 also developed and organized into a second mesoscale convective system (marked CS2), which headed east–northeastwards towards the southeastern coastal regions of France. In the afternoon of 26 October 2012, CS2 crossed the region with surface rainfall amounts of about 150 mm in 24h causing two casualties.
2.2 Triggering mechanisms
An exhaustive evaluation of Meso-NH simulations for the convective systems involved in IOP16a can be found in both Duffourg et al. (2016) and Martinet et al. (2017) at 2.5 km and 500 m horizontal resolution, respectively.
The numerous dedicated airborne and ground-based observations during the HyMeX SOP1 (suites of water vapour lidars, wind profilers, radiosoundings, and boundary-layer drifting balloons, among others) over the sea and along the coast of the northwestern Mediterranean offered a unique framework for validating the convective systems simulated over the sea by kilometric-scale numerical models initialized and driven by kilometric resolution analyses. Indeed, Duffourg et al. (2016) showed that these convective systems during IOP16a were fed during their evolution over the sea by moist and conditionally unstable air masses. A southwest to southeasterly converging low-level flow over the sea is the main triggering mechanism acting to continually initiate and maintain the renewal of convective cells, contributing to the back-building systems CS1 and CS2. Lifting is also partly due to evaporative low-level cooling. In addition it appears that this low-level cooling also controls the organization into a mesoscale convective system.
Martinet et al. (2017) found that the mechanisms mentioned above, as well as the dynamics of the convective systems, are sensitive to the mixing length formulation used in turbulence parameterization, at a horizontal resolution of 500 m. These elements motivate an increase in the horizontal resolution up to LES scale in this present study to assess how the physical mechanisms involved are represented.
3.1 The Meso-NH model
The French non-hydrostatic mesoscale numerical model Meso-NH (Lac et al., 2018) was used for the simulation of the IOP16a case study. The Gal-Chen and Somerville (1975) vertical coordinate is used with 140 vertical levels. The vertical grid spacing is stretched with altitude, from 10 m close to the surface to 250 m aloft. The top of the domain is at 20 km altitude, and a Rayleigh damping is progressively applied above 15 km altitude to the perturbations of the wind components and the thermodynamical variables with respect to their large-scale values, in order to prevent spurious reflections from the upper boundary.
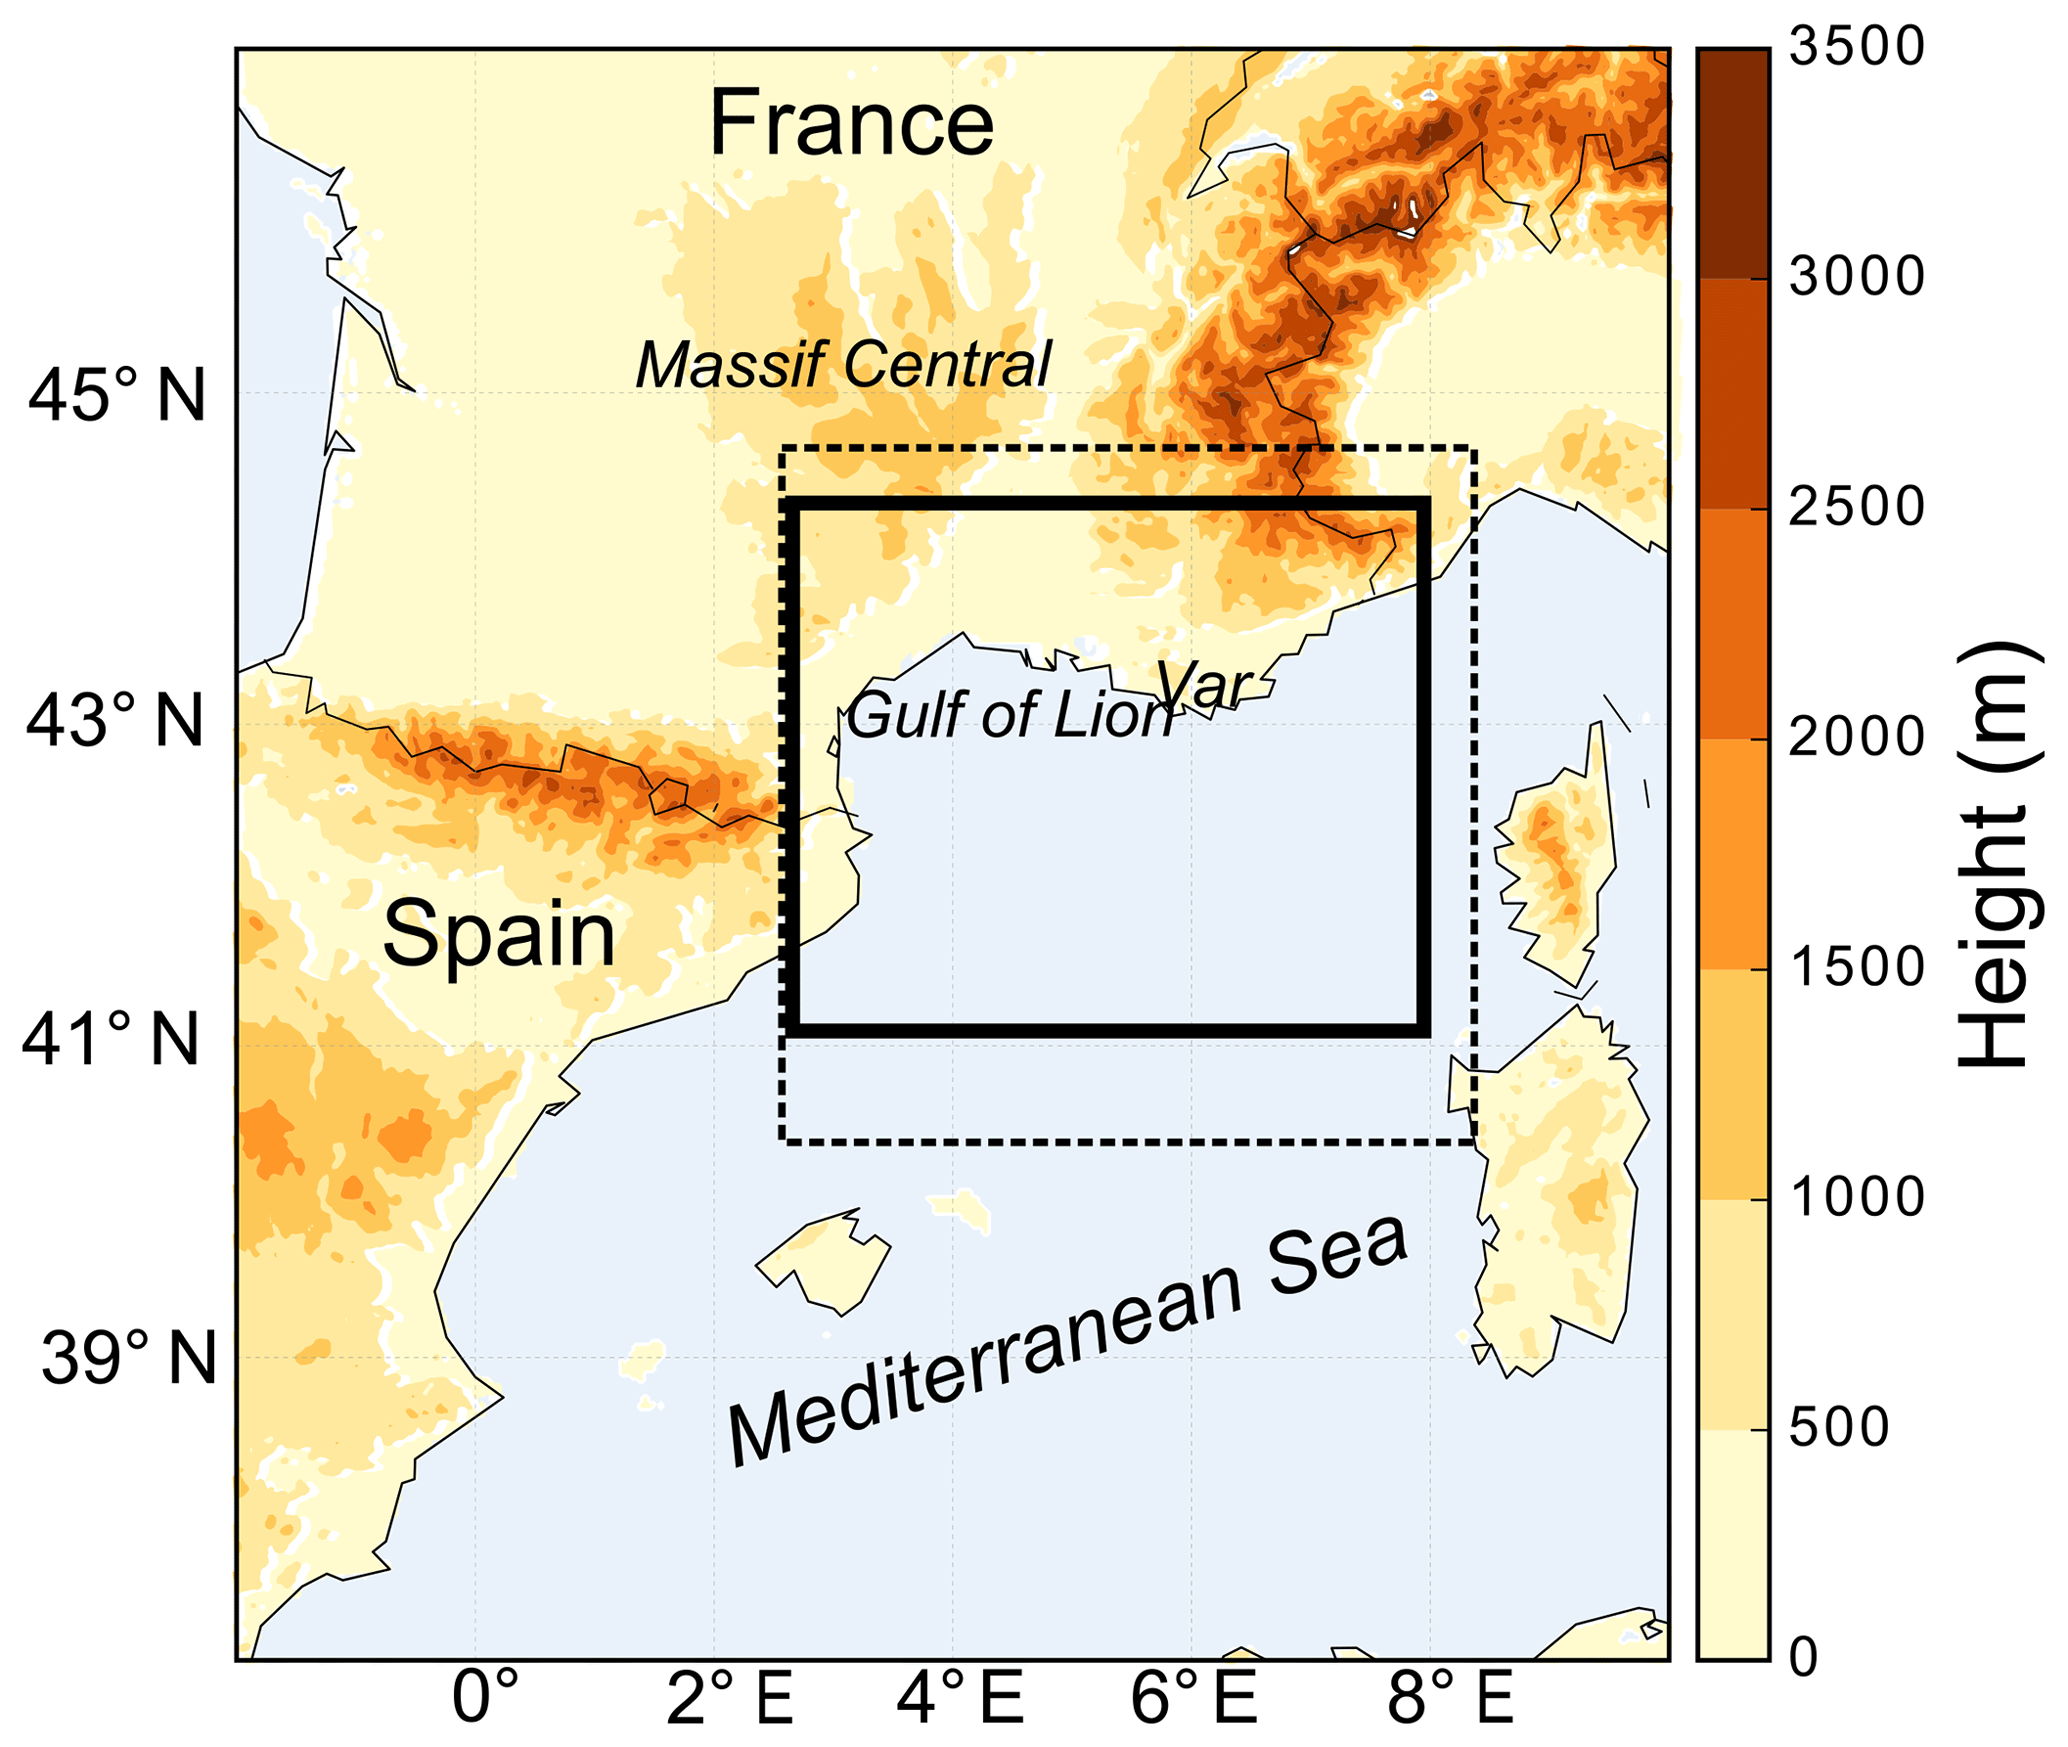
Figure 3Computational domains used for the outer/coarser domain (900 m, dashed rectangle) and for the inner/finer domain (450 or 150 m, thick solid rectangle), respectively (see text for more explanation). The model orography (m) is shown in shading.
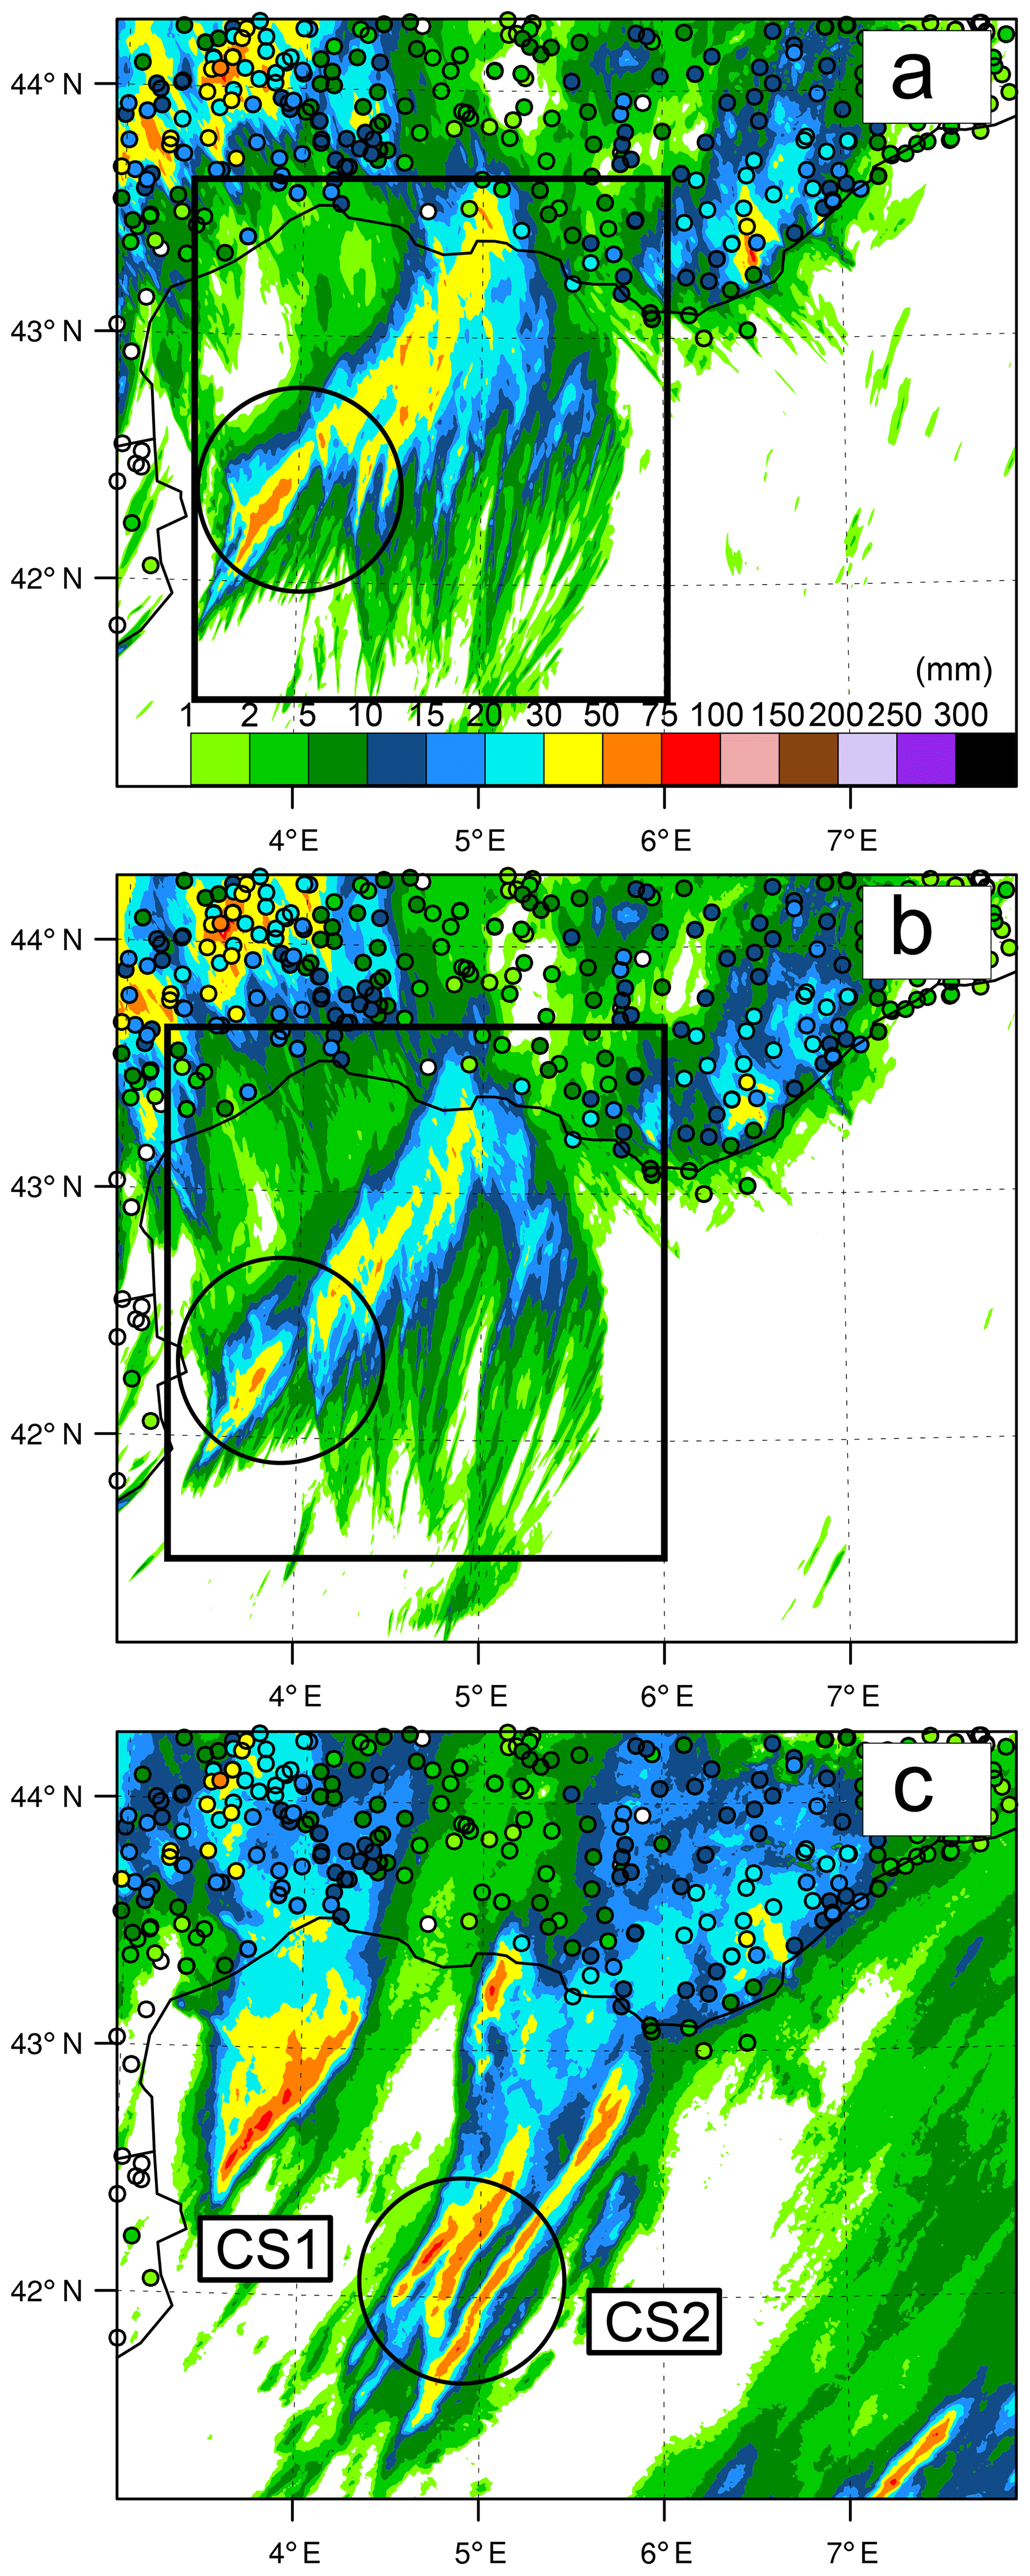
Figure 4Six-hour accumulated simulated and observed surface precipitation from (a) the LR450 experiment, (b) the LR150 experiment, and (c) radar estimates between 06:00 and 12:00 UTC on October 2012. The small circles in the panels represent the rain gauge observations, whereas the largest ones highlight the surface precipitation associated with CS2.
The prognostic variables are the three Cartesian components of velocity: the dry potential temperature, the different water mixing ratios, and the turbulent kinetic energy. Pressure perturbations are determined by solving the elliptic equation obtained by combining air mass continuity and momentum conservation equations. The transport scheme for momentum variables is the weighted essentially nonoscillatory (WENO) scheme (Shu and Osher, 1988) of the fifth order combined with the fourth-order Runge–Kutta time-splitting method (Lunet et al., 2017), while the other 20 variables are transported with the piecewise parabolic method (PPM) scheme (Colella and Woodward, 1984). A bulk one-moment mixed microphysical scheme (Caniaux et al., 1994; Pinty and Jabouille, 1998) governs the equations of the six water species: water vapour, cloud water, rainwater, primary ice, snow aggregates, and graupel. The turbulence parametrization is based on a 1.5-order closure (Cuxart et al., 2000) and the calculation of the turbulent flow is performed through a three-dimensional (3D) scheme for a horizontal resolution below kilometric grid spacings. For a horizontal resolution of about a few hundred metres and coarser grids, the mixing length follows the method of Bougeault and Lacarrère (1989), whereas for LES resolution, the mixing length formulation follows the one proposed by Deardorff (1972), which is directly proportional to the grid volume. The numerical setup used in this study also used other parametrization schemes including the Rapid Radiation Transfer Model parametrization (Mlawer et al., 1997), the Pergaud et al. (2009) eddy-diffusivity mass flux scheme for shallow convection, and the surface model SURFace EXternalisé (SURFEX) (Masson et al., 2013).

Figure 5(a) Time series of the hourly surface precipitation (mm) for LR450 and LR150 experiment, averaged over the whole subdomain seen in Fig. 4 (solid lines) and averaged over the area where surface precipitation exceeds 0.1 mm h−1 (dashed lines). (b) Time series of spatial coverage (%) of the hourly surface precipitation exceeding the threshold of 0.1 mm h−1 over the same subdomain.
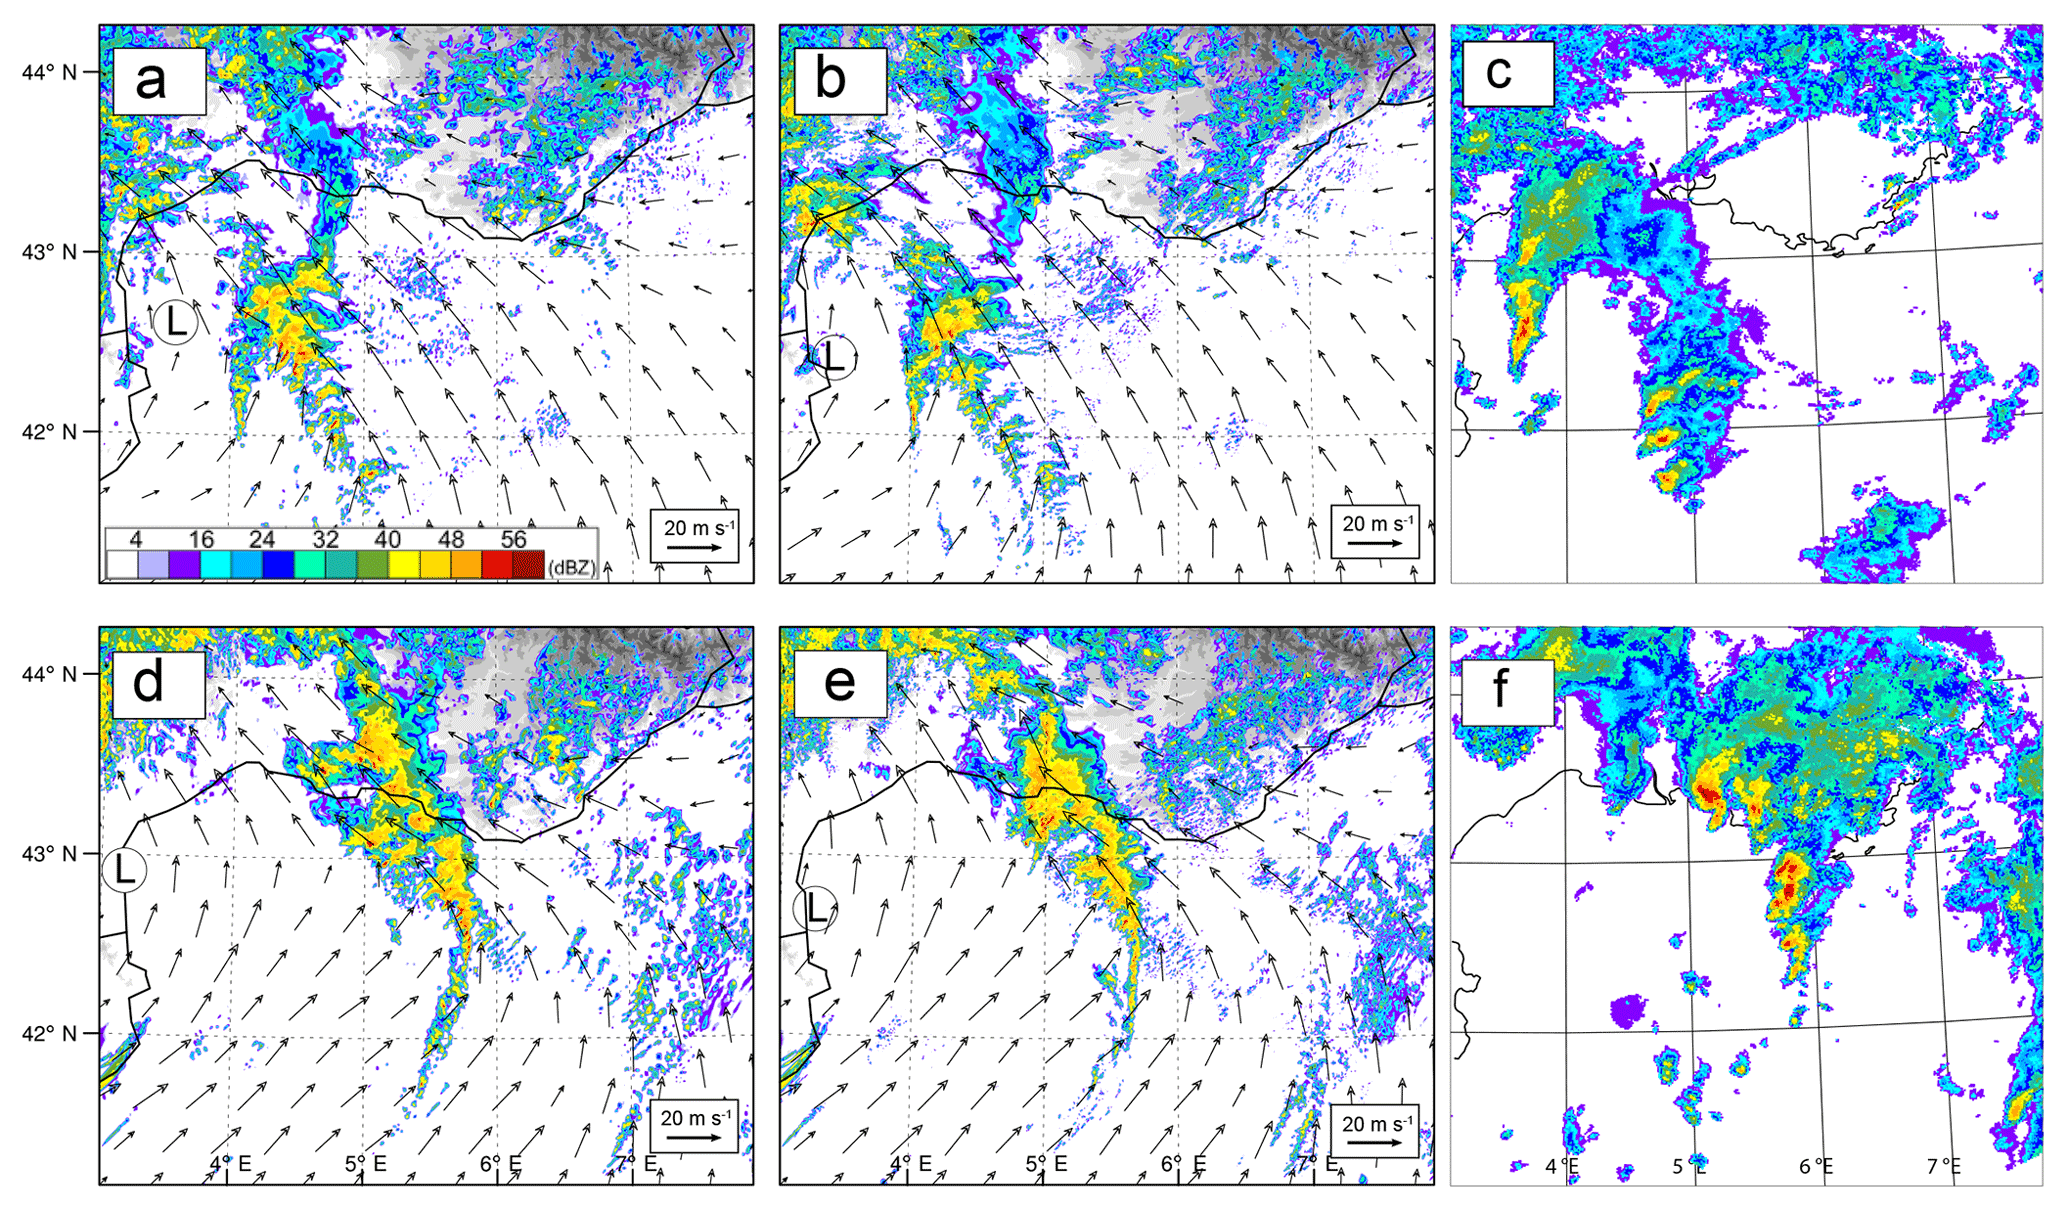
Figure 6Simulated radar reflectivities (dBZ) at 850 hPa and horizontal winds (m s−1) at 950 hPa from (a) LR450 and (b) LR150 at 09:00 UTC on 26 October 2012, respectively. Panels (d) and (e) are the same except for 12:00 UTC. The symbol L marks the location of the surface low-pressure system. Panels (c) and (f) represent the observed radar reflectivities at 09:00 and 12:00 UTC, respectively.
3.2 Simulation design
In this present study an LES of the IOP16a case study is carried out with the Meso-NH model. As in Duffourg et al. (2016) and Martinet et al. (2017), the initial and lateral boundary conditions of the simulations are provided by the AROME-WMED analyses (Fourrié et al., 2015). Since it is not suitable to initialize and drive the LES simulation using the AROME-WMED analyses directly due to too large a horizontal resolution gap, an intermediate domain with a coarser grid is used, through the nesting technique in a two-way interactive mode (Stein et al., 2000). The coarser grid provides the lateral boundary conditions to the finer one, while the variables of the coarser grid are relaxed with a short relaxation time toward the finer grid's values in the overlapping area. Vertical grids are the same. For this present study, two nested domains in the horizontal plane with horizontal grid spacings of 900 and 150 m (hereafter HR150) were used. Another control simulation (hereafter LR450) is carried out with horizontal grid spacings of 900 and 450 m, respectively (Fig. 3). The simulation domains cover nearly the same regions as in Martinet et al. (2017), i.e. the southeastern France and the northwestern Mediterranean, encompassing the precipitating systems and their marine low-level moisture supplying flow (see Fig. 3).
The simulations are initialized at 00:00 UTC on 26 October 2012 and run until 12:00 UTC. At 00:00 UTC and for a 3 h period, only the coarser domain with a grid spacing of 900 m (dashed rectangle in Fig. 3) is started. The finer domains (450 or 150 m) are activated at 03:00 UTC and for the rest of the simulation period.
This section aims at assessing the impact of increasing horizontal resolution by comparing both simulations over the same spatial scale. For that purpose the reference LES fields are upscaled at a coarser horizontal resolution of 450 m (hereafter LR150). The fields are thus coarse grained by averaging the LES fields as in Verrelle et al. (2017) or Honnert et al. (2011). We focus on the life cycle of heavy precipitation occurring over the sea mainly on the morning of 26 October 2012, with a mature phase happening between 06:00 and 12:00 UTC. During this period, the triggering mechanisms within the convective systems are examined.

Figure 7Same as Fig. 6 except for simulated infrared brightness temperature (∘C).
4.1 Comparison between LR450 and LR150 simulations
4.1.1 Precipitation field analysis
Figure 4 represents the surface rainfall accumulated between 06:00 and 12:00 UTC on 26 October 2012. Both LR450 and LR150 simulate the areas of strong precipitation over southeastern France fairly well. The surface rainfall over land is well reproduced in terms of magnitude and location over the Var region and over the southeastern part of the Massif Central, compared to observations (Fig. 4).
As for precipitation over the sea, it is worth mentioning that radar quantitative precipitation estimation is impacted by large uncertainties and in any case should be viewed cautiously. Nevertheless, two areas of strong accumulated surface rainfall are observed over the sea in Fig. 4c: a first one located near 4∘ E and a second one a few tens of kilometres southwest near 5∘ E. These regions of large precipitation are caused by the convective systems CS1 and CS2 mentioned earlier. Although only one convective system is simulated (i.e. CS2), its evolution over the sea is well simulated by both LR450 and LR150, except for a location too far west and stronger offshore rainfall just east of the Spanish coast (see area circled in Fig. 4). This precipitation pattern is explained by a former convective system triggered earlier in the simulation and not dissipating in time. But the spatial distribution and magnitude of precipitation appear stronger for LR450 compared to LR150. The results presented here for LR450 are fairly comparable to those obtained by Martinet et al. (2017) with a 500 m horizontal resolution. Differences are probably due to both different initial conditions and numerical schemes in both simulations.
In order to assess the consistency of these results along the entire simulation period, time series of surface precipitation, averaged over the subdomain represented in Fig. 4, are calculated. This domain encompasses the evolution of the convective system over the sea, not taking into account here precipitation on land. Figure 5 shows the surface precipitation averaged over the whole subdomain and averaged over the area where surface precipitation exceeds 0.1 mm h−1.
One can remark that the surface precipitation simulated by LR450 is greater than LR150 from 06:00 until near 11:00 UTC on 26 October 2012 (Fig. 5a). However, it must be emphasized that the largest surface rainfall in LR450 from 06:00 UTC until 09:00 UTC is mainly due to more spatially widespread precipitation, whereas between 09:00 and 11:00 UTC stronger rainfall rates contribute more to the largest precipitation for LR450. The sensitivity of these results to the precipitation threshold has also been examined (not shown). Indeed, higher precipitation thresholds (>20 mm h−1) confirm that LR450 simulates stronger rainfall over a greater spatial area after 09:00 UTC.
These results with more simulated precipitation with a horizontal resolution of 450 m, compared to the LES, are somewhat different than those obtained by Fiori et al. (2017) or Hanley et al. (2015) for instance, who found that the largest surface rainfall amounts are simulated at the finest scale. Nevertheless around 12:00 UTC, the surface rainfall simulated by LR150 becomes greater (Fig. 5a).

Figure 8Same as Fig. 6 except for virtual potential temperature at the third model level (near 40 m a.g.l.) (∘C, blue areas), water vapour horizontal flux integrated over the lowest 3000 m a.s.l. (kg m−2 s−1, arrows), and vertical velocity exceeding 3 m s−1 at 500 m a.s.l. (red isolines). Black areas denote values of moisture flux exceeding 480 kg m−2 s−1.
Both LR450 and LR150 are now compared by analysing the time evolution of the convection over the sea. It is worth mentioning that a convective system is triggered earlier shortly after the beginning of the simulation and was maintained in the simulation for too long. This former convective system is responsible for the large surface precipitation accumulation just east of the Spanish coast (Fig. 4). The first convective cells of interest are actually triggered a bit late in both simulations near 07:00 UTC on 26 October 2012 (not shown), leading to different behaviour and evolution during the triggering stage compared to observations.
Figure 6 represents the simulated radar reflectivities at 09:00 and 12:00 UTC at 850 hPa compared to observations as well as horizontal winds at 950 hPa. As mentioned previously, the circulation, in which the convective system evolves, was characterized by strong low-level convergence, controlled by surface low pressure located between Spain and the Balearic Islands. This pattern enhances convergence locally in the southwesterly to southeasterly low-level flow. This surface low pressure is simulated quite similarly in both LR450 and LR150 (Fig. 6b and d). The mature stage is characterized by continual renewal of convective cells along the low-level convergence around 09:00 UTC as shown in Fig. 6a and b. This particular organization is also visible in the observed radar reflectivities (Fig. 6c). It appears that the convective system develops faster in LR450 with convection extending more northeastwards. As a matter of fact, when comparing both simulations at upper levels, i.e. analysing the infrared brightness temperature, one can see a more spatially extended convective system with a more pronounced cloudy anvil in LR450 (Fig. 7a and b). On the other hand, one can also remark that, for both LR450 and LR150, the coldest area in terms of brightness temperature is less spatially extended compared to the observations (Fig. 7c and f). This is probably related to a lack of iced hydrometeors at upper levels in the simulations. As the surface low pressure moves east–northeastwards, the low-level flow strengthens and convergence increases, organizing into a very pronounced line. Near 12:00 UTC on 26 October 2012, differences between both LR450 and LR150 become barely discernable and precipitating structures are more comparable (Fig. 6c and d). At this time, both simulations show a convective system tilting along a slight southwest–northeast axis that is fairly comparable with the observed radar reflectivities (Fig. 6f).

Figure 9Time series of: (a) rainwater mixing ratio, (b) graupel mixing ratio, (c) snow aggregate mixing ratio, and (d) the 90th percentile of vertical velocities for LR450 and LR150 experiments,d averaged over the whole subdomain seen in Fig. 4.
In summary, an increase in horizontal resolution from 450 m until 150 m for this case does not significantly improve some deficiencies of the simulation. Indeed, the low-level convergence could be closely controlled by the surface low pressure, and both LR450 and LR150 handle its strengthening very similarly. Moreover, only a single convective system is simulated in both LR450 and LR150 instead of two compared to observations, and surface rainfall that is too strong is simulated just east of Spanish coast. Nevertheless, significant differences appear between both simulations during the mature stage of the convective systems, especially in terms of the accumulation of surface precipitation, the spatial extent of the simulated systems, intensity (between 09:00 and 11:00 UTC), and the development of convection over the Mediterranean Sea.
4.1.2 Triggering mechanisms
In this section, the differences highlighted in terms of simulated surface precipitation patterns, convective organization, and intensity are explained by analysing the environment and the mechanisms associated with the convective systems. It has been shown in the previous section that the mature stage is simulated differently by both LR450 and LR150. The system of interest is triggered around 07:00 UTC just east of another decaying one, offshore of the Balearic Islands, slowly moving east–northeastwards over the sea. This convective system developed within a warm and moist environment and had high values of conditional convective instability (not shown) along a low-level convergence line, as discussed previously. These triggering mechanisms are quite similar to those found by Duffourg et al. (2016) and Martinet et al. (2017) with a 2.5 km or 500 m horizontal resolution, albeit with a slight time lag.
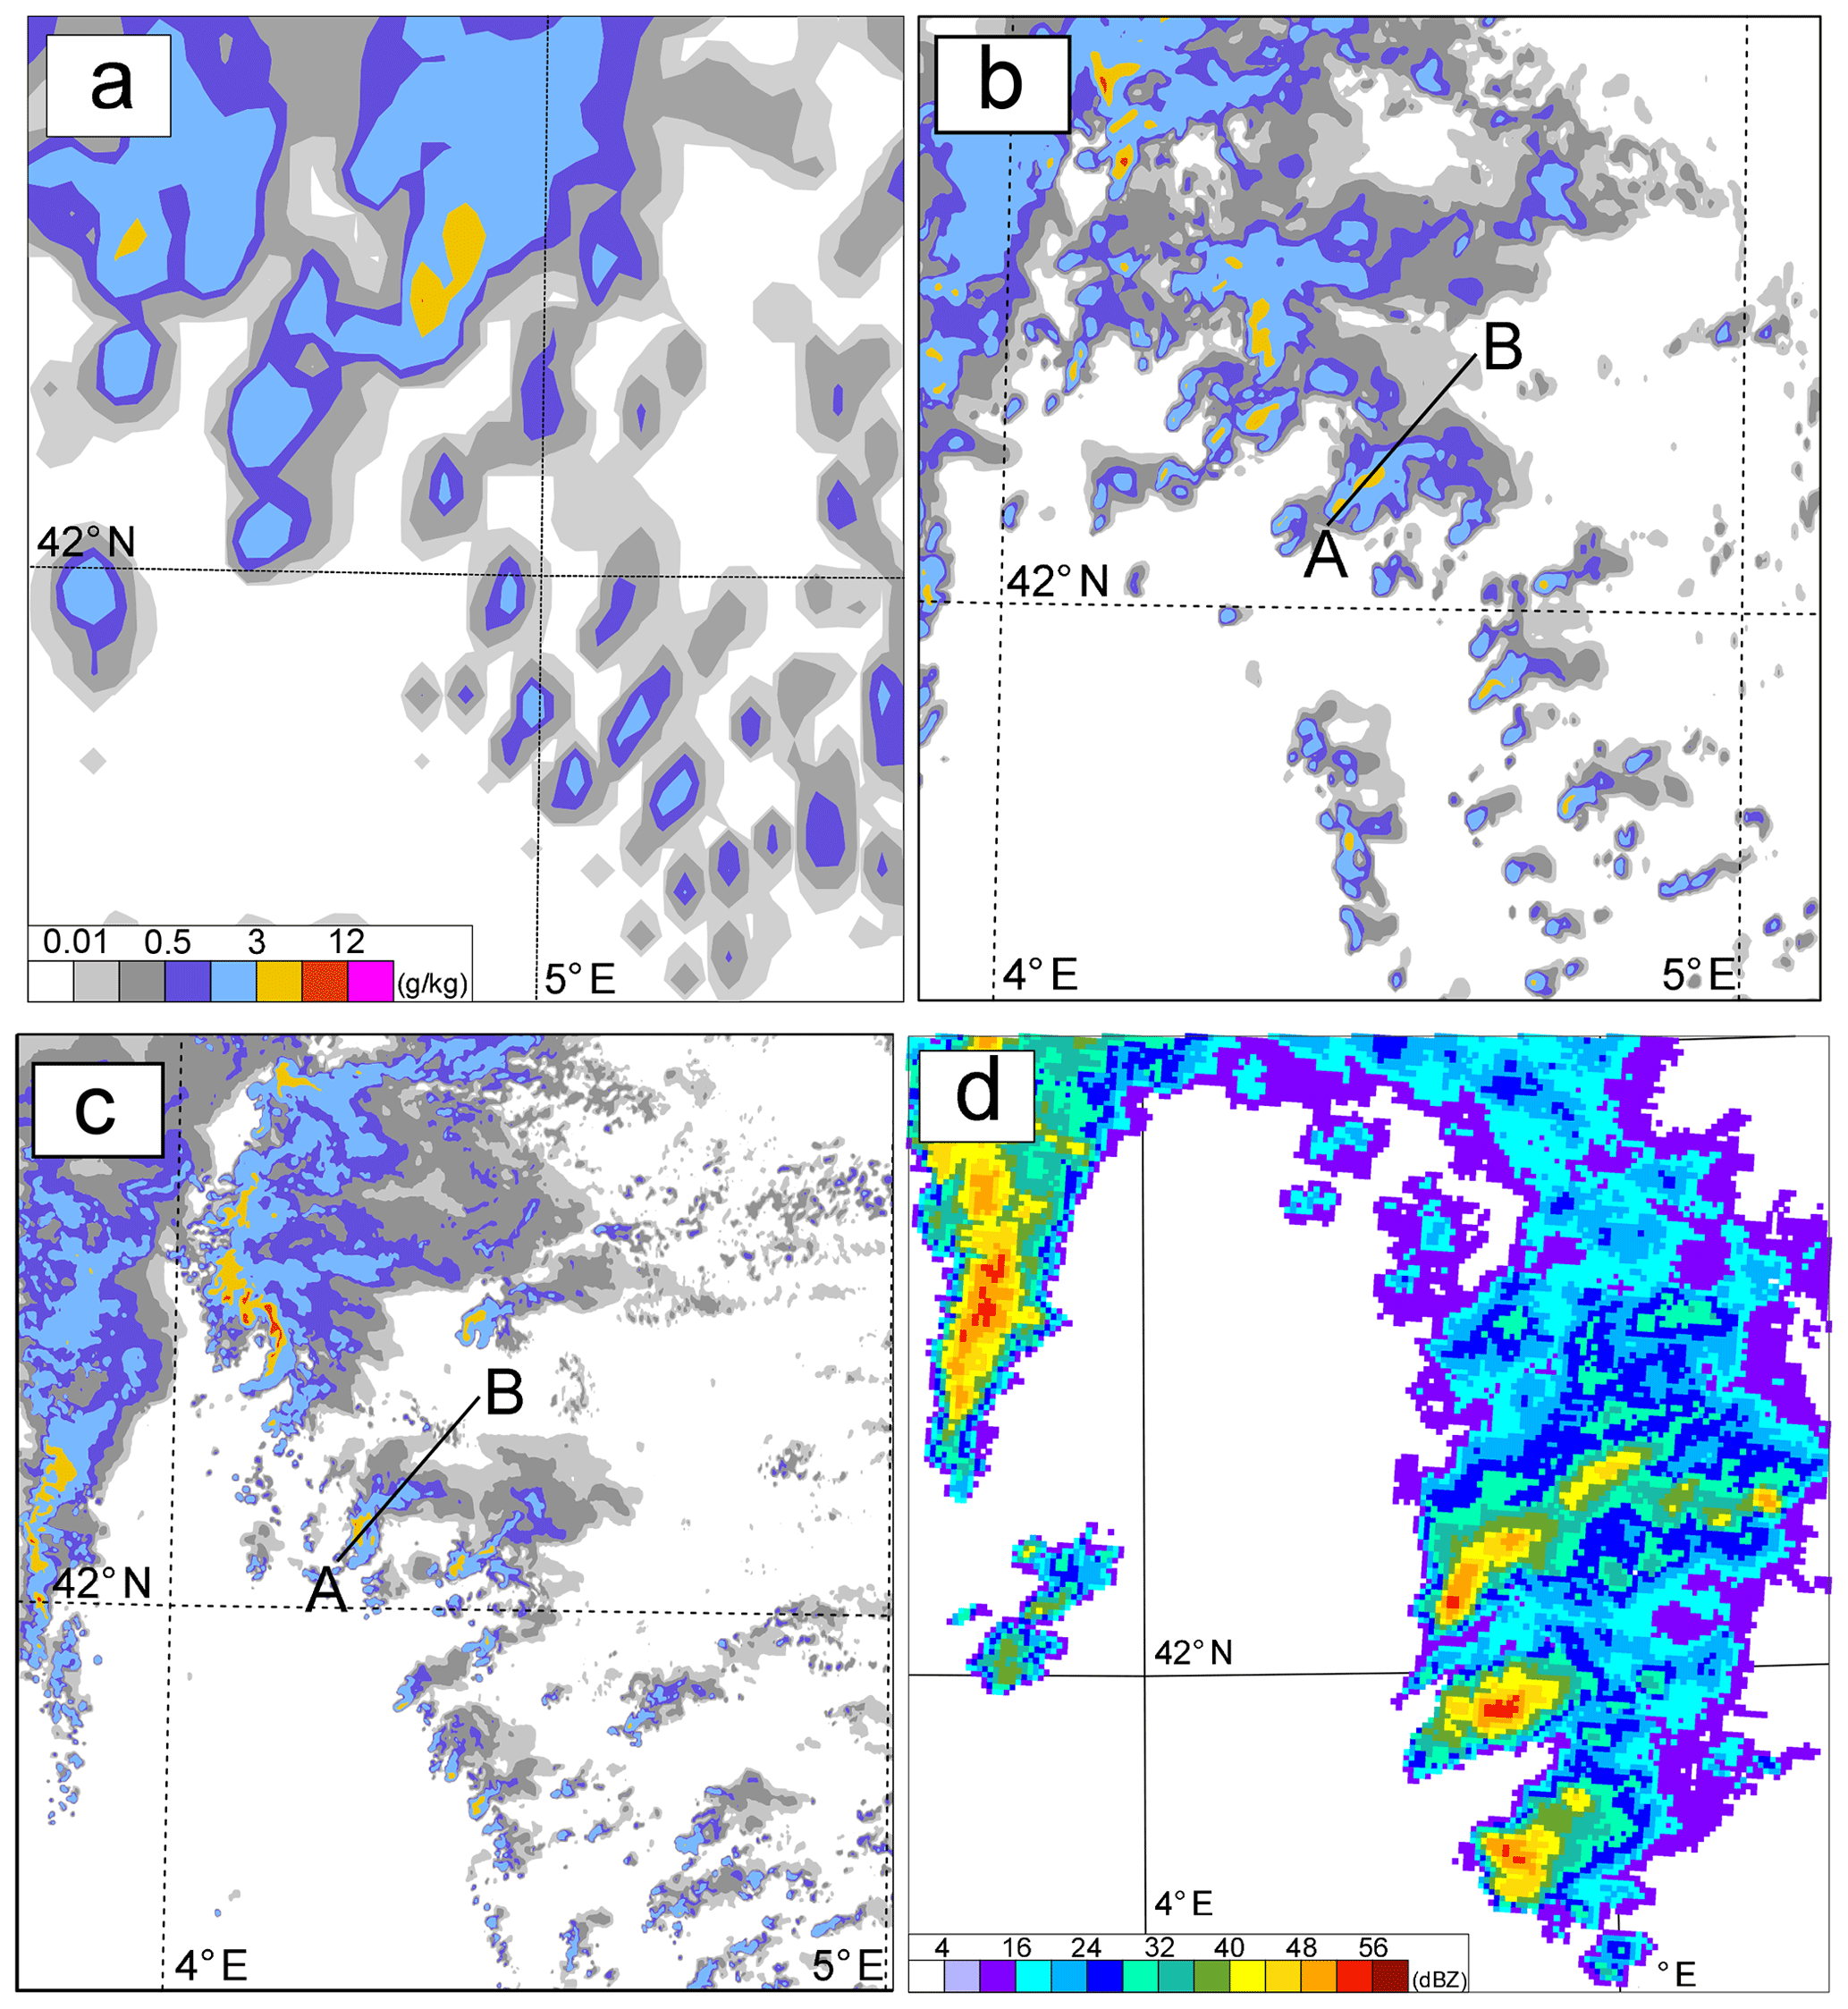
Figure 10Zoomed view of the spatial distribution of warm microphysical species (sum of rain and cloud water mixing ratio) at 1500 m height for (a) the Duffourg et al. (2016) simulation at 2.5 km horizontal resolution, (b) LR450, and (c) HR150. Panel (d) shows the observed radar reflectivities at 09:00 UTC on 26 October 2012.
Thereafter and as also discussed previously, the systems simulated in both simulations adopt different behaviours during their mature stage. Figure 8 shows the low-level moisture flux integrated in the first 3000 m of the troposphere, the virtual potential temperature at near 40 m a.g.l. (third model level) and updraughts with a magnitude greater than 3 m s−1 at 500 m height, simulated for both LR450 and LR150 around the mature stage. The spatial distribution of the low-level moist flux is simulated differently in both simulations. Indeed around 09:00 UTC, LR150 simulates stronger values downstream of the convective system, whereas intense values of low-level moisture flux are located in the vicinity of the precipitating event for LR450, with a maximum value reaching near 500 kg m−2 s−1 (Fig. 8a and b). Near 12:00 UTC on 26 October 2012, the low-level moisture flux becomes stronger and more uniform for LR150, throughout the convective system (Fig. 8d), with locally stronger fluxes than LR450. Strong and pronounced updraughts are simulated for both simulations at the leading edge of the area of low-level convergence, thus evidencing the lifting of conditionally unstable air masses triggering deep convection. This area of low-level convergence and high moisture flux appears to be slightly northeast for LR150.
Another mechanism responsible for lifting is also present and competes with the low-level convergence. Indeed, both simulations reproduce a low-level cold pool (LLCP) underneath the convective system. However, the cooling is more spatially widespread with stronger horizontal gradients greater than 2 ∘C for LR450, favouring more lifting. The LLCP interacts with the low-level flow and also locally enhances the area of convergence, as shown in Duffourg et al. (2016) with their simulations at 2.5 km horizontal resolution. The less intense LLCP for LR150 probably leads to a less deflected flow, stronger moisture advection, and a triggering of convection downstream compared to the system simulated by LR450.
In order to assess how these differences on mechanisms impact the dynamics of the simulated convective systems, Fig. 9 presents time series of the mixing ratios for the precipitating hydrometeors as well as the strongest updraughts, averaged over the whole subdomain shown in Fig. 4. Precipitating hydrometeors (rain, graupel, and snow aggregates) contents and updraughts are increasing throughout the morning of 26 October 2012 until 12:00 UTC, showing a strengthening of the convective system with intense dynamics. Hydrometeor contents and vertical motions are systematically greater for LR450, sometimes exceeding the LR150 values by nearly 50 % (Fig. 9b).
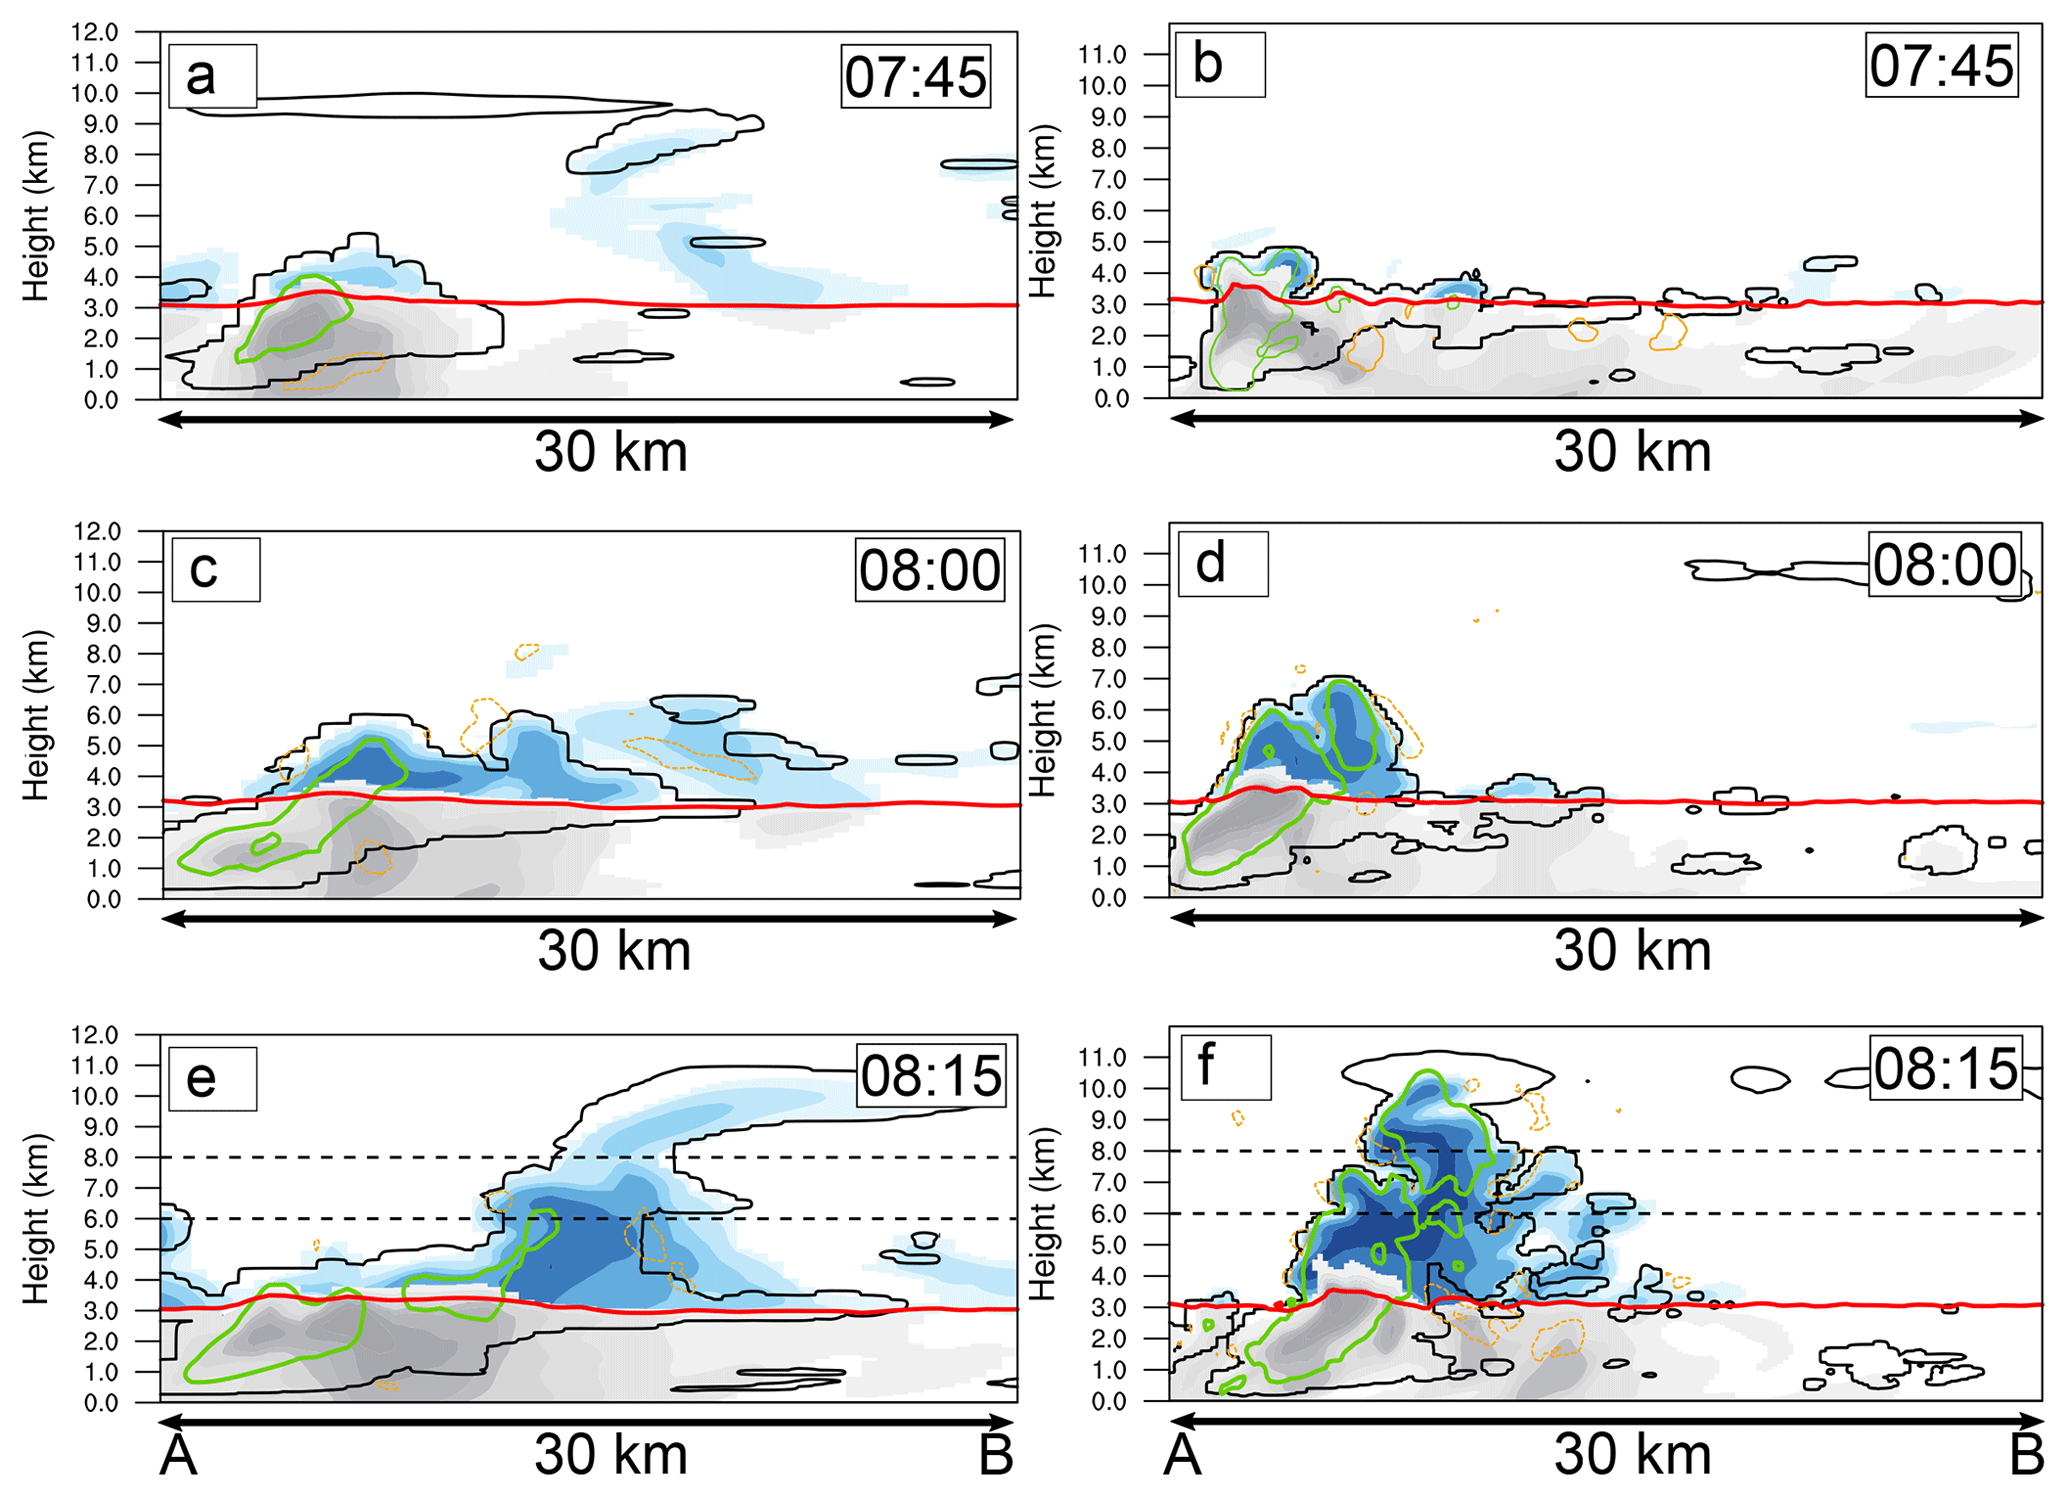
Figure 11Vertical cross section along a convective cell for (a) LR450 and (b) HR150 at 07:45, 08:00 and 08:15 UTC. Rainwater contents (g kg−1) are represented in grey, whereas mixed precipitating hydrometeor (graupel and snow aggregate) contents (g kg−1) are highlighted in blue. The black solid line delineates the cloud boundaries (threshold of cloud and ice water contents >0.001 g kg−1). Updraughts (green lines) and downdraughts (orange dashed lines) are represented with a threshold of about 5 m s−1 and −2 m s−1, respectively. The red solid line stands for the freezing level.
Dynamics of the convective system and the hydrometeor contents, leading to the LLCP and more surface precipitation, thus appear much greater in the simulation with a horizontal resolution of 450 m compared to the LES. However, when horizontal winds and water vapour contents are examined, the low-level environment for both simulations appears quite similar, even with a slightly weaker low-level flow for LR450 (not shown). Therefore, one can argue that, for this specific IOP16a case study, the largest surface precipitation obtained for the simulation with a horizontal resolution of 450 m could be partly explained by the manner in which dynamics and microphysics are represented within the convective system and its interactions with the nearby surrounding air.
In Sect. 4, both simulations were compared by upscaling the LES at the same resolution as LR450. It has been shown that the increase in horizontal resolution does not modify the environment of the precipitating system significantly. The triggering mechanisms, such as the low-level convergence, are not modified significantly, except for the LLCP, which is strengthened by the possible enhancement of rainfall evaporation at low levels in the convective system.
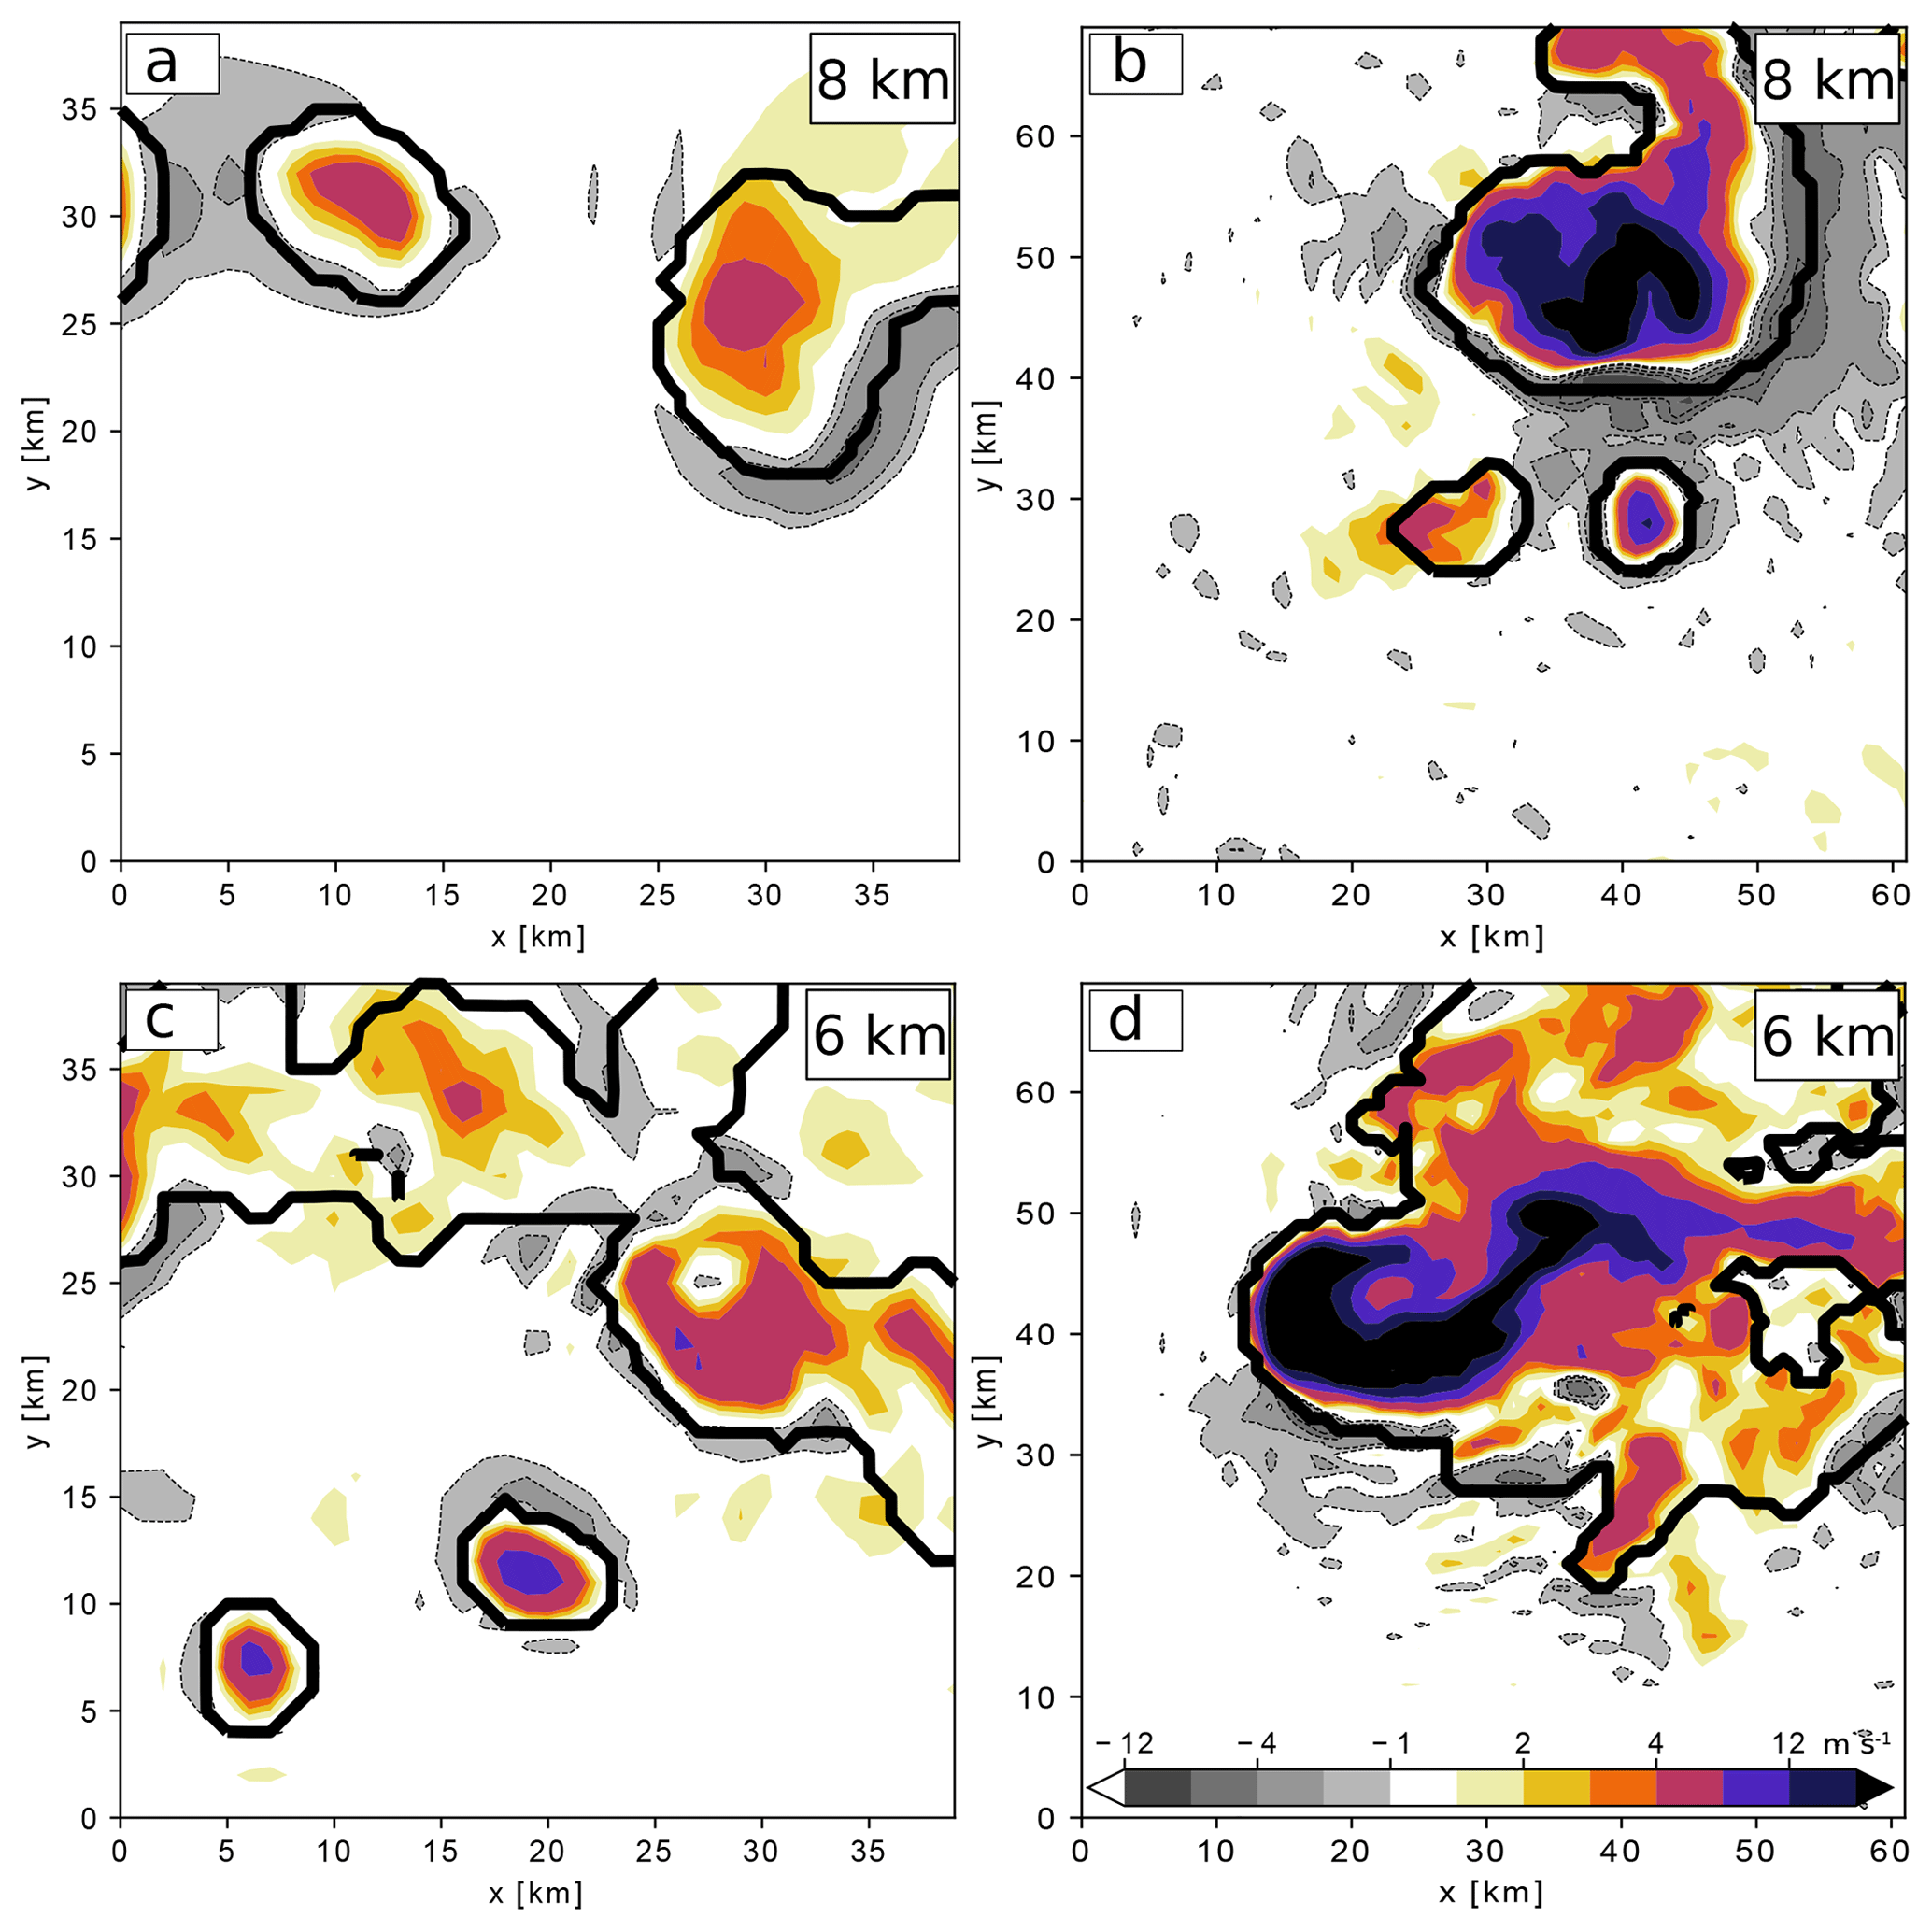
Figure 12Horizontal cross section of vertical velocities at 6 km and 8 km height throughout the convective cells displayed in Fig. 11 for (a, c) LR450 and (b, d) HR150, respectively. The black solid line delineates the cloud boundaries (threshold of cloud and ice water contents >0.001 g kg−1).
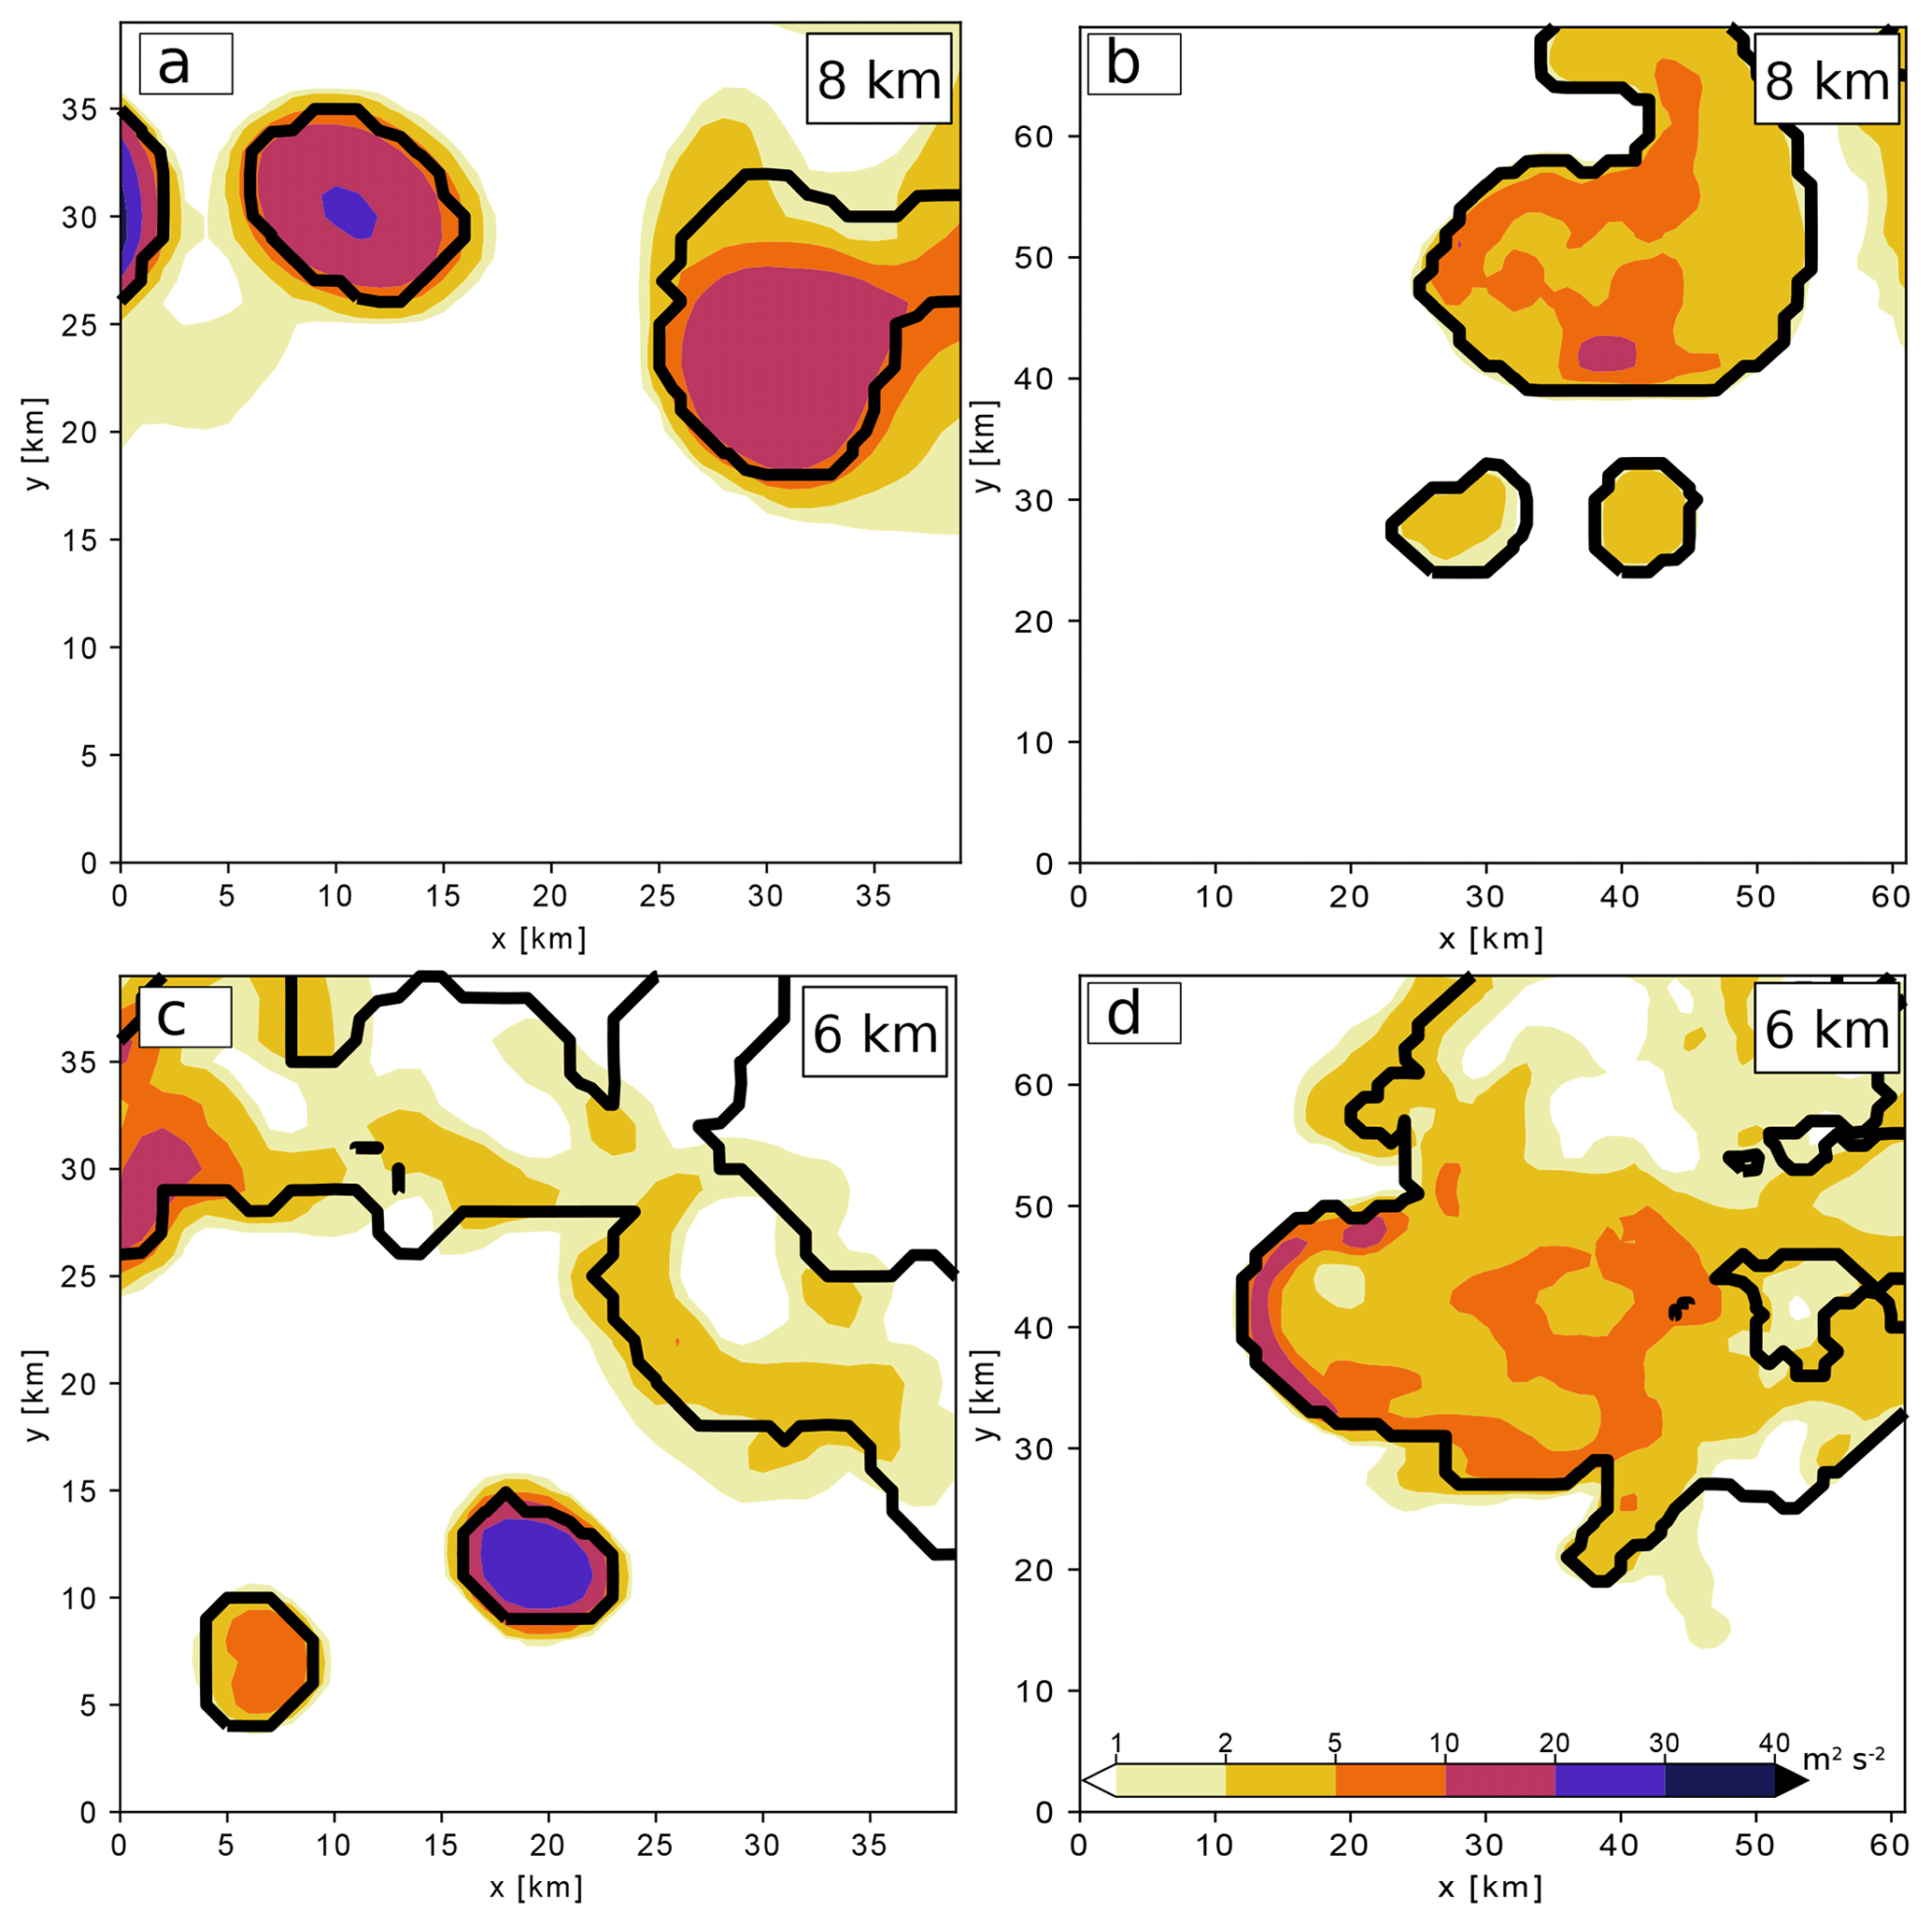
Figure 13Same as Fig. 12 but for the subgrid turbulent kinetic energy (TKE).
In the LES, the precipitating structures are simulated and represented at a finer scale. It offers the possibility of analysing the dynamics more precisely and the convective organization down to the cell scale. Therefore, in the rest of the paper, the LES simulation will be presented at the native horizontal resolution (HR150). Figure 10 highlights the spatial distribution of the rain and cloud mixing ratios at 1500 m height for both LR450 and HR150, which are compared to the Duffourg et al. (2016) simulation at 2.5 km horizontal resolution. If the kilometric simulation develops a convective structure within the low-level convergence, it is unable to organize small convective cells, as depicted at hectometric resolution (Fig. 10a compared to b and c). This simulated organization with trains of very small convective cells are also depicted and confirmed by radar observations (Fig. 10d).
Within the southernmost part of the precipitating system, one can see intense convective cell trains, oriented southwest to northeast and triggered and organized along the low-level convergence. Figure 11 shows a vertical cross section along a convective cell between 07:45 and 08:15 UTC (A–B axis in Fig. 10), in both LR450 and HR150, of the simulated precipitating hydrometeor contents (rain, graupel, and snow aggregate contents) and the non-precipitating (cloud and ice) water contents. Vertical motions (updraughts and downdraughts) are also represented. At the beginning of the developing stage at 07:45 UTC, for LR450 the non-precipitating hydrometeors depict a rather shallow cloud with a base below 500 m a.s.l. (above sea level). There are some mixed hydrometeor contents appearing at 08:00 UTC, but they are limited to 5–6 km height (Fig. 11c). Very quickly – 15 min later – at 08:15 UTC, strong upward motions are simulated within the cell, associated with large graupel contents of up to 9 km height (Fig. 11e). When reaching the top of the troposphere, a cloudy anvil forms and fans out downstream of the upper-level southwesterly flow.
However, the cloud appearance is quite different and especially more realistic for HR150. Indeed, the structure is still organized with pronounced hydrometeor amounts advected upwards within convective updraughts but, in this case, there are stronger gradients of vertical velocity located all along the edge of the convective cell, i.e. downward motions in the environment neighbouring and abutting strong updraughts at the cloud edge. Moreover in HR150, the cloud takes a clearly discernible cumuliform appearance throughout the entire period of the developing stage, which might be an indication of a better representation of cloud-edge entrainment and therefore a better representation, at this scale, of horizontal turbulent mixing between the cloud and its environment (Fig. 11b, d, and f).
In order to illustrate that point, Figs. 12, 13, and 14 show horizontal cross sections of vertical velocities, subgrid turbulent kinetic energy (TKE) at 6 and 8 km height, and both dynamical (DP) and thermal (TP) contributions in the TKE production at 6 km height, throughout the convective cells displayed in Fig. 11. As one can see in Figs. 12a and c and 13a and c, at 450 m horizontal resolution, the updraught cores are partly resolved, as vertical velocities do not exceed 12 m s−1, and are also partly unresolved, with TKE sometimes higher than 30 m2 s−2. This TKE is produced by both dynamical and thermal processes and is mainly localized within the updraught cores. The eddies near the cloud edges, which are subgrid at 450 m horizontal resolution, are not represented by the turbulence scheme. These results are in a good agreement with those obtained by Verrelle et al. (2017) and Strauss et al. (2019), who have shown that a commonly used eddy-diffusivity turbulence scheme underestimates the TKE at kilometric and hectometric (500 m) horizontal resolution, especially at the cloud edges but also in the updraught cores where the thermal production is misrepresented as the scheme does not enable the countergradient structures present in the updraught to be reproduced.
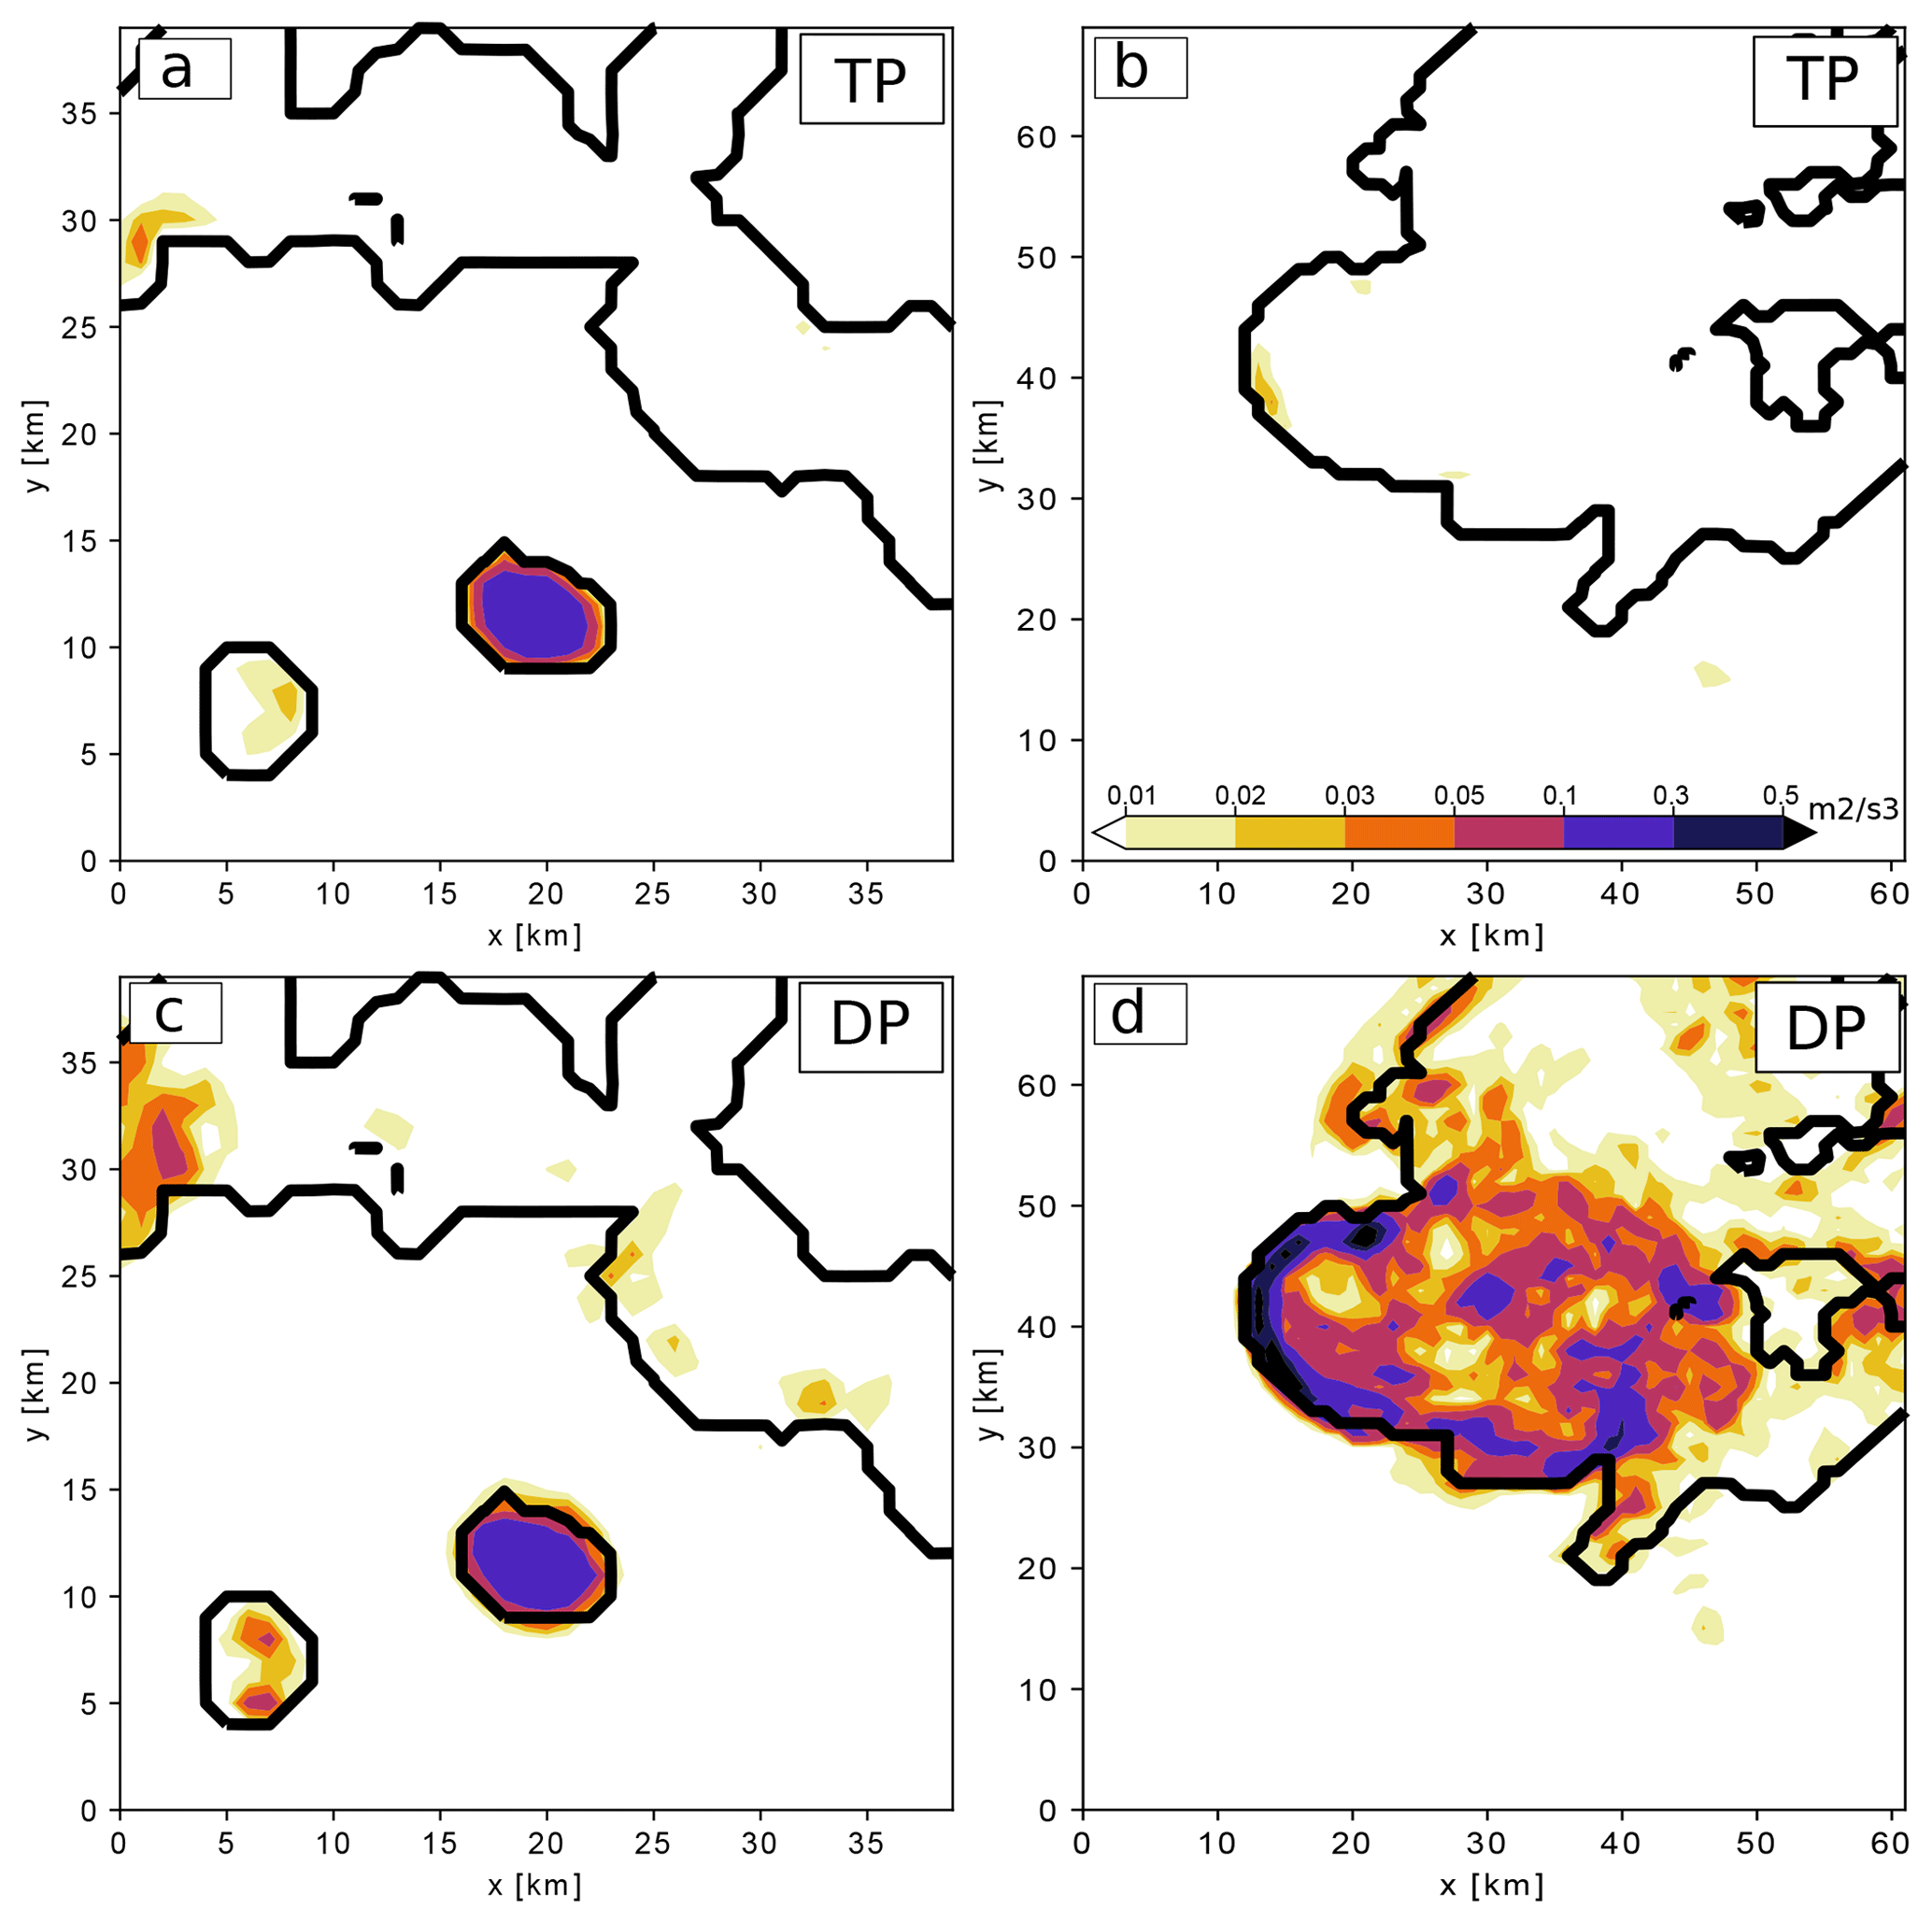
Figure 14Horizontal cross section of thermal production (TP) and dynamical production (DP) at 6 km height throughout the convective cells displayed in Fig. 11 for: (a, c) LR450, and (b, d) HR150.
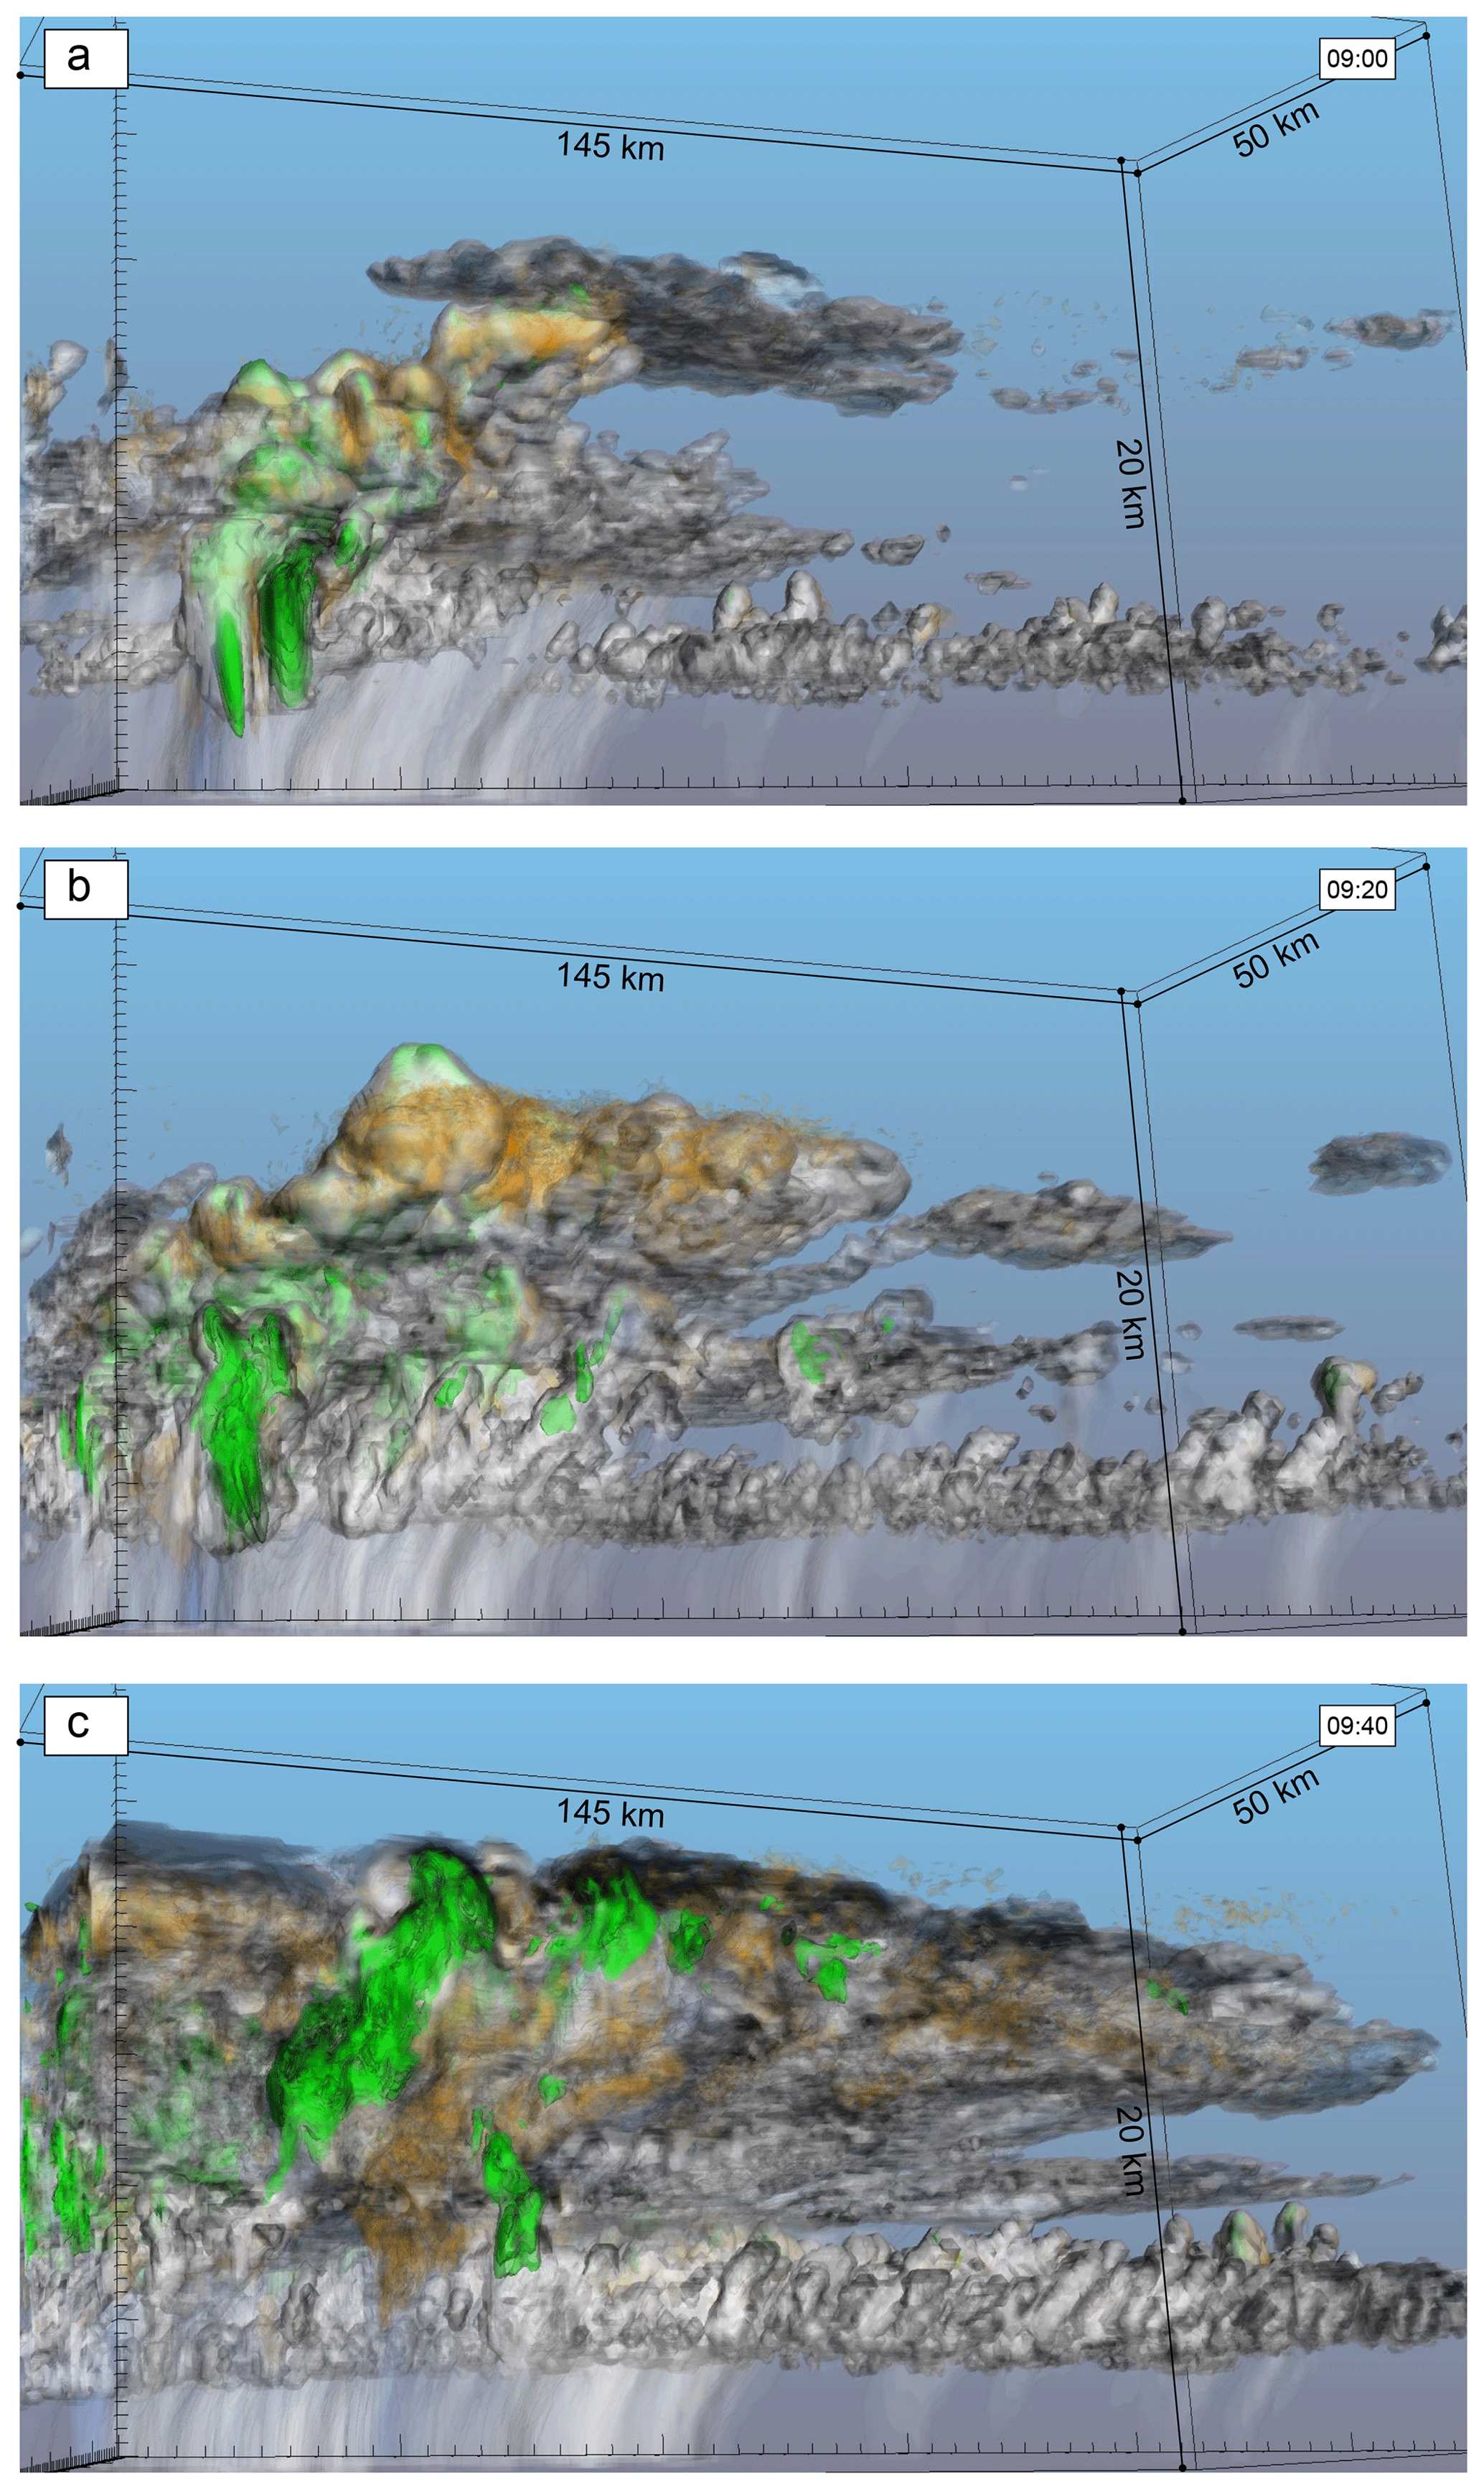
Figure 15Three-dimensional rendering of the simulated convective cell from HR150 between 09:00 and 10:00 UTC, in terms of rainwater, cloud water, graupel, snow aggregate, and ice water contents. Panels also show updraughts exceeding 5 m s−1 (green colour) and downdraughts stronger than 2 m s−1 (orange colour).
At 150 m horizontal resolution, these eddies, as well as the updraught cores, are becoming better resolved as ascents exceed 12 m s−1 over large areas. Furthermore, the strongest updraughts are neighboured by strong downdraughts (exceeding 10 m s−1) just outside the cloud edge that might be associated with a subsiding shell (Fig. 12b and d). At 150 m the unresolved flow is mainly located at cloud edges and a significant part of the TKE contribution comes from the 3D dynamical production linked to the entrainment process. As a matter of fact, a clear signature is simulated along the cloud edge in HR150 (Fig. 14d). As a consequence, it is possible to argue that the entrainment process, especially along the cloud edge, is strongly underestimated at 450 m horizontal resolution, which might lead to less entrainment of drier environmental air in the clouds, and thus LR450 simulates too rapid a development of the convective system and greater surface rainfall compared to HR150.
This issue of the representation of entrainment between clouds and their environment at LES scale has been also assessed by other previous studies (Bryan et al., 2003; Heus et al., 2009; Khairoutdinov et al., 2009; Glenn and Krueger, 2014, among others). For example, Heath et al. (2017) also compared LES with horizontal resolutions of 150 and 450 m for a continental deep-convection case. They found that, even if moving from a kilometric grid spacing to LES does improve the representation of their case study, their LES-150 m does not adequately represent the associated small-scale forcing mechanisms. Moreover, in that case, higher resolutions worsen results due to relatively more environmental entrainment, and moisture updraughts thus appear too diluted. On the other hand some previous studies also confirm the point that LESs are primarily impacted by the mesoscale meteorological forcing through the lateral boundary conditions. As a result, even an LES with a horizontal resolution of 50 m does not significantly improve the quantitative precipitation forecast (Talbot et al., 2012). These previous studies confirm that increased horizontal resolution for LES grid spacing is necessary to better represent the small-scale processes governing deep-convection organization, even if there is still further progress to be made in current parameterizations at this scale.
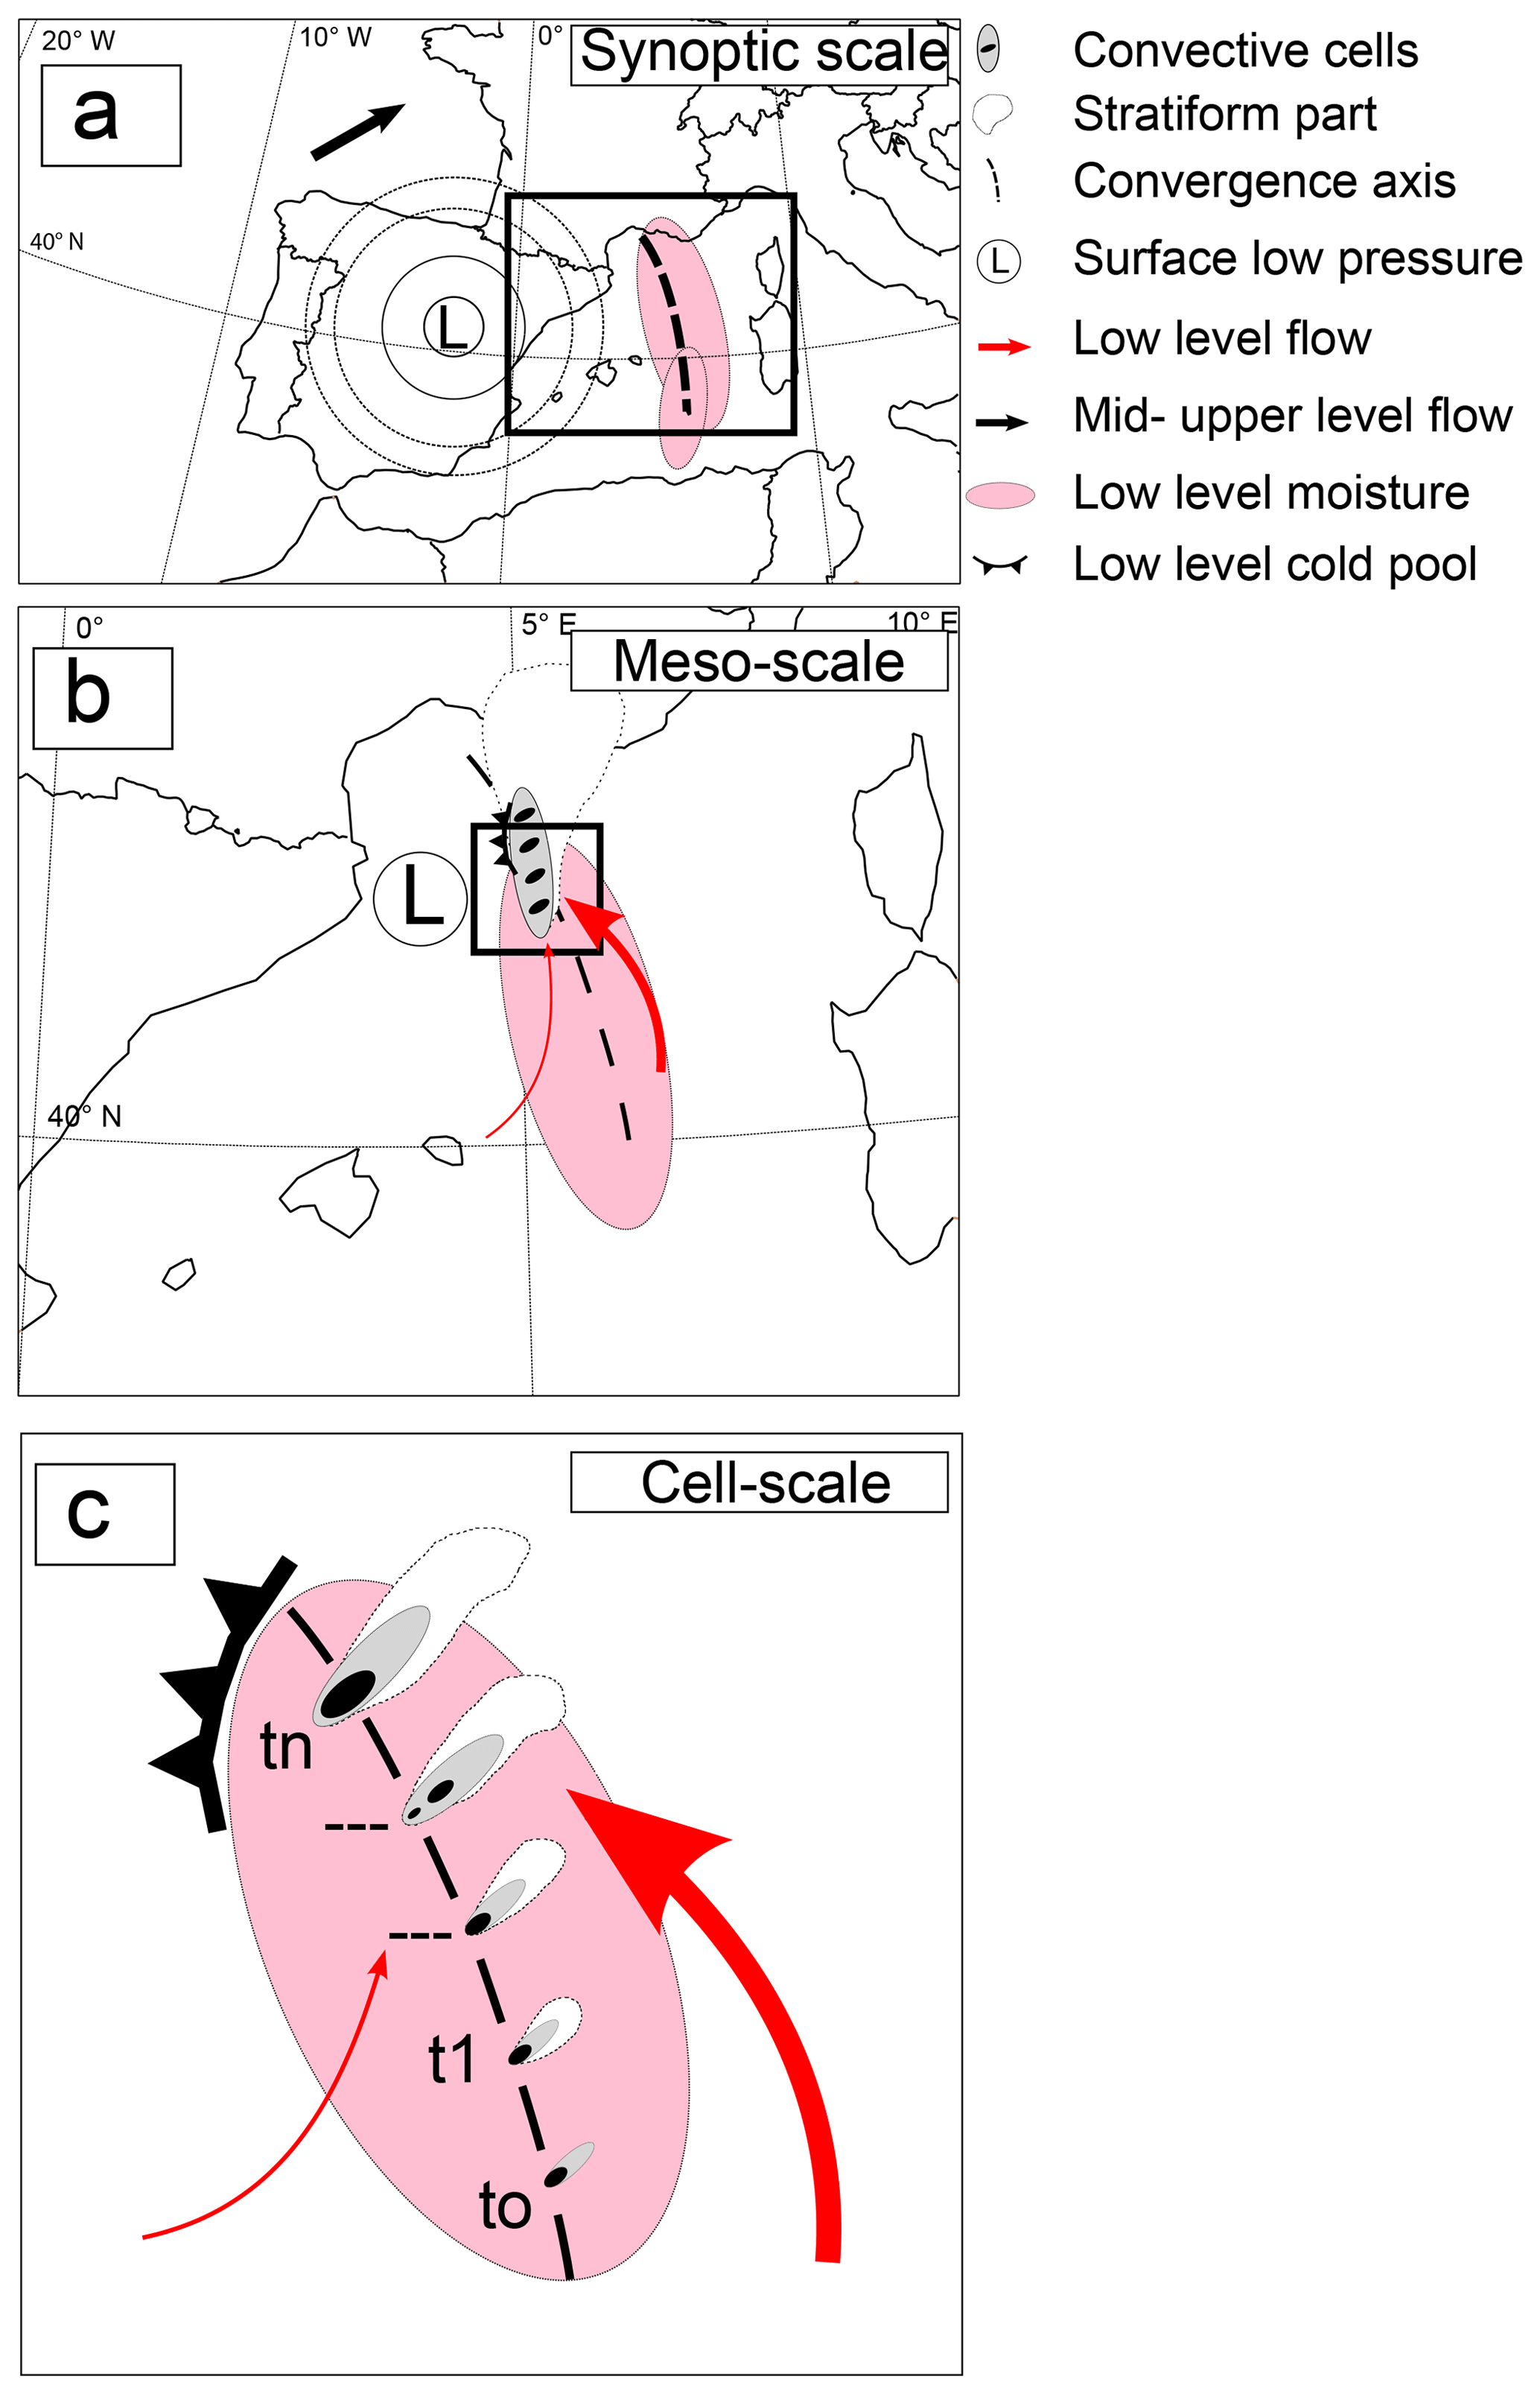
Figure 16Schematic drawings of the precipitation structures of the convective systems and triggering ingredients observed during HyMeX IOP16a on 26 October 2012, at the (a) synoptic scale, (b) mesoscale, and (c) cell scale, respectively.
Furthermore, the LES simulation also better represents the spatial and temporal convective organization at the cell scale within the precipitating system. Figure 15 illustrates a 3D rendering of the convective cell simulated by HR150 between 09:00 and 09:40 UTC. At 09:00 UTC one can see a well-developed cumulus cloud, forming a well-simulated arcus cloud just in front of very intense rainfall underneath the storms (Fig. 15a). It is possible to track the cell across the following 10 min. It continues to expand spatially and vertically in the following 10 min while developing a stratiform part and stronger subsidence downstream (Fig. 15b). Finally around 09:40 UTC, the convective cell reaches its mature stage (Fig. 15c) before loosing its identity, and it is no longer discernible as it merges gradually with the rest of the precipitating system (not shown).
An animation of this 3D rendering performed with very high temporal resolution (every 1 min) is very useful to better understand the 3D circulation within the precipitating system. The animation is available at https://doi.org/10.6096/mistrals-hymex.1540 (Nuissier, 2019). The southwest to southeasterly low-level flow initiates convective cells just at the inner edge of the resulting strong convergence that, hereafter, propagate northwards while developing in the southwesterly upper-level flow.
This study examines the impact of increasing horizontal resolution for LES in a numerical simulation of a real case study of Mediterranean HPE. For that purpose and for the first time, a large domain encompassing the convective systems and the low-level flow feeding convection over the Mediterranean sea, is considered. The goal here was to assess precisely how the physical mechanisms and convective organization are represented from a sub-kilometric scale down to LES horizontal resolution. The paper focuses on an offshore convection case study, which took place on 26 October 2012 during the HyMeX SOP1. Figure 16 summarizes the precipitation structures of the convective systems as well as the triggering mechanisms analysed during this HyMeX case study.
The convective systems observed during IOP16a were fed all along their evolution over the sea by moist and conditionally unstable air masses. A southwest to southeasterly converging low-level flow is the main triggering mechanism acting to continually initiate and maintain the renewal of convective cells, contributing to a back-building-shaped system (Fig. 16b). The low-level convergence was enhanced strongly by a surface low pressure located between Spain and the Balearic Islands (Fig. 16a).
First, an LES carried out at 150 m horizontal resolution is compared, at the same scale, to another simulation performed with a 450 m grid spacing. On one hand, the increase in horizontal resolution from 450 until 150 m is not able, for this case study, to improve significantly deficiencies of the simulation. Indeed, the simulated converging low-level flow is quite similar in both simulations and only a single convective system is represented by both simulations instead of two compared to observations.
Although the present study does not present any sensitivity experiments to assess their precise role, initial and lateral boundary conditions might impact the simulations. The predictability of this heavy-precipitation event, associated with offshore deep convection over the sea, is relatively low compared with more classical events anchored over the mountain range foothills. The direct orographic forcing appeared less crucial while the convective systems were moving over the sea, but the neighbouring mountains were able to deflect the environmental mesoscale flow. Moreover, the model physics could also have a strong impact on the simulations. As a matter of fact, for this case study Martinet et al. (2017) showed that the formulation of the mixing length impacts the simulated surface precipitation through, in some cases, greater low-level moisture advection and hydrometeor contents within the convective system. Moreover, Thévenot et al. (2016) and Rainaud et al. (2017) even showed that taking into account the wave effect or sea surface conditions in different parameterizations of the sea state is able to locally modify the spatial distribution of the precipitation, although the overall rainfall pattern is globally well reproduced.
All these aspects are important, but it must be emphasized that, during the IOP16a case, the location and the evolution of deep convection over the sea (in particular the split into two distinct systems CS1 and CS2) are closely controlled by the upstream conditions (i.e. low-level moisture convergence generated by a surface low pressure located between Spain and the Balearic Islands) and how they propagate inside of the LES domains. This split of deep convection over the sea is a real challenge for this case study. Another numerical experiment could consider a larger LES domain encompassing these upstream conditions. Although this LES over a very large domain would suffer from expansive computing time, it would be able to address whether a higher-resolution simulation of these features is crucial. Furthermore, there were numerous dedicated observations, in particular over the Mediterranean sea, during HyMeX SOP1 that captured fairly well the wind and moisture spatial and vertical features of the upstream flow heading towards the French Mediterranean coastal regions (Duffourg et al., 2016). A posteriori assimilation of these field research observations could improve the quality of kilometric-scale analyses arising from AROME-WMED for example. As a matter of fact, a reanalysis, including HyMeX observations, was carried out recently with AROME-WMED (Fourrié et al., 2019). New initial and lateral boundary conditions provided by this reanalysis may help improve the representation of the mesoscale flow over the sea for this case study.
On the other hand, the increase in horizontal resolution modifies the representation of some of triggering and organizing mechanisms controlling the precipitating system. More intense low-level cold pools are simulated with a horizontal resolution of 450 m, probably related to the evaporation of greater falling precipitation at least at the beginning of the simulation. As a matter of fact, at 150 m the unresolved flow is mainly located at cloud edges and a significant part of the turbulent kinetic energy contribution comes from the 3D dynamical production linked to the entrainment process. As a consequence, it is possible to argue that the entrainment process, especially along the cloud edge, is strongly underestimated at 450 m horizontal resolution, which might lead to less entrainment of dryer environmental air in the clouds that could explain why LR450 simulates too rapid a development of the convective system, greater surface rainfall, and stronger low-level cold pools compared to HR150.
Obviously, the results presented here need to be confirmed considering more convective case studies and using more statistical approaches. However, this first LES of a real Mediterranean precipitating case study highlighted an organization in fast-propagating and developing cell trains within the converging low-level flow (Fig. 16), features that are definitively out of range of the kilometric resolution. In a general way, the goal of ongoing and future work is to better represent the key processes in the models at hectometric scales, such as turbulence and microphysics, that are crucial to progress in heavy-precipitation forecasts.
Since version 5.1 was released in 2014, Meso-NH has been freely available under the CeCILL-C license agreement. CeCILL is a free software license, explicitly compatible with GNU GPL. The CeCILL-C license agreement grants users the right to modify and re-use the covered software. The dataset on which this paper is based (LES raw data) is too large to be publicly archived with available resources. However a time-lapse video of this LES is available at https://doi.org/10.6096/mistrals-hymex.1540 (Nuissier, 2019).
For the first time large eddy simulations (LESs) of Mediterranean convective systems, initialized with real observed conditions (AROME-WMED), over a large domain encompassing the northwestern Mediterranean (900 million grid points) were carried out for IOP16a and IOP13. The time-lapse video for IOP16a highlights the realistic growing stage of the convective cells, from shallow cumuliform stage until regenerating deep-cell trains within a low-level convergence line. The video supplement is available at https://doi.org/10.6096/mistrals-hymex.1540 (Nuissier, 2019).
MM, FD, and ON performed the numerical experiments and analysed the data and the results. All authors contributed to the interpretation of the results. ON took the lead in writing the paper. VD and CL provided critical feedback and helped shape the analysis and paper. Finally, all authors discussed the results and contributed to the final paper.
The authors declare that they have no conflict of interest.
This article is part of the special issue “Hydrological cycle in the Mediterranean (ACP/AMT/GMD/HESS/NHESS/OS inter-journal SI)”. It is not associated with a conference.
This work represents a contribution to the HyMeX programme supported by MISTRALS and the ANR MUSIC grant ANR-14-CE01-0014. The authors are grateful to all the scientists involved in the HYMEX SOP1 field campaign. Thanks are also due to Clément Strauss for his skill in model field visualization. Finally, we would like to thank Timothy J. Dunkerton, as well as the two reviewers, for their precise and constructive remarks, which significantly helped improve the paper.
This research has been supported by the Agence Nationale de la Recherche (grant no. ANR-14-CE01-0014).
This paper was edited by Timothy J. Dunkerton and reviewed by two anonymous referees.
Barthlott, C. and Davolio, S.: Mechanisms initiating heavy precipitation over Italy during HyMeX Special Observation Period 1: a numerical case study using two mesoscale models, Q. J. Roy. Meteor. Soc., 142, 238–258, https://doi.org/10.1002/qj.2630, 2016. a
Barthlott, C., Adler, B., Kalthoff, N., Handwerker, J., Kohler, M., and Wieser, A.: The role of Corsica in initiating nocturnal offshore convection, Q. J. Roy. Meteor. Soc., 142, 222–237, https://doi.org/10.1002/qj.2415, 2016. a
Bougeault, P. and Lacarrère, P.: Parameterization of orography-induced turbulence in a meso-beta-scale model, Mon. Weather Rev., 123, 1560–1573, 1989. a
Bryan, G. H., Wyngaard, J. C., and Fritsch, J. M.: Resolution Requirements for the Simulation of Deep Moist Convection, Mon. Weather Rev., 131, 2394–2416, https://doi.org/10.1175/1520-0493(2003)131<2394:RRFTSO>2.0.CO;2, 2003. a, b
Buzzi, A., Davolio, S., Malguzzi, P., Drofa, O., and Mastrangelo, D.: Heavy rainfall episodes over Liguria in autumn 2011: numerical forecasting experiments, Nat. Hazards Earth Syst. Sci., 14, 1325–1340, https://doi.org/10.5194/nhess-14-1325-2014, 2014. a, b
Caniaux, G., Redelsperger, J.-L., and Lafore, J.-P.: A numerical study of the stratiform region of a fast-moving squall line. 1. general description and water and heat budgets., J. Atmos. Sci., 51, 2046–2074, 1994. a
Colella, P. and Woodward, P. R.: The Piecewise Parabolic Method (PPM) for gas-dynamical simulations, Journal of Computational Physics, 54, 174–201, https://doi.org/10.1016/0021-9991(84)90143-8, 1984. a
Cuxart, J., Bougeault, P., and Redelsperger, J.-L.: A turbulence scheme allowing for mesoscale and large-eddy simulations., Q. J. Roy. Meteor. Soc., 126, 1–30, 2000. a
Dauhut, T., Chaboureau, J.-P., Escobar, J., and Mascart, P.: Large-eddy simulations of Hector the convector making the stratosphere wetter, Atmospheric Science Letters, 16, 135–140, https://doi.org/10.1002/asl2.534, 2015. a
Dauhut, T., Chaboureau, J.-P., Escobar, J., and Mascart, P.: Giga-LES of Hector the Convector and Its Two Tallest Updrafts up to the Stratosphere, J. Atmos. Sci., 73, 5041–5060, https://doi.org/10.1175/JAS-D-16-0083.1, 2016. a
Davolio, S., Volonté, A., Manzato, A., Pucillo, A., Cicogna, A., and Ferrario, M. E.: Mechanisms producing different precipitation patterns over north-eastern Italy: insights from HyMeX-SOP1 and previous events, Q. J. Roy. Meteor. Soc., 142, 188–205, https://doi.org/10.1002/qj.2731, 2016. a
Deardorff, J. W.: Numerical Investigation of Neutral and Unstable Planetary Boundary Layers, J. Atmos. Sci., 29, 91–115, https://doi.org/10.1175/1520-0469(1972)029<0091:NIONAU>2.0.CO;2, 1972. a
Ducrocq, V., Nuissier, O., Ricard, D., Lebeaupin, C., and Thouvenin, T.: A numerical study of three catastrophic precipitatating events over southern France. II: Mesoscale triggering and stationarity factors, Q. J. Roy. Meteor. Soc., 134, 131–145, 2008. a
Ducrocq, V., Braud, I., Davolio, S., Ferretti, R., Flamant, C., Jansa, A., Kalthoff, N., Richard, E., Taupier-Letage, I., Ayral, P.-A., Belamari, S., Berne, A., Borga, M., Boudevillain, B., Bock, O., Boichard, J.-L., Bouin, M.-N., Bousquet, O., Bouvier, C., Chiggiato, J., Cimini, D., Corsmeier, U., Coppola, L., Cocquerez, P., Defer, E., Delanoë, J., Di Girolamo, P., Doerenbecher, A., Drobinski, P., Dufournet, Y., Fourrié, N., Gourley, J., Labatut, L., Lambert, D., Le Coz, J., Marzano, F., Molinié, G., Montani, A., Nord, G., Nuret, M., Ramage, K., Rison, W., Roussot, O., Said, F., Schwarzenboeck, A., Testor, P., Van Baelen, J., Vincendon, B., Aran, M., and Tamayo, J.: HyMeX-SOP1: The Field Campaign Dedicated to Heavy Precipitation and Flash Flooding in the Northwestern Mediterranean, B. Am. Meteorol. Soc., 95, 1083–1100, 2014. a
Ducrocq, V., Davolio, S., Ferretti, R., Flamant, C., Santaner, V. H., Kalthoff, N., Richard, E., and Wernli, H.: Introduction to the HyMeX Special Issue on ‘Advances in understanding and forecasting of heavy precipitation in the Mediterranean through the HyMeX SOP1 field campaign’, Q. J. Roy. Meteor. Soc., 142, 1–6, https://doi.org/10.1002/qj.2856, 2016. a
Duffourg, F., Nuissier, O., Ducrocq, V., Olivier Bock, O., Chazette, P., Delanoë, J., Doerenbecher, A., Flamant, C., Fourrié, N., di Girolamo, P., Lac, C., Martinet, M., and Said, F.: Offshore deep convection initiation and maintenmain during HyMeX IOP 16a heavy precipitation event, Q. J. Roy. Meteorol. Soc., 142, 259–274, https://doi.org/10.1002/qj.2725, 2016. a, b, c, d, e, f, g, h, i, j, k
Duffourg, F., Lee, K.-O., Ducrocq, V., Flamant, C., Chazette, P., and Di Girolamo, P.: Role of moisture patterns in the backbuilding formation of HyMeX IOP13 heavy precipitation systems, Q. J. Roy. Meteor. Soc., 144, 291–303, https://doi.org/10.1002/qj.3201, 2018. a, b
Fiori, E., Ferraris, L., Molini, L., Siccardi, F., Kranzlmueller, D., and Parodi, A.: Triggering and evolution of a deep convective system in the Mediterranean Sea: modelling and observations at a very fine scale, Q. J. Roy. Meteor. Soc., 143, 927–941, 2017. a, b
Fourrié, N., Bresson, É., Nuret, M., Jany, C., Brousseau, P., Doerenbecher, A., Kreitz, M., Nuissier, O., Sevault, E., Bénichou, H., Amodei, M., and Pouponneau, F.: AROME-WMED, a real-time mesoscale model designed for the HyMeX special observation periods, Geosci. Model Dev., 8, 1919–1941, https://doi.org/10.5194/gmd-8-1919-2015, 2015. a
Fourrié, N., Nuret, M., Brousseau, P., Caumont, O., Doerenbecher, A., Wattrelot, E., Moll, P., Bénichou, H., Puech, D., Bock, O., Bosser, P., Chazette, P., Flamant, C., Di Girolamo, P., Richard, E., and Saïd, F.: The AROME-WMED reanalyses of the first special observation period of the Hydrological cycle in the Mediterranean experiment (HyMeX), Geosci. Model Dev., 12, 2657–2678, https://doi.org/10.5194/gmd-12-2657-2019, 2019. a
Gal-Chen, T. and Somerville, R. C. J.: On the use of a coordinate transformation for the solution of the Navier-Stokes equations, J. Comput. Phys., 17, 209–228, https://doi.org/10.1016/0021-9991(75)90037-6, 1975. a
Glenn, I. B. and Krueger, S. K.: Downdrafts in the near cloud environment of deep convective updrafts, Journal of Advances in Modeling Earth Systems, 6, 1–8, https://doi.org/10.1002/2013MS000261, 2014. a
Hanley, K. E., Plant, R. S., Stein, T. H. M., Hogan, R. J., Nicol, J. C., Lean, H. W., Halliwell, C., and Clark, P. A.: Mixing-length controls on high-resolution simulations of convective storms, Q. J. Roy. Meteor. Soc., 141, 272–284, https://doi.org/10.1002/qj.2356, 2015. a, b
Heath, N. K., Fuelberg, H. E., Tanelli, S., Turk, F. J., Lawson, R. P., Woods, S., and Freeman, S.: WRF nested large-eddy simulations of deep convection during SEAC4RS, J. Geophys. Res.-Atmos., 122, 3953–3974, https://doi.org/10.1002/2016JD025465, 2017. a
Heus, T., J. Pols, C. F., J. Jonker, H. J., A. Van den Akker, H. E., and H. Lenschow, D.: Observational validation of the compensating mass flux through the shell around cumulus clouds, Q. J. Roy. Meteor. Soc., 135, 101–112, https://doi.org/10.1002/qj.358, 2009. a
Honnert, R., Masson, V., and Couvreux, F.: A Diagnostic for Evaluating the Representation of Turbulence in Atmospheric Models at the Kilometric Scale, J. Atmos. Sci., 68, 3112–3131, https://doi.org/10.1175/JAS-D-11-061.1, 2011. a
Jansa, A., Genoves, A., Angeles Picornell, M., Campins, J., Riosalido, R., and Carretero, O.: Western Mediterranean cyclones and heavy rain. Part 2: Statistical approach, Meteorol. Appl., 8, 43–56, 2001. a
Khairoutdinov, M. F., Krueger, S. K., Moeng, C.-H., Bogenschutz, P. A., and Randall, D. A.: Large-Eddy Simulation of Maritime Deep Tropical Convection, J. Adv. Model. Earth Sy., 1, 15, https://doi.org/10.3894/JAMES.2009.1.15, 2009. a
Lac, C., Chaboureau, J.-P., Masson, V., Pinty, J.-P., Tulet, P., Escobar, J., Leriche, M., Barthe, C., Aouizerats, B., Augros, C., Aumond, P., Auguste, F., Bechtold, P., Berthet, S., Bielli, S., Bosseur, F., Caumont, O., Cohard, J.-M., Colin, J., Couvreux, F., Cuxart, J., Delautier, G., Dauhut, T., Ducrocq, V., Filippi, J.-B., Gazen, D., Geoffroy, O., Gheusi, F., Honnert, R., Lafore, J.-P., Lebeaupin Brossier, C., Libois, Q., Lunet, T., Mari, C., Maric, T., Mascart, P., Mogé, M., Molinié, G., Nuissier, O., Pantillon, F., Peyrillé, P., Pergaud, J., Perraud, E., Pianezze, J., Redelsperger, J.-L., Ricard, D., Richard, E., Riette, S., Rodier, Q., Schoetter, R., Seyfried, L., Stein, J., Suhre, K., Taufour, M., Thouron, O., Turner, S., Verrelle, A., Vié, B., Visentin, F., Vionnet, V., and Wautelet, P.: Overview of the Meso-NH model version 5.4 and its applications, Geosci. Model Dev., 11, 1929–1969, https://doi.org/10.5194/gmd-11-1929-2018, 2018. a
Lunet, T., Lac, C., Auguste, F., Visentin, F., Masson, V., and Escobar, J.: Combination of WENO and Explicit Runge–Kutta Methods for Wind Transport in the Meso-NH Model, Mon. Weather Rev., 145, 3817–3838, https://doi.org/10.1175/MWR-D-16-0343.1, 2017. a
Machado, L. A. T. and Chaboureau, J.-P.: Effect of Turbulence Parameterization on Assessment of Cloud Organization, Mon. Weather Rev., 143, 3246–3262, 2015. a
Martinet, M., Nuissier, O., Duffourg, F., Ducrocq, V., and Ricard, D.: Fine-scale numerical analysis of the sensitivity of the HyMeX IOP16a heavy precipitating event to the turbulent mixing-length parametrization, Q. J. Roy. Meteor. Soc., 143, 3122–3135, https://doi.org/10.1002/qj.3167, 2017. a, b, c, d, e, f, g, h, i, j
Masson, V., Le Moigne, P., Martin, E., Faroux, S., Alias, A., Alkama, R., Belamari, S., Barbu, A., Boone, A., Bouyssel, F., Brousseau, P., Brun, E., Calvet, J.-C., Carrer, D., Decharme, B., Delire, C., Donier, S., Essaouini, K., Gibelin, A.-L., Giordani, H., Habets, F., Jidane, M., Kerdraon, G., Kourzeneva, E., Lafaysse, M., Lafont, S., Lebeaupin Brossier, C., Lemonsu, A., Mahfouf, J.-F., Marguinaud, P., Mokhtari, M., Morin, S., Pigeon, G., Salgado, R., Seity, Y., Taillefer, F., Tanguy, G., Tulet, P., Vincendon, B., Vionnet, V., and Voldoire, A.: The SURFEXv7.2 land and ocean surface platform for coupled or offline simulation of earth surface variables and fluxes, Geosci. Model Dev., 6, 929–960, https://doi.org/10.5194/gmd-6-929-2013, 2013. a
Mlawer, E., Taubman, S., Brown, P., Iacono, M., and Clough, S.: Radiative transfer for inhomogeneous atmospheres: RRTM, A validated correlated-k model for the longwave, J. Geophys. Res., 102, 16663–16682, https://doi.org/10.1029/97JD00237, 1997. a
Nuissier, O.: Time-lapse video of the Intense Observation Period (IOP) 16a case study, SEDOO OMP, HyMeX database, https://doi.org/10.6096/mistrals-hymex.1540, 2019. a, b, c
Nuissier, O., Ducrocq, V., Ricard, D., Lebeaupin, C., and Anquetin, S.: A numerical study of three catastrophic precipitating events over southern France. I: Numerical framework and synoptic ingredients, Q. J. Roy. Meteor. Soc., 134, 111–130, 2008. a
Pergaud, J., Masson, V., and Malardel, S.: A parameterization of dry thermals and shallow cumuli for mesoscale numerical weather prediction., Bound.-Layer Meteor., 132, 83–106, 2009. a
Petch, J. C.: Sensitivity studies of developing convection in a cloud-resolving model, Q. J. Roy. Meteor. Soc., 132, 345–358, https://doi.org/10.1256/qj.05.71, 2006. a
Pinty, J.-P. and Jabouille, P.: A mixed-phase cloud parameterization for use in mesoscale non-hydrostatic model: simulations of a squall line and of orographic precipitations, in: Proc. Conf. of Cloud Physics, Everett, WA, USA, 17–21 August 1998, 217–220, 1998. a
Rainaud, R., Brossier, C. L., Ducrocq, V., and Giordani, H.: High-resolution air–sea coupling impact on two heavy precipitation events in the Western Mediterranean, Q. J. Roy. Meteor. Soc., 143, 2448–2462, https://doi.org/10.1002/qj.3098, 2017. a
Scheffknecht, P., Richard, E., and Lambert, D.: A highly localized high-precipitation event over Corsica, Q. J. Roy. Meteor. Soc., 142, 206–221, https://doi.org/10.1002/qj.2795, 2016. a, b
Shu, C.-W. and Osher, S.: Efficient implementation of essentially non-oscillatory shock-capturing schemes, Journal of Computational Physics, 77, 439–471, https://doi.org/10.1016/0021-9991(88)90177-5, 1988. a
Stein, J., Richard, E., Lafore, J.-P., Pinty, J.-P., Asencio, N., and Cosma, S.: High-resolution non-hydrostatic simulations of flash-flood episodes with grid-nesting and ice phase, Meteor. Atmos. Phys., 72, 203–221, 2000. a
Stein, T. H. M., Hogan, R. J., Clark, P. A., Halliwell, C. E., Hanley, K. E., Lean, H. W., Nicol, J. C., and Plant, R. S.: The DYMECS Project: A Statistical Approach for the Evaluation of Convective Storms in High-Resolution NWP Models, B. Am. Meteorol. Soc., 96, 939–951, 2015. a
Strauss, C., Ricard, D., Lac, C., and Verrelle, A.: Evaluation of turbulence parametrizations in convective clouds and their environment based on a large-eddy simulation, Q. J. Roy. Meteor. Soc., 145, 3195–3217, https://doi.org/10.1002/qj.3614, 2019. a
Talbot, C., Bou-Zeid, E., and Smith, J.: Nested Mesoscale Large-Eddy Simulations with WRF: Performance in Real Test Cases, Journal of Hydrometeorology, 13, 1421–1441, https://doi.org/10.1175/JHM-D-11-048.1, 2012. a
Thévenot, O., Bouin, M.-N., Ducrocq, V., Lebeaupin Brossier, C., Nuissier, O., Pianezze, J., and Duffourg, F.: Influence of the sea state on Mediterranean heavy precipitation: a case-study from HyMeX SOP1, Q. J. Roy. Meteor. Soc., 142, 377–389, https://doi.org/10.1002/qj.2660, 2016. a
Verrelle, A., Ricard, D., and Lac, C.: Sensitivity of high‐resolution idealized simulations of thunderstorms to horizontal resolution and turbulence parametrization, Q. J. Roy. Meteor. Soc., 141, 433–448, https://doi.org/10.1002/qj.2363, 2015. a, b
Verrelle, A., Ricard, D., and Lac, C.: Evaluation and Improvement of Turbulence Parameterization inside Deep Convective Clouds at Kilometer-Scale Resolution, Mon. Weather Rev., 145, 3947–3967, https://doi.org/10.1175/MWR-D-16-0404.1, 2017. a, b, c
Wyngaard, J. C.: Toward Numerical Modeling in the “Terra Incognita”, J. Atmos. Sci., 61, 1816–1826, https://doi.org/10.1175/1520-0469(2004)061<1816:TNMITT>2.0.CO;2, 2004. a
Zängl, G., Reinert, D., Rípodas, P., and Baldauf, M.: The ICON (ICOsahedral Non-hydrostatic) modelling framework of DWD and MPI-M: Description of the non-hydrostatic dynamical core, Q. J. Roy. Meteor. Soc., 141, 563–579, https://doi.org/10.1002/qj.2378, 2015. a
- Abstract
- Introduction
- The IOP16a case study
- Description on the numerical experiments
- Overview of the numerical simulations
- Very fine-scale convective organization
- Conclusions
- Data availability
- Video supplement
- Author contributions
- Competing interests
- Special issue statement
- Acknowledgements
- Financial support
- Review statement
- References