the Creative Commons Attribution 4.0 License.
the Creative Commons Attribution 4.0 License.
 | 01 Dec 2020
Nationwide increase of polycyclic aromatic hydrocarbons in ultrafine particles during winter over China revealed by size-segregated measurements
Qingqing Yu
Quanfu He
Weiqiang Yang
Ming Zhu
Sheng Li
Runqi Zhang
Ruqin Shen
Yanli Zhang
Xinhui Bi
Yuesi Wang
Ping'an Peng
Polycyclic aromatic hydrocarbons (PAHs) are toxic compounds in the atmosphere and have adverse effects on public health, especially through the inhalation of particulate matter (PM). At present, there is limited understanding of the size distribution of particulate-bound PAHs and their health risks on a continental scale. In this study, we carried out a PM campaign from October 2012 to September 2013 at 12 sampling sites simultaneously, including urban, suburban and remote sites in different regions of China. Size-segregated PAHs and typical tracers of coal combustion (picene), biomass burning (levoglucosan) and vehicle exhaust (hopanes) were measured. The annual averages of the 24 total measured PAHs (∑24PAHs) and benzo[a]pyrene (BaP) carcinogenic equivalent concentration (BaPeq) ranged from 7.56 to 205 ng/m3 with a mean of 53.5 ng/m3 and from 0.21 to 22.2 ng/m3 with a mean of 5.02 ng/m3, respectively. At all the sites, ∑24PAHs and BaPeq were dominant in the ultrafine particles with aerodynamic diameter < 1.1 µm, followed by those in the size ranges of 1.1–3.3 µm and > 3.3 µm. Compared with southern China, northern China witnessed much higher ∑24PAHs (87.36 vs. 17.56 ng/m3), BaPeq (8.48 vs. 1.34 ng/m3) and PAHs' inhalation cancer risk (7.4 × 10⁻⁴ vs. 1.2 × 10⁻⁴). Nationwide increases in both PAH levels and inhalation cancer risk occurred in winter. The unfavorable meteorological conditions and enhanced emissions of coal combustion and biomass burning together led to severe PAHs' pollution and high cancer risk in the atmosphere of northern China, especially during winter. Coal combustion is the major source of BaPeq in all size particles at most sampling sites. Our results suggested that the reduction of coal and biofuel consumption in the residential sector could be crucial and effective in lowering PAH concentrations and their inhalation cancer risk in China.
- Article
(7018 KB) - Full-text XML
-
Supplement
(2541 KB) - BibTeX
- EndNote


Ambient particulate matter (PM) pollution has adverse effects on public health. The global deaths caused by exposure to PM with aerodynamic diameters less than 2.5 µm (PM2.5) kept increasing from 1990 and reached 4.2 million in 2015 (Cohen et al., 2017). In China, ambient PM2.5 pollution was ranked the fourth leading risk of death (Yang et al., 2013) and caused 1.7 million premature deaths in 2015 (Song et al., 2017). Adverse health impacts of PM are associated with particle size and chemical components (Chung et al., 2015; Dong et al., 2018). A higher risk of cardiovascular disease was associated with smaller size-fractionated particulate matter, especially PM1.0-bound particulate matter (Yin et al., 2020).
Polycyclic aromatic hydrocarbons (PAHs) are a group of organic substances composed of two or more aromatic rings. Due to their mutagenic, teratogenic and carcinogenic properties (Kim et al., 2013), PAHs are one of the most toxic components in PM (Xu et al., 2008). Toxic PAHs usually enrich in fine particles, especially those with aerodynamic diameters less than 1.0 µm (Wang et al., 2016; Li et al., 2019), which can enter the human respiratory system through inhalation (Yu et al., 2015). Exposure to PAHs likely induces DNA damage and raises the risk of genetic mutation (Zhang et al., 2012; Lv et al., 2016) and cardiopulmonary mortality (Kuo et al., 2003; John et al., 2009). Previous studies have demonstrated that inhalation exposure to PAHs can cause a high risk of lung cancer (Armstrong et al., 2004; Zhang et al., 2009; Shrivastava et al., 2017).
Atmospheric PAHs are mainly emitted from the incomplete combustion of fossil fuels and biomasses (Mastral and Callen, 2000). As typical semi-volatile chemicals, PAHs can be transported over long distances (Zelenyuk et al., 2012) and have been detected in the global atmosphere (Brown et al., 2013; Garrido et al., 2014; Hong et al., 2016; B. Liu et al., 2017; Hayakawa et al., 2018). An emission inventory indicated that developing countries are the major contributors to global PAHs' emission (Zhang and Tao, 2009; Shen et al., 2013a).
As the largest developing country in the world, China has large amounts of PAHs' emission and high cancer risk caused by exposure to PAHs. The annual emission of 16 US EPA priority PAHs in China sharply increased from 18 Gg in 1980 to 106 Gg in 2007 (Xu et al., 2006; Shen et al., 2013a). China became the largest emitter of PAHs, accounting for about 20 % of the global PAHs' emission during 2007 (Shen et al., 2013a). The excess lung cancer risk caused by inhalation exposure to ambient PAHs was estimated to be 6.5 × 10⁻⁶ in China (Zhang et al., 2009), which was 5.5 times higher than the acceptable risk level of 1.0 × 10⁻⁶ in the United States (US EPA, 1991). As Hong et al. (2016) estimated, the lifetime excess lung cancer cases caused by exposure to PAHs for China ranged from 27.8 to 2200 per million people and were higher than other Asian countries. Moreover, PAHs' emission and cancer risk in China have large spatial and seasonal variations. As reported by Tao and coworkers, high emission of PAHs occurred in the North China Plain (Zhang et al., 2007), and the emission in winter was 1.6 times higher than that in summer (Zhang and Tao, 2008). Thus, the lung cancer risk caused by ambient PAH inhalation exposure in northern China was higher than that in southern China (Zhang et al., 2009). In addition, through long-range atmospheric transport, PAHs emitted in China could spread to other regions of the world (Zhang et al., 2011; Inomata et al., 2012).
For more accurate estimation of inhalation exposure to ambient PAHs and their cancer risk in China, it is essential to carry out nationwide campaigns to acquire spatial and seasonal characteristics of atmospheric PAHs. Data on PAHs in the ambient air have accumulated in China during the past decades. Among these field studies, most were conducted in rapidly developing economic regions, including the North China region (Huang et al., 2006; Liu et al., 2007; Wang et al., 2011; Lin et al., 2015a; Lin et al., 2015b; Tang et al., 2017; Yu et al., 2018), Yangtze River Delta region (Liu et al., 2001; Zhu et al., 2009; Gu et al., 2010; He et al., 2014) and Pearl River Delta region (Bi et al., 2003; Guo et al., 2003; Li et al., 2006; Tan et al., 2006; Duan et al., 2007; Lang et al., 2007; Yang et al., 2010; Gao et al., 2011, 2012, 2013, 2015; Yu et al., 2016), due to large amounts of combustion emission and the high density of population in these regions. These studies provided insight into the fate and health risk of airborne PAHs on a local or regional scale. However, due to inconsistency in sampling methods, frequency and duration in these local and regional campaigns, it is difficult to draw a national picture of PAHs' pollution in the air of China.
There are rare datasets discovering nationwide characteristics of airborne PAHs over China. Liu et al. (2007b) reported PAHs in the air of 37 cities across China using passive polyurethane foam (PUF) disks. Wang et al. (2006) and D. Liu et al. (2017) determined PM2.5-bound PAHs over 14 and 9 Chinese cities, respectively. PAHs in total suspended particles (TSPs) and the gas phase were measured over 11 cities in China (Ma et al., 2018, 2020). In addition to this important information on PAHs in the bulk PM, it is vital to determine the size distribution of PAHs, since the size of particles is directly linked to their potential to cause health problems. On the national scale, at present, there is only one field study available reporting size-segregated atmospheric PAHs at 10 sites (Shen et al., 2019). Therefore, it is essential to carry out large-range campaigns covering multiple types of sites across different regions to investigate the size distribution of PAHs' levels and sources and discover their difference in health risks among typical regions of China (e.g. north vs. south, urban vs. remote). In this study, we simultaneously collected filter-based size-fractionated PM samples consecutively at 12 sites for 1 year. We analyzed chemical compositions of PAHs as well as other organic tracers to characterize the spatiotemporal pattern and size distribution of PAHs over China and to explore the possible sources of PAHs on the national scale. This information is helpful to provide a basis for PAHs' pollution control and the reduction of health effects in different regions of China.
2.1 Field sampling
The PM samples were collected simultaneously at 12 sampling sites across six regions of China, consisting of five urban sites, three suburban sites and four remote sites (Fig. S1 and Table S1 in the Supplement). The Huai River–Qin Mountains line is the geographical line that divides China into the northern and southern regions. There are central heating systems in winter in some urban areas of northern China but not so in southern China. The 12 sampling sites are Beijing (BJ), Dunhuang (DH), Hefei (HF), Hailun (HL), Kunming (KM), Qianyanzhou (QYZ), Sanya (SY), Shapotou (SPT), Taiyuan (TY), Tongyu (TYU), Wuxi (WX) and Xishuangbanna (BN). According to their locations, 6 of the 12 sites are situated in northern China, including BJ, DH, HL, SPT, TY and TYU. And the remaining 6 sites are located in southern China, including BN, HF, KM, QYZ, SY and WX.
Total suspended particles (TSPs) were collected using Anderson 9-stage cascade impactors (< 0.4, 0.4–0.7, 0.7–1.1, 1.1–2.1, 2.1–3.3, 3.3–4.7, 4.7–5.8, 5.8–9.0, > 9.0 µm) at a constant flow of 28.3 L/min. Quartz fiber filters (Whatman, QMA) that were used to collect PM samples were prebaked for 8 h at 450 ∘C. At each site, one set of nine size-fractionated PM samples was collected for 48 h every 2 weeks. A total of 294 sets of field samples and one set of field blanks were collected. Detailed information on the field sampling can be found elsewhere (Ding et al., 2014).
According to the meteorological definition, each season lasts 3 months; i.e., spring runs from March to May, summer runs from June to August, fall (autumn) runs from September to November and winter runs from December to February.
The data of average temperature (T), relative humidity (RH) and maximum solar radiation (SR) during each sampling episode are available from the China Meteorological Data Service Center (http://data.cma.cn/en, last access: 8 November 2019). And the average boundary layer height (BLH) was calculated using the NOAA's READY Archived Meteorology online calculating program (http://ready.arl.noaa.gov/READYamet.php, last access: 20 November 2019).
2.2 Chemical analysis
Each set of nine filters was combined into three samples with the aerodynamic diameters smaller than 1.1 µm (PM1.1), between 1.1 and 3.3 µm (PM1.1−3.3) and larger than 3.3 µm (PM>3.3), respectively. Before ultrasonic solvent extraction, 400 µL of isotope-labeled mixture compounds (tetracosane-d50, naphthalene-d8, acenaphthene-d10, phenanthrene-d10, chrysene-d12, perylene-d12 and levoglucosan-13C6) was spiked into the samples as internal standard. Samples were ultrasonically extracted twice with the mixed solvent of dichloride methane / hexane (1:1, v∕v) and then twice with the mixed solvent of dichloride methane / methanol (1:1, v∕v). The extracts of each sample were filtered, combined and finally concentrated to about 1 mL. Then the extracts were divided into two aliquots for silylation and methylation, respectively. Detailed information about the procedures of silylation and methylation is introduced elsewhere (Ding et al., 2014; Yu et al., 2016).
The methylated aliquot was analyzed for PAHs and hopanes using a 7890/5975C gas chromatograph–mass spectrometer detector (GC/MSD) in the selected ion monitoring (SIM) mode with a 60 m HP-5MS capillary column (0.25 mm, 0.25 µm). The GC temperature was initiated at 65 ∘C, held for 2 min and then increased to 300 ∘C at 5 ∘C min−1 and held for 40 min. The silylated aliquot was analyzed for levoglucosan using the same GC/MSD in the scan mode with a 30 m HP-5MS capillary column (0.25 mm, 0.25 µm). The GC temperature was initiated at 65 ∘C, held for 2 min and then increased to 290 ∘C at 5 ∘C min−1 and held for 20 min. The target compounds were identified by authentic standards and quantified using an internal calibration approach. A total of 24 PAHs were quantified, including Phenanthrene (Phe), Anthracene (Ant), Fluoranthene (Flu), Acephenanthrylene (Acep), Pyrene (Pyr), Retene (Ret), Benzo(ghi)fluoranthene (BghiF), Cyclopenta(cd)pyrene (CcdP), Benz(a)anthracene (BaA), Chrysene (Chr), Benzo(b)fluoranthene (BbF), Benzo(k)fluoranthene (BkF), Benzo(j)fluoranthene (BjF), Benzo(e)pyrene (BeP), Benzo(a)pyrene (BaP), Perylene (Per), Indeno(cd)fluoranthene (IcdF), Indeno(cd)pyrene (IcdP), Dibenzo[a,h]anthracene (DahA), Dibenz(a,c)anthracene (DacA), Benzo(b)chrysene (BbC), Picene (Pic), Benzo(ghi)perylene (BghiP) and Coronene (Cor). Table S2 lists the 24 target PAHs and their abbreviations.
2.3 Quality control and quality assurance
Field and laboratory blanks were analyzed in the same manner as the PM samples. The target compounds were not detected or negligible in the blanks. The data reported in this study were corrected by corresponding field blanks. To test the recovery of the analytical procedure, we analyzed the NIST urban dust Standard Reference Material (SRM 1649b, n=6) in the same manner as the PM samples. Compared with the certified values for PAHs in SRM 1649b, the recoveries were 81.5 % ± 1.9 %, 66.6 % ± 5.4 %, 113.6 % ± 4.4 %, 76.2 % ± 2.5 %, 100.4 % ± 7.9 %, 138.3 % ± 3.6 %, 109.5 % ± 14.2 %, 125.8 % ± 8.8 % and 86.4 % ± 10.7 % for Pyr, Ret, Chr, BbF, BkF, BeP, Per, IcdP and Pic respectively. The data reported in this study were not recovery-corrected. The method detection limits (MDLs) of the target compounds ranged from 0.01 to 0.08 ng/m3.
2.4 Positive matrix factorization (PMF) analysis
Positive matrix factorization (PMF) (US EPA, version PMF 5.0) was employed for source apportionment of PAHs. The model has been widely used to attribute major sources of PAHs (Larsen and Baker, 2003; Belis et al., 2011). In the case that the observed concentration (Con) of a compound was below its MDL, half of the MDL was used as the model input data and the uncertainty (Unc) was set as 5/6 of the MDL (Polissar et al., 1998). If the Con of a compound was higher than its MDL, Unc was calculated as Unc = [(20 %. × Con)2+ (MDL)2]1∕2 (Polissar et al., 1998).
2.5 Exposure assessment
Besides benzo[a]pyrene (BaP), other PAHs like BaA, BbF, DahA and IcdP are also carcinogenic compounds (IARC, 2009). In order to assess the carcinogenicity of bulk PAHs, the BaP carcinogenic equivalent concentration (BaPeq) was calculated by multiplying the concentrations of PAH individuals (PAHi) by their toxic equivalency factor (TEFi) as
In this study, we adopted the TEFs reported by Nisbet and Lagoy (1992), which were 0.001 for Phe, Flu and Pyr, 0.01 for Ant, Chr and BghiP, 0.1 for BaA, BbF, BkF, BeP and IcdP and 1.0 for BaP and DahA. Table S3 lists annual averages of PAH individuals and BaPeq at the 12 sites.
Incremental lifetime lung cancer risk (ILCR) caused by inhalation exposure to PAHs was estimated as
where URBaP is the unit relative risk of BaP. Based on the epidemiological data from studies on coke oven workers, the lung cancer risk of BaP inhalation was estimated to be 8.7 × 10⁻⁵ per ng/m3 (WHO, 2000). Thus, we used a URBaP value of 8.7 × 10⁻⁵ per ng/m3 in this study.
3.1 General remarks
The annual averages of the 24 total measured PAHs (∑24PAHs) in TSPs (sum of three PM size ranges) ranged from 7.56 to 205 ng/m3 (Fig. 1a) among the 12 sampling sites, with a mean of 53.5 ng/m3. The highest concentration of ∑24PAHs was observed at TY, and the lowest level occurred at SY (Fig. 1a). Compared with the data in other large-scale observations (Table 1), atmospheric concentrations of PAHs measured at the 12 sites in this study were comparable with previously reported values in China in 2013–2014 (D. Liu et al., 2017; Shen et al., 2019) and the United States (B. Liu et al., 2017), lower than those measured in China in 2003 and 2008–2009 (Wang et al., 2006; Ma et al., 2018) and higher than those over Great Lakes (Sun et al., 2006), Europe (Jaward et al., 2004), Japan (Hayakawa et al., 2018) and some Asian countries (Hong et al., 2016). Fig. 1a also presents the compositions of PAHs. Evidently, four- and five-ring PAHs were the majority in ∑24PAHs, with mass shares of 36.8 %±5.6 % and 31.4 %±9.6 %, respectively, followed by the PAHs with three rings (19.2 %±9.4 %), six rings (11.3 %±3.8 %) and seven rings (1.3 %±0.6 %). The concentrations of ∑24PAHs at urban sites (82.7 ng/m3) were significantly higher (p<0.05) than those at suburban (48.0 ng/m3) and remote sites (18.0 ng/m3) (Fig. S2).
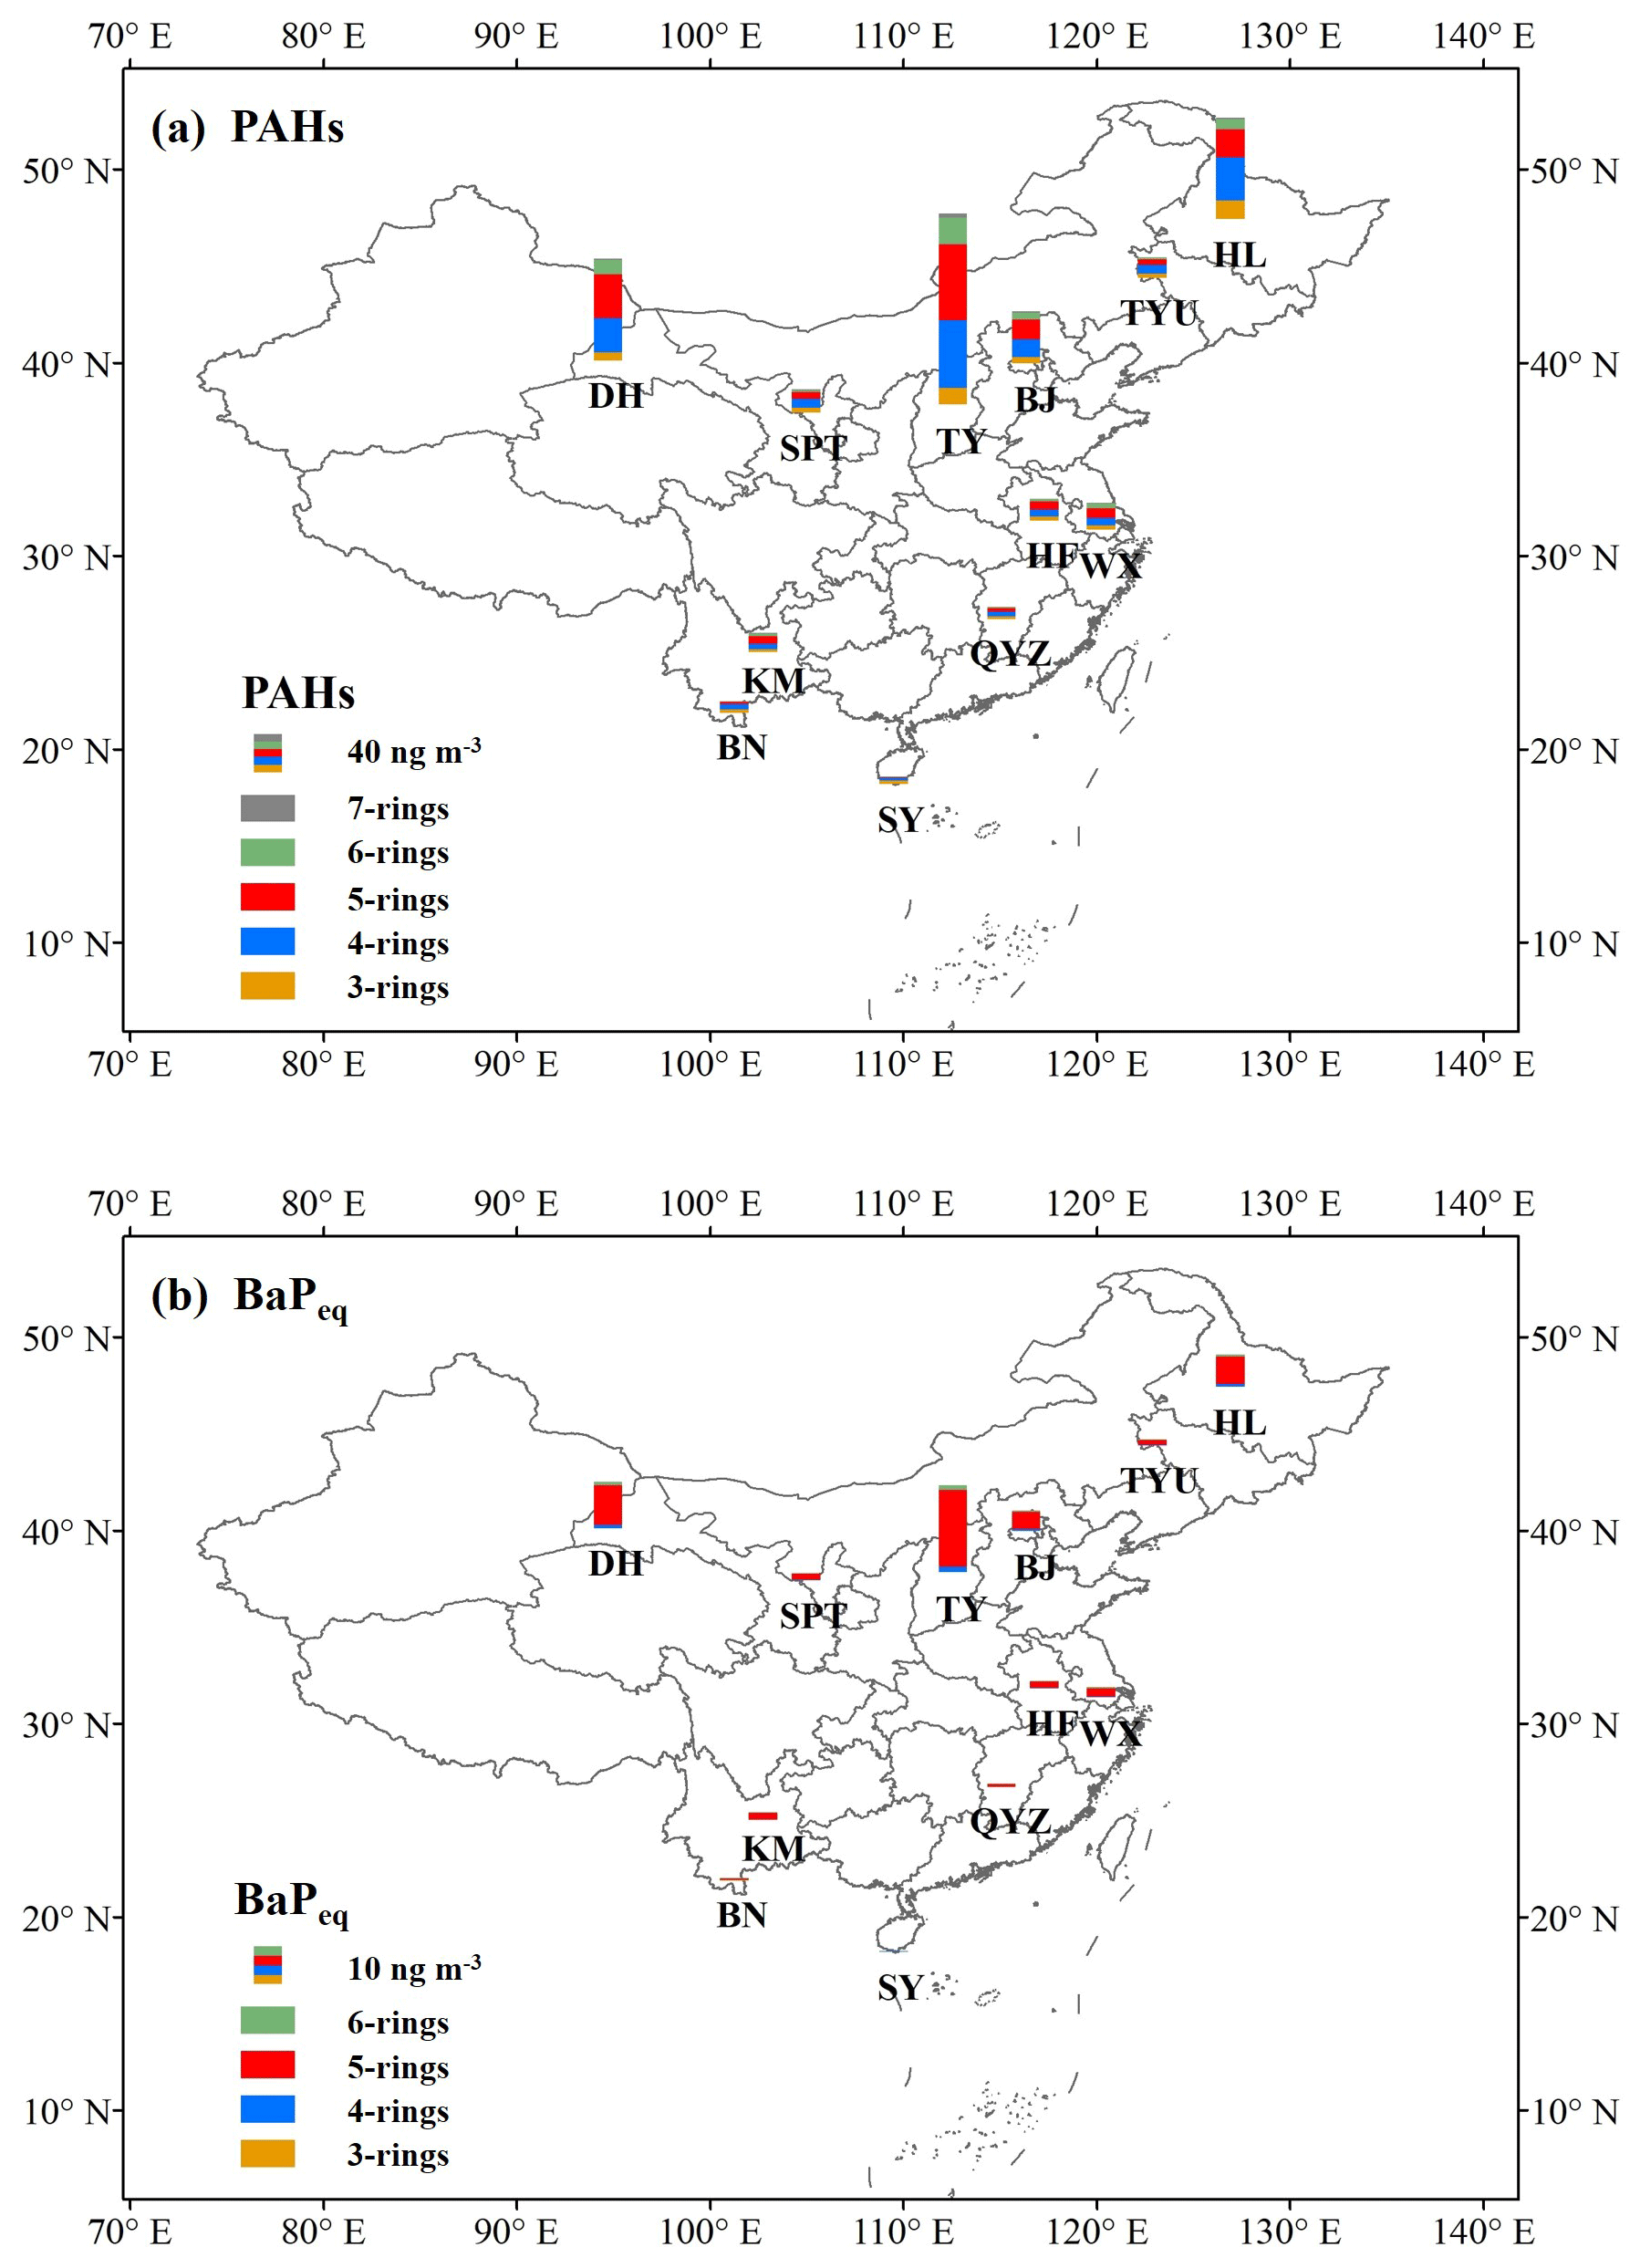
Figure 1Annual averages of ∑24PAHs (a) and BaPeq (b) at 12 sites in China.
Table 1PAHs' concentration measured in this study and comparison with those of other large-scale observations.
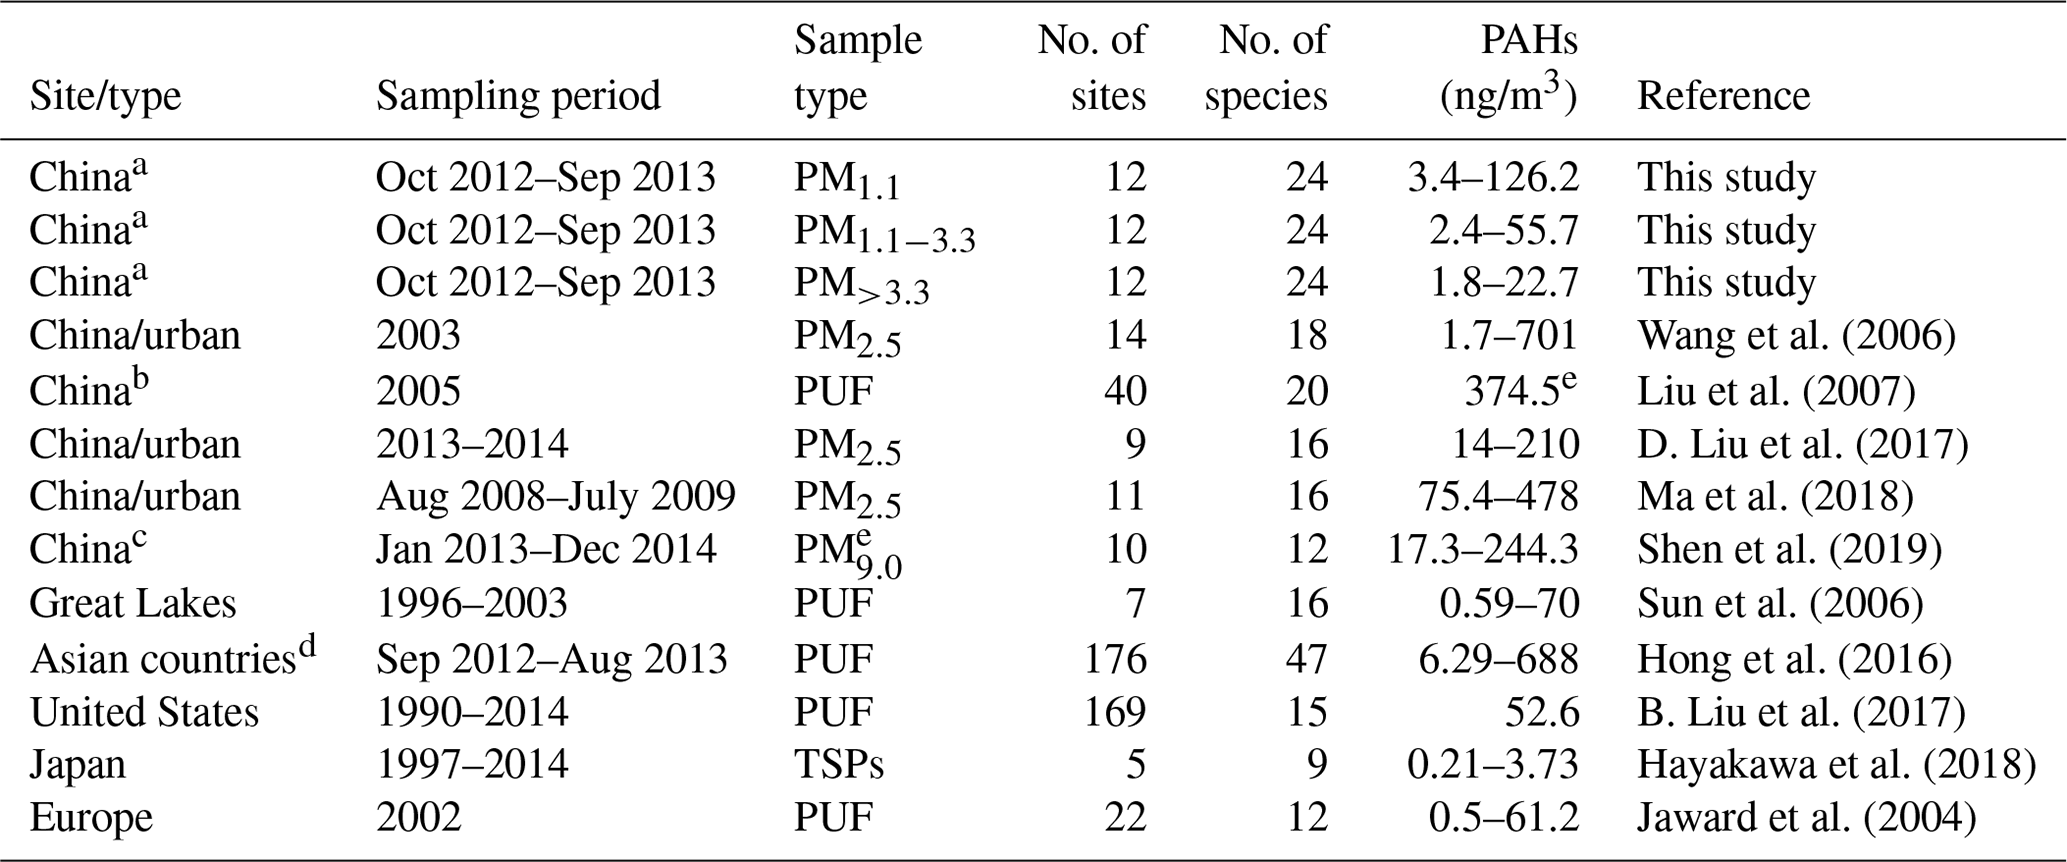
a Including five urban sites, three suburban sites and four remote sites in China. b Including 37 cities and three rural locations in China. c Including five urban sites, one suburban site, one farmland site and three background sites in China. d Including 82 urban sites, 83 rural sites and 11 background sites in China, Japan, South Korea, Vietnam and India. e The unit is nanograms (ng) per day.
Annual averages of BaP in TSPs among the 12 sites were in the range of 0.09 to 11.0 ng/m3, with a mean of 2.58 ng/m3. The highest level of atmospheric BaP occurred at TY, and the lowest existed at SY. The BaP values at five sites (WX, BJ, HL, DH and TY) exceeded the national standard of annual atmospheric BaP (1.0 ng/m3) by factors of 1.2 to 11.0. For BaPeq, annual averages ranged from 0.21 to 22.2 ng/m3, with the predominant contribution from five-ring PAHs (Fig. 1b). ILCR caused by inhalation exposure to PAHs ranged from 1.8 × 10⁻⁵ (SY) to 1.9 × 10⁻³ (TY) among the 12 sites in China (Fig. S3), which were much higher than the acceptable risk level of 1.0 × 10⁻⁶ in the United States (US EPA, 1991). All these data demonstrate that China faces severe PAHs' pollution and high related health risk (Zhang et al., 2009; Shrivastava et al., 2017). And BePeq (Fig. S4) and ILCR (Fig. S5) were both the highest at urban sites. These data indicate that people in urban regions of China were faced with higher exposure risk of PAHs' pollution as compared to those in suburban and remote areas. Figure S6 shows that four- and five-ring PAHs are the majority in ∑24PAHs at urban, suburban and remote sites, which accounted for 72.2 %, 63.8 % and 66.6 % of the total amounts in TSPs, respectively. The percentage of five-ring PAHs dominates at urban sites, and four-ring PAHs make up the largest proportion at suburban and remote sites (Fig. S6).
3.2 Enrichment of PAHs in PM1.1
Figure 2 presents the size distribution of PAHs and BaPeq at the 12 sites in China. Both ∑24PAHs and BaPeq were concentrated in PM1.1, accounting for 44.6 %–71.3 % and 56.7 %–79.3 % of the total amounts in TSPs, respectively. And BaPeq had more enrichment in PM1.1 than ∑24PAHs. The mass fractions of ∑24PAHs and BaPeq in PM1.1−3.3 were 20.6 %–39.5 % and 16.1 %–38.3 %. The coarse particles (PM>3.3) had the lowest loadings of ∑24PAHs (7.2 %–23.4 %) and BaPeq (3.0 %–12.9 %). Thus, our observations indicated that PAHs in the ultrafine particles (PM1.1) contributed the highest health risk of PAHs in TSPs over China. A previous study at three sites in East Asia found that the size distribution of PAHs was unimodal and peaked at 0.7–1.1 µm size (Wang et al., 2009). A recent study at 10 sites of China also found that PAHs were concentrated in PM1.1 (Shen et al., 2019). Based on the observation at one site in the Fenhe Plain, northern China, Li et al. (2019) pointed out that PAHs in the particles with the aerodynamic diameters < 0.95 µm contributed more than 60 % to the total cancer risk of PAHs in PM10. All these results demonstrate that the high carcinogenicity of PAHs is accompanied with ultrafine particles, probably because small particles are apt to invade the blood vessels and cause DNA damage. Thus, further studies should give more attention to PAHs' pollution in ultrafine particles.
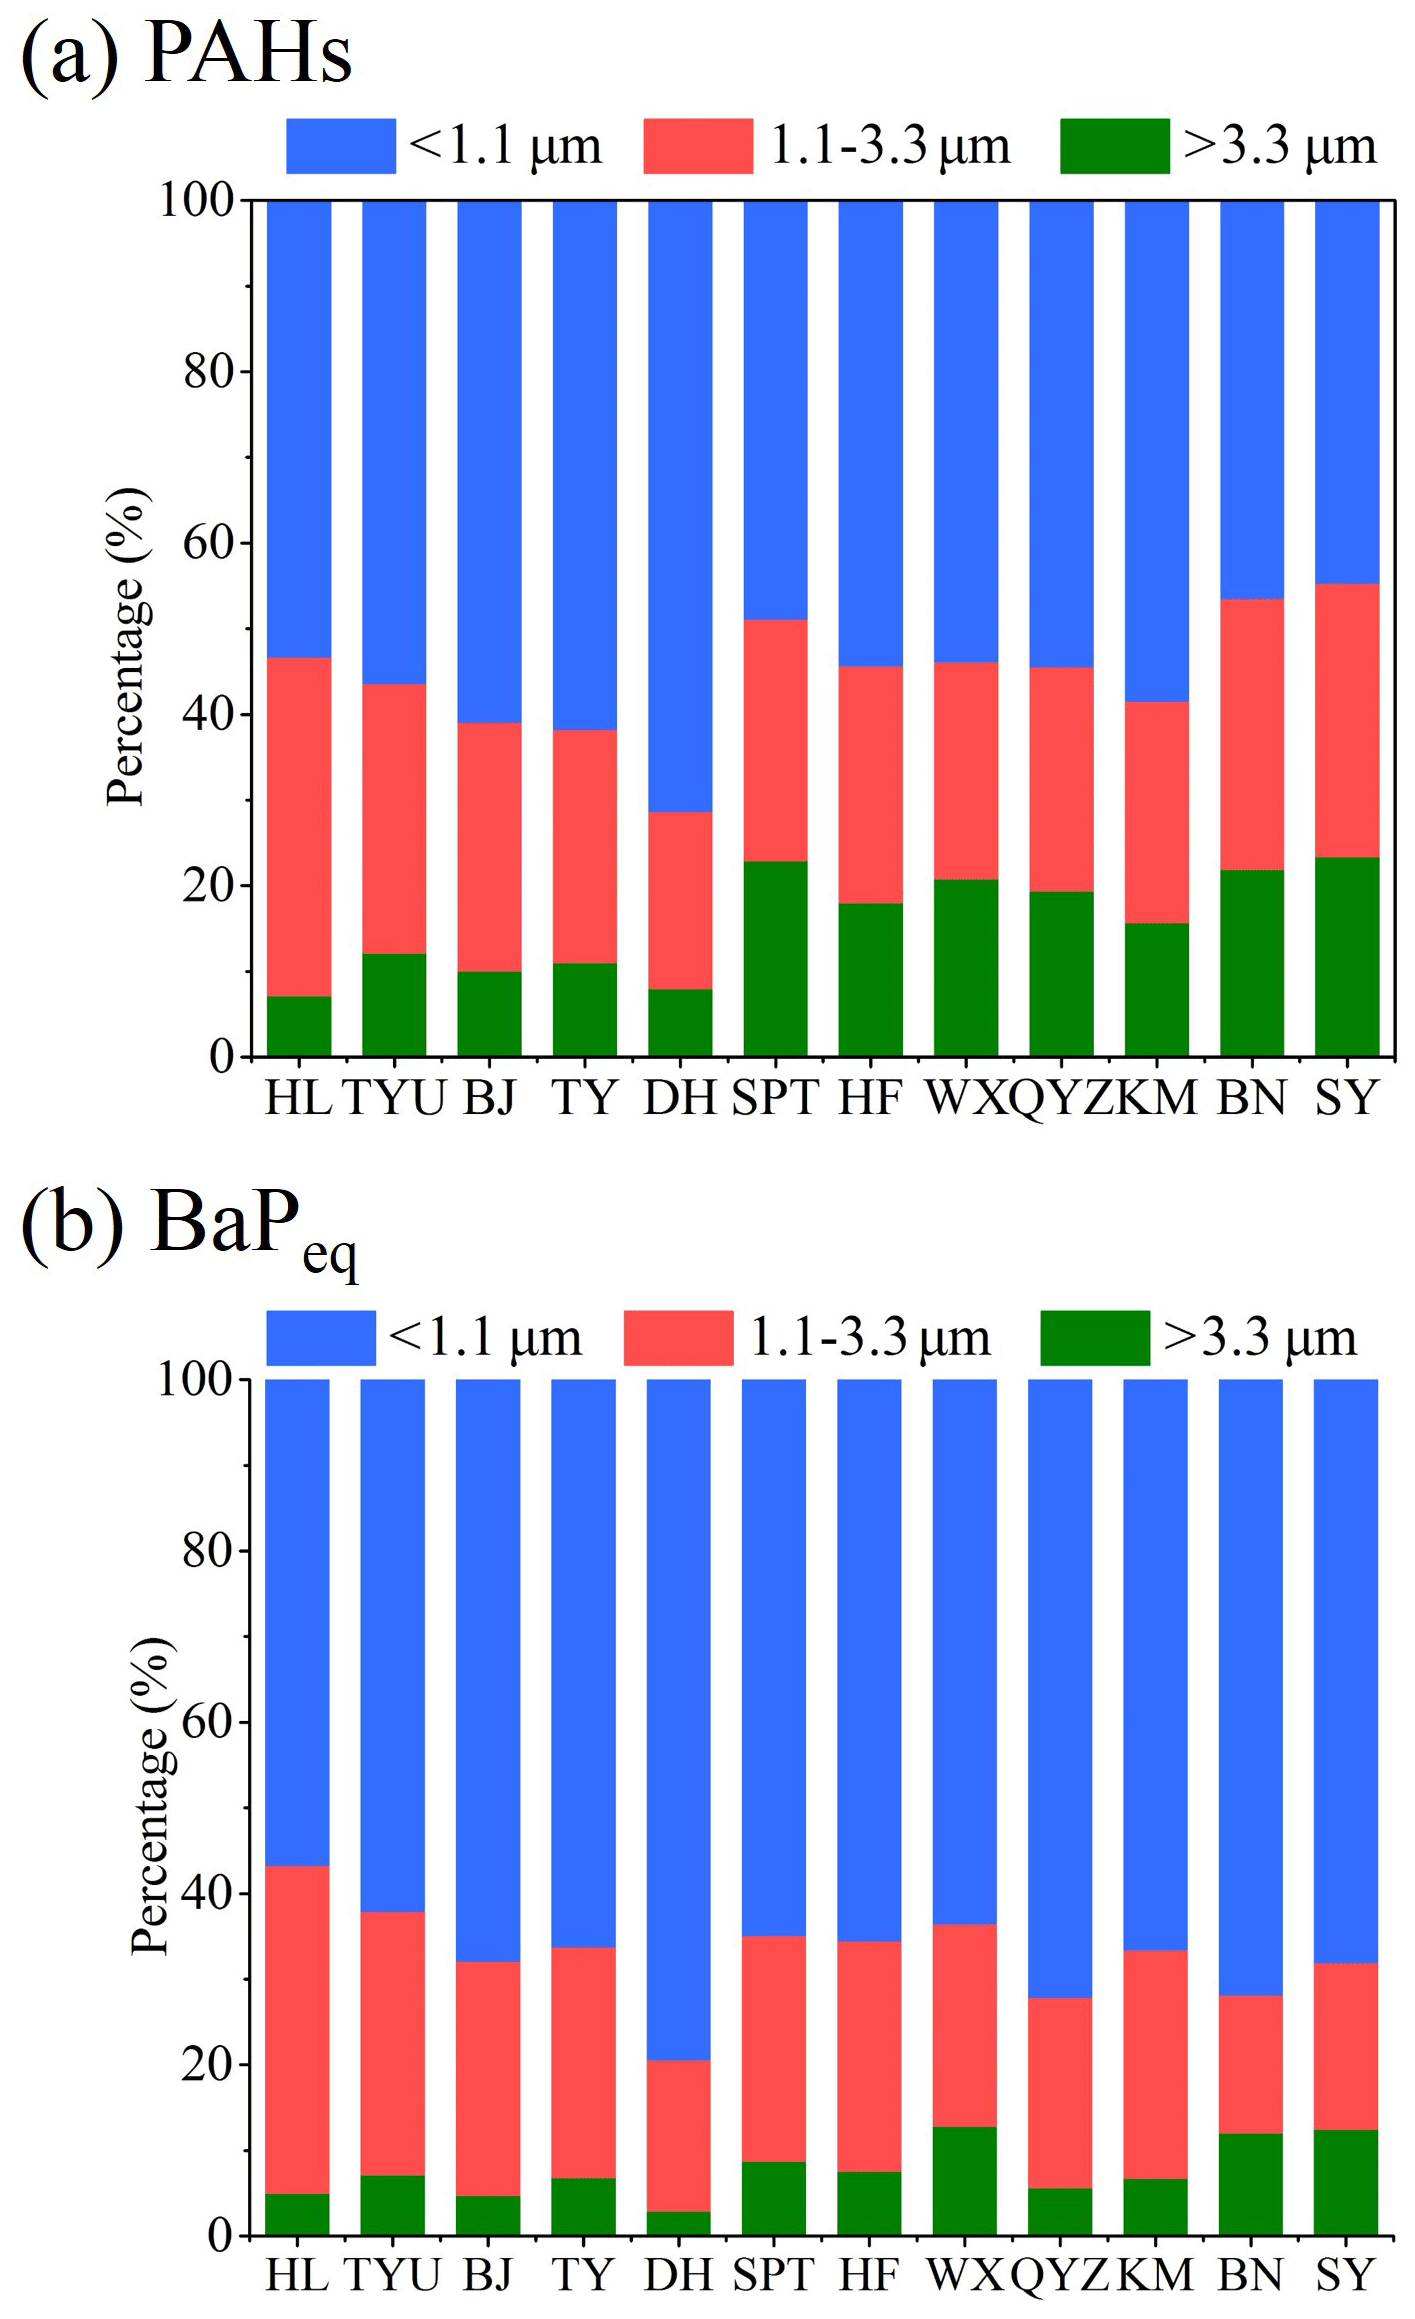
Figures S7 and S8 show seasonal variations in the size distribution of ∑24PAHs and BaPeq, respectively. ∑24PAHs and BaPeq were enriched in PM1.1 throughout the year at all sites. The mass fractions of ∑24PAHs and BaPeq in PM1.1 were the highest during fall to winter (up to 74.6 % and 79.7 % at the DH site) and the lowest during summer (down to 39.2 % and 50.7 % at the BN site). It should be related to the emission sources of PAHs. Atmospheric PAHs are mainly derived from combustion sources. As Shen et al. (2013b) reported, PAHs emitted from biomass burning and coal combustion were enriched in ultrafine particles (< 1.1 µm). Moreover, coal combustion witnessed more enrichment of PAHs in ultrafine particles than biomass burning. Figure S9 presents monthly variations in the size distribution of PAHs with different numbers of rings. The mass shares of three-ring PAHs in PM1.1 (39.2 %), PM1.1−3.3 (32.0 %) and PM>3.3 (28.9 %) were comparable. And the highest loading of three-ring PAHs in PM1.1 was observed in December 2012. The mass fractions of four-ring PAHs in PM1.1 were the highest in December 2012 (58.4 %) and the lowest in July 2013 (39.5 %). The higher molecular weight PAHs (five–seven-ring PAHs) were enriched in PM1.1 throughout the year.
3.3 High levels of atmospheric PAHs in northern China
Figure 3 shows the differences of atmospheric PAHs between northern China (BJ, DH, HL, SPT, TY and TYU) and southern China (BN, HF, KM, QYZ, SY and WX). ∑24PAHs in northern China were higher than in southern China by a factor of 5.0 (Fig. 3a). The concentrations of PAHs with different ring numbers were all higher in northern China than those in southern China, especially for the four–seven-ring PAHs. Moreover, BaP, BaPeq and ILCR in northern China were 5.8, 5.3 and 5.3 times higher than those in southern China (Fig. 3b). The higher concentrations of PAHs in the air of northern China than southern China were also reported in previous field studies (D. Liu et al., 2017; Ma et al., 2018; Shen et al., 2019). Based on the emission inventories and model results, previous studies predicted that PAHs' concentrations, BaP levels and lung cancer risk of exposure to ambient PAHs in northern China were all higher than those in southern China (Xu et al., 2006; Zhang et al., 2007; Zhang and Tao, 2009; Zhu et al., 2015). All these indicated much higher PAHs' pollution and health risk in northern China.
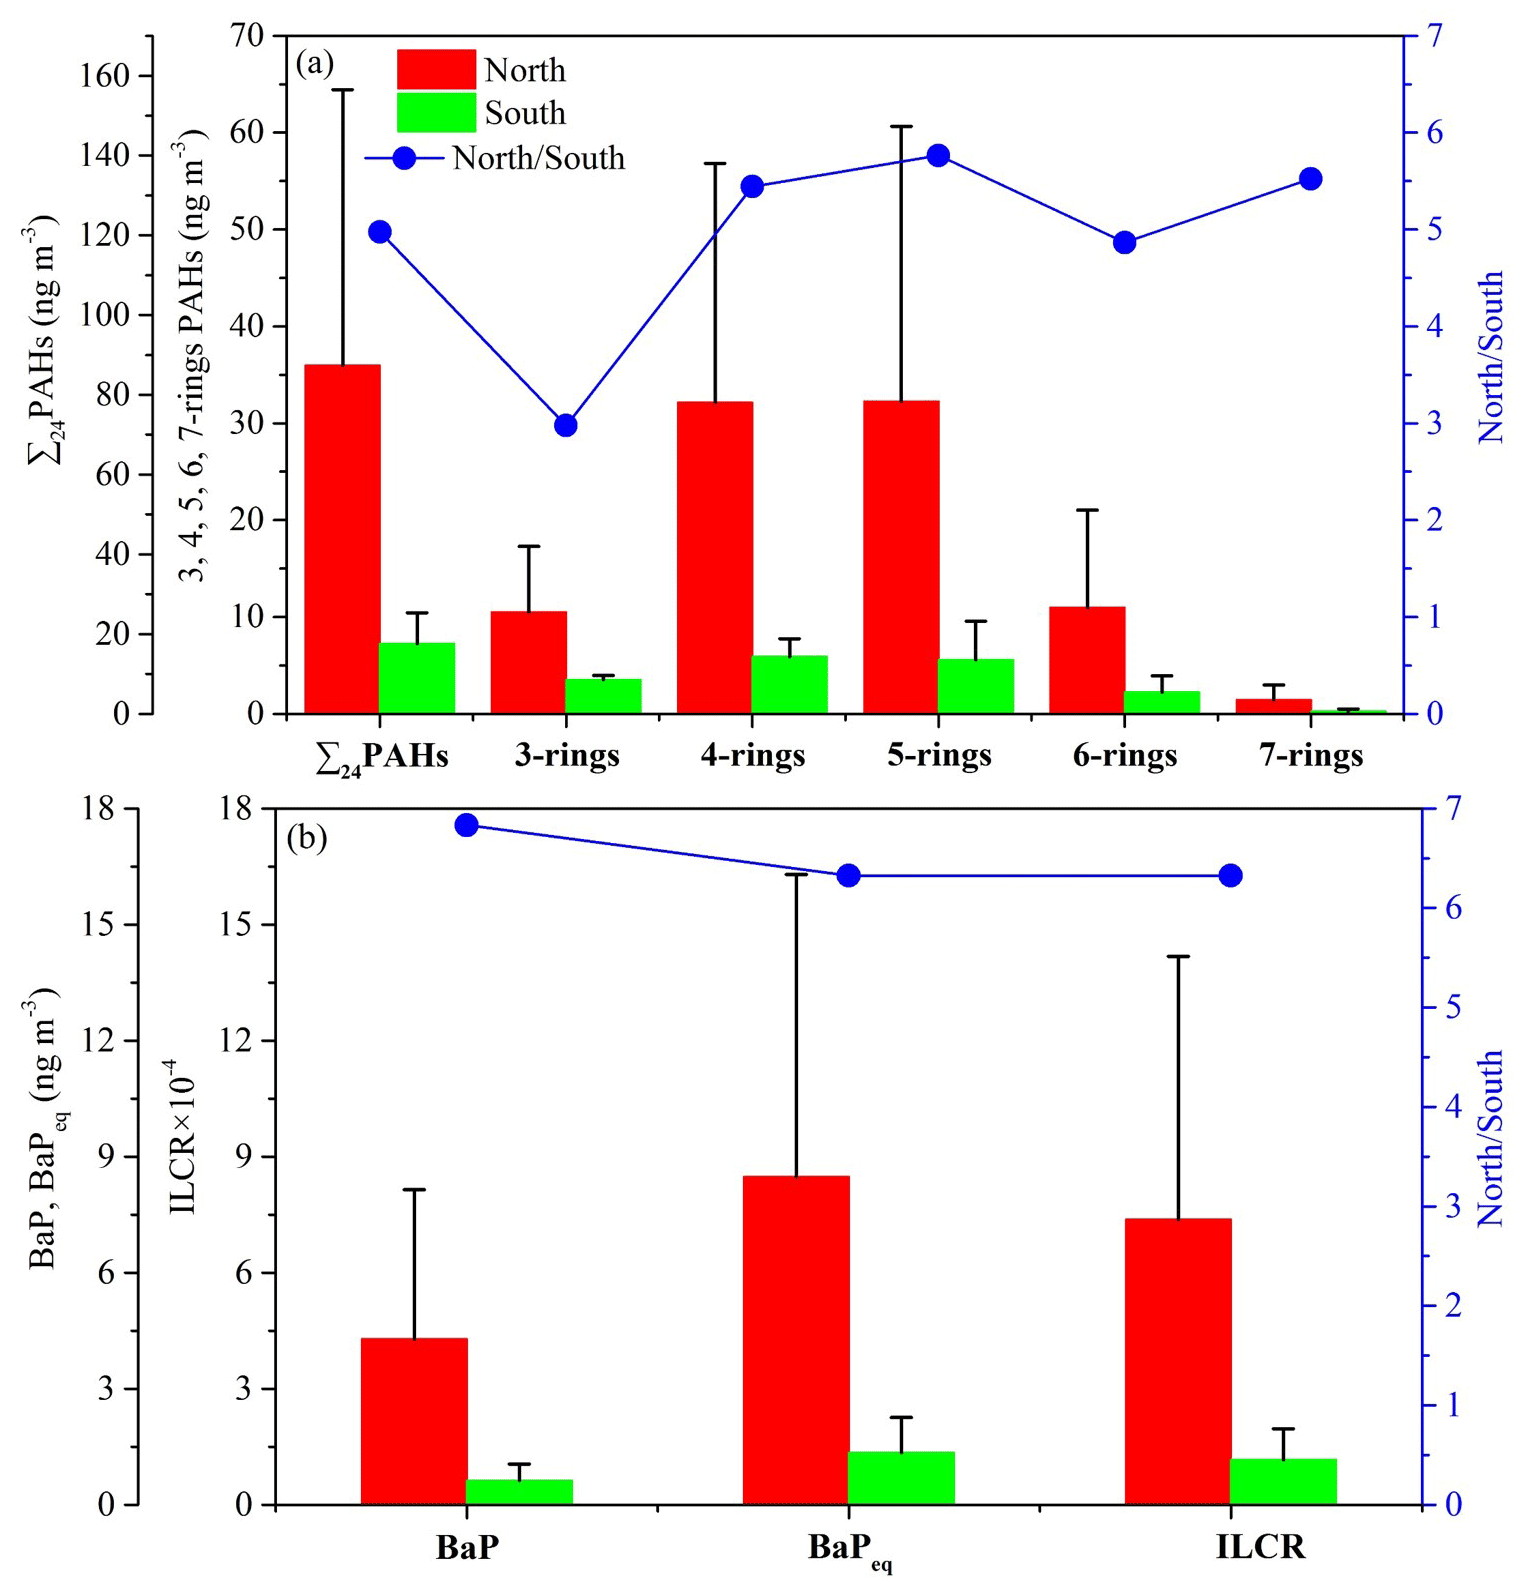
Figure 3Comparison of ∑24PAHs between northern and southern China. Three–seven-ring PAHs (a) and BaP, BaPeq and ILCR (b).
The northern high feature of atmospheric PAHs should be determined by the meteorological conditions and source emissions. The theoretical relationship between meteorological parameters (temperature, solar radiation and boundary layer height) and the concentration of particulate-bound PAHs were discussed, and the detailed theoretical discussion information can be found in Sect. S1 in the Supplement. We illustrate that a decrease of ambient temperature would result in an increase of individual PAHs in the particulate phase, assuming a constant total concentration in the air. The decrease of SR can indeed lower concentrations of hydroxyl radical [OH] and accumulate PAHs in the air, resulting in the increase of PAHs' concentrations. And a low height of the boundary layer can inhibit the vertical diffusion of PAHs, which leads to PAHs' accumulation and increased concentrations. As Fig. 4 shows, PAHs exhibited strong negative correlations with temperature (T), solar radiation (SR) and the boundary layer height (BLH), especially in northern China. This indicated that unfavorable meteorological conditions, such as low levels of temperature, solar radiation and BLH, could lead to PAHs' accumulation in the air (Sofuoglu et al., 2001; Callén et al., 2014; Lin et al., 2015a; Li et al., 2016a). In fact, annual averages of T, SR and BLH in northern China were all significantly lower than those in southern China (p < 0.05, Table S4), which could indeed cause the accumulation of PAHs in the air of northern China. In addition, low temperatures in northern China promote the condensation of semi-volatile PAHs on particles (Wang et al., 2011; Ma et al., 2020). At the southern sites, the negative correlations between PAHs and meteorological parameters (SR and BLH) were not as strong as those in the northern sites. This implied that the adverse influence of meteorological conditions on PAHs' pollution in southern China might be less significant than that in northern China. The annual ambient temperature at the 12 sampling sites was 13.9 ∘C, so we chose 13.9 ∘C as the boundary to divide the 1-year data into warm and cold seasons. As Fig. S10 showed, at most sites in northern and southern China, PAHs negatively correlated with temperature (T), boundary layer height (BLH) and solar radiation (SR) in both cold (T < 13.9 ∘C) and warm (T > 13.9 ∘C) seasons. Thus, coupled with theoretical discussion, we suggest that worsened PAH pollution in winter was partly caused by adverse meteorological conditions.
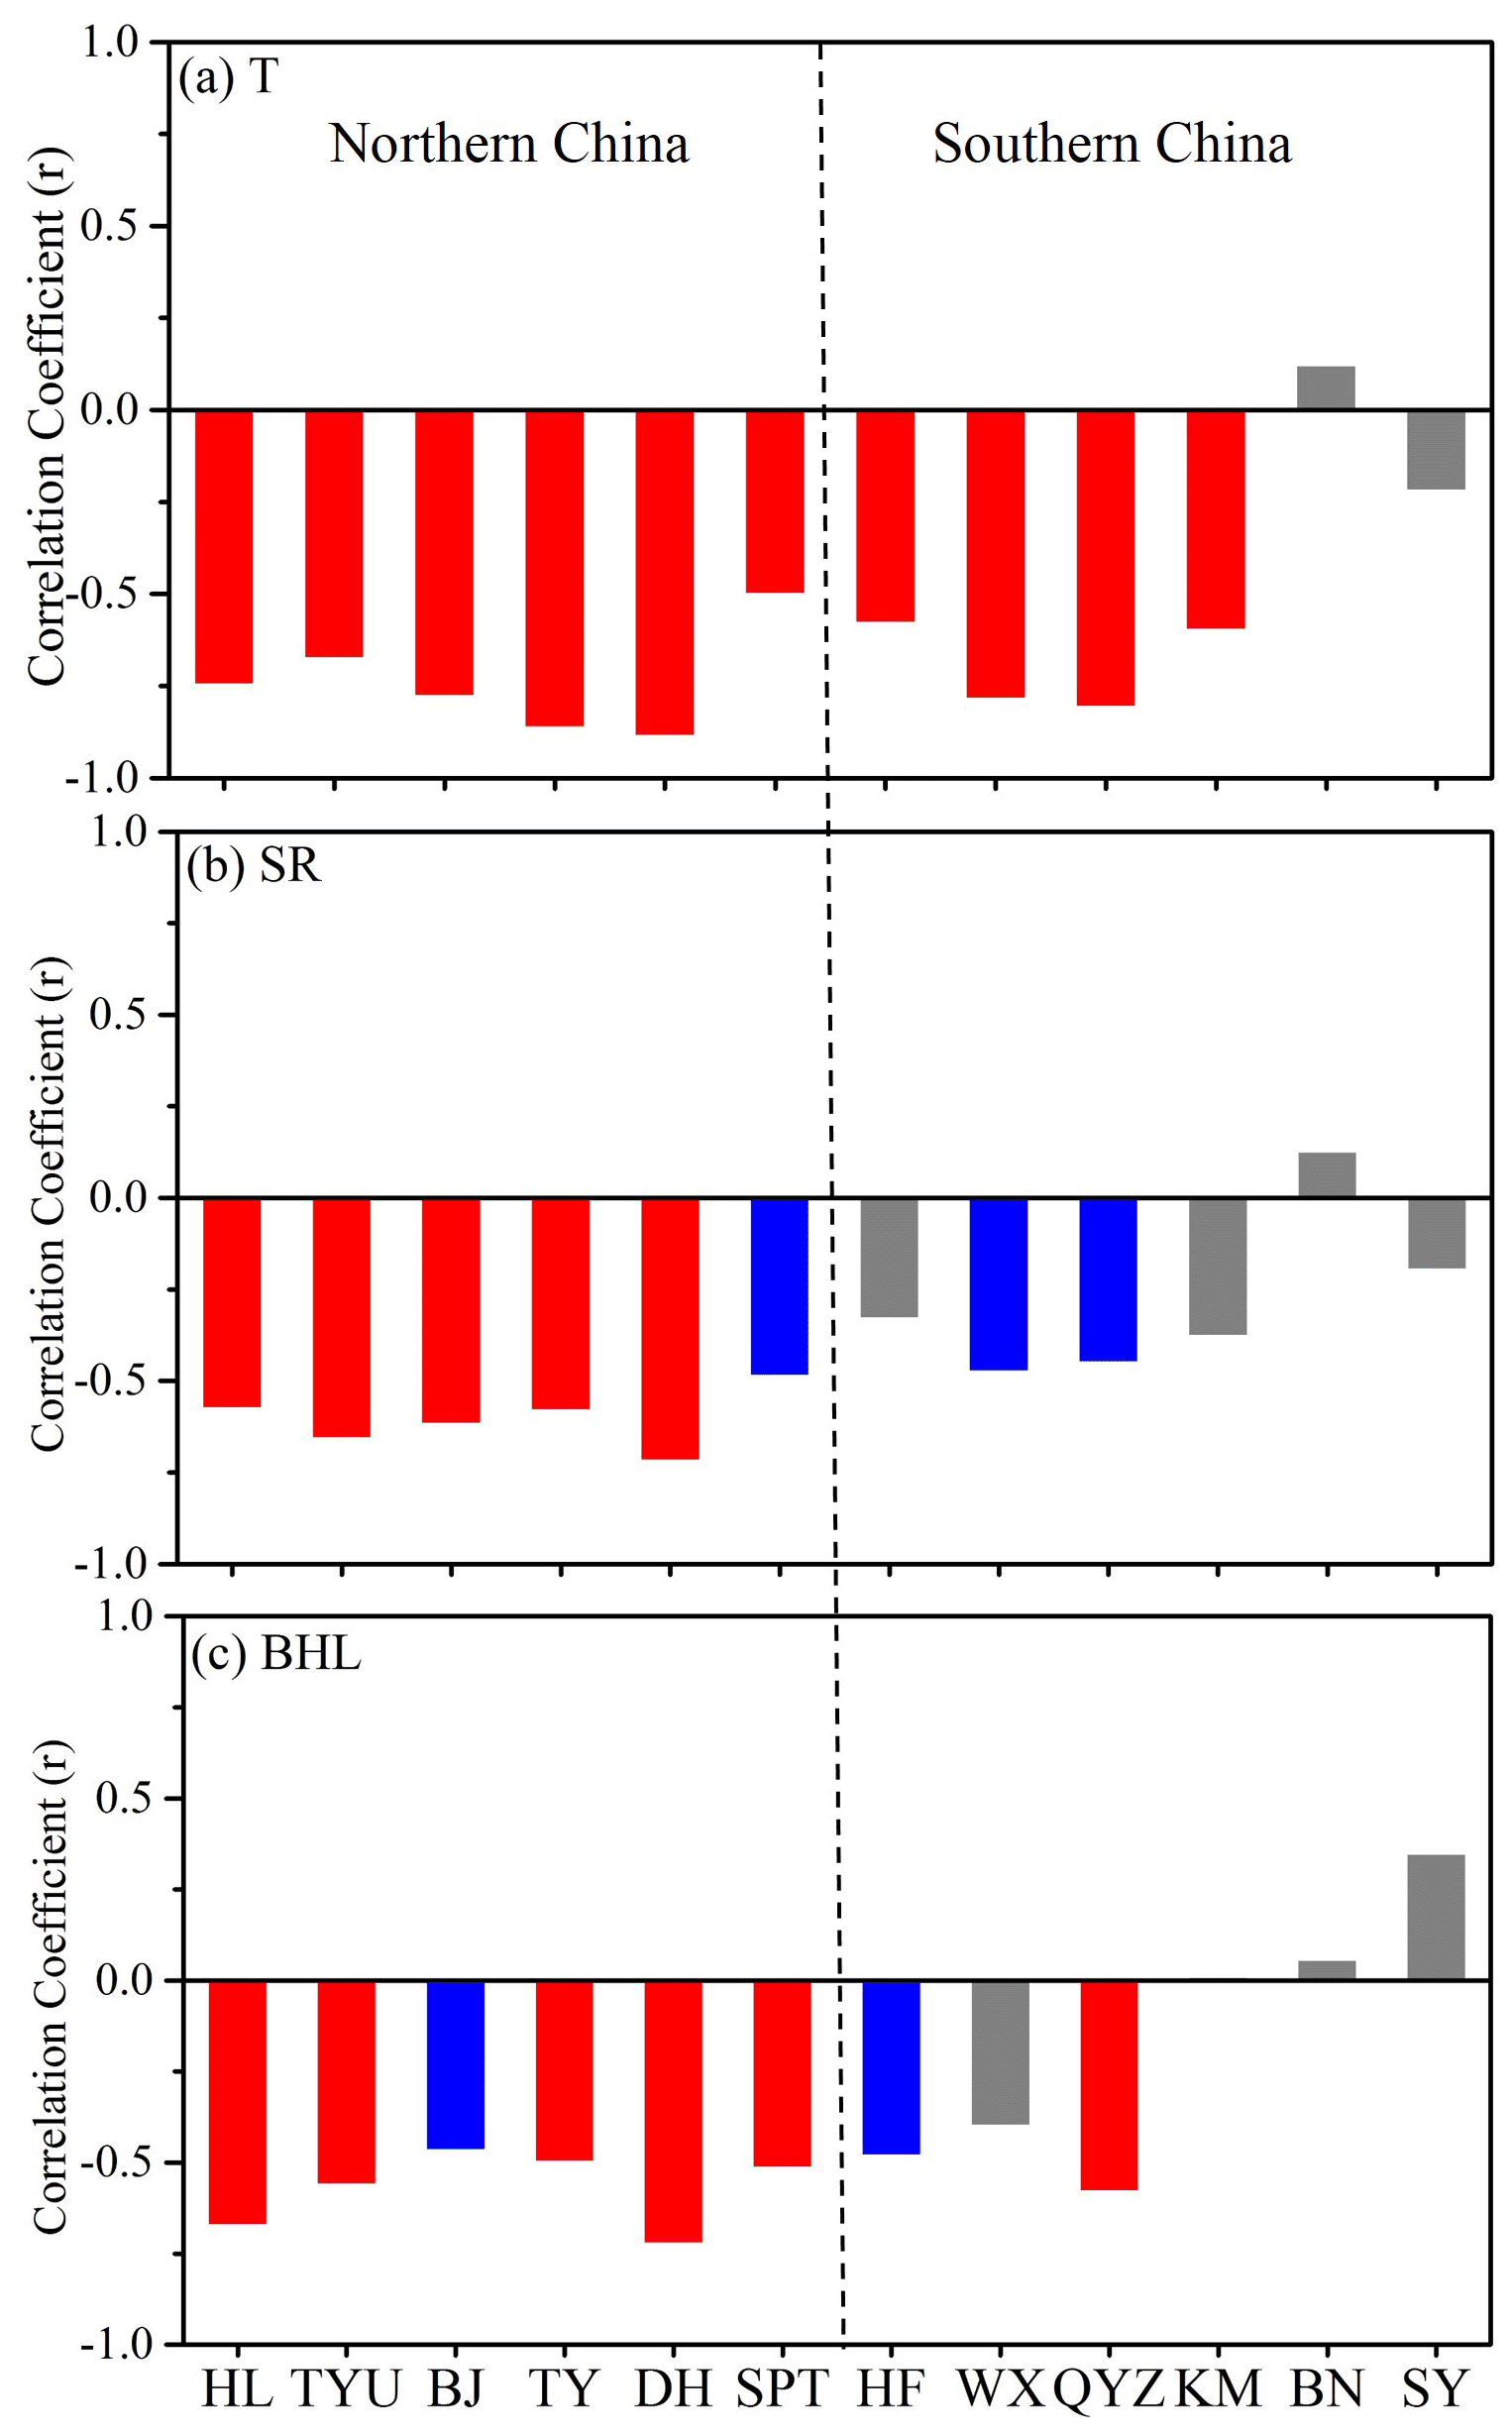
Figure 4Correlation coefficient (r) of PAHs with T (a), SR (b) and BLH (c) at 12 sites. The red, blue and gray bars indicate p<0.01, p<0.05 and p>0.05, respectively.
For PAHs' emission, there are apparent differences in sources and strength between the northern and southern regions. For instance, there is central heating during winter in northern China but not so in southern China. Residential heating during cold periods in northern China could consume large amounts of coal and biofuel and release substantial PAHs into the air (Liu et al., 2008; Xue et al., 2016). Consequently, atmospheric levels of PAHs in northern China were much higher than those in southern China. Since central heating systems start heating supply simultaneously within each region in northern China, atmospheric PAHs should increase synchronously within the northern regions of China. To check the spatial homogeneity of PAHs on a regional scale, we analyzed the correlation of PAHs between paired sites within each region. As Table 2 shows, PAHs varied synchronously and correlated well at the paired sites in northern China (p < 0.001). And for closer distances between sites, stronger correlations were observed. The spatial synchronized trends of PAHs observed in the northern regions of China probably resulted from the synchronous variation of PAHs' emission in northern China. In southern China, although the distances between paired sites were closer than those in the northern regions, the correlations between sites within a region was weaker. This indicates that there might be more local emission of which sources and strength vary from place to place in southern China.
Table 2Correlation coefficient (r) and significance (p) of PAHs between paired sites in each region.

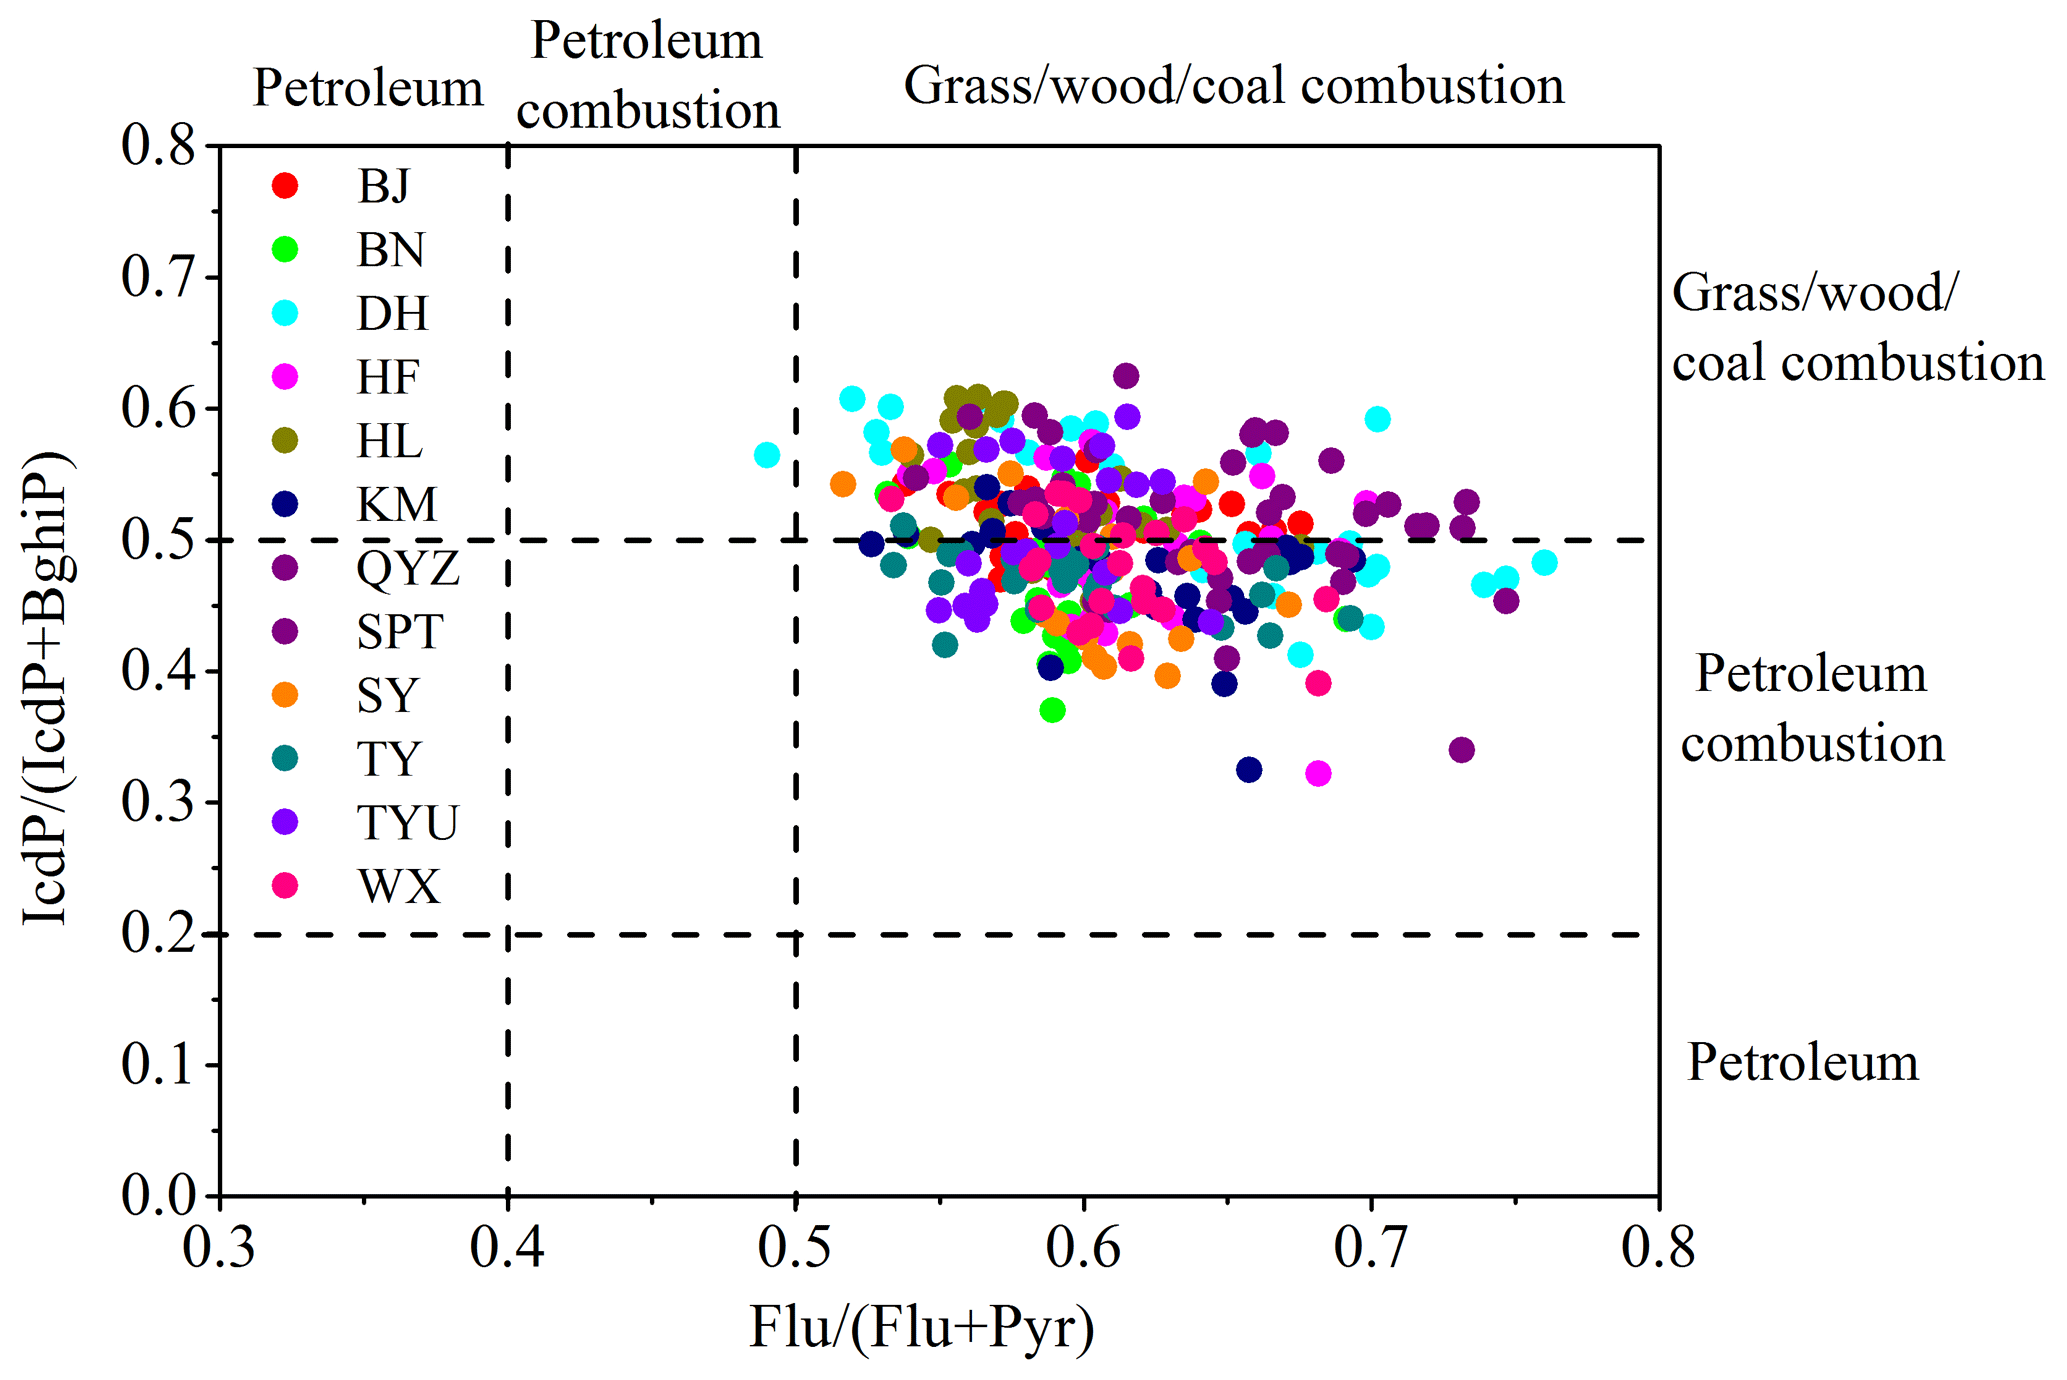
Figure 5Diagnostic ratios of IcdP / (IcdP + BghiP) versus Flu / (Flu + Pyr) at 12 sites in China. Ranges of ratios for sources are adopted from Yunker et al. (2002).

Figure 6The correlation between PAHs and levoglucosan, picene and hopanes at sites in northern China (a–c) and southern China (d–f).
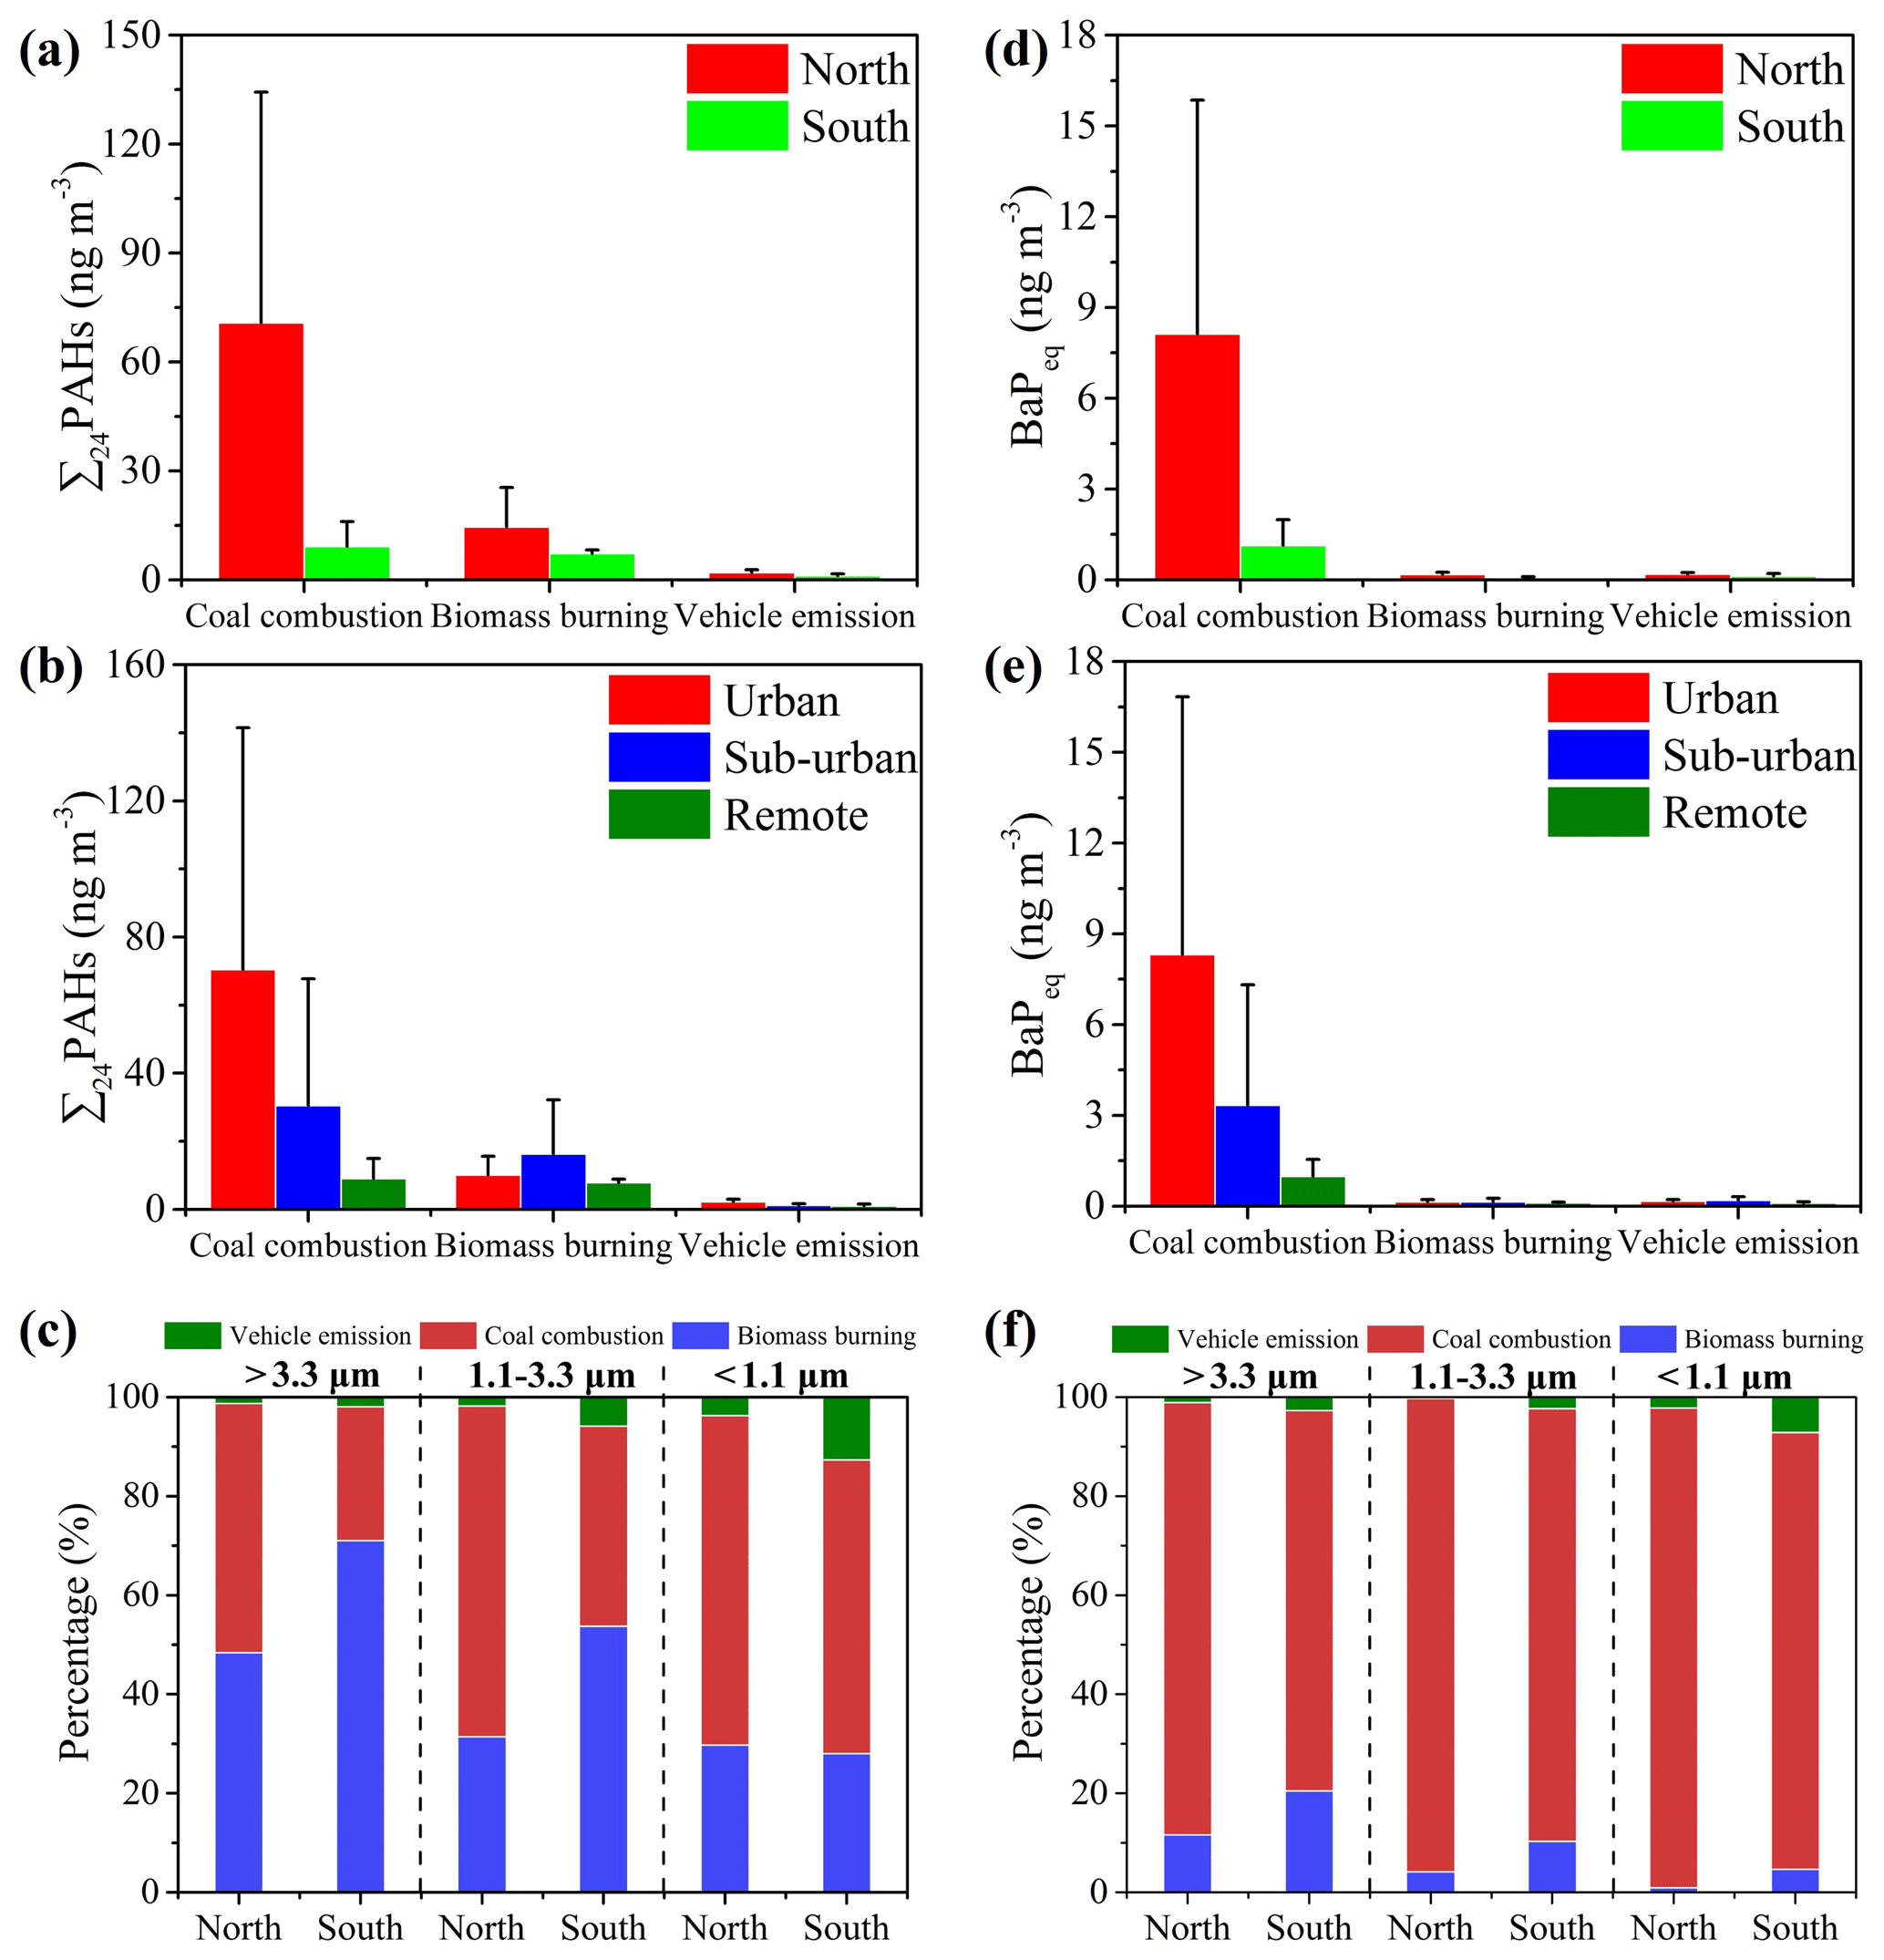
Figure 7Source apportionment of ∑24 PAHs and BaPeq in different regions (a, d), sampling sites (b, e) and size particles (c, f).
We applied diagnostic ratios of PAH isomers to identify major sources of atmospheric PAHs. The ratios of IcdP / (IcdP + BghiP) and Flu / (Flu + Pyr) have been widely used to distinguish possible sources of PAHs (Aceves and Grimalt, 1993; Zhang et al., 2005; Ding et al., 2007; Gao et al., 2012; Lin et al., 2015a; Ma et al., 2018). As summarized by Yunker et al. (2002), the petroleum boundary ratios for IcdP / (IcdP + BghiP) and Flu / (Flu + Pyr) are close to 0.20 and 0.40, respectively; for petroleum combustion, the ratios of IcdP / (IcdP + BghiP) and Flu / (Flu + Pyr) range from 0.20 to 0.50 and 0.40 to 0.50, respectively; and the combustion of grass, wood and coal has ratios higher than 0.50 for both IcdP / (IcdP + BghiP) and Flu / (Flu + Pyr). As Fig. 5 shows, the ratios of Flu / (Flu + Pyr) at the 12 sites ranged from 0.49 to 0.76, suggesting that biomass (grass/wood) burning and coal combustion were the major sources. And the ratios of IcdP / (IcdP + BghiP) were in the range of 0.32 to 0.62, indicating that besides biomass and coal combustion, petroleum combustion, especially vehicle exhaust, was also an important source of atmospheric PAHs. Thus, as identified by the diagnostic ratios, biomass burning, coal combustion and petroleum combustion were major sources of atmospheric PAHs over China. This is also confirmed by the significant correlations of ∑24 PAHs with the typical tracers of biomass burning (levoglucosan), coal combustion (picene) and vehicle exhaust (hopanes) at most sites (Fig. 6). As a global emission inventory showed, PAHs in the atmosphere were mainly released from incomplete combustion processes including coal combustion, biomass burning and vehicle exhaust (Shen et al., 2013a).
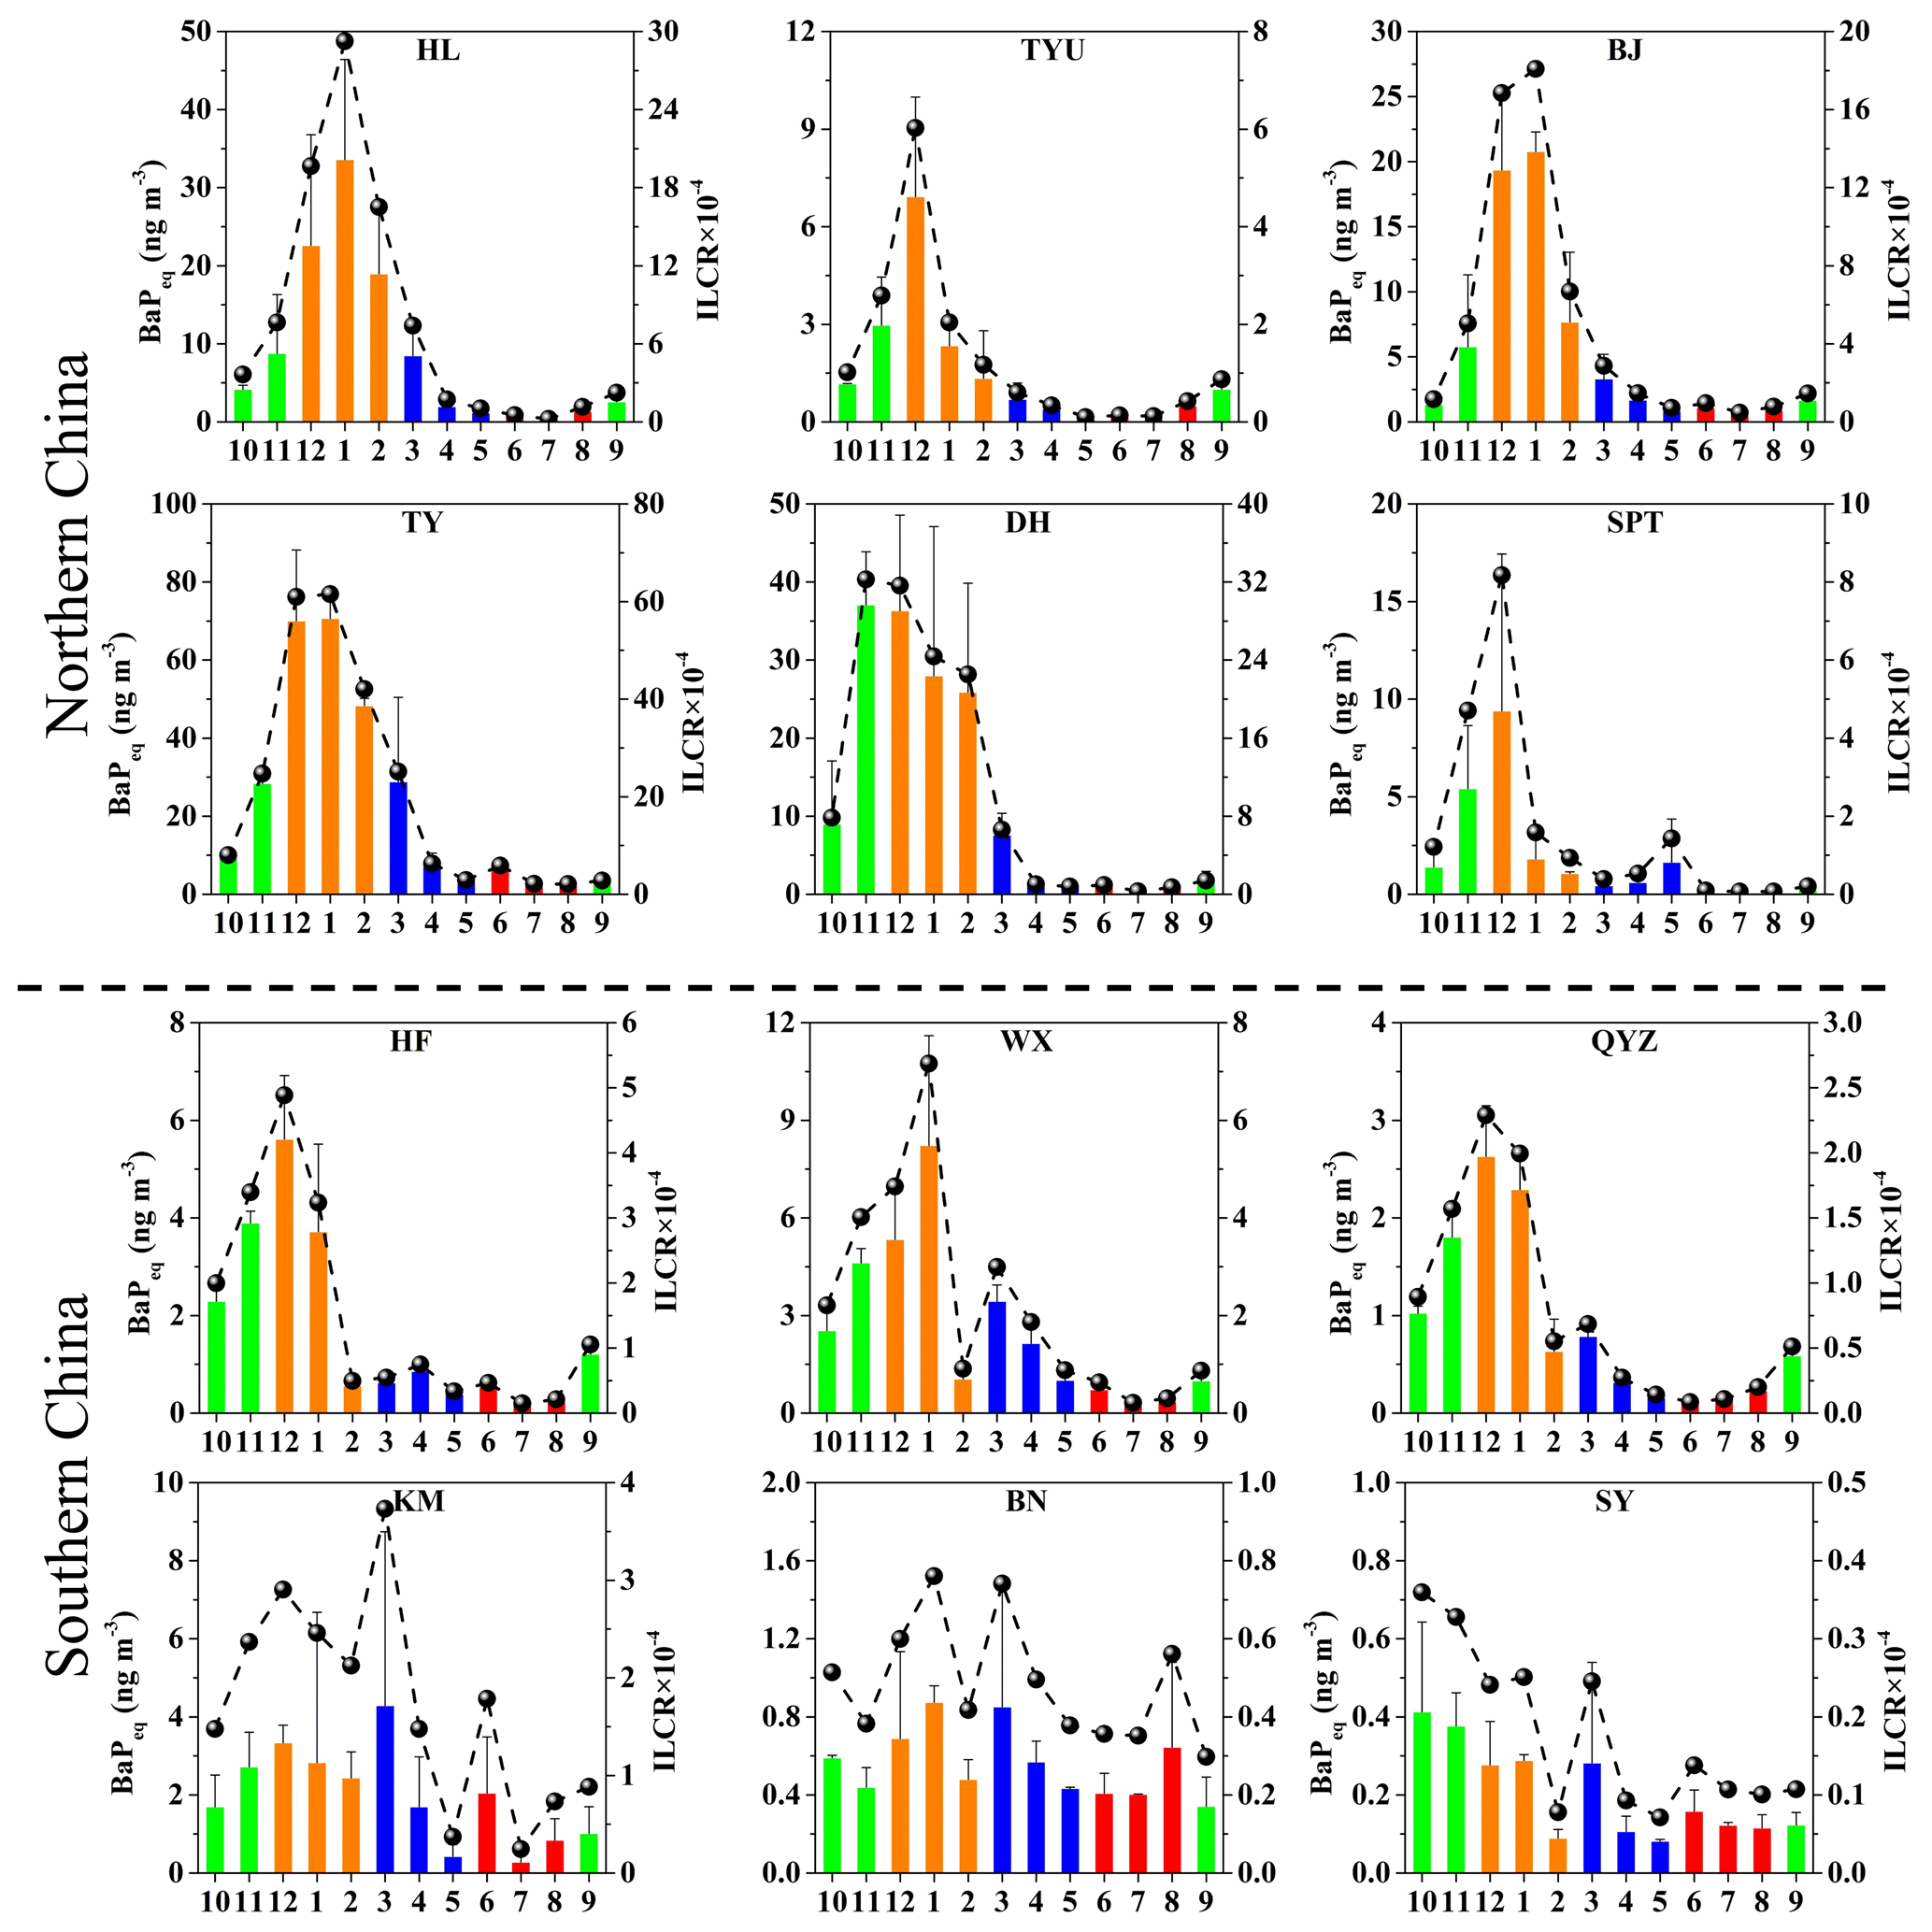
Figure 8Monthly variations of BaPeq and ILCR at sites in northern China and southern China. The green, yellow, blue and red bars represent BaPeq in fall (October–November 2012 and September 2013), winter (December 2012–February 2013), spring (March–May 2013) and summer (June–August 2013), respectively.
To further attribute PAHs' sources, we employed the PMF model to quantify source contributions to atmospheric PAHs at the 12 sites in China. Three factors were identified, and the factor profiles resolved by PMF are presented in Fig. S11. The first factor was identified as biomass burning, as it had high loadings of the biomass burning tracer levoglucosan and light-molecular-weight PAHs such as Phe, Ant, Flu and Pyr which are largely emitted from biomass burning (Li et al., 2016). The second factor was considered to be coal combustion, as it was characterized by high fractions of the coal combustion marker picene and high-molecular-weight PAHs (Shen et al., 2013b). The third factor was regarded as vehicle exhaust, as it was featured by the presence of hopanes, which are molecular markers tracking vehicle exhaust (Cass, 1998; Dai et al., 2015). As Fig. S12 shows, there was significant agreement between the predicted and measured PAHs at each site (R2 in the range of 0.78 to 0.99, p < 0.001). As the emission inventory of PAHs in China shows, residential/commercial, industrial and transportation were the major sectors of atmospheric PAHs in 2013 (Fig. S13; http://inventory.pku.edu.cn, last access: 10 March 2020). Residential/commercial and industrial sectors mainly consumed coal and biofuel, while the transportation sector consumed oil (Shen et al., 2013a). Thus, the main sources of PAHs in China were coal combustion, biomass burning and petroleum combustion (especially vehicle exhaust).
Figure 7a presents atmospheric PAHs emitted from different sources in China. In northern China, coal combustion was the major source of atmospheric PAHs (73.6 ng/m3, 84.2 % of ∑24PAHs), followed by biomass burning (11.8 ng/m3 and 13.5 %) and vehicle exhaust (2.0 ng/m3 and 2.3 %). In southern China, coal combustion (9.6 ng/m3 and 54.8 %) and biomass burning (6.8 ng/m3 and 39.0 %) were the major contributors, followed by vehicle exhaust (1.1 ng/m3 and 6.2 %). Atmospheric PAHs emitted from the three sources in northern China were all higher than those in southern China, especially from coal combustion. Thus, coal combustion was the most important source of atmospheric PAHs in China and caused large increases in PAHs' pollution in northern China. As the China Statistical Yearbook recorded (http://www.stats.gov.cn/english/Statisticaldata/AnnualData/, last access: 6 August 2020), coal was the dominant fuel in China, accounting for 70.6 % (24.1 × 10⁸ t of standard coal equivalent, SCE) of total primary energy consumption in 2012, followed by crude oil contributing 19.9 % (6.7 × 10⁸ t of SCE) and other types of energy 9.5 %, including biofuel, natural gas, hydropower, nuclear power and other power (3.2 × 10⁸ t of SCE). Although the biofuel consumption was lower than crude oil, the poor combustion conditions during residential biofuel burning could have led to higher PAHs' emissions as compared to petroleum combustion.
We further compared our results with those in the PAHs' emission inventory of China (http://inventory.pku.edu.cn, last access: 20 March 2020) (Fig. S14). Our source apportionment results focused on fuel types, while the emission inventory classified the sources into six socioeconomic sectors (residential and commercial activities, industry, energy production, agriculture, deforestation and wildfires and transportation). Since the transportation mainly used liquid petroleum (gasoline and diesel) and the rest of the sectors mainly consumed solid fuels (coal and biomass), we grouped these sectors into liquid petroleum combustion and solid fuel burning to directly compare them with our results. As Fig. S14 shows, both our observation and the emissions inventory demonstrate that the PAHs' contributions from solid fuel burning was higher in northern China, while the PAHs' contributions from liquid petroleum combustion was higher in southern China.
Atmospheric PAHs emitted from different sources at urban, suburban and remote sites (Fig. 7b) and different size particles (Fig. 7c) were discussed. At urban and suburban sites, coal combustion was the largest source of ∑24PAHs (70.4 ng/m3, 85.1 % and 30.5 ng/m3, 63.5 %), followed by biomass burning (10.1 ng/m3, 12.2 % and 16.3 ng/m3, 33.9 %) and vehicle emission (2.2 ng/m3, 2.6 % and 1.2 ng/m3, 2.5 %), while at remote sites the contributions of coal combustion (9.1 ng/m3, 50.6 %) and biomass burning (7.8 ng/m3, 43.7 %) were comparable, and vehicle emission (1.0 ng/m3, 5.7 %) had minor contributions. The major sources of ∑24PAHs varied among different size particles in northern and southern China (Fig. 7c). For PM>3.3-bound PAHs, the contributions of coal combustion (50.3 %) and biomass burning (48.4 %) were comparable in northern China, while biomass burning (71.0 %) was the largest source in southern China. For PM1.1−3.3-bound PAHs, coal combustion (66.7 %) was the dominant source in northern China, whereas the percentage of biomass burning (53.7 %) was larger than that of coal combustion (40.4 %) in southern China. For PM1.1-bound PAHs, coal combustion was the dominant source in northern (66.6 %) and southern (59.3 %) China.
Source apportionment of BaPeq in different regions (Fig. 7d), sampling sites (Fig. 7e) and size particles (Fig. 7f) were also discussed. Unlike ∑24PAHs, coal combustion was the predominant source of BaPeq in northern (8.1 ng/m3 and 95.7 %) and southern (1.1 ng/m3 and 84.7 %) China. The contributions of coal combustion at urban sites (8.3 ng/m3 and 96.4 %) were larger than those at suburban (3.3 ng/m3 and 90.8 %) and remote (1.0 ng/m3 and 82.5 %) sites. Coal combustion was the dominating source in different size particles. And its contributions to PM>3.3, PM1.1−3.3 and PM1.1-bound PAHs in northern China (87.3 %, 95.6 % and 96.9 %) were all larger than those in southern China (76.8 %, 87.3 % and 88.2 %).
In terms of incremental lifetime lung cancer risk (ILCR) induced by ambient PAHs, coal combustion was the largest source of total ILCR, accounting for 95.7 % (7.1 × 10⁻⁴) and 84.7 % (1.0 × 10⁻⁴) in northern and southern China, respectively (Fig. S15). The ILCR due to coal combustion was as high as 1.9 × 10⁻³ at the TY site in Shanxi province, which was 3 orders of magnitude higher than the acceptable risk level of 1.0 × 10⁻⁶ recommended by US EPA (1991). Shanxi province has the largest coal industry in China, including coal mining and coking production. Previous studies have reported that higher lung cancer risks occurred in Shanxi province, largely owing to the extremely high inhalation exposure of PAHs there (Xia et al., 2013; D. Liu et al., 2017; Han et al., 2020). It should be noted that although the contributions of biomass burning (2.1 %, 1.6 × 10⁻⁵ vs. 6.4 %, 7.5 × 10⁻⁶) and vehicle emission (2.2 %, 1.6 × 10⁻⁵ vs. 8.9 %, 1.0 × 10⁻⁵) to total ILCR were minor in northern and southern China, their ILCR both exceeded the acceptable risk level of 1.0 × 10⁻⁶ (US EPA, 1991). Thus, the health risks from biomass burning and vehicle emission cannot be ignored.
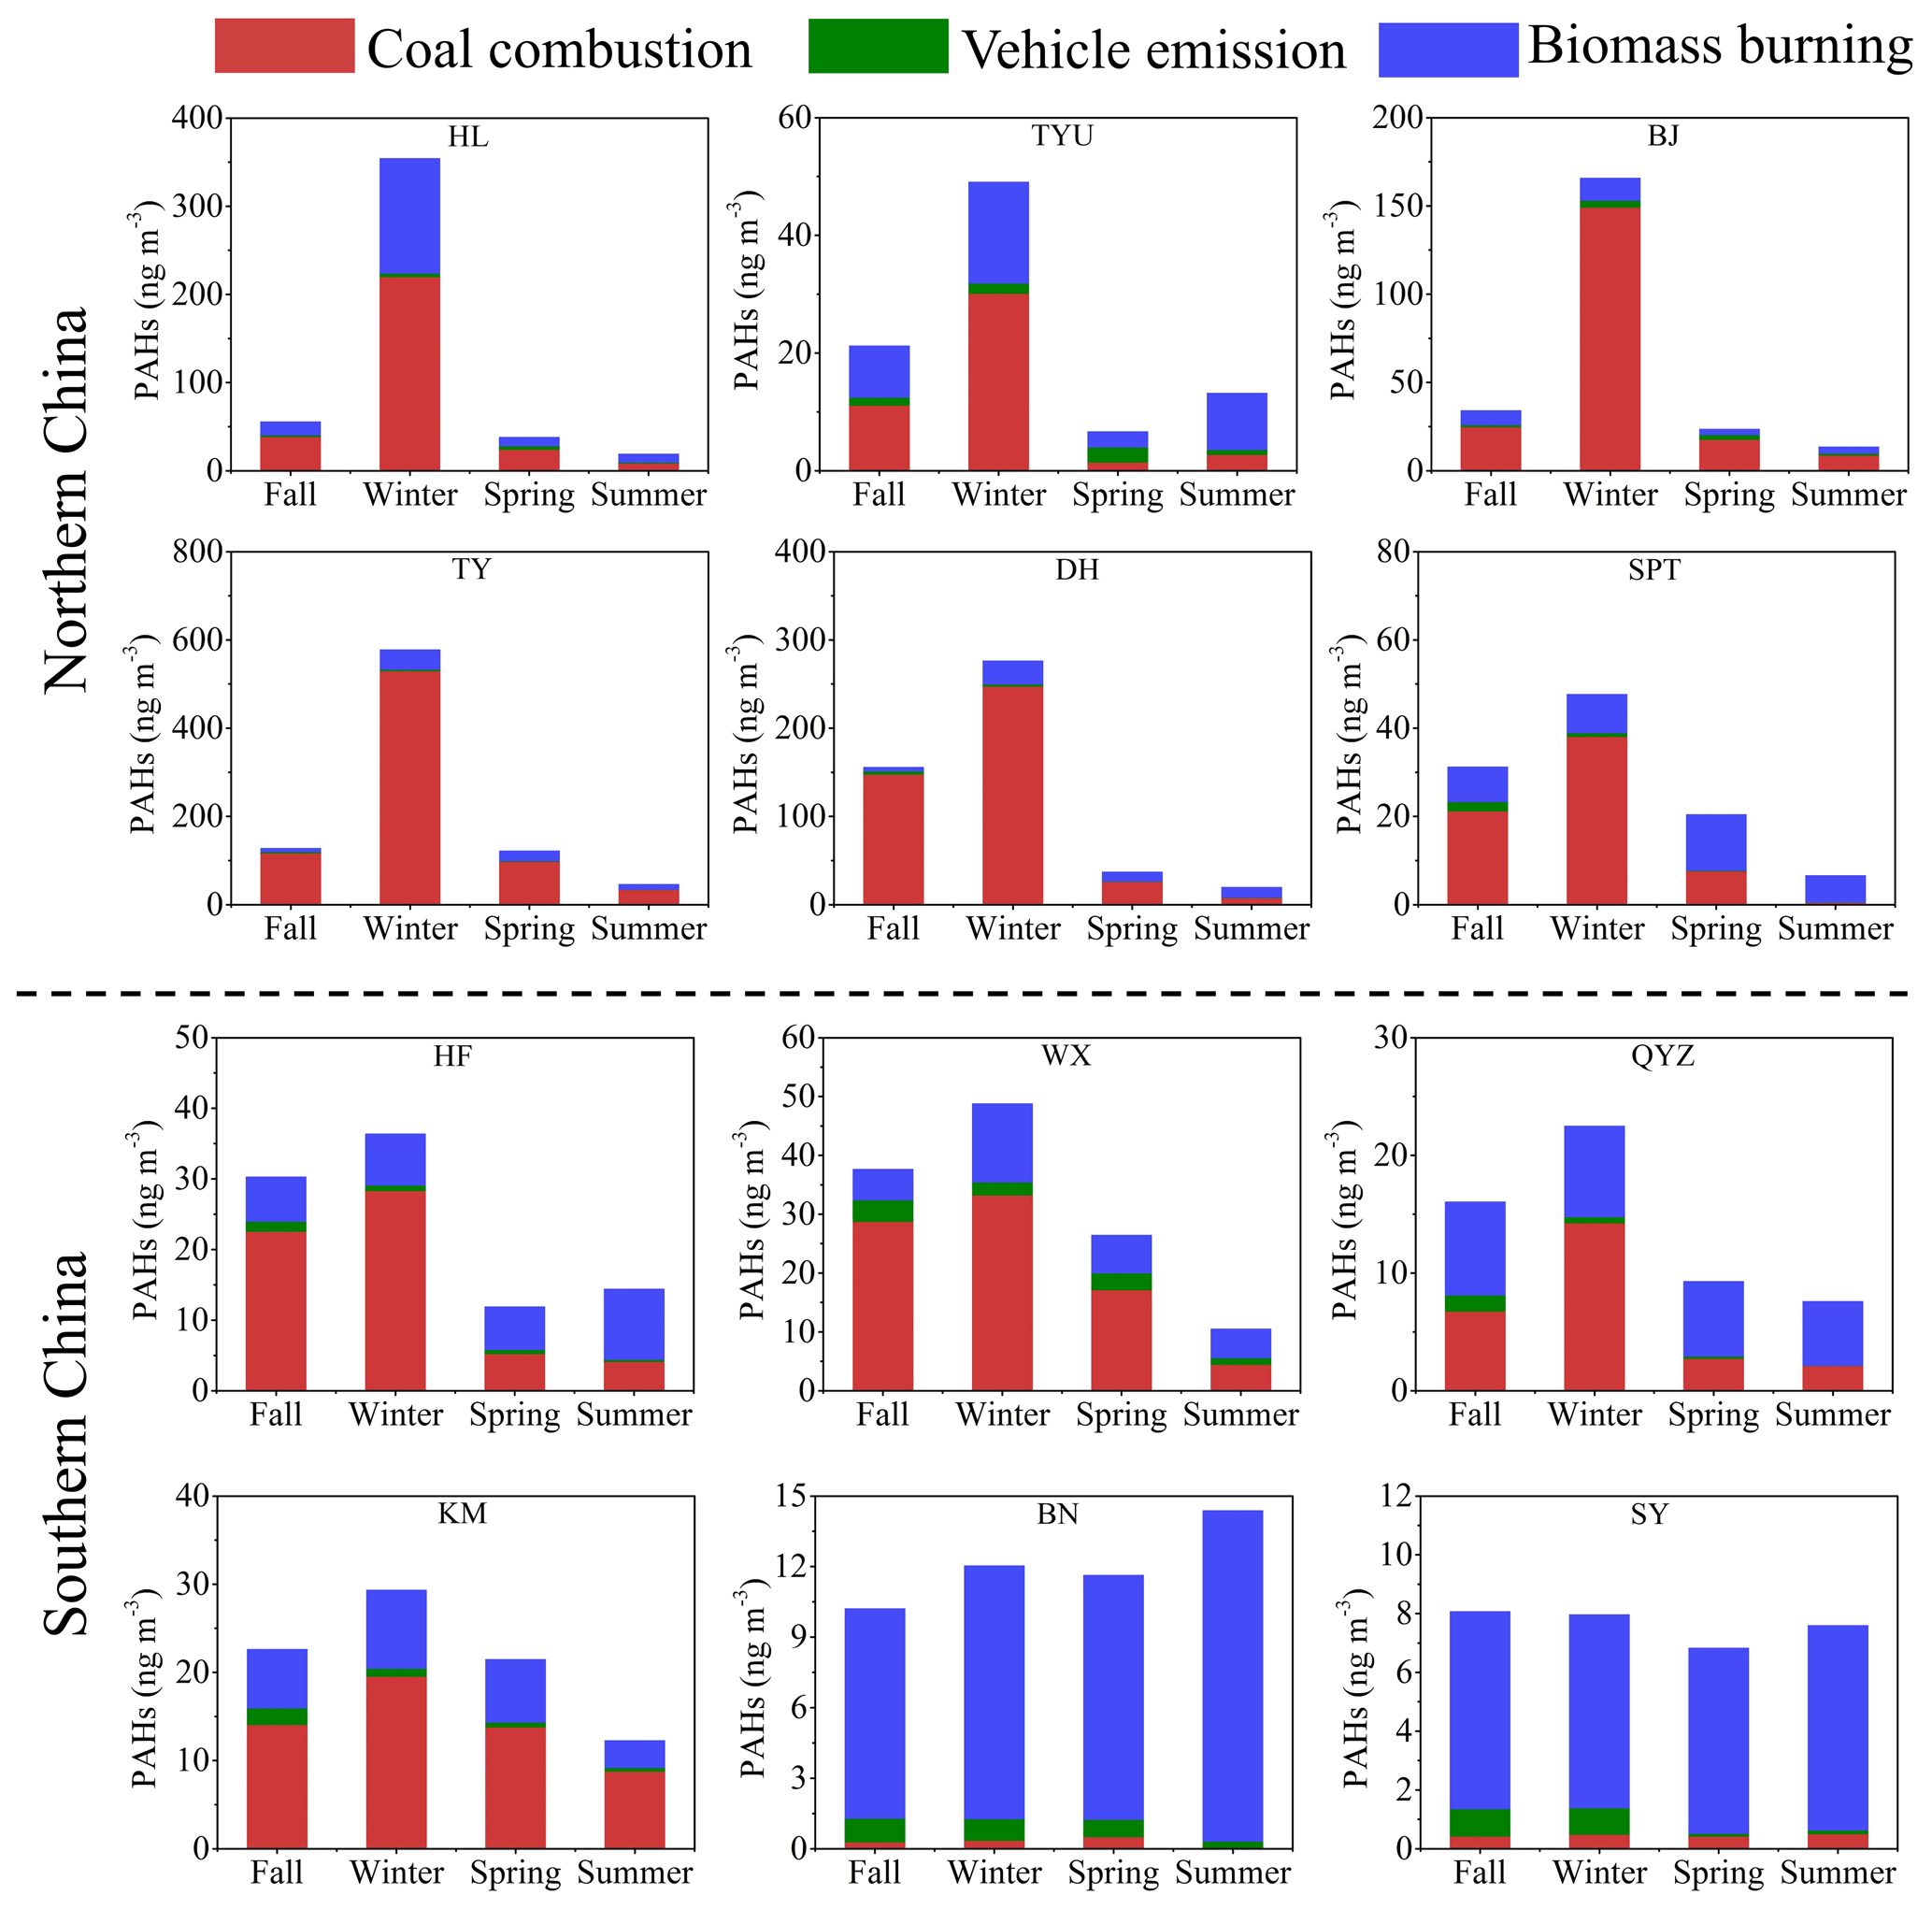
Figure S16 shows different source contributions to ILCR at the urban, suburban and remote sites. Coal combustion was the dominant source of total ILCR, which accounted for 96.4 % (7.2 × 10⁻⁴) at the urban sites, 90.8 % (2.9 × 10⁻⁴) at the suburban sites and 82.5 % (8.6 × 10⁻⁵) at the remote sites. The ILCR from biomass burning was the highest at the urban sites (1.3 × 10⁻⁵), followed by the suburban (1.2 × 10⁻⁵) and remote sites (9.5 × 10⁻⁶). For vehicle emission, the ILCR was 1.4 × 10⁻⁵, 1.7 × 10⁻⁵ and 8.7 × 10⁻⁶ at the urban, suburban and remote sites. Our results indicate that even the remote areas in China face high health risks since even the ILCR from the least contributor (e.g. 8.7 × 10⁻⁶ for vehicle emission) exceeds the acceptable risk level of 1.0 × 10⁻⁶ (US EPA, 1991).
Here, we conclude that the unfavorable meteorological conditions and intensive emission especially in coal combustion together led to severe PAHs' pollution and high cancer risk in the atmosphere of northern China.
3.4 Nationwide increase of PAHs' pollution and health risk during winter
Figure 8 exhibits monthly variations of BaPeq and ILCR at the 12 sites. BaPeq levels were the highest in winter and the lowest in summer at all sites. As Fig. 8 shows, the enhancement of BaPeq from summer to winter ranged from 1.05 (SY) to 32.5 (SPT). And such an enhancement was much more significant at the northern sites than the southern sites. Hence, ILCR was significantly enhanced in winter, especially in northern China (Fig. 8) and was much higher than the acceptable risk level of 1.0 × 10⁻⁶ in the United States (US EPA, 1991). Previous studies in different cities of China also reported such a winter high trend of atmospheric PAHs (D. Liu et al., 2017; Ma et al., 2018; Shen et al., 2019). Thus, there is a nationwide increase of PAHs' pollution during winter in China.
The winter high feature of PAHs' pollution results from the impacts of meteorological conditions and source emissions. The winter-to-summer ratios of PAHs correlated well with those for temperature (Fig. S17). And T, SR and BLH were all the lowest during winter and the highest during summer (Tables S5–S7). Coupled with the negative correlations between PAHs and meteorological factors (Fig. 4), the unfavorable meteorological conditions in wintertime did account for the increase in PAHs' pollution.
Moreover, PAHs emitted from coal combustion and biomass burning were elevated during fall–winter (Fig. 9). In northern China, central heating systems in urban areas usually start from November to the following March. Meanwhile residential heating in the rural areas of northern China consumes substantial coal and biofuel (Xue et al., 2016). Thus, the energy consumption in the residential sector is dramatically enhanced during fall–winter (Xue et al., 2016). In southern China, although there is no central heating system in urban areas, power plants and industry consume large amounts of coal. And there is also residential coal/biofuel consumption for heating during winter as well as cooking in rural areas (Zhang et al., 2013; Xu et al., 2015). In addition, open burning of agriculture residuals which accounts for a major fraction of the total biomass burning in China significantly increases during fall–winter harvest seasons in southern China (Zhang et al., 2013). Our observation and emissions inventory witnessed similar monthly trends that the PAHs from solid fuel combustion (coal and biomass) were elevated during fall–winter in northern and southern China (Fig. S18). Previous field studies also found that the contributions of coal combustion and biomass burning to PAHs were elevated during fall–winter (Lin et al., 2015a; Yu et al., 2016). Thus, we concluded that the unfavorable meteorological conditions and intensive source emission together led to the increase of PAHs' pollution during winter.
Figure S19 presents seasonal variation of ILCR from different sources. The ILCR values from three major sources were all elevated during winter. Coal combustion was the largest source of ILCR, accounting for 94.4 % (4.2 × 10⁻⁴), 94.1 % (10.8 × 10⁻⁴), 89.2 % (1.8 × 10⁻⁴) and 83.8 % (6.5 × 10⁻⁵) in fall, winter, spring and summer, respectively. The ILCR from biomass burning was highest in winter (3.7 × 10⁻⁵), followed by spring (1.1 × 10⁻⁵), fall (9.1 × 10⁻⁶) and summer (7.9 × 10⁻⁶). For vehicle emission, the ILCR was 1.6 × 10⁻⁵, 3.0 × 10⁻⁵, 1.1 × 10⁻⁵ and 4.7 × 10⁻⁶ in fall, winter, spring and summer, respectively. Our results revealed that even in summer people face high health risks since even the ILCR from the least contributor (e.g. 4.7 × 10⁻⁶ for vehicle emission) exceeds the acceptable risk level of 1.0 × 10⁻⁶ (US EPA, 1991).
The data are provided in the Supplement.
The supplement related to this article is available online at: https://doi.org/10.5194/acp-20-14581-2020-supplement.
QY analyzed the data, wrote the paper and performed data interpretation. QH and RS analyzed the samples. WY ran the PMF model and helped with the interpretation. MZ, SL and RZ provided the meteorological data and prepared the related interpretation. YZ and XB gave many suggestions about the results and discussion. YW helped with the field observation and performed data interpretation. XD, PP and XW performed data interpretation and reviewed and edited this paper.
The authors declare that they have no conflict of interest.
This article is part of the special issue “In-depth study of air pollution sources and processes within Beijing and its surrounding region (APHH-Beijing) (ACP/AMT inter-journal SI)”. It is not associated with a conference.
This research has been supported by the National Natural Science Foundation of China (grant nos. 41530641, 41961144029, 41722305, and 41907196), the National Key Research and Development Program (grant nos. 2016YFC0202204 and 2018YFC0213902), the Chinese Academy of Sciences (grant nos. XDA05100104 and QYZDJ-SSW-DQC032), and Guangdong Foundation for Science and Technology Research (grant nos. 2019B121205006, 2017BT01Z134, and 2020B1212060053).
This paper was edited by Yongjie Li and reviewed by Yingjun Chen and one anonymous referee.
Aceves, M. and Grimalt, J. O.: Seasonally dependent size distributions of aliphatic and polycyclic aromatic hydrocarbons in urban aerosols from densely populated areas, Environ. Sci. Technol., 27, 2896–2908, https://doi.org/10.1021/Es00049a033, 1993.
Armstrong, B., Hutchinson, E., Unwin, J., and Fletcher, T.: Lung cancer risk after exposure to polycyclic aromatic hydrocarbons: A review and meta-analysis, Environ. Health. Persp., 112, 970–978, https://doi.org/10.1289/ehp.6895, 2004.
Belis, C. A., Cancelinha, J., Duane, M., Forcina, V., Pedroni, V., Passarella, R., Tanet, G., Douglas, K., Piazzalunga, A., Bolzacchini, E., Sangiorgi, G., Perrone, M. G., Ferrero, L., Fermo, P., and Larsen, B. R.: Sources for PM air pollution in the Po Plain, Italy: I. Critical comparison of methods for estimating biomass burning contributions to benzo(a)pyrene, Atmos. Environ., 45, 7266–7275, https://doi.org/10.1016/j.atmosenv.2011.08.061, 2011.
Bi, X. H., Sheng, G. Y., Peng, P. A., Chen, Y. J., Zhang, Z. Q., and Fu, J. M.: Distribution of particulate- and vapor-phase n-alkanes and polycyclic aromatic hydrocarbons in urban atmosphere of Guangzhou, China, Atmos. Environ., 37, 289–298, https://doi.org/10.1016/S1352-2310(02)00832-4, 2003.
Brown, A. S., Brown, R. J. C., Coleman, P. J., Conolly, C., Sweetman, A. J., Jones, K. C., Butterfield, D. M., Sarantaridis, D., Donovan, B. J., and Roberts, I.: Twenty years of measurement of polycyclic aromatic hydrocarbons (PAHs) in UK ambient air by nationwide air quality networks, Environ. Sci.-Proc. Imp., 15, 1199–1215, https://doi.org/10.1039/c3em00126a, 2013.
Callén, M. S., Iturmendi, A., and López, J. M.: Source apportionment of atmospheric PM2.5-bound polycyclic aromatic hydrocarbons by a PMF receptor model. Assessment of potential risk for human health, Environ. Pollut., 195, 167–177, https://doi.org/10.1016/j.envpol.2014.08.025, 2014.
Cass, G. R.: Organic molecular tracers for particulate air pollution sources, Trac-Trend. Anal. Chem., 17, 356–366, https://doi.org/10.1016/S0165-9936(98)00040-5, 1998.
Chung, Y., Dominici, F., Wang, Y., Coull, B. A., and Bell, M. L.: Associations between long-term exposure to chemical constituents of fine particulate matter (PM2.5) and mortality in medicare enrollees in the eastern United States, Environ. Health Persp., 123, 467–474, https://doi.org/10.1289/ehp.1307549, 2015.
Cohen, A. J., Brauer, M., Burnett, R., Anderson, H. R., Frostad, J., Estep, K., Balakrishnan, K., Brunekreef, B., Dandona, L., Dandona, R., Feigin, V., Freedman, G., Hubbell, B., Jobling, A., Kan, H., Knibbs, L., Liu, Y., Martin, R., Morawska, L., Pope, C. A., Shin, H., Straif, K., Shaddick, G., Thomas, M., van Dingenen, R., van Donkelaar, A., Vos, T., Murray, C. J. L., and Forouzanfar, M. H.: Estimates and 25-year trends of the global burden of disease attributable to ambient air pollution: An analysis of data from the Global Burden of Diseases Study 2015, Lancet, 389, 1907–1918, https://doi.org/10.1016/S0140-6736(17)30505-6, 2017.
Dai, S., Bi, X., Chan, L. Y., He, J., Wang, B., Wang, X., Peng, P., Sheng, G., and Fu, J.: Chemical and stable carbon isotopic composition of PM2.5 from on-road vehicle emissions in the PRD region and implications for vehicle emission control policy, Atmos. Chem. Phys., 15, 3097–3108, https://doi.org/10.5194/acp-15-3097-2015, 2015.
Ding, X., Wang, X. M., Xie, Z. Q., Xiang, C. H., Mai, B. X., Sun, L. G., Zheng, M., Sheng, G. Y., Fu, J. M., and Poschl, U.: Atmospheric polycyclic aromatic hydrocarbons observed over the North Pacific Ocean and the Arctic area: Spatial distribution and source identification, Atmos. Environ., 41, 2061–2072, https://doi.org/10.1016/j.atmosenv.2006.11.002, 2007.
Ding, X., He, Q. F., Shen, R. Q., Yu, Q. Q., and Wang, X. M.: Spatial distributions of secondary organic aerosols from isoprene, monoterpenes, beta-caryophyllene, and aromatics over China during summer, J. Geophys. Res.-Atmos., 119, 11877–11891, https://doi.org/10.1002/2014JD021748, 2014.
Dong, W., Pan, L., Li, H., Miller, M. R., Loh, M., Wu, S., Xu, J., Yang, X., Shan, J., Chen, Y., Deng, F., and Guo, X.: Association of size-fractionated indoor particulate matter and black carbon with heart rate variability in healthy elderly women in Beijing, Indoor Air, 28, 373–382, https://doi.org/10.1111/ina.12449, 2018.
Duan, J. C., Bi, X. H., Tan, J. H., Sheng, G. Y., and Fu, J. M.: Seasonal variation on size distribution and concentration of PAHs in Guangzhou city, China, Chemosphere, 67, 61four–622, https://doi.org/10.1016/j.chemosphere.2006.08.030, 2007.
Gao, B., Yu, J. Z., Li, S. X., Ding, X., He, Q. F., and Wang, X. M.: Roadside and rooftop measurements of polycyclic aromatic hydrocarbons in PM2.5 in urban Guangzhou: Evaluation of vehicular and regional combustion source contributions, Atmos. Environ., 45, 718four–7191, https://doi.org/10.1016/j.atmosenv.2011.09.005, 2011.
Gao, B., Guo, H., Wang, X. M., Zhao, X. Y., Ling, Z. H., Zhang, Z., and Liu, T. Y.: Polycyclic aromatic hydrocarbons in PM2.5 in Guangzhou, southern China: Spatiotemporal patterns and emission sources, J. Hazard. Mater., 239, 78–87, https://doi.org/10.1016/j.jhazmat.2012.07.068, 2012.
Gao, B., Guo, H., Wang, X. M., Zhao, X. Y., Ling, Z. H., Zhang, Z., and Liu, T. Y.: Tracer-based source apportionment of polycyclic aromatic hydrocarbons in PM2.5 in Guangzhou, southern China, using positive matrix factorization (PMF), Environ. Sci. Pollut. R., 20, 2398–2409, https://doi.org/10.1007/s11356-012-1129-0, 2013.
Gao, B., Wang, X. M., Zhao, X. Y., Ding, X., Fu, X. X., Zhang, Y. L., He, Q. F., Zhang, Z., Liu, T. Y., Huang, Z. Z., Chen, L. G., Peng, Y., and Guo, H.: Source apportionment of atmospheric PAHs and their toxicity using PMF: Impact of gas/particle partitioning, Atmos. Environ., 103, 11four–120, https://doi.org/10.1016/j.atmosenv.2014.12.006, 2015.
Garrido, A., Jiménez-Guerrero, P., and Ratola, N.: Levels, trends and health concerns of atmospheric PAHs in Europe, Atmos. Environ., 99, 47four–484, https://doi.org/10.1016/j.atmosenv.2014.10.011, 2014.
Gu, Z. P., Feng, J. L., Han, W. L., Li, L., Wu, M. H., Fu, J. M., and Sheng, G. Y.: Diurnal variations of polycyclic aromatic hydrocarbons associated with PM2.5 in Shanghai, China, J. Environ. Sci., 22, 389–396, https://doi.org/10.1016/S1001-0742(09)60120-0, 2010.
Guo, H., Lee, S. C., Ho, K. F., Wang, X. M., and Zou, S. C.: Particle-associated polycyclic aromatic hydrocarbons in urban air of Hong Kong, Atmos. Environ., 37, 5307–5317, https://doi.org/10.1016/j.atmosenv.2003.09.011, 2003.
Han, F., Guo, H., Hu, J., Zhang, J., Ying, Q., and Zhang, H.: Sources and health risks of ambient polycyclic aromatic hydrocarbons in China, Sci. Total Environ., 698, 134229, https://doi.org/10.1016/j.scitotenv.2019.134229, 2020.
Hayakawa, K., Tang, N., Nagato, E. G., Toriba, A., Sakai, S., Kano, F., Goto, S., Endo, O., Arashidani, K.-i., and Kakimoto, H.: Long term trends in atmospheric concentrations of polycyclic aromatic hydrocarbons and nitropolycyclic aromatic hydrocarbons: A study of Japanese cities from 1997 to 2014, Environ. Pollut., 233, 47four–482, https://doi.org/10.1016/j.envpol.2017.10.038, 2018.
He, J. B., Fan, S. X., Meng, Q. Z., Sun, Y., Zhang, J., and Zu, F.: Polycyclic aromatic hydrocarbons (PAHs) associated with fine particulate matters in Nanjing, China: Distributions, sources and meteorological influences, Atmos. Environ., 89, 207–215, https://doi.org/10.1016/j.atmosenv.2014.02.042, 2014.
Hong, W. J., Jia, H. L., Ma, W. L., Sinha, R. K., Moon, H.-B., Nakata, H., Minh, N. H., Chi, K. H., Li, W. L., Kannan, K., Sverko, E., and Li, Y. F.: Distribution, fate, inhalation exposure and lung cancer risk of atmospheric polycyclic aromatic hydrocarbons in some Asian countries, Environ. Sci. Technol., 13, 7163–7174, https://doi.org/10.1016/j.atmosenv.2006.11.002, 2016.
Huang, X. F., He, L. Y., Hu, M., and Zhang, Y. H.: Annual variation of particulate organic compounds in PM2.5 in the urban atmosphere of Beijing, Atmos. Environ., 40, 2449–2458, https://doi.org/10.1016/j.atmosenv.2005.12.039, 2006.
Inomata, Y., Kajino, M., Sato, K., Ohara, T., Kurokawa, J. I., Ueda, H., Tang, N., Hayakawa, K., Ohizumi, T., and Akimoto, H.: Emission and atmospheric transport of particulate PAHs in Northeast Asia, Environ. Sci. Technol., 46, 4941–4949, https://doi.org/10.1021/es300391w, 2012.
IARC–International Agency for Research on Cancer:Overall Evaluations of Carcinogenicity to Humans–List of All Agents, Mixtures and Exposures Evaluated to Date. WHO, Geneva, available at: http://monographs.iarc.fr (last access: 23 November 2020), 2009.
Jaward, F. M., Farrar, N. J., Harner, T., Sweetman, A. J., and Jones, K. C.: Passive air sampling of polycyclic aromatic hydrocarbons and polychlorinated naphthalenes across Europe, Environ. Toxicol. Chem., 23, 1355–1364, https://doi.org/10.1897/03-420, 2004.
John, K., Ragavan, N., Pratt, M. M., Singh, P. B., Al-Buheissi, S., Matanhelia, S. S., Phillips, D. H., Poirier, M. C., and Martin, F. L.: Quantification of phase I/II metabolizing enzyme gene expression and polycyclic aromatic hydrocarbon–DNA adduct levels in human prostate, Prostate, 69, 505–519, https://doi.org/10.1002/pros.20898, 2009.
Kim, K. H., Jahan, S. A., Kabir, E., and Brown, R. J. C.: A review of airborne polycyclic aromatic hydrocarbons (PAHs) and their human health effects, Environ. Int., 60, 71–80, https://doi.org/10.1016/j.envint.2013.07.019, 2013.
Kuo, C. Y., Hsu, Y. W., and Lee, H. S.: Study of human exposure to particulate PAHs using personal air samplers, Arch. Environ. Con. Tox., 44, 045four–0459, https://doi.org/10.1007/s0024four-002-1177-4, 2003.
Lang, C., Tao, S., Wang, X. J., Zhang, G., Li, J., and Fu, J. M.: Seasonal variation of polycyclic aromatic hydrocarbons (PAHs) in Pearl River Delta region, China, Atmos. Environ., 41, 8370–8379, https://doi.org/10.1016/j.atmosenv.2007.06.015, 2007.
Larsen, R. K. and Baker, J. E.: Source apportionment of polycyclic aromatic hydrocarbons in the urban atmosphere: A comparison of three methods, Environ. Sci. Technol., 37, 1873–1881, https://doi.org/10.1021/es0206184, 2003.
Li, H. Y., Guo, L. L., Cao, R. F., Gao, B., Yan, Y. L., and He, Q. S.: A wintertime study of PM2.5-bound polycyclic aromatic hydrocarbons in Taiyuan during 2009-2013: Assessment of pollution control strategy in a typical basin region, Atmos. Environ., 140, 40four–414, https://doi.org/10.1016/j.atmosenv.2016.06.013, 2016a.
Li, H., Li, H., Zhang, L., Cheng, M., Guo, L., He, Q., Wang, X., and Wang, Y.: High cancer risk from inhalation exposure to PAHs in Fenhe Plain in winter: A particulate size distribution-based study, Atmos. Environ., 216, 116924, https://doi.org/10.1016/j.atmosenv.2019.116924, 2019.
Li, J., Zhang, G., Li, X. D., Qi, S. H., Liu, G. Q., and Peng, X. Z.: Source seasonality of polycyclic aromatic hydrocarbons (PAHs) in a subtropical city, Guangzhou, South China, Sci. Total Environ., 355, 145–155, https://doi.org/10.1016/j.scitotenv.2005.02.042, 2006.
Li, X., Yang, Y., Xu, X., Xu, C., and Hong, J.: Air pollution from polycyclic aromatic hydrocarbons generated by human activities and their health effects in China, J. Clean Prod., 112, 1360–1367, https://doi.org/10.1016/j.jclepro.2015.05.077, 2016.
Lin, Y., Ma, Y. Q., Qiu, X. H., Li, R., Fang, Y. H., Wang, J. X., Zhu, Y. F., and Hu, D.: Sources, transformation, and health implications of PAHs and their nitrated, hydroxylated, and oxygenated derivatives in PM2.5 in Beijing, J. Geophys. Res.-Atmos., 120, 7219–7228, https://doi.org/10.1002/2015JD023628, 2015a.
Lin, Y., Qiu, X. H., Ma, Y. Q., Ma, J., Zheng, M., and Shao, M.: Concentrations and spatial distribution of polycyclic aromatic hydrocarbons (PAHs) and nitrated PAHs (NPAHs) in the atmosphere of North China, and the transformation from PAHs to NPAHs, Environ. Pollut., 196, 16four–170, https://doi.org/10.1016/j.envpol.2014.10.005, 2015b.
Liu, B., Xue, Z., Zhu, X., and Jia, C.: Long-term trends (1990–2014), health risks, and sources of atmospheric polycyclic aromatic hydrocarbons (PAHs) in the U.S., Environ. Pollut., 220, 1171–1179, https://doi.org/10.1016/j.envpol.2016.11.018, 2017.
Liu, D., Lin, T., Syed, J. H., Cheng, Z. N., Xu, Y., Li, K. C., Zhang, G., and Li, J.: Concentration, source identification, and exposure risk assessment of PM2.5-bound parent PAHs and nitro-PAHs in atmosphere from typical Chinese cities, Sci. Rep.-UK, 7, 10398, https://doi.org/10.1038/s41598-017-10623-4, 2017.
Liu, S. Z., Tao, S., Liu, W. X., Liu, Y. N., Dou, H., Zhao, J. Y., Wang, L. G., Wang, J. F., Tian, Z. F., and Gao, Y.: Atmospheric polycyclic aromatic hydrocarbons in north China: A winter-time study, Environ. Sci. Technol., 41, 8256–8261, https://doi.org/10.1021/es0716249, 2007.
Liu, S. Z., Tao, S., Liu, W. X., Dou, H., Liu, Y. N., Zhao, J. Y., Little, M. G., Tian, Z. F., Wang, J. F., Wang, L. G., and Gao, Y.: Seasonal and spatial occurrence and distribution of atmospheric polycyclic aromatic hydrocarbons (PAHs) in rural and urban areas of the North Chinese Plain, Environ. Pollut., 156, 651–656, https://doi.org/10.1016/j.envpol.2008.06.029, 2008.
Liu, X., Zhang, G., Li, J., Cheng, H. R., Qi, S. H., Li, X. D., and Jones, K. C.: Polycyclic aromatic hydrocarbons (PAHs) in the air of Chinese cities, J. Environ. Monitor., 9, 1092–1098, https://doi.org/10.1039/b707977j, 2007b.
Liu, Y. J., Zhu, L. Z., and Shen, X. Y.: Polycyclic aromatic hydrocarbons (PAHs) in indoor and outdoor air of Hangzhou, China, Environ. Sci. Technol., 35, 840–844, https://doi.org/10.1021/es001354t, 2001.
Lv, Y., Li, X., Xu, T. T., Cheng, T. T., Yang, X., Chen, J. M., Iinuma, Y., and Herrmann, H.: Size distributions of polycyclic aromatic hydrocarbons in urban atmosphere: sorption mechanism and source contributions to respiratory deposition, Atmos. Chem. Phys., 16, 2971–2983, https://doi.org/10.5194/acp-16-2971-2016, 2016.
Ma, W. L., Liu, L. Y., Jia, H. L., Yang, M., and Li, Y. F.: PAHs in Chinese atmosphere Part I: Concentration, source and temperature dependence, Atmos. Environ., 173, 330–337, https://doi.org/10.1016/j.atmosenv.2017.11.029, 2018.
Ma, W. L., Zhu, F. J., Hu, P. T., Qiao, L. N., and Li, Y. F.: Gas/particle partitioning of PAHs based on equilibrium-state model and steady-state model, Sci. Total Environ., 706, 136029, https://doi.org/10.1016/j.scitotenv.2019.136029, 2020.
Mastral, A. M. and Callén, M. S.: A review on polycyclic aromatic hydrocarbon (PAH) emissions from energy generation, Environ. Sci. Technol., 34, 3051–3057, https://doi.org/10.1021/es001028d, 2000.
Nisbet, I. C. T. and Lagoy, P. K.: Toxic equivalency factors (TEFs) for polycyclic aromatic hydrocarbons (PAHs), Regul. Toxicol. Pharm., 16, 290–300, https://doi.org/10.1016/0273-2300(92)90009-X, 1992.
Polissar, A. V., Hopke, P. K., and Paatero, P.: Atmospheric aerosol over Alaska-2. Elemental composition and sources, J. Geophys. Res.-Atmos., 103, 19045–19057, https://doi.org/10.1029/98jd01212, 1998.
Shen, H. Z., Huang, Y., Wang, R., Zhu, D., Li, W., Shen, G. F., Wang, B., Zhang, Y.Y., Chen, Y. C., Lu, Y., Chen, H., Li, T. C., Sun, K., Li, B. G., Liu, W. X., Liu, J. F., and Tao, S.: Global atmospheric emissions of polycyclic aromatic hydrocarbons from 1960 to 2008 and future predictions, Environ. Sci. Technol., 47, 6415–6424, https://doi.org/10.1021/es400857z, 2013a.
Shen, G. F., Tao, S., Chen, Y. C., Zhang, Y. Y., Wei, S. Y., Xue, M., Wang, B., Wang, R., Lu, Y., Li, W., Shen, H. Z., Huang, Y., and Chen, H.: Emission characteristics for polycyclic aromatic hydrocarbons from solid fuels burned in domestic stoves in rural China, Environ. Sci. Technol., 47, 14485–14494, https://doi.org/10.1021/es403110b, 2013b.
Shen, R., Wang, Y., Gao, W., Cong, X., Cheng, L., and Li, X.: Size-segregated particulate matter bound polycyclic aromatic hydrocarbons (PAHs) over China: Size distribution, characteristics and health risk assessment, Sci. Total Environ., 685, 116–123, https://doi.org/10.1016/j.scitotenv.2019.05.436, 2019.
Shrivastava, M., Lou, S., Zelenyuk, A., Easter, R. C., Corley, R. A., Thrall, B. D., Rasch, P. J., Fast, J. D., Massey Simonich, S. L., Shen, H., and Tao, S.: Global long-range transport and lung cancer risk from polycyclic aromatic hydrocarbons shielded by coatings of organic aerosol, P. Natl. Acad. Sci. USA, 114, 1246–1251, https://doi.org/10.1073/pnas.1618475114, 2017.
Sofuoglu, A., Odabasi, M., Tasdemir, Y., Khalili, N. R., and Holsen, T. M.: Temperature dependence of gas-phase polycyclic aromatic hydrocarbon and organochlorine pesticide concentrations in Chicago air, Atmos. Environ., 35, 6503–6510, https://doi.org/10.1016/S1352-2310(01)00408-3, 2001.
Song, C. B., He, J. J., Wu, L., Jin, T. S., Chen, X., Li, R. P., Ren, P. P., Zhang, L., and Mao, H. J.: Health burden attributable to ambient PM2.5 in China, Environ. Pollut., 223, 575–586, https://doi.org/10.1016/j.envpol.2017.01.060, 2017.
Sun, P., Blanchard, P., Brice, K. A., and Hites, R. A.: Trends in polycyclic aromatic hydrocarbon concentrations in the Great Lakes atmosphere, Environ. Sci. Technol., 40, 6221–6227, https://doi.org/10.1021/es0607279, 2006.
Tan, J. H., Bi, X. H., Duan, J. C., Rahn, K. A., Sheng, G. Y., and Fu, J. M.: Seasonal variation of particulate polycyclic aromatic hydrocarbons associated with PM10 in Guangzhou, China, Atmos. Res., 80, 250–262, https://doi.org/10.1016/j.atmosres.2005.09.004, 2006.
Tang, N., Suzuki, G., Morisaki, H., Tokuda, T., Yang, X. Y., Zhao, L. X., Lin, J. M., Kameda, T., Toriba, A., and Hayakawa, K.: Atmospheric behaviors of particulate-bound polycyclic aromatic hydrocarbons and nitropolycyclic aromatic hydrocarbons in Beijing, China from 2004 to 2010, Atmos. Environ., 152, 35four–361, https://doi.org/10.1016/j.atmosenv.2016.12.056, 2017.
US EPA: Role of the baseline risk assessment in Superfund remedy-selection decisions, Office of Solid Waste and Emergency Response, Washington, USA, 1991.
Wang, G., Kawamura, K., Lee, S., Ho, K., and Cao, J.: Molecular, seasonal, and spatial distributions of organic aerosols from fourteen Chinese cities, Environ. Sci. Technol., 40, 4619–4625, https://doi.org/10.1021/es060291x, 2006.
Wang, G., Kawamura, K., Xie, M., Hu, S., Gao, S., Cao, J., An, Z., and Wang, Z.: Size-distributions of n-alkanes, PAHs and hopanes and their sources in the urban, mountain and marine atmospheres over East Asia, Atmos. Chem. Phys., 9, 8869–8882, https://doi.org/10.5194/acp-9-8869-2009, 2009.
Wang, Q. Y., Kobayashi, K., Lu, S. L., Nakajima, D., Wang, W. Q., Zhang, W. C., Sekiguchi, K., and Terasaki, M.: Studies on size distribution and health risk of 37 species of polycyclic aromatic hydrocarbons associated with fine particulate matter collected in the atmosphere of a suburban area of Shanghai city, China, Environ. Pollut., 214, 149–160, https://doi.org/10.1016/j.envpol.2016.04.002, 2016.
Wang, W. T., Simonich, S. L. M., Wang, W., Giri, B., Zhao, J. Y., Xue, M., Cao, J., Lu, X. X., and Tao, S.: Atmospheric polycyclic aromatic hydrocarbon concentrations and gas/particle partitioning at background, rural village and urban sites in the North China Plain, Atmos. Res., 99, 197–206, https://doi.org/10.1016/j.atmosres.2010.10.002, 2011.
World Health Organization (WHO): Air Quality Guidelines for Europe, 2nd Edition, World Health Organization Regional Office for Europe, Copenhagen, 2000.
Xia, Z. H., Duan, X. L., Tao, S., Qiu, W. X., Liu, D., Wang, Y. L., Wei, S. Y., Wang, B., Jiang, Q. J., Lu, B., Song, Y. X., and Hu, X. X.: Pollution level, inhalation exposure and lung cancer risk of ambient atmospheric polycyclic aromatic hydrocarbons (PAHs) in Taiyuan, China, Environ. Pollut., 173, 150–156, https://doi.org/10.1016/j.envpol.2012.10.009, 2013.
Xu, H. J., Wang, X. M., Poesch, U., Feng, S. L., Wu, D., Yang, L., Li, S. X., Song, W., Sheng, G. Y., and Fu, J. M.: Genotoxicity of total and fractionated extractable organic matter in fine air particulate matter from urban Guangzhou: Comparison between haze and nonhaze episodes, Environ. Toxicol. Chem., 27, 206–212, https://doi.org/10.1897/07-095.1, 2008.
Xu, J., Chang, S. Y., Yuan, Z. H., Jiang, Y., Liu, S. N., Li, W. Z., and Ma, L. L.: Regionalized techno-economic assessment and policy analysis for biomass molded fuel in China, Energies, 8, 13846–13863, https://doi.org/10.3390/en81212399, 2015.
Xu, S. S., Liu, W. X., and Tao, S.: Emission of polycyclic aromatic hydrocarbons in China, Environ. Sci. Technol., 40, 702–708, https://doi.org/10.1021/es0517062, 2006.
Xue, Y. F., Zhou, Z., Nie, T., Wang, K., Nie, L., Pan, T., Wu, X. Q., Tian, H. Z., Zhong, L. H., Li, J., Liu, H. J., Liu, S. H., and Shao, P. Y.: Trends of multiple air pollutants emissions from residential coal combustion in Beijing and its implication on improving air quality for control measures, Atmos. Environ., 142, 303–312, https://doi.org/10.1016/j.atmosenv.2016.08.004, 2016.
Yang, G. H., Wang, Y., Zeng, Y. X., Gao, G. F., Liang, X. F., Zhou, M. G., Wan, X., Yu, S. C., Jiang, Y. H., Naghavi, M., Vos, T., Wang, H. D., Lopez, A. D., and Murray, C. J. L.: Rapid health transition in China, 1990-2010: Findings from the Global Burden of Disease Study 2010, Lancet, 381, 1987–2015, https://doi.org/10.1016/S0140-6736(13)61097-1, 2013.
Yang, Y. Y., Guo, P. R., Zhang, Q., Li, D. L., Zhao, L., and Mu, D. H.: Seasonal variation, sources and gas/particle partitioning of polycyclic aromatic hydrocarbons in Guangzhou, China, Sci. Total Environ., 408, 2492–2500, https://doi.org/10.1016/j.scitotenv.2010.02.043, 2010.
Yin, P., Guo, J., Wang, L., Fan, W., Lu, F., Guo, M., Moreno, S. B. R., Wang, Y., Wang, H., Zhou, M., and Dong, Z.: Higher risk of cardiovascular disease associated with smaller size-fractioned particulate matter, Environ. Sci. Technol. Let., 7, 95–101, https://doi.org/10.1021/acs.estlett.9b00735, 2020.
Yu, Q. Q., Gao, B., Li, G. H., Zhang, Y. L., He, Q. F., Deng, W., Huang, Z. H., Ding, X., Hu, Q. H., Huang, Z. Z., Wang, Y. J., Bi, X. H., and Wang, X. M.: Attributing risk burden of PM2.5-bound polycyclic aromatic hydrocarbons to major emission sources: Case study in Guangzhou, south China, Atmos. Environ., 142, 313–323, https://doi.org/10.1016/j.atmosenv.2016.08.009, 2016.
Yu, Q. Q., Yang, W. Q., Zhu, M., Gao, B., Li, S., Li, G. H., Fang, H., Zhou, H. S., Zhang, H. N., Wu, Z. F., Song, W., Tan, J. H., Zhang, Y. L., Bi, X. H., Chen, L. G., and Wang, X. M.: Ambient PM2.5-bound polycyclic aromatic hydrocarbons (PAHs) in rural Beijing: Unabated with enhanced temporary emission control during the 2014 APEC summit and largely aggravated after the start of wintertime heating, Environ. Pollut., 238, 532–542, https://doi.org/10.1016/j.envpol.2018.03.079, 2018.
Yu, Y. X., Li, Q., Wang, H., Wang, B., Wang, X. L., Ren, A. G., and Tao, S.: Risk of human exposure to polycyclic aromatic hydrocarbons: A case study in Beijing, China, Environ. Pollut., 205, 70–77, https://doi.org/10.1016/j.envpol.2015.05.022, 2015.
Yunker, M. B., Macdonald, R. W., Vingarzan, R., Mitchell, R. H., Goyette, D., and Sylvestre, S.: PAHs in the Fraser River basin: A critical appraisal of PAH ratios as indicators of PAH source and composition, Org. Geochem., 33, 489–515, https://doi.org/10.1016/S0146-6380(02)00002-5, 2002.
Zelenyuk, A., Imre, D., Beranek, J., Abramson, E., Wilson, J., and Shrivastava, M.: Synergy between secondary organic aerosols and long-range transport of polycyclic aromatic hydrocarbons, Environ. Sci. Technol., 46, 12459–12466, https://doi.org/10.1021/es302743z, 2012.
Zhang, K., Zhang, B. Z., Li, S. M., Wong, C. S., and Zeng, E. Y.: Calculated respiratory exposure to indoor size-fractioned polycyclic aromatic hydrocarbons in an urban environment, Sci. Total Environ., 431, 245–251, https://doi.org/10.1016/j.scitotenv.2012.05.059, 2012.
Zhang, Y. S., Shao, M., Lin, Y., Luan, S. J., Mao, N., Chen, W. T., and Wang, M.: Emission inventory of carbonaceous pollutants from biomass burning in the Pearl River Delta Region, China, Atmos. Environ., 76, 189–199, https://doi.org/10.1016/j.atmosenv.2012.05.055, 2013.
Zhang, X. L., Tao, S., Liu, W. X., Yang, Y., Zuo, Q., and Liu, S. Z.: Source diagnostics of polycyclic aromatic hydrocarbons based on species ratios: A multimedia approach, Environ. Sci. Technol., 39, 9109–9114, https://doi.org/10.1021/es0513741, 2005.
Zhang, Y. X. and Tao, S.: Seasonal variation of polycyclic aromatic hydrocarbons (PAHs) emissions in China, Environ. Pollut., 156, 657–663, https://doi.org/10.1016/j.envpol.2008.06.017, 2008.
Zhang, Y. X. and Tao, S.: Global atmospheric emission inventory of polycyclic aromatic hydrocarbons (PAHs) for 2004, Atmos. Environ., 43, 812–819, https://doi.org/10.1016/j.atmosenv.2008.10.050, 2009.
Zhang, Y. X., Tao, S., Cao, J., and Coveney, R. M.: Emission of polycyclic aromatic hydrocarbons in China by county, Environ. Sci. Technol., 41, 683–687, https://doi.org/10.1021/es061545h, 2007.
Zhang, Y. X., Tao, S., Shen, H. Z., and Ma, J. M.: Inhalation exposure to ambient polycyclic aromatic hydrocarbons and lung cancer risk of Chinese population, P. Natl. Acad. Sci. USA, 106, 21063–21067, https://doi.org/10.1073/pnas.0905756106, 2009.
Zhang, Y. X., Shen, H. Z., Tao, S., and Ma, J. M.: Modeling the atmospheric transport and outflow of polycyclic aromatic hydrocarbons emitted from China, Atmos. Environ., 45, 2820–2827, https://doi.org/10.1016/j.atmosenv.2011.03.006, 2011.
Zhu, L. Z., Lu, H., Chen, S. G., and Amagai, T.: Pollution level, phase distribution and source analysis of polycyclic aromatic hydrocarbons in residential air in Hangzhou, China, J. Hazard. Mater., 162, 1165–1170, https://doi.org/10.1016/j.jhazmat.2008.05.150, 2009.
Zhu, Y., Tao, S., Price, O. R., Shen, H. Z., Jones, K. C., and Sweetman, A. J.: Environmental distributions of benzo[a]pyrene in China: Current and future emission reduction scenarios explored using a spatially explicit multimedia fate model, Environ. Sci. Technol., 49, 13868–13877, https://doi.org/10.1021/acs.est.5b00474, 2015.