the Creative Commons Attribution 4.0 License.
the Creative Commons Attribution 4.0 License.
 | 28 Nov 2020
Amplification of South Asian haze by water vapour–aerosol interactions
Vijayakumar Sivadasan Nair
Filippo Giorgi
Usha Keshav Hasyagar
Air pollution and wintertime fog over South Asia is a major concern due to its significant implications for air quality, visibility and health. Using a regional climate model coupled with chemistry, we assess the contribution of the hygroscopic growth of aerosols (ambient–dry) to the total aerosol optical depth and demonstrate that the increased surface cooling due to the hygroscopic effects of aerosols further increases the humidity in the boundary layer and thus enhances the confinement of pollutants through aerosol–boundary layer interactions. This positive feedback mechanism plays an important role in the prevalence of wintertime fog and poor air quality conditions over South Asia, where water vapour contributes more than half of the aerosol optical depth. The aerosol–boundary layer interactions lead to moistening of the boundary layer and drying of the free troposphere, which amplifies the long-term trend in relative humidity over the Indo-Gangetic Plain during winter. Hence, the aerosol–water vapour interaction plays a decisive role in the formation and maintenance of the wintertime fog conditions over South Asia, which needs to be considered for planning mitigation strategies.
- Article
(6567 KB) - Full-text XML
-
Supplement
(3185 KB) - BibTeX
- EndNote


South Asia experiences severe air pollution events during the winter season. Widespread haze and fog over the northern parts of the Indian subcontinent, especially the Indo-Gangetic Plain (IGP), are associated with anthropogenic activities and are noticeable even from space during the winter season (Ali et al., 2019; Gautam and Singh, 2018; Ghude et al., 2017). Poor air quality and visibility persisting throughout the winter period has been a major concern for more than 900 million people living in the IGP (Gautam and Singh, 2018; Gurjar et al., 2008; Lelieveld et al., 2015). Indeed, various studies have shown that the winter concentrations of fine particles (PM2.5) and gaseous pollutants exceed national and international air quality standards over most of the IGP region and are considered extremely hazardous for human health (Ali et al., 2019; Bharali et al., 2019; Ghude et al., 2017; Gurjar et al., 2008; Kumar et al., 2015a; Nair et al., 2007; Rengarajan et al., 2011; Safai et al., 2008). A recent estimate of premature mortality related to air pollution over India is ∼ 0.65 million per year, mostly found to occur in the IGP due to residential emissions (Lelieveld et al., 2015). Traffic disruptions and air quality alerts are quite frequent during the winter season over megacities such as Delhi, Kolkata, Karachi, Lahore and Dhaka (Ghude et al., 2017, 2008). During the last few decades, the intensity of fog and haze events has increased over the region by a factor of 3 (Ghude et al., 2017; Syed et al., 2012), which is in line with the observed increase in aerosol optical loading (2.3 % yr−1 from 1985 onwards) and surface dimming over South Asia reported from a network of radiometer observations (Babu et al., 2013).
The sources of primary emission of anthropogenic aerosols include residential, transport, industrial and agricultural sectors (Kumar et al., 2015b). The extensive burning of stubble in agricultural fields has been reported to be a major contributor to the formation of haze at the beginning of winter. Mineral-dust transport from west Asia and the Thar Desert also causes the deterioration of air quality over the region. In addition to the emission sources, low temperatures, a shallow boundary layer and low-wind-speed conditions hinder the vertical and horizontal mixing (ventilation) of aerosols, which favours the accumulation of pollutants within the boundary layer (Bharali et al., 2019; Nair et al., 2007). Even though the aerosol loading within the boundary layer is very high over the IGP, measurements on board aircraft show relatively clean free-troposphere conditions. The vertical extent of this high aerosol loading is thus limited and mostly confined to the first 2 km near the surface with an exponential decrease above the boundary layer (Babu et al., 2016). Mass concentrations of fine particles (size < 2.5 µm, PM2.5) near the surface measured by the Central Pollution Control Board (CPCB) clearly indicate the poor air quality conditions prevailing over the IGP. The seasonal mean PM2.5 values estimated over urban centres such as Delhi, Kanpur, Lucknow and Patna are higher than 150 µg m−3, and even higher values (> 300 µg m−3) are reported during fog events (Bharali et al., 2019). High aerosol loadings over the IGP prevail during most of the winter period, with more than 60 % of days being foggy (Ghude et al., 2017). The seasonal mean value of PM2.5 reported at Delhi is 3 times higher than the national standard of 60 µg m−3 for satisfactory levels of ambient air quality, and the aerosol optical depth (AOD) exceeds 1.0 quite frequently over most of the IGP region.
In contrast to the numerous studies on the effects of aerosols on the Indian summer monsoon rainfall characteristics (e.g. see references in Li et al., 2016), the impact of high wintertime aerosol loadings on regional haze and fog conditions has been little explored, although some studies have focused on the implications of regional emission sources for air quality or aerosol loading over the region. For example, Nair et al. (2007) showed that the aerosol variability over the IGP has strong relations with the boundary layer variability, whereas Bharali et al. (2019) reported that the aerosol forcing strongly influences the boundary layer evolution, thus strengthening the accumulation of pollutants near the surface. Hence, boundary layer variability affects the aerosol loading and the aerosol forcing influences the evolution of the boundary layer as reported by several studies over polluted urban centres (Bharali et al., 2019; Ding et al., 2016; Huang et al., 2014; Li et al., 2017; Tie et al., 2017). Similarly, several observational studies have investigated the correlation between meteorological parameters, especially temperature and humidity, with aerosol loadings (Kumar et al., 2015a). However, these observational studies have inherent difficulties in separating the aerosol forcing on meteorological conditions from the effects of meteorology on the aerosol loading. Generally, low temperatures and high humidity are observed over the IGP during winter, when the climate over the region is influenced by the western disturbances originating from the Mediterranean and bringing cold moist air over the aerosol-laden IGP. In addition, irrigation, water bodies (rivers and lakes) and farming activities enhance evapotranspiration and relative humidity in the lower troposphere which, together with high aerosol loadings, lead to extensive and frequent fog events over the region (Gautam et al., 2007; Ghude et al., 2017; Goswami and Sarkar, 2015; Syed et al., 2012).
The effect of aerosols on regional climates depends on the aerosol–radiation interactions, which are influenced by the water affinity of particles and the ambient relative humidity. The optical properties of aerosol (AOD, scattering and extinction coefficient) are enhanced by more than 2 times at conditions of higher relative humidity (> 80 %), which has a strong dependence on the relative dominance of organic and inorganic species (chemical composition) and size of the particles. However, the direct measurements of hygroscopic-growth functions for physical (size) or optical (scattering coefficient) properties of aerosols are limited over the Indian landmass (Mandariya et al., 2020). Even though several studies have addressed the implications of aerosols for air quality, health, and regional and global climate, there have been only very limited efforts to understand the implications of aerosol hygroscopicity on regional meteorology, visibility and air quality.
Based on these considerations, in this study, we use a regional climate model (RegCM4; Giorgi et al., 2012) coupled to air chemistry and aerosol models to assess the contribution of the aerosol hygroscopic growth to the total aerosol optical depth over the IGP. Since the total radiative impacts of aerosols on surface temperature, cloud properties and precipitation through various forcing pathways are more comprehensively explored by several studies (e.g. Li et al., 2016), we focus only on the effects of the increase in AOD due to relative humidity. Further, we quantify the effects and feedbacks of the aerosol hygroscopic growth on the regional meteorology, visibility and low-air-quality conditions over the region. The model configuration and experimental details are given in the next section.
2.1 Regional climate model (RegCM4)
For our study, we use the regional climate model version 4 (RegCM4) coupled with an atmospheric chemistry and aerosol module. RegCM4 is a limited-area model with a hydrostatic dynamical core and sigma-pressure vertical coordinates (Giorgi et al., 2012). The Coordinated Regional Downscaling Experiment (CORDEX) South Asia domain is used in this study (Fig. 1) with 50 km horizontal grid spacing, 18 vertical levels and a model top at 50 hPa (Giorgi et al., 2012; Nair et al., 2012; Usha et al., 2020). The meteorological initial and lateral boundary conditions for our simulations are provided by the ERA-Interim reanalysis (Dee et al., 2011) for the three winter seasons (December to February) from November 2014 to March 2017, where the first month of simulation (November) of each year is discarded from the analysis as model spin-up. Optimum-interpolation weekly sea surface temperature data from the National Oceanic and Atmospheric Administration (NOAA) are used as lower boundary conditions over the ocean. The parameterization schemes used in the simulations are (1) for boundary layer, the University of Washington (UW) planetary boundary layer scheme; (2) for convection over land and ocean, the Tiedtke scheme; (3) for radiative transfer, the Community Climate Model (CCM3) scheme; (4) for cloud microphysics, a subgrid explicit moisture scheme; and (5) for land surface, the Biosphere–Atmosphere Transfer Scheme. More details on the model configurations and physics have already been discussed in earlier papers (Ajay et al., 2019; Giorgi et al., 2012; Usha et al., 2020). Note that in the validation and analysis of the model output we always consider the average over the three winter seasons unless otherwise specified.
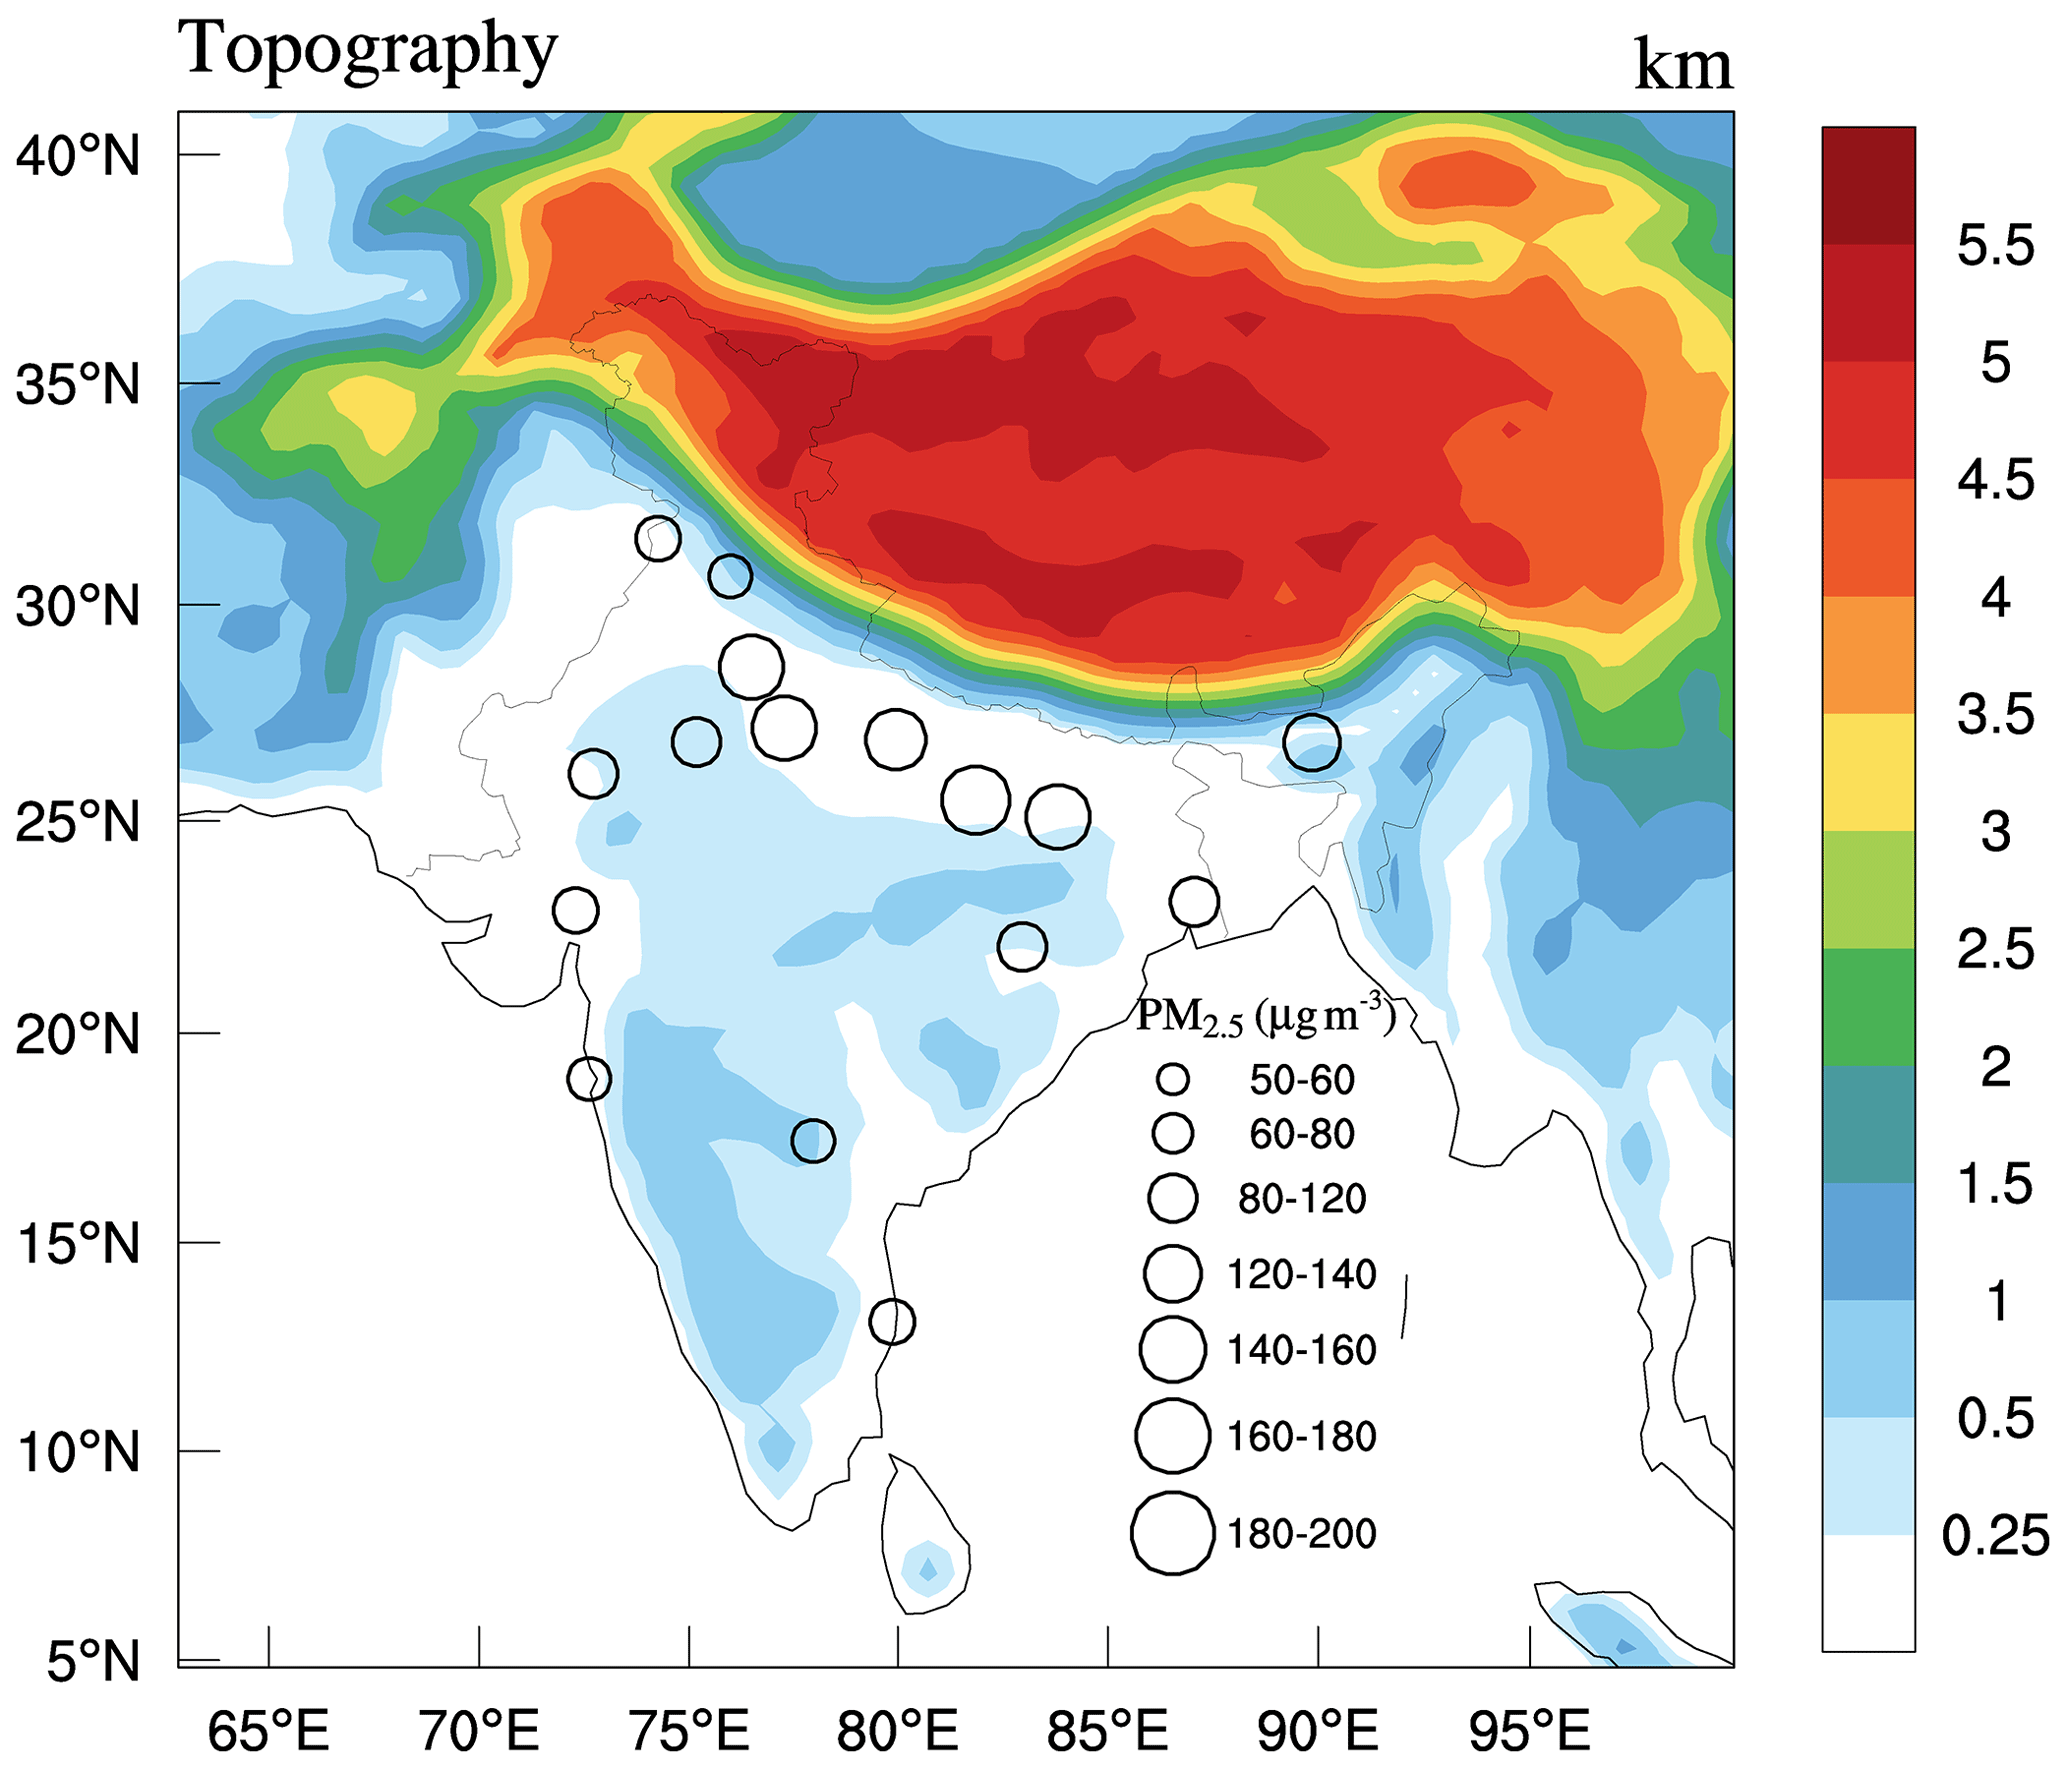
Figure 1Study domain centred over South Asia. Colour map shows the topography (km), and circles indicate the near-surface mass loading (µg m−3) of particles below the 2.5 µm size range (PM2.5). PM2.5 data are taken from the Central Pollution Control Board (CPCB), India.
RegCM4 has an online chemistry module, which is extensively used for understanding aerosol–climate interactions (Nair et al., 2012; Shalaby et al., 2012; Solmon et al., 2015). The aerosol and trace gas emission fluxes are adopted from the IIASA dataset, and chemical boundary conditions are from the global model MOZART (Model for Ozone and Related chemical Tracers). Gas-phase chemistry is based on the CBMZ (Carbon-Bond Mechanism version Z) scheme and ISORROPIA II is used for inorganic aerosols (Shalaby et al., 2012). The aerosol scheme includes sulfate, nitrate, ammonia, sea salt (two size bins), mineral dust (four size bins), black carbon (hydrophilic and hydrophobic) and organic carbon (hydrophilic and hydrophobic). The sources, sinks, atmospheric processes and transport of the aerosol species are detailed in Solmon et al. (2006) and Zakey et al. (2008). The mass concentration of each aerosol species is converted into optical properties using a mass extinction cross section, which depends on the ambient relative humidity and species-specific hygroscopic-growth functions (Solmon et al., 2006). We use the growth function described by Kiehl et al. (2000) for sulfate, nitrate and ammonia aerosols, in which the growth function increases exponentially with humidity. For example, at 80 % relative humidity, the particle mass extinction cross section increases by a factor of 3 compared to its dry value. The model emits carbonaceous aerosols as hydrophobic, and the optical properties of these carbonaceous aerosols are invariant with relative humidity. These particles change from hydrophobic to hydrophilic due to ageing at a fixed timescale of 1.15 d (∼ 27.6 h; Solmon et al., 2006). The hydrophilic part of the carbonaceous aerosols (black carbon and organic carbon) has a weak affinity to water compared to sulfate aerosols (Kasten, 1969). At 80 % relative humidity, the growth factor is 1.37 and 1.49 for hydrophilic black carbon and organic carbon, respectively. Mineral dust is considered fully hydrophobic. The sea salt size increases by 2 times at 80 % relative humidity compared to in dry conditions, but this is of little importance over the IGP during winter. In general, most of the aerosols grow with relative humidity, and this enhances the optical depth.
2.2 Experiments
RegCM4 has been widely used to investigate aerosol–hydroclimate interactions and the impacts of various forcings on monsoon characteristics (e.g. Solmon et al., 2015, and Usha et al., 2020). The model can be run with and without radiative feedbacks of aerosols. In the former case, aerosols affect the radiation balance and change the surface temperature and meteorology through direct and indirect pathways. In the latter, the aerosol radiative forcing is calculated but it does not have effects on the meteorology, surface temperature and atmospheric thermodynamics. In the present study, model simulations with (ambient) and without (dry) hygroscopic growth of aerosols are named as experiments 1 and 2, respectively. Experimental details are summarized in Table 1. In the case of the dry-aerosol simulations, we forced the aerosol hygroscopic-growth functions to be equal to 1 in the model code. The model runs without meteorological feedbacks (Exp1 and Exp2) are considered control runs for the ambient- and dry-aerosol cases. Since the effect of aerosol–radiation interactions on land and meteorological parameters are switched off (no meteorological feedback), the difference between these two experiments provides the contribution of hygroscopic growth to the aerosol properties (ΔAODRH):
Experiments 3 and 4 are similar to Exp1 and Exp2 but with meteorological feedbacks (Table 1). The difference between Exp3 and Exp4 provides the net effect of the hygroscopic growth of aerosols on the regional climate, which includes (i) changes due to the radiative forcing of the aerosol hygroscopic growth and (ii) its meteorological feedback. For example, the change in temperature (T) due to ΔAODRH and its feedback is estimated as
The effect of the total aerosol system on meteorological variables (e.g. temperature) is estimated as
The ΔTRH is a subset of ΔTaerosol.
The change in AOD solely due to the meteorological feedback of the total aerosol system (dry + hygroscopic growth) is estimated as
Hence, the AOD(Ambientfeedback) is the sum of dry AOD, its hygroscopic growth and the meteorological feedback:

2.3 Model validation
Several earlier studies have used RegCM4 to simulate the meteorology of South Asia (Ajay et al., 2019; Giorgi et al., 2012; Nair et al., 2012; Usha et al., 2020). In general, the model captures the basic features of seasonal precipitation (monsoon), though it is sensitive to the convection schemes used and the extent of the ocean–atmosphere coupling (Ajay et al., 2019; Di Sante et al., 2019). Studies on the validation of chemical constituents simulated by the model are rather limited over South Asia (Nair et al., 2012; Solmon et al., 2015; Usha et al., 2020). A qualitative inter-comparison of the chemical composition of aerosols simulated by RegCM4 with in situ measurements at distinct locations over the Indian region is shown in Fig. 2. The measurements of columnar aerosol optical depth are taken from AERONET (Aerosol Robotic Network) radiometer observations at Jaipur, Kanpur, Gandhi College and Delhi. The black carbon measurements were carried out using Aethalometers installed under the ARFI (Aerosol Radiative Forcing over India) project. Since the measurements of aerosol composition are sparse over the Indian region, we have taken values reported from earlier studies for the winter season, and therefore the organic-carbon and sulfate measurements are for different years than those of the model simulations (Ali et al., 2019; Aswini et al., 2019; George et al., 2008; Ram et al., 2010, 2012; Rengarajan et al., 2011; Safai et al., 2008; Satsangi et al., 2012). Despite these shortcomings, compared to earlier studies, the present model configuration simulates black carbon mass loading and AOD which are closer to the observed values (Nair et al., 2012). Though RegCM4 has a simple scheme for organic aerosols, the organic carbon mass concentration broadly matches the observed seasonal mean values. In fact, most climate and chemical transport models fail to capture the high aerosol loading over this region, a problem which has been mostly attributed to the parameterization of stable boundary layer conditions (Nair et al., 2012), unaccounted for emissions (e.g. Nair et al., 2012, references therein), and biases in simulating relative humidity and precipitation (Chatani and Sharma, 2018; Feng et al., 2016). In the present study, AOD and the near-surface mass concentrations of black carbon, organic carbon, sulfate and dust simulated by the model are in the range of values reported by several studies over the region. One of the main challenges in simulating the AOD over the region is the accurate simulation of relative humidity, which affects hygroscopic growth (Chatani and Sharma, 2018). The mean relative humidity estimated from several reanalysis datasets and measurements in different locations of the IGP varies from 60 % to 80 % (Chatani and Sharma, 2018; Gautam et al., 2007; Ghude et al., 2017; Goswami and Sarkar, 2015). A good agreement between measured and simulated (with aerosol feedback) relative humidity over the IGP (Fig. 2e) is important for the estimation of aerosol optical properties from simulated speciated aerosol mass concentrations. The RegCM4-simulated relative humidity values are approximately 10 % higher than the measured RH, with a mean absolute error of 6.6 % and root mean square error (RMSE) of 7.3 %. During winter, aerosols are confined within the boundary layer, and changes in the boundary layer height play a major role in the dilution (ventilation) of aerosols over the IGP (Bharali et al., 2019; Nair et al., 2012). Shallow and stable boundary layers prevail during the simulated winter seasons. A comparison with IGRA (Integrated Global Radiosonde Archive) radiosonde data indicates that the UW scheme is able to simulate the boundary layer height over the region reasonably well (Fig. 2f) with a mean absolute error of 200 m (26 % of mean boundary layer height) and RMSE of 240 m. Further intercomparison of modelled and measured PM2.5, AOD and black carbon (BC) mass concentration at various locations over the Indian region is shown in Figs. S1, S2 and S3 in the Supplement.
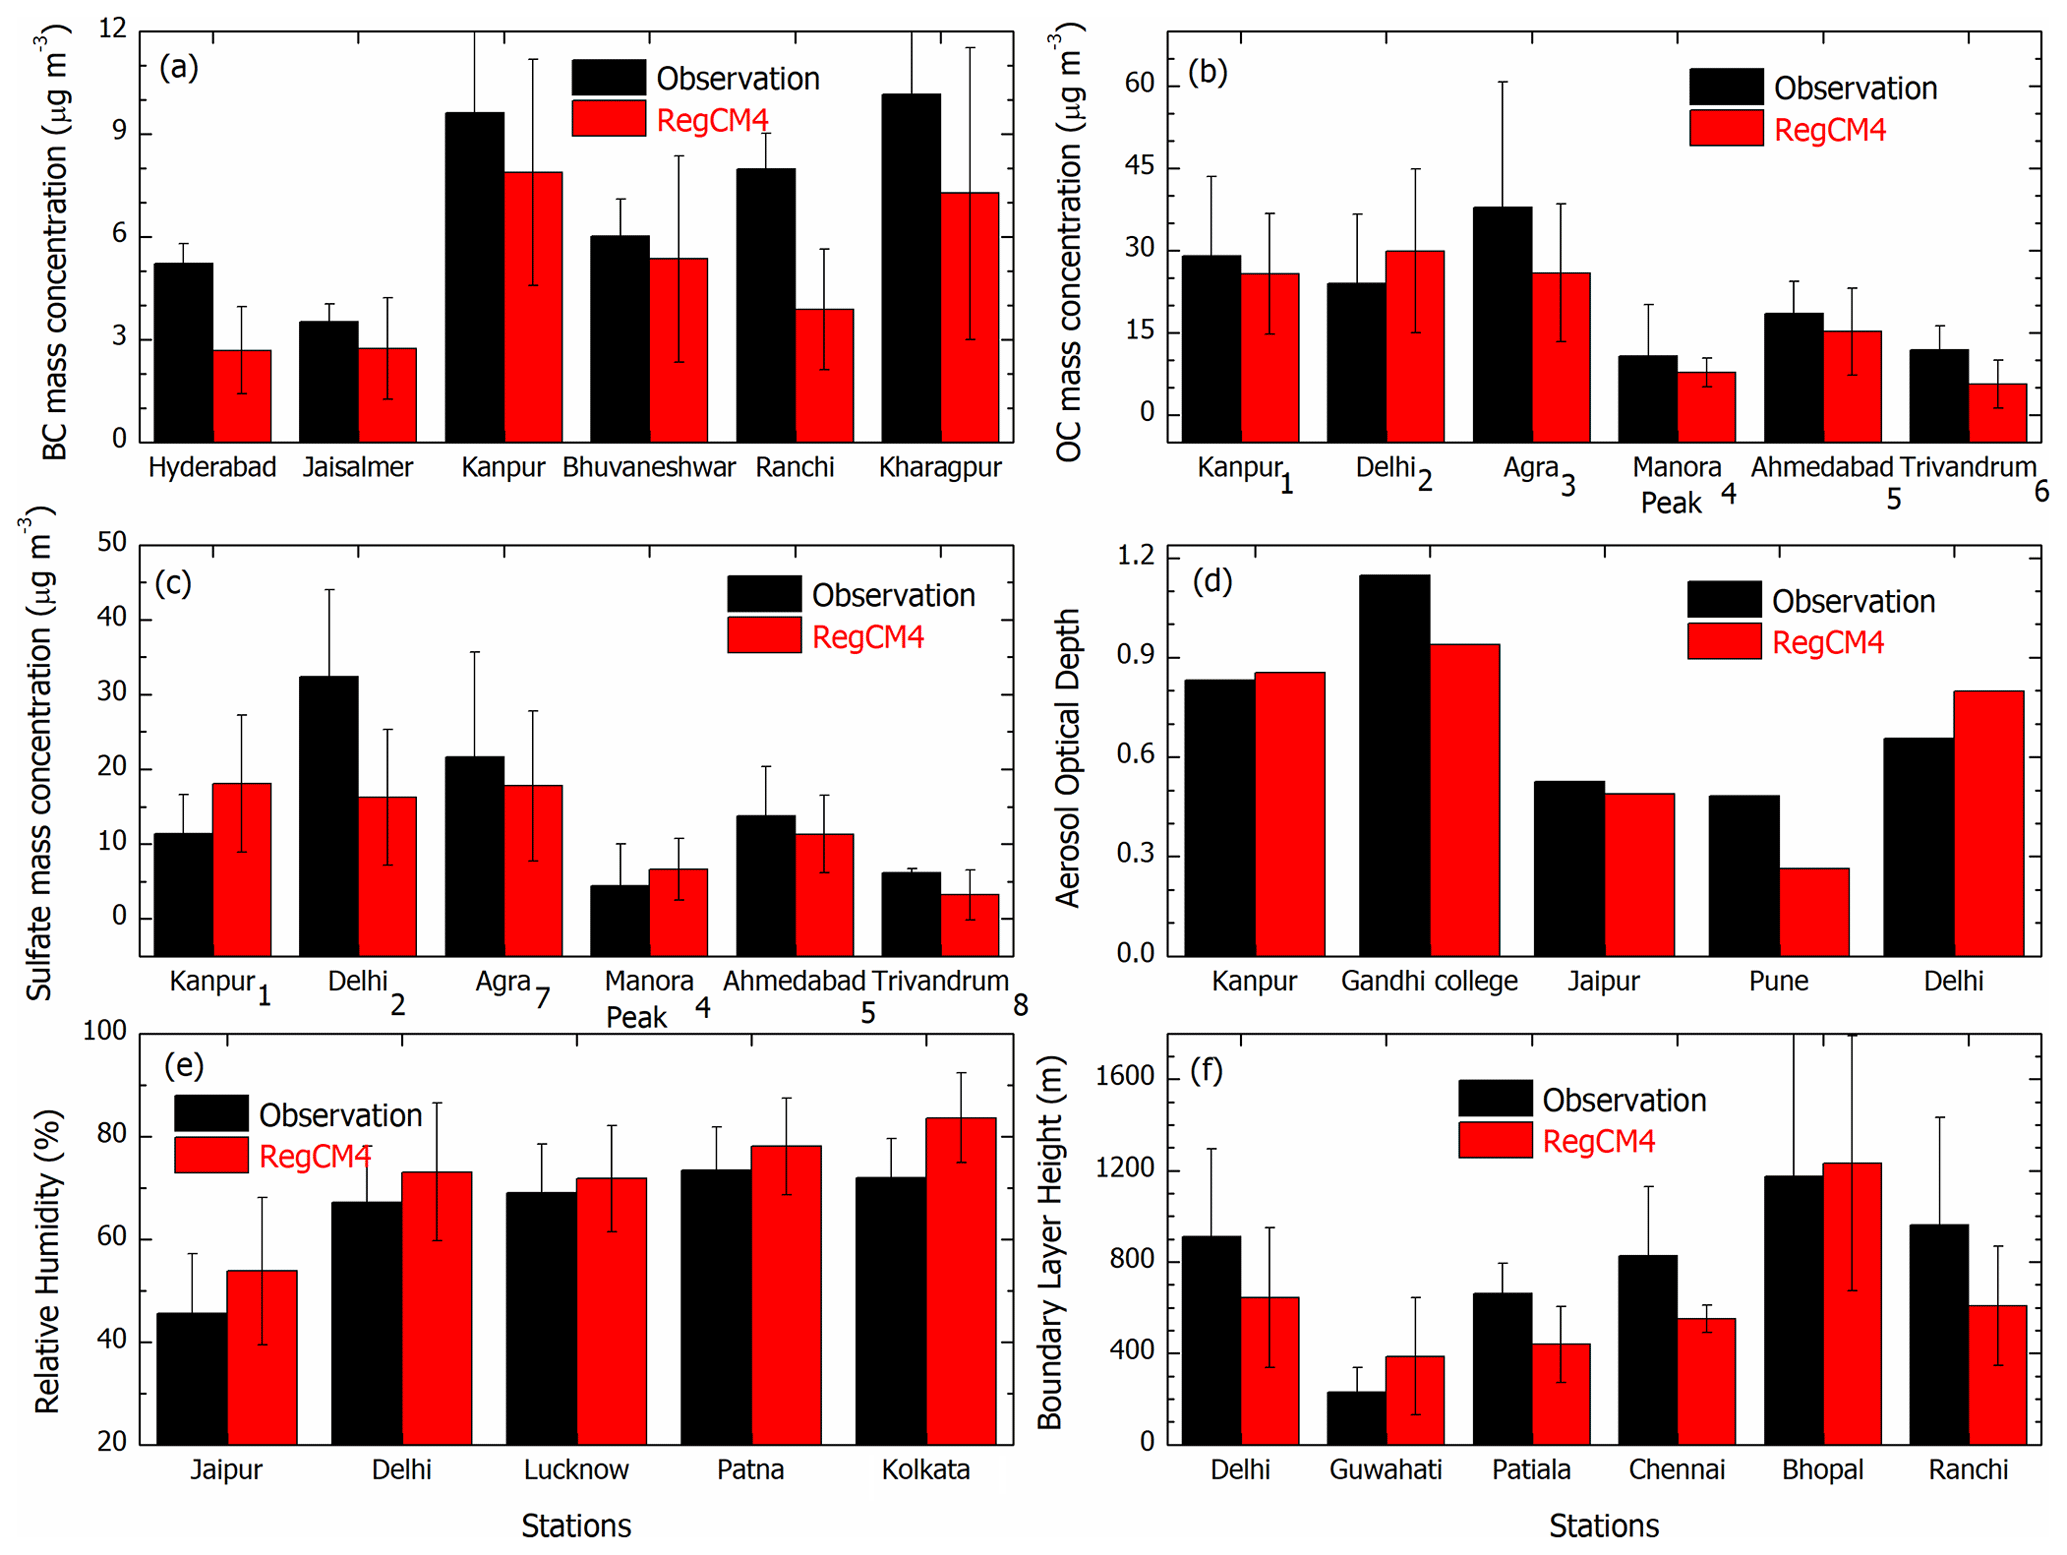
Figure 2Validation of RegCM4-simulated (Exp3) aerosol parameters (a, black carbon – BC; b, organic carbon – OC; c, sulfate; d, AOD), (e) relative humidity and (f) boundary layer height with measurements over different locations in India. The measurements of OC and sulfate mass loading are taken from earlier measurements (Kanpur1 – Ram et al., 2012; Delhi2 – Ali et al., 2019; Agra3 – Satsangi et al., 2012; Manora Peak4 – Ram et al., 2010; Ahmedabad5 – Rengarajan et al., 2011; Trivandrum6 – Aswini et al., 2019; Agra7 – Safai et al., 2008; Trivandrum8 – George et al., 2008), and these values represent the winter season but for different years than those of the model simulations.
3.1 Hygroscopic growth of aerosols
The particulate mass loadings (PM2.5) measured over most cities in the IGP during winter are well above the air quality standards, as shown in Fig. 1. The total column AOD at ambient humidity simulated by RegCM4 with meteorological feedbacks shows very high values over the IGP, mostly consisting of boundary layer aerosols. The comparison of measured and simulated AOD for dry and ambient humidity conditions (Fig. 3) over the distinct environments of the IGP indicates an almost 2-fold increase in AOD due to the hygroscopic growth of aerosols and its meteorological feedback. The mean observed AODs (simulated ambient and dry AODs) for Jaipur, Kanpur, Pune and Gandhi College are 0.53 (0.51, 0.26), 0.83 (0.81, 0.34), 0.48 (0.32, 0.15) and 1.15 (0.92, 0.36), respectively. In general, both the magnitude and large day-to-day variability in AOD (Fig. 3) are captured by the model when the hygroscopic growth (ΔAODRH) and meteorological feedback (ΔAODfeedback) are included in the simulation. Except for dust and freshly emitted black carbon, most of the aerosol species have an affinity towards water vapour, with the hygroscopic growth of inorganic aerosols such as sulfate, ammonia, nitrate and sea salt being more pronounced compared to organic carbon (Solmon et al., 2006). Due to ageing, a fraction of hydrophobic black carbon also becomes slightly hydrophilic (Solmon et al., 2006) and contributes, though not to a large extent, to the AOD at ambient humidity. Observations close to the Thar Desert (Fig. 1a, Jaipur) show lower hygroscopic growth (43 %) compared to other IGP stations because of the dominance of dust aerosols and relatively low humidity conditions prevailing there.

Figure 3Wintertime AOD measured using AERONET radiometers and simulated with RegCM4 for ambient and dry humidity conditions with meteorological feedback at (a) Jaipur, (b) Kanpur, (c) Pune and (d) Gandhi College. Stations (b) and (d) are located in the IGP, while (a) and (c) are located outside the IGP. One season (December 2015–February 2016) of data is shown here for inter-comparison; the same is the case for the other years. (e) Spatial distribution of satellite-retrieved (MODIS) aerosol optical depth at 550 nm.
Our study shows that the large day-to-day and spatial variability in AOD over the IGP is mostly contributed by relative humidity (Fig. 3), with lower contributions from changes in source characteristics and synoptic-scale circulation. The simulated AOD at ambient relative humidity matches well with the measured AOD (mean absolute error of 0.12 and RMSE of 0.15), whereas the dry AOD is significantly lower and less variable in time. The standard deviation of measured and simulated AOD at ambient humidity conditions is nearly half of the mean AODs (coefficient of variation of 50 %; Fig. 3), whereas, for dry aerosols, the standard deviation of the AOD is low (0.05 to 0.1), with a coefficient of variance ranging between 20 % and 30 %. All the meteorological conditions, associated processes (winds, chemistry, deposition and transport) and anthropogenic emissions remained the same for dry and ambient AOD simulations, except the hygroscopic growth of AOD with relative humidity for the ambient AOD. Compared to the dry AOD, the ambient AOD shows large variability associated with the variability in humidity. The AOD due to dry aerosols has 10 % to 15 % less variability compared to that of the total AOD.
The AOD due to hygroscopic growth (ΔAODRH) estimated using Eq. (1) is shown in Fig. 4a. The ΔAODRH values are high over the IGP, especially the eastern IGP and Bangladesh (ΔAODRH>0.3). The ratio of AOD(Drynofeedback) to AOD(Ambientnofeedback) shown as contours in Fig. 4a indicates that dry aerosols contribute 50 % to 60 % of the AOD over most of the Indian subcontinent (Fig. 4a), except over western India, where the contribution of hydrophobic dust to the total AOD is high even during winter. The contribution of the aerosol hygroscopic growth is more than 50 % of the total AOD over the northern Indian Ocean, which is attributed to the dominance of hydrophilic aerosols (sea salt) and high relative humidity. It is interesting to note that the increase in AOD due to hygroscopic growth (ΔAODRH= AOD(ambient) − AOD(dry)) is ∼ 0.23 over the IGP (Fig. 4a), which is higher than the global mean AOD (0.155±0.018) reported by Watson-Parris et al. (2020) using various satellite observations. Mandariya et al. (2020) have reported that wintertime aerosols over the central IGP show an increase in particle diameter of 1.34±0.07 times that of the dry particles at 85 % relative humidity. This increase in particle diameter corresponds to a doubling of the scattering coefficient for anthropogenic aerosols (McInnes et al., 1998). In the present study, the mean dry AOD increases almost 1.7 times due to relative humidity over the IGP, which is slightly lower than the estimated AOD for the hygroscopic factor reported by Mandariya et al. (2020). Since organic aerosols dominate the aerosol system over the IGP (Ram et al., 2012), there could be a substantial decrease in the hygroscopic growth of particles as discussed by several studies. Mandariya et al. (2020) have reported that 150 nm particles are more hygroscopic than 100 nm particles due to the higher organic fraction present in the 100 nm particle mass concentration. In addition, although most observational studies consider 40 % as the reference humidity level (dry) for estimating the hygroscopic growth, the model estimates the dry AOD for zero relative humidity. Titos et al. (2016) reported that the assumption of no growth at 40 % humidity contributes to higher uncertainty in the estimates of measurement-based hygroscopic growth.
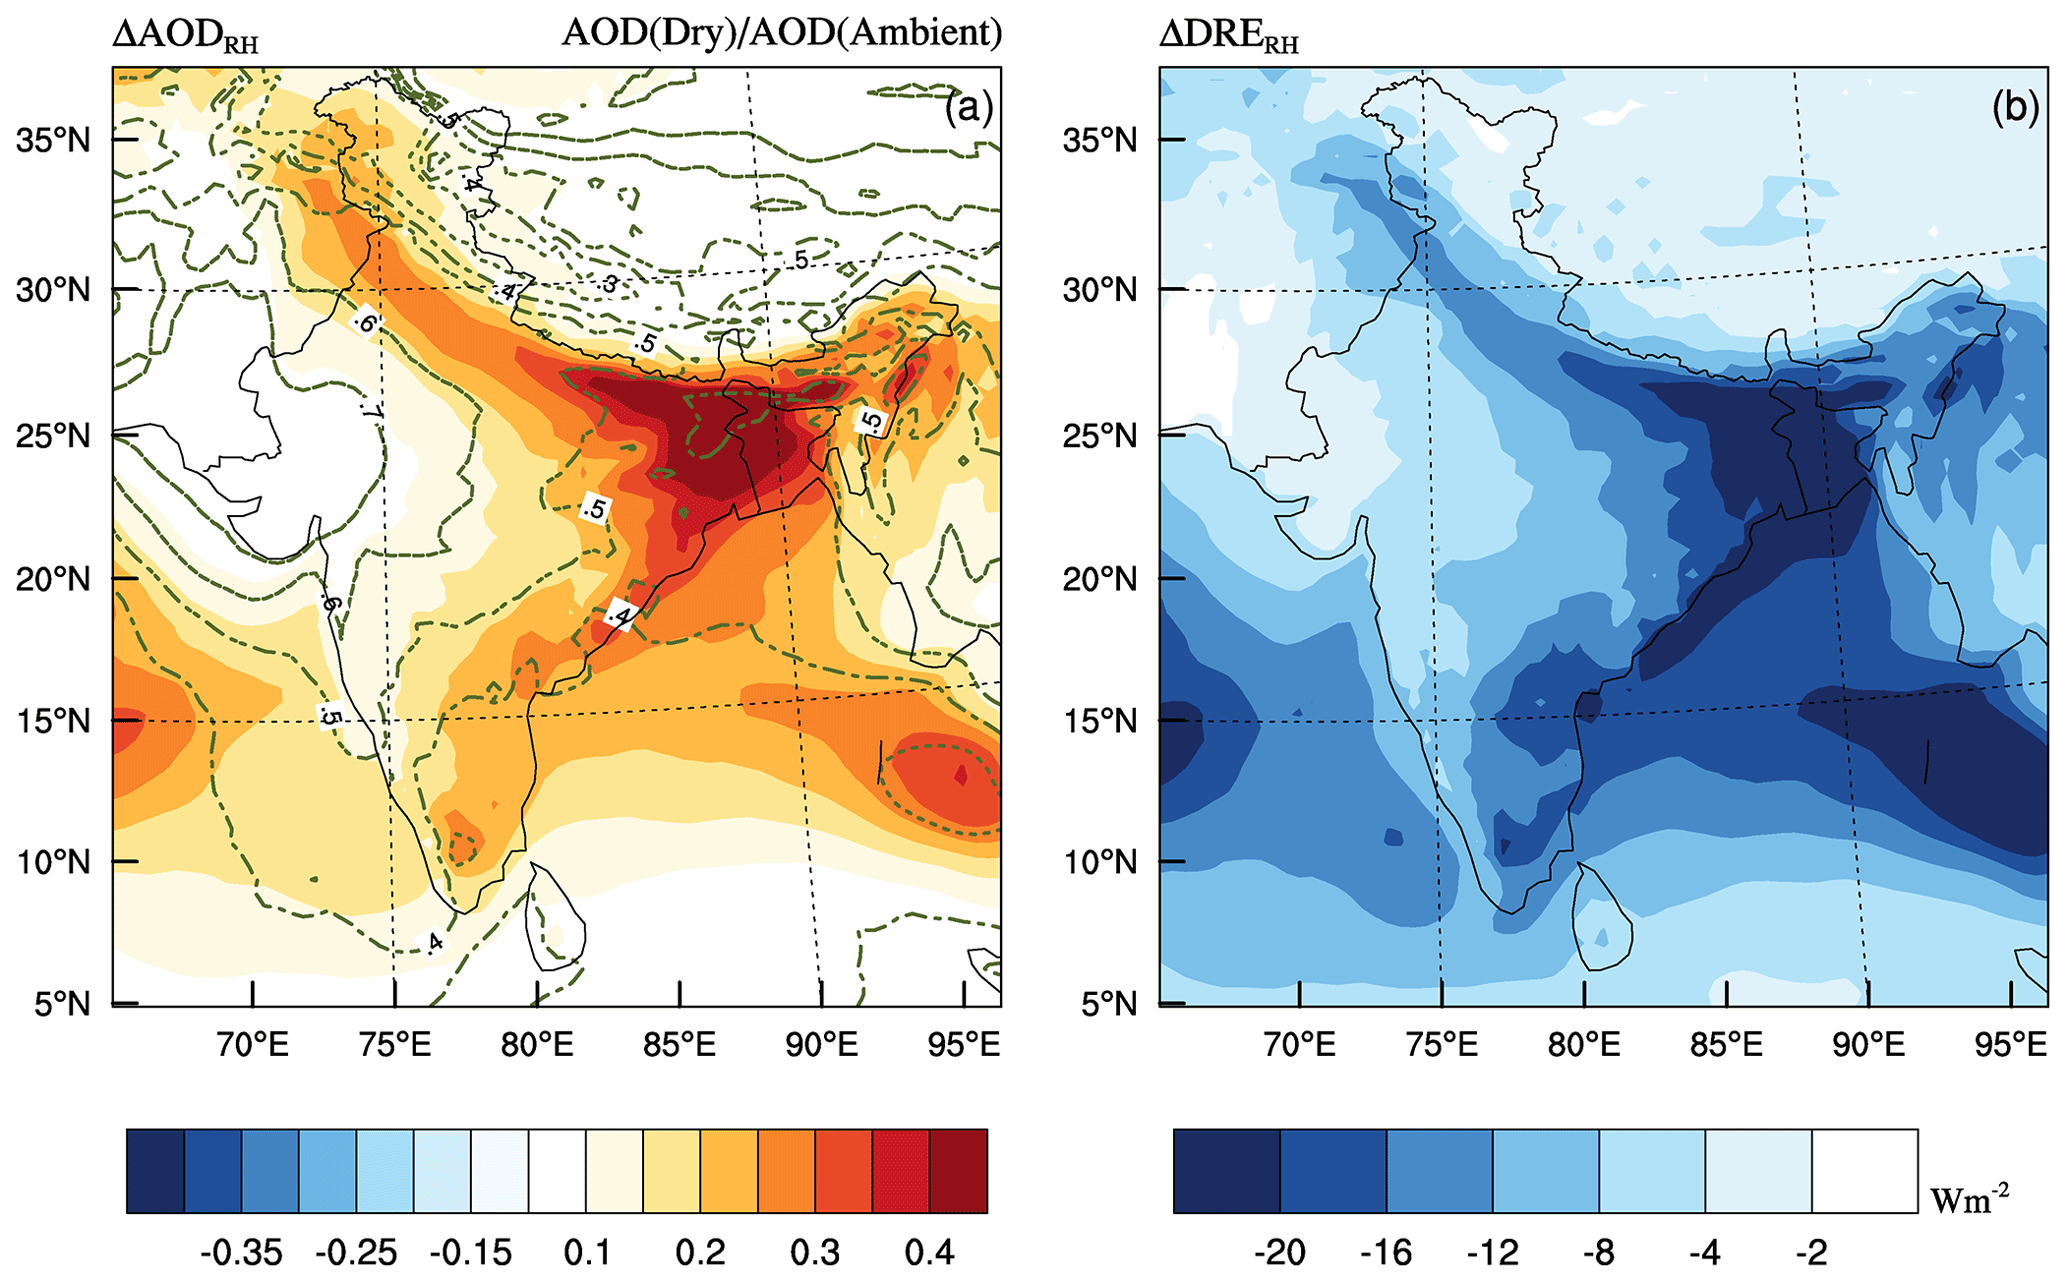
Figure 4(a) Aerosol optical depth (AOD) simulated using RegCM4 for dry and ambient humidity conditions. Colour map indicates AOD(ambient) – AOD(dry) for simulations without meteorological feedback, and line contours show AOD(dry) ∕ AOD(ambient). (b) Difference in aerosol direct radiative effects (DREs) at the surface for dry and ambient humidity conditions (without meteorological feedbacks).
In general, the mean AOD over the IGP stations (Kanpur and Gandhi College) is ∼ 0.7, indicating significant surface dimming of solar radiation (Fig. 4b). The increase in AOD due to the hygroscopic growth alone reduces the surface solar flux by 10 to 20 W m−2 over the IGP. Nair et al. (2016a) reported a mean surface forcing of W m−2 due to the total aerosol system over the entire Indian region during winter. The surface dimming due to aerosol–radiation interactions results in the reduction in surface temperature, heat fluxes (sensible and latent) and boundary layer height (Bharali et al., 2019; Ding et al., 2016; Li et al., 2017). As a result, aerosol forcing leads to the accumulation of pollutants in the boundary layer (as discussed later). Since water vapour contributes significantly to the total AOD, most of the effects of aerosols on regional climate, visibility and air quality are strongly associated with meteorological conditions.

Figure 5Change in (a) 2 m air temperature, (b) relative humidity and (c) cloud fraction solely due to the hygroscopic growth of aerosols (ambient − dry). Change in temperature, relative humidity (RH) and cloud fraction due to the total effect of aerosols (dry + hygroscopic growth) is shown in (d), (e) and (f). Dots indicate statistical significance of Student's t test at a 90 % level.
3.2 Effects on regional meteorology
The effects of the increase in AOD solely due to the hygroscopic growth of particles (ΔAODRH) on surface temperature, relative humidity and cloud fraction (Eq. 2) are illustrated in Fig. 5a–c, which shows a surface cooling of about 0.5 ∘C and a 3 % increase in relative humidity over the IGP during winter. This is mostly due to the direct solar dimming at the surface and to a cloud cover change (up to 3 %) induced by the ΔAODRH (Fig. 5c). The total effect of aerosols on temperature, relative humidity and cloud fraction (Eq. 3) is shown in Fig. 5d–f. Nearly 40 % to 50 % of the aerosol-induced surface cooling is contributed by water vapour through the hygroscopic growth of particles. The cloud cover increases by 3 % to 5 % over the IGP due to ambient aerosol forcings (Fig. 5f). These effects are more prominent over the IGP and central India, whereas high ΔAODRH and surface dimming is seen over the eastern IGP (Fig. 4). Although AOD and ΔAODRH are high, the change in relative humidity due to the hygroscopic growth of aerosols (Fig. 5b) is negligible over Bangladesh and the eastern IGP. The presence of relatively high cloud fraction over the eastern IGP mask the aerosol-induced surface cooling which is attributed to the contrast in the spatial pattern of surface temperature and AOD. The change in shortwave flux at the surface shows an almost similar pattern to that of change in temperature (Fig. S4). Bharali et al. (2019) have reported that the strength of land–atmosphere interactions through the exchange of heat and moisture fluxes plays a major role in determining the aerosol-induced dimming effects on meteorology (more details are available in Li et al., 2017). At the surface, an observed decrease in evapotranspiration (and associated rainfall) due to solar dimming further confirms a slowing down of the hydrological cycle induced by the aerosol hygroscopic growth (Liepert et al., 2004; Ramanathan, 2001). In other words, water vapour itself reduces the evaporation through dimming associated with the aerosol hygroscopic growth.
The mean vertical profiles of change in temperature and relative humidity over the IGP due to total aerosol and hygroscopic effects are shown in Fig. 6. Significant cooling and associated moistening are noticeable in the boundary layer followed by a weak drying in the lower free troposphere (1 to 3 km) and a negligible influence above (> 3 km). Based on extensive measurements from Delhi during wintertime fog campaigns, Ghude et al. (2017) have reported high values of relative humidity (70 %) within the boundary layer and dry conditions (< 20 %) above 3 km. A similar pattern is observed for specific humidity, with an increase of 0.6 g kg−1 at the surface, which confirms that the hygroscopic growth is the single largest contributor to the total aerosol effects over the IGP during winter (Fig. S5).
Aerosol-induced surface cooling and weak entrainment of dry air mass from the free troposphere lead to an increase in relative and specific humidity at the surface (Fig. 5a). Based on extensive measurements of aerosol and humidity profiles, Feng et al. (2016) reported up to 30 % underestimation of relative humidity within the boundary layer and 20 % overestimation in the free troposphere by the WRF-Chem model over a north Indian station (Nainital) during the winter season. They cited this dry bias in boundary layer humidity as one of the major reasons for the underestimation of AOD by climate models over the region. Most reanalysis datasets (National Centers for Environmental Prediction – NCEP – and European Centre for Medium-Range Weather Forecasts – ECMWF) have a negative bias (underestimate) in simulating relative humidity over this region, especially during winter (Chatani and Sharma, 2018; Feng et al., 2016), which significantly affects the simulation of aerosol optical depth, aerosol radiative forcing and fog prediction. The present study shows that the negative bias (underestimation) of relative humidity could be reduced, especially at high relative humidities (RH > 70 %), by including the meteorological feedback of ambient aerosols (Exp4). In contrast to boundary layer moistening, drying in the lower free troposphere (1.5 to 3.5 km) by 1 % to 2 % was attributed to the aerosol-induced warming, which decreases humidity and suppresses mixing of air mass between the free troposphere and boundary layer. Compared to dry conditions, the warming of the top of the boundary layer occurs at a lower altitude for ambient aerosol forcing.
We analysed reanalysis data and in situ observations for the long-term trend in wintertime relative humidity within the boundary layer and free troposphere over the IGP during the last 4 decades (Fig. 7). In contrast to the global scenario, relative humidity increased over the Indian region at the rate of 1 % per decade, together with a concurrent increase in aerosol loadings (Babu et al., 2013) and the number of foggy days (Ghude et al., 2017; Syed et al., 2012). Based on the above discussions (Fig. 6), it can be argued that the aerosol forcing contributes significantly to the observed increasing trend in wintertime moistening of the boundary layer and enhanced occurrence of fog events over the IGP. The aerosol radiative forcing increases the stability of the atmosphere and decreases the transport of moisture from the boundary layer to the free troposphere, which favours the drying trend in the lower free troposphere shown in Fig. 7b. Earlier studies have also attributed the humidification of the boundary layer and drying of the free troposphere during winter to the aerosol forcing (Li et al., 2017; Tie et al., 2017). Our analysis shows that aerosol feedback processes significantly increase the near-surface relative humidity due to weak turbulent diffusivity in the stratified boundary layer (Bharali et al., 2019; Li et al., 2017). The increase in relative humidity, when surface temperature decreases, is due to the increase in water vapour content in the atmosphere as seen in the specific humidity trend reported by Mukhopadhyay et al. (2017). In contrast to the negative trend in relative humidity in the lower free troposphere during winter (Fig. 7b), Mukhopadhyay et al. (2017) show a positive trend for annual mean humidity, which is largely dominated by the positive trend during summer. Global analyses have shown that most continental regions exhibit a long-term warming trend and decrease in relative humidity (Dai, 2006), which has strong implications for the land–ocean warming contrast (Hodnebrog et al., 2019). The long-term trend in the moistening of the boundary layer and drying of the free troposphere over the Indian region during winter is further amplified by the aerosol radiative forcing, primarily through the hygroscopic growth. However, the masking effects of surface warming by aerosols and the contribution of aerosols to the increasing trend in humidity are yet to be quantified.
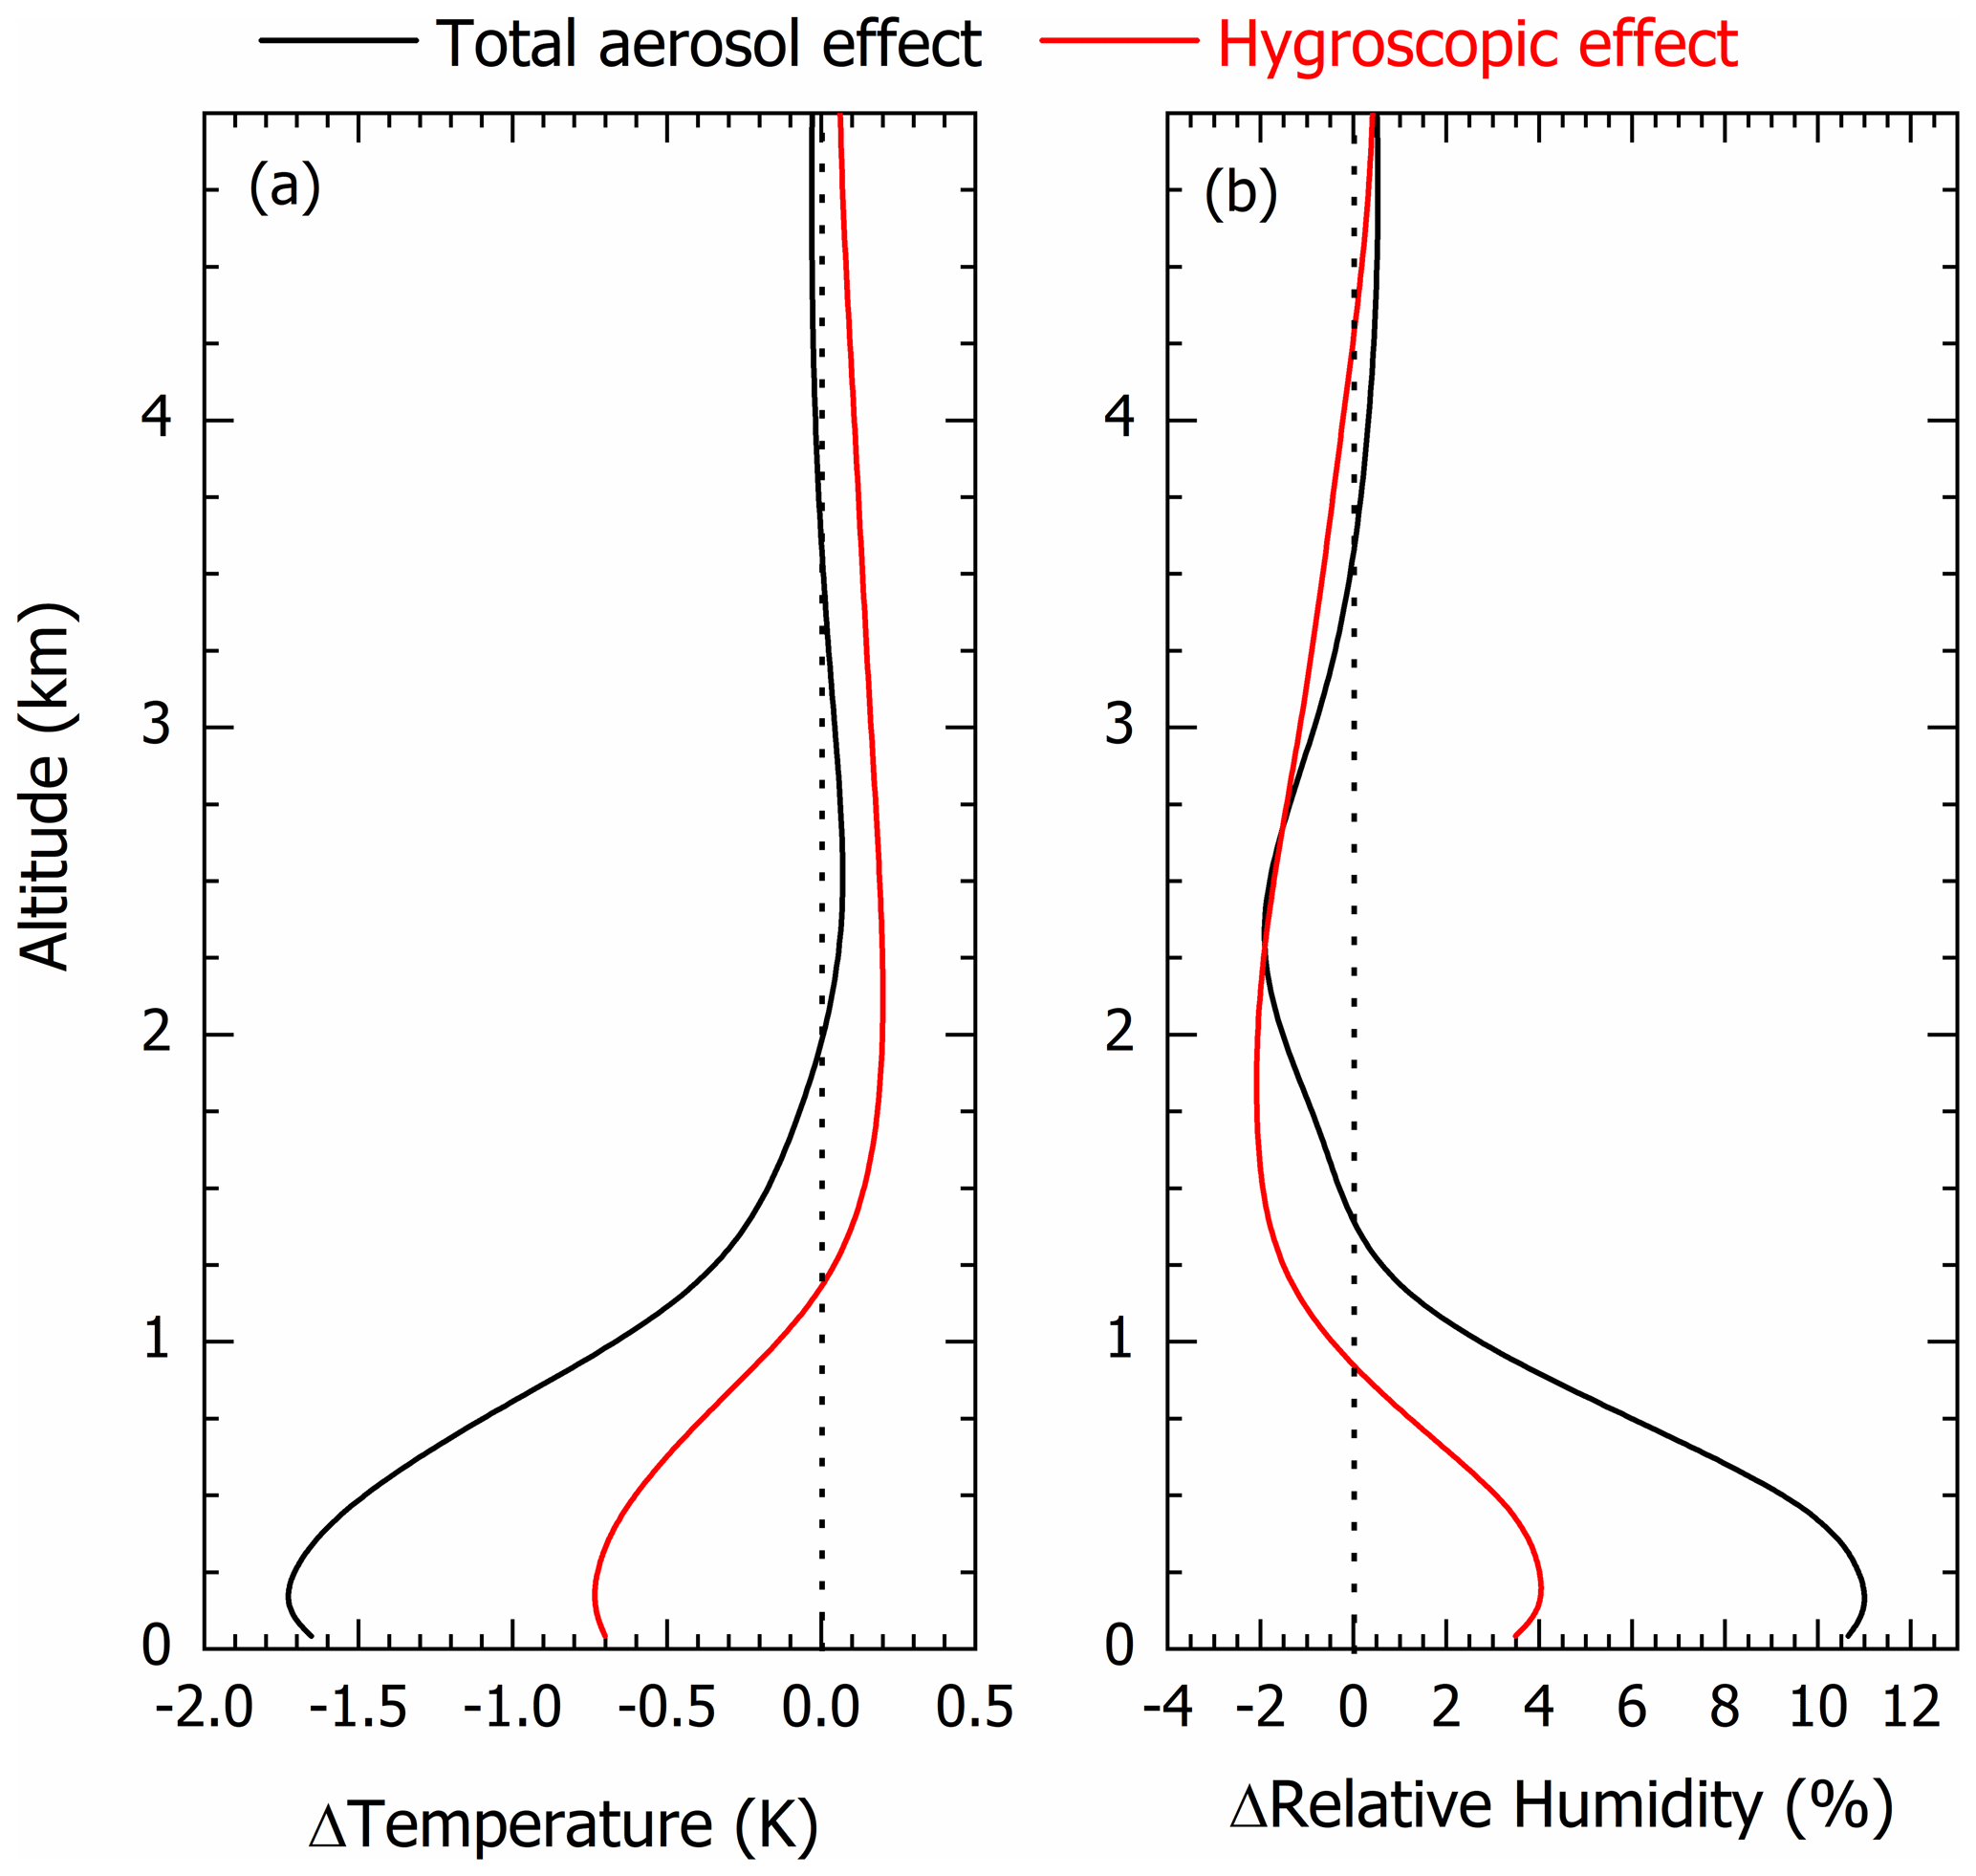
Figure 6Vertical profiles of change in relative humidity and temperature due to the total aerosol effect (Ambientfeedback − Ambientnofeedback; black line) and only due to hygroscopic growth of aerosols (Ambientfeedback − dryfeedback; red line).
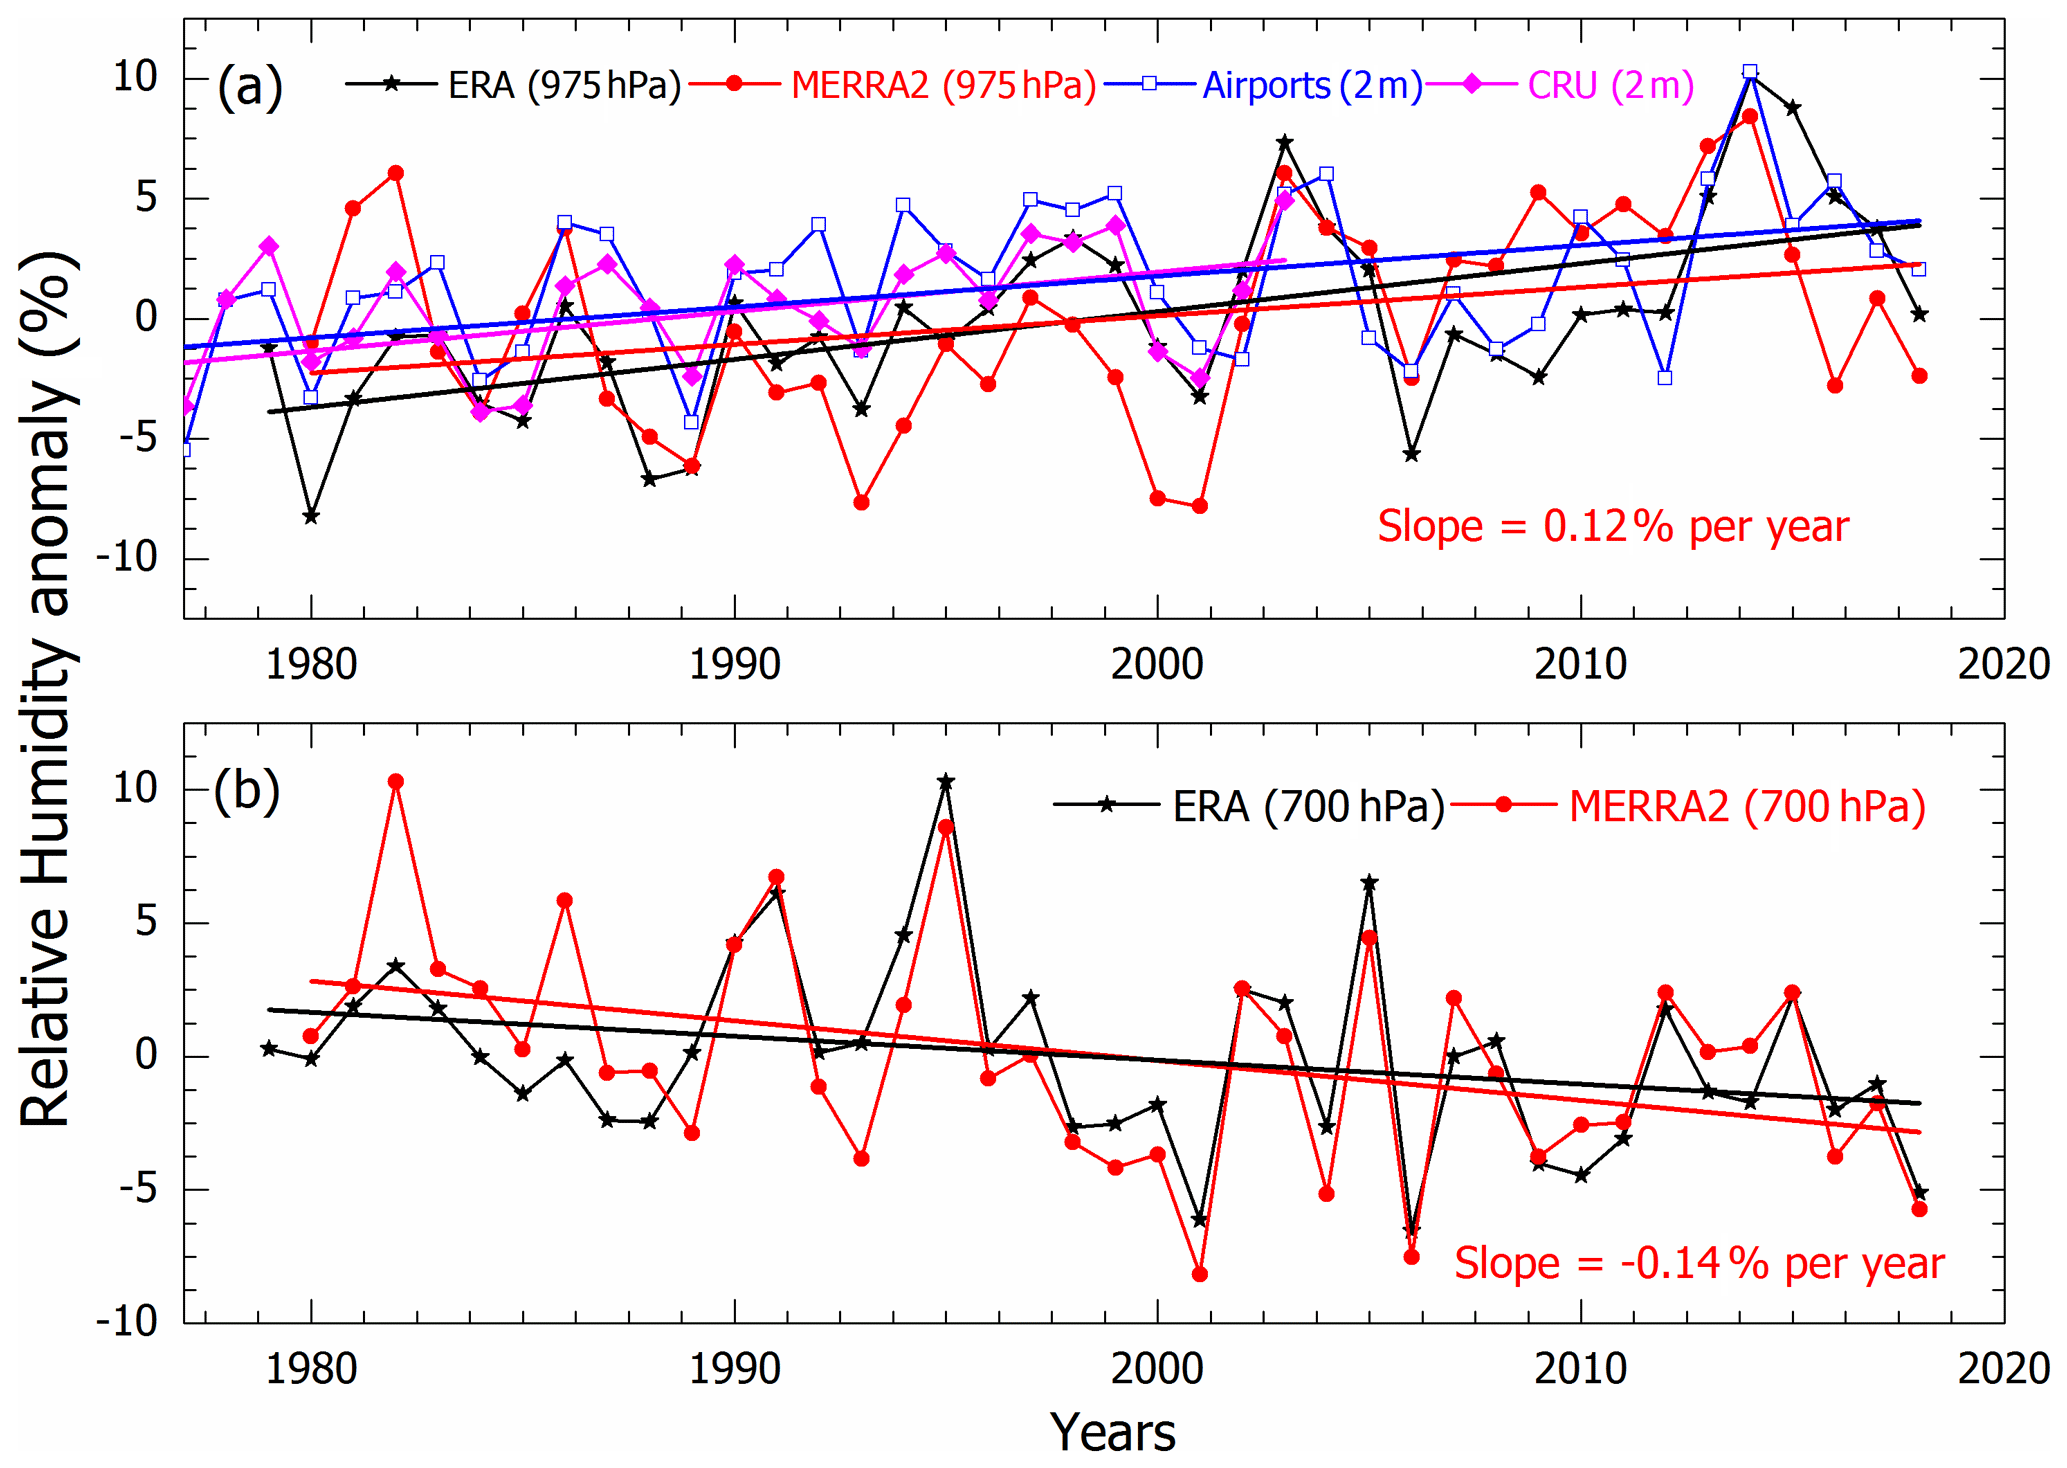
Figure 7(a) Relative humidity in the boundary layer (975 hPa) from reanalysis (interim ECMWF Re-Analysis, ERA-Interim; Modern-Era Retrospective Analysis for Research and Applications, MERRA2; and Climatic Research Unit, CRU) and in situ observations. (b) Relative humidity in the free troposphere (700 hPa) taken from reanalysis data.
3.3 Implications for visibility and air quality
A regional mean AOD increase of ∼ 0.23 is contributed by the hygroscopic growth of aerosols (Fig. 3), which further increases the AOD through meteorological feedbacks (ΔAODfeedback; Fig. 8a), whose contribution can be estimated using Eq. (4). Overall, the hygroscopic growth (ΔAODRH∼ 0.23) and associated meteorological feedback (ΔAODfeedback∼ 0.17) contribute significantly to the total AOD (0.72) over the IGP. This positive feedback is stronger over the central IGP than the eastern IGP, though the eastern IGP has higher AOD and relative humidity. The moisture content in the atmosphere increases the AOD directly by its hygroscopic effect (Fig. 3) while high AOD increases the surface relative humidity through its radiative and meteorological feedbacks (Fig. 8a). Even though the spatial patterns of change in AOD and relative humidity due to aerosol feedbacks are slightly different, the anomalies in AOD and relative humidity show a significant correlation over most of the Indian subcontinent, especially over the IGP (Fig. 8b). Since the aircraft and lidar observations over the IGP clearly showed that aerosols are mostly confined within the boundary layer during the winter season with lower contributions from the free tropospheric aerosols (Nair et al., 2016b), we have used AOD and surface-level parameters like PM2.5, and visibility to investigate the implications of aerosol-induced forcing on air quality and visibility.
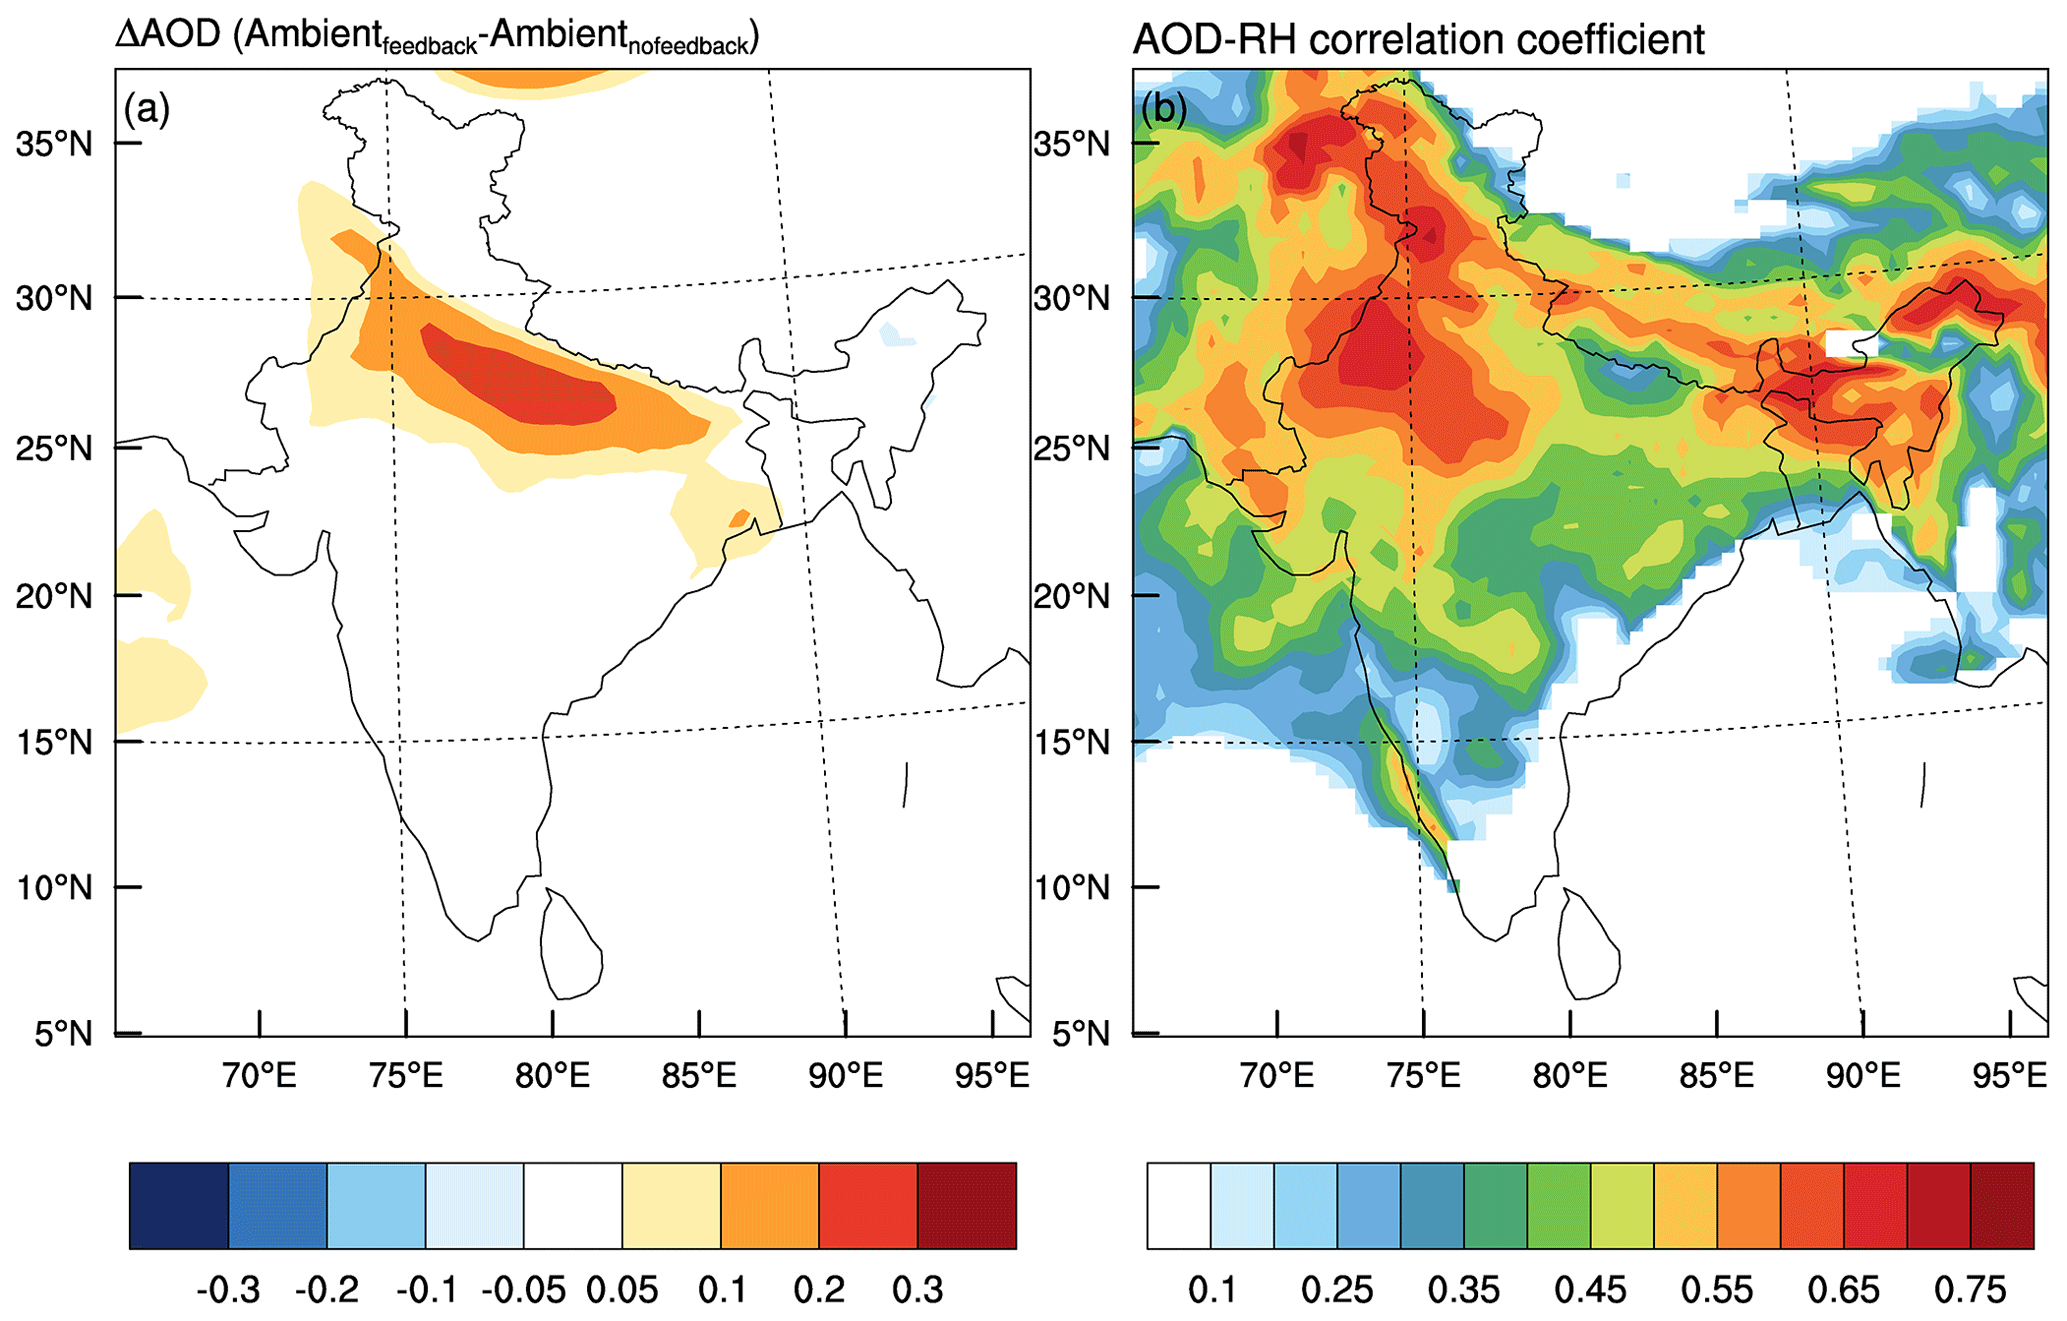
Figure 8(a) Change in AOD due to the meteorological feedbacks of the hygroscopic growth of aerosols ((Ambientfeedback − Dryfeedback) − (Ambientnofeedback − Drynofeedback)). (b) Correlation coefficient of AOD and relative humidity due to the meteorological feedback of hygroscopic growth of aerosols.

Figure 9Frequency of occurrence of (a) AOD and (c) PM2.5 for dry and ambient relative humidity conditions with meteorological feedback over the Indo-Gangetic Plain (IGP). (b) The frequency distribution of the ratio of AOD for ambient and dry humidity with and without meteorological feedback. Dotted vertical lines on PM2.5 frequency of occurrence (c) show the breakpoint concentration for the air quality index categories for satisfactory (60 µg m−3), moderately polluted (90 µg m−3) and poor (150 µg m−3) conditions as proposed by the Central Pollution Control Board (CPCB), India.
The frequency of occurrence of AOD and PM2.5 for dry and ambient humidity conditions with meteorological feedback over the IGP is shown in Fig. 9. The inclusion of meteorological feedback and hygroscopic aerosol growth (ΔAODRH) produces an increase in AOD along the IGP (Fig. 5). The narrow frequency distribution for dry AOD broadens substantially when including the effect of ambient humidity, which implies an increase in the number of days with hazy skies, high AOD and significant dimming at the surface. The frequency distribution of the ratio of AOD for ambient and dry humidity with and without meteorological feedback is shown in Fig. 9b. The no-feedback simulation shows a mean ratio of 1.72, which increases to 2.3 at ambient humidity with meteorological feedbacks. Due to the positive feedback as mentioned above, AOD at ambient humidity increases to more than 3 times its dry AOD, depending on the strength of the land–atmosphere and aerosol–boundary layer interaction. The magnitude of the meteorological feedback due to the total aerosol system (ΔAODfeedback) is comparable to ΔAODRH over the IGP. This clearly indicates that not only the hygroscopic growth of aerosols but also the meteorological feedback is important over the IGP. Therefore, the aerosol feedbacks on regional meteorology need to be investigated further to better understand and predict the fog events over the IGP (Bharali et al., 2019). Although the dominance of organics in the aerosol mass loading over the IGP is expected to decrease the hygroscopic growth of pure inorganic aerosols (Mandariya et al., 2020), the meteorological feedback processes (Eq. 3) increase the AOD by moistening the boundary layer (ΔRHaerosol). The frequency of occurrence of high values of PM2.5 mass concentration for ambient humidity shows deterioration of air quality due to aerosol–radiation interaction, and the aerosol forcing itself increases the aerosol loading through aerosol–boundary layer interaction.
In fact, generally calm winds (< 2 m s−1), low temperatures, a shallow boundary layer and a slow descending motion prevail over the IGP during winter, which favours the accumulation of aerosols within the boundary layer (Ghude et al., 2017; Kumar et al., 2015a; Nair et al., 2007). In addition, the aerosol effects further weaken the horizontal and vertical circulations and decrease the boundary layer height (Fig. S6), which results in more accumulation of aerosols and thus poorer air quality (Bharali et al., 2019; Ding et al., 2016). Although wintertime aerosols are mostly confined within the boundary layer, near-surface PM2.5 and columnar aerosol loading show poor correlation over the IGP as reported by Kumar et al. (2015a). Our study also shows a poor correlation between ambient AOD and PM2.5; however, a high correlation is found between the dry AOD and PM2.5. This result has implications for the estimation of PM2.5 from satellite observations or for finding an empirical relationship between AOD and PM2.5 for air quality applications since the high relative humidity causes the association between AOD and PM2.5 to deteriorate. By and large, the offline filter-based PM2.5 measurements have issues associated with sampling aerosols at ambient humidity conditions. This also points to the need for dedicated field experiments focusing on the size-segregated hygroscopic-growth functions of physical and optical properties of aerosols over the IGP (Mandariya et al., 2020).
As shown in Fig. 10, there also exists an enhancement in near-surface aerosol mass loading (carbonaceous, inorganics and PM2.5) due to the suppression of the boundary layer height induced by the meteorological feedbacks from the aerosol–radiation interaction. This results in further degradation of the air quality of this region. The aerosol concentration increases along the IGP due to aerosol-induced weak ventilation. Figure 11 shows the estimated visibility using the aerosol extinction coefficient. Due to high aerosol loading and high humidity conditions, visibility is low over the region. Compared to the dry aerosols, there is a 60 % reduction in visibility because of the aerosol hygroscopic growth (Fig. S7). In addition, the enhancement in relative humidity due to aerosol forcing again decreases the visibility. This analysis further confirms that the air quality problems in the IGP are associated not only with the aerosol source strength but also with the ambient humidity conditions and their (aerosol) radiative forcing and meteorological feedback.
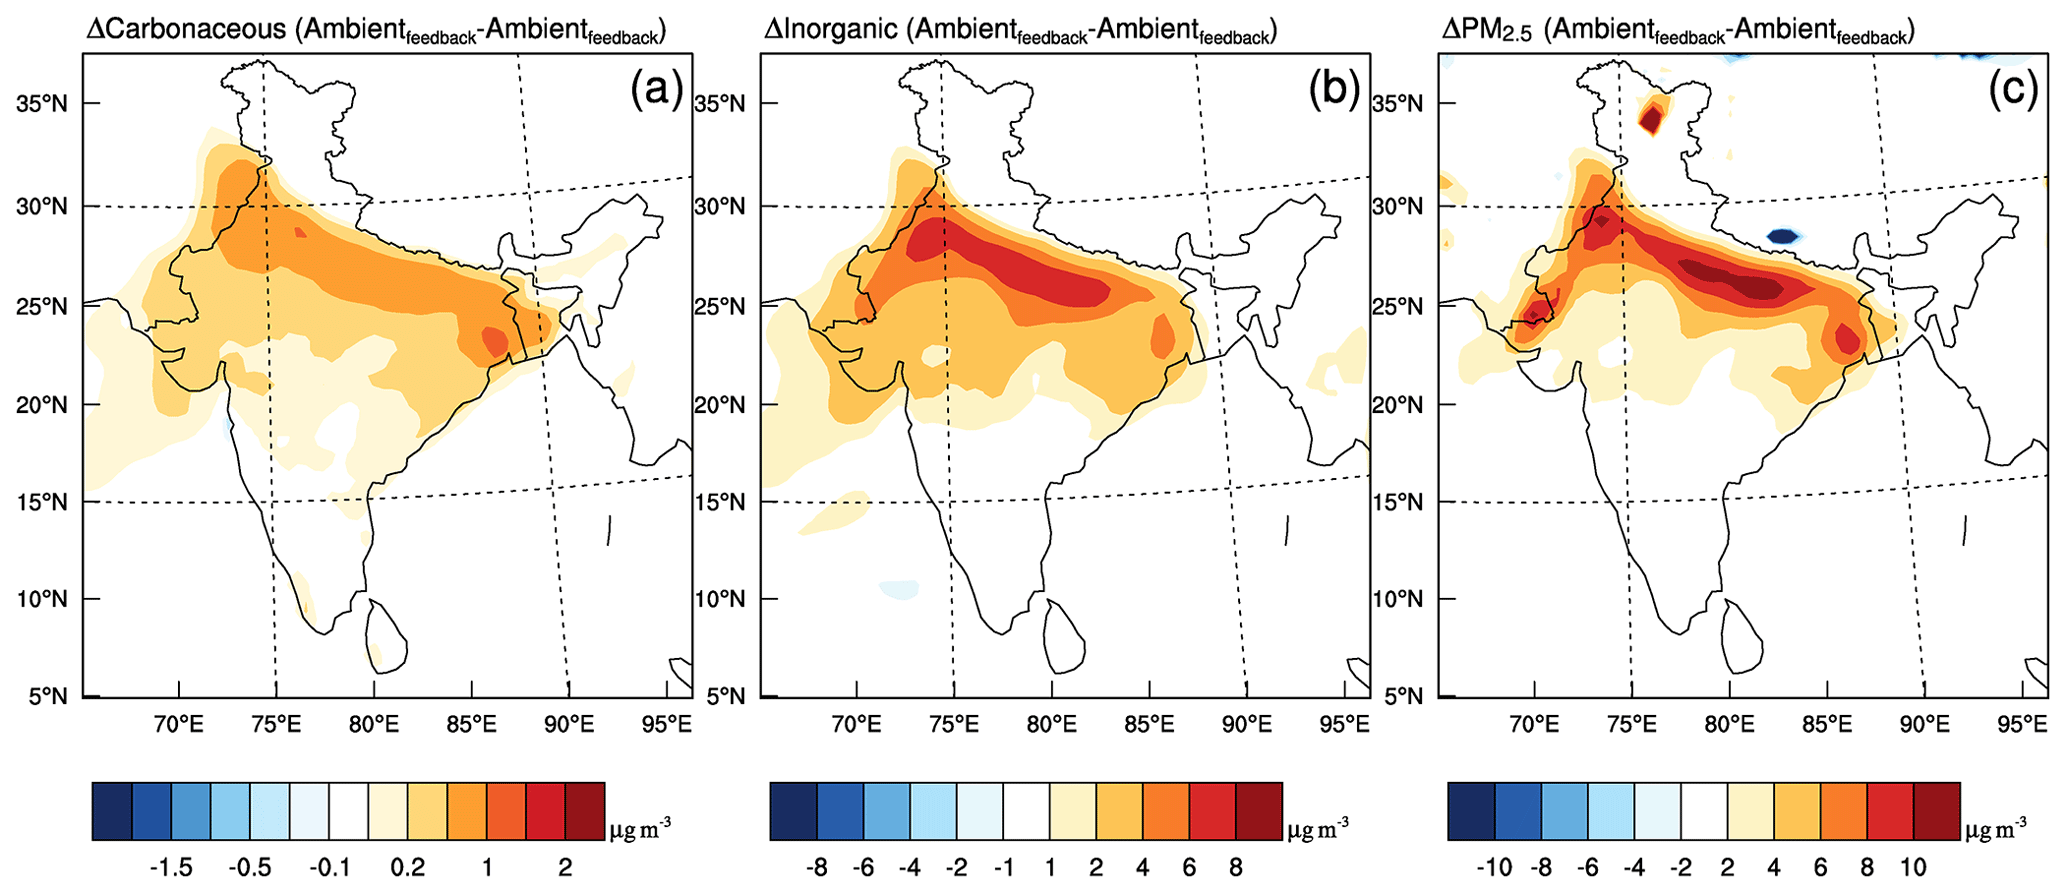
Figure 10Change in near-surface mass loading (µg m−3) due to the meteorological feedback of total aerosol radiative forcing for (a) carbonaceous aerosols, (b) inorganic aerosols and (c) PM2.5.
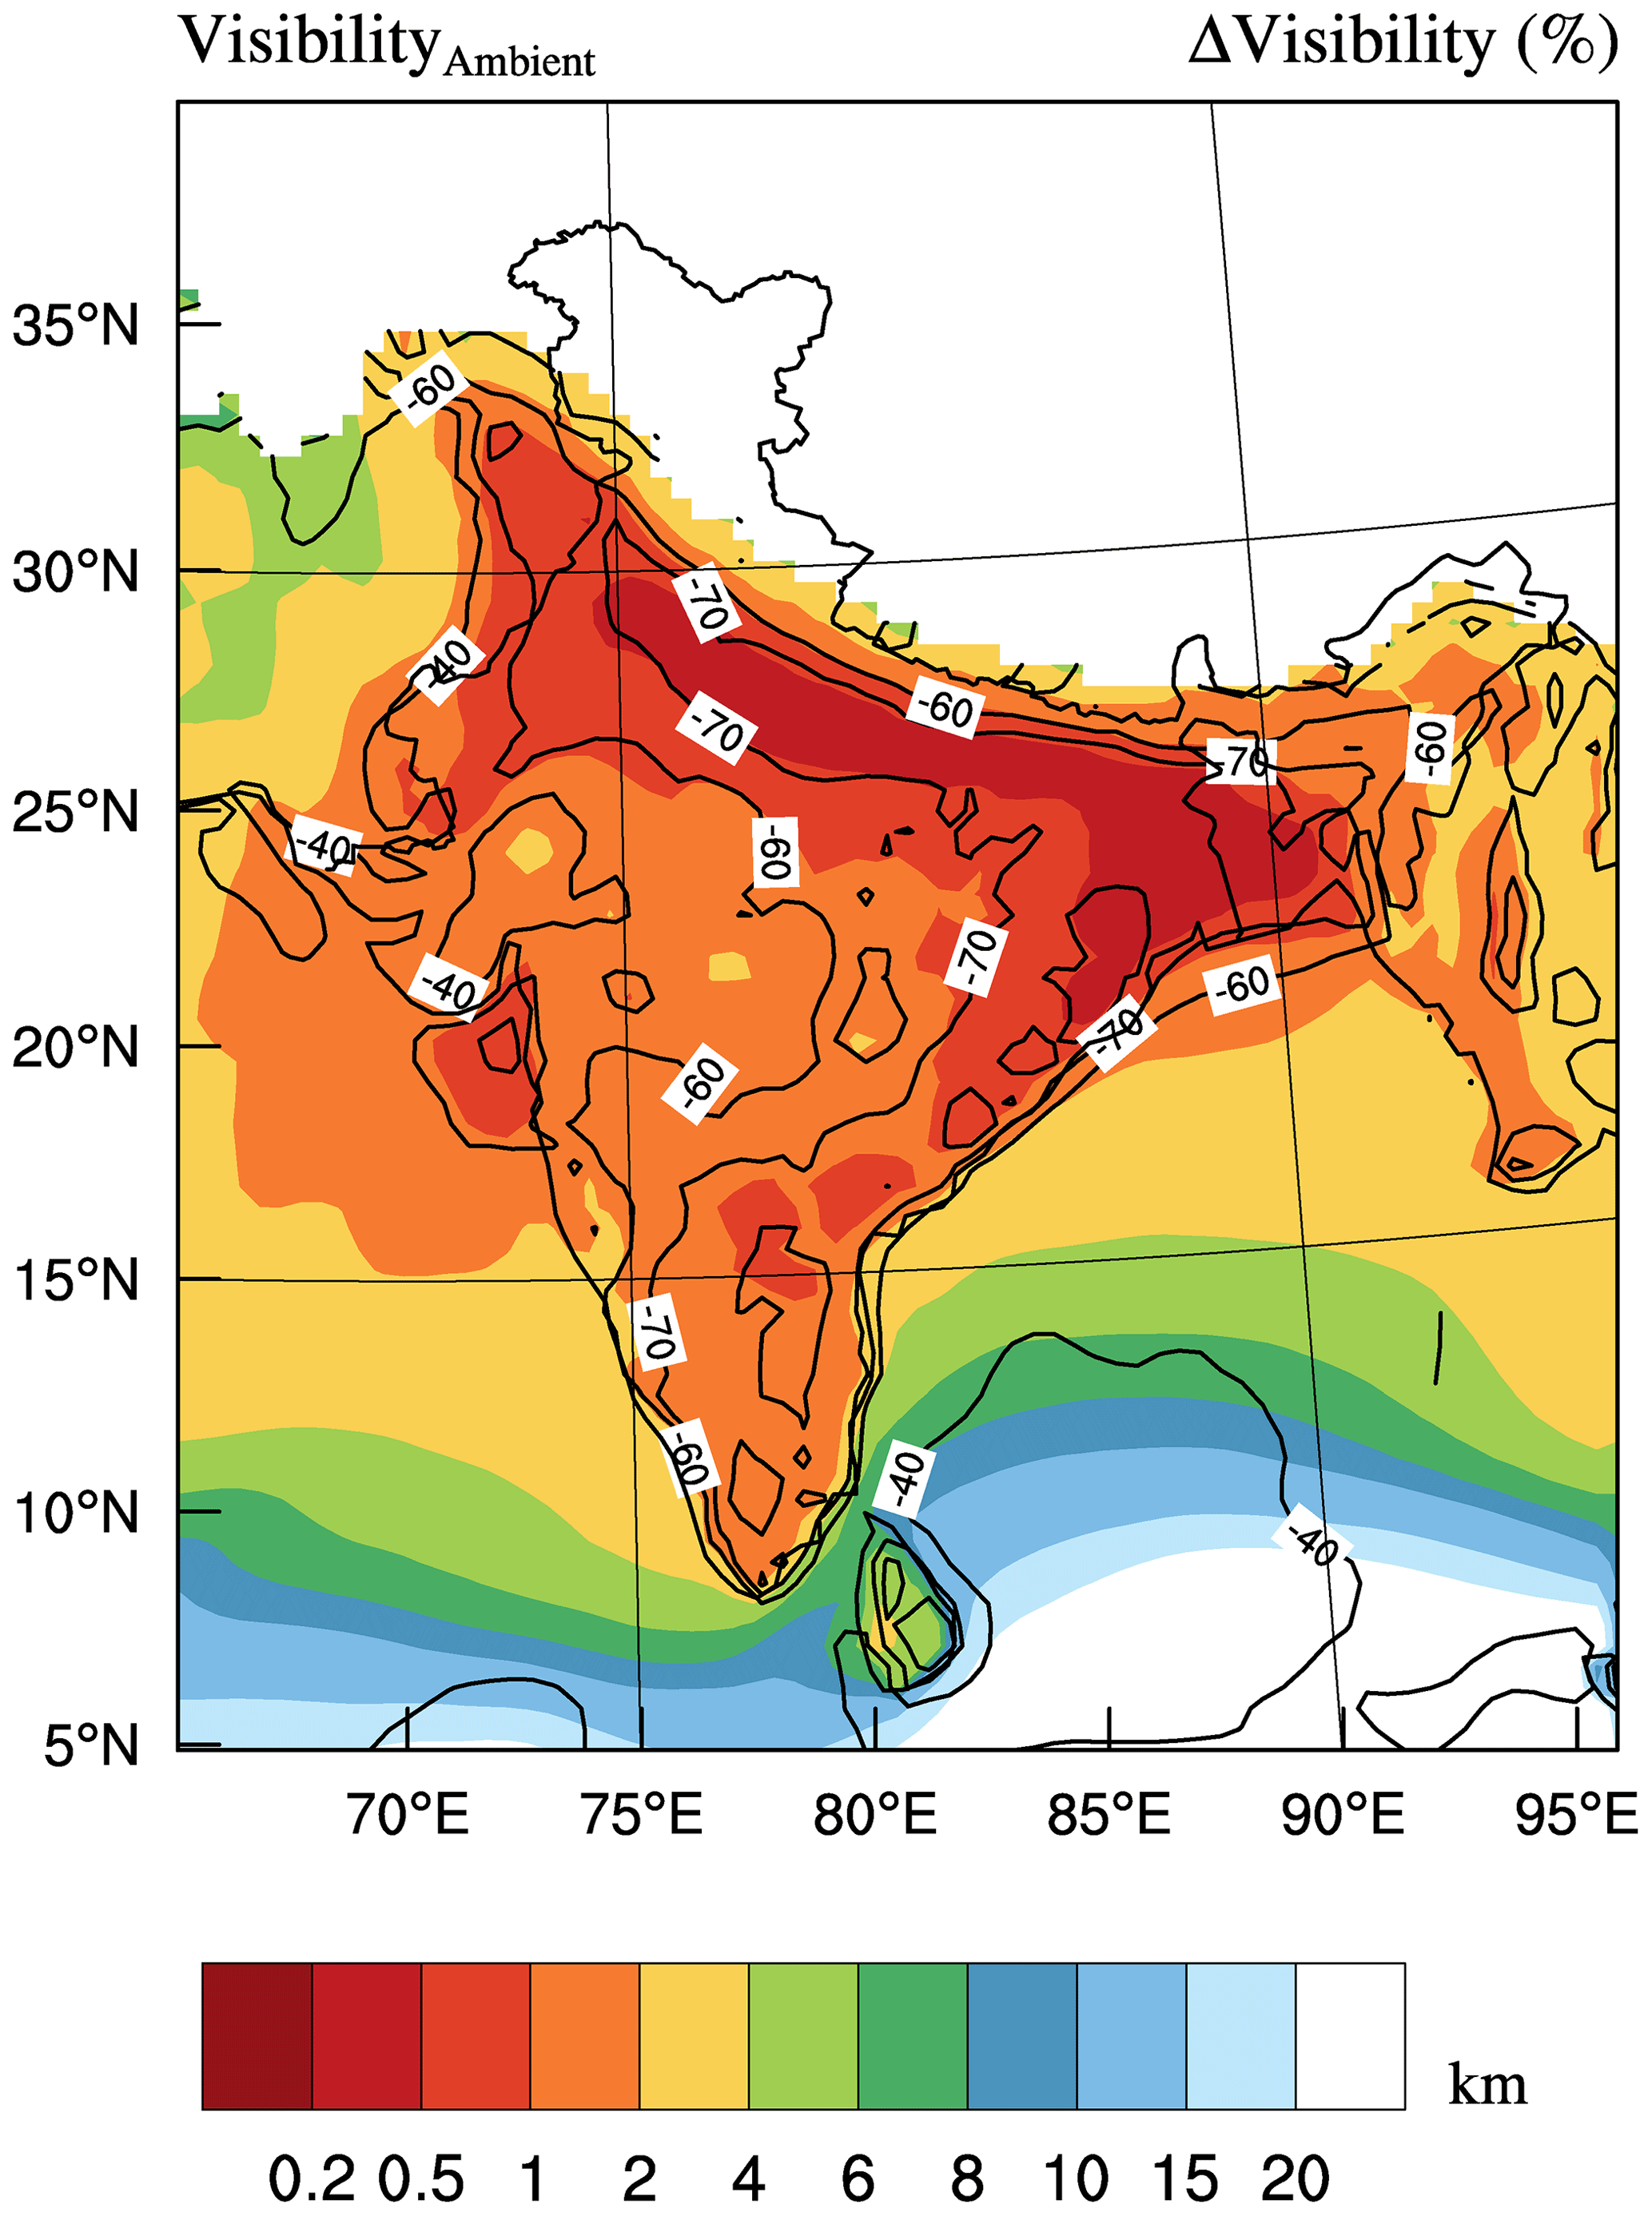
Figure 11Spatial variation in mean visibility over the Indian region for ambient feedback simulation. The percentage variation in visibility changes due to hygroscopic growth with respect to visibility due to dry aerosols is given as line contours.
As discussed above, the AOD increase via hygroscopic growth of aerosols under high-relative-humidity conditions further decreases the incoming solar radiation at the surface, which results in enhanced surface cooling (compared to dry aerosols) and a decrease in the exchanges between the boundary layer and free troposphere. Aerosol–radiation interactions lead to a significant increase in cloud cover over the IGP region (2 % to 8 %), which is further increased by the hygroscopic effect of aerosols. The increase in cloud cover leads to more sulfate formation and thus again influence the radiative balance. Hence, the hygroscopic effects of aerosols significantly strengthen the observed aerosol–boundary layer interactions over the region (Bharali et al., 2019). Recent studies have shown that the high aerosol concentrations at the surface over urban centres are strongly related to positive-feedback processes associated with the boundary layer and water vapour (Ding et al., 2016; Huang et al., 2014; Li et al., 2017; Tie et al., 2017). The surface solar dimming and atmospheric warming due to black carbon in the upper boundary layer decrease the height of the mixed layer (increasing stratification) and increase the accumulation of aerosols within the boundary layer (Bharali et al., 2019; Ding et al., 2016; Nair et al., 2007). The aerosol-induced increase in relative humidity (1 %–10 %) over most land regions (Fig. 5), especially the central IGP, further increases the AOD. Tie et al. (2017) have reported that a decrease in the dispersion of water vapour leads to a self-amplifying feedback mechanism through which an increase in relative humidity further increases the AOD due to hygroscopic growth (ΔAODRH). All these pathways further increase moisture in the boundary layer and, consequently, the AOD (Tie et al., 2017). These feedback processes significantly cause air quality conditions during winter to deteriorate (Li et al., 2017).
In this work, the regional climate model RegCM4 interactively coupled with atmospheric chemistry and aerosols is used to investigate the contribution of the hygroscopic growth of aerosols to the total aerosol optical depth and its meteorological feedback over the Indian subcontinent. Our analysis shows that the aerosol hygroscopic growth can contribute up to 40 % of the total AOD and that feedback processes significantly increase near-surface relative humidity and decrease lower-free-troposphere humidity. This might strengthen the long-term trend in boundary layer moistening and free tropospheric drying over the IGP during winter. We also show that the inclusion of the meteorological feedback due to the hygroscopic growth of aerosols (ΔAODRH) produces an increase in AOD along the IGP, especially over the central IGP regions. The moisture content in the atmosphere increases the AOD not only directly by its hygroscopic effect but also indirectly through its radiative and meteorological feedbacks. Briefly, aerosol forcing due to dry aerosols and their hygroscopic growth at high-relative-humidity conditions increases the relative humidity in the boundary layer, which further increases the AOD through positive feedback. Our analysis demonstrates that the aerosol–moisture interaction is the most significant contributor favouring and strengthening the high-aerosol conditions (poor air quality) prevailing over the IGP during winter.
Our study also highlights the need to increase understanding of aerosol–climate–air quality interactions over the India subcontinent through (i) the inclusion of hygroscopic growth and related feedbacks in climate–chemistry models; (ii) direct measurements of hygroscopic-growth functions of aerosols, which are rather limited over the region (Mandariya et al., 2020); and (iii) measurements and model descriptions of the effect of ageing and mixing state on the water affinity of hydrophobic aerosols. Some model limitations specific to this study are worth noting here. The RegCM4 has a simple organic aerosol module and a single growth function for the hundreds of organic species present in the atmosphere which are characterized by a wide range of affinity towards water vapour. The model does not include the effects of organic aerosols on the water affinity of inorganic aerosols, and in addition the effect of aerosols on cloud characteristics (indirect aerosol effect) is not included. All these aspects of model development are underway in the next version of the RegCM4 modelling system.
Notwithstanding these limitations, our study clearly shows that understanding the interactions of natural factors (moisture fluxes and relative humidity) with anthropogenic aerosols (organic and inorganic) is essential for predicting fog and haze events over the IGP and devising appropriate pollution mitigation strategies. In this regard, the aerosol–water vapour interaction is a unique example of the amplification of anthropogenic forcing (aerosols) by natural agents (water vapour) leading to significant changes in regional climate and air quality. To date, low-air-quality and low-visibility events over the IGP have been considered essentially a problem of emission sources and transport of particles; however, our study highlights the important, and in fact sometimes dominant, contributions of atmospheric water vapour to these events and thus the need to consider this natural factor in air quality assessments and related policymaking.
Data are available upon request from the contact author, Vijayakumar S. Nair (vijayakumarsnair@gmail.com).
The supplement related to this article is available online at: https://doi.org/10.5194/acp-20-14457-2020-supplement.
VSN conceived the research theme. VSN and FG wrote the manuscript. UKH supported the data analysis.
The authors declare that they have no conflict of interest.
The work has been carried out under the Simons Associate Programme of the International Centre for Theoretical Physics (ICTP), Trieste, Italy. Vijayakumar Sivadasan Nair acknowledges the support received from the Aerosol Radiative Forcing over India (ARFI) project of the Indian Space Research Organisation. The authors acknowledge the Central Pollution Control Board (CPCB) for the air quality data.
This research has been supported by the Simons Associate Programme of the International Centre for Theoretical Physics (ICTP), Trieste, Italy.
This paper was edited by Armin Sorooshian and reviewed by two anonymous referees.
Ajay, P., Pathak, B., Solmon, F., Bhuyan, P. K., and Giorgi, F.: Obtaining best parameterization scheme of RegCM 4.4 for aerosols and chemistry simulations over the CORDEX South Asia, Clim. Dyn., 53, 329–352, https://doi.org/10.1007/s00382-018-4587-3, 2019.
Ali, K., Acharja, P., Trivedi, D. K., Kulkarni, R., Pithani, P., Safai, P. D., Chate, D. M., Ghude, S., Jenamani, R. K., and Rajeevan, M.: Characterization and source identification of PM 2.5 and its chemical and carbonaceous constituents during Winter Fog Experiment 2015–16 at Indira Gandhi International Airport, Delhi, Sci. Total Environ., 662, 687–696, https://doi.org/10.1016/j.scitotenv.2019.01.285, 2019.
Aswini, A. R., Hegde, P., Nair, P. R., and Aryasree, S.: Seasonal changes in carbonaceous aerosols over a tropical coastal location in response to meteorological processes, Sci. Total Environ., 656, 1261–1279, https://doi.org/10.1016/j.scitotenv.2018.11.366, 2019.
Babu, S. S., Manoj, M. R., Moorthy, K. K., Gogoi, M. M., Nair, V. S., Kompalli, S. K., Satheesh, S. K., Niranjan, K., Ramagopal, K., Bhuyan, P. K. and, Singh, D.: Trends in aerosol optical depth over Indian region: Potential causes and impact indicators, J. Geophys. Res.-Atmos., 118, 11794–11806, https://doi.org/10.1002/2013JD020507, 2013.
Babu, S. S., Nair, V. S., Gogoi, M. M., and Moorthy, K. K.: Seasonal variation of vertical distribution of aerosol single scattering albedo over Indian sub-continent: RAWEX aircraft observations, Atmos. Environ., 125, 312–323, https://doi.org/10.1016/j.atmosenv.2015.09.041, 2016.
Bharali, C., Nair, V. S., Chutia, L. and, Babu, S. S.: Modeling of the Effects of Wintertime Aerosols on Boundary Layer Properties Over the Indo Gangetic Plain, J. Geophys. Res.-Atmos., 124, 4141–4157, https://doi.org/10.1029/2018JD029758, 2019.
Chatani, S. and Sharma, S.: Uncertainties Caused by Major Meteorological Analysis Data Sets in Simulating Air Quality Over India, J. Geophys. Res.-Atmos., 123, 6230–6247, https://doi.org/10.1029/2017JD027502, 2018.
Dai, A.: Recent Climatology, Variability, and Trends in Global Surface Humidity, J. Clim., 19, 3589–3606, https://doi.org/10.1175/JCLI3816.1, 2006.
Dee, D. P., Uppala, S. M., Simmons, A. J., Berrisford, P., Poli, P., Kobayashi, S., Andrae, U., Balmaseda, M. A., Balsamo, G., Bauer, P., Bechtold, P., Beljaars, A. C. M., van de Berg, L., Bidlot, J., Bormann, N., Delsol, C., Dragani, R., Fuentes, M., Geer, A. J., Haimberger, L., Healy, S. B., Hersbach, H., Hólm, E. V., Isaksen, L., Kållberg, P., Köhler, M., Matricardi, M., McNally, A. P., Monge-Sanz, B. M., Morcrette, J.-J., Park, B.-K., Peubey, C., de Rosnay, P., Tavolato, C., Thépaut, J.-N., and Vitart, F.: The ERA-Interim reanalysis: configuration and performance of the data assimilation system, Q. J. Roy. Meteor. Soc., 137, 553–597, https://doi.org/10.1002/qj.828, 2011.
Ding, A. J., Huang, X., Nie, W., Sun, J. N., Kerminen, V. -M., Petäjä, T., Su, H., Cheng, Y. F., Yang, X. -Q., Wang, M. H., Chi, X. G., Wang, J. P., Virkkula, A., Guo, W. D., Yuan, J., Wang, S. Y., Zhang, R. J., Wu, Y. F., Song, Y., Zhu, T., Zilitinkevich, S., Kulmala, M., and Fu, C. B.: Enhanced haze pollution by black carbon in megacities in China, Geophys. Res. Lett., 43, 2873–2879, https://doi.org/10.1002/2016GL067745, 2016.
Di Sante, F., Coppola, E., Farneti, R., and Giorgi, F.: Indian Summer Monsoon as simulated by the regional earth system model RegCM-ES: the role of local air–sea interaction, Clim. Dyn., 53, 759–778, https://doi.org/10.1007/s00382-019-04612-8, 2019.
Feng, Y., Cadeddu, M., Kotamarthi, V. R., Renju, R., and Suresh Raju, C.: Humidity Bias and Effect on Simulated Aerosol Optical Properties during the Ganges Valley Experiment, Curr. Sci., 111, 93, https://doi.org/10.18520/cs/v111/i1/93-100, 2016.
Gautam, R. and Singh, M. K.: Urban Heat Island Over Delhi Punches Holes in Widespread Fog in the Indo-Gangetic Plains, Geophys. Res. Lett., 45, 1114–1121, https://doi.org/10.1002/2017GL076794, 2018.
Gautam, R., Hsu, N. C., Kafatos, M., and Tsay, S.-C.: Influences of winter haze on fog/low cloud over the Indo-Gangetic plains, J. Geophys. Res., 112, D05207, https://doi.org/10.1029/2005JD007036, 2007.
George, S. K., Nair, P. R., Parameswaran, K., Jacob, S., and Abraham, A.: Seasonal trends in chemical composition of aerosols at a tropical coastal site of India, J. Geophys. Res.-Atmos., 113, D16209, https://doi.org/10.1029/2007JD009507, 2008.
Ghude, S. D., Bhat, G. S., Prabhakaran, T., Jenamani, R. K., Chate, D. M., Safai, P. D., Karipot, A. K., Konwar, M., Pithani, P., Sinha, V., Rao, P. S. P., Dixit, S. A., Tiwari, S., Todekar, K., Varpe, S., Srivastava, A. K., Bisht, D. S., Murugavel, P., Ali, K., Mina, U., Dharua, M., Rao, J., Padmakumari, B., Hazra, A., Nigam, N., Shende, U., Lal, D. M., Chandra, B. P., Mishra, A. K., Kumar, A., Hakkim, H., Pawar, H., Acharja, P., Kulkarni, R., Subharthi, C., Balaji, B., Varghese, M., Bera, S., and Rajeevan, M.: Winter Fog Experiment Over the Indo-Gangetic Plains of India, Curr. Sci., 112, 767, https://doi.org/10.18520/cs/v112/i04/767-784, 2017.
Giorgi, F., Coppola, E., Solmon, F., Mariotti, L., Sylla, M. B., Bi, X., Elguindi, N., Diro, G. T., Nair, V., Giuliani, G., Turuncoglu, U. U., Cozzini, S., Güttler, I., O'Brien, T. A., Tawfik, A. B., Shalaby, A., Zakey, A. S., Steiner, A. L., Stordal, F., Sloan, L. C., and Brankovic, C.: RegCM4: Model description and preliminary tests over multiple CORDEX domains, Clim. Res., 52, 7–29, https://doi.org/10.3354/cr01018, 2012.
Goswami, P. and Sarkar, S.: Analysis and quantification of contrasts in observed meteorological fields for foggy and non-foggy days, Meteorol. Atmos. Phys., 127, 605–623, https://doi.org/10.1007/s00703-015-0384-2, 2015.
Gurjar, B. R., Butler, T. M., Lawrence, M. G., and Lelieveld, J.: Evaluation of emissions and air quality in megacities, Atmos. Environ., 42, 1593–1606, https://doi.org/10.1016/j.atmosenv.2007.10.048, 2008.
Hodnebrog, Ø., Myhre, G., Samset, B. H., Alterskjær, K., Andrews, T., Boucher, O., Faluvegi, G., Fläschner, D., Forster, P. M., Kasoar, M., Kirkevåg, A., Lamarque, J.-F., Olivié, D., Richardson, T. B., Shawki, D., Shindell, D., Shine, K. P., Stier, P., Takemura, T., Voulgarakis, A., and Watson-Parris, D.: Water vapour adjustments and responses differ between climate drivers, Atmos. Chem. Phys., 19, 12887–12899, https://doi.org/10.5194/acp-19-12887-2019, 2019.
Huang, R.-J., Zhang, Y., Bozzetti, C., Ho, K.-F., Cao, J.-J., Han, Y., Daellenbach, K. R., Slowik, J. G., Platt, S. M., Canonaco, F., Zotter, P., Wolf, R., Pieber, S. M., Bruns, E. A., Crippa, M., Ciarelli, G., Piazzalunga, A., Schwikowski, M., Abbaszade, G., Schnelle-Kreis, J., Zimmermann, R., An, Z., Szidat, S., Baltensperger, U., El Haddad, I., and Prévôt, A. S. H.: High secondary aerosol contribution to particulate pollution during haze events in China, Nature, 514, 218–222, https://doi.org/10.1038/nature13774, 2014.
Kasten, F.: Visibility forecast in the phase of pre-condensation, Tellus, 21, 631–635, https://doi.org/10.3402/tellusa.v21i5.10112, 1969.
Kiehl, J. T., Schneider, T. L., Rasch, P. J., Barth, M. C., and Wong, J.: Radiative forcing due to sulfate aerosols from simulations with the National Center for Atmospheric Research Community Climate Model, Version 3, J. Geophys. Res.-Atmos., 105, 1441–1457, https://doi.org/10.1029/1999JD900495, 2000.
Kumar, M., Tiwari, S., Murari, V., Singh, A. K., and Banerjee, T.: Wintertime characteristics of aerosols at middle Indo-Gangetic Plain: Impacts of regional meteorology and long range transport, Atmos. Environ., 104, 162–175, https://doi.org/10.1016/j.atmosenv.2015.01.014, 2015a.
Kumar, R., Barth, M. C., Nair, V. S., Pfister, G. G., Suresh Babu, S., Satheesh, S. K., Krishna Moorthy, K., Carmichael, G. R., Lu, Z., and Streets, D. G.: Sources of black carbon aerosols in South Asia and surrounding regions during the Integrated Campaign for Aerosols, Gases and Radiation Budget (ICARB), Atmos. Chem. Phys., 15, 5415–5428, https://doi.org/10.5194/acp-15-5415-2015, 2015b.
Lelieveld, J., Evans, J. S., Fnais, M., Giannadaki, D., and Pozzer, A.: The contribution of outdoor air pollution sources to premature mortality on a global scale, Nature, 525, 367–371, https://doi.org/10.1038/nature15371, 2015.
Li, Z., Lau, W. K. M., Ramanathan, V., Wu, G., Ding, Y., Manoj, M. G., Liu, J., Qian, Y., Li, J., Zhou, T., Fan, J., Rosenfeld, D., Ming, Y., Wang, Y., Huang, J., Wang, B., Xu, X., Lee, S.-S., Cribb, M., Zhang, F., Yang, X., Zhao, C., Takemura, T., Wang, K., Xia, X., Yin, Y., Zhang, H., Guo, J., Zhai, P. M., Sugimoto, N., Babu, S. S., and Brasseur, G. P.: Aerosol and monsoon climate interactions over Asia, Rev. Geophys., 54, 866–929, https://doi.org/10.1002/2015RG000500, 2016.
Li, Z., Guo, J., Ding, A., Liao, H., Liu, J., Sun, Y., Wang, T., Xue, H., Zhang, H., and Zhu, B.: Aerosol and boundary-layer interactions and impact on air quality, Natl. Sci. Rev., 4, 810–833, https://doi.org/10.1093/nsr/nwx117, 2017.
Liepert, B. G., Feichter, J., Lohmann, U., and Roeckner, E.: Can aerosols spin down the water cycle in a warmer and moister world?, Geophys. Res. Lett., 31, L06207, https://doi.org/10.1029/2003GL019060, 2004.
Mandariya, A. K., Tripathi, S. N., Gupta, T., and Mishra, G.: Wintertime hygroscopic growth factors (HGFs) of accumulation mode particles and their linkage to chemical composition in a heavily polluted urban atmosphere of Kanpur at the Centre of IGP, India: Impact of ambient relative humidity, Sci. Total Environ., 704, 135363, https://doi.org/10.1016/j.scitotenv.2019.135363, 2020.
McInnes, L., Bergin, M., Ogren, J., and Schwartz, S.: Apportionment of light scattering and hygroscopic growth to aerosol composition, Geophys. Res. Lett., 25, 513–516, https://doi.org/10.1029/98GL00127, 1998.
Mukhopadhyay, P., Jaswal, A. K., and Deshpande, M.: Variability and Trends of Atmospheric Moisture over the Indian Region, in Observed Climate Variability and Change over the Indian Region, edited by: Rajeevan, M. N. and Nayak, S., Springer, Singapore, 129–144, 2017.
Nair, V. S., Moorthy, K. K., Alappattu, D. P., Kunhikrishnan, P. K., George, S., Nair, P. R., Babu, S. S., Abish, B., Satheesh, S. K., Tripathi, S. N. S. N., Niranjan, K., Madhavan, B. L. L., Srikant, V., Dutt, C. B. S. B. S., Badarinath, K. V. S. V. S., and Reddy, R. R. R. R.: Wintertime aerosol characteristics over the Indo-Gangetic Plain (IGP): Impacts of local boundary layer processes and long-range transport, J. Geophys. Res-Atmos., 112, D13205, https://doi.org/10.1029/2006JD008099, 2007.
Nair, V. S., Solmon, F., Giorgi, F., Mariotti, L., Babu, S. S., and Moorthy, K. K.: Simulation of South Asian aerosols for regional climate studies, J. Geophys. Res.-Atmos., 117, D04209, https://doi.org/10.1029/2011JD016711, 2012.
Nair, V. S., Babu, S. S., Manoj, M. R., Moorthy, K. K., and Chin, M.: Direct radiative effects of aerosols over South Asia from observations and modeling, Clim. Dyn., 49, 1411–1428, https://doi.org/10.1007/s00382-016-3384-0, 2016a.
Nair, V. S., Babu, S. S., Gogoi, M. M., and Moorthy, K. K.: Large-scale enhancement in aerosol absorption in the lower free troposphere over continental India during spring, Geophys. Res. Lett., 43, 11453–11461, https://doi.org/10.1002/2016GL070669, 2016b.
Ram, K., Sarin, M. M., and Hegde, P.: Long-term record of aerosol optical properties and chemical composition from a high-altitude site (Manora Peak) in Central Himalaya, Atmos. Chem. Phys., 10, 11791–11803, https://doi.org/10.5194/acp-10-11791-2010, 2010.
Ram, K., Sarin, M. M., and Tripathi, S. N.: Temporal Trends in Atmospheric PM 2.5, PM 10, Elemental Carbon, Organic Carbon, Water-Soluble Organic Carbon, and Optical Properties: Impact of Biomass Burning Emissions in The Indo-Gangetic Plain, Environ. Sci. Technol., 46, 686–695, https://doi.org/10.1021/es202857w, 2012.
Ramanathan, V.: Aerosols, Climate, and the Hydrological Cycle, Science, 294, 2119–2124, https://doi.org/10.1126/science.1064034, 2001.
Rengarajan, R., Sudheer, A. K., and Sarin, M. M.: Wintertime PM2.5 and PM10 carbonaceous and inorganic constituents from urban site in western India, Atmos. Res., 102, 420–431, https://doi.org/10.1016/j.atmosres.2011.09.005, 2011.
Safai, P. D., Kewat, S., Pandithurai, G., Praveen, P. S., Ali, K., Tiwari, S., Rao, P. S. P., Budhawant, K. B., Saha, S. K., and Devara, P. C. S.: Aerosol characteristics during winter fog at Agra, North India, J. Atmos. Chem., 61, 101–118, https://doi.org/10.1007/s10874-009-9127-4, 2008.
Satsangi, A., Pachauri, T., Singla, V., Lakhani, A., and Kumari, K. M.: Organic and elemental carbon aerosols at a suburban site, Atmos. Res., 113, 13–21, https://doi.org/10.1016/j.atmosres.2012.04.012, 2012.
Shalaby, A., Zakey, A. S., Tawfik, A. B., Solmon, F., Giorgi, F., Stordal, F., Sillman, S., Zaveri, R. A., and Steiner, A. L.: Implementation and evaluation of online gas-phase chemistry within a regional climate model (RegCM-CHEM4), Geosci. Model Dev., 5, 741–760, https://doi.org/10.5194/gmd-5-741-2012, 2012.
Solmon, F., Giorgi, F., and Liousse, C.: Aerosol modelling for regional climate studies: application to anthropogenic particles and evaluation over a European/African domain, Tellus B, 58, 51–72, https://doi.org/10.1111/j.1600-0889.2005.00155.x, 2006.
Solmon, F., Nair, V. S., and Mallet, M.: Increasing Arabian dust activity and the Indian summer monsoon, Atmos. Chem. Phys., 15, 8051–8064, https://doi.org/10.5194/acp-15-8051-2015, 2015.
Syed, F. S., Körnich, H., and Tjernström, M.: On the fog variability over south Asia, Clim. Dyn., 39, 2993–3005, https://doi.org/10.1007/s00382-012-1414-0, 2012.
Tie, X., Huang, R.-J., Cao, J., Zhang, Q., Cheng, Y., Su, H., Chang, D., Pöschl, U., Hoffmann, T., Dusek, U., Li, G., Worsnop, D. R., and O'Dowd, C. D.: Severe Pollution in China Amplified by Atmospheric Moisture, Sci. Rep.-UK, 7, 15760, https://doi.org/10.1038/s41598-017-15909-1, 2017.
Titos, G., Cazorla, A., Zieger, P., Andrews, E., Lyamani, H., Granados-Muñoz, M. J., Olmo, F. J., and Alados-Arboledas, L.: Effect of hygroscopic growth on the aerosol light-scattering coefficient: A review of measurements, techniques and error sources, Atmos. Environ., 141, 494–507, https://doi.org/10.1016/j.atmosenv.2016.07.021, 2016.
Usha, K. H., Nair, V. S., and Babu, S. S.: Modeling of aerosol induced snow albedo feedbacks over the Himalayas and its implications on regional climate, Clim. Dyn., 54, 4191–4210, https://doi.org/10.1007/s00382-020-05222-5, 2020.
Watson-Parris, D., Bellouin, N., Deaconu, L. T., Schutgens, N. A. J., Yoshioka, M., Regayre, L. A., Pringle, K. J., Johnson, J. S., Smith, C. J., Carslaw, K. S., and Stier, P.: Constraining Uncertainty in Aerosol Direct Forcing, Geophys. Res. Lett., 47, e2020GL087141, https://doi.org/10.1029/2020GL087141, 2020.
Zakey, A. S., Giorgi, F., and Bi, X.: Modeling of sea salt in a regional climate model: Fluxes and radiative forcing, J. Geophys. Res., 113, D14221, https://doi.org/10.1029/2007JD009209, 2008.