the Creative Commons Attribution 4.0 License.
the Creative Commons Attribution 4.0 License.
 | 24 Nov 2020
Tracing the evolution of morphology and mixing state of soot particles along with the movement of an Asian dust storm
Liang Xu
Satoshi Fukushima
Sophie Sobanska
Kotaro Murata
Ayumi Naganuma
Yuanyuan Wang
Hongya Niu
Zongbo Shi
Tomoko Kojima
Daizhou Zhang
Tracing the aging progress of soot particles during transport is highly challenging. An Asian dust event could provide an ideal opportunity to trace the continuous aging progress of long-range-transported soot particles. Here, we collected individual aerosol particles at an inland urban site (T1) and a coastal urban site (T2) in China and a coastal site (T3) in southwestern Japan during an Asian dust event. Microscopic analysis showed that the number fraction of soot-bearing particles was 19 % and 16 % at T1 and T2 in China but surprisingly increased to 56 % at T3 in Japan. The dominant fresh soot (71 %) at T1 became partially embedded (68 %) at T2 and fully embedded (84 %) at T3. These results indicated that the tiny soot particles had lower deposition than other aerosol types and became more aged during the transport from T1 to T3. We quantified soot morphology using the fractal dimension and found an increasing trend of 1.65 at T1, 1.84 at T2, and 1.91 at T3. Furthermore, we found that the morphology compression of the soot aggregations was associated with secondary coating thickness and relative humidity. A unique mixing structure where multi-soot particles scattered in organic coatings instead of the sulfate core in individual core-shell particles was observed at T3 after the crossing of the East China Sea. The study provides understanding for important constraints of the soot morphological effects and provides a possible aging scale along with their transport pathway. These new findings will be helpful to improve optical calculations and regional climate modeling of soot particles during their transport in the atmosphere.
- Article
(5584 KB) - Full-text XML
-
Supplement
(1759 KB) - BibTeX
- EndNote


Soot (i.e., black carbon, BC) is a type of carbonaceous material with graphitic structures emitted from the incomplete combustion of fossil fuels and biomass. Soot particles exhibit a chainlike aggregation morphology with a diameter of 10 to 100 nm (Buseck et al., 2014). Because of its strong capacity to absorb solar radiation, soot is considered the second greatest contributor to global warming after carbon dioxide (IPCC, 2013; Bond et al., 2013). Soot is an important particulate pollutant in fine particles (i.e., PM2.5) in urban polluted air, which adversely affects the respiratory health of citizens and induces generally unwanted heating in the planetary boundary layer (West et al., 2016; Ding et al., 2016).
Fresh soot particles are hydrophobic but are converted into a hydrophilic state following their aging through physical and chemical processes (Li et al., 2016b; Riemer et al., 2010; Perring et al., 2017). Aged soot particles containing secondary coating aerosols (e.g., ammonium sulfate, ammonium nitrate, and organic matter) can be activated as cloud condensation nuclei (CCN) (Zhang et al., 2008; Wang et al., 2010; Ding et al., 2019; Shiraiwa et al., 2007; Lee et al., 2019). These coatings can significantly change the optical scattering and absorption capacity of soot particles (Liu et al., 2017; Moffet and Prather, 2009; Matsui et al., 2018; He et al., 2015; Zhang et al., 2018a). Numerical model simulations have estimated that light absorption by internally mixed soot is enhanced by a factor of 2 over externally mixed soot (Jacobson, 2001). In contrast, Cappa et al. (2012) reported in situ observations of soot absorption enhancement of only 6 % in ambient air. This discrepancy between simulation and observation could be attributed to the complex mixing structure and various morphologies of soot particles in the air (Adachi et al., 2016; Li et al., 2016a; Wu et al., 2018).
In aged air masses, soot particles tend to be internally mixed with secondary aerosols such as sulfates, nitrates, and secondary organic matter (Li et al., 2016b). Especially in the East Asian region, one of the most polluted areas in the world, soot is internally mixed with secondary aerosols in polluted urban, rural, and remote air (Adachi et al., 2016; Zhang et al., 2013; Yuan et al., 2019; Zhang et al., 2018b). However, most of these studies have focused on the aging and mixing state of soot particles at one or multiple isolated sites. These results have not traced the detailed aging processes (e.g., morphology and mixing structure) from fresh to aged soot particles during their transport.
Although great progress has been made in the field of soot aging, it is highly challenging to trace the aging processes of soot particles during transport. Asian dust storms carry both dust and anthropogenic aerosols across East Asia into the North Pacific Ocean (Li et al., 2014; Geng et al., 2014; Zhang et al., 2005). This presents an ideal environment to study the aging processes of soot particles during long-range transport. Compared to previous publications, the present study quantified the variation in mixing structures and fractal dimension of soot particles and further explored how shape of soot particles changed following the dust storm movement from East China to Japan.
Using transmission electron microscopy (TEM), we investigated the morphology, mixing structure, relative abundance, and size distribution of individual soot particles. Furthermore, we evaluated the morphological differences of individual soot particles at three sampling sites. Finally, a conceptual model was proposed to better understand the aging processes of long-range-transported soot particles.
2.1 Aerosol sampling
Three sampling sites were chosen for aerosol collections: an inland urban site in Jinan city (T1; 36.67∘ N, 117.06∘ E), China; a coastal urban site in Qingdao city (T2; 36.10∘ N, 120.46∘ E), China; and a coastal rural site at Amakusa (T3; 32.30∘ N, 130.00∘ E), southwestern Japan (Fig. 1). A dust storm outbreak was observed in East Asia. Detailed information about this dust storm will be discussed in Sect. 3.1. We collected aerosol particles during dust transport from 18 to 19 March 2014 at the three sampling sites (Fig. S1–S5). In total, seven dust samples were collected within 30 h after the dust storm arrival. The details about the sampling dates, times, meteorological conditions, and PM (particulate matter) concentrations for the samples are listed in Table S1.
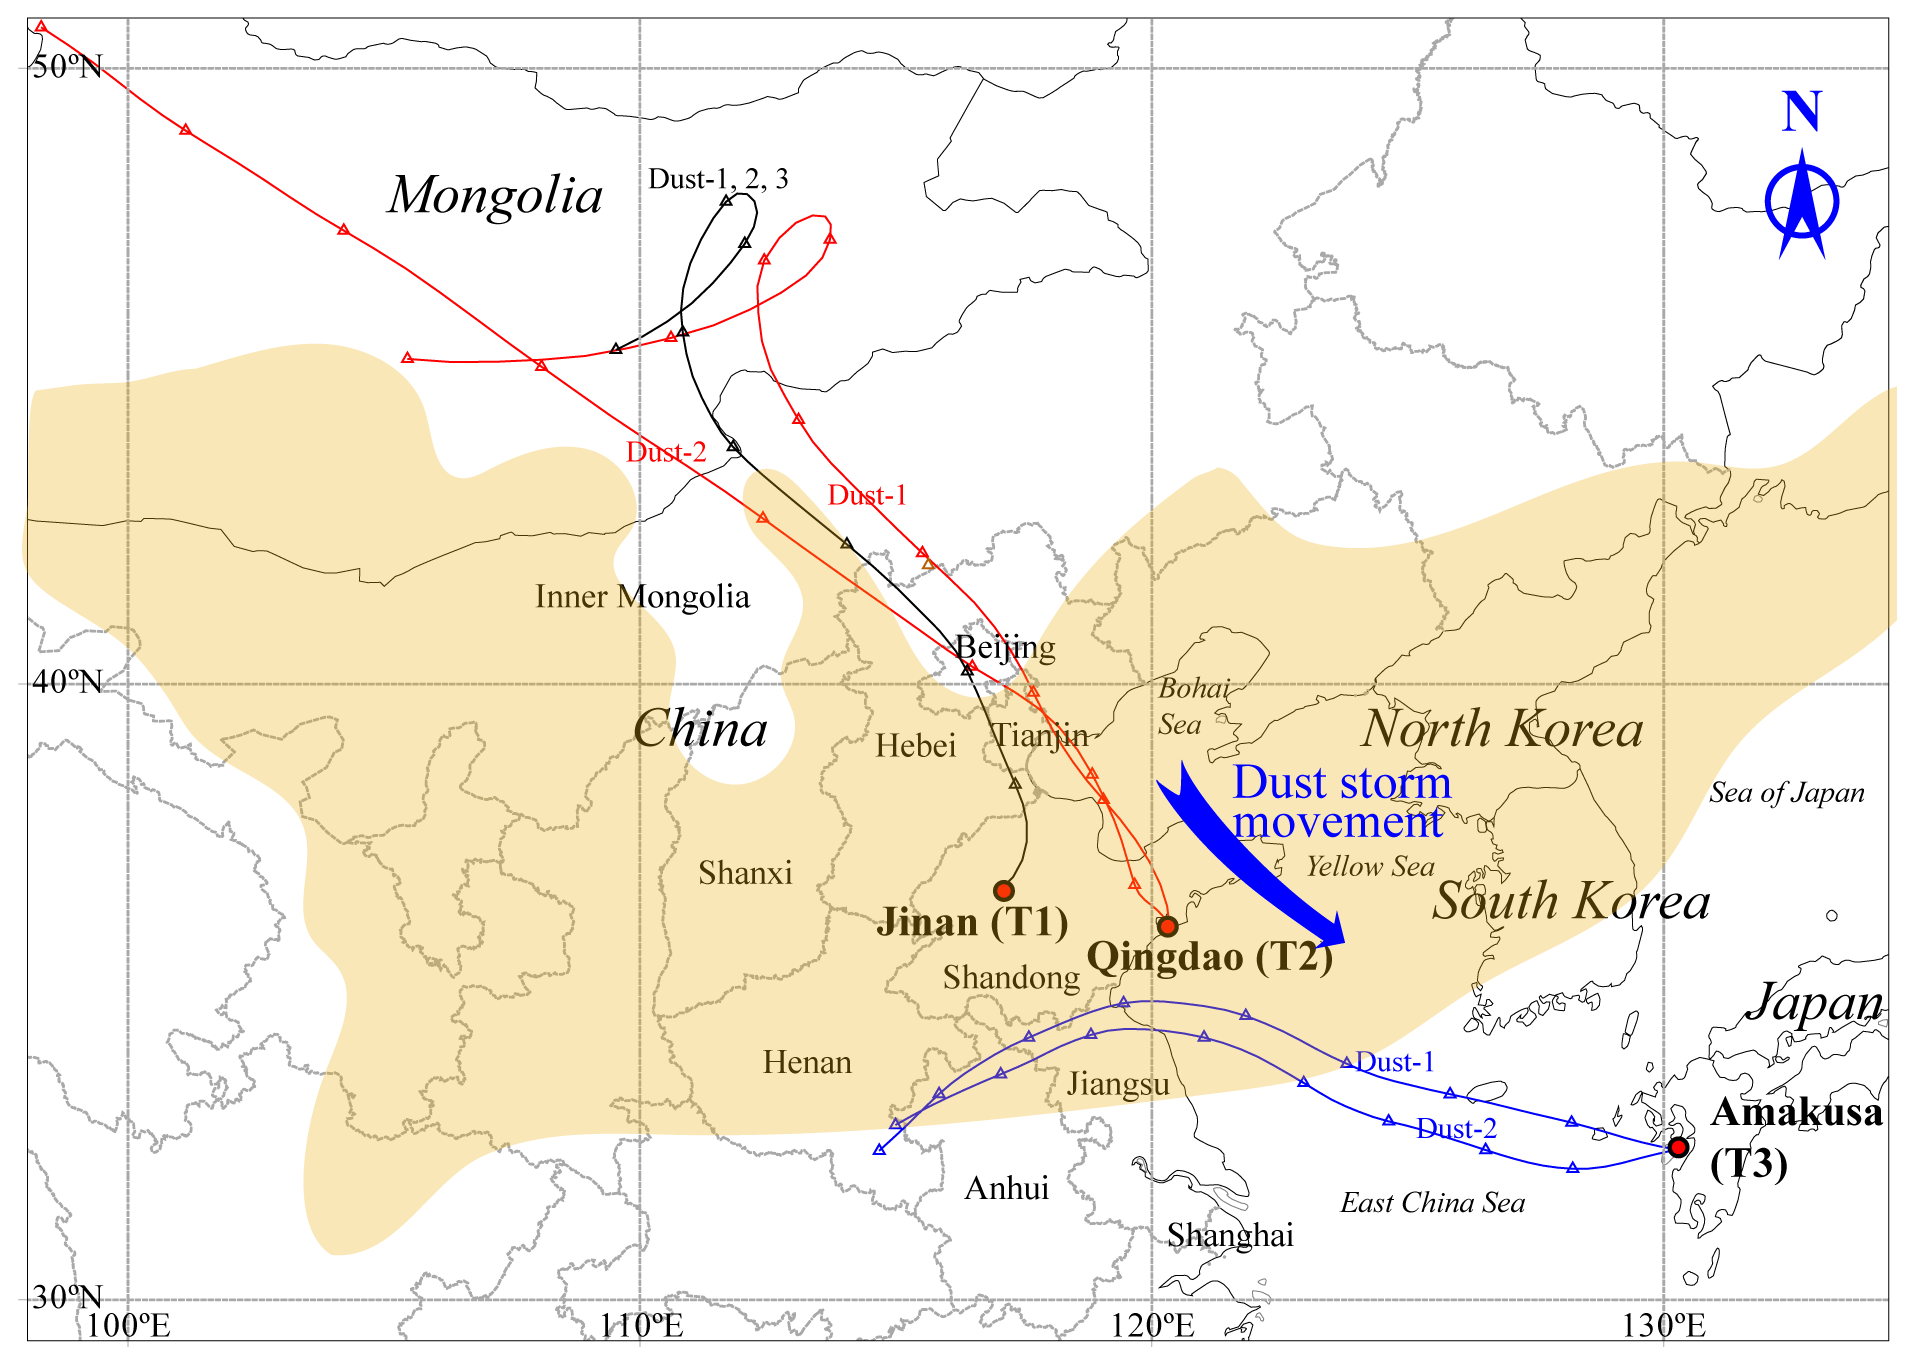
Figure 1The locations of the three sampling sites and HYSPLIT (HYbrid Single-Particle Lagrangian Integrated Trajectory) 48 h air mass backward trajectories arriving at 1500 m above ground level at T1, T2, and T3 sites. The interval between two triangle symbols is 6 h. The yellow shadow is derived from Fig. S1, which represents the area influenced by the dust storm at 00:00 UTC on 18 March 2014.
A DKL-2 sampler (Genstar Technologies Company Inc., China) was used to collect individual aerosol particles on copper TEM grids covered by carbon film (carbon type B, 300-mesh copper; Tianld Co., China) with an air flow of 1.0 L/min. A single-stage impactor with a 0.5 mm diameter jet nozzle was installed on the sampler. This impactor has a collection efficiency of 100 % at an aerodynamic diameter of 0.5 µm with an assumed particle density of 2 g/cm3. The sampling duration varied from 1 to 2 min according to the visibility, PM concentration, and particle distribution on the substrate. All samples were placed in sealed, dry plastic capsules and stored in a desiccator at 25 ∘C and 20 ± 3 % relative humidity (RH) for further analysis.
2.2 Electron microscopic analyses
A JEOL JEM-2100 transmission electron microscopy (TEM) operated at 200 kV was used to analyze individual particles. Elemental composition was determined semiquantitatively by using an energy-dispersive X-ray spectrometer (EDS) (Oxford Instruments, UK) that can detect elements heavier than carbon (Z≥6). The distribution of aerosol particles on TEM grids was not uniform, with coarser particles occurring near the center and finer particles occurring on the periphery (Xu et al., 2019). Therefore, to ensure that the analyzed particles were representative of the entire size range, three areas were chosen from the center to the periphery of the sampling spot on each grid. The iTEM software (Olympus Soft Imaging Solutions GmbH, Germany) was used to analyze the TEM images and obtain the projected area, perimeter, shape factor, and equivalent circle diameter (ECD) of individual aerosol particles. In total, we analyzed 412, 486, and 887 aerosol particles for T1, T2, and T3 sites, respectively.
2.3 AFM analysis
Atomic force microscopy (AFM) is an analytical method used for studying the surface structure of solid materials. AFM (Dimension Icon, Germany) can determine the three-dimensional morphology of particles in tapping mode. The AFM settings consisted of imaging forces between 1 and 1.5 nN, scanning rates between 0.5 and 0.8 Hz, and a scanning range of 10 µm with a resolution of 512 pixels per length. The bearing areas (A) and bearing volumes (V) of the particles were directly obtained from NanoScope Analysis software. Their equivalent circle diameters (ECDs) and equivalent volume diameters (EVDs) were calculated according to the formulas described by Chi et al. (2015).
The correlations of ECDs and EVDs are shown in Fig. S6 in the Supplement. Therefore, the ECD of individual aerosol particles measured from the iTEM software can be further converted into an EVD based on this correlation.
2.4 Air mass backward trajectories
Forty-eight-hour backward trajectories were calculated for the three sites using the NOAA HYSPLIT (HYbrid Single-Particle Lagrangian Integrated Trajectory) model (Stein et al., 2015). We selected an altitude of 1500 m as the end point in each backward trajectory.
We measured the actual duration from the Beijing-Tianjin-Hebei (BTH) area to T1 and T2 according to the backward trajectories in Fig. 1. It was approximately 12 h between BTH and T1 and 15 h between BTH and T2. The interval between T1 and T2 was 3 h. The duration between the air mass leaving T2 and reaching T3 was approximately 30 h.
2.5 Morphological analysis of soot particles
The fractal dimension (Df) calculated by the scaling law is used to characterize the morphology of soot particles (Koeylue et al., 1995).
where N is the total number of soot monomers, Rg is the radius of gyration of the soot particle, dp is the diameter of soot monomer, kg is the fractal prefactor, and Df is the mass fractal dimension of an individual soot particle.
Df and kg in Eq. (1) are estimated from a power law fit of a scatter plot of N versus the values of 2Rg∕dp; N can also be calculated by Eq. (2).
where Aa is the projected area of the soot particle, Ap is the mean projected area of the soot monomer, ka is a constant, and α is an empirical projected area exponent.
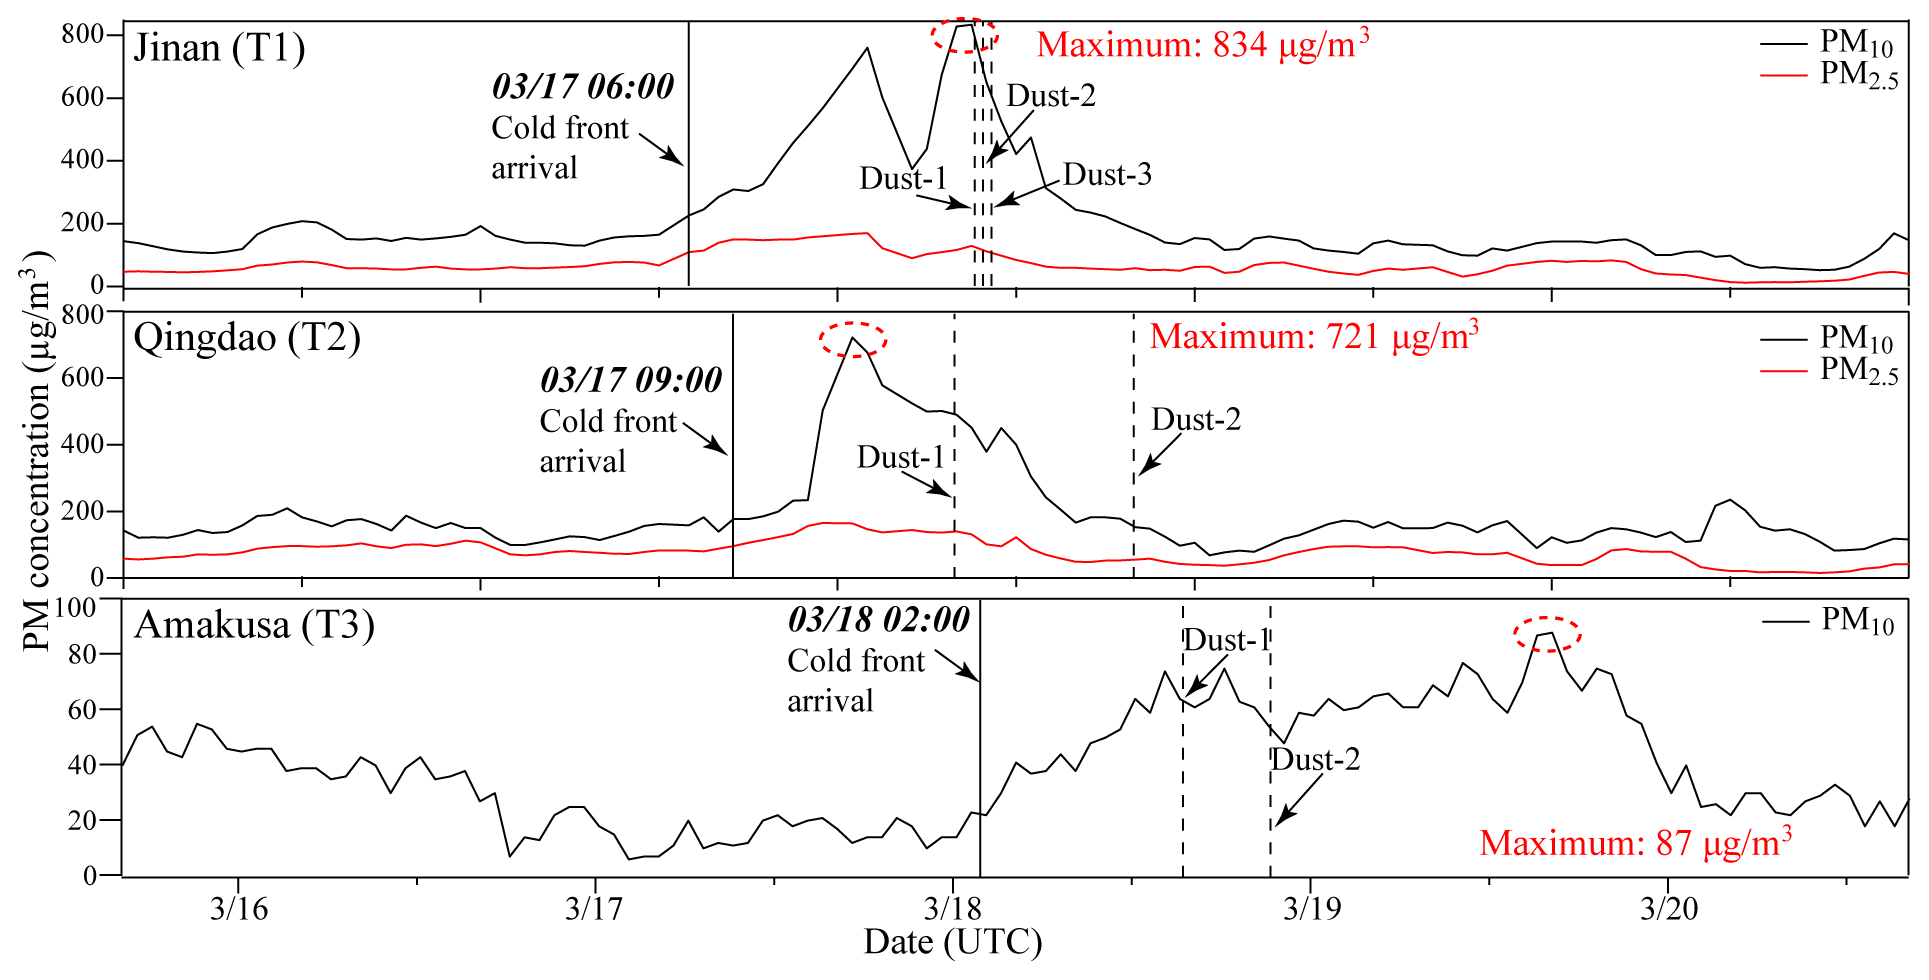
Figure 2Time series of PM (particulate matter) concentrations at T1, T2, and T3 during sampling. The cold front arrival times indicate the time when the sampling site starts to be influenced by the dust storm. Data source for T1 and T2 is the Ministry of Ecology and Environment of the People's Republic of China, https://www.aqistudy.cn/ (last access: 20 November 2020), and for T3 the source is the National Institute for Environmental Studies of Japan, https://www.nies.go.jp/igreen/ (last access: 20 November 2020) ). Date format is M/DD, i.e., March 2014.
The values of α and ka in Eq. (2) depend on the overlap parameter (δ) calculated using Eq. (3). Then δ can be used to obtain α and ka based on Fig. 6 in Oh and Sorensen (1997).
where a is the soot monomer radius and l is the monomer spacing.
The radius of gyration of the soot particle Rg is obtained by the simple correlation in Eq. (4) developed by Brasil et al. (1999):
where Lmax is the maximum length of the soot particle.
The values of dp, Aa, Ap, a, l, and Lmax can be directly obtained from TEM images.
In addition to Df, we also used the shape factor (SF) to further quantify the morphological differences of soot particles. The shape factor is defined as the ratio of the actual area of a particle to the area of a circle with the same perimeter (Eq. 5). A shape factor of 1 (the maximum value) indicates a perfectly round particle.
where S is the area of a soot particle and P is the perimeter of a soot particle.
3.1 The Asian dust storm event
Figure 2 displays variations in PM10 and PM2.5 concentrations before, during, and after the dust storm event at the Jinan, Qingdao, and Amakusa sampling sites. The dust storm air mass started to influence T1 at approximately 06:00 UTC (Universal Time Coordinated) on 17 March. The concentration of PM10 at T1 increased rapidly to a maximum value of 834 µg/m3. The air mass reached T2 at 09:00 UTC on 17 March, and the highest PM10 concentration was recorded at 721 µg/m3. After the arrival of a cold front at T2, the air mass continued moving approximately 1000 km to T3 at 02:00 UTC on 18 March. The concentration of PM10 reached 87 µg/m3 at T3 (Fig. 2). During this study, the meteorological data (e.g., temperature and air pressure) measured at the three sampling sites also confirm the arrival time of the dust storm (Figs. S3–S5). All seven dust samples were collected after the arrival of the dust storm, confirming the sampling of the same dust storm event (Figs. 2 and S2).
Figure 1 indicates that all the air masses during the dust storm event originated from Mongolia, moving southeastward via the BTH area, reaching T1 and T2. The BTH, as the largest city cluster in China, contains one of the largest anthropogenic emission sources (e.g., heavy industries, coal-fired power plants, and vehicles) in the world (Li et al., 2016b). The transport duration from the BTH to T1 and T2 was about 12 and 15 h, respectively. Thus, we estimated that the interval between T1 and T2 was 3 h. After passing over T1 and T2, the air masses kept moving southeastward to Japan. The estimated interval between T2 and T3 was 30 h. The ground PM and meteorological measurements at the three sampling sites (Figs. 2 and S3–S5) coupled with air mass back trajectories (Fig. 1) and a dust storm simulation in East Asia (Fig. S1) together verified that the dust storm, under the force of a strong cold front, was transported across the large BTH city cluster to the downwind area. Therefore, this dust storm movement provides a unique opportunity to study particles in the same air mass and thus trace physical and chemical changes in aerosol particles.
3.2 Classification and mixing state of soot-bearing particles
Soot particles with a typical chainlike structure can be easily distinguished from other aerosol components (e.g., sulfate, organic, metal, and mineral particles) by their morphology. TEM observation is a convenient way to determine whether soot is associated with other aerosol components (Li et al., 2016b; Laskin et al., 2019). During the dust storm period, 56 % of the analyzed particles within a size range of 50 nm to 2.4 µm included soot particles at T3, approximately 3 times higher than those at T1 (19 %) and T2 (16 %). This high percentage of internally mixed soot particles was also shown by Ueda et al. (2016) in an Asian outflow at Noto Peninsula, Japan, based on single-particle soot photometer (SP2) analyses. Our results show that the dust storm event not only carried large amounts of dust particles from the Gobi Desert in northwestern China but also that this dust-laden air mass also incorporated many soot particles from polluted East Asia (Figs. 2 and 3a–d). This is consistent with Pan et al. (2015), who showed that dust storms in East Asia contain and transport anthropogenic pollutants from urban areas.

Figure 3Morphology of soot-bearing aerosol particles: (a) fresh chainlike soot aggregates with no visible coating; (b) partially embedded soot: part of the soot particle was coated by secondary aerosols; (c) fully embedded soot: the whole soot particle was encapsulated by secondary aerosols; (d) a subtype of fully embedded soot: individual soot particles were only embedded in the organic coating on a sulfur-rich particle.
Based on the mixing structures between soot and sulfate on the substrates, three groups of soot particles were defined in this study: fresh, partially embedded, and fully embedded (Fig. 3).
-
Fresh soot. The soot particles were not obviously mixed with secondary aerosol components (Fig. 3a). Although surfaces of the fresh soot particles could contain minor organic matter, the organic film was insufficient to change soot morphology and optical properties (Buseck et al., 2014).
-
Partially embedded soot. Part of the soot particle was coated by secondary aerosols (Fig. 3b). Most of the partially embedded soot particles include one soot core; only ∼10 % of them contain two soot cores (Fig. S7).
-
Fully embedded soot. The entire soot particle was encapsulated by secondary aerosols (Fig. 3c). It should be noted that some soot particles were only embedded in the organic coating instead of the sulfur-rich core (Fig. 3d).
TEM images show that the fully embedded soot particles with a clear rim on the substrate displayed a droplet-like shape (Fig. 3c–d), suggesting that these secondary particles were in an aqueous phase in ambient air (Li et al., 2016b).
Based on the three mixing structures of soot particles, we further obtained their relative abundance at the three sampling sites (Fig. 4). Seventy-one percent of soot-bearing particles were fresh at T1, decreasing to 10 % at T2. In contrast, partially embedded soot increased from 14 % at T1 to 68 % at T2 when the cold front moved from T1 to T2. It should be noted that fresh soot disappeared at T3 after crossing the East China Sea, and the fully embedded soot-dominated soot-bearing particles (84 %).
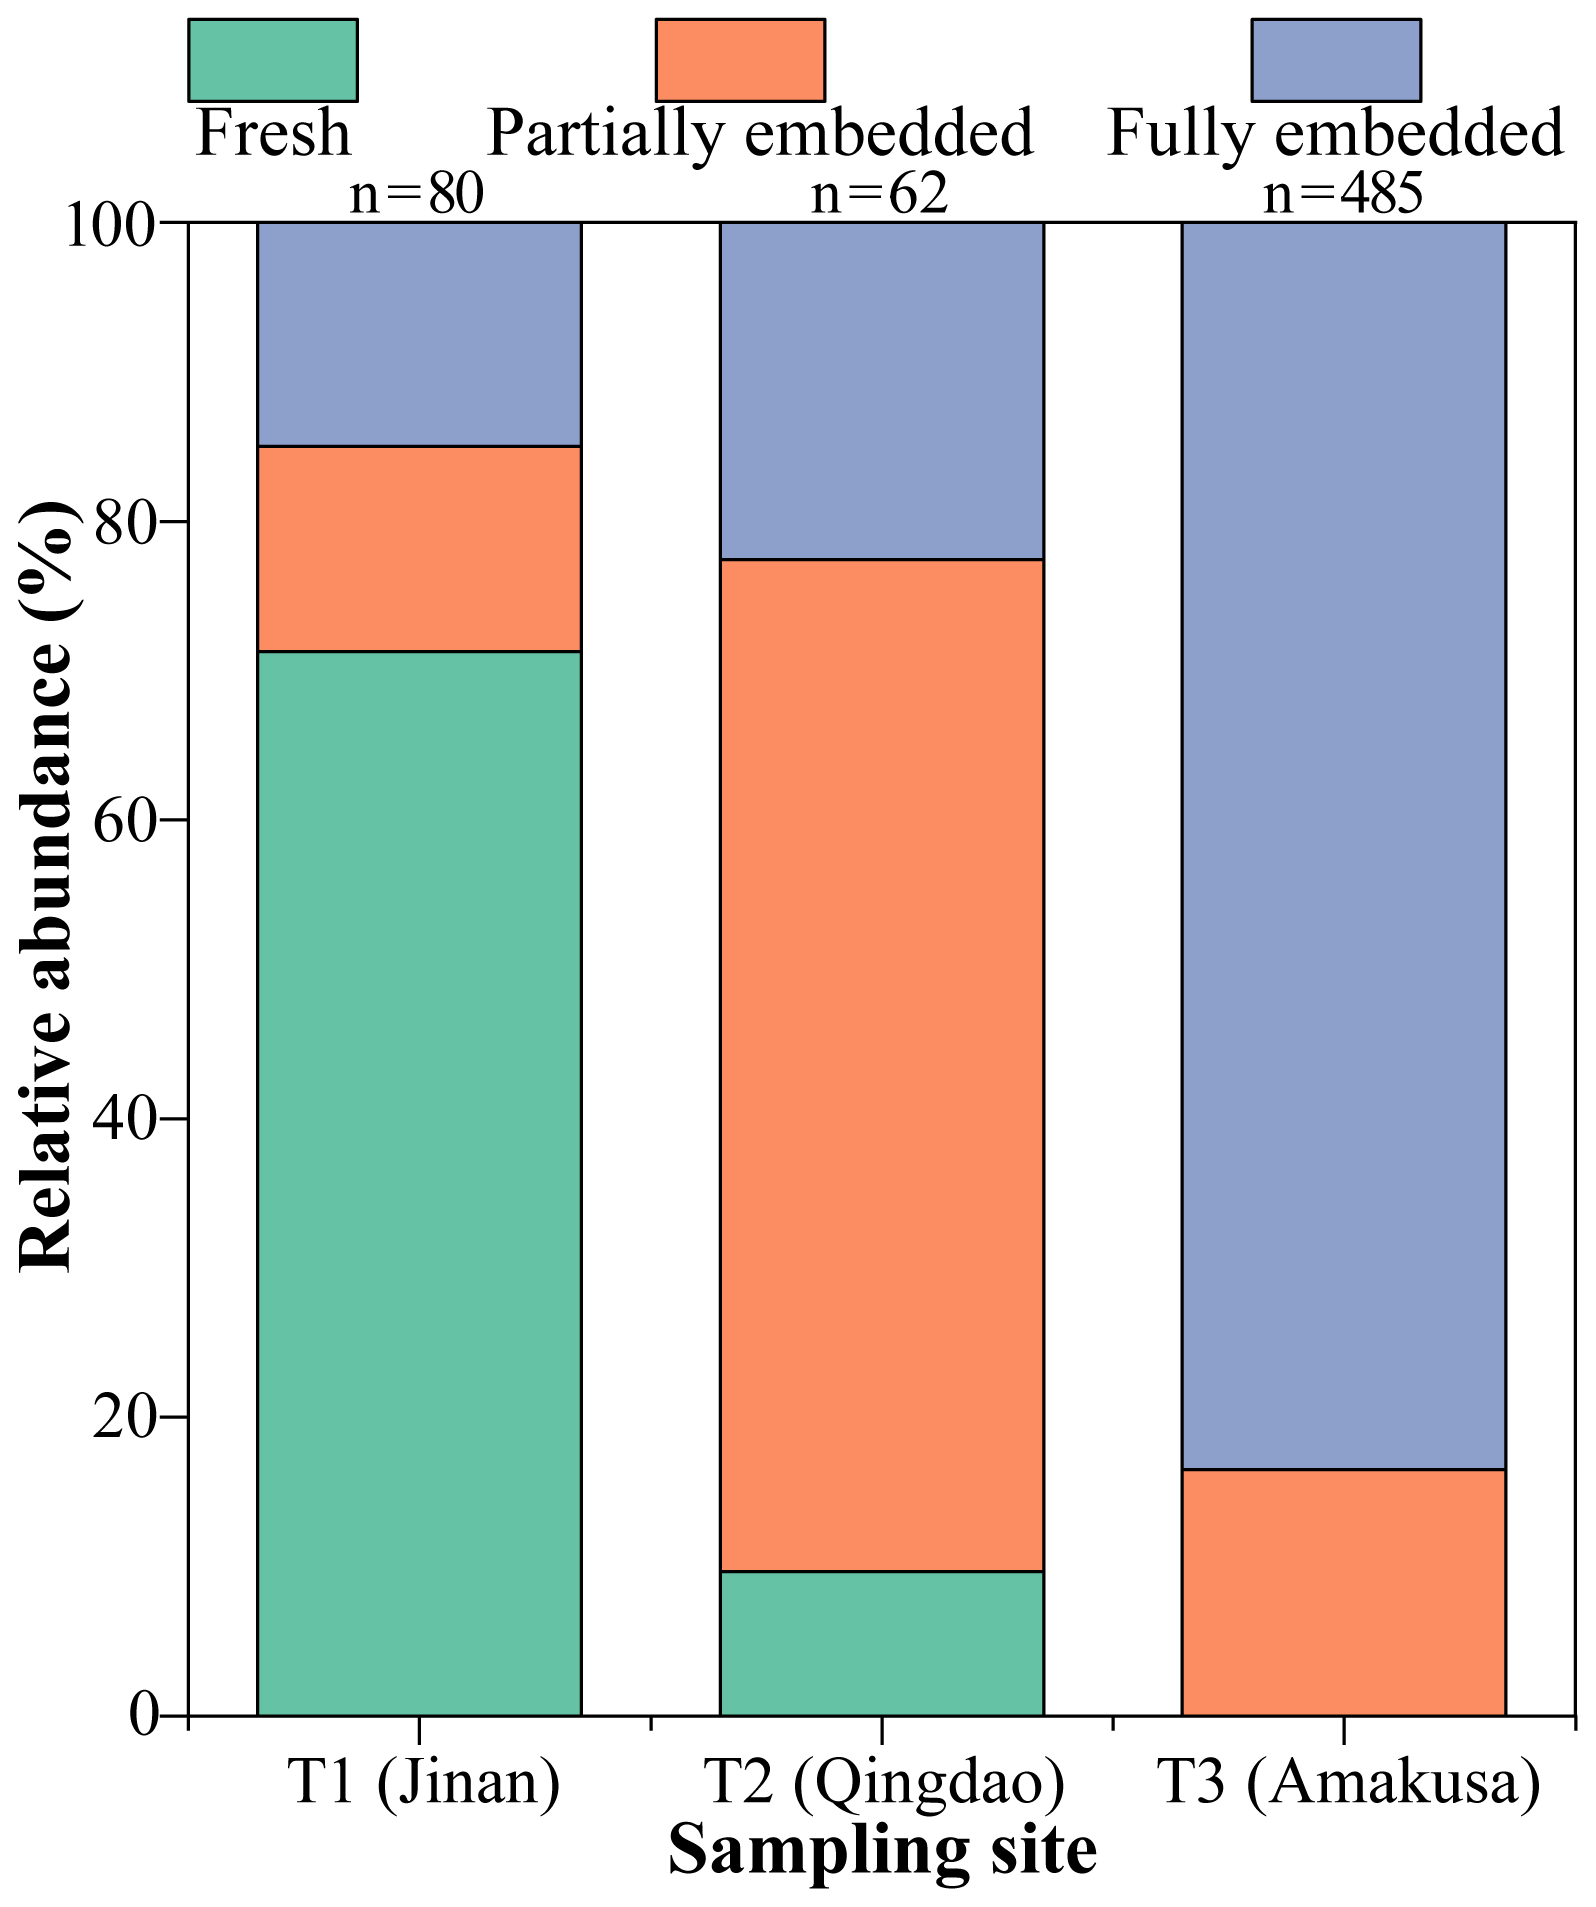
Figure 4Relative abundance of three types of soot-bearing aerosol particles at the three sampling sites. The number of analyzed soot-bearing particles is shown above the column.
Following the dust storm movement, we found that the number fraction of total soot-bearing particles increased to 56 % among all the analyzed particles from T1 to T3, suggesting that soot particles had lower deposition than other aerosol types in the cold front. Indeed, soot particles normally have smaller sizes and densities than mineral dust, metal, sulfate, and nitrate particles (Peng et al., 2017), suggesting that soot particles can be transported over longer distances during Asian dust storms. Moreover, the number fraction increase of soot-bearing particles also could be attributed to the increase of mixing state index (the metric to quantify the population mixing state, ranging from 0 for a completely external mixture to 1 for a completely internal mixture) as aging during transport (Riemer and West, 2013; Healy et al., 2014).
3.3 Quantifying the morphology of soot particles
The fractal dimension (Df) of soot particles is a key parameter used to reflect soot morphological structure; e.g., compact soot particles usually have larger Df than lacy aggregates (China et al., 2015; Wang et al., 2017; China et al., 2013). Therefore, Df can be used to understand soot aging processes in the atmosphere. Figure 5 shows that the Df sequence of soot particles is T1 (1.65) < T2 (1.84) < T3 (1.91). The Df of soot particles at T1 (1.65) is much closer to the values of soot emitted from sources, such as the Df from biomass burning in the range of 1.68–1.74 (Chakrabarty et al., 2006) and the Df from diesel burning in the range of 1.56–1.68 (Wentzel et al., 2003). The Df of soot particles at T3 (1.96 for partially embedded soot and 1.88 for fully embedded soot, Fig. S8) is close to that of aged soot (1.81–1.90) in remote marine air (China et al., 2015) and polluted air in northern China (Wang et al., 2017).
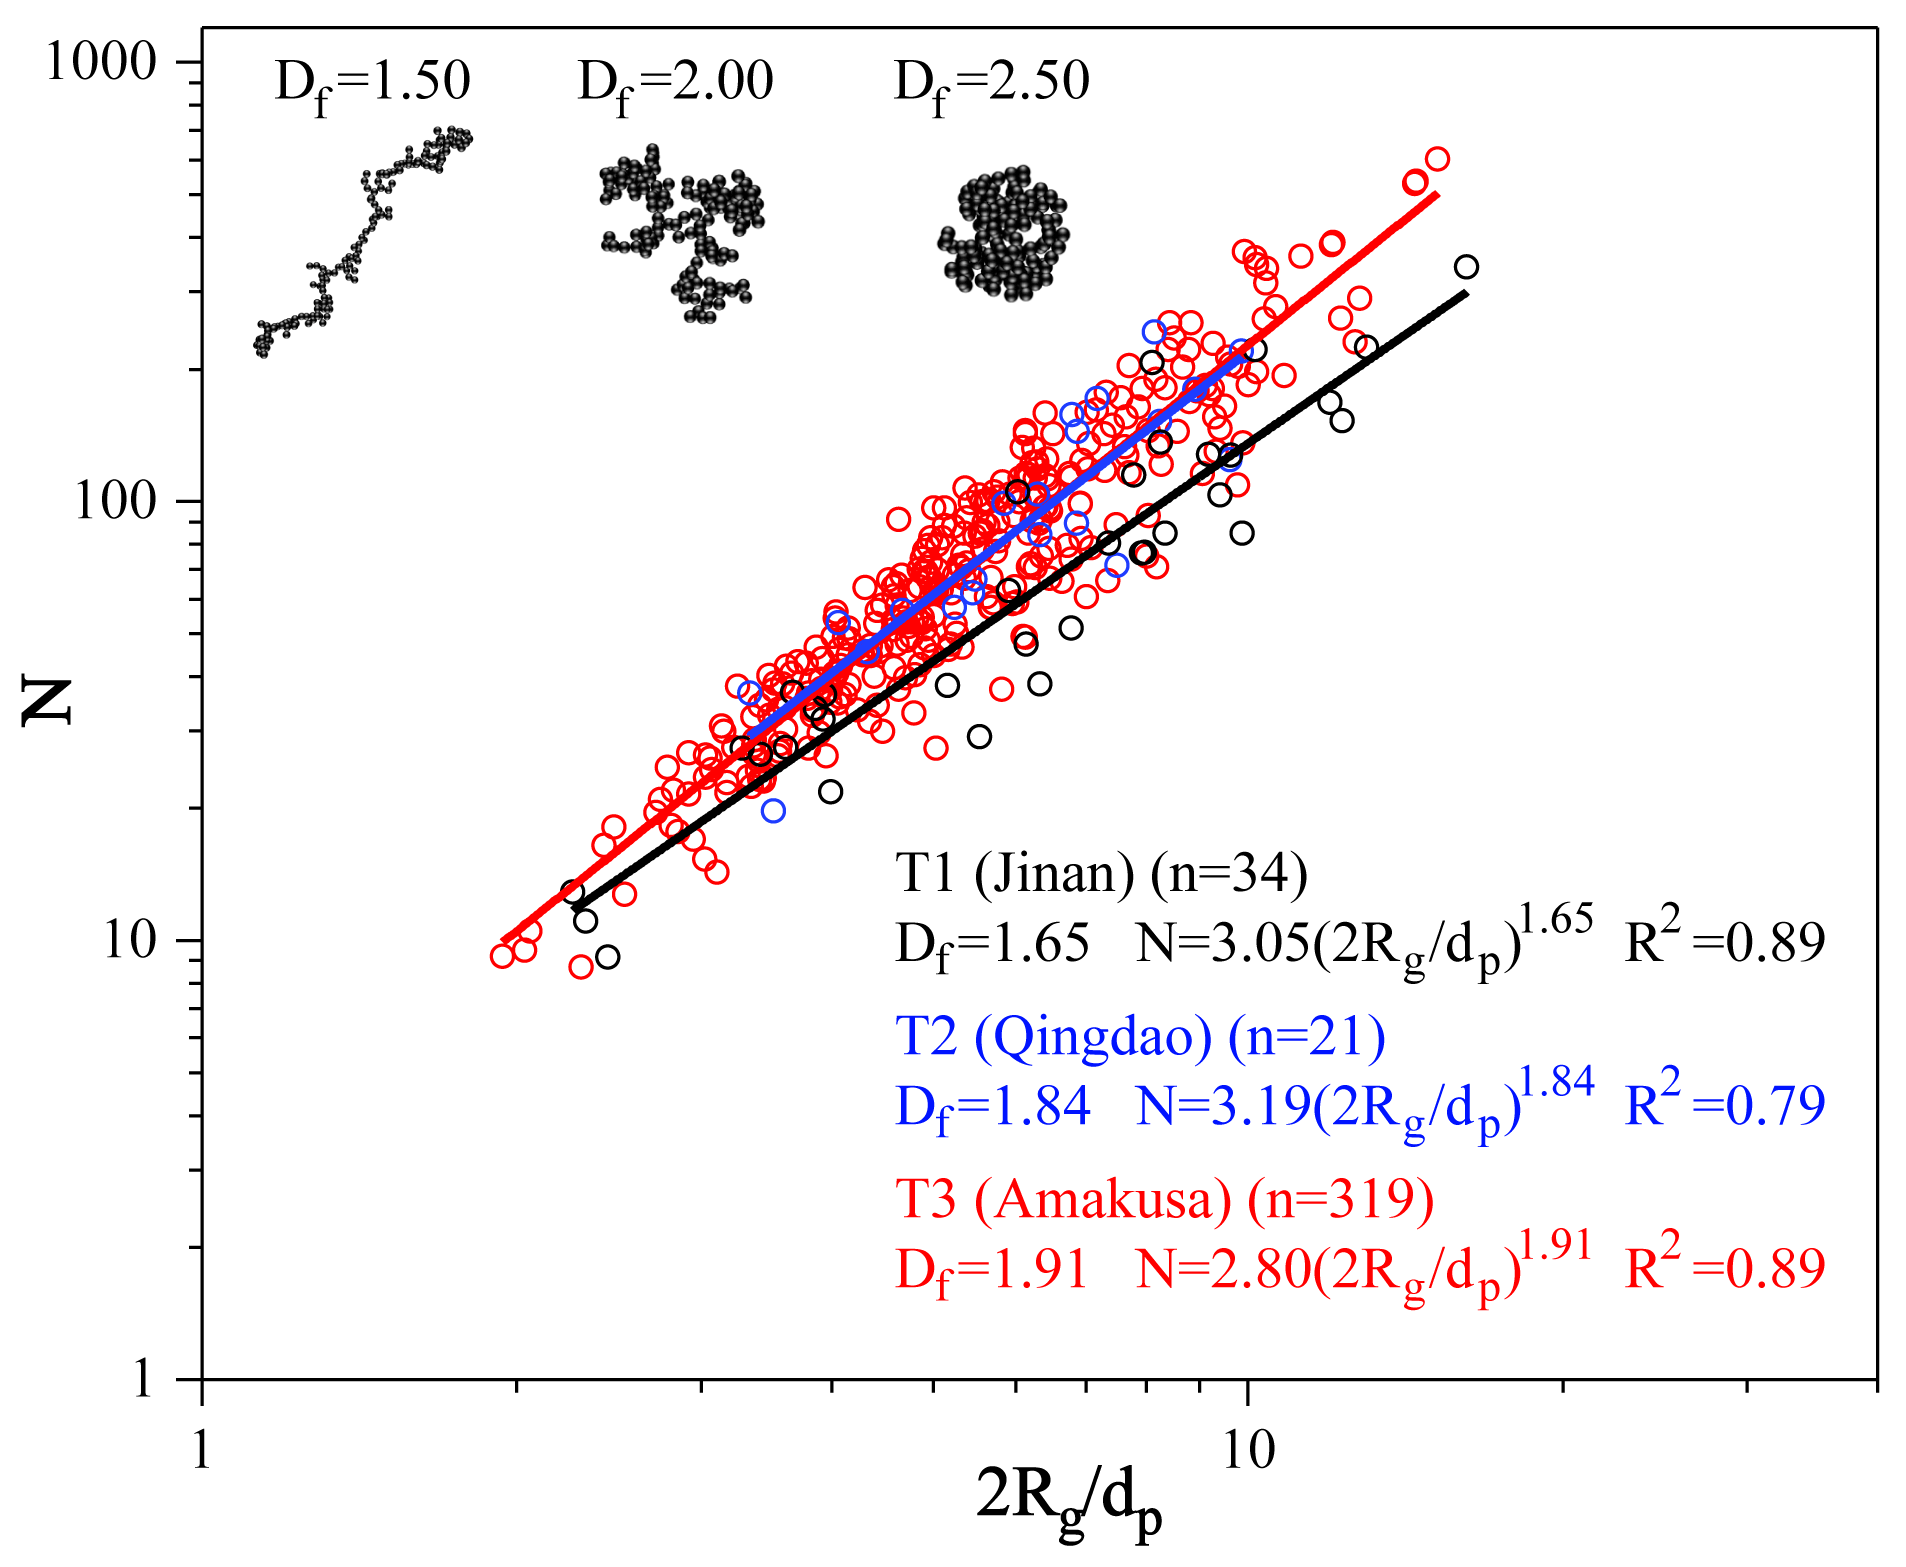
Figure 5Fractal dimension of soot-bearing particles at the three sampling sites. The parameter n in parentheses represents the total number of soot particles analyzed for each site to calculate Df and kg. Three model simulated soot particles with different Df are presented to represent different soot morphology. The inconsistency of analyzed soot number in Figs. 4 and 5 is attributed to the indistinct soot particles in the low-magnification TEM images that can be identified as soot but cannot provide necessary data for Df analysis.
At the three sampling sites, the highest Df value at T3 suggests a more compacted structure of the soot particles. Moreover, we obtained the shape factors of soot particles at the three sampling sites to indicate the compactness of soot particle. The average shape factor of soot particles at T3 was 0.73, much higher than 0.34 at T1 and 0.54 at T2 (Fig. 6a). These two parameters show that the soot morphology became more compact and had a rounder shape following the dust storm movement.
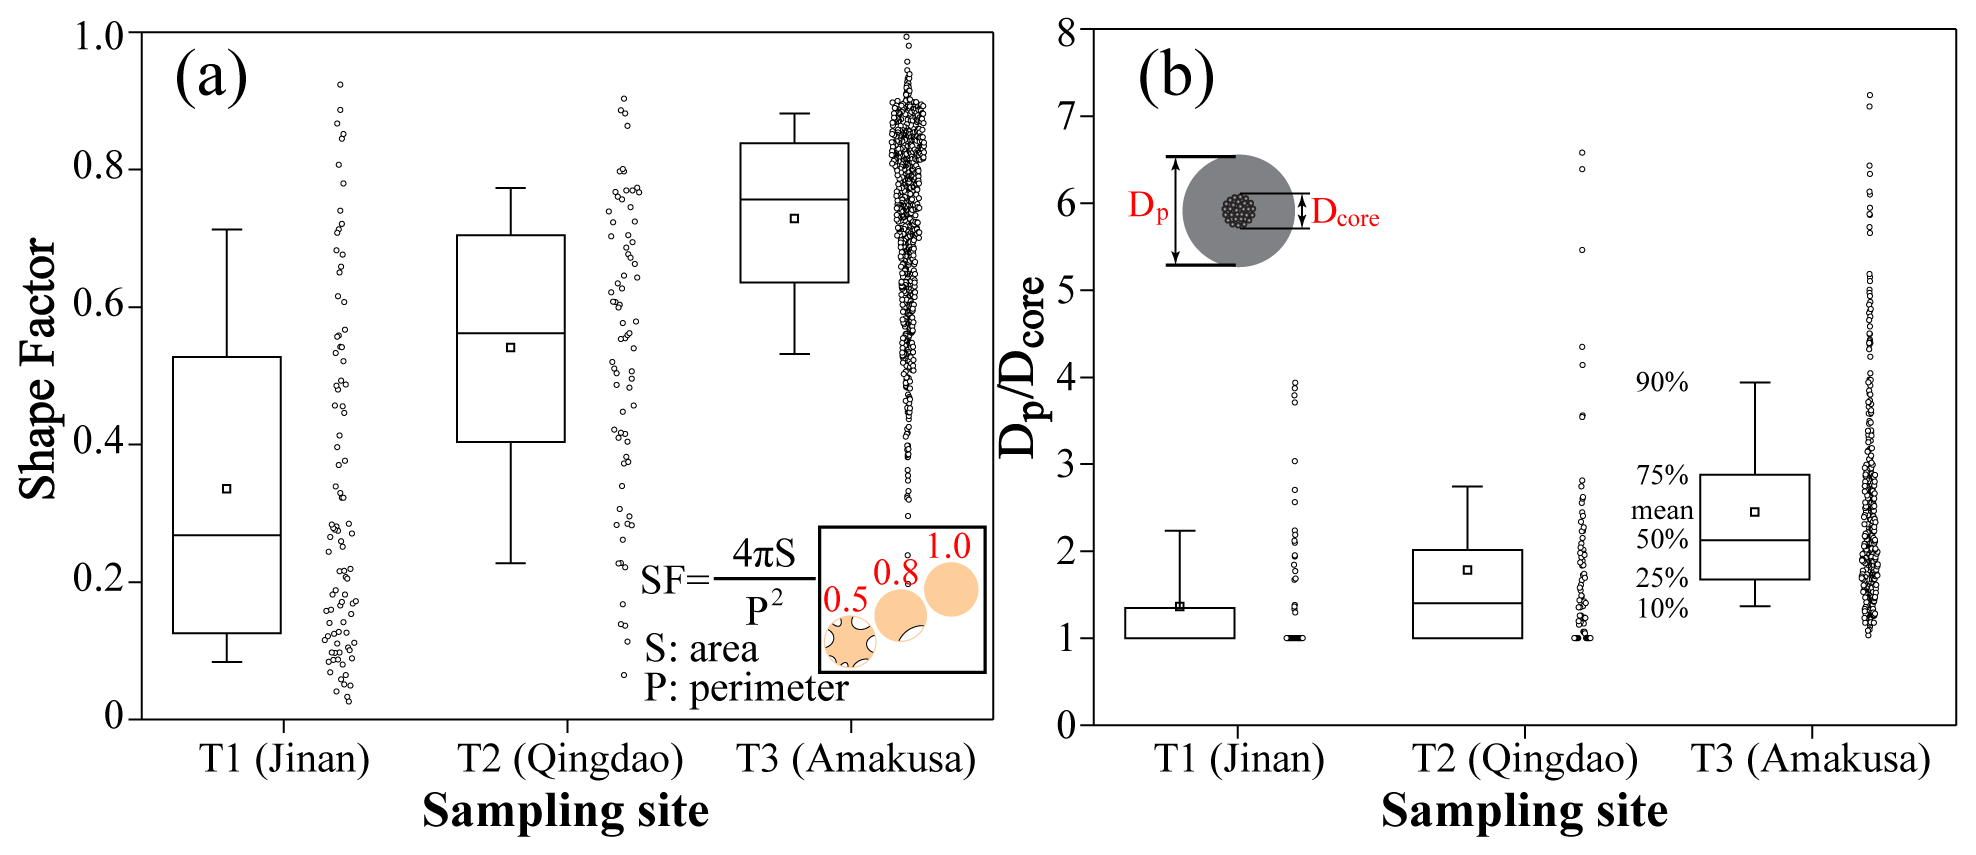
Figure 6(a) Shape factor of soot-bearing particles and (b) the particle-to-soot core diameter ratio (Dp∕Dcore) at the three sampling sites.
3.4 Soot-bearing particle size growth following soot aging
The average ratio (Dp∕Dcore) of the diameter of the internally mixed particle (Dp) to its corresponding soot core (Dcore) during the dust storm period was 1.42 at T1, 1.78 at T2, and 2.49 at T3 (Fig. 6b). Size distribution of the soot core indicates a small difference between T1, T2, and T3 during the dust storm period (peak at 200–250 nm, Fig. S9). Thus, the Dp∕Dcore increase from T1 to T3 is attributed to the increased coating thickness. The Dp∕Dcore values in this study are much higher than the reported values in fresh emissions (e.g., average value 1.24 for fossil fuel; Sahu et al., 2012) but close to ∼2.0 in aged aerosols in background and polluted air (Dahlkötter et al., 2014; Raatikainen et al., 2015; Metcalf et al., 2012). Recently, Peng et al. (2017) reported a high growth rate in urban Beijing and a derived average Dp∕Dcore value of 1.97 (1.34–2.61). The Dp∕Dcore value in urban Beijing air is much higher than our reported values of 1.42–1.78 at T1 and T2 during the dust storm period. This is understandable considering the weak secondary aerosol formation in the dust storm in the continental air as a result of acidic gases being scavenged by the large amounts of mineral dust particles (Li et al., 2016b).
Based on the air mass backward trajectories, we can infer that it took approximately 3 h for the cold front to move between T1 and T2 and 30 h from T2 to T3 (Fig. 1). Here, we calculated the coating volume of aged soot particles based on the values of Dp and Dcore of individual particles and found a 152 % increase in the coating volume from T1 to T2 and a 609 % increase from T2 to T3.
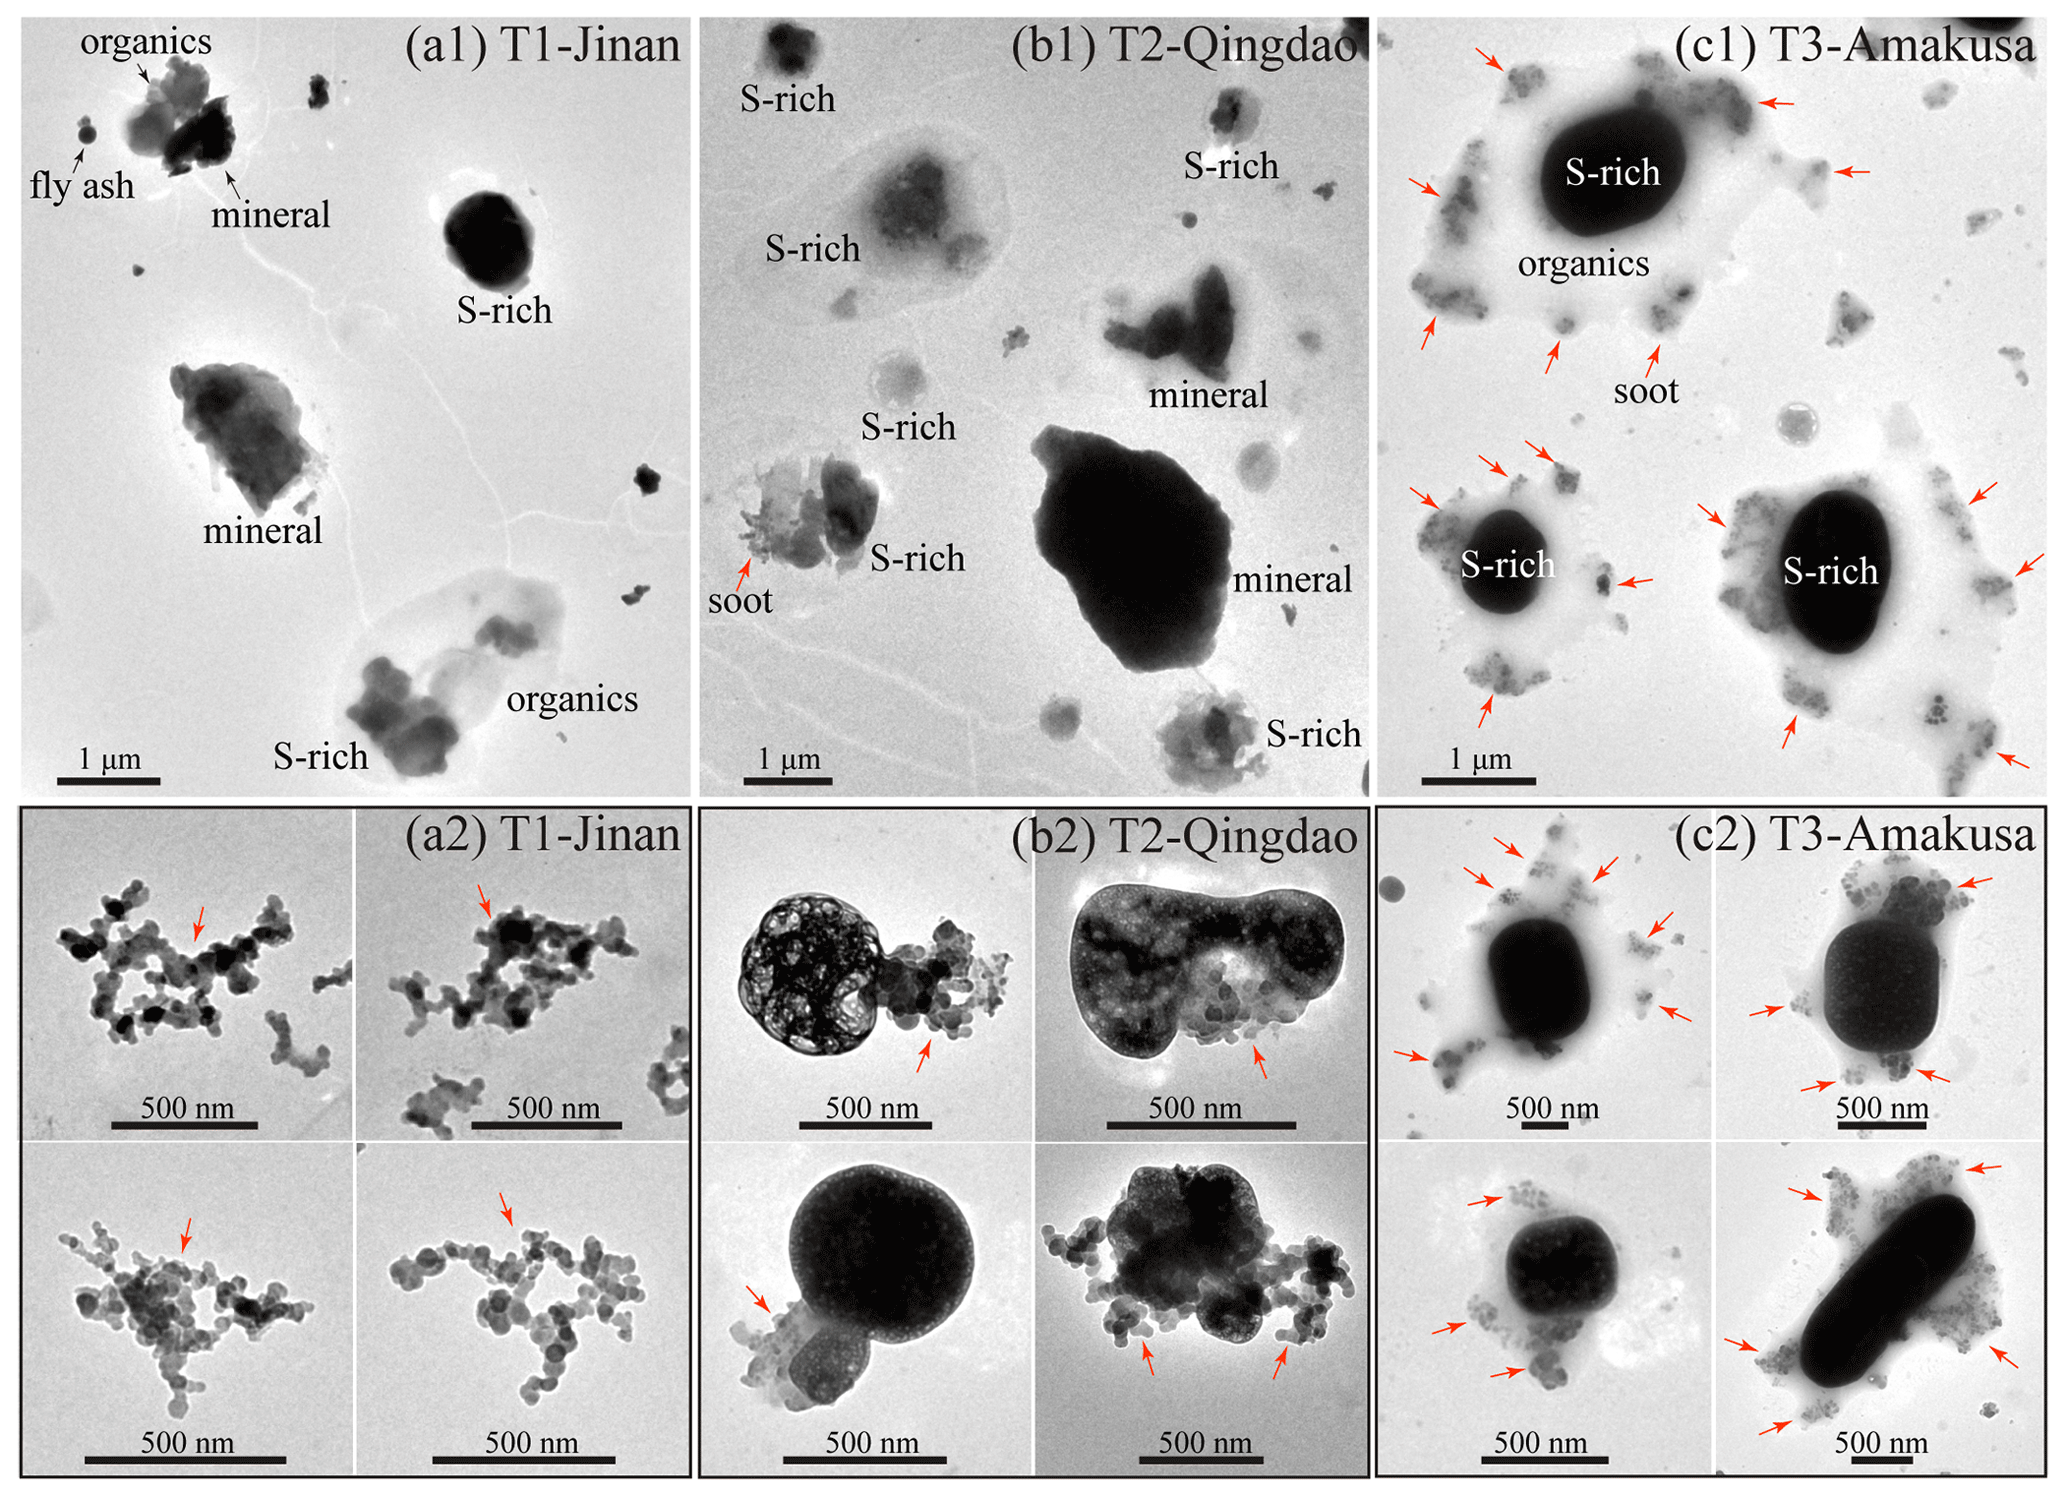
Figure 7(a1–c1) Low-magnification TEM images at T1, T2, and T3. (a2–c2) TEM images of soot-dominated particles at T1, T2, and T3.
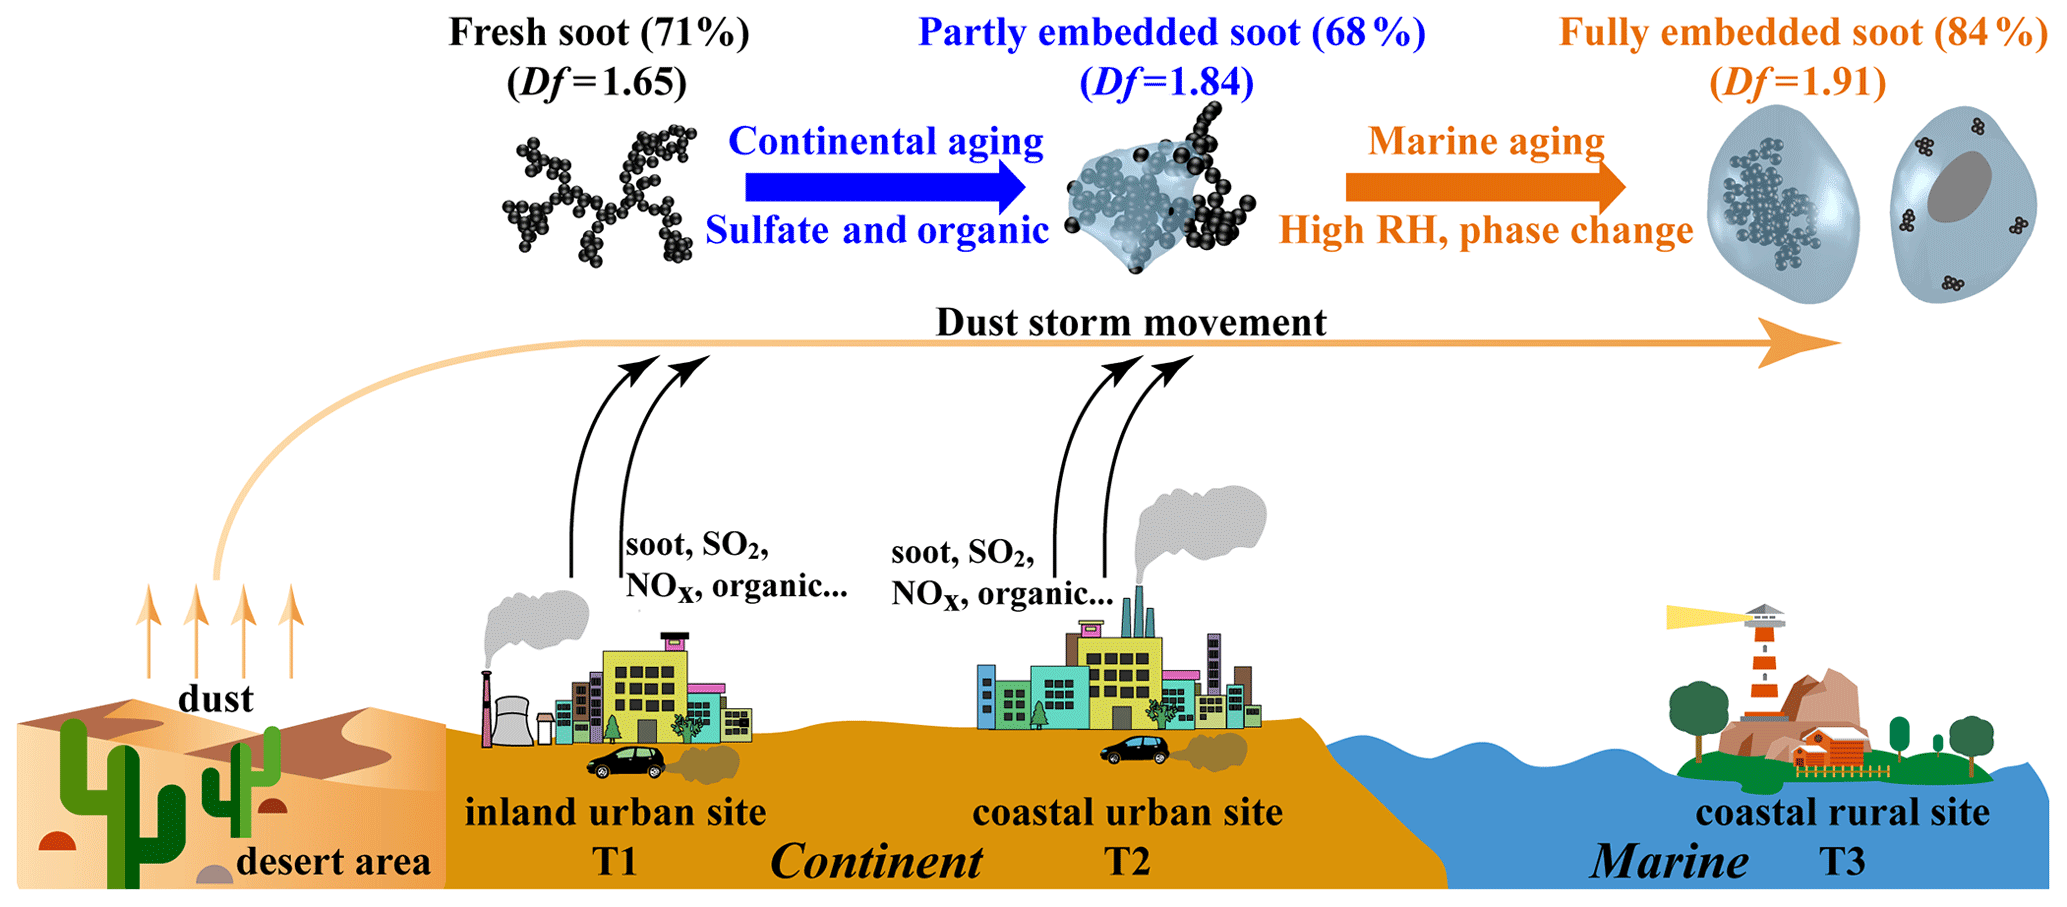
Figure 8Schematic diagram showing the evolution of morphology and mixing state of soot particles along with the movement of an Asian dust storm.
3.5 Aging mechanism of soot particles
We noticed that the partially embedded soot particles significantly increased from 14 % at T1 to 68 % at T2 (Fig. 4), indicating that the fresh soot particles aged during the dust storm movement from the inland to the coastal area. Meanwhile, we found that the Df value at T1 changed from 1.65 at T1 to 1.84 at T2. The strong diffusion during the dust storm is not conducive to soot accumulation (Pan et al., 2015). Although local emissions at T2 could interfere with the observation of the soot aging process, long-range-transported soot particles were still dominant at T2 during the cold front. These results indicate that the morphological structures of soot particles underwent changes along with the dust storm movement. In short, large amounts of fresh soot converted into partially embedded soot particles from T1 to T2 (Fig. 4).
Figure 4 shows that the fresh soot particles disappeared at T3, and the number fraction of fully embedded soot particles increased to 84 %. Moreover, the Df of soot particles had a large change from 1.84 at T2 to 1.91 at T3, which suggests that the morphology structure of soot particles changed from chainlike to compact when the air masses crossed the East China Sea (Fig. 5).
Secondary aerosol formation on soot particles can significantly change their fractal morphology into a compact shape (China et al., 2015; Wang et al., 2017; Ma et al., 2013; Pei et al., 2018). The thick coating of soot particles occurred when air masses crossed the East China Sea (Fig. 6b), suggesting that secondary aerosol coating formation can significantly compress the fractal morphology of soot particles. Recently, Yuan et al. (2019) further found that the phase change of secondary aerosols (due to RH variation) in aged soot particles could further compress the fractal shape of soot aggregates. The high humidity in marine air (T2 to T3) should lead to phase changes of secondary aerosols and further cause the morphological compactness of soot aggregations. These two reasons are able to explain the change in soot fractal dimension from T2 to T3 (Fig. 5).
TEM observations present a particular mixing structure of the fully embedded soot at T3: the organic coating instead of sulfate contains several typical soot particles, and the organic coating spreads on the substrate (named droplet-like particles; O'Brien et al., 2015; Li et al., 2011) (Figs. 3d, 7c1–c2). More than half of these types of particles contain one or two soot fragments, while 43 % of them include more than three soot fragments (Fig. S7). The droplet-like coating morphology of soot can reflect that these secondary particles were in an aqueous phase at T3 in the air. Similar droplet-like particles were not observed at T1 and T2 (Figs. 7a1–a2 and b1–b2). A previous study has shown that secondary aerosol particles begin to acquire aqueous shells at RH 60 % (Sun et al., 2018). Once secondary aerosols change from a solid to liquid phase following an RH increase in marine air, soot particles tend to adhere to the liquid phase through coagulation (Li et al., 2016b). Figure 7c1 and c2 show the phase separation of the organic coating and sulfate core on the substrate under the phenomenon of liquid–liquid phase separations (You et al., 2012). Recently, Brunamonti et al. (2015) found that soot particles tend to redistribute into the organic coating during liquid–liquid phase separation. Therefore, the soot distribution in the organic coating indicates that aerosol particles in the air mass at T3 underwent an aqueous aging process over the East China Sea, which is different from the continental aerosol particles at T1 and T2. It must be noted that several tiny soot particles were distributed in the organic coating at T3 (Fig. 7c1–c2), which did not occur at T1 and T2. There is no previous study to report the tiny scattered soot in the organic coating. We proposed a possible reason that soot particles with smaller size have a longer lifetime and could be transported over longer distances. Therefore, the tiny soot particles have more chances to coagulate with pre-existing aqueous secondary particles in marine air (Liu et al., 2018). Our findings suggest that the complex aqueous process of individual particles in marine air could result in scattered soot particles, but further studies are required to reveal the detailed reasons.
By tracing the soot particles during the dust storm, we can clarify that the morphology change of soot particles depends on the secondary coating thickness and relative humidity in the air. The microscopic changes between soot and coating could change their optical absorption, which is different from the core-shell absorption (He et al., 2015). Our study proposes that BC-related optical models should not only consider the mixing state of soot particles but also incorporate the morphological structure of soot particles in different air environments.
Based on the results and discussion above, we propose a conceptual model to summarize the evolution of morphology and mixing state of soot particles along with the movement of an Asian dust storm (Fig. 8). Dust storms in East Asia could carry soot and other anthropogenic pollutants from urban areas to downwind areas. During the transport, the dominated mixing structure of individual soot particles changed from fresh via partially embedded and finally to fully embedded. Meanwhile, the chainlike soot compressed and had a rounder shape depending on secondary coating thickness and relative humidity.
Individual aerosol particles were collected from 18 to 19 March 2014 during an Asian dust storm event. Three sampling sites along with the pathway of the dust storm were chosen to study soot aging, including an inland urban site in Jinan city, China (T1); a coastal urban site in Qingdao city, China (T2); and a coastal rural site at Amakusa, southwestern Japan (T3). Soot-bearing particles were classified into three types: fresh, partially embedded, and fully embedded. There was a noticeable difference in the mixing structure of soot particles during long-range transport, with 71 % fresh soot in the analyzed soot particles (by number) at T1, 68 % partially embedded soot at T2, and 84 % fully embedded soot at T3. The fractal dimension (Df) of soot particles at T3 (1.91) was higher than that at the other two sites (1.65 and 1.84), suggesting that soot particles converted from chainlike to compact shapes during long-range transport. This study showed that an increasing number of soot particles were internally mixed with secondary aerosol particles and significantly aged during transport. The average ratios of Dp∕Dcore during the dust storm period were 1.42 at T1, 1.78 at T2, and 2.49 at T3, indicating increasing coating thickness. By comparing the soot fractal dimension in continental air and marine air, we found that both secondary coating thickness and relative humidity can significantly change the fractal morphology of soot particles in the air. Individual particle analysis showed several tiny soot particles only observed in organic coatings instead of sulfate in individual soot-bearing particles at T3.
All data presented in this paper are available upon request from the corresponding author (liweijun@zju.edu.cn).
The supplement related to this article is available online at: https://doi.org/10.5194/acp-20-14321-2020-supplement.
LX and WL conceived the study and wrote the article. The field campaign was organized and supervised by WL and DZ. SF, KM, AN, and TK collected aerosol particles. LX, SoS, LL, YW, HN, and ZS contributed sample and data analyses. All authors reviewed and commented on the paper.
The authors declare that they have no conflict of interest.
We thank Peter Hyde for his editorial comments.
This research has been supported by the National Natural Science Foundation of China (grant nos. 42075096, 91844301, and 41807305), the National Key R&D Program of China (grant no. 2017YFC0212700), Zhejiang Provincial Natural Science Foundation of China (grant no. LZ19D050001), and China Postdoctoral Science Foundation (grant no. 2019M662021).
This paper was edited by Stefania Gilardoni and reviewed by two anonymous referees.
Adachi, K., Moteki, N., Kondo, Y., and Igarashi, Y.: Mixing states of light-absorbing particles measured using a transmission electron microscope and a single-particle soot photometer in Tokyo, Japan, J. Geophys. Res.-Atmos., 121, 9153–9164, https://doi.org/10.1002/2016JD025153, 2016.
Bond, T. C., Doherty, S. J., Fahey, D. W., Forster, P. M., Berntsen, T., DeAngelo, B. J., Flanner, M. G., Ghan, S., Kärcher, B., Koch, D., Kinne, S., Kondo, Y., Quinn, P. K., Sarofim, M. C., Schultz, M. G., Schulz, M., Venkataraman, C., Zhang, H., Zhang, S., Bellouin, N., Guttikunda, S. K., Hopke, P. K., Jacobson, M. Z., Kaiser, J. W., Klimont, Z., Lohmann, U., Schwarz, J. P., Shindell, D., Storelvmo, T., Warren, S. G., and Zender, C. S.: Bounding the role of black carbon in the climate system: A scientific assessment, J. Geophys. Res.-Atmos., 118, 5380–5552, https://doi.org/10.1002/jgrd.50171, 2013.
Brasil, A. M., Farias, T. L., and Carvalho, M. G.: A recipe for image characterization of fractal-Like aggregates, J. Aerosol Sci, 30, 1379–1389, https://doi.org/10.1016/S0021-8502(99)00026-9, 1999.
Brunamonti, S., Krieger, U. K., Marcolli, C., and Peter, T.: Redistribution of black carbon in aerosol particles undergoing liquid-liquid phase separation, Geophys. Res. Lett., 42, 2532–2539, https://doi.org/10.1002/2014GL062908, 2015.
Buseck, P. R., Adachi, K., Gelencsér, A., Tompa, É., and Pósfai, M.: Ns-Soot: A Material-Based Term for Strongly Light-Absorbing Carbonaceous Particles, Aerosol Sci. Technol., 48, 777–788, https://doi.org/10.1080/02786826.2014.919374, 2014.
Cappa, C. D., Onasch, T. B., Massoli, P., Worsnop, D. R., Bates, T. S., Cross, E. S., Davidovits, P., Hakala, J., Hayden, K. L., Jobson, B. T., Kolesar, K. R., Lack, D. A., Lerner, B. M., Li, S.-M., Mellon, D., Nuaaman, I., Olfert, J. S., Petäjä, T., Quinn, P. K., Song, C., Subramanian, R., Williams, E. J., and Zaveri, R. A.: Radiative Absorption Enhancements Due to the Mixing State of Atmospheric Black Carbon, Science, 337, 1078–1081, https://doi.org/10.1126/science.1223447, 2012.
Chakrabarty, R. K., Moosmüller, H., Garro, M. A., Arnott, W. P., Walker, J., Susott, R. A., Babbitt, R. E., Wold, C. E., Lincoln, E. N., and Hao, W. M.: Emissions from the laboratory combustion of wildland fuels: Particle morphology and size, J. Geophys. Res.-Atmos., 111, D07204, https://doi.org/10.1029/2005JD006659, 2006.
Chi, J. W., Li, W. J., Zhang, D. Z., Zhang, J. C., Lin, Y. T., Shen, X. J., Sun, J. Y., Chen, J. M., Zhang, X. Y., Zhang, Y. M., and Wang, W. X.: Sea salt aerosols as a reactive surface for inorganic and organic acidic gases in the Arctic troposphere, Atmos. Chem. Phys., 15, 11341–11353, https://doi.org/10.5194/acp-15-11341-2015, 2015.
China, S., Mazzoleni, C., Gorkowski, K., Aiken, A. C., and Dubey, M. K.: Morphology and mixing state of individual freshly emitted wildfire carbonaceous particles, Nat. Commun., 4, 2122, https://doi.org/10.1038/ncomms3122, 2013.
China, S., Scarnato, B., Owen, R. C., Zhang, B., Ampadu, M. T., Kumar, S., Dzepina, K., Dziobak, M. P., Fialho, P., and Perlinger, J. A.: Morphology and mixing state of aged soot particles at a remote marine free troposphere site: Implications for optical properties, Geophys. Res. Lett., 42, 1243–1250, https://doi.org/10.1002/2014GL062404, 2015.
Dahlkötter, F., Gysel, M., Sauer, D., Minikin, A., Baumann, R., Seifert, P., Ansmann, A., Fromm, M., Voigt, C., and Weinzierl, B.: The Pagami Creek smoke plume after long-range transport to the upper troposphere over Europe – aerosol properties and black carbon mixing state, Atmos. Chem. Phys., 14, 6111–6137, https://doi.org/10.5194/acp-14-6111-2014, 2014.
Ding, A. J., Huang, X., Nie, W., Sun, J. N., Kerminen, V. M., Petäjä, T., Su, H., Cheng, Y. F., Yang, X. Q., Wang, M. H., Chi, X. G., Wang, J. P., Virkkula, A., Guo, W. D., Yuan, J., Wang, S. Y., Zhang, R. J., Wu, Y. F., Song, Y., Zhu, T., Zilitinkevich, S., Kulmala, M., and Fu, C. B.: Enhanced haze pollution by black carbon in megacities in China, Geophys. Res. Lett., 43, 2873–2879, https://doi.org/10.1002/2016GL067745, 2016.
Ding, S., Liu, D., Zhao, D., Hu, K., Tian, P., Zhou, W., Huang, M., Yang, Y., Wang, F., Sheng, J., Liu, Q., Kong, S., Cui, P., Huang, Y., He, H., Coe, H., and Ding, D.: Size-Related Physical Properties of Black Carbon in the Lower Atmosphere over Beijing and Europe, Environ. Sci. Technol., 53, 11112–11121, https://doi.org/10.1021/acs.est.9b03722, 2019.
Geng, H., Hwang, H., Liu, X., Dong, S., and Ro, C.-U.: Investigation of aged aerosols in size-resolved Asian dust storm particles transported from Beijing, China, to Incheon, Korea, using low-Z particle EPMA, Atmos. Chem. Phys., 14, 3307–3323, https://doi.org/10.5194/acp-14-3307-2014, 2014.
He, C., Liou, K.-N., Takano, Y., Zhang, R., Levy Zamora, M., Yang, P., Li, Q., and Leung, L. R.: Variation of the radiative properties during black carbon aging: theoretical and experimental intercomparison, Atmos. Chem. Phys., 15, 11967–11980, https://doi.org/10.5194/acp-15-11967-2015, 2015.
Healy, R. M., Riemer, N., Wenger, J. C., Murphy, M., West, M., Poulain, L., Wiedensohler, A., O'Connor, I. P., McGillicuddy, E., Sodeau, J. R., and Evans, G. J.: Single particle diversity and mixing state measurements, Atmos. Chem. Phys., 14, 6289–6299, https://doi.org/10.5194/acp-14-6289-2014, 2014.
IPCC: Clouds and Aerosols, in: Climate Change 2013: The Physical Science Basis, Contribution of Working Group I to the Fifth Assessment Report of the Intergovernmental Panel on Climate Change, Intergovernmental Panel on Climate Change (IPCC), Cambridge, United Kingdom and New York, NY, USA, 571–657, 2013.
Jacobson, M. Z.: Strong radiative heating due to the mixing state of black carbon in atmospheric aerosols, Nature, 409, 695–697, https://doi.org/10.1038/35055518, 2001.
Koeylue, U., Xing, Y., and Rosner, D. E.: Fractal Morphology Analysis of Combustion-Generated Aggregates Using Angular Light Scattering and Electron Microscope Images, Langmuir, 11, 4848–4854, https://doi.org/10.1021/la00012a043, 1995.
Laskin, A., Moffet, R. C., and Gilles, M. K.: Chemical Imaging of Atmospheric Particles, Acc. Chem. Res., 52, 3419–3431, https://doi.org/10.1021/acs.accounts.9b00396, 2019.
Lee, A. K. Y., Rivellini, L.-H., Chen, C.-L., Liu, J., Price, D. J., Betha, R., Russell, L. M., Zhang, X., and Cappa, C. D.: Influences of Primary Emission and Secondary Coating Formation on the Particle Diversity and Mixing State of Black Carbon Particles, Environ. Sci. Technol., 53, 9429–9438, https://doi.org/10.1021/acs.est.9b03064, 2019.
Li, J., Liu, C., Yin, Y., and Kumar, K. R.: Numerical investigation on the Ångström exponent of black carbon aerosol, J. Geophys. Res.-Atmos., 121, 3506–3518, https://doi.org/10.1002/2015JD024718, 2016a.
Li, W., Zhou, S., Wang, X., Xu, Z., Yuan, C., Yu, Y., Zhang, Q., and Wang, W.: Integrated evaluation of aerosols from regional brown hazes over northern China in winter: Concentrations, sources, transformation, and mixing states, J. Geophys. Res.-Atmos., 116, D09301, https://doi.org/10.1029/2010JD015099, 2011.
Li, W., Shao, L., Shi, Z., Chen, J., Yang, L., Yuan, Q., Yan, C., Zhang, X., Wang, Y., Sun, J., Zhang, Y., Shen, X., Wang, Z., and Wang, W.: Mixing state and hygroscopicity of dust and haze particles before leaving Asian continent, J. Geophys. Res.-Atmos., 119, 1044–1059, https://doi.org/10.1002/2013JD021003, 2014.
Li, W., Sun, J., Xu, L., Shi, Z., Riemer, N., Sun, Y., Fu, P., Zhang, J., Lin, Y., Wang, X., Shao, L., Chen, J., Zhang, X., Wang, Z., and Wang, W.: A conceptual framework for mixing structures in individual aerosol particles, J. Geophys. Res.-Atmos., 121, 13784–13798, https://doi.org/10.1002/2016JD025252, 2016b.
Liu, D., Whitehead, J., Alfarra, M. R., Reyes-Villegas, E., Spracklen, D. V., Reddington, C. L., Kong, S., Williams, P. I., Ting, Y.-C., Haslett, S., Taylor, J. W., Flynn, M. J., Morgan, W. T., McFiggans, G., Coe, H., and Allan, J. D.: Black-carbon absorption enhancement in the atmosphere determined by particle mixing state, Nat. Geosci., 10, 184–188, https://doi.org/10.1038/ngeo2901, 2017.
Liu, L., Zhang, J., Xu, L., Yuan, Q., Huang, D., Chen, J., Shi, Z., Sun, Y., Fu, P., Wang, Z., Zhang, D., and Li, W.: Cloud scavenging of anthropogenic refractory particles at a mountain site in North China, Atmos. Chem. Phys., 18, 14681–14693, https://doi.org/10.5194/acp-18-14681-2018, 2018.
Ma, X., Zangmeister, C. D., Gigault, J., Mulholland, G. W., and Zachariah, M. R.: Soot aggregate restructuring during water processing, J. Aerosol Sci, 66, 209–219, https://doi.org/10.1016/j.jaerosci.2013.08.001, 2013.
Matsui, H., Hamilton, D. S., and Mahowald, N. M.: Black carbon radiative effects highly sensitive to emitted particle size when resolving mixing-state diversity, Nat. Commun., 9, 3446, https://doi.org/10.1038/s41467-018-05635-1, 2018.
Metcalf, A. R., Craven, J. S., Ensberg, J. J., Brioude, J., Angevine, W., Sorooshian, A., Duong, H. T., Jonsson, H. H., Flagan, R. C., and Seinfeld, J. H.: Black carbon aerosol over the Los Angeles Basin during CalNex, J. Geophys. Res.-Atmos., 117, D00V13, https://doi.org/10.1029/2011JD017255, 2012.
Moffet, R. C. and Prather, K. A.: In-situ measurements of the mixing state and optical properties of soot with implications for radiative forcing estimates, P. Natl. Acad. Sci. USA, 106, 11872–11877, https://doi.org/10.1073/pnas.0900040106, 2009.
O'Brien, R. E., Wang, B., Kelly, S. T., Lundt, N., You, Y., Bertram, A. K., Leone, S. R., Laskin, A., and Gilles, M. K.: Liquid–Liquid Phase Separation in Aerosol Particles: Imaging at the Nanometer Scale, Environ. Sci. Technol., 49, 4995–5002, https://doi.org/10.1021/acs.est.5b00062, 2015.
Oh, C. and Sorensen, C. M.: The Effect of Overlap between Monomers on the Determination of Fractal Cluster Morphology, J. Colloid Interface Sci., 193, 17–25, https://doi.org/10.1006/jcis.1997.5046, 1997.
Pan, X., Uno, I., Hara, Y., Kuribayashi, M., Kobayashi, H., Sugimoto, N., Yamamoto, S., Shimohara, T., and Wang, Z.: Observation of the simultaneous transport of Asian mineral dust aerosols with anthropogenic pollutants using a POPC during a long-lasting dust event in late spring 2014, Geophys. Res. Lett., 42, 1593–1598, https://doi.org/10.1002/2014GL062491, 2015.
Pei, X., Hallquist, M., Eriksson, A. C., Pagels, J., Donahue, N. M., Mentel, T., Svenningsson, B., Brune, W., and Pathak, R. K.: Morphological transformation of soot: investigation of microphysical processes during the condensation of sulfuric acid and limonene ozonolysis product vapors, Atmos. Chem. Phys., 18, 9845–9860, https://doi.org/10.5194/acp-18-9845-2018, 2018.
Peng, J., Hu, M., Guo, S., Du, Z., Shang, D., Zheng, J., Zheng, J., Zeng, L., Shao, M., Wu, Y., Collins, D., and Zhang, R.: Ageing and hygroscopicity variation of black carbon particles in Beijing measured by a quasi-atmospheric aerosol evolution study (QUALITY) chamber, Atmos. Chem. Phys., 17, 10333–10348, https://doi.org/10.5194/acp-17-10333-2017, 2017.
Perring, A. E., Schwarz, J. P., Markovic, M. Z., Fahey, D. W., Jimenez, J. L., Campuzano-Jost, P., Palm, B. D., Wisthaler, A., Mikoviny, T., Diskin, G., Sachse, G., Ziemba, L., Anderson, B., Shingler, T., Crosbie, E., Sorooshian, A., Yokelson, R., and Gao, R.-S.: In situ measurements of water uptake by black carbon-containing aerosol in wildfire plumes, J. Geophys. Res.-Atmos., 122, 1086–1097, https://doi.org/10.1002/2016JD025688, 2017.
Raatikainen, T., Brus, D., Hyvärinen, A.-P., Svensson, J., Asmi, E., and Lihavainen, H.: Black carbon concentrations and mixing state in the Finnish Arctic, Atmos. Chem. Phys., 15, 10057–10070, https://doi.org/10.5194/acp-15-10057-2015, 2015.
Riemer, N., West, M., Zaveri, R., and Easter, R.: Estimating black carbon aging time-scales with a particle-resolved aerosol model, J. Aerosol Sci, 41, 143–158, https://doi.org/10.1016/j.jaerosci.2009.08.009, 2010.
Riemer, N. and West, M.: Quantifying aerosol mixing state with entropy and diversity measures, Atmos. Chem. Phys., 13, 11423–11439, https://doi.org/10.5194/acp-13-11423-2013, 2013.
Sahu, L. K., Kondo, Y., Moteki, N., Takegawa, N., Zhao, Y., Cubison, M. J., Jimenez, J. L., Vay, S., Diskin, G. S., Wisthaler, A., Mikoviny, T., Huey, L. G., Weinheimer, A. J., and Knapp, D. J.: Emission characteristics of black carbon in anthropogenic and biomass burning plumes over California during ARCTAS-CARB 2008, J. Geophys. Res.-Atmos., 117, D16302, https://doi.org/10.1029/2011JD017401, 2012.
Shiraiwa, M., Kondo, Y., Moteki, N., Takegawa, N., Miyazaki, Y., and Blake, D. R.: Evolution of mixing state of black carbon in polluted air from Tokyo, Geophys. Res. Lett., 34, L16803, https://doi.org/10.1029/2007GL029819, 2007.
Stein, A. F., Draxler, R. R., Rolph, G. D., Stunder, B. J. B., Cohen, M. D., and Ngan, F.: NOAA's HYSPLIT Atmospheric Transport and Dispersion Modeling System, B. Am. Meteorol. Soc., 96, 2059–2077, https://doi.org/10.1175/bams-d-14-00110.1, 2015.
Sun, J., Liu, L., Xu, L., Wang, Y., Wu, Z., Hu, M., Shi, Z., Li, Y., Zhang, X., Chen, J., and Li, W.: Key Role of Nitrate in Phase Transitions of Urban Particles: Implications of Important Reactive Surfaces for Secondary Aerosol Formation, J. Geophys. Res.-Atmos., 123, 1234–1243, https://doi.org/10.1002/2017JD027264, 2018.
Ueda, S., Nakayama, T., Taketani, F., Adachi, K., Matsuki, A., Iwamoto, Y., Sadanaga, Y., and Matsumi, Y.: Light absorption and morphological properties of soot-containing aerosols observed at an East Asian outflow site, Noto Peninsula, Japan, Atmos. Chem. Phys., 16, 2525–2541, https://doi.org/10.5194/acp-16-2525-2016, 2016.
Wang, J., Cubison, M. J., Aiken, A. C., Jimenez, J. L., and Collins, D. R.: The importance of aerosol mixing state and size-resolved composition on CCN concentration and the variation of the importance with atmospheric aging of aerosols, Atmos. Chem. Phys., 10, 7267–7283, https://doi.org/10.5194/acp-10-7267-2010, 2010.
Wang, Y., Liu, F., He, C., Bi, L., Cheng, T., Wang, Z., Zhang, H., Zhang, X., Shi, Z., and Li, W.: Fractal Dimensions and Mixing Structures of Soot Particles during Atmospheric Processing, Environ. Sci. Technol. Lett., 4, 487–493, https://doi.org/10.1021/acs.estlett.7b00418, 2017.
Wentzel, M., Gorzawski, H., Naumann, K. H., Saathoff, H., and Weinbruch, S.: Transmission electron microscopical and aerosol dynamical characterization of soot aerosols, J. Aerosol Sci, 34, 1347–1370, https://doi.org/10.1016/S0021-8502(03)00360-4, 2003.
West, J. J., Cohen, A., Dentener, F., Brunekreef, B., Zhu, T., Armstrong, B., Bell, M. L., Brauer, M., Carmichael, G., Costa, D. L., Dockery, D. W., Kleeman, M., Krzyzanowski, M., Künzli, N., Liousse, C., Lung, S.-C. C., Martin, R. V., Pöschl, U., Pope, C. A., Roberts, J. M., Russell, A. G., and Wiedinmyer, C.: What We Breathe Impacts Our Health: Improving Understanding of the Link between Air Pollution and Health, Environ. Sci. Technol., 50, 4895–4904, https://doi.org/10.1021/acs.est.5b03827, 2016.
Wu, Y., Cheng, T., Liu, D., Allan, J. D., Zheng, L., and Chen, H.: Light Absorption Enhancement of Black Carbon Aerosol Constrained by Particle Morphology, Environ. Sci. Technol., 52, 6912–6919, https://doi.org/10.1021/acs.est.8b00636, 2018.
Xu, L., Zhang, D., and Li, W.: Microscopic comparison of aerosol particles collected at an urban site in North China and a coastal site in Japan, Sci. Total Environ., 669, 948–954, https://doi.org/10.1016/j.scitotenv.2019.03.163, 2019.
You, Y., Renbaum-Wolff, L., Carreras-Sospedra, M., Hanna, S. J., Hiranuma, N., Kamal, S., Smith, M. L., Zhang, X., Weber, R. J., Shilling, J. E., Dabdub, D., Martin, S. T., and Bertram, A. K.: Images reveal that atmospheric particles can undergo liquid–liquid phase separations, P. Natl. Acad. Sci. USA, 109, 13188–13193, https://doi.org/10.1073/pnas.1206414109, 2012.
Yuan, Q., Xu, J., Wang, Y., Zhang, X., Pang, Y., Liu, L., Bi, L., Kang, S., and Li, W.: Mixing State and Fractal Dimension of Soot Particles at a Remote Site in the Southeastern Tibetan Plateau, Environ. Sci. Technol., 53, 8227–8234, https://doi.org/10.1021/acs.est.9b01917, 2019.
Zhang, D., Iwasaka, Y., Shi, G., Zang, J., Hu, M., and Li, C.: Separated status of the natural dust plume and polluted air masses in an Asian dust storm event at coastal areas of China, J. Geophys. Res.-Atmos., 110, D06302, https://doi.org/10.1029/2004JD005305, 2005.
Zhang, G., Bi, X., Li, L., Chan, L. Y., Li, M., Wang, X., Sheng, G., Fu, J., and Zhou, Z.: Mixing state of individual submicron carbon-containing particles during spring and fall seasons in urban Guangzhou, China: a case study, Atmos. Chem. Phys., 13, 4723–4735, https://doi.org/10.5194/acp-13-4723-2013, 2013.
Zhang, R., Khalizov, A. F., Pagels, J., Zhang, D., Xue, H., and McMurry, P. H.: Variability in morphology, hygroscopicity, and optical properties of soot aerosols during atmospheric processing, P. Natl. Acad. Sci. USA, 105, 10291–10296, https://doi.org/10.1073/pnas.0804860105, 2008.
Zhang, X., Mao, M., Yin, Y., and Wang, B.: Numerical Investigation on Absorption Enhancement of Black Carbon Aerosols Partially Coated With Nonabsorbing Organics, J. Geophys. Res.-Atmos., 123, 1297–1308, https://doi.org/10.1002/2017JD027833, 2018a.
Zhang, Y., Su, H., Ma, N., Li, G., Kecorius, S., Wang, Z., Hu, M., Zhu, T., He, K., Wiedensohler, A., Zhang, Q., and Cheng, Y.: Sizing of Ambient Particles From a Single-Particle Soot Photometer Measurement to Retrieve Mixing State of Black Carbon at a Regional Site of the North China Plain, J. Geophys. Res.-Atmos., 123, 12778–12795, https://doi.org/10.1029/2018JD028810, 2018b.