the Creative Commons Attribution 4.0 License.
the Creative Commons Attribution 4.0 License.
 | 24 Nov 2020
A comparison of PM2.5-bound polycyclic aromatic hydrocarbons in summer Beijing (China) and Delhi (India)
Gareth J. Stewart
Stefan J. Swift
Beth S. Nelson
Leigh R. Crilley
Mohammed S. Alam
Ernesto Reyes-Villegas
Ranu Gadi
Roy M. Harrison
Jacqueline F. Hamilton
Alastair C. Lewis
Polycyclic aromatic hydrocarbons (PAHs) are ubiquitous pollutants in air, soil, and water and are known to have harmful effects on human health and the environment. The diurnal and nocturnal variations of 17 PAHs in ambient particle-bound PAHs were measured in urban Beijing (China) and Delhi (India) during the summer season using gas-chromatography–quadrupole time-of-flight mass spectrometry (GC-Q-TOF-MS). The mean concentration of particles less than 2.5 µm (PM2.5) observed in Delhi was 3.6 times higher than in Beijing during the measurement period in both the daytime and night-time. In Beijing, the mean concentration of the sum of the 17 PAHs (∑17 PAHs) was 8.2 ± 5.1 ng m−3 in daytime, with the highest contribution from indeno[1,2,3-cd]pyrene (12 %), while at night-time the total PAHs was 7.2 ± 2.0 ng m−3, with the largest contribution from benzo[b]fluoranthene (14 %). In Delhi, the mean ∑17 PAHs was 13.6 ± 5.9 ng m−3 in daytime and 22.7 ± 9.4 ng m−3 at night-time, with the largest contribution from indeno[1,2,3-cd]pyrene in both the day (17 %) and night (20 %). Elevated mean concentrations of total PAHs in Delhi observed at night were attributed to emissions from vehicles and biomass burning and to meteorological conditions leading to their accumulation from a stable and low atmospheric boundary layer. Local emission sources were typically identified as the major contributors to total measured PAHs in both cities. Major emission sources were characterized based on the contribution from each class of PAHs, with the four-, five- and six-ring PAHs accounting ∼ 95 % of the total PM2.5-bound PAHs mass in both locations. The high contribution of five-ring PAHs to total PAH concentration in summer Beijing and Delhi suggests a high contribution from petroleum combustion. In Delhi, a high contribution from six-ring PAHs was observed at night, suggesting a potential emission source from the combustion of fuel and oil in power generators, widely used in Delhi. The lifetime excess lung cancer risk (LECR) was calculated for Beijing and Delhi, with the highest estimated risk attributed to Delhi (LECR = 155 per million people), which is 2.2 times higher than the Beijing risk assessment value (LECR = 70 per million people). Finally, we have assessed the emission control policies in each city and identified those major sectors that could be subject to mitigation measures.
- Article
(1003 KB) - Full-text XML
-
Supplement
(259 KB) - BibTeX
- EndNote


The significant increase in particulate matter (PM) and gaseous pollutants over the past decades in some rapidly expanding economies has led to greater emphasis being placed on mitigation of emissions and management of air quality health effects. To support such measures requires insight in both the sources of pollution and the composition of pollution so that most harmful sources may be tackled as a priority. Although there have been recent improvements that have reduced primary particle concentrations in some regions, concentrations of many damaging gases and fine particles continue to exceed WHO guidelines (WHO, 2016) in megacities such as Beijing (Elzein et al., 2019; Lin et al., 2018; Gao and Ji, 2018) and Delhi (Kanawade et al., 2019; Sharma et al., 2007) and in many other cities around the world such as Cairo, Egypt (Cheng et al., 2016), and Islamabad, Pakistan (Mehmood et al., 2020). Growing populations, human activities, energy consumption and natural contributions (volcanic eruptions and forest fires) are an important contributor to particle emissions. PM monitoring and analysis become ever more important because of its adverse effect on human health. The chemical composition of airborne particles influences the health impacts, particularly the abundance of primary and secondary organic matter, metals and ions (WHO, 2016; Bond et al., 2004; Saikawa et al., 2009). Fine particles become more harmful as particle size decreases (ultrafine); they enter the human body through the lungs and may translocate to other organs, causing respiratory diseases and cancer (Schraufnagel., 2020). The greatest adverse effects on human health in epidemiological studies are currently associated with the mass of particles less than 2.5 µm in diameter (PM2.5) (Raaschou-Nielsen et al., 2013; Pun et al., 2017; Hamra et al., 2014). The organic component of PM2.5 consists of thousands of compounds, among them polycyclic aromatic hydrocarbons (PAHs), a particular class of species with high toxic potency. They are released into the atmosphere from both natural and anthropogenic sources. PAHs are considered ubiquitous in the environment and can be found in soil and water via dry or wet atmospheric deposition (Menzie et al., 1992; Meador et al., 1995). Their major emissions come from anthropogenic sources and include incomplete combustion of fossil fuels, vehicle exhaust emissions, cigarette emissions, agricultural burning and industrial activities (Saikawa et al., 2009). It has been shown that PAHs can react with atmospheric oxidants, leading to the formation of secondary species with direct-acting mutagenicity and carcinogenicity, and thus they can be significant contributors to the high toxicity of particles even at low PM levels (Nisbet and LaGoy, 1992).
Beijing and Delhi often suffer from severe air pollution episodes, reaching high PM2.5 concentrations and air quality index levels. The local government in Beijing has declared many different air quality actions since September 2013, resulting in a decrease in the concentration of total PAHs as reported in recent studies for the winter season in Beijing (Chen et al., 2017; Elzein et al., 2019; Feng et al., 2019). This has been attributed to the efforts made by the municipal government of Beijing to improve air quality and control emissions by reducing combustion sources and promoting the use of clean-energy sources and electric vehicles.
Several anti-pollution measures have been introduced in Delhi in the last two decades, such as Bharat stage (equivalent to Euro standards), switching public transport from running on diesel to compressed natural gas (CNG) and applying odd–even vehicle number plate restriction during working days (Guttikunda et al., 2014; Goel and Guttikunda, 2015; Chowdhury et al., 2017). Despite the government effort to tackle air pollution in India and especially in Delhi, recent studies have showed that the air quality continues to be among the poorest in the world, causing thousands of premature deaths (Tiwari et al., 2015; Ghude et al., 2016; Chowdhury and Dey, 2016; Pant et al., 2017; Conibear et al., 2018). PAH emission sources in Delhi have previously been attributed to vehicle emissions, coal combustion, and wood and burning leaves (Gadi et al., 2019; Shivani et al., 2019; Gupta et al., 2011; Sharma et al 2007). To the best of our knowledge, data on PM2.5-bound PAHs in Delhi during the summer season (pre-monsoon: March–June) are scarce and limited to other periods of the year with low-time-resolution ambient samples (sample averaging time of 24 h). It has been shown that concentrations of ambient particle-bound PAHs when collected over long sampling times are subject to higher uncertainties related to sampling artefacts deriving from meteorological effects and oxidant concentrations such as ozone (Goriaux et al., 2006; Tsapakis and Stephanou, 2003, 2007; Ringuet et al., 2012a; Keyte et al., 2013). Using shorter time periods for ambient particle sampling (e.g. 3 and 4 h) has been suggested as offering a more accurate diagnosis of emission sources (Tian et al., 2017; Srivastava et al., 2018); shorter time sampling is still scarce and limited to studies outside China and India (Reisen and Arey, 2004; Srivastava et al., 2018). Considering the above and that particles collected during 24 h sampling time integrate both daytime and night-time chemistry together, we collected high-frequency ambient air particle samples (PM2.5) in urban Beijing (China) and Delhi (India) to determine the temporal diurnal and nocturnal variation of PAHs. A great advantage in this study is that all particle samples from both campaigns were collected, extracted and analysed using the same analytical method, which provides a better comparison of the variation in PAHs between cities and of the feasibility and efficiency of implementing emission control policies to improve air quality in both cities.
2.1 Sampling campaigns
Both measurement campaigns were part of the UK NERC/MRC Air Pollution and Human Health (APHH) research programme. The sampling site in Beijing was located at the Institute of Atmospheric Physics, Chinese Academy of Sciences in Beijing (39∘58′28′′ N, 116∘22′15′′ E), and the sampling site in Delhi was located at the Indira Gandhi Delhi Technical University for Women (28∘39′52.6′′ N, 77∘13′54.1′′ E). In both campaigns, the sampling equipment was installed on the roof of a two-storey building about 8 m above ground level. Prior to sampling the quartz microfiber filters (Whatman QM-A, 20.3 cm × 25.4 cm, supplied by VWR UK) were baked at 550 ∘C for 5 h in order to eliminate any organic matter. PM2.5 filter samples were collected every 3 h during daytime and over 15 h at night-time, using a high-volume air sampler (Ecotech HiVol 3000, Victoria, Australia) operating at 1.33 m3 min−1. The daytime sampling started at 08:30 in the morning and the filter was changed every 3 h. Night-time sampling began at ∼ 17:30 and ended at 08:30 the following day. Filters were collected for 20 d (22 May to 10 June 2017) totalling 80 filters during the Beijing campaign and for 9 d (28 May to 5 June 2018) totalling 35 filters during the Delhi campaign. After sampling, filters were wrapped in aluminium foil, sealed in polyethylene bags and stored at −20 ∘C until extraction and analysis.
2.2 Sample extraction
Collected filters were cut using a cube cutter (1∕16 of the filter) measuring a surface area equivalent to 24 cm2. Each section was then cut into small pieces to fit inside 5 mL stainless-steel extraction cells used by a pressurized solvent extractor (Dionex, ASE 350). All samples were extracted in acetonitrile (HPLC grade) using the following method: oven at 120 ∘C, pressure at 1500 psi, rinse volume 60 % and 60 s purge time for three consecutive 5 min cycles. The extraction time of each cell was about 25 min for a final volume of 20 mL. Prior to purification, extracts (V = 20 mL) were evaporated to approximately 6 mL under a gentle stream of nitrogen. All samples and blanks were purified on solid phase extraction (SPE) silica normal phase cartridge (1 g/6 mL; Sigma-Aldrich) to reduce the impacts of interfering compounds in the matrix and to help maintain a clean GC injection inlet liner. After the purification step, the solution of each sample was evaporated to 1 mL under a gentle stream of nitrogen at room temperature (20 ∘C) and transferred to a 1.5 mL autosampler amber vial. Each concentrated sample was stored at 4 ∘C until analysis.
2.3 Analytical procedures
In this study, 17 PAHs were selected based on their presence within the particle phase and commercially available standards. These are listed in Table 1 and standards purchased from Sigma-Aldrich, Alfa Aesar and Santa Cruz Biotechnology in the UK with a minimum purity of 97 %. In parallel to individual standards, a mixed solution of the 16 EPA PAHs (CRM47940, Supelco, Sigma-Aldrich) of 10 µg mL−1 in acetonitrile was also used. Standard solutions for calibrations were prepared in acetonitrile (HPLC grade, 99.9 % purity, Sigma-Aldrich). Phenanthrene-d10 and pyrene-d10 were used as surrogate standards and were spiked over two blank filters and two sample filters from both campaigns, with the concentration on filters corresponding to 300 ng (V = 60 µL from 5 ng µL−1 in acetonitrile). Spiked filter solutions were analysed 10 times, and the average recovery efficiency calculated from surrogate standards was 96 %, ranging from 88 % to 107 % for both compounds, phenanthrene-d10 and pyrene-d10. PAH concentrations were corrected to the average recovery efficiencies. These two deuterated compounds were supplied by C/D/N Isotopes and distributed by QMX Laboratories Ltd (Essex, UK).
All PAHs were quantified using a gas-chromatography–quadrupole time-of-flight mass spectrometry system (GC Agilent 7890B coupled to an Agilent 7200 Q-TOF-MS). A total of 1 µL of each sample was injected in pulsed splitless mode at 320 ∘C using an automated liquid injection with the GERSTEL MultiPurpose Sampler (MPS). Helium was used as a carrier gas at 1.4 mL min−1, and target compounds were eluted using the RXi-5ms (Restek GC column, Crossbond diphenyl dimethyl polysiloxane; length: 30 m, diameter: 0.25 mm, film thickness: 0.25 µm). The analysis time of each sample was set to 35 min using the following GC oven temperature programme: 65 ∘C for 4 min as a starting point and then increased to 185 ∘C at a heating rate of 40 ∘C min−1 and held for 0.5 min, followed by a heating rate of 10 ∘C min−1 to 240 ∘C and then ramped at 5 ∘C min−1 until 320 ∘C and held isothermally for a further 6 min to ensure all analytes eluted from the column. The MS was operated in electron ionization (EI) mode at 70 eV with an emission current of 35 µA. Ten-point calibration solutions were injected four times in the same sequence as for samples and covered the range from 1 to 1000 pg µL−1, with a correlation coefficient from the linear regression between 0.970 and 0.999.
2.4 Error evaluation
As part of our method validation and in addition to recovery efficiency corrections, we have evaluated other possible factors that can affect our final true result. In this study, the solvent (acetonitrile) and field blanks (n= 3) were analysed following the same procedure as for the samples (extraction, SPE, evaporation) to determine any source of contamination during sample preparation and the analytical procedure. Whilst most target compounds were found to be below our limit of detection (S ∕ N = 3), three PAHs (fluorene, phenanthrene, fluoranthene and pyrene) were quantified in field blanks, and their contributions to the final data have been corrected.
To evaluate the agreement between repeated measurements (precision error), we calculated the relative standard deviations (%RSD) from replicate analysis (n= 10) of two samples. The %RSD average of total PAHs was 8.7 % (range: 3.36 %–13.71 %) for Beijing samples and 4.2 % (range: 2.64 %–10.12 %) for Delhi samples. The %RSD average for deuterium-labelled compounds spiked over two sample filters was ∼ 3.6 % for both campaigns. The %RSD of each compound is shown in Table S1. Moreover, the calibration offset and the influence of the sample matrix on the quantification step are an important source of systematic error, which was estimated to be a maximum of 20 %. Therefore, the upper limit estimated error, combining the precision and the systematic effects, is 30 % for Beijing samples and 25 % for Delhi samples.
In addition, another type of error has been attributed to sampling artefacts. Previous studies (Schauer et al., 2003; Goriaux et al., 2006; Tsapakis and Stephanou, 2003; Brown and Brown, 2012) have reported a chemical decomposition of PAHs depending on the ambient concentration of ozone and sampling time. Therefore, data from long sampling times and under very high ozone ambient concentrations (> 70 ppb) may be biased by sampling artefacts of more than 100 % (Schauer et al., 2003; Goriaux et al., 2006). However, at low ozone levels (< 30 ppb), negative artefacts were considered not significant (Tsapakis and Stephanou, 2003), whilst at medium ozone levels (30–50 ppb) PAH values were underestimated by 30 % (Schauer et al., 2003). Tsapakis and Stephanou (2003) have reported a loss of PAHs of 28 % due to ozone atmospheric concentration about 60 ppb and long sampling times of 24 h. They have also suggested that a long sampling time under low ozone concentration (< 30 ppb) does not affect the concentration of collected PAHs in the gas or particle phases, while a short sampling time (2 h) under ozone concentration about 60 ppb will reduce the concentration of PAHs by 17 %. In this study, ozone concentrations were measured in both campaigns and averaged to the filter sampling time to provide a more accurate estimation of the negative sampling artefacts. The ozone concentration in summer Beijing ranged between 3.7 and 140 ppb over the campaign (mean value: 56 ± 31 ppb), approximately 5 times higher than that in winter (mean value: 10.4 ± 8.8 ppb, Elzein et al., 2019). Daytime ozone concentration ranged from 12 to 140 ppb (mean value: 63 ± 30 ppb), while over the night-time it ranged from 4 to 74 ppb (mean value: 34 ± 18 ppb). Therefore, based on the Tsapakis and Stephanou (2003) study, the negative sampling artefacts due to ozone concentration were estimated to be 20 % for daytime samples (3 h) and 10 % for the night-time samples (15 h) due to lower ozone concentration at night. Using the same approach, daytime ozone concentration in Delhi ranged between 39 and 119 ppb, with a mean value of 75 ± 20 ppb, while the night-time concentration ranged from 14 to 50 ppb (mean value: 37 ± 12 ppb). Therefore, the estimation of the negative sampling artefacts on the data from Delhi ranged between 15 % and 30 %, with the highest error estimation attributable to daytime samples (3 h) because of the higher ozone concentration during the day.
3.1 Concentration levels of PM2.5 and benzo[a]pyrene in summer Beijing and Delhi
In 2016, the World Health Organisation (WHO, 2016) published an air quality guideline on outdoor air pollution limits to help protect human health and reduce the risk of mortality due to fine particles. The air quality standards for PM2.5 were expressed as an annual and 24 h mean concentration (WHO, 2016; Ministry of Ecology and Environment The People’s Republic of China, 2012). The daily PM2.5 (mean 24 h) guideline concentration is currently set at 75 and 60 µg m−3 for China and India, respectively, while the annual mean guideline concentration is currently set at 35 and 40 µg m−3 for China and India, respectively. PM2.5 concentrations measured at the two sites were averaged to the filter sampling time and are shown in Figs. 1 and 2. In Beijing, the average 24 h PM2.5 concentration was 39 ± 21 µg m−3 (range: 16–97 µg m−3), exceeding the Chinese 24 h limit value (75 µg m−3) on 1 d of the 20 sampling days. The average daytime and night-time PM2.5 concentrations in Beijing were 40 ± 24 and 38 ± 24 µg m−3, respectively. Delhi showed an average 24 h PM2.5 concentration of 143 ± 27 µg m−3 (range: 110–195 µg m−3), exceeding the Indian 24 h limit value on all 9 sampling days. The average daytime and night-time PM2.5 concentrations in Delhi were 141 ± 51 and 140 ± 26 µg m−3, respectively. PM2.5 concentrations in Delhi have changed little in recent years; between 2008 and 2011 the daily average of PM2.5 concentrations was 123 ± 87 µg m−3 (Guttikunda and Calori, 2013), while the annual average was reported to be 125.5 ± 77.2 µg m−3 between January 2013 and May 2014 (winter: 196 µg m−3, summer: 83.6 µg m−3, monsoon: 58.8 µg m−3) (Sharma and Mandal, 2017). The limited change seen in recent years may be associated with continued emissions from residential energy use, which are estimated to contribute about 50 % of PM2.5 airborne concentrations (Conibear et al., 2018; Butt et al., 2016). The construction sector is fast growing in India, and the dust emitted from various activities (demolition, excavation, drilling, etc.) is also considered an important source of particles (Guttikunda et al., 2014).
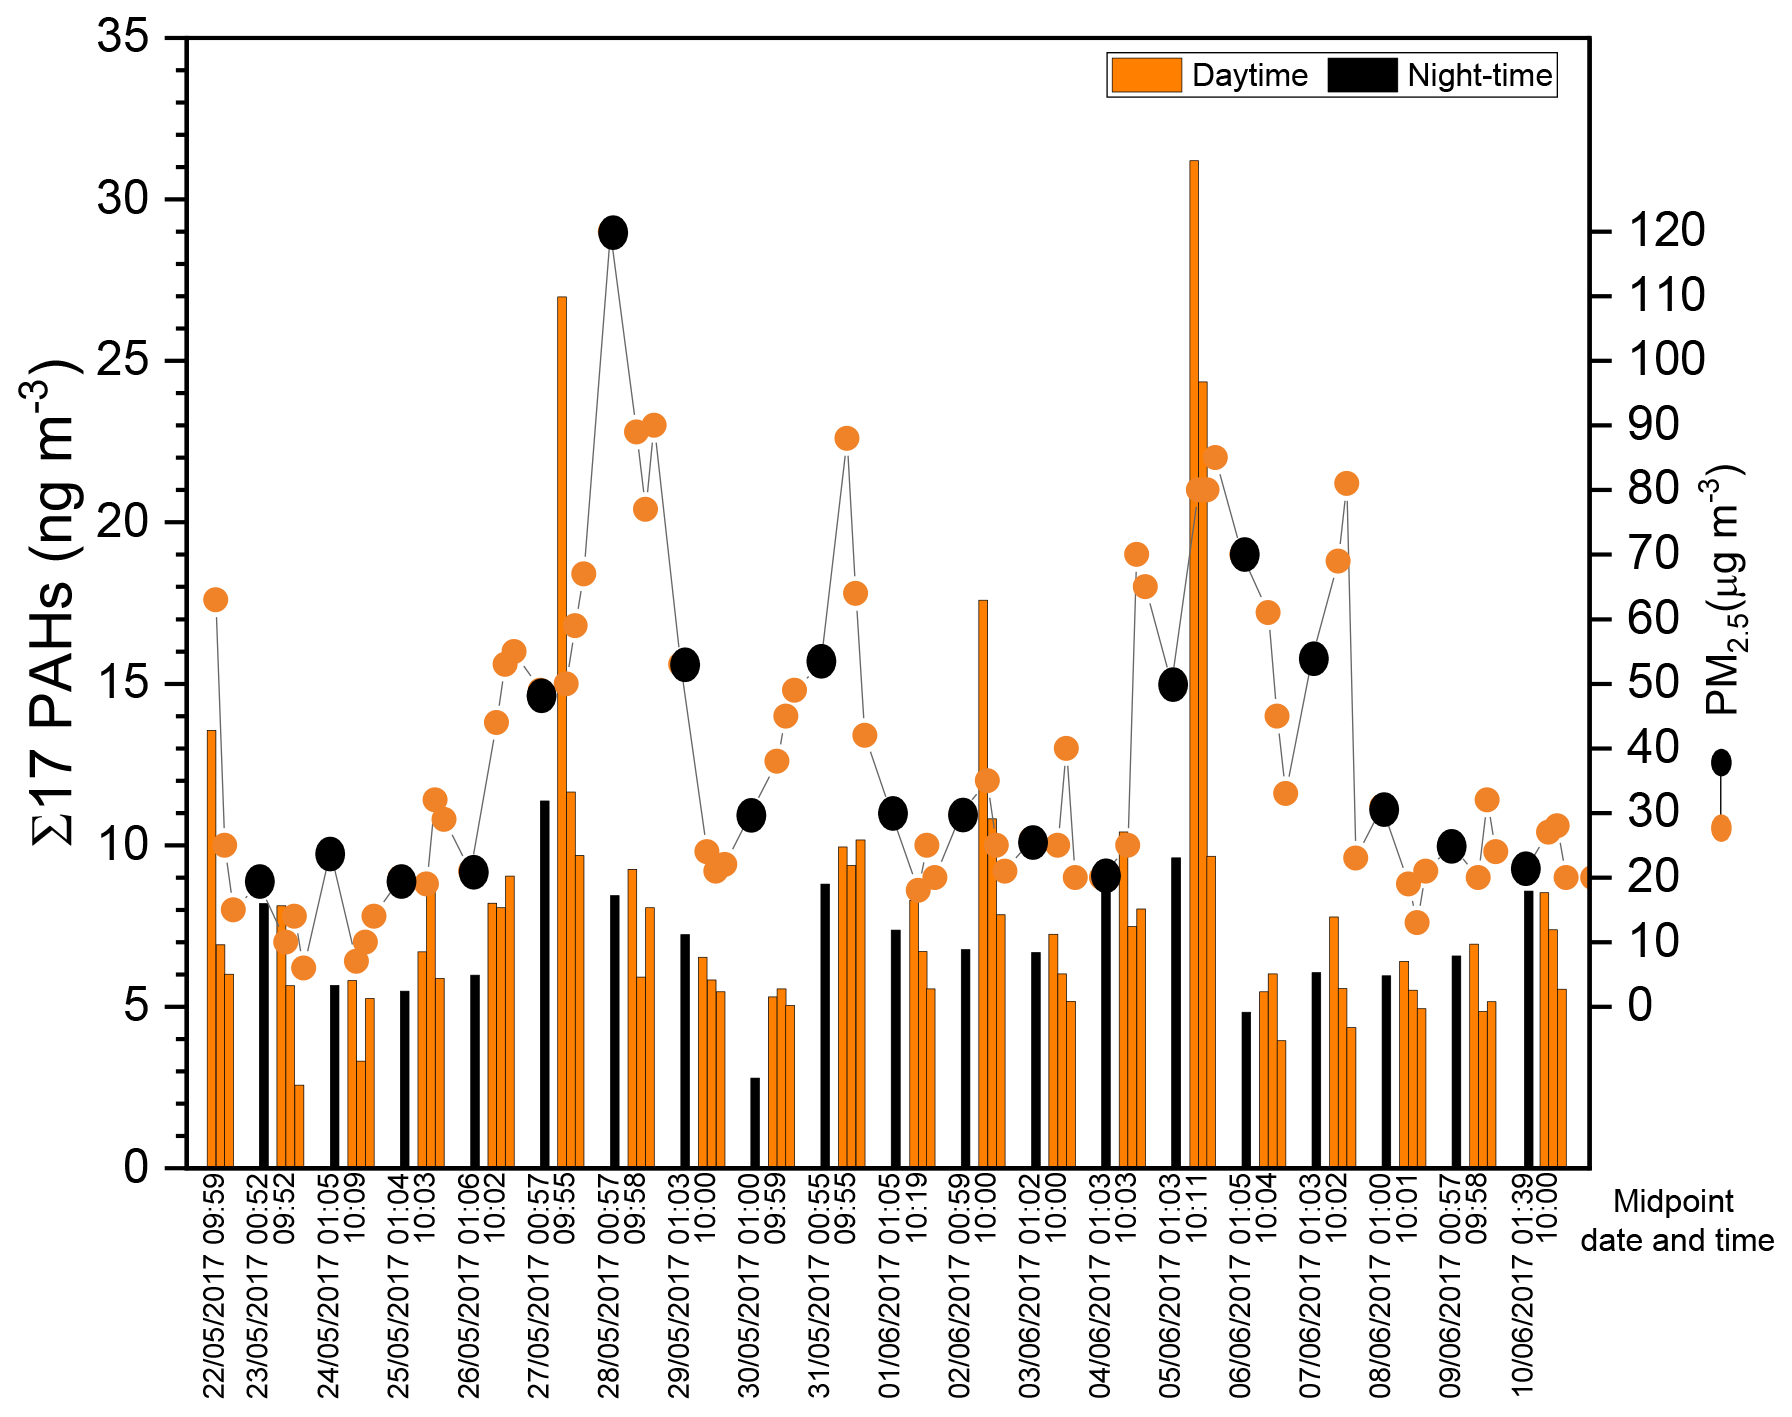
Figure 1Temporal variation of total PAHs and PM2.5 concentrations in summer Beijing. PM2.5 concentrations were averaged to the filter sampling time, approximately 3 h in daytime and 15 h at night. The 3 h midpoint time tick labels at noon (∼ 13:00) and in the afternoon (∼ 16:00) have been omitted for clarity.
The WHO has not published a guideline limit value for PAHs, but benzo[a]pyrene (BaP) is often used as a marker of toxicity for all PAHs. The European Union has set an annual mean air quality limit of 1 ng m−3 for BaP (WHO, 2016). The daily (24 h) concentration of BaP in summer Beijing (this study) ranged from 0.49 to 1.18 ng m−3 (average 0.80 ± 0.17 ng m−3), about 19 times lower than previously observed at this site in winter (Elzein et al., 2019). This is below the 24 h average limit value of 2.5 ng m−3, set in China by the Ministry of Ecology and Environment in 2012, on all of the 20 d of the sampling period. During the short summer measurement period in Delhi, BaP varied between 1.16 and 3.16 ng m−3 (average 1.78 ± 0.67 ng m−3) and exceeded the threshold of 2.5 ng m−3 on 1 d.
3.2 Variability of PAHs in summer Beijing and Delhi
Time series of the temporal variation of total PAHs in Beijing and Delhi are shown in Figs. 1 and 2, respectively. The box plots in Fig. 3 show a comparison of the measured concentrations of the total 17 PAHs between daytime and night-time in both cities.

Figure 2Temporal variation of total PAHs and PM2.5 concentrations in summer Delhi. PM2.5 concentrations were averaged to the filter sampling time, approximately 3 h in daytime and 15 h at night.
3.2.1 Beijing
The mean 3 h daytime concentration of ∑17 PAHs in Beijing was 8.2 ± 5.1 ng m−3, ranging from 2.6 to 31.2 ng m−3, while the mean 15 h night-time concentration was 7.2 ± 2.0 ng m−3, ranging from 2.8 to 11.4 ng m−3. The mean 24 h total concentration (combined results from daytime and night-time samples) of the total 17 PAHs was 7.6 ± 1.9 ng m−3 (range: 3.9–11.3 ng m−3). This 24 h average is approximately 13 times lower than the average 24 h in wintertime Beijing (97 ng m−3) reported in our previous study at the same location (Elzein et al., 2019). Similarly, previous studies in urban Beijing (Feng et al., 2005, 2019; Wu et al., 2014; Gao and Ji, 2018; Song et al., 2019) have reported much lower values of PAHs in summer than in winter, showing the important role of seasonal variation in influencing ambient concentrations of PAHs. The dominant reason for this seasonal variation in Beijing is the increase in energy consumption in winter and in particular the emissions from traditional rural/urban heating methods using coal. The effect of dispersion in vertical and horizontal directions and long-range transport due to air mass trajectory can also influence local PAH concentration.
The photochemical effects on particulate PAHs between summer and winter are not clear in the literature and were considered to play a minor role in the seasonal variation of PAHs (Wu et al., 2014). However, an important factor that might affect PAH levels is their degradation or transformation due to high ozone ambient concentration level in summer, which were 5 times higher than in winter (Elzein et al., 2019). This factor can negatively bias PAHs levels during filter sampling by more than 100 % (discussed above in Sect. 2.4). The gas phase concentrations of PAHs were not measured in this study, but the distribution of PAHs between the gaseous and particulate phases is an important factor affecting their fate in the environment (Lohmann and Lammel, 2004). The distribution of highly volatile PAHs (e.g. two to three rings) is known to be influenced by temperature (Tsapakis and Stephanou, 2005; Gaga and Ari., 2011; Verma et al., 2017), while the low volatility PAHs and PAH derivatives (e.g. oxygenated and nitrated PAHs) are mostly associated with the particle phase (Albinet et al., 2008; Liu et al., 2017, Zhang et al., 2018). The spatial variation of atmospheric pollutants within urban Beijing is not significant (He et al., 2001); however, the variation of atmospheric pollutants might increase when moving to suburban areas because it consists of a large number of factories, airports and power plant stations. Feng et al. (2005) compared the total PAH concentration in PM2.5 at urban and suburban sites in Beijing at the same period of the year (July and November 2002), and they reported higher values at the suburban site than at the urban site by a factor ∼ 1.5 in summer and ∼ 2 in winter. The sampling location in this study is an urban area surrounded by busy roads, residential buildings, an underground railway and restaurants. Therefore, it may be representative of the urban area of Beijing covering approximately half of the population in metropolitan Beijing.
In Fig. 1, the concentration of total PAHs in the first 3 h filter (08:30–11:30) of the day appears to be higher than the rest of the day. These elevated concentrations are potentially associated with the early morning rush hour time and vehicle emissions. The average night-time total PAH concentration (7.2 ng m−3) was in the range of the second and third 3 h daytime average values, 7.8 and 6.4 ng m−3 respectively. This indicates that the elevated total PAH concentration in the first 3 h filter (08:30–11:30) of the day is not related to accumulation of air pollutants at night-time but most likely related to direct emissions from traffic in the early morning and particularly petrol combustion emissions (see Sect. 3.3).
To the best of our knowledge, previous studies in Beijing have not reported higher-time-resolution data on total PAH concentration but mainly focused on the 24 h average concentration. A previous study from Feng et al., (2005) reported a 24 h mean value of 25 ± 6.8 ng m−3 in summer Beijing (July 2002), approximately 3.3 times higher than our 24 h mean value (7.6 ng m−3). A more recent study from Feng et al. (2019) reported a 24 h mean value of 11 ± 5.9 ng m−3 in Beijing in warm months (April to June 2015), 1.4 times higher than our 24 h mean value. In both studies of Feng et al. (2005, 2019), the urban sampling site was located at the Peking University campus health science centre, a short distance from our sampling site (∼ 1 mi, ∼ 1.6 km). In the same year of 2015 (July to September), Chen et al. (2017) and Zhang et al. (2020) reported the values of 9.7 and 8.9 ng m−3, respectively, for total PAH concentration in PM2.5. In the study of Chen et al. (2017), the PM2.5 samples were collected at the campus of Beihang University (∼ 2.5 mi, ∼ 4 km, from our sampling site). The Zhang et al. (2020) sampling site was located at a primary school in the Haidian district (∼ 3.5 mi, ∼ 5.4 km, from our sampling site). Furthermore, Gao and Ji (2018) reported 14.5 ± 1.3 ng m−3 for total PAH concentration in PM2.5, collected in summer Beijing (May–July, 2016) in the Haidian district (∼ 4 mi, ∼ 6.4 km, from our sampling site). Accordingly, the majority of previous studies have focused on studying PAHs in the Haidian district (Wu et al., 2014; Chen et al., 2017; Gao and Ji, 2018; Feng et al., 2019; Zhang et al., 2020) because of its high population density. The variation of PAH concentration from different site locations in the Haidian district may suggest that the spatial variation of PAHs in this area is not significant. Future studies in different districts and rural areas of metropolitan Beijing would be helpful for comparison of population exposures and spatial variation.
The results from studies of PAHs in summer Beijing in recent years (2015–2020) (Chen et al., 2017; Gao and Ji, 2018; Feng et al, 2019; Zhang et al., 2020) show a continuous decrease in PAH concentrations (range: 7–15 ng m−3) in comparison with the previous decade (2000–2010; range: 11–31 ng m−3) (Feng et al., 2005; Li et al., 2013; Wu et., 2014). This improvement in air quality (mitigating the emissions of PAHs) could be related to meteorological conditions (e.g. temperature, boundary layer height) but also to the anti-pollution actions adopted by the municipal government of Beijing in 2013 to continue tackling air pollution, by reducing combustion sources in the intervening years and promoting the use of clean-energy sources such as solar hot water heating systems, banning heavy duty vehicles from circulating in daytime, public transport modernization, and promoting electric vehicles and electric motorbikes.
3.2.2 Delhi
The population in Delhi is projected to continue growing and to become the most populous city in the world with 39 million people in 2030 (United Nations, 2019), living within a geographic area of 1483 km2, of which 783 km2 is designated as rural and 700 km2 as urban (Nagar et al., 2014). The summer or pre-monsoon season (March–June) has very high temperatures and low precipitation. The city is surrounded by different climatic zones; the Thar desert in the west, the central hot plains to the south, the Himalayas to the north and the Indo-Gangetic Plain in the east (Nagar et al., 2014). The northern and eastern part of India are considered to be the most polluted part of the country (Guttikunda et al., 2014).
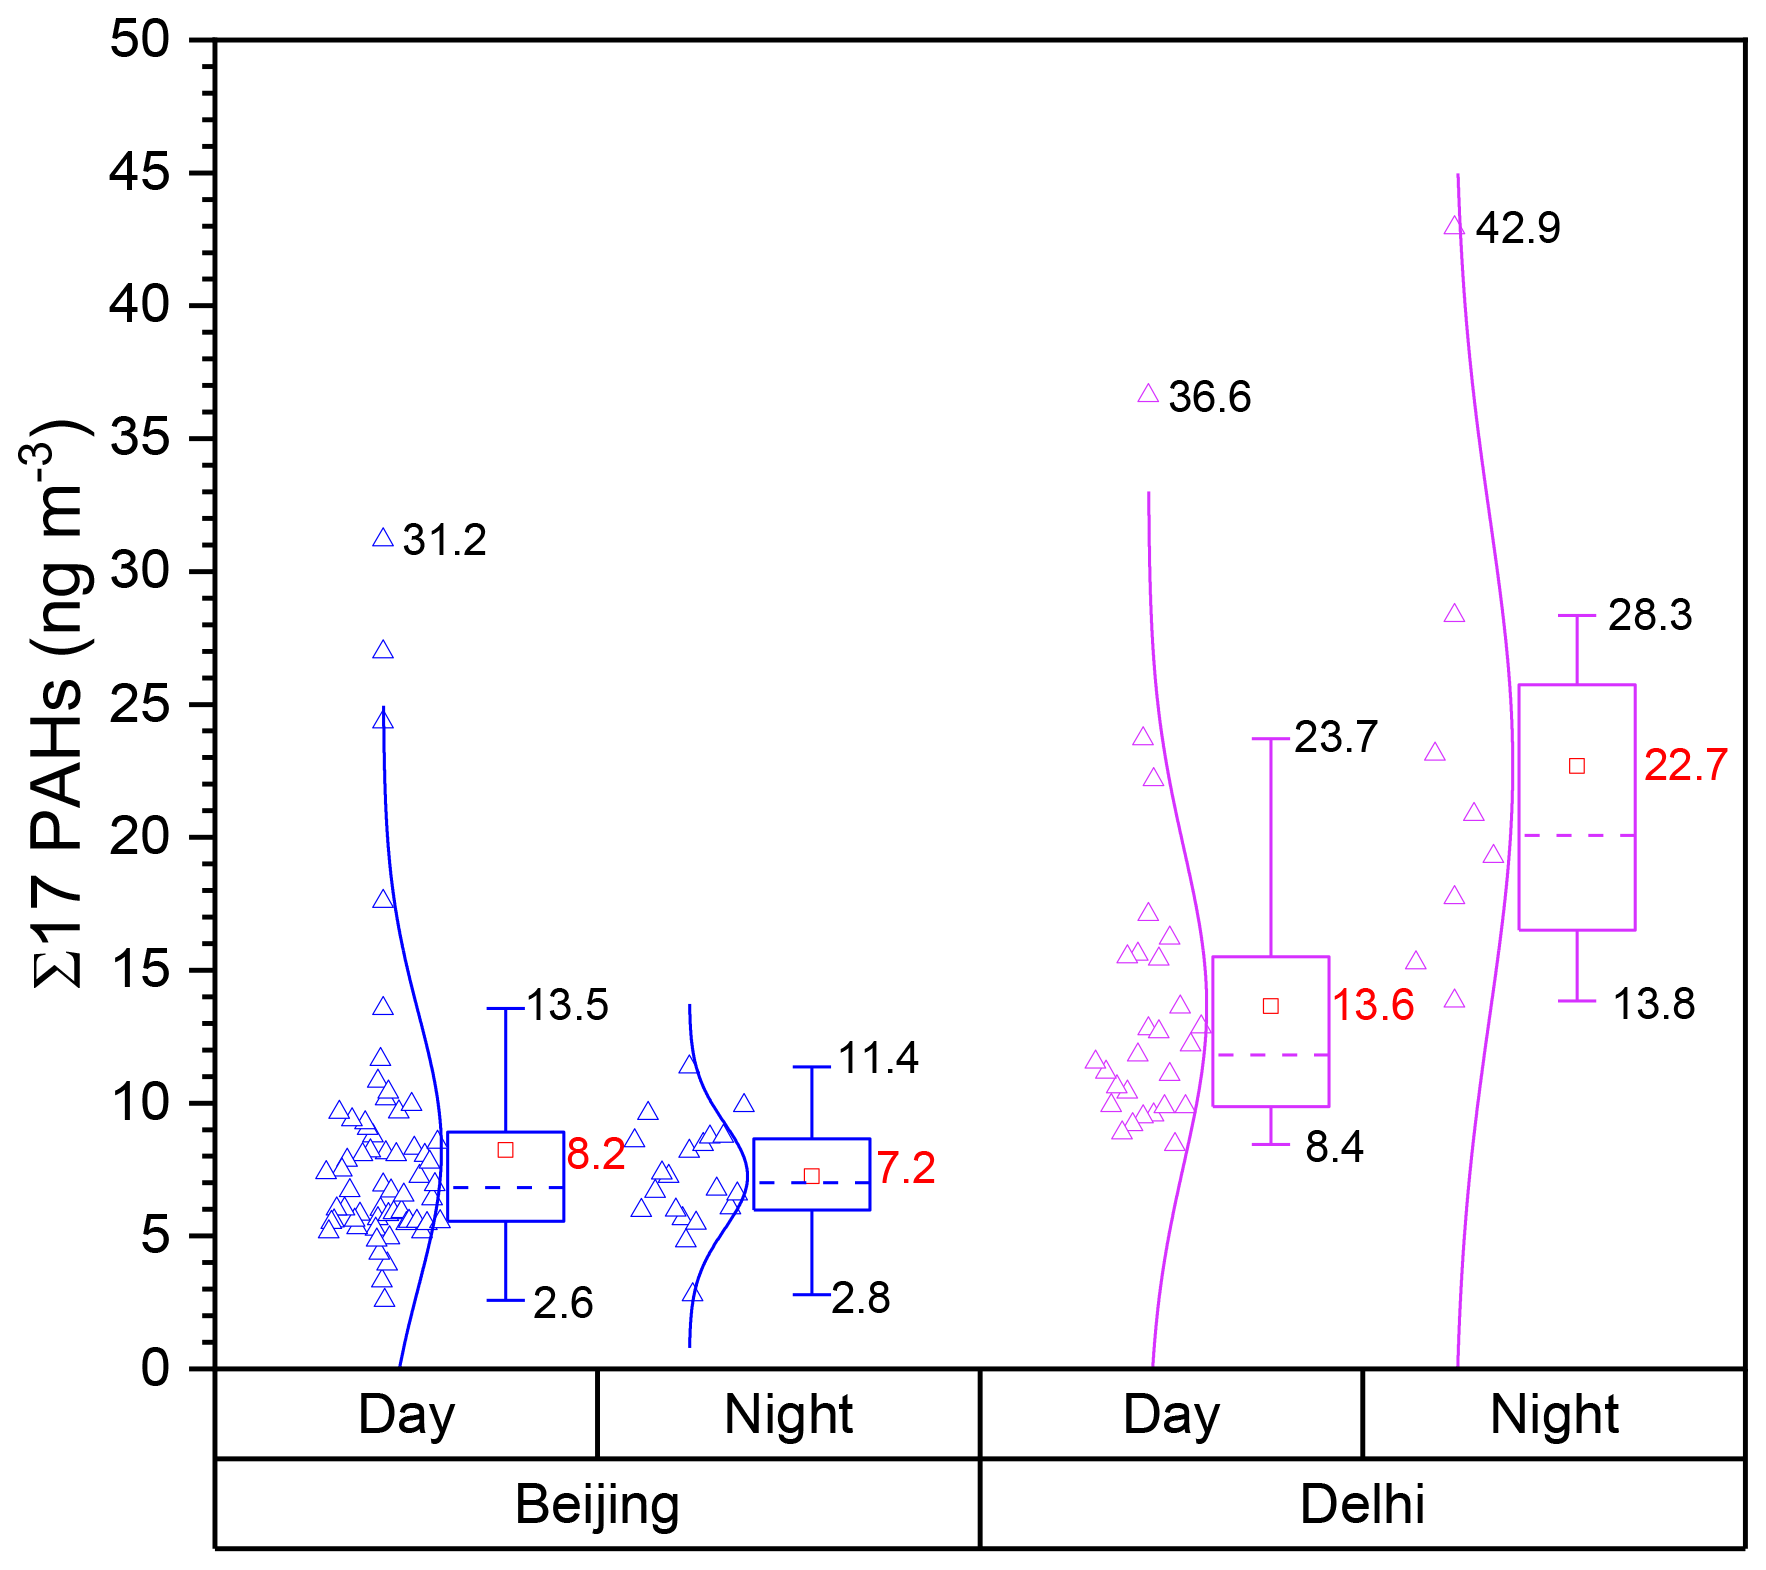
Figure 3Concentrations of 17 PAHs in PM2.5 samples during the daytime (3 h) and night-time (15 h). Box plots represents the 25th and 75th percentile range of the observed concentrations, and the whisker numbers reflect the data within 1.5 times the interquartile range (IQR). Red square symbols represent the mean concentration, and the short dashed line within the boxes represents the median. Empty triangles correspond to the data measured over 3 h and 15 h in Beijing (Blue) and in Delhi (Purple). The lines between data points and boxes reflect a normal distribution curve.
Similar to Beijing, previous studies in Delhi mainly focused on the 24 h average concentration of total PAHs. They have addressed the problem of air pollution across India, focusing on PM2.5 trends, PM2.5 health impact, and source apportionment (Chowdhury et al., 2007; Gupta et al., 2011; Chowdhury and Dey, 2016; Pant et al., 2017; Chen et al., 2020); however, PAH emissions and variation between daytime and night-time have not been measured or discussed previously, and only few studies (Sharma et al., 2007; Singh et al., 2011; Gadi et al., 2019) reported the 24 h mean concentration of ∑n PAHs (n>10) in Delhi itself. In this study, the mean 24 h (combined results from daytime and night-time samples) of the 17 PAHs was 19.3 ± 7.1 ng m−3, ranging from 13.3 to 35 ng m−3. Previous studies showed a large spatial variation in PAH concentrations within Delhi; Sharma et al. (2007) reported a mean 24 h value of 624.04 ± 376.48 ng m−3 (∼ 32 times higher than our mean value) for ∑12 PAHs at the south of Delhi during the summer season of 2003. Singh et al. (2011) reported a mean 24 h value of 45.8 ± 22.1 ng m−3 (∼ 2.4 times higher than our mean value) for ∑16 PAHs at the east of Delhi during the summer season of 2008. Gadi et al. (2019) reported an annual average of 277 ± 126 ng m−3 for the summation of 16 PAHs between December 2016 and December 2017 and 260 ± 111 ng m−3 for the summer season of 2017 (∼ 13.5 times higher than our mean value and ∼ 5.7 times higher than the Singh et al., 2011, mean value). In the study of Gadi et al. (2019), the sampling site was in the same campus as this study (Indira Gandhi Delhi Technical University for Women); the low ∑PAH value in this study is most probably due to the short summer measurement period in Delhi (9 d, 35 samples), coupled with less pollution episodes for PAHs. It appears that the variation of PAH concentration in Delhi could be affected by multiple factors, including the spatial variation, the input from multiple local sources, the surroundings of the sampling site and the meteorological conditions in the north of Delhi. Therefore, the concentrations of ambient particle-bound PAH over a longer averaging period such as the 24 h are subject to high uncertainty related to the multiple factors cited above. Higher-frequency filter sampling during 24 h can provide a better assessment of PAH concentrations and is more likely to reflect direct source emission signals as modified by meteorology. This perspective also applies to other Indian cities in future studies.
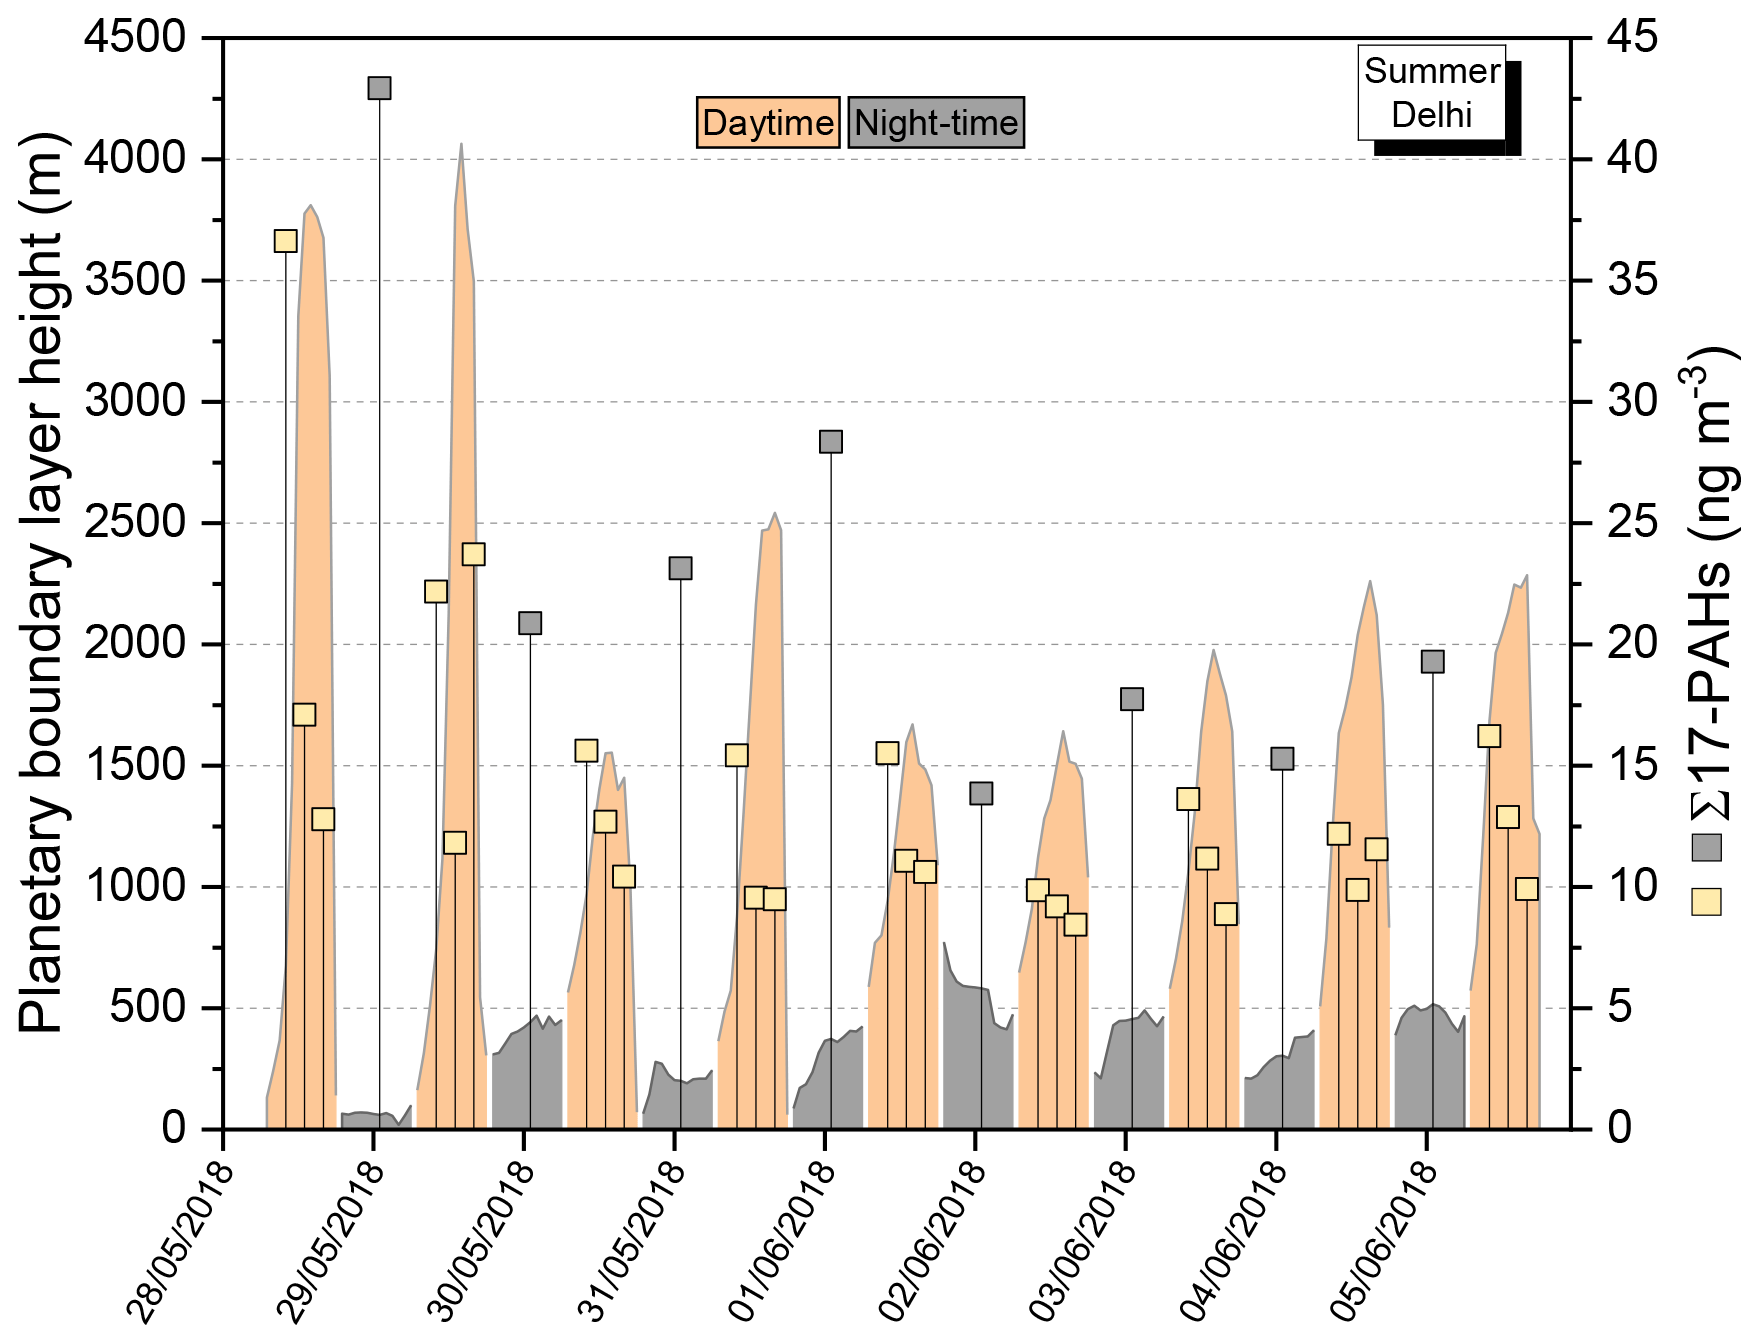
Figure 4Planetary boundary layer height in summer Delhi 2018 (latitude 28.625, longitude 77.25; source: ECMWF ERA5 in 0.25∘, 1 h time resolution). Square symbols represent the temporal variation of total PAHs in daytime and night-time.
The mean 3 h ∑PAH concentration in daytime samples in Delhi was 13.6 ± 5.9 ng m−3 (∼ 1.7 higher than in Beijing), ranging from 8.4 to 36.6 ng m−3, and the mean 15 h night-time samples was 22.7 ± 9.4 ng m−3 (∼ 3.2 higher than in Beijing), ranging from 13.8 to 42.9 ng m−3 as shown in Fig. 3. During the daytime, the total PAH concentrations were generally highest during the first filter sample (08:30 to 11:30) (Fig. 2), following the same trend as for Beijing, suggesting vehicle emissions as a dominant source. The mean total PAH concentration at night-time was ∼ 1.7 times higher than the mean in daytime. Higher total PAH concentration at night could be related to emissions from biomass burning, waste burning, solid fuel cooking and heavy duty diesels entering the city at night-time. The higher PAH concentration at night may also be attributed to the relatively lower temperature at night (∼ 10 ∘C) and lower atmospheric mixing heights (Fig. 4), weaker turbulence leading to lower pollutant dispersion rates, and absence of photodecomposition. Moreover, power cuts in India are frequent (Guttikunda et al., 2014), especially when high demand occurs due to air conditioners in summer (Harish et al., 2020), which require in situ electricity generation using oil, diesel and petrol (Guttikunda et al., 2014). This may be considered as an additional source of air pollution in a megacity like Delhi. PM2.5 concentrations increased on most nights in comparison with the preceding daytime sample. Residential energy use across India has been reported to be an important source of PM2.5 emissions, contributing 62 % in summer and 70 % in winter of anthropogenic emissions of PM2.5 (Conibear et al., 2018). This was also confirmed in the study of Butt et al. (2016), showing that the impact of residential combustion emissions on atmospheric aerosol across India is very important, accounting for 63 % of anthropogenic black carbon and 78 % of anthropogenic particle organic matter emissions.
The mean 24 h values of ∑PAHs from this study (19.3 ± 7.1 ng m−3) and recent previous studies (45.8 ± 22.1 ng m−3, Singh et al., 2011; and 260 ± 111 ng m−3, Gadi et al., 2019) are high. This suggests the need for the implementation of a residential emission control strategy through potentially more effective alternative technologies such as the use of non-fossil fuel (biofuel) and clean-energy sources (solar, wind, hydro-electric power, natural gas) for domestic use, ending the use of in situ power generators by increasing electricity supply and load, and cutting emissions from open waste burning by implementing efficient collection and disposal of waste.
Table 1Minimum, maximum and mean concentrations of individual PAHs in PM2.5. Compounds in bold represent the highest mean contribution to the sum of all compounds.

* SD: standard deviation.
3.3 Major PAH, particle ageing and traffic emissions
In both campaigns, a high proportion of five- and six-ring PAHs were found in the particle phase (Table 1). In Beijing, benzo[b]fluoranthene, benzo[k]fluoranthene, benzo[a]pyrene and indeno[1,2,3-cd]pyrene were the four most abundant particle-bound PAHs in daytime samples, while benzo[b]fluoranthene, indeno[1,2,3-cd]pyrene and benzo[ghi]perylene were the three dominant particle-bound PAHs in night-time samples. Six major compounds were found in Delhi day and night samples: benzo[b]fluoranthene, benzo[k]fluoranthene, benzo[a]pyrene (BaP), benzo[e]pyrene (BeP), indeno[1,2,3-cd]pyrene and benzo[ghi]perylene; the mean concentrations of these compounds were higher at night. Generally, the two- and three-ring PAHs are predominantly found in the gas phase and the four-ring PAHs partition between the gas and particle phase (Liu et al., 2013; Zhang et al., 2018). The study from Liu et al. (2013) suggested that ambient temperature largely controls the gas–particle partitioning of two-, three-, and four-ring PAH concentration in the gas and particle phases.
A number of molecular diagnostic ratios for source apportionment have been proposed in the literature and are still under debate (Larsen and Baker, 2003; Katsoyiannis et al., 2011; Keyte et al., 2013; Zheng et al., 2017). They were considered uncertain in some studies because the results were not consistent and reproducible and did not reflect known differences in sources in space and time unless the source is very strong and the sampling measurements are made close to the known source. In addition, they may be biased by atmospheric reactions and selective loss processes (Katsoyiannis et al., 2011; Zheng et al., 2017). Among the PAHs, BaP is known to be a particularly carcinogenic compound inducing a mutagenic effect in experimental animals and is used as a key PAH marker of total exposure (WHO, 2016; IARC, 2012). BaP is mostly emitted from coal and biomass burning, as well as vehicle exhaust emissions (Harrison et al., 1996; WHO, 2016). The sampling site in both Beijing and Delhi was at a short distance from busy roads with significant vehicle exhaust emissions. BaP lifetime is affected by light and oxidants in the atmosphere; BaP is far more reactive than its isomer BeP (Butler and Crossley, 1981; Ringuet et al., 2012b); thus the decline of the ratio BaP ∕ (BaP + BeP) can be regarded as an indicator of particle ageing (Liu et al., 2013; Watson et al., 2016). Considering the above, BaP ∕ (BaP + BeP) has been used in this study to assess the contribution of local sources to particle composition. Generally, there is no defined threshold value for BaP ∕ (BaP + BeP) which can distinguish aged particles from freshly emitted ones. However, Watson et al. (2016) suggested that similar amounts of BaP and BeP (ratio = 0.5) indicate that particles are freshly emitted and mostly affected by local emissions rather than long-range atmospheric transport. Moreover, Liu et al. (2013) compared BaP and BeP ratios at remote sites and emission source regions and reported that BaP ∕ BeP lower than 0.4 means aged aerosol type, while a value higher than 0.4 indicates local emission source. In this study, a ratio of BaP ∕ (BaP + BeP) higher than 0.5 has been considered to characterize local emission sources. The ratio of BaP ∕ (BaP + BeP) has been calculated for both campaigns and results are shown in Fig. 5. This ratio mainly varied between 0.5 and 0.6 in Beijing, indicating a dominant contribution from local sources. In Delhi, 25 % of the data were below 0.5, indicating that aged particles might contribute to the air masses collected at the sampling site, but local emissions of PAHs are still a significant source. However, this assumption does not take into account the on-filter oxidation errors during sampling. Tsapakis and Stephanou (2003) reported a relative reactivity of BaP which is 1.6 times higher than BeP, with respect to degradation on glass fibre filters. Using the reactivity factor of 1.6, the ratio of BaP ∕ (BaP + BeP) will be affected negatively by an average of 4 % (day) and 1.6 % (night) for Beijing and 7 % (day) and 3 % (night) for Delhi. This assumption will therefore affect Delhi results, suggesting more contribution from long-range transport. Therefore, the indicator of particle ageing should be used carefully in the summer season unless ozone ambient concentrations are below 30 ppb, and consequently the negative artefacts are considered not significant (Tsapakis and Stephanou, 2003).
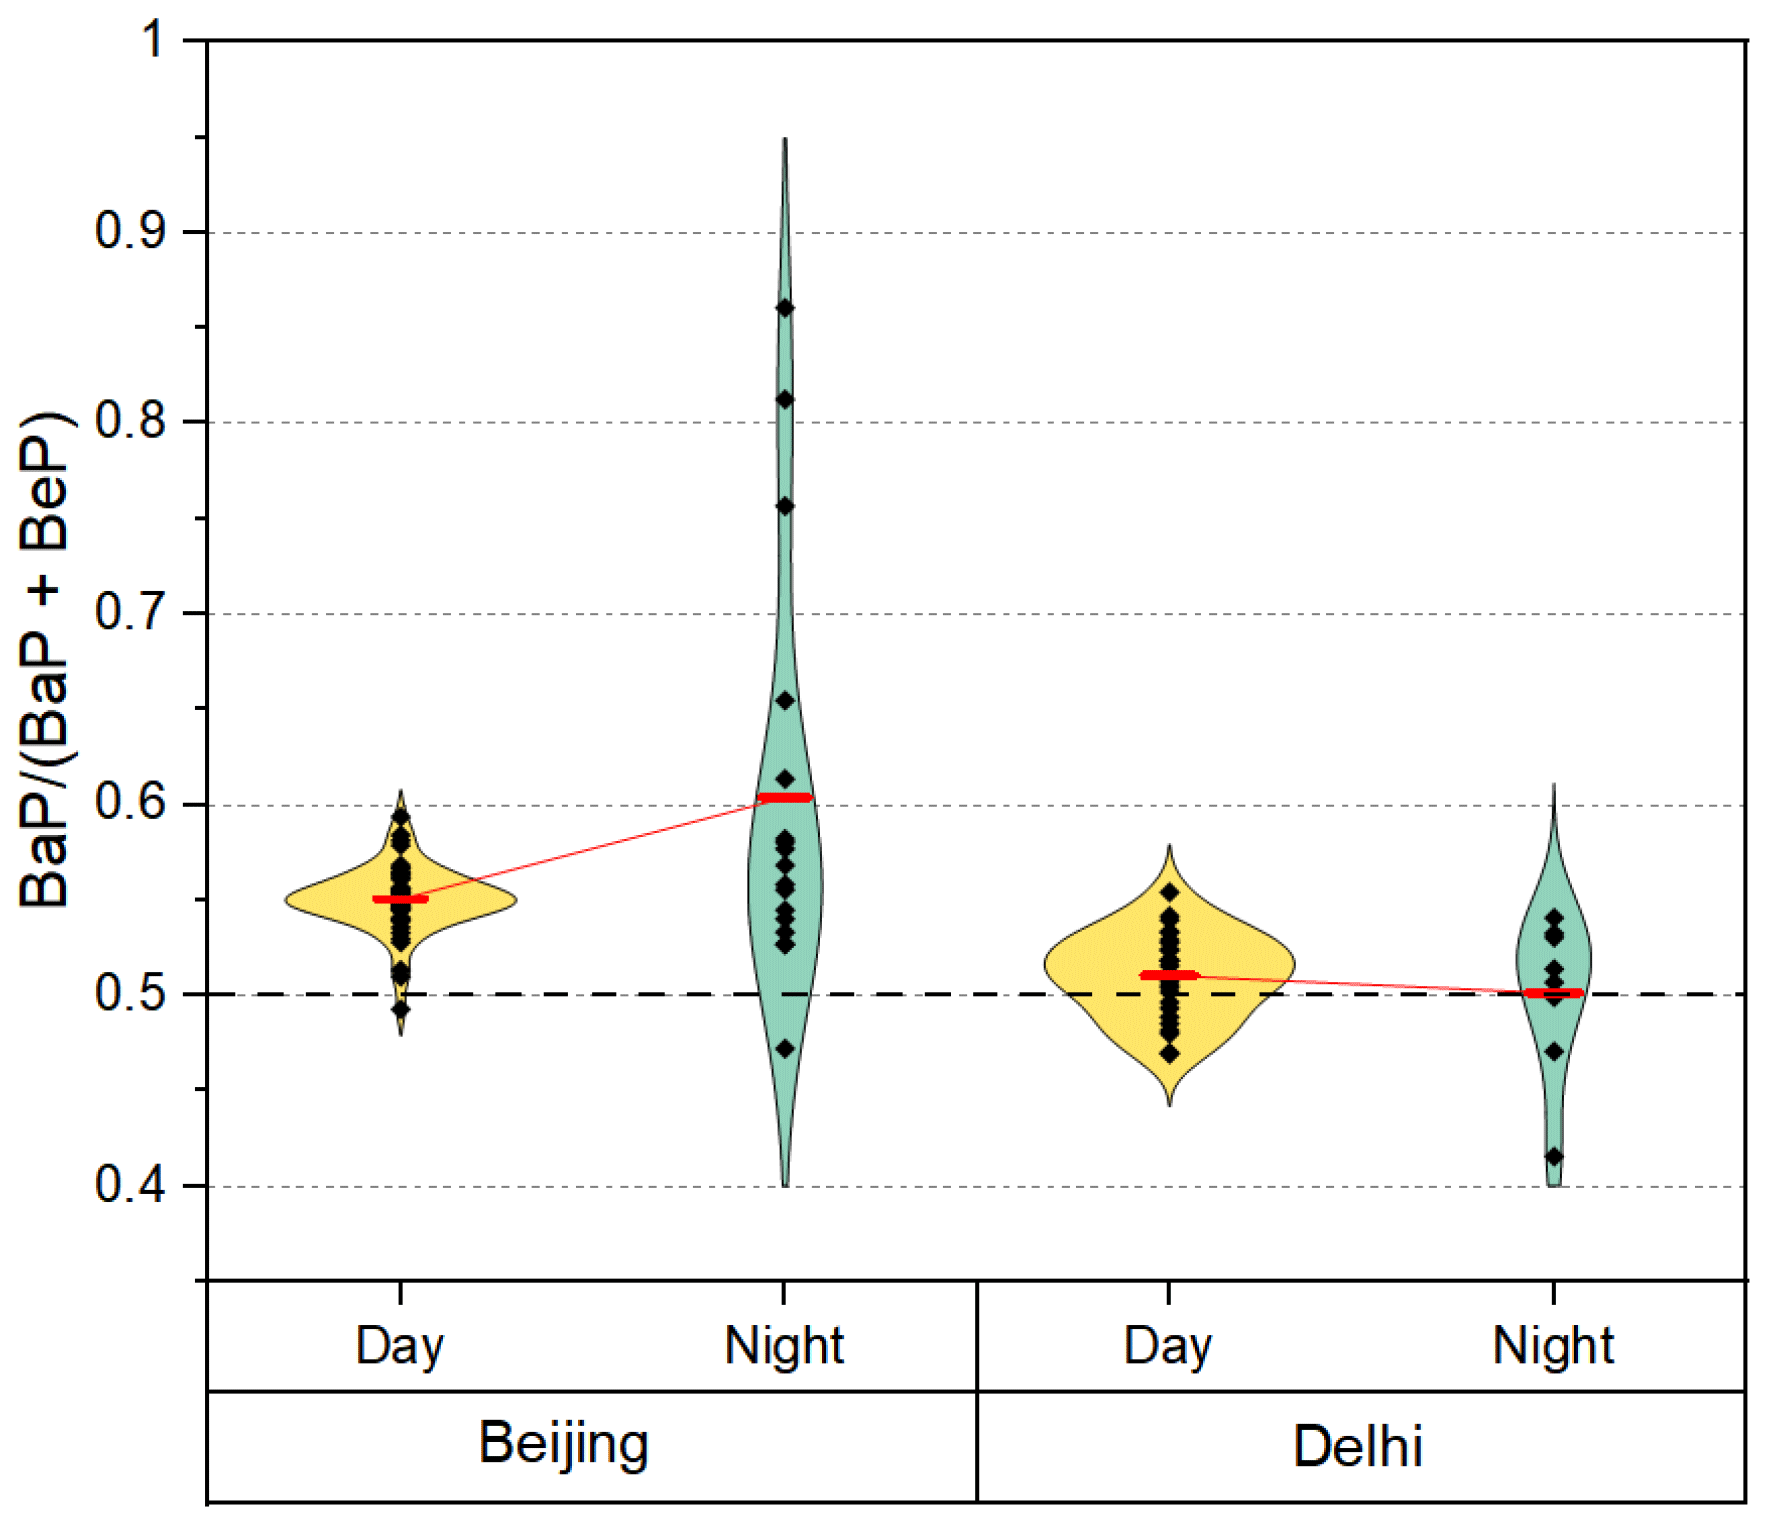
Figure 5Ratio of BaP ∕ (BaP + BeP) in PM2.5 samples during the daytime (every 3 h) and night-time (15 h). Violin plots represent the data distribution between day and night, and the wider sections represent the higher density of data smoothed by a kernel density estimator. Red rectangle symbols represent the mean concentration, and the red lines connect the mean values between day and night.
Since the influence from traffic emissions is very strong in both Beijing and Delhi, related diagnostic ratios were used to distinguish between petrol and diesel, such as fluorene ∕ fluorene + pyrene (< 0.5 for petrol engines and > 0.5 for diesel engines) and pyrene ∕ BaP (Ravindra et al., 2008; Tobiszewski and Namiesnik, 2012; Watson et al., 2016; Zheng et al., 2017). We calculated the ratio value for pyrene ∕ BaP using the data reported in a previous study (Rogge et al., 1993), where the authors have quantified more than 100 organic compounds in exhaust emission fine particulate matter. The ratio value for pyrene ∕ BaP was ∼ 0.7 for non-catalyst-equipped petrol cars, ∼ 1.3 for catalyst-equipped petrol cars and > 16 for heavy duty diesel engines. A recent study from Perrone et al. (2014) reported PM-phased PAH emission factors for different types of vehicles (Euro 3 standards); the ratio value for pyrene ∕ BaP was ∼ 6 and 30 for petrol and diesel cars, respectively. The results from both ratios (fluorene ∕ fluorene + pyrene and pyrene ∕ BaP) suggest high contribution from petrol engines to particle composition in Beijing and Delhi (Fig. S1). Tsapakis and Stephanou (2003) reported a relative reactivity for BaP, pyrene and fluorene of 0.86, 0.82 and 0.68 respectively. The relative reactivity of BaP and pyrene is similar and therefore does not affect the indicator pyrene ∕ BaP values. Pyrene is 20 % more reactive than fluorene; the on-filter oxidation has little effect on the indicator fluorene ∕ fluorene + pyrene values, because of the large difference in the defined threshold values, which were 6 and 30 for petrol and diesel cars, respectively.
3.4 Emission source fingerprints
The profiles of the specific class of PAHs and their abundance vary largely, depending on the fuel types and combustion conditions (IARC, 2012). Previous studies reported that two- and three-aromatic-ring PAHs are mostly emitted from wood combustion (Khalili et al., 1995; Larsen and Baker, 2003; Liu et al., 2017); two-, three- and four-ring PAHs from diesel exhaust emission (Bourotte et al., 2005; Ravindra et al., 2007; De Souza and Corrêa, 2016; Zheng et al., 2017); three- and four-ring PAHs from coal combustion (Harrison, et al., 1996; Liu et al., 2017); four-, five- and six-ring PAHs from vehicle emissions (Ravindra et al., 2007; Zhao et al., 2020); and five- and six-ring PAHs from petrol and oil combustion (Harrison et al., 1996; Ravindra et al., 2007). In this study, we have classified the 17 PAHs based on their number of aromatic rings; we referred to previous studies and to our knowledge of local sources, sampling site and surroundings, and analytical uncertainties to describe the emission source of each class. The two- and three-aromatic-ring PAHs were below the limit of detection (LOD) and limit of quantification (LOQ) in many samples; however, they are predominantly found in the gas phase, and their partitioning to the particle phase is very small because of their high volatility; their percentage in the particle phase was previously reported to be less than 10 % (Ravindra et al., 2007; Liu et al., 2017; Zhao et al., 2020).
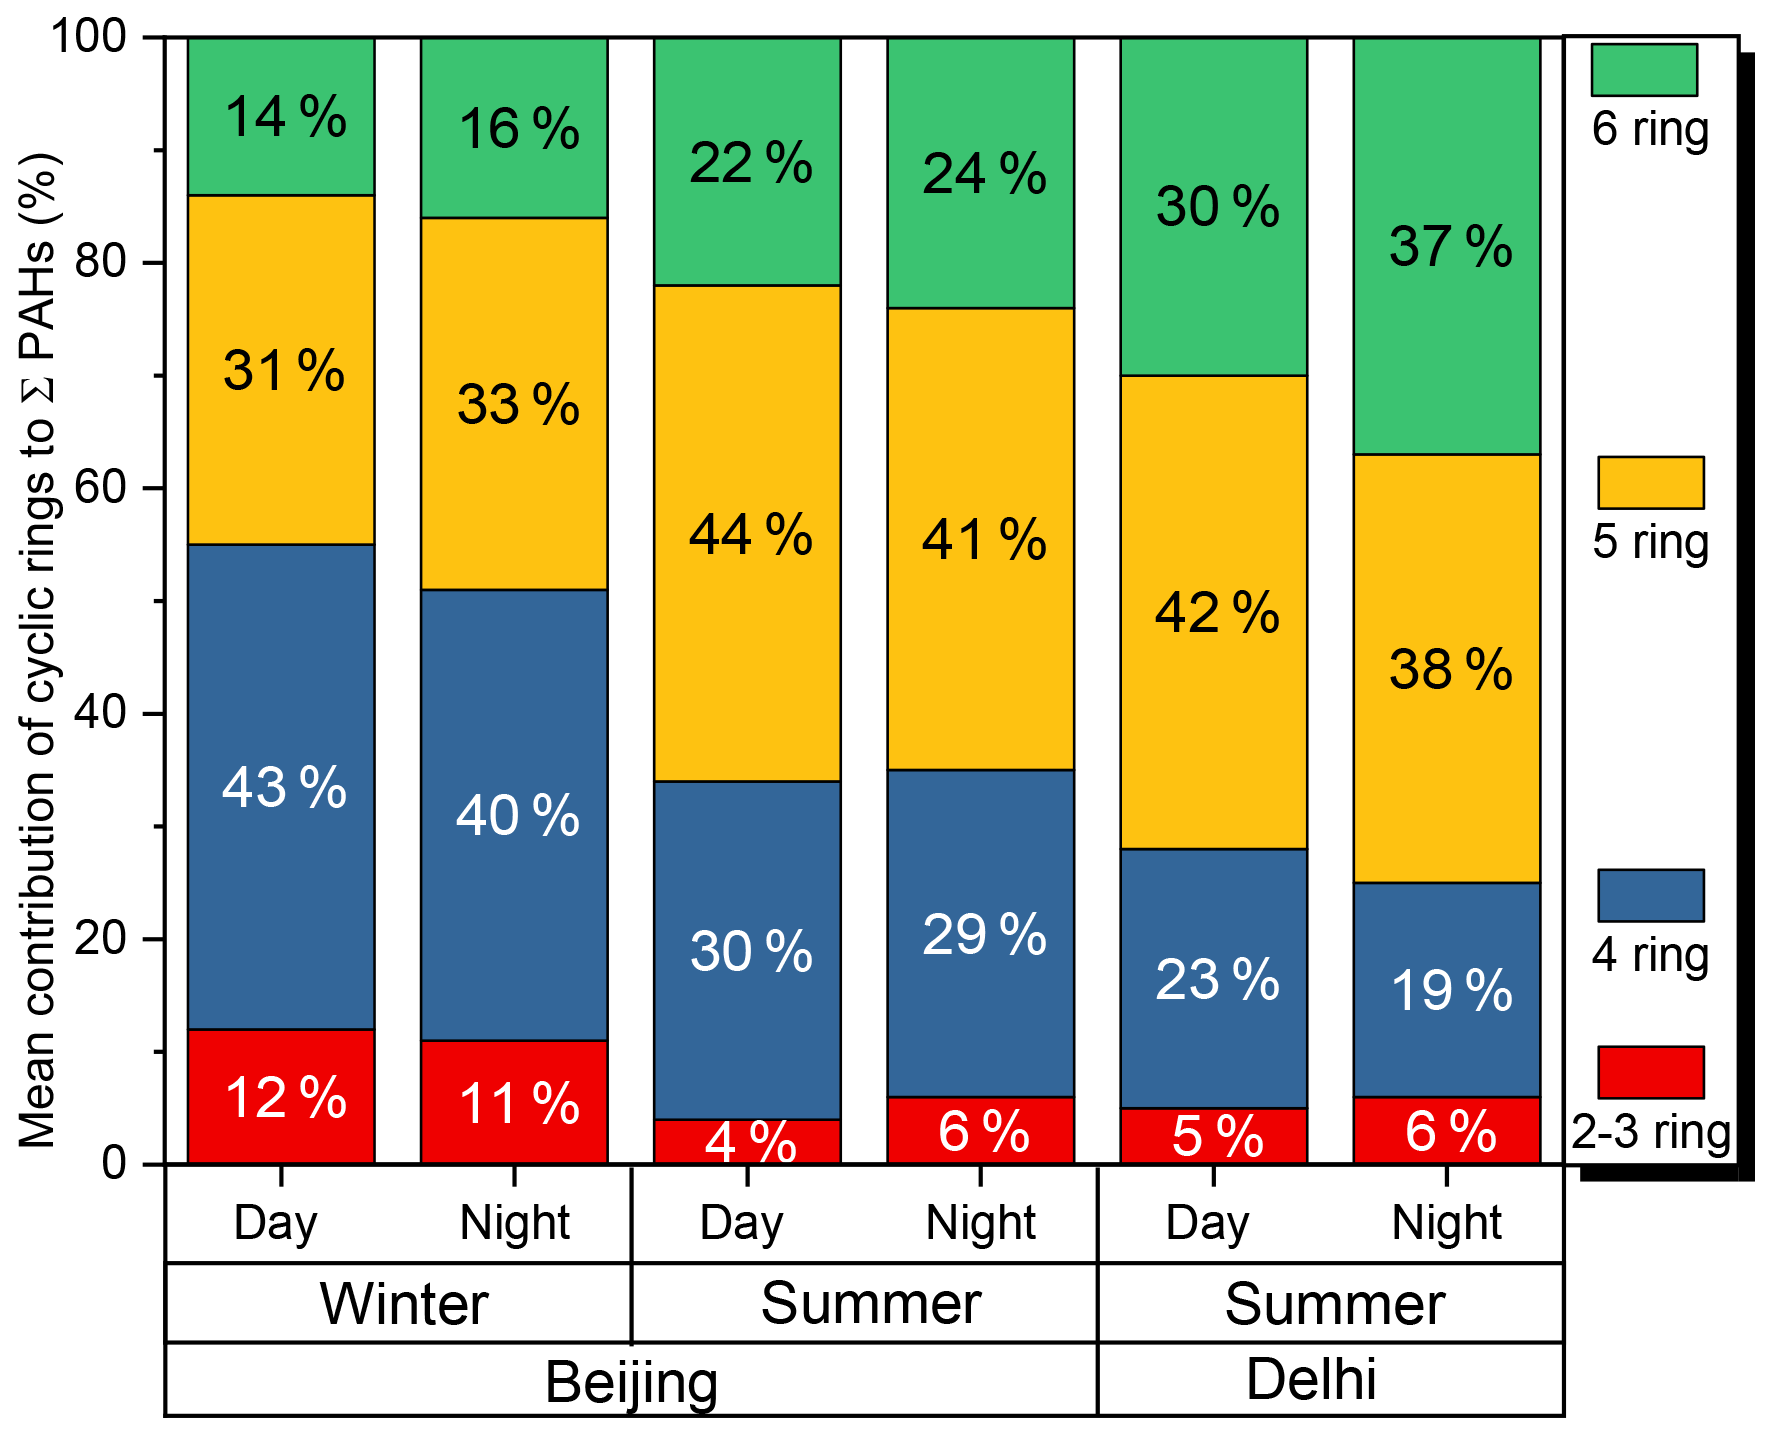
Figure 6Distribution of PAH compounds by number of cyclic rings in PM2.5 samples collected during the daytime (every 3 h) and night-time (15 h) for summer Beijing 2017 and Delhi 2018 (this study) and winter Beijing 2016 (Elzein et al., 2019).
In this study, the four-, five- and six-ring PAHs accounted for ∼ 95 % of the total PM2.5-bound PAH concentrations measured in both campaigns (Fig. 6). The mean contribution of the number of rings to the total of PAHs in Beijing PM2.5 was distributed in the order rings and in Delhi as rings (Fig. 6). In both Beijing and Delhi, road traffic is known to be one of the largest emission sources of gas and particle phase pollutants (Fang et al., 2016; Zhang et al., 2020; Shivani et al., 2019), which might explain the high contribution from four, five and six rings to total PAHs, while diesel and coal combustion may also contribute to the emission of four-ring PAHs. The four-ring PAH concentration in Delhi was higher than in Beijing; the mean concentration of the four-ring PAHs in daytime and night-time samples was 2.7 and 2.1 ng m−3 in Beijing and 3.1 and 4.1 ng m−3 in Delhi, respectively (Table 1). In contrast to Beijing ( ring), the four-ring PAH total concentration in Delhi was lower than the six-ring PAHs (Fig. 6), and a potential emission source could be the common use of fuel and oil in power generators.
The distribution of ring PAHs in Fig. 6 shows a comparison between the results from this study and our previous study in winter Beijing (Elzein et al., 2019). The contributions from two, three and four rings were higher in winter than in summer, and the ring PAHs are distributed as –3 ring (Fig. 6). Ambient temperature highly affects the gas–particle partitioning of two- to three-ring PAHs (Tsapakis and Stephanou, 2005; Gaga and Ari, 2011; Verma et al., 2017). Therefore, higher contributions from two, three and four rings in winter Beijing are likely due to lower temperature and to the use of coal and wood combustion for residential heating. The two- to three-ring and six-ring PAH contributions in winter Beijing are relatively similar, while in summer Beijing the contribution from six-ring PAHs is ∼ 20 % higher than that of the two- to three-ring PAHs, most probably due to the effect of ambient temperature on the two- to three-ring PAHs. The five-ring PAHs (representative of vehicle emissions) contribute the most to the total PAH concentration in summer Beijing and Delhi, suggesting a high contribution from petroleum combustion.
Finally, identifying PAH markers emitted from specific emission sources (types of fuel, types of coal, types of waste, etc.) in ambient air is still complex due to the similarity of PAH profiles from different source types, which may quickly blend in the air with interferences from both nearby and remote emission sources. A more complete assessment of emission source types at specific locations would require the use of individual PAHs as source markers combined with other chemical constituents of PM2.5 (elements and ions) and with gas phase air pollutants known to be released from the same source such as volatile organic compound (VOC) markers.
Table 2Mean concentration of BaPeq, BaP and LECR assessment for Beijing and Delhi.
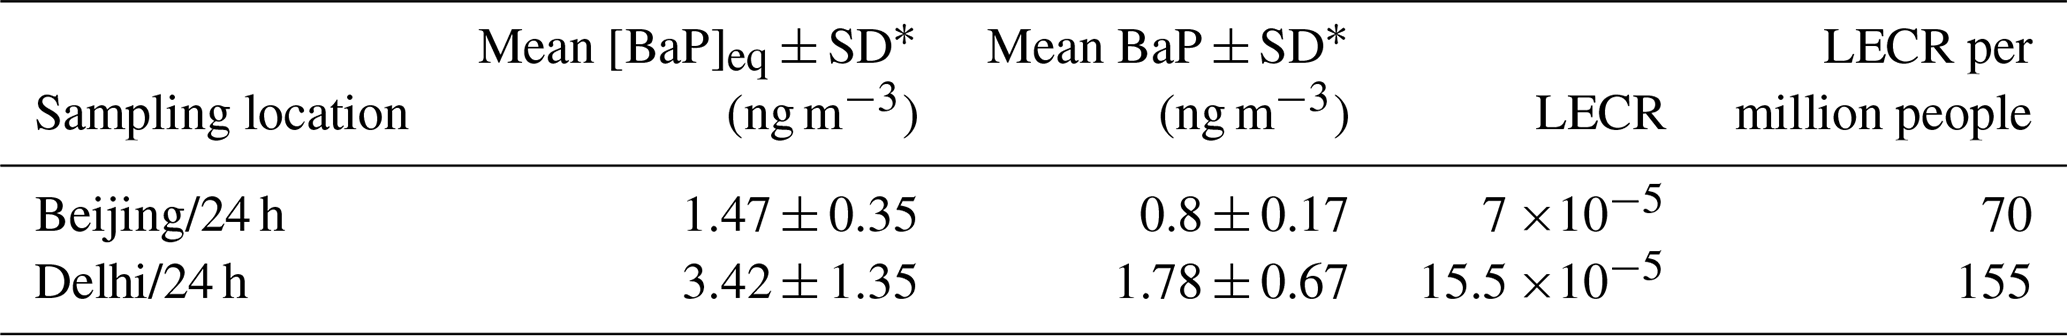
* SD: standard deviation.
3.5 Health risk assessment
Although PAHs have long been recognized as carcinogenic environmental pollutants, BaP is still the only PAH allowing a quantitative risk assessment (WHO, 2000; Boström et al., 2002). BaP is used as the most common reference chemical being representative for PAH mixtures from emissions of coke ovens and similar combustion processes in urban air (WHO, 2000). Relative potencies of individual PAHs (relative to BaP) have also been published as toxicity equivalency factors (TEFs) (Nisbet and LaGoy, 1992; Larsen and Larsen, 1998; Durant et al., 1996; OEHHA, 1994). Thus, the carcinogenic risk of the mixture of PAHs can be expressed as BaP equivalents (BaPeq). The equivalent exposure to the index compound (i.e. BaP) can be calculated from the TEF of each target compound (Table S2) multiplied by its corresponding concentration in ng m−3.
To estimate the statistical potential of contracting cancer from inhalation and lifetime exposure to PM2.5-bound PAHs, commonly known as the lifetime excess cancer risk (LECR) shown in Eq. (2), we have used the WHO unit risk (UR) estimate of 8.7 (ng m (WHO, 2000), meaning that 8.7 people per 100 000 people may contract lung cancer when exposed continuously to 1 ng m−3 of BaP concentration over a lifetime of 70 years. This risk refers to the total PAH mixture and not only to the BaP content (U.S.EPA, 2002, Boström et al., 2002) and is referred to as the surrogate approach. The use of BaPeq instead of BaP in Eq. (2) overestimates the LECR, and therefore the use of the actual measured BaP concentration better assesses the lifetime cancer risk following Eq. (2):
As shown in Table 2, the LECR attributable to the 15 PAHs in urban air of Beijing and Delhi was 7 and 15.5 (, respectively, suggesting an elevated lifetime cancer risk for adults (Chen and Liao, 2006; Bai et al., 2009), especially when considering the population size associated with each city. The LECR value for Delhi gives an estimate of 85 additional cancer cases per million people exposed, in comparison to Beijing. The LECR for Beijing in winter (Elzein et al., 2019) was much higher than in summer (this study) and showed 1235 additional cases, and this was mostly attributed to the increase in use of fossil fuels for central and residential heating, in addition to meteorological conditions such as lower volatilization at low temperatures and lower photochemical transformation. It is however the annual mean which is directly related to cancer risk.
Although BaP is widely used as an indicator of all PAH carcinogenicity, this approach is still under debate and may not give a very good representation of the whole mixture potency (U.S.EPA, 2002; Boström et al., 2002). Delgado-Saborit et al. (2011) have used the TEFs to calculate the percentage contribution of each PAH to total carcinogenicity following Eq. (3):
where RC is the relative abundance marker of an individual PAH to the carcinogenic marker BaP (RC = (PAH)i ∕ (BaP)). Using Eq. (3), the compounds that contribute most to the total carcinogenic potential of the PAH mixture in Beijing (B) and Delhi (D) are benzo[a]pyrene (B: 46 %; D: 48 %), dibenzo[a,h]anthracene (B: 23 %; D: 19 %), benzo[b]fluoranthene (B: 15 %; D: 13 %), benzo[k]fluoranthene (B: 5 %; D: 5 %) and indeno[1,2,3-cd]pyrene (B: 6 %; D: 10 %). The sum of all other PAHs used in this study was about 5 %.
Since the majority of people (∼ 90 %) spend most of their time indoor, the total PAH burden from inhalation has been related to indoor air, and BaP is used as a marker for the carcinogenic potential of all PAHs irrespective of the environment (indoor or outdoor) (Delgado-Saborit et al., 2011). In this study, the health risk evaluation was only based on inhalation exposure to PAHs in the particulate phase. The risk values can increase due to the presence of PAH derivatives in the particulate phase, such as the nitrated PAHs (Elzein et al., 2019), and in particular from 6-nitrochrysene and 1,6-dinitropyrene, which have been attributed a high TEF value equal to 10 (OEHHA, 1994; WHO, 2003; Lundstedt et al., 2007). Dermal exposure to PAHs is also an important risk factor for skin cancer, but toxicity values for dermal exposures are still not available (U.S.EPA, 2002); in addition, ingestion exposure to PAHs from soil, sediments and water is high (Li et al., 2010), and both exposures (dermal + ingestion) can highly exceed the risk from inhalation (U.S.EPA, 2002).
PAHs in the gas phase are mostly low molecular weight (two- to three-ring PAHs), and their partitioning to the particle phase is small (Ravindra et al., 2007; Liu et al., 2017; Zhao et al., 2020), with lower TEF values (Table S2); therefore, their contribution to total carcinogenic potential is low (< 5 % in this study). Previous studies may consider a variable number of PAHs and other aromatics with known TEFs such as the nitrated PAHs, including different references for TEF values which make a direct comparison of the carcinogenic risk between studies not ideal. However, as particulate-PAH concentrations are lower in warm months, related BaPeq values were also lower in warm months. Feng et al. (2019) reported an average BaPeq total concentration of 20 PAHs equal to 1.9 and 21.9 ng m−3 in summer and winter Beijing, respectively. In this study, the summer BaPeq total concentration of 15 quantified PAHs in Beijing was 1.47 ng m−3, while in our previous study for winter Beijing (Elzein et al., 2019), the BaPeq total concentration of 16 quantified PAHs and seven derivatives was 23.6 ng m−3. The results from this study suggest focusing attention on mitigating the emission of major contributors to the total carcinogenic potential (benzo[a]pyrene, dibenzo[a,h]anthracene, benzo[b]fluoranthene, benzo[k]fluoranthene and indeno[1,2,3-cd]pyrene) in order to reduce adverse health effects from exposure to this class of air pollution. These compounds are five- and six-ring PAHs and were mostly related to emission from petrol and oil combustion (Harrison et al., 1996; Ravindra et al., 2007).
Diurnally resolved samples of ambient PM2.5 were collected in Beijing, China, from 22 May to 10 June 2017 (20 d) and in Delhi from 28 May to 5 June 2018 (9 d). The 24 h average concentration of PM2.5 was 39 ± 21 µg m−3 (range: 16–97 µg m−3) in Beijing, exceeding the Chinese 24 h guideline value (75 µg m−3) on 1 d of the 20 sampling days, while in Delhi the 24 h average concentration of PM2.5 was 143 ± 27 µg m−3 (range: 110–195 µg m−3), exceeding the Indian 24 h guideline value (60 µg m−3) on all 9 sampling days. High contribution to PM2.5 emissions was attributed to residential energy use emissions and to the construction sector.
In Beijing and Delhi, 17 PAHs were quantified using a GC-Q-TOF-MS and the measured concentrations compared between daytime and night-time, showing a high relative proportion (∼ 95 %) of four-, five- and six-ring PAHs in the particle phase. In Beijing, ∑17 PAH concentrations varied between 2.6 and 31.2 ng m−3 (average 8.2 ± 5.1 ng m−3) in daytime and from 2.8 to 11.4 ng m−3 (average 7.2 ± 2.0 ng m−3) at night-time. In Delhi, ∑17 PAH concentrations varied between 8.4 and 36.6 ng m−3 (average 13.6 ± 5.9 ng m−3) in daytime and from 13.8 to 42.9 ng m−3 (average 22.7 ± 9.4 ng m−3) at night-time.
In Beijing, indeno[1,2,3-cd]pyrene was the highest contributor to the mean total PAHs during daytime (12 %) and benzo[b]fluoranthene at night-time (14 %). In Delhi, indeno[1,2,3-cd]pyrene was the largest contributor to the total PAHs in both the day (17 %) and night-time (20 %).
The elevated mean concentration of total PAHs in Delhi at night was attributed to emissions from biomass burning, waste burning and open-fire cooking along with meteorological conditions facilitating the accumulation of air pollutants as a result of low atmospheric boundary layer heights.
The ratio of BaP ∕ (BaP + BeP) has been used to evaluate the contribution from local sources against long-range atmospheric transport of particle-bound PAHs. This ratio suggests a larger contribution from local sources in both cities. Fluorene ∕ fluorene + pyrene and pyrene ∕ BaP were used as diagnostic ratios to distinguish between petrol and diesel, and results suggest petrol combustion emissions as a major source in Both Beijing and Delhi.
PAHs were classified according to their number of aromatic rings to characterize major emission sources. The four-, five- and six-ring PAHs accounted ∼ 95 % of the total PM2.5-bound PAH concentrations in both campaigns. The five-ring PAHs contribute the most to the total PAH concentration in summer Beijing and Delhi, suggesting a high contribution from petroleum combustion. In Beijing, the four-ring PAHs' total concentration was higher than the six-ring PAHs by 8 % during the day and 5 % at night, while in Delhi, the six-ring PAHs' total concentration was higher than the four-ring PAHs by 7 % during the day and 18 % at night; a potential emission source of six-ring PAHs in Delhi could be the common use of fuel and oil in power generators. Due to the similarity of PAH profiles from different source types, it would be beneficial to use other source markers such as elements and ions in PM2.5 and VOCs markers from the gas phase to better identify the differences in emission sources.
The lifetime excess lung cancer risk was calculated for Beijing and Delhi, with the highest estimated risk attributed to Delhi (LECR = 155 per million people), which is 2.2 times higher than the Beijing risk assessment value (LECR = 70 per million people). The results from this study suggest focusing attention on mitigating the emission of major contributors to the total carcinogenic potential, being the five- and six-ring PAHs (mostly emitted from petrol and oil combustion), in order to reduce adverse health effects from inhalation exposure to PAHs in the particulate phase.
Finally, in Beijing, the anti-pollution actions since 2013 appear to have had a positive effect on the air quality, while in Delhi, despite the government effort to mitigate air pollutants emission, a strict implementation of emission control policies is still needed with particular focus on mitigating residential emissions and burning, increasing the electricity supply to cover peak demand in summer, and limiting the use of local power generators as well as promoting cleaner vehicles. Future studies in different districts of Beijing (other than Haidian) and Delhi (other than old Delhi) and rural areas would be helpful for comparison of population exposures and spatial variation. Higher-frequency filter sampling (every 3 h) can provide a better assessment of PAH concentrations and photochemistry and can lead to better conclusions on direct source emission signals as modified by meteorology during the daytime and night-time.
The meteorological data in this study were taken from the National Oceanic and Atmospheric Administration.
PAHs data are presented in Table 1 and throughout the different sections of the paper. Specific data requests can be addressed by email to the corresponding author or co-authors.
The supplement related to this article is available online at: https://doi.org/10.5194/acp-20-14303-2020-supplement.
AE conducted the chemical analysis, analysed the data and prepared the manuscript. ACL, JFH and RMH contributed to the interpretation, writing and corrections of the paper. ERV calculated and provided the data on Delhi planetary boundary layer height. RG supported on-site filter collection and helped to set up the laboratory at the field site. AE and SJS conditioned and collected the filter samples in Beijing. GJS and BSN conditioned and collected the filter samples in Delhi. LRC and MSA measured and provided the data on PM2.5 in Delhi. All authors reviewed and contributed to corrections of the paper.
The authors declare that they have no conflict of interest.
This article is part of the special issue “In-depth study of air pollution sources and processes within Beijing and its surrounding region (APHH-Beijing) (ACP/AMT inter-journal SI)”. It is not associated with a conference.
Authors gratefully acknowledge the UK Natural Environment Research Council for funding the Air Pollution and Human Health programme (grant nos. NE/N007115/1 and NE/N006917/1). We also acknowledge the NERC grant NE/S006648/1. We acknowledge the support from Pingqing Fu, Zifa Wang, Jie Li and Yele Sun from IAP for hosting the APHH-Beijing campaign at IAP. We thank Zongbo Shi, Tuan Vu and Bill Bloss from the University of Birmingham; Siyao Yue, Liangfang Wei, Hong Ren, Qiaorong Xie, Wanyu Zhao, Linjie Li, Ping Li, Shengjie Hou and Qingqing Wang from IAP; Kebin He and Xiaoting Cheng from Tsinghua University; and James Allan from The University of Manchester for providing logistic and scientific support for the field campaigns. Leigh Creilly and Mohammed Alam acknowledge the NERC grant NE/P016499/1. We acknowledge the logistic support of Shivani (Indira Gandhi Delhi Technical University for Women), Eiko Nemitz and Neil Mulligan (Centre for Ecology and Hydrology), and Tuhin Mandal (CSIR-National Physical Laboratory). This work was supported by the Newton-Bhabha Fund administered by the UK Natural Environment Research Council, through the Delhi Flux project of the Atmospheric Pollution and Human Health in an Indian Megacity (APHH-India) programme (grant reference NE/P016502/1). Gareth J. Stewart, Beth S. Nelson and Stefan J. Swift acknowledge the NERC SPHERES doctoral training programme for studentships.
This research has been supported by the UK Natural Environment Research Council (grant nos. NE/N007115/1, NE/N006917/1, NE/P016502/1, NE/P016499/1 and NE/S006648/1).
This paper was edited by Pingqing Fu and reviewed by two anonymous referees.
Albinet, A., Leoz-Garziandia, E., Budzinski, H., Villenave, E., and Jaffrezo, J. L.: Nitrated and oxygenated derivatives of polycyclic aromatic hydrocarbons in the ambient air of two French alpine valleys Part 1: Concentrations, sources and gas/particle partitioning, Atmos. Environ., 42, 43–54, https://doi.org/10.1016/j.atmosenv.2007.10.009, 2008.
Bai, Z., Hu, Y., Yu, H.,Wu, N., and You, Y.: Quantitative health risk assessment of inhalation exposure to polycyclic aromatic hydrocarbons on citizens in Tianjin, China, B. Environ. Contam. Tox., 83, 151–154, https://doi.org/10.1007/s00128-009-9686-8, 2009.
Bond, T. C., Streets, D. G., Yarber, K. F., Nelson, S. M., Woo, J. H., and Klimont, Z.: A technology-based global inventory of black and organic carbon emissions from combustion, J. Geophys. Res., 109, D14203, https://doi.org/10.1029/2003JD003697, 2004.
Boström, C.-E., Gerde, P., Hanberg, A., Jernström, B., Johansson, C., Kyrklund, T., Rannug, A., Törnqvist, M., Victorin, K., and Westerholm, R.: Cancer Risk Assessment, Indicators, and Guidelines for Polycyclic Aromatic Hydrocarbons in the Ambient Air, Environ. Health. Persp., 110, 451–489, https://doi.org/10.1289/ehp.110-1241197, 2002.
Bourotte, C., Forti, M.-C.,Taniguchi, S., Bícego, M. C., and Lotufo, P. A.: A wintertime study of PAHs in fine and coarse aerosols in São Paulo city, Brazil, Atmos. Environ., 39, 3799-3811, https://doi.org/10.1016/j.atmosenv.2005.02.054, 2005.
Brown, R. J. C. and Brown, A. S.: The effect of degradation by gaseous oxidants on measured benzo[a]pyrene concentrations, NPL report AS 72, 2012.
Butler, J. D. and Crossley, P.: Reactivity of polycyclic aromatic hydrocarbons adsorbed on soot particles, Atmos. Environ., 15, 91–94, https://doi.org/10.1016/0004-6981(81)90129-3, 1981.
Butt, E. W., Rap, A., Schmidt, A., Scott, C. E., Pringle, K. J., Reddington, C. L., Richards, N. A. D., Woodhouse, M. T., Ramirez-Villegas, J., Yang, H., Vakkari, V., Stone, E. A., Rupakheti, M., S. Praveen, P., G. van Zyl, P., P. Beukes, J., Josipovic, M., Mitchell, E. J. S., Sallu, S. M., Forster, P. M., and Spracklen, D. V.: The impact of residential combustion emissions on atmospheric aerosol, human health, and climate, Atmos. Chem. Phys., 16, 873–905, https://doi.org/10.5194/acp-16-873-2016, 2016.
Chen, S. C. and Liao, C. M.: Health risk assessment on human exposed to environmental polycyclic aromatic hydrocarbons pollution sources, Sci. Total Environ., 366, 112–123, https://doi.org/10.1016/j.scitotenv.2005.08.047, 2006.
Chen, Y., Li, X., Zhu, T., Han, Y., and Lv, D.: PM2.5-bound PAHs in three indoor and one outdoor air in Beijing: Concentration, source and health risk assessment, Sci. Total Environ., 586, 255–264, https://doi.org/10.1016/j.scitotenv.2017.01.214, 2017.
Chen, Y., Wild, O., Conibear, L., Ran, L., He, J., Wang, L., and Wang, Y.: Local characteristics of and exposure to fine particulate matter (PM2.5) in four indian megacities, Atmos. Environ., 5, 100052, https://doi.org/10.1016/j.aeaoa.2019.100052, 2020.
Cheng, Z., Luo, L., Wang, S., Wang, Y., Sharma, S., Shimadera, H., Wang, X., Bressi, M., Maura de Miranda, R., Jiang, J., Zhou, W., Fajardo, O., Yan, N., and Hao, J.: Status and characteristics of ambient PM2.5 pollution in global megacities, Environ. Int., 89–90, 212–221 https://doi.org/10.1016/j.envint.2016.02.003, 2016.
Chowdhury, Z., Zheng, M., Schauer, J. J., Sheesley, R. J., Salmon, L. G., Cass, G. R., and Russell, A. G.: Speciation of ambient fine organic carbon particles and source apportionment of PM2.5 in Indian cities, J. Geophys. Res., 112, D15303, https://doi.org/10.1029/2007JD008386, 2007
Chowdhury, S. and Dey, S.: Cause-specific premature death from ambient PM2.5 exposure in India: Estimate adjusted for baseline mortality, Environ. Int. 91, 283–290, 2016.
Chowdhury, S., Dey, S., Tripathi, S. N., Beig, G., Mishra, A. K., and Sharma, S.: “Traffic intervention” policy fails to mitigate air pollution in megacity Delhi, Environ. Sci. Policy, 74, 8–13, https://doi.org/10.1016/j.envsci.2017.04.018, 2017
Conibear, L., Butt, E. W., Knote, C., Arnold, S. R., and Spracklen, D. V.: Residential energy use emissions dominate health impacts from exposure to ambient particulate matter in India, Nat. Commun., 9, 617, https://doi.org/10.1038/s41467-018-02986-7, 2018.
Delgado-Saborit, J. M., Stark, C., and Harrison, R. M.: Carcinogenic potential, levels and sources of polycyclic aromatic hydrocarbon mixtures in indoor and outdoor environments and their implications for air quality standards, Environ. Int. 37, 383–392, https://doi.org/10.1016/j.envint.2010.10.011, 2011.
De Souza, C. V. and Corrêa, S. M.: Polycyclic aromatic hydrocarbons in diesel emission, diesel fuel and lubricant oil, Fuel, 185, 925–931, https://doi.org/10.1016/j.fuel.2016.08.054, 2016.
Durant, J. L., Busby, W. F., Lafleur, A. L., Penman, B. W., and Crespi, C. L.: Human cell mutagenicity of oxygenated, nitrated and unsubstituted polycyclic aromatic hydrocarbons associated with urban aerosols, Mutat. Res. Genet. Toxicol., 371, 123–157, https://doi.org/10.1016/S0165-1218(96)90103-2, 1996.
Elzein, A., Dunmore, R. E., Ward, M. W., Hamilton, J. F., and Lewis, A. C.: Variability of polycyclic aromatic hydrocarbons and their oxidative derivatives in wintertime Beijing, China, Atmos. Chem. Phys., 19, 8741–8758, https://doi.org/10.5194/acp-19-8741-2019, 2019.
Fang, X., Li, R., Xu, Q., Bottai, M., Fang, F., and Cao, Y.: A Two-Stage Method to Estimate the Contribution of Road Traffic to PM2.5 Concentrations in Beijing, China, Int. J. Environ. Res. Public Health, 13, 124, https://doi.org/10.3390/ijerph13010124, 2016.
Feng, J., Chan, C. K., Fang, M., Hu, M., He, L., and Tang, X.: Impact of meteorology and energy structure on solvent extractable organic compounds of PM2.5 in Beijing, China, Chemosphere, 61, 623–632, https://doi.org/10.1016/j.chemosphere.2005.03.067, 2005.
Feng, B., Li, L., Xu, H., Wang, T., Wu, R., Chen, J., Zhang, Y., Liu, S., Ho, S. S. H., Cao, J., and Huang, W.: PM2.5-bound polycyclic aromatic hydrocarbons (PAHs) in Beijing: Seasonal variations, sources, and risk assessment, J. Environ. Sci., 77, 11–19, https://doi.org/10.1016/j.jes.2017.12.025, 2019.
Gadi, R., Shivani, Sharma, S. K., and Mandal, T. K.: Source apportionment and health risk assessment of organic constituents in fine ambient aerosols (PM2.5): A complete year study over National Capital Region of India, Chemosphere, 221, 583–596, https://doi.org/10.1016/j.chemosphere.2019.01.067, 2019.
Gaga, E. O. and Ari, A.: Gas–particle partitioning of polycyclic aromatic hydrocarbons (PAHs) in an urban traffic site in Eskisehir, Turkey, Atmos. Res., 99, 207–216, https://doi.org/10.1016/j.atmosres.2010.10.013, 2011.
Gao, Y. and Ji, H.: Characteristics of polycyclic aromatic hydrocarbons components in fine particle during heavy polluting phase of each season in urban Beijing, Chemosphere, 212, 346–357, https://doi.org/10.1016/j.chemosphere.2018.08.079, 2018.
Ghude, S. D., Chate, D. M., Jena, C., Beig, G., Kumar, R., Barth, M. C., Pfister, G. G., Fadnavis, S., and Pithani, P.: Premature mortality in India due to PM2.5 and ozone exposure, Geophys. Res. Lett., 43, 4650–4658, 2016.
Goel, R. and Guttikunda, S. K.: Evolution of on-road vehicle exhaust emissions in Delhi, Atmos. Environ., 105, 78–90, https://doi.org/10.1016/j.atmosenv.2015.01.045, 2015.
Goriaux, M., Jourdain, B., Temime, B., Besombes, J.-L., Marchand, N., Albinet, A., Leoz-Garziandia, E. and Wortham, H.: Field Comparison of Particulate PAH Measurements Using a Low-Flow Denuder Device and Conventional Sampling Systems, Environ. Sci. Technol., 40, 6398–6404, https://doi.org/10.1021/es060544m, 2006.
Gupta, S., Kumar, K., Srivastava, A., Srivastava, A., and Jain, V. K.: Size distribution and source apportionment of polycyclic aromatic hydrocarbons (PAHs) in aerosol particle samples from the atmospheric environment of Delhi, India, Sci. Total Environ., 409, 4674–4680, https://doi.org/10.1016/j.scitotenv.2011.08.008, 2011.
Guttikunda, S. K. and Calori, G.: A GIS based emissions inventory at 1 km × 1 km spatial resolution for air pollution analysis in Delhi, India, Atmos. Environ., 67, 101–111, https://doi.org/10.1016/j.atmosenv.2012.10.040, 2013.
Guttikunda, S. K., Goel, R., and Pant, P.: Nature of air pollution, emission sources, and management in the Indian cities, Atmos. Environ., 95, 501–510, https://doi.org/10.1016/j.atmosenv.2014.07.006, 2014.
Hamra, G. B., Guha, N., Cohen, A., Laden, F., Raaschou-Nielsen, O., Samet, J. M., Vineis. P., Forastiere, F., Saldiva, P., Yorifuji, T., and Loomis, D.: Outdoor particulate matter exposure and lung cancer: a systematic review and meta-analysis, Environ. Health. Perspect., 122, 906–911, https://doi.org/10.1289/ehp.1408092, 2014.
Harrison, R. M., Smith, D. J. T., and Luhana, L.: Source apportionment of atmospheric polycyclic hydrocarbons collected from an urban location in Birmingham, U.K., Environ. Sci. Technol., 30, 825–832, 1996.
Harish, S., Singh, N., and Tongia, R.: Impact of temperature on electricity demand: Evidence from Delhi and Indian states, Energ. Policy, 140, 111445, https://doi.org/10.1016/j.enpol.2020.111445, 2020.
He, K. B., Yang, F., Ma, Y., Zhang, Q., Yao, X. H., Chan, C. K., Cadle, S., Chan, T., and Mulawa, P.: The characteristics of PM2.5 in Beijing, China, Atmos. Environ., 35, 4959–4970, https://doi.org/10.1016/S1352-2310(01)00301-6, 2001.
IARC (International Agency for Research on Cancer): Chemical agents and related occupations, IARC Monogr Eval Carcinog Risks Hum, 100F: 111–138, Lyon, France, available at: https://publications.iarc.fr/123 (last access: 18 November 2020), 2012.
IARC (International Agency for Research on Cancer): Monographs on the Evaluation of Carcinogenic Risks to Humans, 100E, Indoor emissions from household combustion of coal, 515–532, Lyon, France, available at: https://publications.iarc.fr/122 (last access: 18 November 2020), 2012.
Kanawade, V. P., Srivastava, A. K., Ram, K., Asmi, E., Vakkari, V., Soni, V. K., Varaprasad, V., and Sarangi, C.: What caused severe air pollution episode of November 2016 in New Delhi?, Atmos. Environ., 222, 117125, https://doi.org/10.1016/j.atmosenv.2019.117125, 2019.
Katsoyiannis, A., Sweetman, A. J., and Jones, K. C.: PAH Molecular Diagnostic Ratios Applied to Atmospheric Sources: A Critical Evaluation Using Two Decades of Source Inventory and Air Concentration Data from the UK, Environ. Sci. Technol., 45, 8897–8906, https://doi.org/10.1021/es202277u, 2011.
Keyte, I. J., Harrison, R. M., and Lammel, G.: Chemical reactivity and long-range transport potential of polycyclic aromatic hydrocarbons – a review, Chem. Soc. Rev., 42, 9333–9391, https://doi.org/10.1039/C3CS60147A, 2013.
Khalili, N. R., Scheff, P. A., and Holsen, T. M.: PAH source fingerprints for coke ovens, diesel and gasoline engines, highway tunnels, and wood combustion emissions, Atmos. Environ., 29, 533–542, 1995.
Larsen, J. C. and Larsen, P. B.: Chemical Carcinogens, in: Air pollution and Health, Volume 10 of Issues in environmental science and technology, edited by: Hester, R. E. and Harrison, R. M., Royal Society of Chemistry, United Kingdom, 33–56, https://doi.org/10.1039/9781847550095, 1998.
Larsen, R. K. and Baker, J. E.: Source Apportionment of Polycyclic Aromatic Hydrocarbons in the Urban Atmosphere: A Comparison of Three Methods, Environ. Sci. Technol., 37, 1873–1881, https://doi.org/10.1021/es0206184, 2003.
Li, J., Shang, X., Zhao, Z., Tanguay, R. L., Dong, Q., and Huang, C.: Polycyclic aromatic hydrocarbons in water, sediment, soil, and plants of the Aojiang River waterway in Wenzhou, China, J. Hazard. Mater. 173, 75–81, https://doi.org/10.1016/j.jhazmat.2009.08.050, 2010.
Lin, Y., Zou, J., Yang, W., and Li, C. Q.: A Review of Recent Advances in Research on PM2.5 in China, Int. J. Environ. Res. Public. Health., 15, 438, https://doi.org/10.3390/ijerph15030438, 2018.
Li, X., Wang, Y., Guo, X., and Wang, Y.: Seasonal variation and source apportionment of organic and inorganic compounds in PM2.5 and PM10 particulates in Beijing, China, J. Environ. Sci., 25, 741–750, https://doi.org/10.1016/S1001-0742(12)60121-1, 2013.
Liu, J., Li, J., Lin, T., Liu, D., Xu, Y., Chaemfa, C., Qi, S., Liu, F., and Zhang, G.: Diurnal and nocturnal variations of PAHs in the Lhasa atmosphere, Tibetan Plateau: Implication for local sources and the impact of atmospheric degradation processing, Atmos. Res., 124, 34–43, https://doi.org/10.1016/j.atmosres.2012.12.016, 2013.
Liu, D., Lin, T., Syed, J. H., Cheng, Z., Xu, Y., Li, K., Zhang, G., and Jun, Li.: Concentration, source identification, and exposure risk assessment of PM2.5-bound parent PAHs and nitro-PAHs in atmosphere from typical Chinese cities, Sci. Rep., 7, 10398, https://doi.org/10.1038/s41598-017-10623-4, 2017.
Lohmann, R. and G. Lammel.: Adsorptive and absorptive contributions to the gas-particle partitioning of polycyclic aromatic hydrocarbons: State of knowledge and recommended parametrization for modeling, Environ. Sci. Technol., 38, 3793–3803, https://doi.org/10.1021/es035337q, 2004.
Lundstedt, S., White, P. A., Lemieux, C. L., Lynes, K. D., Lambert, L. B., Öberg, L., Haglund, P., and Tysklind, M.: Sources, fate, and toxic hazards of oxygenated polycyclic aromatic hydrocarbons (PAHs) at PAH-contaminated sites, AMBIO, 36, 475–485, 2007.
Meador, J. P., Stein, J. E., Reichert, W. L., and Varanasi, U.: Bioaccumulation of polycyclic aromatic hydrocarbons by marine organisms, Rev Environ. Contam. Toxicol., 143, 79–165, 1995.
Mehmood, T., Zhu, T., Ahmad, I., and Li, X.: Ambient PM2.5 and PM10 bound PAHs in Islamabad, Pakistan: Concentration, source and health risk assessment, Chemosphere, 257, 127187, https://doi.org/10.1016/j.chemosphere.2020.127187, 2020
Menzie, C. A., Potocki. B. B., Santodonato, J.: Exposure to carcinogenic PAHs in the environment, Environ. Sci. Technol., 26, 1278–1284, https://doi.org/10.1021/es00031a002, 1992.
Ministry of Ecology and Environment The People's Republic of China: Ambient air quality standards (GB-3095-2012), available at: http://english.mee.gov.cn/Resources/standards/Air_Environment/quality_standard1/201605/t20160511_337502.shtml (last access: 18 November 2020), 2012.
Nagar, J. K., Shrivastava, J. P., and Kumar, R.: Airborne suspended particulate matter and its impact on human respiratory system – mineralogical study from Shahdara and Shahzada Bagh industrial areas in Delhi, Chap. 4, Land resources, Geohazards and environment, 489–507, Geo-resources, 2014.
Nisbet, I. C. T. and LaGoy, P. K.: Toxic equivalency factors (TEFs) for polycyclic aromatic hydrocarbons (PAHs), Regul. Toxicol. Pharmacol., 16, 290–300, https://doi.org/10.1016/0273-2300(92)90009-X, 1992.
OEHHA (Office of Environmental Health Hazard Assessment): Benzo[a]pyrene as a Toxic Air Contaminant, available at: https://oehha.ca.gov/media/downloads/air/document/benzo5ba5dpyrene.pdf (last access: 1 July 2020), 1994.
Pant, P., Habib, G., Marshall, J. D., and Peltier, R. E.: PM2.5 exposure in highly polluted cities: A case study from New Delhi, India, Environ. Res., 156, 167–174, 2017.
Perrone, M. G., Carbone, C., Faedo, D., Ferrero, L., Maggioni, A., Sangiorgi, G., and Bolzacchini, E.: Exhaust emissions of polycyclic aromatic hydrocarbons, n-alkanes and phenols from vehicles coming within different European classes, Atmos. Environ., 82, 391–400, https://doi.org/10.1016/j.atmosenv.2013.10.040, 2014.
Pun, V. C., Kazemiparkouhi, F., Manjourides, J., and Suh, H. H.: Long-Term PM2.5 Exposure and Respiratory, Cancer, and Cardiovascular Mortality in Older US Adults, Am. J. Epidem., 186, 961–969, https://doi.org/10.1093/aje/kwx166, 2017.
Raaschou-Nielsen, O., Andersen, Z. J., Beelen, R., Samoli, E., Stafoggia, M., Weinmayr, G., Hoffmann, B., Fischer, P., Nieuwenhuijsen, M. J., Brunekreef, B., Xun, W. W., Kat- souyanni, K., Dimakopoulou, K., Sommar, J., Forsberg, B., Modig, L., Oudin, A., Oftedal, B., Schwarze, P. E., Nafstad, P., De Faire, U., Pedersen, N. L., Ostenson, C. G., Fratiglioni, L., Penell, J., Korek, M., Pershagen, G., Eriksen, K. T., Sørensen, M., Tjønneland, A., Ellermann, T., Eeftens, M., Peeters, P. H., Meliefste, K., Wang, M., Bueno-de-Mesquita, B., Key, T. J., De Hoogh, K., Concin, H., Nagel, G., Vilier, A., Grioni, S., Krogh, V., Tsai, M. Y., Ricceri, F., Sacerdote, C., Galassi, C., Migliore, E., Ranzi, A., Cesaroni, G., Badaloni, C., Forastiere, F., Tamayo, I., Amiano, P., Dorronsoro, M., Trichopoulou, A., Bamia, C., Vineis, P., and Hoek, G.: Air pollution and lung cancer incidence in 17 European cohorts: prospective analyses from the European Study of Cohorts for Air Pollution Effects (ESCAPE), Lancet. Oncol., 14, 813–822, https://doi.org/10.1016/S1470-2045(13)70279-1, 2013.
Ravindra, K., Sokhi, R., and Van Grieken, R.: Atmospheric polycyclic aromatic hydrocarbons: Source attribution, emission factors and regulation, Atmos. Environ., 42, 2895–2921, https://doi.org/10.1016/j.atmosenv.2007.12.010, 2007.
Ravindra, K., Sokhi, R., and Van Grieken, R.: Atmospheric polycyclic aromatic hydrocarbons: source attribution, emission factors and regulation, Atmos. Environ., 42, 2895–2921, https://doi.org/10.1016/j.atmosenv.2007.12.010, 2008.
Reisen, F. and Arey, J.: Atmospheric reactions influence seasonal PAH and nitro-PAH concentrations in the Los Angeles basin, Environ. Sci. Technol., 39, 64–73, https://doi.org/10.1021/es035454l, 2004.
Ringuet, J., Albinet, A., Leoz-Garziandia, E., Budzinski, H., and Villenave, E.: Diurnal/nocturnal concentrations and sources of particulate-bound PAHs, OPAHs and NPAHs at traffic and suburban sites in the region of Paris (France), Sci. Total Environ., 437, 297–305, https://doi.org/10.1016/j.scitotenv.2012.07.072, 2012a.
Ringuet, J., Albinet, A., Leoz-Garziandia, E., Budzinski, H., and Villenave, E.: Reactivity of polycyclic aromatic compounds (PAHs, NPAHs and OPAHs) adsorbed on natural aerosol particles exposed to atmospheric oxidants, Atmos. Environ., 61, 15–22, https://doi.org/10.1016/j.atmosenv.2012.07.025, 2012b.
Rogge, W. F., Hlldeman, L. M., Mazurek, M. A., Cass, G. R., and Simoneit, B. R. T.: Sources of fine organic aerosol. 2. Noncatalyst and Catalyst-equipped automobiles and heavy-duty diesel trucks, Environ. Sci. Technol., 27, 636–651, https://doi.org/10.1021/es00041a007, 1993.
Saikawa, E., Naik, V., Horowitz, L. W., Liu, J. F., and Mauzerall, D. L.: Present and potential future contributions of sulfate, black and organic carbon aerosols from China to global air quality, premature mortality and radiative forcing, Atmos. Environ., 43, 2814–2822, https://doi.org/10.1016/j.atmosenv.2009.02.017, 2009.
Schauer, C., Neissner, R., and Pöschl, U.: Polycyclic Aromatic Hydrocarbons in Urban Air Particulate Matter: Decadal and Seasonal Trends, Chemical Degradation, and Sampling Artifacts, Environ. Sci. Technol., 37, 2861–2868, https://doi.org/10.1021/es034059s, 2003.
Schraufnagel, D. E.: The health effects of ultrafine particles, Experiment. Molec. Med., 52, 311–317, https://doi.org/10.1038/s12276-020-0403-3, 2020.
Sharma, H., Jain, V. K., and Khan, Z. H.: Characterization and source identification of polycyclic aromatic hydrocarbons (PAHs) in the urban environment of Delhi, Chemosphere, 66, 302–310, https://doi.org/10.1016/j.chemosphere.2006.05.003, 2007.
Sharma, S. K. and Mandal, T. K.: Chemical composition of fine mode particulate matter (PM2.5) in an urban area of Delhi, India and its source apportionment, Urban Climate, 21, 106–122, https://doi.org/10.1016/j.uclim.2017.05.009, 2017.
Shivani, Gadi, R., Sharma, S. K., Mandal, T. K.: Seasonal variation, source apportionment and source attributed health risk of fine carbonaceous aerosols over National Capital Region, India, Chemosphere, 237, 124500, https://doi.org/10.1016/j.chemosphere.2019.124500, 2019.
Singh, D. P., Gadi, R., and Mandal, T. K.: Characterization of particulate-bound polycyclic aromatic hydrocarbons and trace metals composition of urban air in Delhi, India, Atmos. Environ., 45, 7653–7663, https://doi.org/10.1016/j.atmosenv.2011.02.058, 2011.
Srivastava, D., Favez, O., Bonnaire, N., Lucarelli, F., Haeffelin, M., Perraudin, E., Gros, V., Villenave, E., and Albinet, A.: Speciation of organic fractions does matter for aerosol source apportionment. Part 2: Intensive short-term campaign in the Paris area (France), Sci. Total Environ., 634, 267–278, https://doi.org/10.1016/j.scitotenv.2018.03.296, 2018.
Song, H., Zhang, Y., Luo, M., Gu, J., Wu, M., Xu, D., Xu, G., and Ma, L.: Seasonal variation, sources and health risk assessment of polycyclic aromatic hydrocarbons in different particle fractions of PM2.5 in Beijing, China, Atmos. Pollut. Res., 10, 105–114, https://doi.org/10.1016/j.apr.2018.06.012, 2019.
Tian, Y., Xiao, Z., Wang, H., Peng, X., Guan, L., Huangfu, Y., Shi, Guoliang, Chen, K., Bi, X., and Feng, Y.: Influence of the sampling period and time resolution on the PM source apportionment: Study based on the high time-resolution data and long-term daily data, Atmos. Environ., 165, 301–309, https://doi.org/10.1016/j.atmosenv.2017.07.003, 2017.
Tiwari, S., Hopke, P. K., Pipal, A. S., Srivastava A. K., Bisht, D. S., Tiwari, S., Singh, A. K., Soni, V. K., and Attri, S. D.: Intra-urban variability of particulate matter (PM2.5 and PM10) and its relationship with optical properties of aerosols over Delhi, India, Atmos. Envirom., 166, 223–232, 2015.
Tobiszewski, M. and Namiesnik, J.: PAH diagnostic ratios for the identification of pollution emission sources, Environ. Pollut., 162, 110–119, https://doi.org/10.1016/j.envpol.2011.10.025, 2012.
Tsapakis, M. and Stephanou, E. G.: Collection of gas and particle semi-volatile organic compounds: use of an oxidant denuder to minimize polycyclic aromatic hydrocarbons degradation during high-volume air sampling, Atmos. Environ., 37, 4935–4944, https://doi.org/10.1016/j.atmosenv.2003.08.026, 2003.
Tsapakis, M. and Stephanou, E. G.: Occurrence of gaseous and particulate polycyclic aromatic hydrocarbons in the urban atmosphere: study of sources and ambient temperature effect on the gas/particle concentration and distribution, Environ. Pollut., 133, 147–156, https://doi.org/10.1016/j.envpol.2004.05.012, 2005.
Tsapakis, M. and Stephanou, E. G: Diurnal Cycle of PAHs, Nitro-PAHs, and oxy-PAHs in a High Oxidation Capacity Marine Background Atmosphere, Environ. Sci. Technol., 41, 8011–8017, https://doi.org/10.1021/es071160e, 2007.
U.S. EPA: Peer Consultation Workshop On Approaches To Polycyclic Aromatic Hydrocarbon (PAH) Health Assessment, U.S. Environmental Protection Agency, Office of Research and Development, National Center for Environmental Assessment, Washington Office, Washington, DC, EPA/635/R-02/005, 2002.
United Nations, Department of Economic and Social Affairs, Population Division: World Urbanization Prospects: The 2018 Revision (ST/ESA/SER.A/420), New York: United Nations, available at: https://population.un.org/wup/Publications/Files/WUP2018-Report.pdf (last access: 1 July 2020), 2019
Verma, P. K., Sah, D., Kumari, K. M., and Lakhani, A.: Atmospheric concentrations and gas-particle partitioning of polycyclic aromatic hydrocarbons (PAHs) and nitro-PAHs at Indo-Gangetic sites, Environ. Sci.-Proc. Imp., 19, 1051, https://doi.org/10.1039/c7em00168a, 2017.
Watson, J. G., Chow, J. C., Chen, L. W. A., Engling, G., and Wang, X. L.: Airborne Particulate Matter: Sources, Aymospheric Processes and Health, chap. 3, source apportionment: principles and methods, Royal Society of Chemistry, 72–119, 2016.
WHO (World Health Organization): Air Quality Guidelines for Europe, 2nd edn., Copenhagen, WHO, Regional Office for Europe (Copenhagen), chap. 5, 92–94, available at: http://www.euro.who.int/__data/assets/pdf_file/0005/74732/E71922.pdf (last access: 1 July 2020), 2000.
WHO (World Health Organization): outdoor air pollution, IARC Monographs on the Evaluation of Carcinogenic Risks to Humans, International Agency for Research on Cancer, Lyon, France, 109 pp., 2016.
World Health Organisation: Environmental Health Criteria 229: Nitrogenated Polycyclic Aromatic Hydrocarbons, WHO, Geneva, 2003.
Wu, Y., Yang, L., Zheng, X., Zhang, S., Song, S., Li, J., and Hao, J.: Characterization and source apportionment of particulate PAHs in the roadside environment in Beijing, Sci. Total Environ., 470–471, 76–83, https://doi.org/10.1016/j.scitotenv.2013.09.066, 2014.
Zhang, J., Yang, L., Mellouki, A., Chen, J., Chen, X., Gao, Y., Jiang, P., Li, Y., Yu, H., and Wang, W.: Atmospheric PAHs, NPAHs, and OPAHs at an urban, mountainous, and marine sites in Northern China: Molecular composition, sources, and ageing, Atmos. Environ., 173, 256–264, https://doi.org/10.1016/j.atmosenv.2017.11.002, 2018.
Zhang, L., Morisaki, H., Wei, Y., Li, Z., Yang, L., Zhou, Q., Zhang, X., Xing, W., Hu, M., Shima, M., Toriba, A., Hayakawa, K., and Tang, N.: PM2.5-bound polycyclic aromatic hydrocarbons and nitro-polycyclic aromatic hydrocarbons inside and outside a primary school classroom in Beijing: Concentration, composition, and inhalation cancer risk, Sci. Total Environ., 705, 135840, https://doi.org/10.1016/j.scitotenv.2019.135840, 2020.
Zhao, T., Yang, L., Huang, Q., Zhang, Y., Bie, S., Li, J., Zhang, W., Duan, S., Gao, H., and Wang, W.: PM2.5-bound polycyclic aromatic hydrocarbons (PAHs) and their derivatives (nitrated-PAHs and oxygenated-PAHs) in a road tunnel located in Qingdao, China: Characteristics, sources and emission factors, Sci. Total Environ., 720, 137521, https://doi.org/10.1016/j.scitotenv.2020.137521, 2020.
Zheng, X., Wu, Y., Zhang, S., Hu, J., Zhang, K. M., Li, Z., He, L., and Hao, J.: Characterizing particulate polycyclic aromatic hydrocarbon emissions from diesel vehicles using a portable emissions measurement system, Sci. Rep., 7, 10058, https://doi.org/10.1038/s41598-017-09822-w, 2017.