the Creative Commons Attribution 4.0 License.
the Creative Commons Attribution 4.0 License.
A new look at the environmental conditions favorable to secondary ice production
Ivan Heckman
Mengistu Wolde
Andrew S. Ackerman
Ann M. Fridlind
Luis A. Ladino
R. Paul Lawson
Jason Milbrandt
Earle Williams
This study attempts a new identification of mechanisms of secondary ice production (SIP) based on the observation of small faceted ice crystals (hexagonal plates or columns) with typical sizes smaller than 100 µm. Due to their young age, such small ice crystals can be used as tracers for identifying the conditions for SIP. Observations reported here were conducted in oceanic tropical mesoscale convective systems (MCSs) and midlatitude frontal clouds in the temperature range from 0 to −15 ∘C and heavily seeded by aged ice particles. It was found that in both MCSs and frontal clouds, SIP was observed right above the melting layer and extended to higher altitudes with colder temperatures. The roles of six possible mechanisms to generate the SIP particles are assessed using additional observations. In most observed SIP cases, small secondary ice particles spatially correlated with liquid-phase, vertical updrafts and aged rimed ice particles. However, in many cases, neither graupel nor liquid drops were observed in the SIP regions, and therefore, the conditions for an active Hallett–Mossop process were not met. In many cases, large concentrations of small pristine ice particles were observed right above the melting layer, starting at temperatures as warm as −0.5 ∘C. It is proposed that the initiation of SIP above the melting layer is stimulated by the recirculation of large liquid drops through the melting layer with convective turbulent updrafts. After re-entering a supercooled environment above the melting layer, they impact with aged ice, freeze, and shatter. The size of the splinters generated during SIP was estimated as 10 µm or less. A principal conclusion of this work is that only the freezing-drop-shattering mechanism could be clearly supported by the airborne in situ observations.
- Article
(36160 KB) - Full-text XML
- BibTeX
- EndNote
Secondary ice production (SIP) has long been acknowledged as a fundamental cloud microphysical process (e.g., Cantrell and Heymsfield, 2005; Field et al., 2017). Along with the other leading processes in cold clouds, such as primary ice formation via activation of ice nucleating particles (INPs), particle vapor growth, aggregation, riming, and sedimentation, SIP is likely to commonly play a critical role in the formation of size distributions and habits of ice particles (e.g., Ackerman et al., 2015; Ladino et al., 2017). Through the modulation of ice particle concentration, SIP can thereby impact precipitation formation, rate of glaciation of mixed-phase clouds, the longevity of ice clouds, cloud electrification, and radiative properties of clouds. On the global scale, SIP may significantly impact the hydrological cycle and climate in general. However, the commonality and precise mechanisms of SIP have remained persistently poorly established. Understanding of mechanisms of SIP is of great importance for developing a parameterization of the ice initiation processes in weather prediction and climate models.
The significance of SIP was recognized only after the beginning of regular airborne studies of cloud microstructure in different geographical regions (e.g., Koenig, 1963, 1965; Hobbs, 1969; Mossop, 1970, 1985; Mossop et al., 1972; Ono, 1972; Hallett et al., 1978; Hobbs and Rangno, 1985, 1990; Beard, 1992; and many others). A systematically observed difference of up to 5 orders of magnitude between concentrations of INPs and measured ice concentration urged provision of an explanation of the physical processes underlying this discrepancy. One of the explanations suggested an enhancement of the concentration of ice particles via a mechanism unrelated to the primary ice formation. Several possible mechanisms were proposed to explain such so-called secondary production of ice crystals.
Historically, the first proposed mechanism to explain SIP focused on droplet fragmentation during freezing (e.g., Langham and Mason, 1958; Mason and Maybank, 1960; Kachurin and Bekryaev, 1960). During the freezing of a cloud droplet, isolated pockets of liquid water may become trapped inside an ice shell. The expansion of water during subsequent freezing results in an increase of pressure inside the ice shell. If the pressure exceeds a critical point, then the ice shell may break into fragments to relieve the internal pressure. Newly formed ice fragments may serve as INPs and result in an enhancement of ice concentration.
Subsequent laboratory studies demonstrated that fragmentation of freezing drops depends on many factors such as droplet temperature before freezing, environmental temperature, droplet size, concentration of CO2 and other gases dissolved in water, the crystalline nature of the ice shell (i.e., monocrystalline or polycrystalline), drop rotation during freezing, and the type of INPs employed for droplet freezing and the manner of droplet suspension in the laboratory (Muchnik and Rudko, 1961; Evans and Hutchinson, 1963; Stott and Hutchinson, 1965; Dye and Hobbs, 1966, 1968; Johnson and Hallett, 1968; Brownscombe and Thorndike, 1968; Hobbs and Alkezweeny, 1968; Takahashi and Yamashita, 1969, 1970; Pitter and Pruppacher, 1973; Takahashi, 1975, 1976; Wildeman et al., 2017; Lauber et al., 2018). A review of the laboratory studies of droplet freezing showed a large diversity of reported results, and conditions required for droplet shattering during freezing remain not well understood.
Splintering during ice particle riming is another mechanism that can potentially explain apparent SIP (Macklin, 1960; Latham and Mason, 1961). Hallett and Mossop (1974) and Mossop and Hallett (1974) observed splinter formation during riming in a cloud chamber with liquid water content of ∼1 g m−3 and droplet concentration 500 cm−3. They found that splinter production is active in the air temperature range from −3 to −8 ∘C, and its rate has a pronounced maximum at an air temperature of −5 ∘C and drop impact velocity of 2.5 m s−1. At these conditions, one splinter was produced per 250 droplets of diameter D>24 µm. The phenomenon of splinter production during riming is usually referred to as the Hallett–Mossop (HM) mechanism. Several studies have aimed at understanding the physical mechanism responsible for the splinter production (e.g., Choularton et al., 1978, 1980; Emersic and Connolly, 2017). However, despite these efforts, the physical mechanism underlying this phenomenon is still under debate.
The collision of ice particles may result in their mechanical fragmentation and the production of secondary ice. This hypothesis was stimulated by observations of ice particle fragments collected during airborne studies (e.g., Hobbs and Farber, 1972; Takahashi, 1993) and ground-based ones (Jiusto and Weickmann, 1973). Collisional fragmentation of ice particles was explored in the laboratory by Vardiman (1978) and Takahashi et al. (1995). However, the obtained results do not allow an unambiguous conclusion about ice–ice collisional fragmentation and its contribution to SIP.
When an ice crystal collides with a supercooled drop, it will experience thermal shock due to the release of latent heat of the freezing drop. This will cause a differential expansion of the ice crystal and may result in its fragmentation. This phenomenon was observed during laboratory studies by Dye and Hobbs (1968) and Hobbs and Farber (1972). Due to the current lack of laboratory studies, the efficiency of ice particle fragmentation due to thermal shock and its effect on SIP remains inconclusive.
Ice particle fragmentation and formation of secondary ice may occur during sublimation in subsaturated areas near cloud edges or underneath the cloud base. The phenomenon of fragmentation during sublimation was studied by Oraltay and Hallett (1989), Dong et al. (1994), and Bacon et al. (1998). However, it remains unclear whether small fragments formed in the subsaturated environment can re-enter supersaturated cloud and act as SIP particles. This appears to be a significant limitation on the efficacy of sublimation breakup as a SIP mechanism.
Gagin (1972) proposed a mechanism for SIP due to the activation of INPs in high-transient-supersaturation areas around freezing drops. After nucleation, the freezing drop temperature rises to 0 ∘C. If the surrounding air is colder than 0 ∘C, the surface of the freezing drop acts as a source of water vapor to a colder environment. The resulting water vapor diffuses radially outward. Depending on the air humidity, it may create at some distance from the droplet a region with supersaturated air. Rosinski et al. (1975) and Gagin and Nozyce (1984) studied nucleation of INPs around suspended freezing drops with 1–2 mm diameter. However, simply due to limited laboratory studies, the effect of INP activation around freezing drops on SIP remains insufficiently quantified.
The hypothesis that ice concentration measurements are subject to artifacts induced by airborne instruments has been discussed over a long period of time. Larger ice particles may bounce off a forward probe's tips or inlet and shatter into smaller fragments. After rebounding, the shattered fragments may travel into the sample area and cause multiple artificial counts of small ice (e.g., Gardiner and Hallett, 1985; Gayet et al., 1996; Heymsfield, 2007; McFarquhar et al., 2007; Jensen et al., 2009; Field et al., 2003). The following introduction of antishattering K tips (A. V. Korolev et al., 2013) along with the interarrival time algorithm (Field et al., 2006) allowed for a significant mitigation of the effect of shattering and an improvement in the ice particle measurements. As was shown by Korolev et al. (2011), A. Korolev et al. (2013), and Lawson (2011), a measured concentration of ice particles smaller than 200 µm can be enhanced due to the shattering effect by up to 2 orders of magnitude.
The latter finding brings up a question that some early airborne studies that pointed out the discrepancy between concentrations of ice particles and INPs might be contaminated by shattering artifacts, which resulted in an enhancement of the measured concentration of small ice. However, numerous recent in situ measurements, which applied the antishattering techniques, are in general consistent with the early SIP observations, and they also showed that in many clouds, ice particle concentrations are still much higher than the INP concentration (e.g., Crosier et al., 2011, 2014; Crawford et al., 2012; Stith et al., 2014; R. P. Lawson et al., 2015; P. Lawson et al., 2017; Lloyd et al., 2015; Lasher-Trapp et al., 2016; Keppas et al., 2017; Ladino et al., 2017; and others).
Another source of artifacts in measurements of high concentration of ice by optical array probes (OAPs) is related to fragmentation of particle images when particles pass through the sample volume close to the edge of the depth of field (DoF) (Korolev, 2007a). A few 1- to 2-pixel images resulting from fragmentation of large out-of-focus images have an enhanced artificial contribution to particle concentration due to their very small sample volumes. This problem is recognized by many research groups. One solution to this is the exclusion of the first two or three size bins compromised by the ambiguity of the DoF definition and contamination by image fragments. Due to the extent that particles from the first two or three size bins (<30–80 µm depending on the OAP type) may significantly contribute to the total ice concentration, a limitation is imposed on the measurements of total concentration of ice particles in SIP cloud regions.
Most observations of an enhanced concentration of ice particles have been attributed to the HM process. The list of these studies extends over 30 publications, so we name only a few of them here (e.g., Ono, 1971, 1972; Harris-Hobbs and Cooper, 1987; Bower et al., 1996; and others). In these studies, the conclusions about the HM process were obtained based on the observed association with graupel and columnar ice crystals. Fewer studies attributed observations of high ice concentration to drop shattering (e.g., Koenig 1963, 1965; Braham, 1964; Rangno, 2008; Lawson et al., 2017). Ice–ice collisional fragmentation was identified as a source of SIP in natural clouds by Hobbs and Farber (1972), Takahashi (1993), and Schwarzenboeck et al. (2009). As can be seen, the identification of SIP gravitates towards the HM process, whereas mechanisms such as activation of INPs in transient supersaturation around freezing drops, ice fragmentation due to thermal shock, or sublimation were not even considered. In this regard, the question that arises is as follows: could these observations reflect an actual occurrence of different types of SIP?
The present study is focused on revisiting the role of different SIP mechanisms and identifying conditions favorable for SIP. Cloud regions with ongoing ice multiplication were identified with the help of a new technique based on the identification of small faceted ice crystals smaller than 60–100 µm measured by a cloud particle imager (CPI). The newly developed technique was applied to the data set collected in mature tropical mesoscale convective systems (MCSs) and in midlatitude frontal clouds. The roles of six possible mechanisms to generate the SIP particles are assessed using additional observations: fragmentation of freezing drops, splintering during the HM process, ice–ice collisional breakup, ice fragmentation during thermal shock, fragmentation during ice sublimation, and INP nucleation in transient supersaturation. The variety of environmental conditions associated with SIP will be considered based on six specific cases that sampled tropical MCSs (four cases) and midlatitude frontal clouds (two cases).
Measurements were conducted from the National Research Council (NRC) Convair 580 research aircraft during two field campaigns: High Ice Water Content (HIWC) and the Buffalo Area Icing and Radar Study 2/Weather Radar Validation Experiment (BAIRS2/WERVEX).
The HIWC flight operations were conducted out of Cayenne (French Guiana) in May 2015. A total of 14 Convair 580 research flights were conducted in the frame of the HIWC campaign with the average flight endurance of approximately 4 h. Most of the flights were performed in oceanic MCSs in altitudes ranging from 6500 to 7200 m and temperatures from 0 to −15 ∘C. The observations of MCSs were performed during their mature stages, when the area of clouds with longwave brightness temperatures colder than −50 ∘C from GOES-13 approached or surpassed its maximum. At that stage, most of the volume of the MCS above the freezing level was nearly glaciated, with embedded mixed-phase regions mainly associated with vertical updrafts (Korolev et al., 2018). However, the studied MCS during the observations remained dynamically active, with updrafts peaking at 15–20 m s−1.
The BAIRS2/WERVEX flight operations were conducted over southern Ontario and upstate New York from January to March 2017. A total of five research flights were conducted in precipitating frontal cloud systems. In the framework of this study, the analysis will be focused on two flights performed on 7 February and 24 March 2017 in the range of altitudes from 1500 to 3000 m and temperature ranges from +5 to −10 ∘C.
The NRC Convair 580 was equipped with state-of-the-art cloud microphysical and thermodynamic instrumentation. Size distributions of aerosol particles were measured by a DMT Ultra-High Sensitivity Aerosol Spectrometer (UHSAS) (Cai et al., 2008). Measurements of ice particle number concentration and ice water content (IWC) were extracted from composite particle size distributions measured by optical array 2-D imaging probes (OAPs), a PMS 2DC (Knollenberg, 1981), a SPEC two-dimensional stereo (2DS; Lawson et al., 2006), and a DMT precipitation imaging probe (PIP; Baumgardner et al., 2001). Cloud droplet size distributions were measured by a PMS forward scattering spectrometer probe (FSSP; Knollenberg, 1981) and a DMT cloud droplet probe (CDP; Lance et al., 2010). Cloud particle images were measured with the SPEC CPI (Lawson et al., 2001). Bulk liquid water content (LWC) and total water content (TWC) were measured with a SkyPhysTech Nevzorov probe (Korolev et al., 1998) and a SEA isokinetic probe (IKP) (Davison et al., 2011). A Rosemount icing detector was used for detection of liquid water at ∘C (Mazin et al., 2001). The extinction coefficient was measured with the ECCC cloud extinction probe (Korolev et al., 2014). Vertical velocity was measured by Rosemount 858 (Williams and Marcotte, 2000) and Aventech AIMMS20 (Beswick et al., 2008). The Convair 580 was also equipped with NRC airborne W-band and X-band radars (NAWX) with Doppler capability (Wolde and Pazmany, 2005). The UHSAS and IKP were employed only during the HIWC project and were not used during BAIRS2/WERVEX.
In order to mitigate the effect of shattering artifacts on ice particle measurements (Korolev et al., 2011), all cloud particle probes were equipped with anti-shattering K tips (A. Korolev et al., 2013). The remaining shattering artifacts were filtered out during data post-processing with the help of the modified interarrival time algorithm (Korolev and Field, 2015).
The collected cloud microphysical data were processed with the help of the ECCC D2G software. This software allowed composite visualization and analysis of cloud microphysical, thermodynamic, radar, and aircraft data probes.
3.1 Basic assumptions
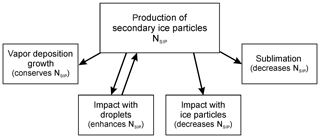
If initiation of secondary ice occurs in a supersaturated environment, then the newly formed ice particles start growing through water vapor diffusion, and some fraction of secondary ice particles may turn into faceted ice crystals. If the growth time is shorter than certain typical time τcorr, then these faceted ice crystals may still be associated with the environment of their origin. At a timescale of t>τcorr, the size and shape of ice crystals may undergo significant metamorphosis, and secondary ice particles may lose their spatial correlation with the environment of their origin due to horizontal and/or vertical advection and turbulent diffusion. This process is schematically shown in Fig. 1.
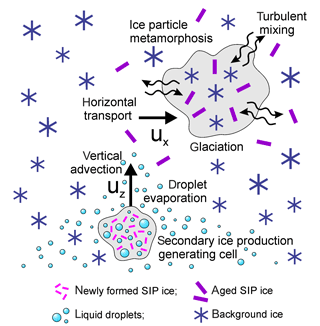
Figure 1Conceptual diagram of the transport of secondary ice production particles in a cloud after its formation.
This concept was used to develop a method for the identification of SIP regions. This method is based on the following approximations:
- 1.
Small faceted ice crystals (hexagonal plates or columns) originate from secondary ice production.
- 2.
During some time τcorr, the newly formed ice crystals remain associated with the environment where they originated.
If these approximations are valid, then small pristine ice crystals can be used as tracers of the environmental conditions favorable to SIP. The following subsections aim to assess τcorr and the typical size of small faceted ice crystals.
3.2 Ice crystal habits
In order for an ice crystal to grow as a hexagonal prism, its growth begins as a monocrystalline ice particle.
As discussed in the introduction, most potential SIP mechanisms are related to the fragmentation of existing ice particles. Since water drops frozen at ∘C tend to be monocrystalline (e.g., Pitter and Pruppacher, 1973; Hallett, 1964), their fragments will also be monocrystalline. In addition, if a large ice particle is polycrystalline, the probability of its small fragment to be monocrystalline remains high. Therefore, the condition of monocrystallinity is expected to be satisfied for most small ice fragments with Lmax<40–50 µm. Formation of ice fragments with typical sizes down to 20 µm is supported by video material of the breakup of freezing drops from Wildeman et al. (2017) and Lauber et al. (2018).
3.3 Assessment of spatial correlation time
Condition (2) in Sect. 3.1 requires assessment of a typical time (τcorr) such that for time t<τcorr, the changes of cloud environment parameters (e.g., air temperature, Ta; humidity, RH; ice particle concentration, Ni; droplet concentration, Nd; LWC; IWC) are insignificant, and the SIP-generated ice particles remain within this environment.
In order to assess τcorr, the main typical timescales of cloud dynamics and kinetics, such as the time of phase relaxation τp, glaciation time τgl, turbulent diffusion time τt, vertical advection time τv, and particle residence time τr, have to be estimated.
The timescale τp characterizes the response of the cloud environment to changes of in-cloud humidity (e.g., due to entrainment, vertical motion, interaction between liquid and ice phases). So, in order for RH to relax to its steady-state value, it is required that
For mixed-phase clouds, after neglecting the effect of the vertical velocity, τp can be written as (Korolev and Mazin, 2003)
where is the time of phase relaxation in the ice clouds, is the time of phase relaxation in liquid clouds, Ni, Nl, , are the concentrations and average radii of ice particles and liquid droplets, and ai, al are coefficients dependent on pressure P and temperature Ta.
The glaciation timescale characterizes the transit time of the mixed-phase cloud into an all-ice cloud due the Wegener–Bergeron–Findeisen (WBF) process (Wegener, 1911; Bergeron, 1935). This process results in complete evaporation of liquid droplets () and changes of steady-state relative humidity ().
Therefore, it is required that
The glaciation timescale can be estimated as (Korolev and Mazin, 2003)
where Si is the supersaturation over ice at saturation over water; Wl0, Wi0 are the initial liquid and ice water content, respectively; Ni is the concentration of ice particles; b(Ta,P) P and Ta.
Turbulent mixing results in a spatial transport of the SIP particles and a decrease in their concentration. Turbulent mixing may result in biases in the assessment of the spatial scales of the SIP regions and the concentration of the SIP particles. Therefore, τcorr should relate to the turbulent mixing time as
The typical time of turbulent mixing of a cloud parcel with a spatial scale L can be estimated as (e.g., Landau and Lifshitz, 1987)
where ε is the turbulent energy dissipation rate.
Vertical transport of a cloud parcel affects Ta and RH. Assuming an adiabatic temperature change ΔT, the typical time of vertical transport can be written as
where uz is the vertical velocity, and γw is the moist adiabatic lapse rate. So, in order to limit the amplitude of Ta and RH, τcorr and τv should relate as
Residence time of an ice particle is determined by the fall velocity uice and cloud parcel size L and is equal to
In order for the ice particle to remain in the cloud volume, it is required that
Summarizing Eqs. (1), (3), (5), (8), and (10) yields the condition for τcorr:
Typical values of τp, τgl, τt, τv, τres will be assessed for the following conditions: ∘C, P=700 mbar, Ni=200 L−1, Nd=100 cm−3, µm, µm, L=200–300 m, ε=102 m2 s−3, uz=1–4 m s−1, temperature change limit |ΔT|<2 ∘C, vertical fall velocity of a solid column with Lmax=100 µm, and uice=0.1 m s−1.
Substituting Ta, P, L, ε, Nd, Ni, , , ΔT, uice in Eqs. (2), (4), (6), (7), (9) yields τp≈5 s, τgl≈320 s, τt≈160 s, τv≈80 s, τres≈2000 s. It should be noted that τp, τgl, τt, τv are sensitive to the above parameters and may be different from the obtained estimates. However, the above assessment provides the magnitude of the typical times for SIP cloud regions. Based on the above estimates, it would be reasonable to assume that τcorr should not exceed 60–120 s.
3.4 Assessment of ice particle sizes
The estimate of τcorr allows for the assessment of ice particle sizes that they may grow up to during this time. Since SIP is expected to occur in liquid or mixed-phase clouds, then the water vapor humidity will be close to saturation over water (Korolev and Isaac, 2006).
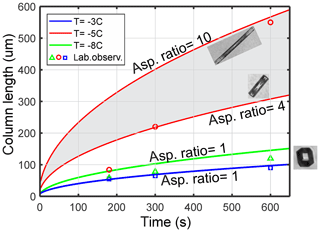
Figure 2 shows the calculated length of columns, which were grown by water vapor deposition at saturation over liquid water at different temperatures. The results of the calculations are in good agreement with the laboratory studies of ice growth in Fukuta and Takahashi (1999). As shown in Fig. 2, during τcorr, the length of hexagonal columns Lmax may reach 50 to 150 µm depending on the temperature and the aspect ratio (). Based on this assessment, for the following identification of SIP, the size of small faceted crystals will be limited by Lmax<100 µm.
3.5 Identification of SIP particles
Acquisition of small ice particles images was conducted with the help of the SPEC CPI (Lawson et al., 2001). The CPI was designed for recording 256 grey-level images of ice particles with 2.3 µm resolution at a rate of up to approximately 500 images per second. Even though the acquisition rate of particle images is lower than that for 2-D-imaging optical array probes, the CPI provides crisp, high-resolution photographic-quality images of small ice particles. This feature is critical for the goals of this study. Binary OAP images (e.g., SPEC 2DS, PMS 2DC) have lower pixel resolution (from 10 to 25 µm), and their appearance may be significantly modified by diffraction effects (e.g., Korolev, 2007a; Vaillant de Guélis et al., 2019).
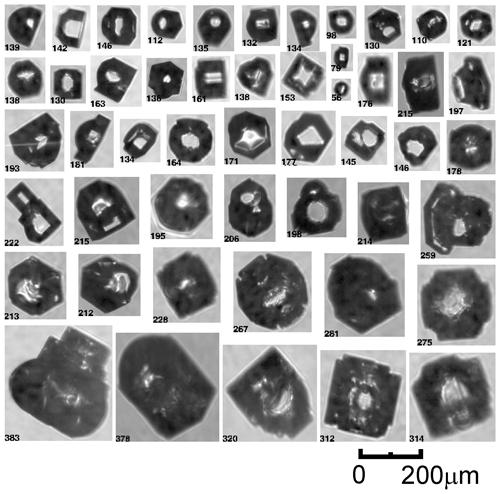
Identification of small pristine ice particles from the CPI imagery was performed with the help of a pre-trained convolutional neural network (Krizhevsky et al., 2017) fine-tuned for the identification of small hexagonal faceted ice crystals. The habit of faceted ice particles was limited to hexagonal prism-type crystals: columns, short columns, and plates. Examples of CPI images that were used in the final tuning are presented in Fig. 3a.
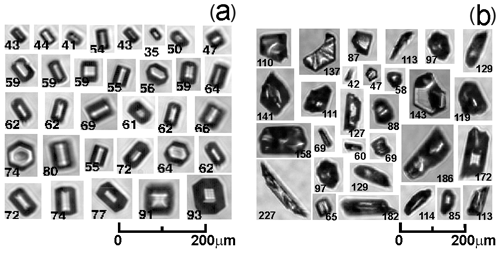
Figure 3(a) Examples of CPI images used for neural net training to identify small faceted ice crystals. These ice crystals were collected in the mesoscale convective clouds at altitudes m and temperature range of . (b) Examples of images misidentified by the image recognition software as pristine faceted ice. The numbers below each image frame indicate maximum size of the images in µm.
Validation, based on hand-labeled images held out from training (950 from each of the three categories), showed that only 4 % were misclassified. Although the occurrence of small faceted ice crystals was rare, since they also tended to appear in clusters, a clear signal of their occurrence could be seen above noise from false positives.
Examples of images of small ice particles falsely identified as pristine faceted ice are shown in Fig. 3b. As it is seen from Fig. 3b, the centers of growth of the ice crystals are absent in the images. From a crystallographic viewpoint, such crystals cannot be formed during vapor deposition growth, and they are most likely the result of breakups after impact with the CPI inlet (Appendix A). Such particles were excluded from the analysis as described in Appendix A.
It is worth noting that some or similar images with irregular shapes as in Fig. 3b could be a result of SIP and therefore have a natural origin. Thus, fragments of droplets shattered during freezing may appear as irregularly shaped ice before they develop facets. So, the assessment of the concentration of the SIP particles based on the estimates of the concentration of small faceted ice particles can be considered as a lower limit.
In this study, the sizes of particle images are estimated from the maximum size of the image measured in all possible directions (Lmax). Note that, for randomly oriented hexagonal thin plates, Lmax provides an estimate of the diameter of the prism base (a) with accuracy better than 15 %. For hexagonal columns, Lmax is not representative of the prism height h, and depending on the column orientation, it can be either Lmax>h or Lmax<h.
Due to the uncertainty of the CPI sample area definition affected by the settings of acceptance of out-of-focus images during sampling and post-processing, we will be using counting rate (s−1) of small faceted ice particles to characterize their concentration. The assessment of the concentration of faceted ice provided in the foregoing discussion was done based on the comparisons of the CPI counting rate of droplets with D>40 µm and that measured by 2DS. After identification of the scaling coefficient for the conversion of the CPI droplet rate into concentration, this coefficient was applied to the counting rate of small hexagonal crystals. This procedure is based on the approximation that the droplets and ice crystals <Lmax are in the same size range and their CPI sample volumes are approximately the same. The accuracy of such estimation of the concentration of small ice particles is estimated as ±50 %.
4.1 SIP observations in tropical MCSs
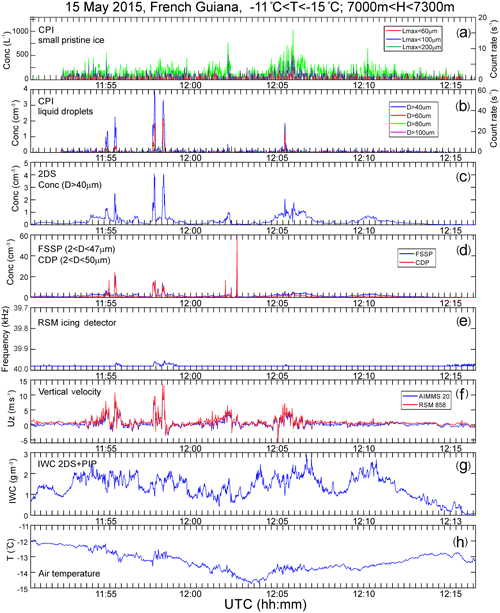
In this section, we present the observations of SIP during the Convair 580 flight in a tropical MCS on 15 May 2015. The MCS was located off the shore of French Guiana with its center approximately 350 km northeast of Cayenne. Figure 4 shows two GOES-13 infrared images of the MCS with an overlay of Convair 580 flight tracks. During the flight leg in Fig. 4a (09:23–10:22 UTC), the altitude varied between 5600 and 5700 m with the air temperature ranging from −4 to −6 ∘C. As it is seen in Fig. 4a, the Convair 580 crossed three convective cells with the cloud-top brightness temperatures ranging between approximately −55 and −65 ∘C (marked by dashed circles). The flight leg in Fig. 4b (11:23–12:07 UTC) was performed at altitudes ranging from 7000 to 7300 m and temperatures from −11 to −15 ∘C. Despite its decaying stage, the MCS remained dynamically active at the Convair 580 flight level. As will be discussed below, it was found that SIP was observed in convective cloud regions indicated by circles in Fig. 4a, b.
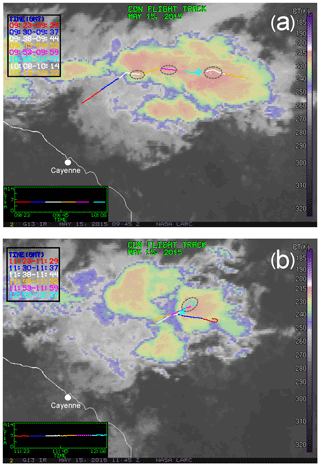
Figure 4GOES-13 infrared image of the MCS with the Convair 580 track (courtesy of Pat Minnis) corresponding to time segments shown in Figs. 5 and 8. Circles indicate the cloud regions along the flight track where SIP was identified (see Fig. 5). The marked regions also coincide with convective cloud regions (see text).
Figure 5 presents a time series of cloud microphysical parameters corresponding to the flight leg in Fig. 4a. The top panel (Fig. 5a) shows the CPI counting rate of small faceted ice crystals with Lmax<60 and 100 µm. Grey vertical strips indicate cloud sections identified as SIP regions. In this cloud segment, the concentration of small pristine ice with Lmax<100 µm attains values up to Npr100≈500 L−1. Based on the discussion in Sect. 3, the origin of these small pristine ice crystals is attributed to the vicinity of the level of their observation.
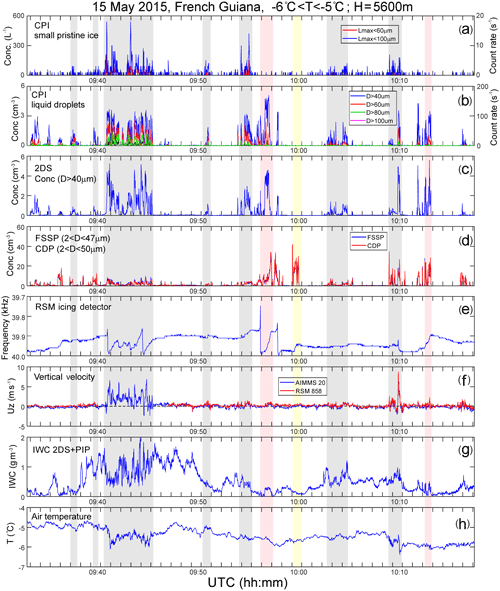
Figure 5Time series of microphysical parameters collected in oceanic MCS offshore French Guiana on 15 May 2015. (a) CPI count rate of small pristine ice with Lmax<60 and 100 µm; (b) CPI count rate of cloud droplets with D>40, 60, 80, and 100 µm; (c) concentration of cloud particles D>40 µm measured by 2DS; (d) concentration of cloud droplets measured by FSSP and CDP; (e) Rosemount icing detector frequency; (f) vertical velocity measured by AIMMS20 and Doppler velocity calculated from W-band radar; (g) IWC calculated from 2DS and PIP; (h) air temperature. Grey strips indicate cloud regions with enhanced concentration of small faceted ice particles; red and yellow strips indicate regions where ice and liquid were present, but no SIP was observed (see text). The altitude of measurements varied between 5600 and 5700 m.
After including aged pristine ice crystals with Lmax<200 µm, the concentration of faceted ice crystals reached Npr200≈900 L−1. As was shown in Ladino et al. (2017), the estimated INP concentration remained nearly constant during the flight operations in French Guiana, and for the temperature range of it was approximately L−1. So, the estimated NINP is nearly 4–5 orders of magnitude lower than the concentration of small pristine ice particles Npr100 and Npr200. Therefore, the observed small ice particles cannot be explained by heterogeneous ice nucleation, and the most likely pathway of their formation is SIP.
To address the question regarding conditions favorable for SIP, we explore the correlations of different microphysical parameters. As seen from Table 1, the ice particle concentration has the highest correlation coefficient with droplets D>60–80 µm. In many apparent SIP regions, droplets over 300 µm in diameter were registered by the CPI. However, in some cloud regions with D>60 µm, small faceted ice was not observed. Such cloud regions in Fig. 5 are indicated by pink strips.
Table 1Correlation coefficient between droplet concentration in different size ranges and concentration of small faceted ice crystals with Lmax<100 µm for the cloud segment in Fig. 5 for 30 and 60 s averaging.

The analysis of the entire HIWC data set showed that, as a rule, SIP was not observed or was very unproductive in supercooled liquid clouds with droplets Dmax<40 µm. One such case in Fig. 5 is indicated by a yellow strip. In this specific cloud region, the maximum size of droplets measured by FSSP and CDP did not exceed Dmax=30 µm.
Comparing Fig. 5a, f also indicates that intense SIP was observed in cloud regions with enhanced turbulence or vertical updrafts. Yet, in the regions on the left side of Fig. 5a (09:33–09:38 UTC), SIP was observed in the absence of any significant turbulence or updraft (uz<0.2 m s−1).
4.1.1 Case 1
Figure 6 shows CPI images of cloud particles from a 5 s cloud segment (09:40:33–09:40:38 UTC) in Fig. 5. This cloud segment is characterized by an enhanced concentration of small faceted ice particles (Lmax<100 µm) estimated as approximately Npr100≈450 L−1. The majority of the CPI images of droplets are larger than 40 µm diameter with drizzle size drops up to 200 µm (Fig. 6a). The droplet concentration measured by FSSP and CDP is quite low and varies from 2 to 6 cm−3, whereas the concentration of droplets with D>40 µm assessed from the CPI and 2DS data varies between 1 and 3 cm−3.
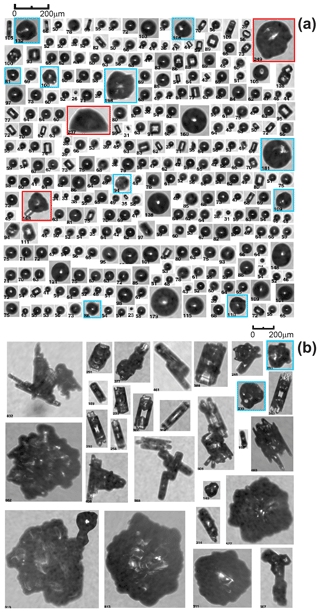
Figure 6Spatial sequence of CPI images of (a) droplets and faceted ice crystals and (b) aged large ice particles. (a) Blue frames indicate frozen droplets with modified shapes, and red frames indicate fragments of shattered frozen drops. Numbers under each image indicate their maximum sizes (Lmax). Cloud particles in panels (a, b) are spatially mixed, and they were split between two panels because of their difference in size. The images were sampled at ∘C and H=5650 m during 09:40:42–09:40:47 UTC on 15 May 2015 during measurements shown in Fig. 5.
Some of the droplets, identified as frozen and indicated in Fig. 6a by blue frames, have distorted shapes and bulges. As documented by Lauber et al. (2018) the formation of bulges may be accompanied by bubble bursting or jetting, which may be a primary source of SIP particles. A few other droplets in the red frames appear as fragments of shattered droplets. Altogether, the presence of droplet fragments and frozen droplets with bulges is supportive of SIP from shattering of freezing drops.
The concentration of frozen drops in Fig. 6a is estimated as Nfrd∼6 L−1. This concentration is still much higher than the concentration of INPs ( L−1) at ∘C (Ladino et al., 2017), and therefore, droplet freezing cannot be explained by heterogeneous nucleation on INPs alone. This gap serves as a basis for explaining droplet freezing due to impact with splinters produced by shattered freezing drops.
It is worth noting that the actual concentration of frozen droplets in Fig. 6a may be higher than the estimate Nfrd, since some drops may freeze without deformation, and after complete freezing, they may become transparent again and appear as liquid drops (e.g., Mason and Maybank, 1960). The phase state of such drops cannot be unambiguously identified and, in the frame of this study, is considered to be liquid.
Figure 6b shows images of aged ice particles sampled in the same cloud volume as the newly generated SIP ice particles in Fig 6a. The aged ice particles come in two distinct types: faceted columns with Lmax<400 µm and graupel with Lmax<1000 µm. The presence of graupel is a necessary condition for the HM process (Hallett and Mossop, 1974). However, visual analysis of graupel images (Fig. 6b) shows that their surfaces appear smooth without small-scale features. This appearance suggests that liquid droplets spread over the graupel's surface and freeze as a film. The way in which the droplets spread is determined primarily by the droplet's size and air temperature (Macklin and Payne, 1969; Dong and Hallett, 1989).
The surface of graupel in Fig. 6b appears different than the surfaces of rimed ice cylinders in lab experiments on secondary ice production (Macklin, 1960; Choularton et al., 1978, 1980; Emersic and Connolly, 2017). The surfaces of the rimed ice cylinders were highly inhomogeneous with distinct images of frozen droplets and small features down to 10 µm, which presumably serve as a source of splintering. Comparing these observations with laboratory studies poses a question regarding whether graupel without small-scale features, as in Fig. 6b, could produce splinters.
Another condition for the HM process is the presence of droplets smaller than 12 µm (Mossop, 1978, 1985). For the case in Fig. 6b, the concentration of droplets with D<15 µm is estimated from the CDP and FSSP data to be 0.5 to 1 cm−3. The probability of graupel collision with droplets at such a small concentration is likely too low to have any significant effect on the HM process.
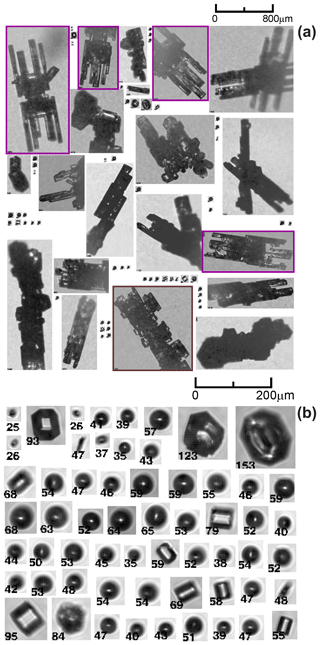
Figure 7(a) Spatial sequence of CPI images; (b) subset of droplets and faceted ice crystals from panel (a). Numbers under each image indicate their maximum sizes (Lmax). The images were sampled at ∘C and H=5620 m during 09:46:36–09:46:39 UTC on 15 May 2015 during measurements shown in Fig. 5. (a) Purple frames indicate images of ice particles with evidence for their vertical circulation in the storm.
4.1.2 Case 2
Figure 7a shows another 5 s segment with successive cloud particle images measured by the CPI in another SIP region (09:46:39–09:46:44 UTC). Enlarged cloud droplets and SIP particles from Fig. 7a are shown in Fig. 7b. The concentration of SIP particles is estimated as 70 L−1, which is lower than that of the previous case. The concentration of droplets with D>40 µm is also lower, and it is estimated from the 2DS and CPI measurements as 0.2–0.3 cm−3. The droplet concentration with D<40 µm measured by FSSP and CDP is approximately 1 cm−3. However, due to the large concentration of ice in this cloud region, half of the FSSP- and CDP-measured concentration (∼0.5 cm−3) may be caused by shattering artifacts (A. V. Korolev et al., 2013). No droplets larger than 70 µm were observed in this cloud segment.
As seen from Fig. 7a, the background aged ice is represented by columnar-shaped particles with well-developed facets with minor riming. Some ice particles highlighted by purple frames have features of recirculation. These particles started their growth as columns at ; then, they were ascended to a plate growth condition (e.g., ) and turned into capped columns. Then, they were brought down by a downdraft or sedimented back to the columnar growth environment () and developed columns growing out of the plate edges.
What is important about the case in Fig. 7 is that no graupel, heavily rimed ice, or significant amount of liquid droplets were observed here. Therefore, the SIP in this specific cloud region formally does not meet the HM process criteria.
Figure 8 shows a time series of microphysical and state parameters in the same cloud area as in Fig. 5 but at a higher altitude () and lower temperature (). This locale offers the opportunity to consider the evolution of ice crystals initiated at lower levels and to explore the initiation of new ice in colder environments. Figure 8a shows that small faceted particles are spread horizontally over the entire cloud environment. The clustering of the small ice parties and their association with updrafts and liquid droplets is less pronounced than at the temperature level of −4 to −6 ∘C (Fig. 5). As follows from Fig. 8b–f, the liquid phase appears in horizontally narrow segments associated with vertical updraft regions. As discussed in Korolev (2007b), updrafts may extend the maintenance of the liquid phase in mixed-phase clouds or completely suppress the WBF process. The majority of the cloud segment in Fig. 8 is associated with high IWC peaking up to 3 g m−3 within an ice number concentration up to 1 cm−3. A liquid phase with no updraft in this kind of environment can exist only for a short time period. For example, a mixed-phase cloud with LWC∼0.1 g m−3 and uz=0 will be glaciated within 50 s at ∘C.
4.1.3 Case 3
Figure 9a presents a sequence of cloud particle images measured during a 10 s time interval (12:05:31–12:05:41 UTC) at ∘C and H=7250 m. The measurements were conducted within a moderate updraft (). As it is seen, aged ice particles are represented by graupel, a few lightly rimed particles, and numerous columns. The origin of columns is related to nucleation at lower levels (∼5300–5700 m) at temperatures corresponding to columnar growth ().
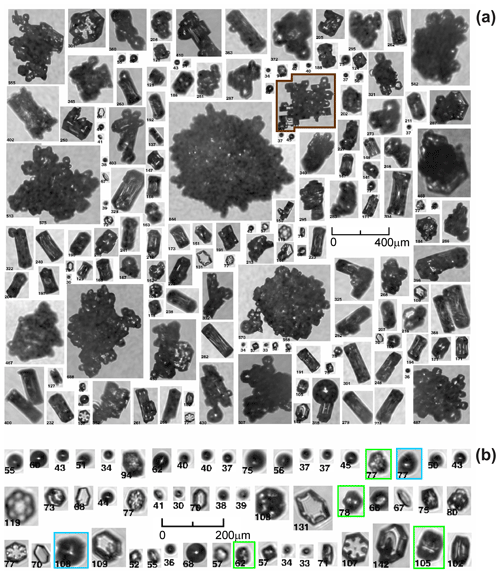
Figure 9(a) Spatial sequence of CPI images; (b) subset of droplets and faceted ice crystals from panel (a). (b) Blue frames indicate frozen droplets with modified shapes, and green frames indicate frozen drops with developed facets. Numbers under each image indicate their maximum sizes (Lmax). The images were sampled at ∘C and H=7200 m during 12:05:27–12:05:38 UTC on 15 May 2015 during measurements shown in Fig. 8.
Figure 9b shows a subset of zoomed-in images of droplets and small faceted ice particles extracted from Fig. 9a. The majority of the small faceted ice particles are hexagonal plates. According to Magono and Lee (1966), these types of plates are expected to form in the near-saturated-over-water air within the temperature range of . Hence, the origin and growth habit of the observed plates are consistent with the temperature range where they were sampled.
The concentration of droplets with D<40 µm is estimated from FSSP and CDP as less than 1 cm−3, and the concentration of droplets with D>40 µm is estimated from 2DS as ∼2 cm−3. Therefore, even though the ensemble of particles in Fig. 9 contains graupel, the rest of the parameters, such as temperature and concentration of small and large droplets, are well outside the envelope of conditions required for the HM process, as documented in the literature.
4.1.4 Case 4
Figure 10a shows another example of ice particles sampled approximately 1 km away from those shown in Fig. 9. This cloud region is characterized by the absence of a liquid phase. However, the concentration of small ice particles in Fig. 10 appears to be even higher than that of the small ice in Fig. 9, where liquid droplets were present. It is worth noting that, in most observational studies, the presence of liquid was considered as one of the necessary conditions for SIP. However, in this particular case, it can be argued that the absence of liquid droplets may be explained by their evaporation as a result of the WBF process just before the cloudy air arrived at the level of observation. The small ice plates in Fig. 10b could be formed at lower levels with temperatures when liquid droplets were still present in the parcel. After that, the plates ascended in the glaciated updraft to a higher level.
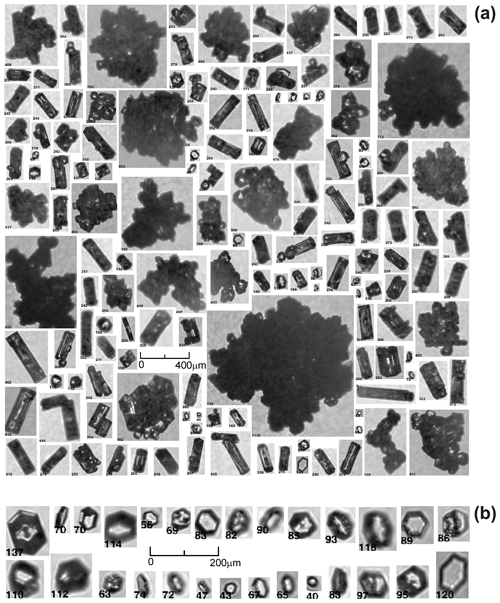
Figure 10(a) Spatial sequence of CPI images; (b) subset of droplets and faceted ice crystals from panel (a). Numbers under each image indicate their maximum sizes (Lmax). No liquid droplets were present in this cloud region. The images were sampled ∘C and H=7200 m during 12:05:47–12:05:53 UTC on 15 May 2015 during measurements shown in Fig. 8.
The variety of habits of small ice particles in Figs. 9 and 10 shows that SIP apparently occurred continuously during ascent through different levels, with temperatures ranging from −2 to −14 ∘C (at the level of observation).
Figure 11 shows a summary of the concentrations of small faceted ice crystals and droplets averaged over the entire Convair 580 HIWC data set. These data were collected in 10 tropical MCSs with a total sampling length of 9580 km within the temperature range of . It was found that small faceted ice crystals, along with cloud drops, occurred in spatial clusters with a typical horizontal extension from a few hundred meters to a few kilometers. In many cases, regions with liquid droplets and regions with enhanced concentrations of the small ice may be separated by a few hundred meters or kilometers. In these SIP cloud regions, the concentration of drops and SIP particles is significantly higher than their average values as shown in Fig. 11.
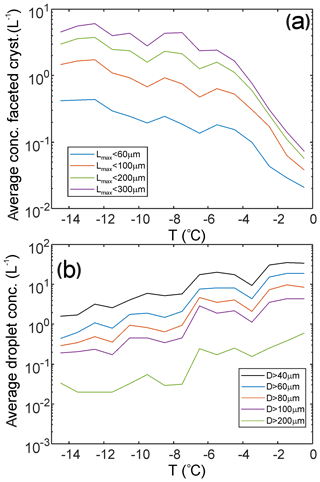
Figure 11Average concentration of small faceted ice crystals (a) and drops (b) estimated from CPI measurements. The concentration was averaged over the entire flight length sampled during 13 flights in 10 tropical MCSs. The concentration was normalized on the sampling distance in each 1 ∘C temperature interval. Total number of 1 s average samples is 8.4×10⁴; total in-cloud length is 9580 km.
Figure 11 shows that, on average, the concentration of SIP particles increases, and the concentration of liquid droplets decreases with increasing height within the entire bulk of MCSs at . These trends may be related to the cumulative effect of vertical transport of SIP particles by the convective updrafts.
4.2 SIP observations in midlatitude frontal clouds
The next observation of SIP was conducted in clouds associated with midlatitude winter frontal systems during the BAIRS2/WERVEX project on 24 March 2017. Figure 12 shows GOES-16 infrared (IR) image (Fig. 12a) and Buffalo NEXRAD reflectivity (Fig. 12b) overlaid with the Convair 580 flight track. The cloud regions identified as SIP are indicated by dashed circles.
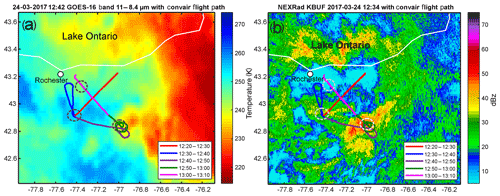
Figure 12Flight track of the Convair 580 in the frontal cloud system on 24 March 2017 overplayed over (a) GOES-16 infrared image (download from University of Wisconsin); (b) KBUF (Buffalo, NY) NEXRAD reflectivity at elevation 0.46∘. Dashed line circles indicate SIP cloud regions.
Figure 13 shows a 1 h segment of in situ cloud microphysical measurements sampled from the Convair 580. During these measurements, the Convair 580 performed a series of porpoise and spiral ascents and descents in the vicinity of the melting layer with altitude and temperature changing in the ranges of and , respectively.
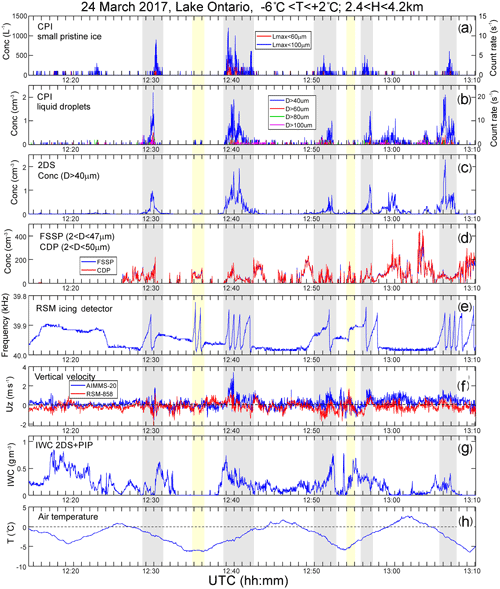
Figure 13Time series of cloud microphysical parameters collected in a frontal cloud system over upstate New York on 24 March 2017. (a) CPI count rate of small pristine ice with Lmax<60 and 100 µm; (b) CPI count rate of cloud droplets with D>40, 60, 80, and 100 µm; (c) concentration of cloud particles D>40 µm measured by 2DS; (d) concentration of cloud droplets measured by FSSP and CDP; (e) Rosemount icing detector frequency; (f) vertical velocity measured by AIMMS20 and Rosemount 858 probes; (g) IWC calculated from composite 2DS and PIP PSDs; (h) air temperature. Grey strips indicate cloud regions with enhanced concentration of small faceted ice particles; red and yellow strips indicate regions where ice and liquid were present, but no SIP was observed (see text).
It turned out that in midlatitude frontal clouds the correlation between the concentration of small faceted ice crystals and liquid droplets is very similar to that observed in tropical MCSs at ∘C. The correlation coefficients between the concentrations of droplets with different diameters and small faceted ice particles are shown in Table 2. As follows from Table 2, the best correlation is reached for droplets with D>40 µm, whereas for the tropical MCS, the best correlation is reached for droplets with D>60 µm (Table 1).
Table 2Correlation coefficient in different size ranges between droplet concentration and concentration of small faceted ice crystals with Lmax<100 µm for the cloud segment in Fig. 13 with 30 and 60 s averaging.

Similar to tropical MCSs, in frontal clouds, SIP was not observed in liquid- and mixed-phase clouds with D<30 µm. Such cloud segments are indicated by yellow strips in Fig. 13. Most cases of SIP in Fig. 13 were associated with cloud regions with enhanced turbulence ( m s−1).
4.2.1 Case 5
Figure 14a shows a sequence of CPI images of cloud particles from a 40 s cloud segment with enhanced concentrations of small faceted ice crystals. In this cloud region, the concentration of small ice crystals with Lmax<100 µm peaked up to approximately Npr100≈100 L−1. Like the case in Fig. 6, a number of frozen drops with deformed shapes (blue frames) were observed in this SIP region. The concentration of visually identified frozen drops is estimated at approximately Nfrd≈30 L−1. During the BAIRS2/WERVEX project, the UHSAS probe was not installed on the Convair 580, and therefore, the concentration of INPs could not be assessed using the approach from Ladino et al. (2017). However, the estimated concentrations of Npr100 and Nfrd still appear to be much higher than expected INP concentrations of 10−6 to 10−3 L−1 at a −2 to −5 ∘C temperature range (e.g., Kanji et al., 2017; DeMott et al., 2016; Price et al., 2018; Welti et al., 2018; Creamean et al., 2018; Wex et al., 2019).
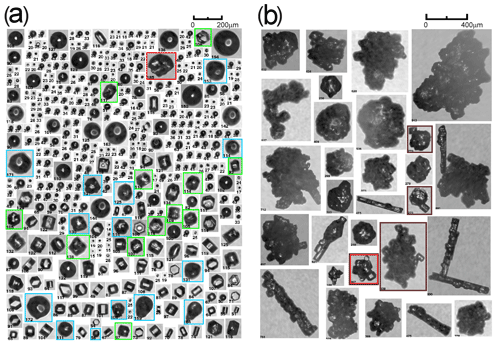
Figure 14Spatial sequence of CPI images of (a) droplets and faceted ice crystals and (b) background large ice particles. (a) Blue frames indicate frozen droplets with modified shapes, green frames indicate frozen drops with developed facets, and red frames indicate fragments of shattered drops. Numbers under each image indicate their maximum sizes (Lmax). Cloud particles in panels (a, b) are spatially mixed, and they were split between two panels because of their difference in size. The images were sampled at ∘C and H=3500 m during 12:29:20–12:30:00 UTC on 24 March 2017 during measurements shown in Fig. 13.
The aged ice particles in Fig. 14b are represented by rimed columns and graupel-like particles. Therefore, this case is consistent with the conditions required for the HM process.
In Fig. 14b, there are a few ice particles with small faceted crystals stuck to their surfaces, which are indicated using brown frames. The origin of small faceted ice on the surface of large particles may be explained by (1) vapor deposition regrowth of rime into faceted crystals or (2) aggregation of newly formed small and pre-existing large ice particles. Option (1) may not be relevant to the particles in Fig. 14b, since a closer look at the small particles reveals that the centers of their growth are separated from the surface of the large ice particle.
Another argument supporting aggregation is that droplets D<100 µm, at ∘C tend to freeze as monocrystals (e.g., Hallett, 1964; Pitter and Pruppacher, 1973). Small droplets freezing on the surface of a monocrystalline particle usually have the same orientation of principal crystallographic axis (e.g., Pitter and Pruppacher, 1973; Iwabuchi and Magono, 1975; Uyeda and Kikuchi, 1978). If the rimed droplets continue to grow through vapor deposition, they will regrow into faceted crystals with the orientation of principal axes the same as that of the “host” crystal. Examples of such ice crystals can be found in Figs. 7 and 9 (brown frames). The alternative to this arrangement is when small faceted ice crystals on the surface of a frozen drop (brown-red frame; Fig. 14b) have clearly multi-directional crystallographic orientations. Therefore, these small ice crystals most likely formed independently of the frozen drop before they were aggregated.
It is worth noting that the ice particles in the brown-red frame include five visible small faceted ice crystals attached to the surface of the frozen drop. Aggregation of the small crystals may be enhanced by electrostatic charges, which fragmented particles may have after shattering. Charge separation during droplet shattering was observed in studies by many research groups (e.g., Mason and Maybank, 1960; Kachurin and Bekryaev, 1960; Latham and Mason, 1961; Evans and Hutchinson, 1963; Stott and Hutchinson, 1965; Kolomeychuk et al., 1975). Therefore, the observation of small faceted ice aggregated to the surface of large particles with different orientations of principal axis is supportive of their formation due to SIP.
4.2.2 Case 6
Figure 15 shows another example of a spatial sequence of particle images from a cloud region with enhanced concentrations of faceted ice particles apparently resulting from SIP. What is interesting about this is that the background aged ice particles were not observed here. Ice particles are either faceted ice crystals or frozen drops. The absence of small droplets and graupel suggests that the HM process is not relevant to this case and that SIP most likely occurred here due to shattering of large drops. This hypothesis is supported by the presence of a large number of images of fragmented (red frames) and deformed frozen drops (blue frames). The presence of such droplets supports the SIP mechanism of shattering of freezing drops. It should be noted that the sizes of most of the faceted ice crystals in Fig. 15 exceed 100–200 µm. Therefore, the age of such particles exceeds the threshold time τcorr, as discussed in Sect. 3.3. However, the purpose of this case is to show another example of SIP in which the criteria for the HM process are not met.
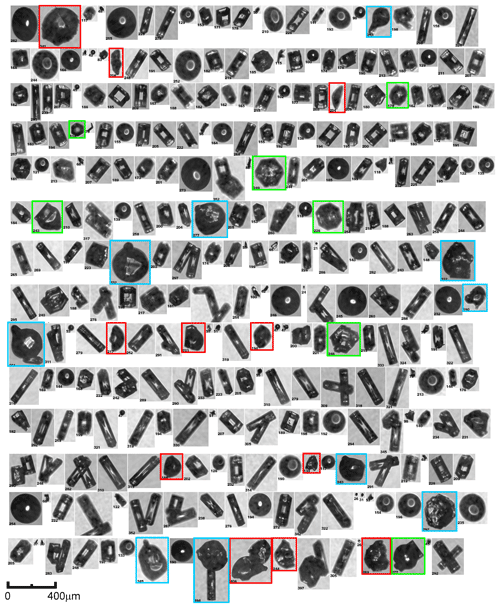
Figure 15Spatial sequence of CPI images of droplets and faceted ice crystals. Blue frames indicate frozen droplets with modified shapes, green frames indicate frozen drops with developed facets, and red frames indicate fragments of shattered drops. Numbers under each image indicate their maximum size (Lmax). The images were sampled during 14:06:30–14:07:30 UTC on 24 March 2017 (not shown in Fig. 13), at ∘C and H=2100 m.
Figure 16 shows the average concentration of faceted ice crystals and droplets for two flights from the BAIRS2/WERVEX field campaign. As it is seen, the concentration of drops with D>60 µm decreases with the decrease of Ta. However, the concentration of faceted ice particles has a maximum at . This type of behavior is different from those in tropical MCSs, as shown in Fig. 11. This difference may be explained by the absence of well-defined convective regions present in MCSs, which transport liquid droplets to the upper levels and extend the temperature range of SIP. A narrower SIP temperature range in the studied frontal clouds may be also explained by SIP regions being associated with the mixed-phase layer embedded into a deep ice cloud. The cloud-top temperature of the mixed-phase layers is limited by to −7 ∘C, which is well reflected in Fig. 16.
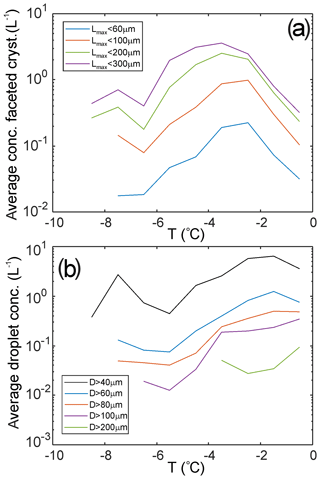
Figure 16Average concentration of ice crystals (a) and drops (b) estimated from CPI measurements and normalized on the sampling distance in each temperature interval. The data were collected during two flights in midlatitude frontal cloud systems with temperatures . Total number of 1 s average samples is 1.4×10⁴; total in-cloud aircraft path length is 1380 km.
4.3 Effect of aircraft-produced ice particles on the measurements
Aircraft-produced ice particles (APIPs) (e.g., Rangno and Hobbs, 1983; Woodley et al., 1991) may be confused with SIP ice crystals and therefore result in biases in the interpretation of measurements. Contamination by APIPs may occur if the aircraft re-enters the cloud region where the APIPs were transported by vertical or horizontal advection. Typically, this may happen if the aircraft traverses through the region of its previous operation.
The contamination by APIPs is excluded for cases 1 and 2 (Figs. 6 and 7) (Sect. 4.1.1, 4.1.2) since the Convair 580 flew along a nearly straight line and never re-entered regions of earlier operations (Fig. 4a). Cases 3 and 4 (Figs. 9, 10) (Sect. 4.1.3, 4.1.4) might be contaminated by APIPs since the clouds were sampled in an area close to where the Convair 580 flew 8 min earlier. However, since cases 3 and 4 were sampled in a convective region with an updraft velocity uz=2–5 m s−1 (Fig. 8f), the potential APIPs were expected to be removed from the area of the measurements by vertical wind.
Case 5 (Fig. 14) (Sect. 4.2.5) was sampled during ascent through the cloud (Fig. 13h) at approximately 12:30 UTC (see also Fig. 12a). This cloud region was not affected by the previous operation of the Convair 580, and therefore, contamination by APIPs of this area is dismissed. Similarly, case 6 (Fig. 15) (Sect. 4.2.6) was sampled during descent through a mixed-phase layer, which was not affected by previous Convair 580 flight operations.
Knowledge about the initial size and number concentration of secondary ice is of great importance for the parameterization of SIP processes in atmospheric models, including weather prediction and climate models, particularly when using multi-moment microphysics schemes. The number and size of SIP particles determine the rate of water vapor depletion, release of latent heat, cloud dynamics, and glaciation time. Because of their slow fall velocity, small SIP particles will stay longer in the environment of their origin. Small fragments will also spread faster over clouds being transported by turbulent diffusion or vertical updrafts. On the contrary, large SIP fragments will precipitate down and have a shorter residence time in the cloud. Besides that, small ice fragments have a higher probability to be monocrystalline and therefore regrow into pristine faceted ice crystals, whereas large ice fragments most likely keep an irregular shape during the subsequent growth by water vapor deposition. The size of the fragments also plays an important role in charge separation and cloud electrification in general (e.g., Jayaratne et al., 1983). Altogether, the size distribution of primary SIP particles has a great significance for precipitation production, radiation properties, and lifetime of clouds.
In this section, we will estimate typical initial sizes of the SIP particles. Identification of initial sizes of secondary ice from the CPI imagery may be problematic because of the limited pixel resolution and ambiguity of distinguishing secondary ice fragments from natural cloud particles. In order to address this issue, we will use an indirect assessment of the initial sizes of secondary ice.
Figure 17 shows images of ice particles sampled in frontal clouds at temperatures ranging from −1 to −1.5 ∘C. All small faceted ice crystals in this cloud region appear to be thin plates (red frames in Fig. 17a). The thickness of the plates (h) is estimated as varying in the range from 10 to 20 µm. Since the smallest size of drops in this region is , then the origin of these plates cannot be attributed to the deposition growth on frozen droplets.
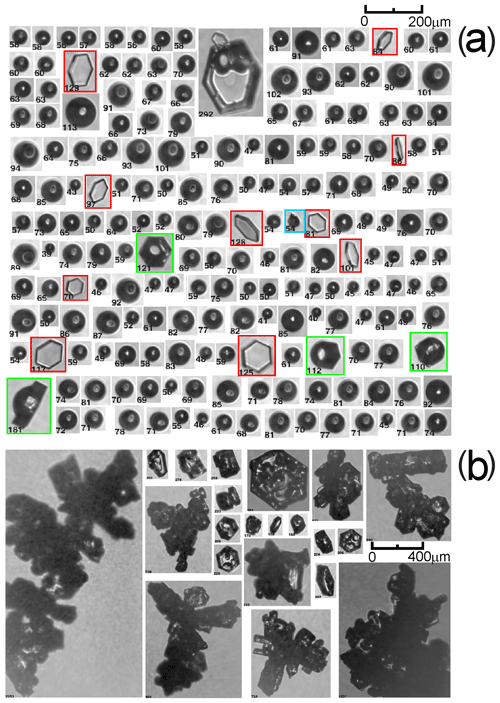
Figure 17Spatial sequence of CPI images of (a) droplets and faceted ice crystals and (b) background large ice particles. (a) Blue frames indicate frozen droplets with modified shapes, green frames indicate frozen drops with developed facets, and red frames indicate secondary ice particles developed into thin hexagonal plates. Numbers under each image indicate their maximum size (Lmax). Cloud particles in panels (a, b) are spatially mixed, and they were split between two panels because of their difference in size. The images were sampled during 04:59:50–05:00:18 UTC on 24 January 2017. ∘C and H=2400 m.
The plates in Fig. 17a have plane parallel basal surfaces without steps. None of these thin plates have a visually identifiable center of initial growth. Such a shape is suggestive that the secondary ice particles, on which these plates were formed, were monocrystalline and their initial sizes (Lmin0) were smaller than the thickness of the plates, i.e., Lmax0<h. In this case, the secondary ice particles were completely embedded inside the plates and became part of the crystallographic lattice. So, there will be no additional refraction of transmitted light and the plates will appear uniform as in Fig. 17a. Therefore, the smallest initial size of the secondary ice particles is estimated as Lmin0≤10 µm.
Secondary ice particles representing a large end of their initial sizes are shown in Fig. 17, which presents images of fragments of shattered frozen drops. Most of these images were collected in SIP regions indicated by grey areas in Fig. 17. The maximum size of droplet fragments Fig. 17 is limited by Lmax0≈400 µm. In general, Lmax0 is determined by the maximum size of ice particles that participate in SIP. Thus, for the case of freezing raindrops, Lmax0 can be extended to a few millimeters.
The obtained estimates suggest that at the moment of initiation, secondary ice particles are represented by a cascade of sizes ranging from 10 µm (or smaller) to a few hundred microns (or larger). This estimate of initial sizes of SIP particles is consistent with the videos by Wildeman et al. (2017) and Lauber et al. (2018), which showed a variety of fragments with different sizes formed during shattering of freezing drops.
The shapes of secondary ice particles that develop during τcorr may shed light on the environmental conditions associated with the SIP initiation.
A quick look at the ice particle images in Figs. 6, 7, 14, 15, and 17 shows that the aspect ratio () of small ice crystals (hexagonal prisms) may noticeably vary within the same SIP cloud region.
Figure 19 shows small faceted ice crystals sampled in different SIP cloud regions (Fig. 5) with narrow temperature ranges from . As seen from Fig. 19, despite the minor changes of Ta, the habits of small ice crystals varied from plates to long columns, and the aspect ratio changed in the range of .
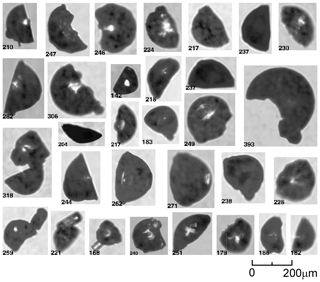
Figure 18Images of fragmented frozen droplets collected in the SIP cloud regions indicated by grey areas in Figs. 5 and 13 at .
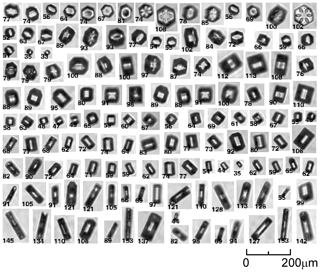
Figure 19Images of small faceted ice particles, which were sampled in SIP cloud regions at , H=5600 m, indicated by grey color in Fig. 5. The aspect ratio of the small hexagonal prisms varies in the range of .
Based on laboratory studies, R depends on the air temperature (Ta) and supersaturation over ice (Si) of the environment where the ice crystals were grown (e.g., Mason, 1971; Kobayashi, 1961; Bailey and Hallett, 2009). Therefore, it is expected that ice crystals that were formed in the same cloud volume and were exposed to the same Ta and Si should have the same R. Thus, the following question arises: why do ice crystals with different habits form in the same cloud volume?
There are several possibilities as to how R may vary. The environment with ∘C and Sw>0 corresponds to the plate growth condition. Therefore, the plates shown in the upper row in Fig. 19 could be formed a few hundred meters below at ∘C and then be brought up to the level of observation with a convective updraft. The internal structure of some plates in the upper row (i.e., image nos. 8, 9, 11, 14, and 15) is indicative of the changing Ta and Si that ice crystals may experience during ascent.
As seen in Fig. 19, most of the ice crystals are solid columns and thick plates. Following laboratory studies (Mason, 1971; Kobayashi, 1961; Bailey and Hallett, 2009), such ice habits form at ∘C in the environment supersaturated with respect to ice (Si>0) but undersaturated with respect to water (Sw<0). Therefore, the cloudy air in the SIP region, despite any presence of liquid drops, was undersaturated with respect to water. Such conditions may occur during the repartitioning of water between ice and liquid phases, when the WBF process is active (Korolev and Mazin, 2003; Pinsky et al., 2018).
Ice crystals with R∼1 may be formed as a result frozen droplets developing facets and turning into isometric hexagonal prisms (e.g., Gonda and Yamazaki 1978, 1984; Magono et al., 1979; Takahashi and Mori, 2006). Long columns with , shown in the two bottom rows in Fig. 19, correspond to the growth condition with Sw≥0 and ∘C (Mason, 1971; Kobayashi, 1961; Bailey and Hallett, 2009).
Accordingly, the shape of secondary ice crystals during the early stage of their evolution may vary from plates to solid columns. At a later stage, ice particles metamorphosize in shape in accordance to their evolving Ta(t) and Si(t). Thus, Figs. 9 and 10 show that columns tend to be the dominant shape of the aged secondary ice particles after ascending from 5600 m (−5 ∘C) to 7200 m (−15 ∘C). The aspect ratio and size of the aged columns vary in the ranges of and , respectively.
The purpose of this section is to identify how secondary ice particles may evolve after their formation. Understanding of possible scenarios of secondary ice evolution is important for the interpretation of the obtained results and developing cloud simulations. The interactions between secondary ice and environment are specifically important for small ice splinters (Lmax<10 µm) due to different types of instability related to this size range. Below, we consider four possible scenarios of how secondary ice particles may evolve after their production.
7.1 Vapor deposition growth
This scenario consists of vapor deposition growth of individual secondary ice particles, which requires supersaturation over ice. The necessary condition for this scenario is supersaturation over ice. This condition is satisfied in mixed-phase clouds and in updrafts in ice clouds (Korolev and Mazin, 2003). Examples of the secondary ice particles regrown into hexagonal plates and columns are shown in Figs. 6, 7, 10, 14, 15, and 17. This scenario conserves the concentration of SIP particles (NSIP).
7.2 Scavenging by liquid droplets
Because of the high concentration of droplets in mixed-phase clouds (typically 101–102 cm−3), scavenging of secondary ice particles by liquid drops may have a high frequency of occurrence. Examples of images of frozen drops measured in SIP cloud regions are shown in Fig. 20. Most of these images do not have any large ice crystals attached to them. Therefore, it would be reasonable to assume that they were nucleated by secondary ice particles, presumably smaller than 10–20 µm. More examples of frozen drops in SIP regions can be seen in Figs. 6, 14, 15, and 17 (indicated by blue frames). Because of the high concentration of the frozen drops (Sect. 4), their formation cannot be explained by nucleation via heterogeneous INPs.
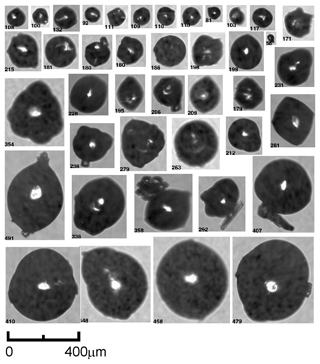
Figure 20CPI images of single frozen droplets whose shape was modified during freezing collected in SIP cloud regions in the temperature range of .
Scavenging of secondary ice particles by liquid droplets may result in shattered freezing drops and an increase in the concentration of secondary ice. This process induces a positive feedback loop and under certain conditions may result in an avalanche increase in the concentration of secondary ice particles. The possibility of ice multiplication due to a chain reaction was proposed in early studies (e.g., Kachurin and Bekryaev, 1960; Mason and Maybank, 1960; Koenig, 1963; Braham, 1964; Mossop et al., 1964; and others). The observation of frozen and fragmented drops inside the SIP regions can be used as evidence that chain reactions are part of the ice multiplication process.
Droplet freezing may also occur without shattering. In this case, frozen drops keep growing through vapor deposition. Examples of large frozen drops with developing facets are shown in Fig. 21. Observations of frozen drops regrowing into hexagonal prisms, as in Fig. 21, are indicative that these drops were nucleated by embryonic monocrystalline secondary ice particles. As seen from Fig. 21, depending on the stage of their growth, some frozen drops developed not only basal and prism faces but also pyramidal faces. Such evolution of frozen drops was observed in laboratory studies by Gonda and Yamazaki (1978, 1984), Magono et al. (1979), and Takahashi and Mori (2006). Additional examples of frozen drops with developed facets can be found in Figs. 14, 15, and 17 (green frames).
7.3 Scavenging by aged ice particles
After their initiation, secondary ice particles may be scavenged by aged ice particles. As follows from laboratory studies, shattering of freezing drops is usually accompanied by charge separation (e.g., Mason and Maybank, 1960; Kachurin and Bekryaev, 1960; Evans and Hutchinson, 1963; Stott and Hutchinson, 1965; Kolomeychuk et al., 1975). Static electric charges may significantly enhance the scavenging of secondary ice by liquid drops and/or pre-existing ice, and result in the rapid reduction of the concentration of secondary ice. An example of secondary ice scavenged by bigger ice particles is shown in Fig. 14b.
7.4 Sublimation of secondary ice
Small secondary ice particles may undergo complete sublimation if SIP occurs in the environment undersaturated over ice. For example, at ∘C and RHw=90 % (RHice=95 %), a 10 µm ice particle will completely sublimate during tev≈4 s.
Subsaturation in ice or mixed-phase clouds may occur due to entrainment of dry air. Thus, Pinsky et al. (2018) showed that in mixed-phase cloud, complete sublimation of small ice crystals during entrainment and mixing of dry air may occur prior to the complete evaporation of liquid droplets.
Ice clouds may also become subsaturated in downdrafts (Korolev and Mazin, 2003). Thus, in an ice cloud parcel with Nice=200 L−1, Lice(0)=200 µm, RHice(0)=100 %, and ∘C, descending with m s−1, relative humidity over ice in t=20 s will be RHice(t)=95 %. If such a parcel contained ice splinters with Dice≈10 µm, they would completely sublimate within 20 s. Downdrafts frequently accompany vertical updrafts in dynamically active regions inside MCSs (e.g., Figs. 5f and 8f). Therefore, sublimation of newly formed small secondary ice particles may play an important role in suppressing ongoing SIP and the reduction of NSIP. Figure 22 summarizes the potential interactions of newly formed secondary ice with a cloud environment.
This section revisits the discussion of the SIP mechanisms, which might be responsible for the enhanced concentration of small ice particles.
8.1 Droplet fragmentation/shattering during freezing
Images of fragmented frozen drops in Figs. 6, 14, and 15, collocated with secondary ice particles, explicitly indicate that the SIP mechanism due to shattering of freezing drops is a contributing factor in ice multiplication. A collection of fragments of frozen drops from other SIP regions is shown in Fig. 18. Fragments of frozen drops were also documented through in situ observations reported by Korolev et al. (2004) and Rangno (2008).
It should be noted that small fragments of frozen droplets may not be identified from the CPI imagery due to limited pixel resolution and issues related to the segregation of irregularly shaped fragments from natural particles. Fragments of large frozen drops may also not be found in the SIP region, since they rapidly leave the region of their origin due to the fast sedimentation. For these reasons, the fragments of shattered frozen droplets may not always be seen by CPI in the SIP cloud regions associated with shattering of freezing drops (e.g., Figs. 7, 9, 10, and 17).
Drop freezing by impaction of ice splinters is supported by observations of single frozen drops with deformed shapes (Fig. 20) and frozen drops with partially developed facets (Fig. 20). Because of the absence of any visible large ice particles attached to them, these drops must have been nucleated by small ice particles.
As it is seen from Figs. 11 and 16, secondary ice particles were observed at temperatures as warm as −0.5 ∘C and colder than −8 ∘C. These temperatures are outside of the HM and riming–splintering temperature range. However, shattering of freezing drops may explain the observation of SIP in a greater temperature range. Such an explanation is consistent with the laboratory observation of the frequency of droplet shattering by Takahashi and Yamashita (1970), Takahashi (1975), and Lauber et al. (2018).
8.2 Splintering during riming and HM mechanism
As discussed in Sect. 4, some SIP cloud regions comprised both liquid droplets and graupel, and therefore, they formally satisfy conditions for the HM process (i.e., Figs. 6 and 14). However, in a number of SIP cases, graupel was not observed (i.e., Figs. 7, 15, and 17), whereas in cases like those in Figs. 9 and 10, graupel is present, but LWC is very low or absent. Hence, such cases did not meet the formal conditions for the HM process.
These inconsistencies of the environmental conditions imply the existence of another SIP mechanism that does not involve graupel. One of such mechanisms could be splintering during riming (Ono, 1971; Choularton et al., 1978; Mossop, 1980). After sticking to an ice surface, some drops during freezing may form an ice shell around a liquid core and rupture, ejecting splinters. Such a scenario is supported by the observation in SIP regions of both liquid droplets and rimed ice.
However, Macklin and Payne (1969) and Dong and Hallett (1989) showed that droplets spread out after hitting an ice surface at temperatures warmer than −3 ∘C. Therefore, an ice shell does not form, and it limits the riming–splintering mechanism at the high temperature end. On the other hand, Griggs and Choularton (1983) argued that the ice shell might be too strong to break from internal pressure at temperatures of ∘C. So, these laboratory studies suggest that the temperature range of the splintering during riming remains approximately the same as for the HM process.
Unfortunately, in the framework of this study, it is not possible to segregate droplet shattering, rime splintering, and HM mechanisms and assess their occurrences.
8.3 Fragmentation due to ice–ice collisions
Takahashi (1993) argued that a collision between large graupel grown by riming and small graupel grown by deposition (or a rimed snowflake) results in SIP. In laboratory experiments, Takahashi et al. (1995) found that collision between large and small graupel might be an efficient source of secondary ice particles.
Formally, the condition for presence of graupel and rimed ice particles is satisfied in the cases shown in Figs. 6, 7, 9, 10, 14, and 17. Therefore, formation of the small faceted ice particles in theses cases can be attributed to the collision–fragmentation mechanism.
However, analysis of the CPI imagery in ice clouds lacking graupel and far away from any sources of liquid or updrafts did not reveal any noticeable presence of small faceted ice crystals. This observation suggests that the collision–fragmentation mechanism most likely has low significance for SIP for the cases of deposition-grown ice crystals in pure ice clouds. Another possible explanation for the absence of evidence of the collision–fragmentation SIP is that the ice fragments formed due to ice–ice collision do not regrow into small faceted ice particles. In cases like that, the employed method cannot be used for the identification of secondary ice formed due to this mechanism.
So, in the frame of the obtained observations, the contribution of the collision–fragmentation mechanism to SIP remains uncertain.
8.4 Ice fragmentation during thermal shock
Laboratory studies by Dye and Hobbs (1968) and Hobbs and Farber (1972) yielded positive results on the fragmentation of ice particles due to thermal shock caused by a droplet freezing on the surface of an ice particle. This mechanism is expected to be active at ∘C (King and Fletcher, 1976a, b). Since a large fraction of our observations of SIP can be related to originating temperatures of ∘C, it is expected that the thermal shock mechanism has low importance for this study. However, for lower temperatures, the role of this mechanism in SIP remains uncertain.
8.5 Ice fragmentation during sublimation
A cloud environment subsaturated with respect to ice is a necessary condition for initiating the mechanism of ice fragmentation during sublimation. As it was discussed in Sect. 4, most of the SIP events were observed in mixed-phase clouds. Such clouds are supersaturated with respect to ice, and therefore, the necessary condition is not satisfied. Hence, the fragmentation during sublimation mechanism can be ruled out.
8.6 INP activation in transient supersaturation around freezing drops
Maximum supersaturation formed around a freezing droplet with D=200 µm at ∘C is estimated as Sw=1 % (Nix and Fukuta, 1974). Such supersaturation can also be achieved in moderate vertical updrafts (e.g., uz=4 m s−1, Ndr=50 cm−3, and D=30 µm), which are typical for convective regions in MCS (e.g., Fig. 5). Therefore, if activation of INPs around freezing drops has any significance at ∘C, it should be observed in the bulk of convective updrafts, since the total volume with Sw∼1 % is much higher there compared to that around a freezing drop. However, many MCS regions (not shown here) with vertical updrafts exceeding 4 m s−1 lacked notable concentrations of small ice particles at temperatures close to −4 ∘C. Therefore, the mechanism of INP nucleation in transient supersaturation around freezing drops is unlikely to be responsible for the observed concentration of small ice observed in this study at ∘C. However, this mechanism may be active at lower temperatures.
One of the most striking findings of this study is the persistent observation of SIP immediately above the melting layer. This phenomenon was observed in clouds in different geographical regions and clouds with different dynamics. So, the following question arises: what are the conditions that make the cloud environment above the melting layer favorable for SIP?
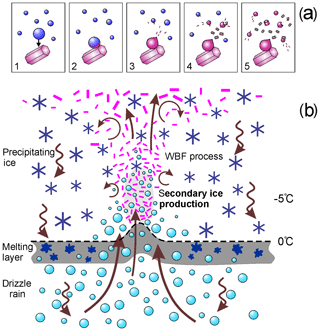
One possible explanation is the formation of large drops (D∼60–300 µm) due to the recirculation of ice and liquid through the melting layer. Thus, ice particles turn into drops after falling through the melting layer. Then, these drops are brought back above the melting layer by convective or turbulent updrafts.
The recirculation hypothesis is supported by the observation of distortion of the bright band altitude in the convective cloud regions. An example of such distortion is presented in Fig. 23. Figure 23 shows a zoomed segment of the time series in Fig. 5, which includes reflectivity (Fig. 23c) and Doppler velocity (Fig. 23d) measured by onboard X-band radar when traversing a convective cell in the tropical MCS (09:40–09:45 UTC). Comparison of Fig. 23b and c shows a peak-to-peak correlation between the vertical wind velocity and elevation of the bright band in the convective cell. In a few points, the bright band moves up to ∼600–700 m above the level of the bright band in undisturbed cloud regions (indicated by the dashed line in Fig. 23c, d). Such distortion of the bright band is explained by moving melted drops by vertical updrafts to higher levels. A spatial coincidence of the SIP area (Fig. 23a), convective updraft (Fig. 23b), and the region with the elevated bright band (Fig. 23c) is supportive of the droplet recirculation hypothesis.
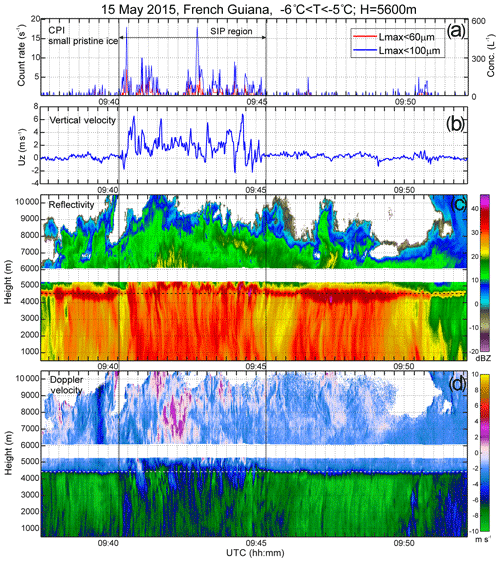
Figure 23Zoomed time segments of the time series in Fig. 5 with the counting rate of small pristine ice particles (a), vertical velocity (b), X-band radar reflectivity (c), and Doppler velocity (d), measured during a traverse of the convective region inside a tropical MCS. Horizontal dashed lines in panels (c, d) show the level of the bright band undisturbed by convective updraft cloud regions. Two vertical solid lines indicate the SIP cloud region, which spatially coincides with the convective cell (b) and elevated bright band (c).
In order for a drop to ascend through the melting layer, the velocity of the updraft (uz) should exceed the drop fall velocity (ufall). Figures 5f and 13f show examples of when the vertical velocity above the melting layer in the tropical MCS reached uz≈8 m s−1 and in frontal clouds uz≈3 m s−1, respectively. Such updraft velocity is sufficient to move drops with D=100–200 µm (ufall=0.3–1 m s−1 at P=500 mbar) through the melting layer (ΔZ=500 m) during a reasonable time of a few tens of seconds to a few minutes.
The vertical travel distance of the liquid drops formed in the melting layer depends on the sustainability and endurance of the convective updraft, its vertical velocity, and droplet size. Smaller droplets have higher chances to travel deeper in the cloud compared to large ones. This is consistent with the observation of occurrence of droplets with D=80 and 100 µm, as shown in Figs. 5b and 8b, which were measured in the same MCS at two different altitudes (5600 and 7000 m), respectively. Rapid decrease of the concentration of large drops with temperature (and therefore altitude) in tropical MCSs is also seen in Fig. 11.
Another explanation of the formation of drizzle size drops is related to the collision–coalescence process. However, the observed LWC and number concentration of cloud droplets with D<40 µm in a mature tropical MCS during HIWC typically varied in the ranges of g m−3 and cm−3, respectively, and were always associated with a mixed phase dominated by ice ( g m−3) (e.g., Figs. 5d, g and 8d, g). High IWC and low Ndr and LWC will hinder the collision–coalescence process due to riming and WBF processes, which result in depletion of droplets. However, the collision–coalescence process cannot be ruled out in midlatitude frontal clouds as in Fig. 13.
After arriving in the supercooled environment above the melting layer, drops collide with aged ice particles, and some of these drops may form ice shells during freezing and shatter. This may result in initiation of SIP. Images of large drops frozen on the surface of aged ice particles observed above the melting layer are shown in Fig. 24. Most of the drops have deformed shapes with bulges. Formation of bulges may be accompanied by production of ice splinters by jetting or bubble bursting (Lauber et al., 2018).
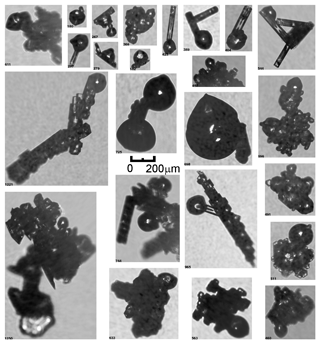
Figure 24Images of frozen droplets attached to ice crystals that initiated their freezing. The shape of the frozen droplets was modified during freezing. Images were collected in the temperature range of .
In laboratory studies, Takahashi (1975) and Lauber et al. (2018) concluded that large drops have higher occurrence of shattering compared to small ones. Therefore, despite their lower concentration, shattering of fewer large drops may play the role of a trigger in initiating SIP. As follows from Tables 1 and 2, the concentration of small ice particles has the highest correlation with the droplets from the size range of 40–60 µm. Therefore, it is expected that the droplets from this size range have the highest contribution to SIP through maintenance of a chain reaction, as shown in Fig. 25a. The conceptual model summarizing the effect of the melting layer of SIP is presented in Fig. 25b.
In the frame of this study, we explored the microphysics of SIP cloud regions in tropical MCSs at the mature stage of their development and midlatitude frontal cloud systems within the temperature range of . SIP cloud regions were identified based on the presence of numerous small faceted ice crystals with Lmax<100 µm. The concentration of such small crystals peaked at 500–1000 L−1. Such particles cannot be a result of the recirculation of pre-existing aged ice. Based on the estimate that the age of such small crystals is limited by τcorr∼60–120 s, it was deduced that such ice crystals are still associated with the environment of their origin. This approximation was employed to assess the environmental conditions associated with SIP. As discussed below, our method has a number of limitations. However, it allowed obtaining the following conclusions:
- 1.
Most SIP cases were associated with
- a.
the presence of liquid droplets in the SIP region or somewhere in the vicinity;
- b.
convective updrafts or regions of enhanced turbulence; or
- c.
aged rimed ice particles.
- a.
- 2.
The highest correlation between the concentration of small faceted ice crystals and liquid droplets was found for droplets in the range of (Tables 1 and 2).
- 3.
In several cases, no liquid was observed in SIP cloud regions.
- 4.
Graupel was not always present in the SIP cloud regions.
- 5.
The shape of small faceted ice particles suggests that they were grown in conditions supersaturated with respect to ice but subsaturated with respect to water.
- 6.
The smallest size of the splinters generated during SIP was estimated at 10 µm or less.
- 7.
The aspect ratio of small hexagonal ice particles observed in the same volume may vary up to 10 times.
- 8.
In both tropical MCSs and midlatitude frontal clouds, secondary ice particles were observed immediately above the melting layer starting at ∘C. In MCSs, SIP was observed at temperatures down to −15 ∘C. No data points were available below this temperature.
- 9.
In MCSs, SIP regions vertically correlate with the locations of the coldest tops. No such dependence was found for the frontal cloud systems we analyzed.
We hypothesize that the initiation of SIP above the melting layer is related to the circulation of liquid drops through the melting layer. Liquid drops formed via melting ice particles are advected by the convective updrafts above the melting layer, where they collide with aged ice, freeze, and shatter. The ice splinters generated by shattering initialize the chain reaction of SIP.
In many cases, concentrations of frozen drops and their fragments exceeding expected concentrations of INPs by orders of magnitude were observed in SIP regions. This discrepancy implies that something other than heterogenous drop freezing must be contributing to SIP. The roles of mechanisms such as HM rime splintering, ice–ice collisional breakup, thermal shock fragmentation, and INP activation around freezing drops cannot be confidently linked to SIP based on the collected data, for reasons explained at length. Thus, we conclude by process of elimination that the mechanism of droplet shattering during freezing is very likely a critical contributing factor to SIP in these cases.
The conclusions obtained in this study are based on the interpretation of observations which were obtained along needle-like penetrations of large cloud systems at some time of their evolution. The fact that initial and boundary conditions of the studied cloud systems are poorly known, and the trajectories of cloud volumes and cloud particles are not identifiable, brings a certain ambiguity into the interpretation of the obtained observations. So, in many ways, the conclusions in this work bear a qualitative character, and the emphasis of this study is on the observational part. The obtained results are expected to contribute to our understanding of SIP, and they may be used by cloud modeling studies for evaluation of secondary ice production in the numerical simulations of clouds (e.g., Qu et al., 2018), for instance, by evaluating where such small particles appear in high concentrations in simulations.
In microphysics schemes that predict the number concentration of ice crystals, i.e., spectral (bin) and multi-moment bulk schemes (e.g., Khain et al., 2004; Milbrandt and Yau, 2005), SIP is most commonly modeled exclusively with a simple parameterization of the HM process. If riming of graupel is occurring in the temperature range between −3 and −8 ∘C, an ice splinter production rate is computed for this process, with a maximum at −5 ∘C, decreasing linearly to zero at the ends of the temperature range. Assumptions of the crystal number concentration tendency and the size of the new crystals are made, based broadly on the published results of Hallett and Mossop (1974). Parameterizations that exist for other mechanisms of secondary ice production have been less widely included in modeling efforts to explain apparent SIP in observed cloud systems, but when INPs are treated rigorously in a prognostic manner, such mechanisms are generally found to be too weak to explain observed ice even when considered additively, including drop shattering and ice–ice collisions (e.g., Fridlind et al., 2007; Fu et al., 2019). It is perhaps unsurprising that such additional mechanisms are not more widely adopted if they provide only weak ice generation and still unsatisfactory results compared with observations, in addition to being highly uncertain due to a paucity of robust laboratory data. Ultimately, it may be important in atmospheric models for some purposes to improve the representation of both primary and secondary ice production in microphysics parameterization schemes based on more recent observations and the hypothesized processes. It will be a topic of future research to apply the observations presented to develop new parameterizations of SIP. However, parameterizations based on field observations will necessarily remain to some degree speculative without a strong foundation of laboratory measurements that can provide clear and repeatable evidence of specific mechanism strengths.
The obtained results bring up a more general question about the limitations of airborne techniques in the identification of major mechanisms and their efficiencies in SIP. Airborne observations deal mostly with the results of SIP in the form of different stages of aged secondary ice. However, attempts to quantify or parameterize the secondary ice production from in situ observations are limited because the initial and boundary conditions are mostly unknown. One of the fundamental limitations of airborne techniques is that they do not allow for monitoring and identifying the process of secondary ice directly. In this regard, the pursuit of SIP research lends itself well to laboratory experiments and should be emphasized in this area.
A set of tests in the Cox and Company, Inc. wind tunnel facility (Plainview, NY) was conducted to identify the performance of different airborne instruments in ice sprays. The primary objective of these tests was to identify and document the effect of shattering and bouncing on the measurements of airborne particle probes with different types of tips and inlets. More detail about the nature of this study can be found in A. V. Korolev et al. (2013).
Figure A1 shows two snapshots from a high-speed video of the CPI inlet in an ice spray at an air speed of 80 m s−1. The CPI sampling tube has a diameter of 2.5 mm with a rounded edge having a radius of curvature of approximately 0.5 mm. The purpose of such sharpened edge is to mitigate the effect of shattering. However, as it is seen from Fig. A1, despite their relative sharpness, ice particles still shatter and rebound from the edge of the CPI inlet. Figure A1 also shows that the rebound particles are deflected both outside and inside the CPI sampling tube. This observation led to the conclusion that the CPI measurements can be affected by mechanical shattering of ice particles on impact with the CPI inlet.
Figure A2 presents results of the computational fluid dynamics (CFD) simulations of the airflow around the CPI housing. The simulation was conducted for the airspeed of 150 m s−1, P=450 mbar, and ∘C. As it is seen in Fig. A2c, d, the velocity of the air changes by approximately 30 m s−1 at a distance of ∼2 cm when passing through the front part of the inlet tube. This will result in large aerodynamic stresses, which ice particles may experience when entering the CPI inlet. Another area where ice particles may experience strong aerodynamic stresses is located near the walls of the inlet tube (Fig. A2b). Such aerodynamic stresses may result in deformation of the shape of liquid drops and fragmentation of large fragile ice particles and aggregates with weak bonding.
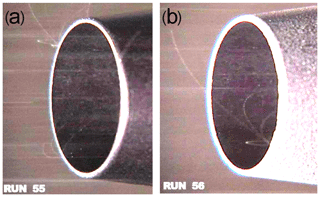
Figure A1Snapshots from a high-speed video of trajectories of shattered and rebound ice particle fragments formed on impact with the CPI inlet. The measurements were conducted in the Cox and Company, Inc. wind tunnel facility (Long Island, NY, USA) in ice spray at TAS=80 m s−1.
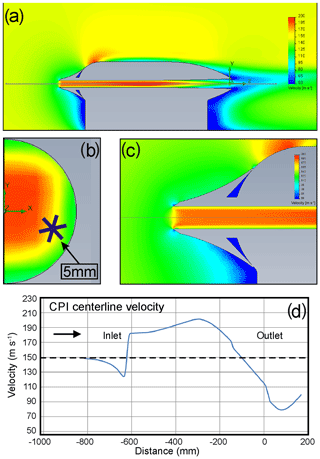
Figure A2Results of the CFD analysis of flow around and through the CPI sampling tube. (a) Airspeed around the CPI sensor head; (b) cross section of speed inside the CPI inlet tube at the location of the sample volume; (c) zoomed CPI inlet area as in panel (a); (d) changes of the air velocity along the CPI inlet tube centerline. The simulation was performed for P=450 mbar, ∘C, TAS=150 m s−1.
It is worth noting that the CPI used in this study had a modified shortened inlet tube. The original CPI front inlet tube is longer, and due to the inner step at the front edge, it has a higher velocity jump at the entrance compared to that in Fig. A2d.
Figure A3 shows examples of CPI images of fragmented ice particles sampled in clouds. The image frame in Fig. A3a includes 55 fragments, which corresponds to a local concentration of approximately 6×10³ to 7×103 cm−3. Such concentrations of ice particles do not seem to be possible in natural clouds. The only reasonable explanation is that these fragments result from ice particle shattering due to mechanical impact with the CPI inlet, and immediately after shattering the fragments form a spatially dense cluster of particles with high local concentration.
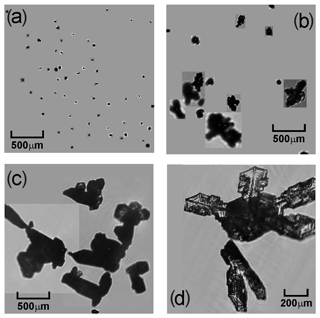
Figure A3Multiple images registered in 2.3 mm×2.3 mm CPI image frames (a, b, c). Images in panels (a, b) are identified as a result of shattering due to mechanical impact with the CPI inlet. Images in panels (c, d) likely result from fragmentation due to aerodynamic stresses in the CPI inlet tube.
The cluster of multiple images shown in Fig. A3b is unlikely to occur in clouds due to significantly different fall velocities, which range from approximately 1 cm s−1 (for the smallest particle in the image frame) to 1 m s−1 (for the largest particle). Most likely, the images in Fig. A3b are debris from a shattered ice particle originated from impact with the CPI inlet.
The origin of fragmentation of the particle in Fig. A3c, d is most likely related to fragmentation due to aerodynamic stresses. If such fragmentation occurs due to some natural causes, the fragments due to their different sizes are unlikely to stay together due to different fall velocities.
In the present study, CPI images similar to those in Fig. A4 were identified as shattered artifacts. The shapes of most of these particles conflict with the concept of growth of crystal lattice. However, their shapes can be explained by the fragmentation of ice crystals.
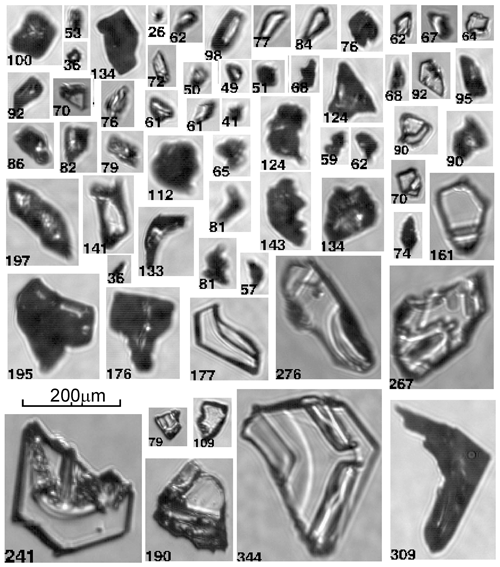
Figure A4Examples of CPI images identified as shattering artifacts. Such images were excluded from analysis.
Images as in Fig. A4 usually form spatial clusters with close spacing, and they appear in CPI image frames (2.3 mm×2.3 mm) as multiple images as in Fig. A3. In this regard, the number of images in CPI image frames was used as an indicator of shattering. In this work, CPI image frames with more than one image were identified as shattering artifacts, and such frames were excluded from the analysis. The SPEC CPIview processing software was modified to recognize such image frames and discard them. Shattered fragments, which appear in the CPI imagery as single particle images (i.e., the rest of the fragments did not pass through the sample volume), could not be identified by this technique. However, since the entire analysis of the CPI data was built on identification and calculation of concentrations of small hexagonal prisms with L<Lmax and droplets with D<300 µm, the unidentified shattered ice fragments in the CPI imagery did not affect outcomes of this study.
It should be noted that some of the images as in Fig. A4 may have a natural origin. However, their exclusion from the analysis does not affect the conclusions obtained in this study.
The analysis of the CPI data showed that the number of shattering artifacts increases with the increase of particle size. Misalignment between the direction of local airflow and the axis of the CPI sampling tube also results in an increase of the shattering artifacts and a decrease of the counting rate of intact particles. Thus, for a 4∘ angle between the airflow and axes of the sampling tube, the CPI sampling volume will be in the geometrical shadow. This will result in a reduction of the counting rate of primarily large particles. Smaller particles will follow the airflow, and their counting rate will be less affected.
The orientation of the CPI sampling tube was aligned with the local flow at H=3 km and TAS=100 m s−1 at the mounting location on the Convair 580. For other flight conditions, the misalignment between the local airflow and the axis CPI inlet tube will persist.
The data used in this study are available upon request from the first author.
AK led the collection of the cloud microphysical data and data analysis. IH performed analysis of the CPI and cloud microphysical data. MW carried out the airborne data collection and analysis of in situ atmospheric state parameters and NAWX radar data. LL supported the analysis of cloud microphysical data. EW supported the airborne data collection during BAIRS2. AK prepared the manuscript with the co-authors contribution from ASA, AMF, PL, and JM.
The authors declare that they have no conflict of interest.
The authors give special thanks to the NRC FRL pilots (Anthony Brown, Paul Kissman, and Rob Erdos) for their outstanding cooperation during in situ data collection during the HIWC and BAIRS2/WERVEX projects. The authors are grateful for the technical support provided during the data collection period by ECCC and NRC technical and engineering teams. The authors acknowledge Ed Emery, Chris Lynch, and Quentin Schwinn of the NASA Glenn Research Center for supporting wind tunnel tests of the CPI probe. CFD analysis of the flow around CPI was performed by Kirk Creelman of Auriga Design Inc. We appreciate the help of the University of Waterloo student, Keegan Cove, who supported CPI data analysis. The authors are grateful to Charlie Knight and the anonymous reviewers for their valuable comments. Any opinions, findings, conclusions, or recommendations expressed in this material are those of the authors and do not necessarily reflect the views of the FAA and TC.
The HIWC program was supported by Environment and Climate Change Canada (ECCC), National Research Council (NRC), Transport Canada (TC) and the Federal Aviation Administration (FAA). WERVEX program was supported by ECCC and TC. The NRC RAIR program contributed funding for the BAIRS2/WERVEX campaign. Participation of the Massachusetts Institute of Technology in BAIRS2 was supported by FAA under Air Force Contract FA8702-15-D-0001.
This paper was edited by Martina Krämer and reviewed by Charles Knight and two anonymous referees.
Ackerman, A. S., Fridlind, A. M., Grandin, A., Dezitter, F., Weber, M., Strapp, J. W., and Korolev, A. V.: High ice water content at low radar reflectivity near deep convection – Part 2: Evaluation of microphysical pathways in updraft parcel simulations, Atmos. Chem. Phys., 15, 11729–11751, https://doi.org/10.5194/acp-15-11729-2015, 2015.
Bacon, N. J., Swanson, B. D., Baker, M. B., and Davis, E. J.: Breakup of levitated frost particles, J. Geophys. Res., 103, 13763–13775, https://doi.org/10.1029/98JD01162, 1998.
Bailey, M. P. and Hallett, J.: A Comprehensive Habit Diagram for Atmospheric Ice Crystals: Confirmation from the Laboratory, AIRS II, and Other Field Studies, J. Atmos. Sci., 66, 2888–2899, https://doi.org/10.1175/2009JAS2883.1, 2009.
Baumgardner, D., Jonsson, H. H., Dawson, W., O'Connor, D. P., and Newton, R.: The Cloud, Aerosol and Precipitation Spectrometer: A New Instrument for Cloud Investigations, Atmos. Res., 59–60, 251–264, https://doi.org/10.1016/S0169-8095(01)00119-3, 2001.
Beard, K. V.: Ice initiation in warm-base convective clouds: An assessment of microphysical mechanisms, Atmos. Res., 28, 125–152, https://doi.org/10.1016/0169-8095(92)90024-5, 1992.
Bergeron, T.: On the physics of clouds and precipitation, Procès Verbaux de l'Association de Météorologie, International Union of Geodesy and Geophysics, Lisbon, 2, 156–178, 1935.
Beswick, K. M., Gallagher, M. W., Webb, A. R., Norton, E. G., and Perry, F.: Application of the Aventech AIMMS20AQ airborne probe for turbulence measurements during the Convective Storm Initiation Project, Atmos. Chem. Phys., 8, 5449–5463, https://doi.org/10.5194/acp-8-5449-2008, 2008.
Bower, K. N., Moss, S. J., Johnson, D. W., Choularton, T. W., Latham, J., Brown, P. R. A., Blyth, A. M., and Cardwell, J.: A parametrization of ice water content observed in frontal and convective clouds, Q. J. Roy. Meteor. Soc., 122, 1815–1844, https://doi.org/10.1002/qj.49712253605, 1996.
Braham, R. R.: What is the Role of Ice in Summer Rain-Showers?, J. Atmos. Sci., 21, 640–645, https://doi.org/10.1175/1520-0469(1964)021<0640:WITROI>2.0.CO;2, 1964.
Brownscombe, J. L. and Thorndike, N. S. C.: Freezing and Shattering of Water Droplets in Free Fall, Nature, 220, 687–689, https://doi.org/10.1038/220687a0, 1968.
Cai, Y., Montague, D. C., Mooiweer-Bryan, W., and Deshler, T.: Performance characteristics of the ultra high sensitivity aerosol spectrometer for particles between 55 and 800 nm: Laboratory and field studies, J. Aerosol Sci., 39, 759–769, https://doi.org/10.1016/j.jaerosci.2008.04.007, 2008.
Cantrell, W. and Heymsfield, A. J.: Production of Ice in Tropospheric Clouds: A Review, B. Am. Meteorol. Soc., 86, 795–808, https://doi.org/10.1175/BAMS-86-6-795, 2005.
Choularton, T. W., Latham, J., and Mason, B. J.: A possible mechanism of ice splinter production during riming, Nature, 274, 791–792, https://doi.org/10.1038/274791a0, 1978.
Choularton, T. W., Griggs, D., Y. Humood, B., and Latham, J.: Laboratory studies of riming, and its relation to ice splinter production, Q. J. Roy. Meteor. Soc., 106, 367–374, https://doi.org/10.1002/qj.49710644809, 1980.
Crawford, I., Bower, K. N., Choularton, T. W., Dearden, C., Crosier, J., Westbrook, C., Capes, G., Coe, H., Connolly, P. J., Dorsey, J. R., Gallagher, M. W., Williams, P., Trembath, J., Cui, Z., and Blyth, A.: Ice formation and development in aged, wintertime cumulus over the UK: observations and modelling, Atmos. Chem. Phys., 12, 4963–4985, https://doi.org/10.5194/acp-12-4963-2012, 2012.
Creamean, J. M., Kirpes, R. M., Pratt, K. A., Spada, N. J., Maahn, M., de Boer, G., Schnell, R. C., and China, S.: Marine and terrestrial influences on ice nucleating particles during continuous springtime measurements in an Arctic oilfield location, Atmos. Chem. Phys., 18, 18023–18042, https://doi.org/10.5194/acp-18-18023-2018, 2018.
Crosier, J., Bower, K. N., Choularton, T. W., Westbrook, C. D., Connolly, P. J., Cui, Z. Q., Crawford, I. P., Capes, G. L., Coe, H., Dorsey, J. R., Williams, P. I., Illingworth, A. J., Gallagher, M. W., and Blyth, A. M.: Observations of ice multiplication in a weakly convective cell embedded in supercooled mid-level stratus, Atmos. Chem. Phys., 11, 257–273, https://doi.org/10.5194/acp-11-257-2011, 2011.
Crosier, J., Choularton, T. W., Westbrook, C. D., Blyth, A. M., Bower, K. N., Connolly, P. J., Dearden, C., Gallagher, M. W., Cui, Z., and Nicol, J. C.: Microphysical properties of cold frontal rainbands, Q. J. Roy. Meteor. Soc., 140, 1257–1268, https://doi.org/10.1002/qj.2206, 2014.
Davison, C., Ratvasky, T., and Lilie, L.: Naturally Aspirating Isokinetic Total Water Content Probe: Wind Tunnel Test Results and Design Modifications, in: SAE 2011 International Conference on Aircraft and Engine Icing and Ground Deicing, Chicago, Illinois, 13–17 June 2011.
DeMott, P. J., Hill, T. C. J., McCluskey, C. S., Prather, K. A., Collins, D. B., Sullivan, R. C., Ruppel, M. J., Mason, R. H., Irish, V. E., Lee, T., Hwang, C. Y., Rhee, T. S., Snider, J. R., McMeeking, G. R., Dhaniyala, S., Lewis, E. R., Wentzell, J. J. B., Abbatt, J., Lee, C., Sultana, C. M., Ault, A. P., Axson, J. L., Diaz Martinez, M., Venero, I., Santos-Figueroa, G., Stokes, M. D., Deane, G. B., Mayol-Bracero, O. L., Grassian, V. H., Bertram, T. H., Bertram, A. K., Moffett, B. F., and Franc, G. D.: Sea spray aerosol as a unique source of ice nucleating particles, P. Natl. Acad. Sci. USA, 113, 5797–5803, https://doi.org/10.1073/pnas.1514034112, 2016.
Dong, Y. Y. and Hallett, J.: Droplet accretion during rime growth and the formation of secondary ice crystals, Q. J. Roy. Meteor. Soc., 115, 127–142, https://doi.org/10.1002/qj.49711548507, 1989.
Dong, Y. Y., Oraltay, R. G., and Hallett, J.: Ice particle generation during evaporation, Atmos. Res., 32, 45–53, https://doi.org/10.1016/0169-8095(94)90050-7, 1994.
Dye, J. E. and Hobbs, P. V.: Effect of carbon dioxide on the shattering of freezing water drops, Nature, 209, 464–466, https://doi.org/10.1038/209464a0, 1966.
Dye, J. E. and Hobbs, P. V: The Influence of Environmental Parameters on the Freezing and Fragmentation of Suspended Water Drops, J. Atmos. Sci., 25, 82–96, https://doi.org/10.1175/1520-0469(1968)025<0082:TIOEPO>2.0.CO;2, 1968.
Emersic, C. and Connolly, P. J.: Microscopic observations of riming on an ice surface using high speed video, Atmos. Res., 185, 65–72, https://doi.org/10.1016/j.atmosres.2016.10.014, 2017.
Evans, D. G. and Hutchinson, W. C. A.: The electrification of freezing water droplets and of colliding ice particles, Q. J. Roy. Meteor. Soc., 89, 370–375, https://doi.org/10.1002/qj.49708938108, 1963.
Field, P. R., Wood, R., Brown, P. R. A., Kaye, P. H., Hirst, E., Greenaway, R., and Smith, J. A.: Ice Particle Interarrival Times Measured with a Fast FSSP, J. Atmos. Ocean. Tech., 20, 249–261, https://doi.org/10.1175/1520-0426(2003)020<0249:IPITMW>2.0.CO;2, 2003.
Field, P. R., Heymsfield, A. J., and Bansemer, A.: Shattering and Particle Interarrival Times Measured by Optical Array Probes in Ice Clouds, J. Atmos. Ocean. Tech., 23, 1357–1371, https://doi.org/10.1175/JTECH1922.1, 2006.
Field, P. R., Lawson, P., Brown, P., Lloyd, G., Westbrook, C., Moisseev, D., Miltenberger, A., Nenes, A., Blyth, A., Choularton, T., Connolly, P., Bühl, J., Crosier, J., Cui, Z., Dearden, C., DeMott, P., Flossmann, A. I., Heymsfield, A. J., Huang, Y., and Sullivan, S.: Secondary Ice Production: Current State of the Science and Recommendations for the Future, Meteor. Mon., 58, 7.1–7.20, https://doi.org/10.1175/AMSMONOGRAPHS-D-16-0014.1, 2017.
Fridlind, A. M., Ackerman, A. S., McFarquhar, G., Zhang, G., Poellot, M. R., DeMott, P. J., Prenni, A. J., and Heymsfield, A. J.: Ice properties of single-layer stratocumulus during the Mixed-Phase Arctic Cloud Experiment: 2. Model results, J. Geophys. Res., 112, D24202, https://doi.org/10.1029/2007JD008646, 2007.
Fu, S., Deng, X., Shupe, M. D., and Xue, H.: A modelling study of the continuous ice formation in an autumnal Arctic mixed-phase cloud case, Atmos. Res., 228, 77–85, https://doi.org/10.1016/j.atmosres.2019.05.021, 2019.
Fukuta, N. and Takahashi, T.: The Growth of Atmospheric Ice Crystals: A Summary of Findings in Vertical Supercooled Cloud Tunnel Studies, J. Atmos. Sci., 56, 1963–1979, https://doi.org/10.1175/1520-0469(1999)056<1963:TGOAIC>2.0.CO;2, 1999.
Gagin, A.: Effect of supersaturation on the ice crystal production by natural aerosols, J. Rech. Atmos., 6, 175–185, 1972.
Gagin, A. and Nozyce, N.: The nucleation of ice crystals during the freezing of large supercooled drops, J. Rech. Atmos., 18, 119–129, 1984.
Gardiner, B. A. and Hallett, J.: Degradation of In-Cloud Forward Scattering Spectrometer Probe Measurements in the Presence of Ice Particles, J. Atmos. Ocean. Tech., 2, 171–180, https://doi.org/10.1175/1520-0426(1985)002<0171:DOICFS>2.0.CO;2, 1985.
Gayet, J.-F., Febvre, G., and Larsen, H.: The Reliability of the PMS FSSP in the Presence of Small Ice Crystals, J. Atmos. Ocean. Tech., 13, 1300–1310, https://doi.org/10.1175/1520-0426(1996)013<1300:TROTPF>2.0.CO;2, 1996.
Gonda, T. and Yamazaki, T.: Morfology of ice droxtals growth from supercooled water droplets, J. Cryst. Growth, 45, 66–69, https://doi.org/10.1016/0022-0248(78)90416-5, 1978.
Gonda, T. and Yamazaki, T.: Initial Growth forms of Snow Crystals Growing from Frozen Cloud Droplets, J. Meteorol. Soc. Jpn., 62, 190–192, https://doi.org/10.2151/jmsj1965.62.1_190, 1984.
Griggs, D. and Choularton, T.: Freezing modes of riming drops with application to ice splinter production, Q. J. Roy. Meteor. Soc., 109, 243–253, https://doi.org/10.1002/qj.49710945912, 1983.
Hallett, J.: Experimental Studies of the Crystallization of Supercooled Water, J. Atmos. Sci., 21, 671–682, https://doi.org/10.1175/1520-0469(1964)021<0671:ESOTCO>2.0.CO;2, 1964.
Hallett, J. and Mossop, S. C.: Production of secondary ice particles during the riming process, Nature, 249, 26–28, https://doi.org/10.1038/249026a0, 1974.
Hallett, J., Sax, R. I., Lamb, D., and Murty, A. S. R.: Aircraft measurements of ice in Florida cumuli, Q. J. Roy. Meteor. Soc., 104, 631–651, https://doi.org/10.1002/qj.49710444108, 1978.
Harris-Hobbs, R. L. and Cooper, W. A.: Field Evidence Supporting Quantitative Predictions of Secondary Ice Production Rates, J. Atmos. Sci., 44, 1071–1082, https://doi.org/10.1175/1520-0469(1987)044<1071:FESQPO>2.0.CO;2, 1987.
Heymsfield, A. J.: On measurements of small ice particles in clouds, Geophys. Res. Lett., 34, L23812, https://doi.org/10.1029/2007GL030951, 2007.
Hobbs, P. V: Ice Multiplication in Clouds, J. Atmos. Sci., 26, 315–318, https://doi.org/10.1175/1520-0469(1969)026<0315:IMIC>2.0.CO;2, 1969.
Hobbs, P. V. and Alkezweeny, A. J.: The Fragmentation of Freezing Water Droplets in Free Fall, J. Atmos. Sci., 25, 881–888, https://doi.org/10.1175/1520-0469(1968)025<0881:TFOFWD>2.0.CO;2, 1968.
Hobbs, P. V. and Farber, R.: Fragmentation of ice particles in clouds, J. Rech. Atmos., 6, 245–258, 1972.
Hobbs, P. V. and Rangno, A. L.: Ice Particle Concentrations in Clouds, J. Atmos. Sci., 42, 2523–2549, https://doi.org/10.1175/1520-0469(1985)042<2523:IPCIC>2.0.CO;2, 1985.
Hobbs, P. V. and Rangno, A. L.: Rapid Development of High Ice Particle Concentrations in Small Polar Maritime Cumuliform Clouds, J. Atmos. Sci., 47, 2710–2722, https://doi.org/10.1175/1520-0469(1990)047<2710:RDOHIP>2.0.CO;2, 1990.
Iwabuchi, T. and Magono, C.: A Laboratory Experiment on the Freezing Electrification of Freely Falling Water Droplets, J. Meteorol. Soc. Jpn., 53, 393–401, https://doi.org/10.2151/jmsj1965.53.6_393, 1975.
Jayaratne, E. R., Saunders, C. P. R., and Hallett, J.: Laboratory studies of the charging of soft-hail during ice crystal interactions, Q. J. Roy. Meteor. Soc., 109, 609–630, https://doi.org/10.1002/qj.49710946111, 1983.
Jensen, E. J., Lawson, P., Baker, B., Pilson, B., Mo, Q., Heymsfield, A. J., Bansemer, A., Bui, T. P., McGill, M., Hlavka, D., Heymsfield, G., Platnick, S., Arnold, G. T., and Tanelli, S.: On the importance of small ice crystals in tropical anvil cirrus, Atmos. Chem. Phys., 9, 5519–5537, https://doi.org/10.5194/acp-9-5519-2009, 2009.
Johnson, D. A. and Hallett, J.: Freezing and shattering of supercooled water drops, Q. J. Roy. Meteor. Soc., 94, 468–482, https://doi.org/10.1002/qj.49709440204, 1968.
Jiusto, J. E. and Weickmann, H. K.: Types of snowfall, B. Am. Meteorol. Soc., 54, 1149–1162, https://doi.org/10.1175/1520-0477(1973)054<1148:TOS>2.0.CO;2, 1973
Kachurin, L. G. and Bekryaev, V. I.: Investigation of the electrification of crystallizing water, Dokl. Akad. Nauk. SSSR, 130, 57–60, 1960.
Kanji, Z. A., Ladino, L. A., Wex, H., Boose, Y., Burkert-Kohn, M., Cziczo, D. J., and Krämer, M.: Overview of Ice Nucleating Particles, Meteor. Mon., 58, 1.1–1.33, https://doi.org/10.1175/AMSMONOGRAPHS-D-16-0006.1, 2017.
Keppas, S. C., Crosier, J., Choularton, T. W., and Bower, K. N.: Ice lollies: An ice particle generated in supercooled conveyor belts, Geophys. Res. Lett., 44, 5222–5230, https://doi.org/10.1002/2017GL073441, 2017.
Khain, A., Arkhipov, V., Pinsky, M., Feldman, Y., and Ryabov, Ya.: Rain Enhancement and Fog Elimination by Seeding with Charged Droplets. Part I: Theory and Numerical Simulations, J. Appl. Meteorol., 43, 1513–1529 https://doi.org/10.1175/JAS-3281.1, 2004.
King, W. D. and Fletcher, N. H.: Thermal Shock as an Ice Multiplication Mechanism. Part I. Theory, J. Atmos. Sci., 33, 85–96, https://doi.org/10.1175/1520-0469(1976)033<0085:TSAAIM>2.0.CO;2, 1976a.
King, W. D. and Fletcher, N. H.: Thermal Shock as an Ice Multiplication Mechanism. Part II. Experimental, J. Atmos. Sci., 33, 97–102, https://doi.org/10.1175/1520-0469(1976)033<0097:TSAAIM>2.0.CO;2, 1976b.
Knollenberg, R. G.: Techniques for probing cloud microstructure, in: Clouds their Formation, Optical Properties, and Effects, edited by: Hobbs, P. V. and Deepak, A., Academic Press, New York, 15–91, 1981.
Kobayashi, T.: The growth of snow crystals at low supersaturatios, Philos. Mag., 6, 1363–1370, https://doi.org/10.1080/14786436108241231, 1961.
Koenig, L. R.: The Glaciating Behavior of Small Cumulonimbus Clouds, J. Atmos. Sci., 20, 29–47, https://doi.org/10.1175/1520-0469(1963)020<0029:TGBOSC>2.0.CO;2, 1963.
Koenig, L. R.: Drop Freezing Through Drop Breakup, J. Atmos. Sci., 22, 448–451, https://doi.org/10.1175/1520-0469(1965)022<0448:DFTDB>2.0.CO;2, 1965.
Kolomeychuk, R. J., McKay, D. C., and Iribarne, J. V: The Fragmentation and Electrification of Freezing Drops, J. Atmos. Sci., 32, 974–979, https://doi.org/10.1175/1520-0469(1975)032<0974:TFAEOF>2.0.CO;2, 1975.
Korolev, A.: Reconstruction of the Sizes of Spherical Particles from Their Shadow Images. Part I: Theoretical Considerations, J. Atmos. Ocean. Tech., 24, 376–389, https://doi.org/10.1175/JTECH1980.1, 2007a.
Korolev, A.: Limitations of the Wegener-Bergeron-Findeisen Mechanism in the Evolution of Mixed-phase Clouds, J. Atmos. Sci., 64, 3372–3375, 2007b.
Korolev, A. and Field, P. R.: Assessment of the performance of the inter-arrival time algorithm to identify ice shattering artifacts in cloud particle probe measurements, Atmos. Meas. Tech., 8, 761–777, https://doi.org/10.5194/amt-8-761-2015, 2015.
Korolev, A., Emery, E., and Creelman, K.: Modification and Tests of Particle Probe Tips to Mitigate Effects of Ice Shattering, J. Atmos. Ocean. Tech., 30, 690–708, https://doi.org/10.1175/JTECH-D-12-00142.1, 2013.
Korolev, A., Shashkov, A., and Barker, H.: Calibrations and Performance of the Airborne Cloud Extinction Probe, J. Atmos. Ocean. Tech., 31, 326–345, https://doi.org/10.1175/JTECH-D-13-00020.1, 2014.
Korolev, A., Heckman, I., and Wolde, M.: Observation of Phase Composition and Humidity in: Oceanic Mesoscale Convective Systems, 15th AMS Cloud Physics Conference, Vancouver, BC, 9–13 July 2018, available at: https://ams.confex.com/ams/15CLOUD15ATRAD/webprogram/Paper347111.html (last access: 27 January 2020), 2018
Korolev, A. V. and Isaac, G. A.: Relative humidity in liquid, mixed-phase, and ice clouds, J. Atmos. Sci., 63, 2865–2880, https://doi.org/10.1175/JAS3784.1, 2006.
Korolev, A. V. and Mazin, I. P.: Supersaturation of Water Vapor in Clouds, J. Atmos. Sci., 60, 2957–2974, https://doi.org/10.1175/1520-0469(2003)060<2957:SOWVIC>2.0.CO;2, 2003.
Korolev, A. V., Strapp, J. W., Isaac, G. A., and Nevzorov, A. N.: The Nevzorov Airborne Hot-Wire LWC–TWC Probe: Principle of Operation and Performance Characteristics, J. Atmos. Ocean. Tech., 15, 1495–1510, https://doi.org/10.1175/1520-0426(1998)015<1495:TNAHWL>2.0.CO;2, 1998.
Korolev, A. V., Bailey, M. P., Hallett, J., and Isaac, G. A.: Laboratory and in situ observation of deposition growth of frozen drops, J. Appl. Meteorol., 43, 612–622, https://doi.org/10.1175/1520-0450(2004)043<0612:LAISOO>2.0.CO;2, 2004.
Korolev, A. V., Emery, E. F., Strapp, J. W., Cober, S. G., Isaac, G. A., Wasey, M., and Marcotte, D.: Small Ice Particles in Tropospheric Clouds: Fact or Artifact? Airborne Icing Instrumentation Evaluation Experiment, B. Am. Meteorol. Soc., 92, 967–973, https://doi.org/10.1175/2010BAMS3141.1, 2011.
Korolev, A. V., Emery, E. F., Strapp, J. W., Cober, S. G., and Isaac, G. A.: Quantification of the Effects of Shattering on Airborne Ice Particle Measurements, J. Atmos. Ocean. Tech., 30, 2527–2553, https://doi.org/10.1175/JTECH-D-13-00115.1, 2013.
Krizhevsky, A., Sutskever, I., and Hinton, G. E.: ImageNet Classification with Deep Convolutional Neural Networks, Commun. ACM, 60, 84–90, https://doi.org/10.1145/3065386, 2017.
Ladino, L. A., Korolev, A., Heckman, I., Wolde, M., Fridlind, A. M., and Ackerman, A. S.: On the role of ice-nucleating aerosol in the formation of ice particles in tropical mesoscale convective systems, Geophys. Res. Lett., 44, 1574–1582, https://doi.org/10.1002/2016GL072455, 2017.
Lance, S., Brock, C. A., Rogers, D., and Gordon, J. A.: Water droplet calibration of the Cloud Droplet Probe (CDP) and in-flight performance in liquid, ice and mixed-phase clouds during ARCPAC, Atmos. Meas. Tech., 3, 1683–1706, https://doi.org/10.5194/amt-3-1683-2010, 2010.
Landau, L. D. and Lifshitz, E. M.: Fluid Mechanics, Pergamon Press, Oxford, 6, 539 pp., 1987.
Langham, E. J. and Mason, B. J.: The Heterogeneous and Homogeneous Nucleation of Supercooled Water, P. Roy. Soc. A-Math. Phy., 247, 493–504, https://doi.org/10.1098/rspa.1958.0207, 1958.
Lasher-Trapp, S., Leon, D. C., DeMott, P. J., Villanueva-Birriel, C. M., Johnson, A. V., Moser, D. H., Tully, C. S., and Wu, W.: A Multisensor Investigation of Rime Splintering in Tropical Maritime Cumuli, J. Atmos. Sci., 73, 2547–2564, https://doi.org/10.1175/JAS-D-15-0285.1, 2016.
Latham, J. and Mason, B. J.: Generation of electric charge associated with the formation of soft hail in thunderclouds, P. Roy. Soc. A.-Math. Phy., 260, 237–249, https://doi.org/10.1098/rspa.1961.0052, 1961.
Lauber, A., Schätzle, M., Handmann, P., Kiselev, A., and Leisner, T.: Production of secondary ice particles and splintering of freezing droplets as a potential mechanism of ice multiplication, in: Proceedings of the International Conference on Clouds and Precipitation, Manchester, United Kingdom, 24–29 July 2016, available at: https://bwsyncandshare.kit.edu/dl/fiCNioFokGC4zRCLdPongUXD/ICCP_2016_Kiselev.ppt (last access: 27 January 2020), 2016.
Lauber, A., Kiselev, A., Pander, T., Handmann, P., and Leisner, T.: Secondary Ice Formation during Freezing of Levitated Droplets, J. Atmos. Sci., 75, 2815–2826, https://doi.org/10.1175/JAS-D-18-0052.1, 2018.
Lawson, P., Gurganus, C., Woods, S., and Bruintjes, R.: Aircraft Observations of Cumulus Microphysics Ranging from the Tropics to Midlatitudes: Implications for a “New” Secondary Ice Process, J. Atmos. Sci., 74, 2899–2920, https://doi.org/10.1175/JAS-D-17-0033.1, 2017.
Lawson, R. P.: Effects of ice particles shattering on the 2D-S probe, Atmos. Meas. Tech., 4, 1361–1381, https://doi.org/10.5194/amt-4-1361-2011, 2011.
Lawson, R. P., Baker, B. A., Schmitt, C. G., and Jensen, T. L.: An overview of microphysical properties of Arctic clouds observed in May and July 1998 during FIRE ACE, J. Geophys. Res., 106, 14989–15014, https://doi.org/10.1029/2000JD900789, 2001.
Lawson, R. P., O'Connor, D., Zmarzly, P., Weaver, K., Baker, B., Mo, Q., and Jonsson, H.: The 2D-S (Stereo) Probe: Design and Preliminary Tests of a New Airborne, High-Speed, High-Resolution Particle Imaging Probe, J. Atmos. Ocean. Tech., 23, 1462–1477, https://doi.org/10.1175/JTECH1927.1, 2006.
Lawson, R. P., Woods, S., and Morrison, H.: The microphysics of ice and precipitation development in tropical cumulus clouds, J. Atmos. Sci., 72, 2429–2445, https://doi.org/10.1175/JAS-D-14-0274.1, 2015.
Lloyd, G., Choularton, T. W., Bower, K. N., Gallagher, M. W., Connolly, P. J., Flynn, M., Farrington, R., Crosier, J., Schlenczek, O., Fugal, J., and Henneberger, J.: The origins of ice crystals measured in mixed-phase clouds at the high-alpine site Jungfraujoch, Atmos. Chem. Phys., 15, 12953–12969, https://doi.org/10.5194/acp-15-12953-2015, 2015.
Macklin, W. C.: The Production of Ice Splinters During Riming, Nubila, 3, 30–33, 1960.
Macklin, W. C. and Payne, G. S.: The spreading of accreted droplets, Q. J. Roy. Meteor. Soc., 95, 724–730, https://doi.org/10.1002/qj.49709540606, 1969.
Magono, C. and Lee, C.: Meteorological classification of natural snow crystals, J. Fac. Sci., Hokkaido Univ., Ser. VII, 2, 321–335, 1966.
Magono, C., Fujita, S.-I., and Taniguchi, T.: Unusual Types of Single Ice Crystals Originating from Frozen Cloud Droplets, J. Atmos. Sci., 36, 2495–2501, https://doi.org/10.1175/1520-0469(1979)036<2495:UTOSIC>2.0.CO;2, 1979
Mason, B. J.: The Physics of clouds, Oxford University Press, 2nd edn., 671 pp., 1971.
Mason, B. J. and Maybank, J.: The fragmentation and electrification of freezing water drops, Q. J. Roy. Meteor. Soc., 86, 176–185, https://doi.org/10.1002/qj.49708636806, 1960.
Mazin, I. P., Korolev, A. V., Heymsfield, A., Isaac, G. A., and Cober, S. G.: Thermodynamics of Icing Cylinder for Measurements of Liquid Water Content in Supercooled Clouds, J. Atmos. Ocean. Tech., 18, 543–558, 2001.
McFarquhar, G. M., Um, J., Freer, M., Baumgardner, D., Kok, G. L., and Mace, G.: Importance of small ice crystals to cirrus properties: Observations from the Tropical Warm Pool International Cloud Experiment (TWP-ICE), Geophys. Res. Lett., 34, L13803, https://doi.org/10.1029/2007GL029865, 2007.
Milbrandt, J. A. and Yau, M. K.: A Multimoment Bulk Microphysics Parameterization. Part II: A Proposed Three-Moment Closure and Scheme Description, J. Atmos. Sci., 62, 3065–3081, https://doi.org/10.1175/JAS3535.1, 2005.
Mossop, S. C.: Concentrations of Ice Crystals in Clouds, B. Am. Meteorol. Soc., 51, 474–479, https://doi.org/10.1175/1520-0477(1970)051<0474:COICIC>2.0.CO;2, 1970.
Mossop, S. C.: Some Factors Governing Ice Particle Multiplication in Cumulus Clouds, J. Atmos. Sci., 35, 2033–2037, https://doi.org/10.1175/1520-0469(1978)035<2033:SFGIPM>2.0.CO;2, 1978.
Mossop, S. C.: The mechanism of ice splinter production during riming, Geophys. Res. Lett., 7, 167–169, 1980.
Mossop, S. C.: The Origin and Concentration of Ice Crystals in Clouds, B. Am. Meteorol. Soc., 66, 264–273, https://doi.org/10.1175/1520-0477(1985)066<0264:TOACOI>2.0.CO;2, 1985.
Mossop, S. C. and Hallett, J.: Ice Crystal Concentration in Cumulus Clouds: Influence of the Drop Spectrum, Science, 186, 632–634, https://doi.org/10.1126/science.186.4164.632, 1974.
Mossop, S. C., Ono, A., and Heffernan, K. J.: Studies of ice crystal in natural clouds, Journal de Recherches Atmosphériques, 3, 45–64, 1964.
Mossop, S. C., Cottis, R. E., and Bartlett, B. M.: Ice crystal concentrations in cumulus and stratocumulus clouds, Q. J. Roy. Meteor. Soc., 98, 105–123, https://doi.org/10.1002/qj.49709841509, 1972.
Muchnik, V. M. and Rudko, J. S.: Peculiarities of freezing supercooled water drops, Trudy Ukrainsk Hydro Meteorological Institute, 26, 64–73, 1961.
Nix, N. and Fukuta, N.: Nonsteady-State Kinetics of Droplet Growth in Cloud Physics, J. Atmos. Sci., 31, 1334–1343, https://doi.org/10.1175/1520-0469(1974)031<1334:NSKODG>2.0.CO;2, 1974.
Ono, A.: Some Aspects of the Natural Glaciation Processes in Relatively Warm Maritime Clouds, J. Meteorol. Soc. Jpn., 49A, 845–858, https://doi.org/10.2151/jmsj1965.49A.0_845, 1971.
Ono, A.: Evidence on the nature of ice crystal multiplication processes in natural cloud, J. Rech. Atmos., 6, 399–408, 1972.
Oraltay, R. G. and Hallett, J.: Evaporation and melting of ice crystals: A laboratory study, Atmos. Res., 24, 169–189, https://doi.org/10.1016/0169-8095(89)90044-6, 1989.
Pinsky, M., Khain, A., and Korolev, A.: Theoretical Analysis of Liquid–Ice Interaction in the Unsaturated Environment with Application to the Problem of Homogeneous Mixing, J. Atmos. Sci., 75, 1045–1062, https://doi.org/10.1175/jas-d-17-0228.1, 2018.
Pitter, R. L. and Pruppacher, H. R.: A wind tunnel investigation of freezing of small water drops falling at terminal velocity in air, Q. J. Roy. Meteor. Soc., 99, 540–550, https://doi.org/10.1002/qj.49709942111, 1973.
Price, H. C., Baustian, K. J., McQuaid, J. B., Blyth, A., Bower, K. N., Choularton, T., Cotton, R. J., Cui, Z., Field, P. R., Gallagher, M., Hawker, R., Merrington, A., Miltenberger, A., Neely, R. R., Parker, S. T., Rosenberg, P. D., Taylor, J. W., Trembath, J., Vergara-Temprado, J., Whale, T. F., Wilson, T. W., Young, G., and Murray, B. J.: Atmospheric Ice-Nucleating Particles in the Dusty Tropical Atlantic, J. Geophys. Res.-Atmos., 123, 2175–2193, https://doi.org/10.1002/2017JD027560, 2018.
Qu, Z., Barker, H. W., Korolev, A. V., Milbrandt, J. A., Heckman, I., Bélair, S., Leroyer, S., Vaillancourt, P. A., Wolde, M., Schwarzenböck, A., Leroy, D., Strapp, J. W., Cole, J. N. S., Nguyen, L., and Heidinger, A.: Evaluation of a high-resolution numerical weather prediction model's simulated clouds using observations from CloudSat, GOES-13 and in situ aircraft, Q. J. Roy. Meteor. Soc., 144, 1681–1694, https://doi.org/10.1002/qj.3318, 2018.
Rangno, A. L.: Fragmentation of Freezing Drops in Shallow Maritime Frontal Clouds, J. Atmos. Sci., 65, 1455–1466, https://doi.org/10.1175/2007jas2295.1, 2008.
Rangno, A. L. and Hobbs, P. V.: Production of ice particles in clouds due to aircraft penetrations, J. Clim. Appl. Meteorol., 22, 214–232, https://doi.org/10.1175/1520-0450(1983)022<0214:POIPIC>2.0.CO;2, 1983.
Rosinski, J., Nagamoto, C. T., and Kerrigan, T. C.: Heterogeneous nucleation of water and ice in the transient supersaturation field surrounding a freezing drop, J. Rech. Atmos., 9, 107–117, 1975.
Schwarzenboeck, A., Shcherbakov, V., Lefevre, R., Gayet, J. F., Pointin, Y., and Duroure, C.: Indications for stellar-crystal fragmentation in Arctic clouds, Atmos. Res., 92, 220–228, https://doi.org/10.1016/j.atmosres.2008.10.002, 2009.
Stith, J. L., Avallone, L. M., Bansemer, A., Basarab, B., Dorsi, S. W., Fuchs, B., Lawson, R. P., Rogers, D. C., Rutledge, S., and Toohey, D. W.: Ice particles in the upper anvil regions of midlatitude continental thunderstorms: the case for frozen-drop aggregates, Atmos. Chem. Phys., 14, 1973–1985, https://doi.org/10.5194/acp-14-1973-2014, 2014.
Stott, D. and Hutchinson, W. C. A.: The electrification of freezing water drops, Q. J. Roy. Meteor. Soc., 91, 80–86, https://doi.org/10.1002/qj.49709138711, 1965.
Takahashi, C.: Deformations of Frozen Water Drops and Their Frequencies, J. Meteorol. Soc. Jpn., 53, 402–411, https://doi.org/10.2151/jmsj1965.53.6_402, 1975.
Takahashi, C.: Relation between the Deformation and the Crystalline Nature of Frozen Water Drops, J. Meteorol. Soc. Jpn., 54, 448–453, https://doi.org/10.2151/jmsj1965.54.6_448, 1976.
Takahashi, C. and Mori, M.: Growth of snow crystals from frozen water droplets, Atmos. Res., 82, 385–390, https://doi.org/10.1016/j.atmosres.2005.12.013, 2006.
Takahashi, C. and Yamashita, A.: Deformation and Fragmentation of Freezing Water Drops in Free Fall, J. Meteorol. Soc. Jpn., 47, 431–436, https://doi.org/10.2151/jmsj1965.47.6_431, 1969.
Takahashi, C. and Yamashita, A.: Shattering of Frozen Water Drops in a Supercooled Cloud, J. Meteorol. Soc. Jpn., 48, 373–376, https://doi.org/10.2151/jmsj1965.48.4_373, 1970.
Takahashi, T.: High ice crystal production in winter cumuli over the Japan Sea, Geophys. Res. Lett., 20, 451–454, https://doi.org/10.1029/93GL00613, 1993.
Takahashi, T., Nagao, Y.,and Kushiyama, Y.: Possible High Ice Particle Production during Graupel–Graupel Collisions, J. Atmos. Sci., 52, 4523–4527, https://doi.org/10.1175/1520-0469(1995)052<4523:PHIPPD>2.0.CO;2, 1995.
Uyeda, H. and Kikuchi, K.: Freezing Experiment of Supercooled Water Droplets Frozen by Using Single Crystal Ice, J. Meteorol. Soc. Jpn., Ser. II, 56, 43–51, https://doi.org/10.2151/jmsj1965.56.1_43, 1978.
Vaillant de Guélis, T., Schwarzenböck, A., Shcherbakov, V., Gourbeyre, C., Laurent, B., Dupuy, R., Coutris, P., and Duroure, C.: Study of the diffraction pattern of cloud particles and the respective responses of optical array probes, Atmos. Meas. Tech., 12, 2513–2529, https://doi.org/10.5194/amt-12-2513-2019, 2019.
Vardiman, L.: The Generation of Secondary Ice Particles in Clouds by Crystal–Crystal Collision, J. Atmos. Sci., 35, 2168–2180, https://doi.org/10.1175/1520-0469(1978)035<2168:TGOSIP>2.0.CO;2, 1978.
Wegener, A.: Thermodynamik der Atmosphäre, J. A. Barth, Leipzig, 1911.
Welti, A., Müller, K., Fleming, Z. L., and Stratmann, F.: Concentration and variability of ice nuclei in the subtropical maritime boundary layer, Atmos. Chem. Phys., 18, 5307–5320, https://doi.org/10.5194/acp-18-5307-2018, 2018.
Wex, H., Huang, L., Zhang, W., Hung, H., Traversi, R., Becagli, S., Sheesley, R. J., Moffett, C. E., Barrett, T. E., Bossi, R., Skov, H., Hünerbein, A., Lubitz, J., Löffler, M., Linke, O., Hartmann, M., Herenz, P., and Stratmann, F.: Annual variability of ice-nucleating particle concentrations at different Arctic locations, Atmos. Chem. Phys., 19, 5293–5311, https://doi.org/10.5194/acp-19-5293-2019, 2019.
Wildeman, S., Sterl, S., Sun, C., and Lohse, D.: Fast Dynamics of Water Droplets Freezing from the Outside In, Phys. Rev. Lett., 118, 84101, https://doi.org/10.1103/PhysRevLett.118.084101, 2017.
Williams, A. and Marcotte, D.: Wind measurements on a maneuvering twin-engine turboprop aircraft accounting for flow distortion, J. Atmos. Ocean. Tech., 17, 795–810, 2000.
Wolde, M. and Pazmany, A.: NRC dual-frequency airborne radar for atmospheric research, in: 32nd Int. Conf. on Radar Meteorology, Albuquerque, NM, 22–29 October 2005, Amer. Meteor. Soc., P1R.9, available at: https://ams.confex.com/ams/32Rad11Meso/techprogram/paper_96918.htm (last access: 27 January 2020), 2005.
Woodley, W. L., Henderson, T. J., Vonnegut, B., Gordon, G., Breidenthal, R., and Holle, S. M.: Aircraft-produced ice particles (APIPs) in supercooled clouds and the probable mechanism for their production, J. Appl. Meteorol., 30, 1469–1489, https://doi.org/10.1175/1520-0450(1991)030<1469:APIPIS>2.0.CO;2, 1991.
- Abstract
- Introduction
- Data sets
- Methodology
- Results
- Initial size of secondary ice particles
- Shapes of small secondary ice particles
- Interaction of secondary ice with the cloud environment
- Feasibility of different SIP mechanisms
- Effect of the melting layer
- Conclusions
- Appendix A: Effect of ice particle shattering on CPI measurements
- Data availability
- Author contributions
- Competing interests
- Acknowledgements
- Financial support
- Review statement
- References


