the Creative Commons Attribution 4.0 License.
the Creative Commons Attribution 4.0 License.
 | 12 Nov 2020
Do alternative inventories converge on the spatiotemporal representation of spring ammonia emissions in France?
Audrey Fortems-Cheiney
Gaëlle Dufour
Karine Dufossé
Florian Couvidat
Jean-Marc Gilliot
Guillaume Siour
Matthias Beekmann
Gilles Foret
Frederik Meleux
Lieven Clarisse
Pierre-François Coheur
Martin Van Damme
Cathy Clerbaux
Sophie Génermont
Agriculture is the main source of ammonia (NH3) in France, an important gaseous precursor of atmospheric particulate matter (PM). National and global emission inventories are known to have difficulty representing the large spatial and temporal variability inherent to atmospheric NH3. In this study, we compare NH3 emissions in France during spring 2011 from one reference inventory, the TNO inventory, and two alternative inventories that account in different manners for both the spatial and temporal variabilities of the emissions: (i) the NH3SAT satellite-derived inventory based on IASI NH3 columns and (ii) the CADASTRE-CIT inventory that combines NH3 emissions due to nitrogen fertilization calculated with the mechanistic model VOLT'AIR on the database of the CADASTRE_NH3 framework and other source emissions from the CITEPA. The total spring budgets, from March to May 2011, at the national level are higher when calculated with both alternative inventories than with the reference, the difference being more marked with CADASTRE-CIT. NH3SAT and CADASTRE-CIT inventories both yield to large NH3 spring emissions due to fertilization on soils with high pH in the northeastern part of France (65 and 135 kt NH3, respectively, vs. 48 kt NH3 for TNO-GEN), while soil properties are not accounted for by the TNO-GEN methodology. For the other parts of France, the differences are smaller. The timing of fertilization and associated ammonia emissions is closely related to the nitrogen requirements and hence the phenological stage of the crops, and therefore to the crop year's specific weather conditions. Maximum emissions are observed in March for 2011 for some regions for both alternative inventories, while April is the period with maximum emissions for the reference inventory regardless of the region or the year. Comparing the inventories at finer temporal resolutions, typically at daily scale, large differences are found. The convergence of alternative, independent and complementary methods on the spatiotemporal representation of the spring NH3 emissions, particularly over areas where the contribution of mineral fertilizer spreading to the spring budget is strong, encourages further developments in both prospective complementary directions, as this will help improve national NH3 emission inventories.
- Article
(1126 KB) - Full-text XML
- BibTeX
- EndNote


France is a major crop producer and a major exporter of agricultural and food products. In 2014, it produced 2 %, 4 %, 5 %, 8 %, 8 % and 14 % of the global production of maize, sunflower, wheat, barley, rapeseed and sugar beet, respectively (Food and Agriculture Organization of the United Nations FAO; Schauberger et al., 2018). Through this food cultivation and also due to animal husbandry, agriculture is the main source of ammonia (NH3) in the country. As an important gaseous precursor of particulate pollution, harmful to human life (Lelieveld et al., 2015; WHO, 2016), ammonia plays an important role in the regulation of inorganic aerosol concentrations (Erisman and Schaap, 2004, Bauer et al., 2016) and contributes to N deposition and potential exceedance of critical loads of ecosystems (Erisman et al., 2007; EEA European Environment Agency, 2014). In order to limit air pollution, also responsible for acidification and eutrophication, the new European National Emission Ceilings Directive 2016/2284, replacing the Directive 2001/81/EC, has now set ambitious national reduction commitments for ammonia. Ammonia emissions indeed have to be reduced by 19 % in 2030, compared with the 2005 levels (OJEU, 2016).
At the European scale, total NH3 emissions are provided by the European Monitoring and Evaluation Program (EMEP) (Vestreng, 2005) or by the TNO-MACCIII (Kuenen et al., 2014) inventories that rely on national annual declarations and estimates of emission factors. Emissions are accounted for without separating fertilization and livestock. These reference inventories are widely used by the scientific community to study the impact of pollutant emissions on the chemical composition of the troposphere and on air quality. Nevertheless, uncertainties on the quantification of the NH3 emissions are usually estimated to be between 100 % and 300 % of the annual budgets in the reference inventories (EMEP/EEA, 2016; Kuenen et al., 2014). In addition, the temporal and spatial variability may not be well represented in the reference inventories, as the temporal profiles used do not account for meteorology, soil properties and other local conditions. Moreover, fertilizer spreading is of particular interest, as these are applied during small periods, especially during a few weeks at the end of winter and early spring. However, the exact timing of fertilizer spreading is difficult to predict, as it depends on agricultural practices and meteorological conditions, which is not taken into account in the temporal disaggregation of the reference emission inventories. Both the inaccurate temporal resolutions and the misrepresentation of the spreading emissions largely explain the difficulty encountered by models to represent seasonal or daily patterns of NH3 concentrations (Menut et al., 2012), and consequently particulate matter levels (Fortems-Cheiney et al., 2016).
To reduce these uncertainties, a better quantification of agricultural ammonia emissions and their temporal and spatial evolution is necessary. In particular, one of the challenges is to capture the right timing of fertilizer spreading at the weekly or even at the daily scale in order to reflect the effect of environmental and agronomic conditions on ammonia emissions. To this end, mechanistic models taking into account meteorological conditions, soil properties and agricultural practices have been developed (e.g., for Denmark (Skjøth et al., 2004), for the UK (Hellsten et al., 2008), and for mineral fertilization in springtime in France, Hamaoui-Laguel et al., 2014). Limitations for such approaches come from the fact that detailed agricultural data needed as input for such models are not available for most of the European countries. Moreover, agricultural practices of a specific country cannot be extrapolated to another country (Skjøth et al., 2011).
As an alternative to direct emission modeling, attempts have been made to constrain ammonia emissions through inverse approaches, based on ammonium wet deposition data (Paulot et al., 2014) or on satellite-observed atmospheric ammonia distributions, e.g., from the Tropospheric Emission Spectrometer (TES) (Zhu et al., 2013; Zhang et al., 2018), from the Infrared Atmospheric Sounding Interferometer (IASI) (Fortems-Cheiney et al., 2016; Van Damme et al., 2018; Adams et al., 2019) or from the Cross-track Infrared Sounder (CrIS) (Adams et al., 2019; Dammers et al., 2019). In principle, such emission estimates can be available shortly after observation. The advantage of satellite-derived estimates is also that these can be derived globally, at a high temporal scale (e.g., daily scale under clear sky). The downside of these, however, is that they do not provide information on the underlying sources of the emissions (fertilizers vs. husbandry), or for example the date of fertilization, the type of fertilizers used, the fertilization rates, etc., that could be important for the regulation of NH3 emissions.
In this context, we compare ammonia emissions in France from inventories using the different approaches mentioned above: (i) the reference, in the sense that this is the method currently used, hereafter called TNO-GEN, is the European inventory based on the annual budgets provided by the TNO-MACCIII inventory (Kuenen et al., 2014) and on seasonal profiles from GENEMIS (Ebel et al., 1997); (ii) a first alternative inventory, hereafter called NH3SAT, is based on a top-down approach starting from the IASI-derived NH3 columns; (iii) the other alternative inventory, hereafter called CADASTRE-CIT, is based on a bottom-up approach quantifying NH3 emissions due to nitrogen fertilization combining spatiotemporal data and calculations performed within the CADASTRE_NH3 framework with the mechanistic model VOLT'AIR (Ramanantenasoa et al., 2018; Génermont et al., 2018) completed with livestock and other source emissions from the French Interprofessional Technical Centre for Studies on Air Pollution (CITEPA). This study aims at assessing the potential contribution of better spatial and temporal representation of fertilization-related ammonia emissions to the quality of ammonia emission inventories. The improvement is assessed in terms of total budget, spatial distribution and timing of the emissions. The study period, spring 2011 (from 1 March to 31 May 2011), was chosen following three criteria. Firstly, because at the time of the study, the last French agricultural data were available from AGRESTE (AGRESTE, 2014) for the agricultural year 2010–2011, allowing the application of the CADASTRE_NH3 framework for the quantification of the spatiotemporal distribution of NH3 emissions due to nitrogen fertilization for this crop year (Ramanantenasoa et al., 2018; Génermont et al., 2018). Secondly, ammonia emissions are enhanced during spring in accordance with crop requirements (Skjøth et al., 2004; Ramanantenasoa et al., 2018; Génermont et al., 2018). Finally, unlike autumn and winter months, the NH3 spring levels are detectable with a better confidence in the IASI satellite observations (Viatte et al., 2020), allowing the extension of the preliminary work of Fortems-Cheiney et al. (2016) to deduce NH3 emissions from the IASI satellite instrument.
The three inventories and methods to build them used for this study are presented in Sect. 2, and the results of the comparison are given and discussed in Sect. 3.
Table 1Main characteristics of the different compared inventories before their aggregation and disaggregation for the inter-comparison.
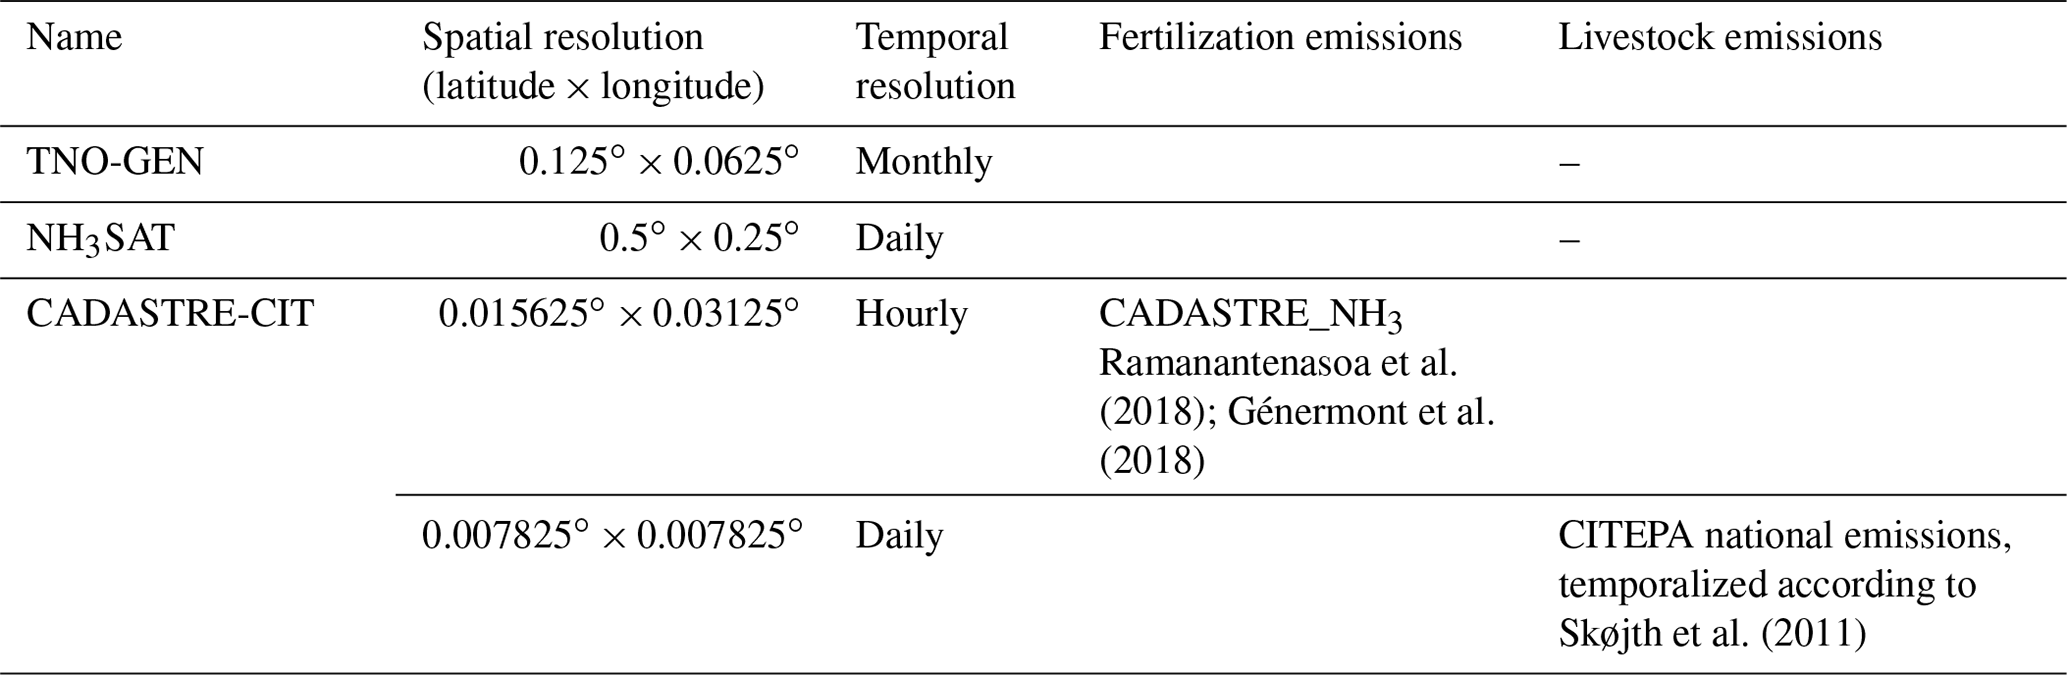
The three inventories TNO-GEN, NH3SAT and CADASTRE-CIT compared in this study are described in Table 1 and in the following sections. It is worth noting that only the CADASTRE-CIT inventory provides information on the respective contribution of fertilization and livestock emissions. The spatial and temporal resolutions of the inventories are also shown in Table 1.
The inter-comparison is made at the 0.5∘ (longitude) × 0.25∘ (latitude) resolution. The outputs of the TNO-GEN and the CADASTRE-CIT inventories could have consequently been aggregated or disaggregated.
2.1 TNO-GEN
In this study, TNO-GEN combines the annual budgets provided by the TNO-MACCIII inventory and the seasonal profiles to deduce the monthly variability of NH3 emissions. This inventory is based on official annual emission data submitted by countries to EMEP/CEIP (European Monitoring and Evaluation Programme/Centre on Emission Inventories and Projections) for air pollutants. It is the update of the TNO-MACCII inventory (Kuenen et al., 2014). It is an inventory at 0.125∘ × 0.0625∘ resolution providing annual emissions of NH3 from the agricultural sector, without separating the contributions from fertilization and livestock. Hereafter, we use the TNO-MACIII emissions of the year 2011. The seasonal profile of these emissions is prescribed according to the typical national factors provided by GENEMIS. This seasonal temporal profile used for the temporalization of emissions – the same one applied to the entire country – leads to a maximum in NH3 emissions systematically in April over France (Ebel et al., 1997). The emissions remain constant between days in each month and between hours in each day.
2.2 NH3SAT
As a first alternative, a mass-balance approach, which is a common method for the quantification of the surface fluxes of short-lived species (Palmer et al., 2003; Jaeglé et al., 2004; Boersma et al., 2008; Lin et al., 2010) was set up. We used it to deduce NH3 emissions from differences between NH3 total columns observed by the IASI instrument and simulated by the CHIMERE regional chemical transport model (CTM) using the TNO-GEN inventory as inputs data.
2.2.1 The regional CTM CHIMERE
CHIMERE simulates concentrations of gaseous and particulate chemical species (Menut et al., 2013; Mailler et al., 2017). For this study, we used the CHIMERE version 2013a. The horizontal resolution is given as follows: 0.5∘ × 0.25∘ over 32∘ N–70∘ N, 17∘ W–40∘ E, including 115 (longitude) × 53 (latitude) grid cells. The vertical grid contains 17 layers from the surface to 200 hPa. This model is driven by the European Centre for Medium-Range Weather Forecasts global meteorological fields (Owens and Hewson, 2018). Climatological values from the LMDz-INCA global model (Szopa et al., 2008) are used to prescribe concentrations at the lateral and top boundaries and the initial atmospheric composition in the domain. For inorganic species, aerosol thermodynamic equilibrium is achieved using the ISORROPIA model (Nenes et al., 1998).
As in most of the models in the world, the parameterization of NH3 dry deposition is unidirectional in CHIMERE. The parameterization of a bidirectional exchange with surfaces in Wichink Kruit et al. (2012) increased their yearly mean modeled LOTOS-EUROS European ammonia concentrations almost everywhere, and particularly over agricultural source areas. However, Zhu et al. (2015), with the Goddard Earth Observing System-Chemistry (GEOS-Chem) global CTM, estimated a decrease in NH3 European concentrations in April, when the inclusion of a compensation point for vegetation is included. Further work needs to be done to better investigate the sensitivity of NH3 concentrations to the deposition. Nevertheless, without such parameterization for bi-directional exchange, Azouz et al. (2019) assessed that regional models such as CHIMERE usually operating with large grid cell sizes simulate quite well the average NH3 dry deposition flux over a large domain of simulation.
The evaluation of CHIMERE NH3 and concentrations should be done against NH3 (as done in Fortems-Cheiney et al., 2016) and measurements. Nevertheless, to our knowledge, there is no available NH3 measurement over France for the focused period here. There is interpretable surface measurements at only one site, making the interpretation of the results difficult. NH3 and comparisons during other periods are also scarce. For instance, Tuccella et al. (2019) compared CHIMERE simulated and observed a the Cabaux supersite and found average concentrations for May 2008 of 1.3 µg m3 for both, with a correlation coefficient of 0.52. For the Paris agglomeration between September 2009 and 2010, the modeled regional burden was 1.8 µg m3 while the modeled one was 1.6 µg m3 (Petetin et al., 2016). From June to September 2010, 83 % of modeled total NHx was gaseous, while in the model, it was only 50 %; coherent with this, NH3 was underestimated especially during warmer days. Thus, it is concluded for one site and season that particulate has a low to medium impact on NH3.
2.2.2 The IASI observations
We use data from the IASI-A instrument, flying on a low Sun-synchronous polar orbit aboard the Metop satellite since October 2006, with Equator crossing times of 09:30 (descending mode) and 21:30 (ascending mode) local sidereal time (LST) (Clerbaux et al., 2009, Clarisse et al., 2009). The spatial resolution of its observations is about 12 km × 12 km at nadir. The algorithm used to retrieve NH3 columns from the radiance spectra is described in Van Damme et al. (2017). Several improvements have been introduced since the description of Van Damme et al. (2014) and the version v1 used in our previous study (Fortems-Cheiney et al., 2016). In this study, we use the reanalyzed dataset ANNI-NH3-v2.2R, relying on ERA-Interim meteorological input data from the European Centre for Medium-Range Weather Forecasts (ECMWF) rather than the operationally provided Eumetsat IASI Level 2 (L2) data used for the standard near-real-time version (Van Damme et al., 2017). We only consider land measurements from the morning overpass, as IASI is more sensitive at this time to the boundary layer, owing to more favorable thermal conditions (Clarisse et al., 2010, Van Damme et al., 2014).
The IASI total columns are averaged into “super-observations” (average of all IASI data within the 0.5∘ × 0.25∘ resolution and for the given CHIMERE physical time step of about 5–10 min). As suggested by Van Damme et al. (2017), we no longer use weighted averages for this purpose. We performed a sensitivity test by selecting the IASI pixels for which the retrieval error does not exceed 100 %: the results of the temporal and spatial variability of the NH3 French emissions presented in Sect. 3 did not significantly change, showing the robustness of the IASI NH3 product (not shown).

Figure 1(a–c) Monthly means of IASI “super-observations” for (a) March 2011, (b) April 2011 and (c) May 2011. Units are molecules per square centimeter (). (d–f) Total number of IASI super-observations per month in (d) March 2011, (e) April 2011 and (f) May 2011.
The resulting monthly means of IASI NH3 columns from March to May 2011 are shown in Fig. 1a–c. The spatiotemporal variability – with the highest values over northeastern France in March, and over northwestern France in April – is confirmed by the IASI 10-year and by the CrIS 5-year monthly means shown in Viatte et al. (2020). Note that the potential of IASI to provide information at high temporal resolution, up to daily scale, can be hampered by the cloud coverage as only observations with a cloud coverage lower than 10 % are delivered (Van Damme et al., 2017). To evaluate the impact of this limitation, the number of IASI super-observations used to calculate these monthly means, which represents the number of days over a month covered by IASI, is shown in Fig. 1d–f. On average, more than half of the month is sampled by IASI during spring, except in May in the northwestern part of France. The regions showing large IASI NH3values are consequently well sampled.
2.2.3 Deducing NH3 SAT emissions
Relative differences between simulated columns by the CHIMERE regional CTM (described in Sect. 2.2.1, using the TNO-GEN emissions for the year 2011, described in Sect. 2.1) and observed IASI total columns (described in Sect. 2.2.2) are applied as a corrective factor to the reference emissions at daily and at grid-cell resolutions over France, from February to May 2011. As IASI “super-observations” provide one piece of information per day, the diurnal time profile of reference emissions cannot be improved: we apply the same daily correction factor to all hourly NH3 emissions. When IASI is not available (i.e., observations with a cloud coverage higher than 10 %), the correction is not applied and the emissions remain equal to the TNO-GEN ones. To compare the emissions with the CADASTRE-CIT inventory, and their respective simulations with CHIMERE, the correction is only applied over France here.
With the mass-balance approach, the transport to neighboring cells is assumed to be negligible following Palmer et al. (2003). This approach has been debated by Turner et al. (2012), who found that non-local sources contribute substantially to columns of short-lived species. Li et al. (2019) evaluated the ability of both a mass-balance approach and a variational assimilation to recover known NH3 emissions at different spatial resolutions. At a 2∘ × 2.5∘ resolution, they found that both methods yielded similar values. At a 0.25∘ × 0.3125∘, the mass-balance approach led to values about 20 % higher compared to the variational ones. With our 0.5∘ × 0.25∘ resolution, the use of a mass-balance approach would lead to additional errors of less than about 20 % for the quantification of NH3 emissions. This uncertainty is acceptable and much lower than the uncertainty existing in the annual and national budgets provided by emission inventories (EMEP/EEA, 2016). In this context, we choose to perform such a mass-balance approach to deduce NH3 emissions from IASI ANNI-NH3-v2.2R super-observations. Additional uncertainty comes from the IASI observations. The IASI minimum detection limit is about 2–3 ppbv (∼ 4–6.1015 ) (Clarisse et al., 2010). The signal-to-noise ratio therefore presents better performance for regions with high local concentrations (e.g., northern part of France, Fig. 1) than over low local concentration areas (e.g., southern parts of France, Fig. 1). There is no evaluation available yet for the IASI ANNI-NH3-v2.2R product used here.
2.3 CADASTRE-CIT
As a second alternative, a bottom-up approach was set up based on the finest national inventories available for anthropogenic sources of ammonia. The CADASTRE_NH3 framework provides such an inventory for organic and mineral fertilization practices. This is, however, not the case for the other anthropogenic sources. For livestock emissions, with the exception of the stage of effluent spreading in the field, the less detailed inventory of the CITEPA is used. To meet the objectives of better specialization and temporalization, specific procedures are applied. These inventories are completed by the TNO-GEN inventory for the emissions of the other sectors.
2.3.1 Fertilization emissions from CADASTRE_NH3
CADASTRE_NH3 was implemented in order to represent in a realistic way spatiotemporal variability of French NH3 emissions due to mineral and organic N fertilization and is fully described in Ramanantenasoa et al. (2018) and in Génermont et al. (2018). It has been constructed through the combined use of two types of resources: the process-based VOLT'AIR model and geo-referenced and temporally explicit databases for soil properties, meteorological conditions and N fertilization.
VOLT'AIR is a 1D process-based model predicting NH3 emissions from N fertilizers on bare soils, from physical, chemical and biological processes (Le Cadre, 2004; Garcia et al., 2012). It incorporates current knowledge on NH3 volatilization after application of the main types of organic manure and mineral N fertilizers in the field. It takes into account the major factors known to influence NH3 volatilization in the field, i.e., soil properties, weather conditions, cultural practices, and properties of mineral fertilizers and organic products. It runs at an hourly time step at the field scale for a period of several weeks, thus covering the entire volatilization duration of fertilization events.
Local features are attributed to each simulation unit, the small agricultural regions (SARs): local weather conditions (SAFRAN, Météo-France); the dominant soil type of the SAR from the European Soil Data Center (ESDC), with soil properties provided by the Harmonized World Soil Database (HWSD) of the Food and Agriculture Organization (FAO); areas cultivated in the crop year 2010–2011 per crop per region, derived from the European Land Parcel Identification System (LPIS, Common Agricultural Policy (CAP) regulations); and nitrogen fertilization management practices, derived from data of the national AGRESTE survey of cultural practices for arable crops and grassland (Department of Statistics and Forecasting of the French Ministry of Agriculture) (AGRESTE, 2014). All input data required by VOLT'AIR are geographically overlaid and intersected with a geographical information system to generate input combinations in each SAR. Each input combination is used as the input data for a virtual 300 m × 300 m field for a simulation using VOLT'AIR. Exact times and dates of fertilizations are required to run VOLT'AIR, but for the sake of robustness, the statistical analysis of the survey data has been performed on the basis of 2-week intervals for the date of fertilization. Fertilizations are thus randomly distributed within these 2-week intervals in proportion to their respective representation following Ramanantenasoa et al. (2018). Each simulation of NH3 emissions is run at an hourly time step for a period of 2 months, starting 1 month before the fertilization in order to calculate soil water content at the time of application, and ending one month after fertilization, in order to cover the whole volatilization event.
About 160 000 runs with the VOLT'AIR model have been performed over the crop year 2010–2011 to produce ammonia emissions per hour, per hectare, per crop type, per SAR. Emissions can be aggregated at different spatial and temporal scales. At the spatial scale, they are weighted with the contribution of (i) each N fertilization management applied to each crop in each SAR and (ii) the area of the crop cultivated in the SAR. A procedure allows ammonia emissions to be produced at the required grid scale for the inventory comparison: it is based on cultivated areas for each crop as the key of desegregation-reaggregation from the SAR to the 0.015625∘ × 0.03125∘ grid. At the temporal scale, emissions are aggregated over daily, weekly or monthly bases for the sake of comparison with TNO-GEN and NH3SAT inventories. Volatilization taking place over several days, from a few days to several weeks, one fertilization in one field contributes to ammonia emissions over several days or weeks. Weather condition effects on overall ammonia emissions are thus the result of both their effects on fertilization timing and their effects on volatilization intensity and dynamics over 30 d from fertilizer application.
As they are not available in the agricultural practice survey, N fertilizations of vegetables, fruits and vines are not accounted for in CADASTRE_NH3: their contribution is minor for France overall, only accounting for 5 % of the total agricultural area (AGRESTE, 2010), but is important in particular regions. As the agricultural practice survey does not provide information over Corsica, this inventory is completed by the TNO-GEN inventory over this region.
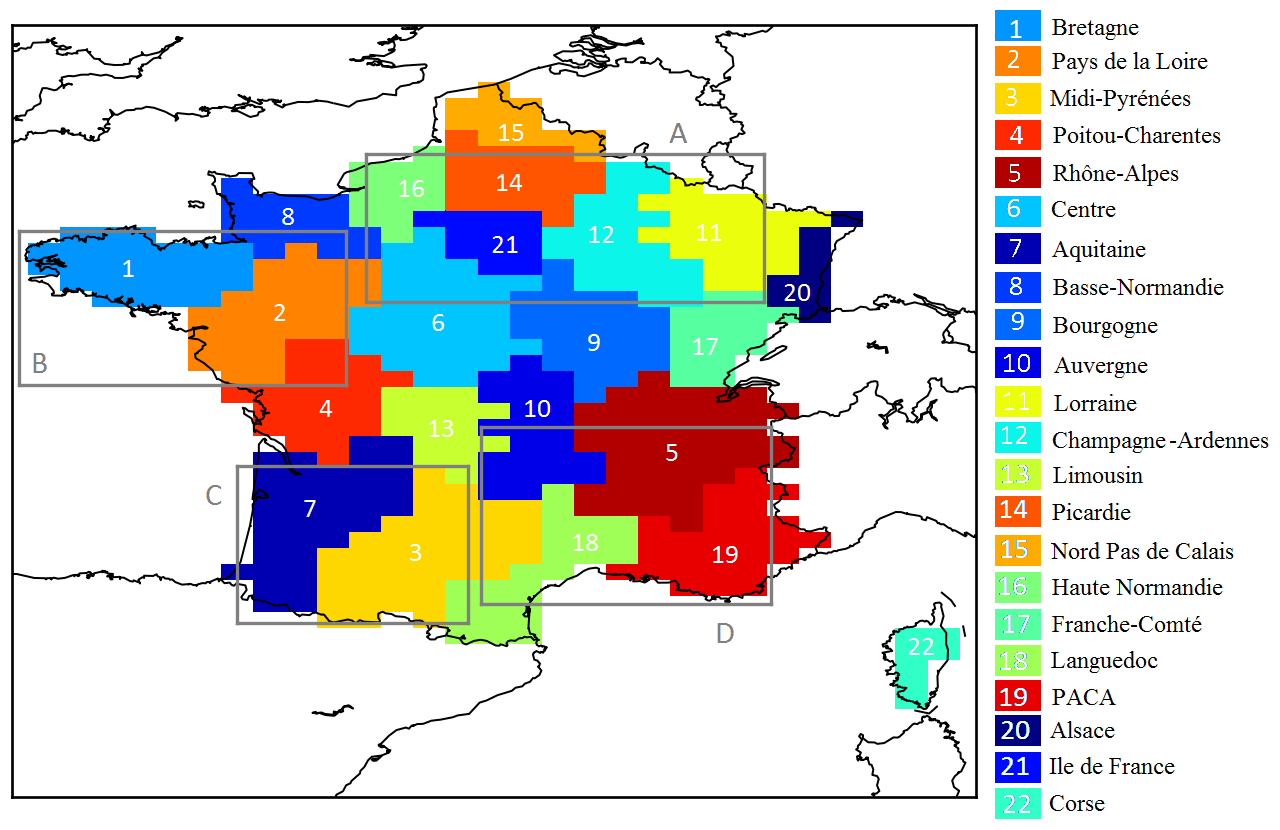
Figure 2Localization and names of the different French regions as taken into account in this study. The regions are listed according to the TNO-GEN annual budget, in descending order. The grey boxes A–D describe the domains we call the northeastern, northwestern, southeastern and southwestern parts of France, respectively, in the paper.
2.3.2 Livestock emissions
As for the TNO-GEN inventory, French NH3 emissions from livestock for the CADASTRE-CIT inventory are generated by using annual national emissions provided by CITEPA for 2011 (Fig. 3a). Nevertheless, here these emissions have been spatially distributed differently than for the TNO-GEN inventory. This has been done by using the FAO Gridded Livestock of the World database with a resolution of 30 arcsec. The temporalization of the emissions has been performed as a function of temperature and wind speed with the parameterizations of Skøjth et al. (2011) for the different subsectors.
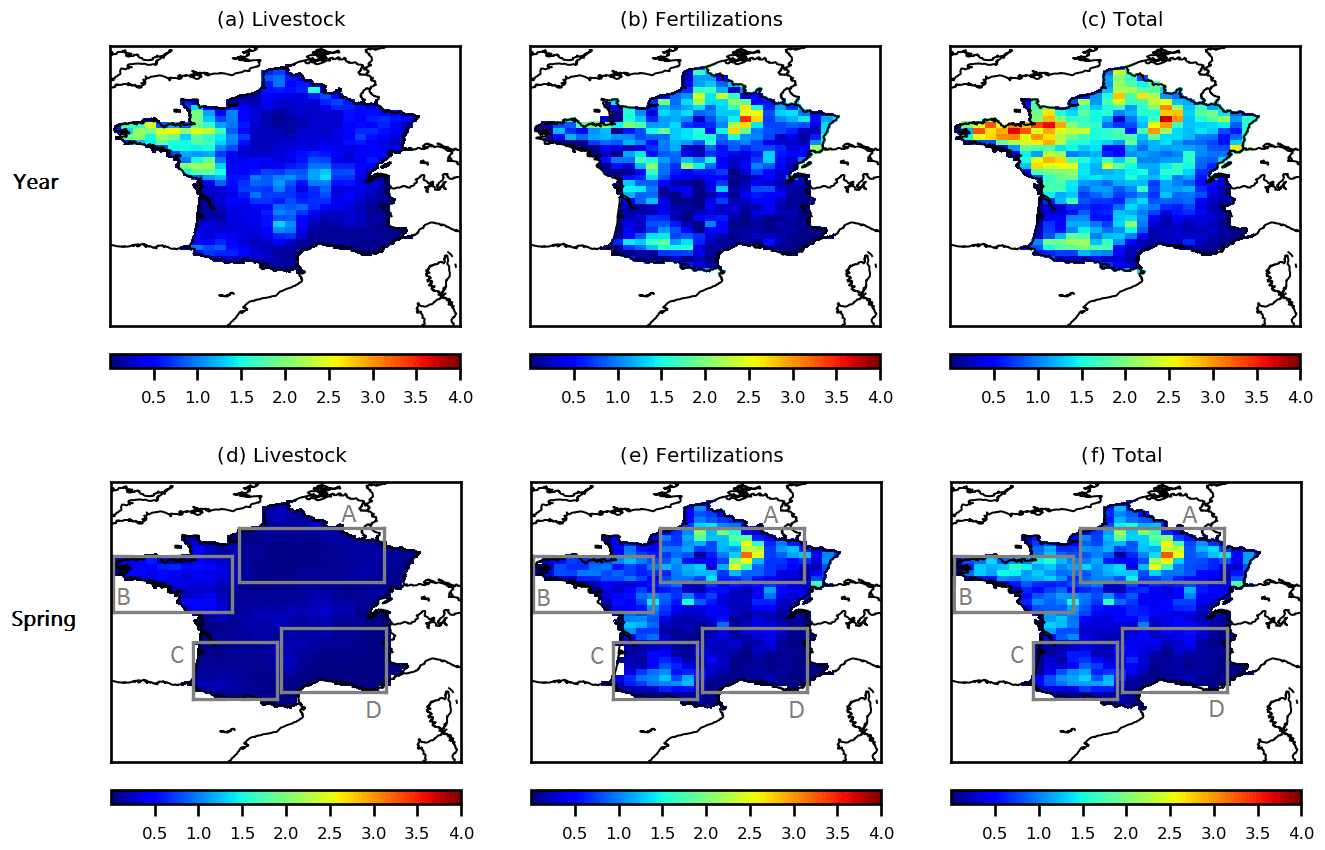
Figure 3(a–c) Yearly NH3 emissions due to (a) livestock husbandry and manure storage, (b) N fertilization (organic and mineral), and (c) all sources in the CADASTRE-CIT inventory, in kilotons of NH3 (kt NH3). (d–f) The same for spring NH3 emissions, from March to May 2011.
First, we analyze the different contributions of livestock and of fertilization to the spring budget in the CADASTRE-CIT inventory. Then, the comparison of the two alternative inventories NH3SAT and CADASTRE-CIT versus the reference inventory TNO-GEN and their inter-comparison are made at different temporal and spatial resolutions. We evaluate the inventories at the national scale and at the scale of the different French administrative regions (the administrative division in France on level 2 of the unified NUTS territory classification, NUTS2, shown in Fig. 2). We also analyze their spatial variability at the 0.5∘ (longitude) × 0.25∘ (latitude) resolution in order to draw a first picture of the consistency of the inventories in terms of the spring NH3 total budget and to identify regions of interest. Finally, we focus on the temporal variability of the identified regions and discuss the agricultural practices that can influence the variability but also down to which temporal resolution the comparison of the inventories is relevant.
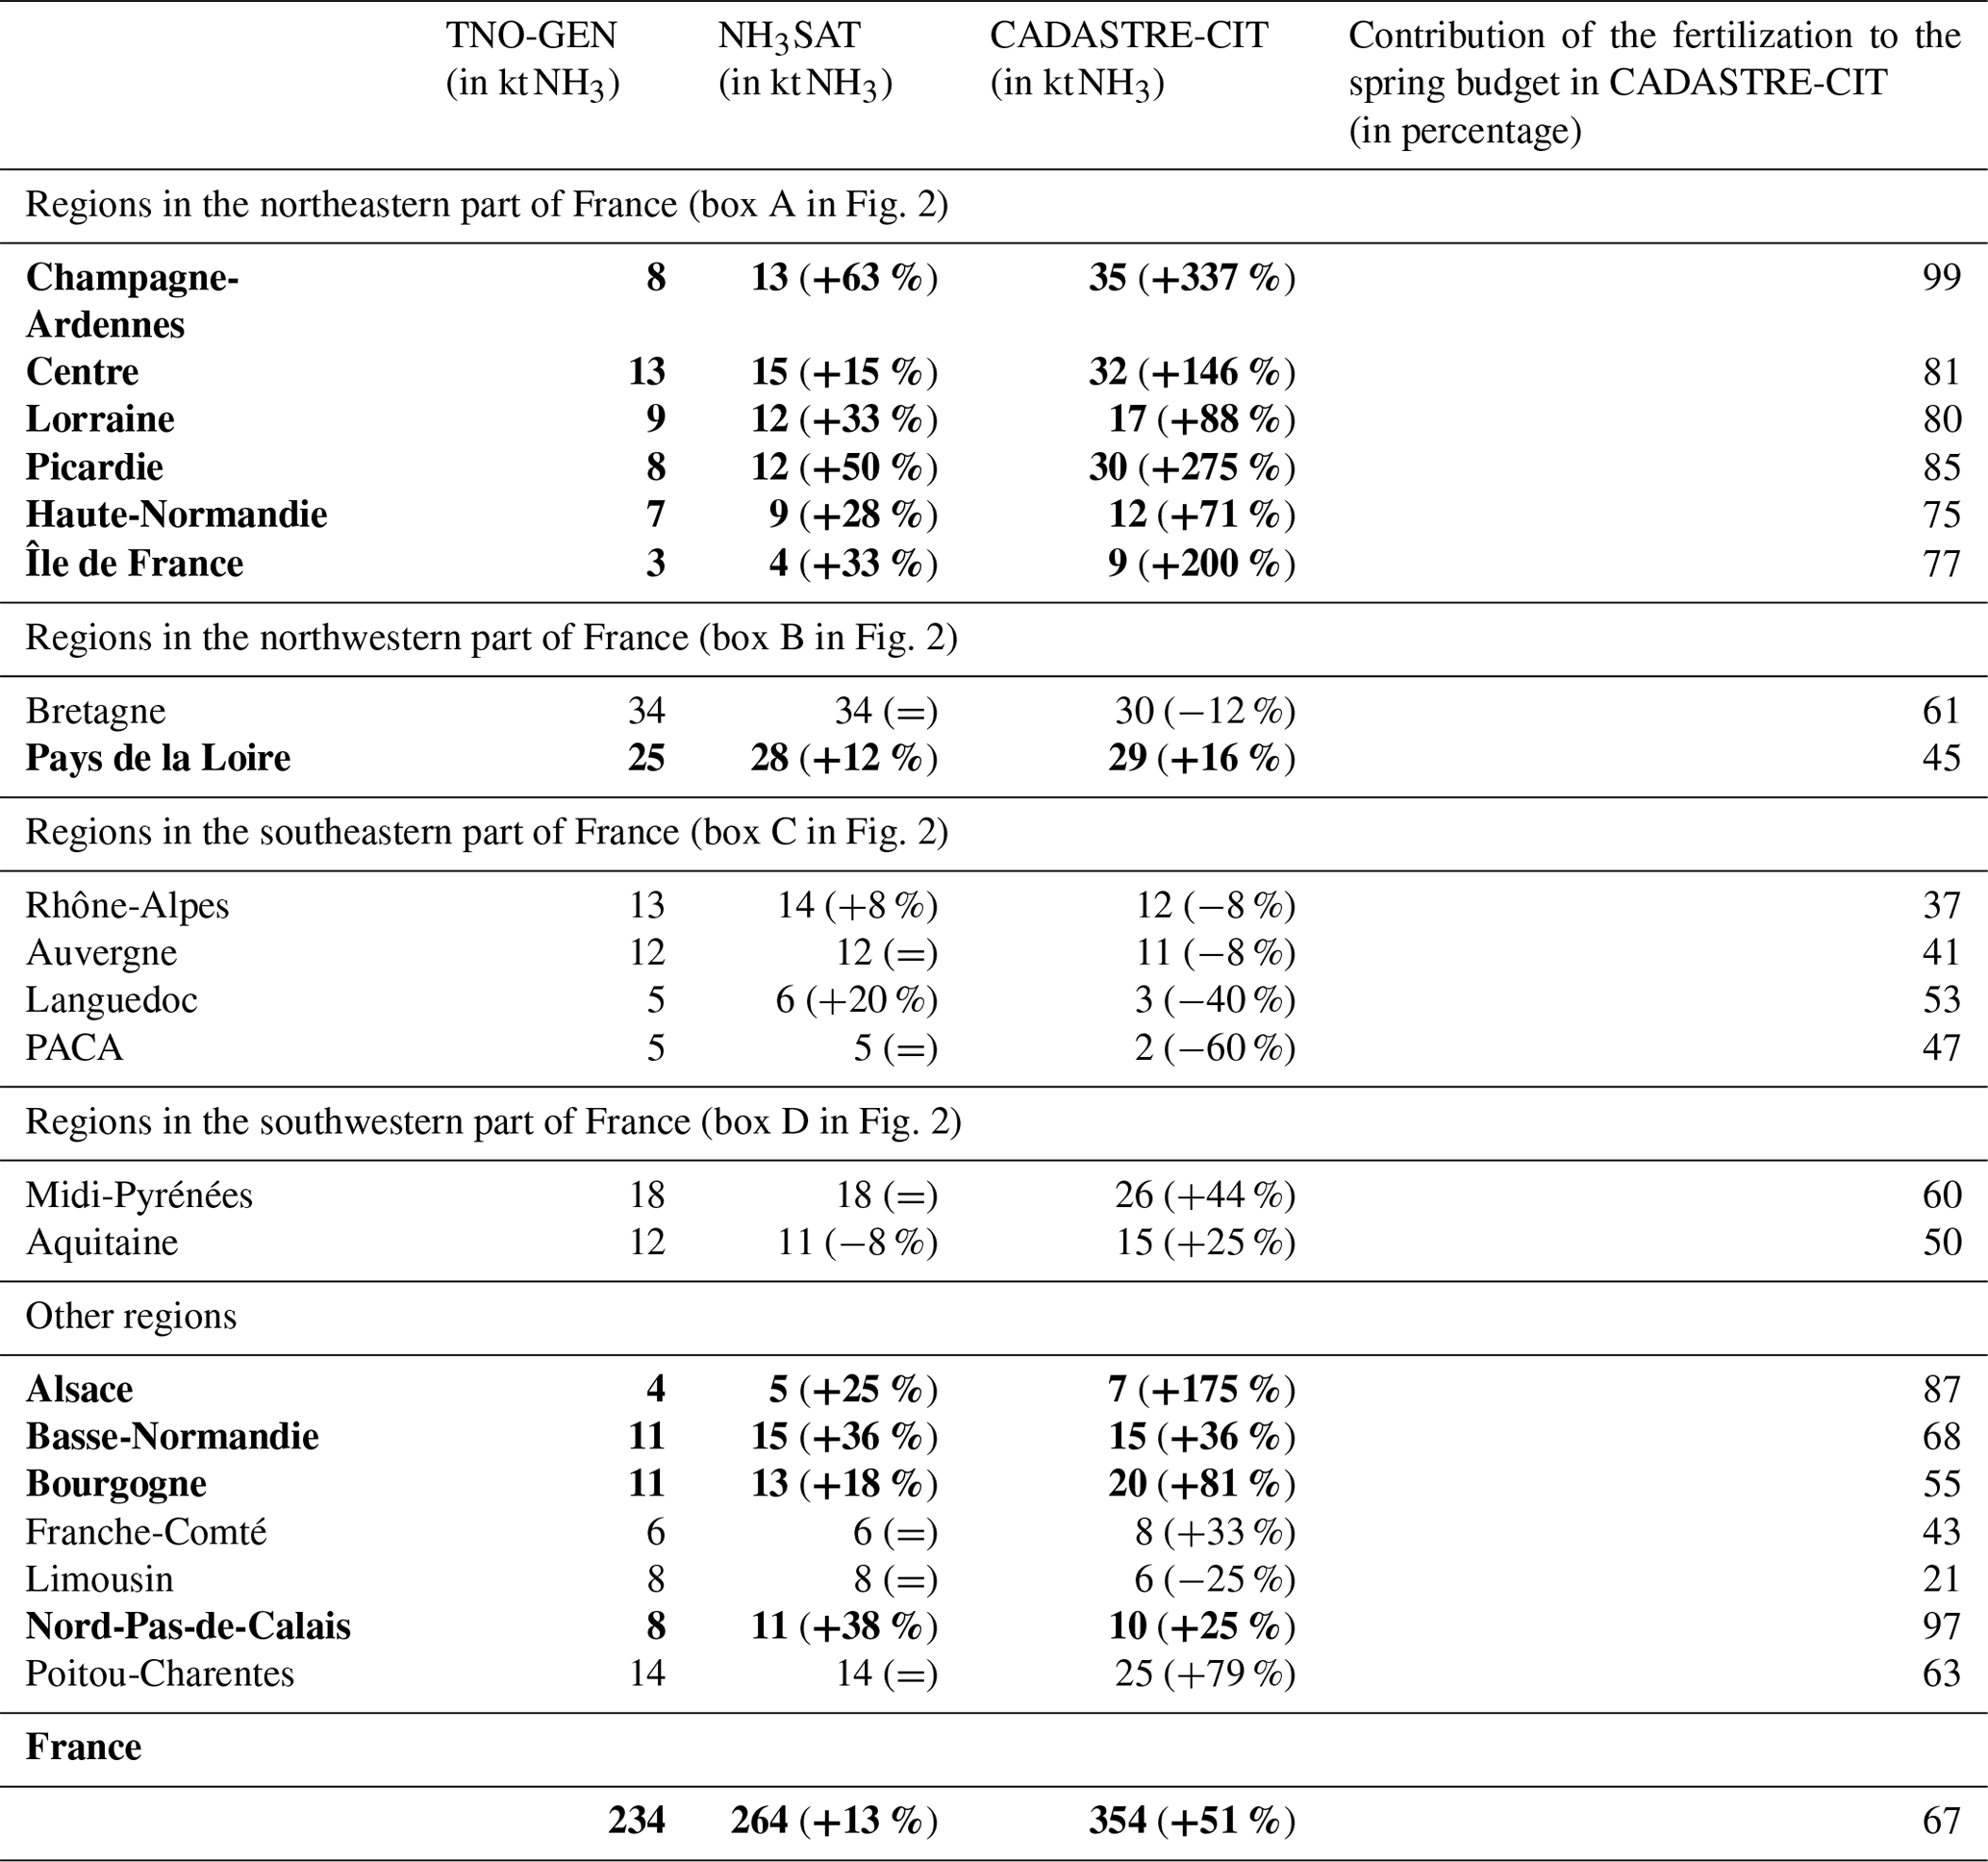
Table 2French national and regional budgets of NH3 spring emissions, from March to May 2011, in kilotons of NH3 (kt NH3). The relative differences compared to the TNO-GEN are presented between brackets, in percentage. Regions for which the inventories NH3SAT and CADASTRE-CIT propose the same sign of relative differences are marked in bold. The contributions of the fertilization emissions to the NH3 regional spring budget in the CADASTRE-CIT inventory are shown in percentage.
3.1 Respective contributions of different sources
The different contributions of livestock and of fertilization to the annual and to the spring budget in the CADASTRE-CIT inventory are shown in Fig. 3. This figure shows that the contribution of fertilization to the annual French budget can be strong, with emissions occurring mainly during spring.
The different contributions of livestock and of fertilization to the spring budget in the CADASTRE-CIT inventory highlight four different domains of interest. We can see that the contribution of fertilization on the high emissions of the northeastern part of France (box A in Fig. 2) is strong. For example, the contribution of fertilization is about 99 % in the region Champagne-Ardennes, and about 85 % in the region Picardie (Table 2). These emissions are mainly due to the use of mineral fertilizer on barley, sugar beet and potato (Ramanantenasoa et al., 2018; Génermont et al., 2018). In particular, the use of urea or nitrogen solution and the high soil pH (Hamaoui-Laguel et al., 2014; Ramanantenasoa et al., 2018; Génermont et al., 2018) – parameters not taken into account by the TNO-GEN inventory – seem to be the factors responsible for the high emissions in this domain.
The second domain of interest is the northwestern part of France (box B in Fig. 2). Over this domain with high emissions, the NH3 emissions are due in roughly equal parts to livestock (including animal housing, manure storage and grazing) and to fertilization, with a high use of organic manure (Ramanantenasoa et al., 2018). Livestock farming indeed produces large amounts of livestock manure available for application on grassland and on arable crops.
The third domain of interest is the southeastern part of France (box C in Fig. 2), showing the smallest spring NH3 emissions. Finally, the contribution of fertilization on the emissions of the southwestern part of France (box D in Fig. 2) is strong.
3.2 French spring NH3 total budget and its main spatial features
The spring NH3 total budget is shown in Table 2 at the national scale and at the French regional scale. The French spring ammonia budgets, calculated for the period from March to May 2011, estimated by the NH3SAT (264 kt NH3) and the CADASTRE-CIT (354 kt NH3) inventories, are both higher than the TNO-GEN reference one (234 kt NH3).The CADASTRE-CIT inventory estimates higher NH3 spring emissions, by about 30 %, than NH3SAT.
The relative agreement on national budget between TNO-GEN and NH3SAT must be nuanced as total budget values from NH3SAT and TNO-GEN are close, but large differences in the spatial distribution of the French NH3 emissions between TNO-GEN and both NH3SAT and CADASTRE-CIT can be observed (Fig. 4).
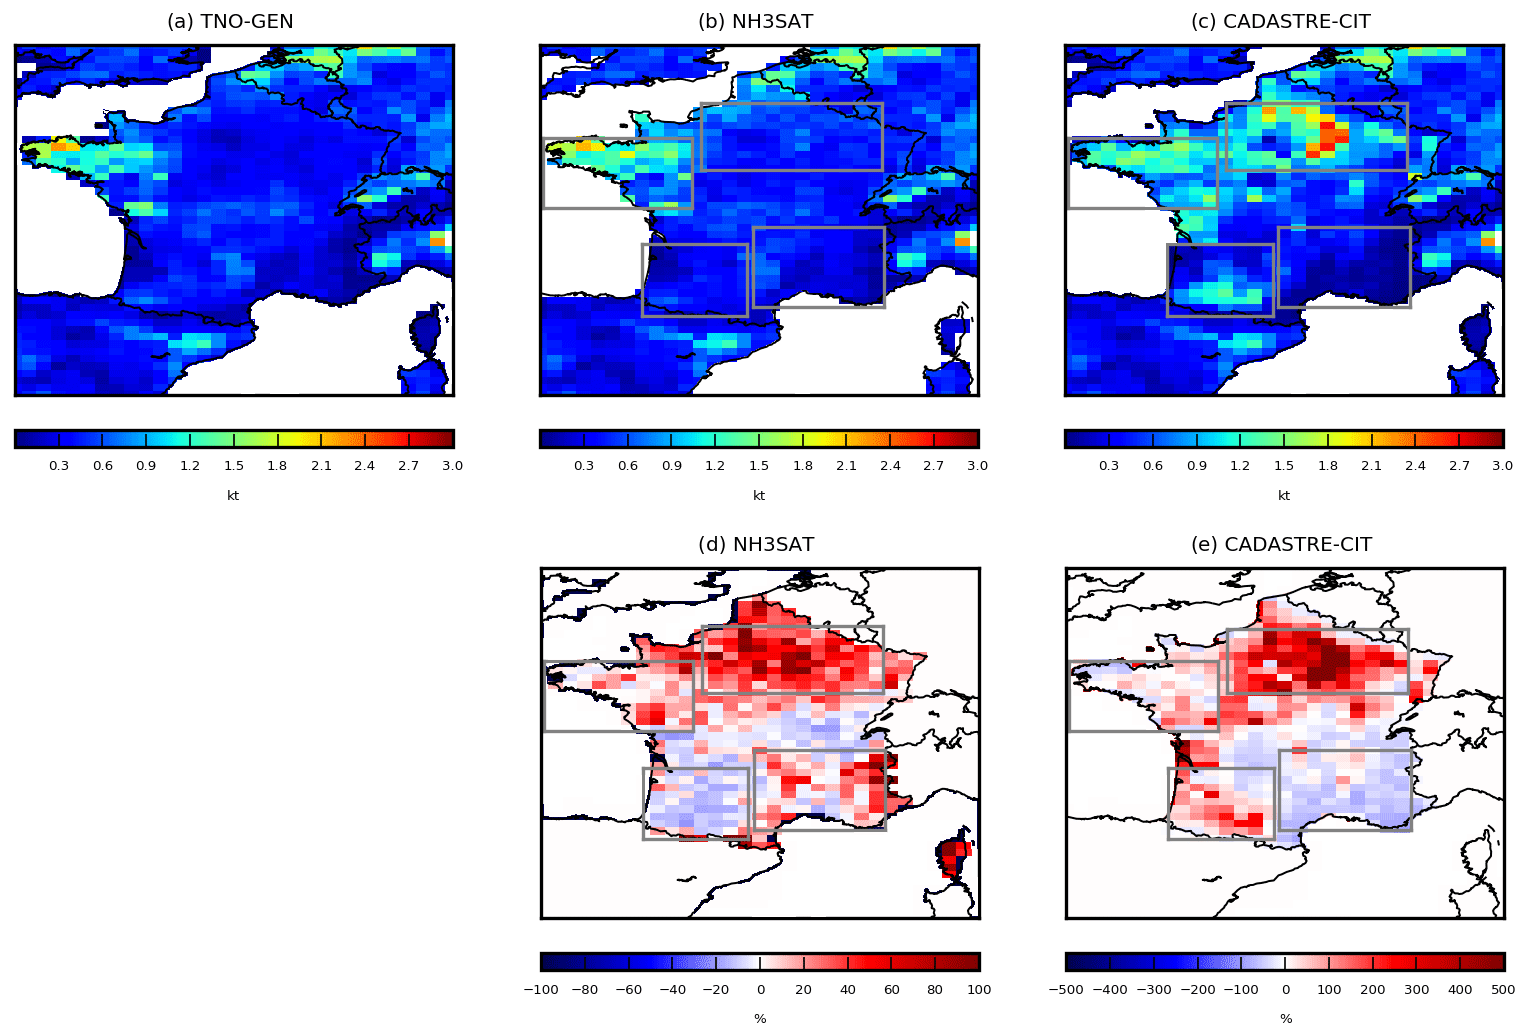
Figure 4French NH3 spring emissions estimated by (a) the TNO-GEN inventory, (b) the NH3SAT inventory and (c) the CADASTRE-CIT inventory, in kilotons of NH3 (kt NH3). Relative differences of (d) the NH3SAT, and (e) the CADASTRE-CIT inventories compared to the TNO-GEN inventory, in percentage, at the pixel resolution, for the period from March to May 2011. Note that the scale is different between (b) and (c).
Indeed, over France and for the spring budget, the spatial correlation compared to the CADASTRE-CIT inventory, which should better represent the agricultural practices and their spatial distribution, is improved when using the NH3SAT inventory instead of using TNO-GEN (Pearson correlation coefficient r=0.78 with NH3SAT against r=0.72 with TNO-GEN).
The northeastern part of France presents the largest difference with the TNO-GEN inventory (48 kt NH3) for both NH3SAT and CADASTRE-CIT inventories (65 and 135 kt NH3, respectively). The high emissions in the northeastern part of France are in agreement with the MASAGE_NH3 inventory (Paulot et al., 2014), the magnitude of their annual NH3 emissions from mineral fertilizer being calculated by combining an inventory of crop acreages; crop- and country-specific fertilizer application rates; and fertilizer-, crop- and application-specific emission factors. Emissions are higher for both NH3SAT and CADASTRE-CIT inventories compared to TNO-GEN over the Champagne-Ardennes (+337 % and +63 %, respectively, for CADASTRE-CIT and NH3SAT, Table 2), Picardie (+275 %, and +50 %, respectively), Centre (+146 % and +15 %, respectively), Haute-Normandie (+71 % and +28 %, respectively), Lorraine (+88 %, and +33 %, respectively) and Île de France regions (+200 %, and +33 %, respectively).
The northwestern part of France presents the largest NH3 emissions according to the TNO-GEN inventory (Fig. 4a). The TNO-GEN, NH3SAT and CADASTRE-CIT inventories lead to similar spring budget (68, 73 and 71 kt NH3, respectively), over this domain.
Over the southeastern part of France, CADASTRE-CIT is about 23 % lower than NH3SAT (28 and 37 kt NH3, respectively, Table 2). One hypothesis to explain the lower NH3 emissions in CADASTRE-CIT is that market gardening is important in this area and not taken into account in the CADASTRE-CIT inventory (Ramanantenasoa et al., 2018; Génermont et al., 2018). Nevertheless, market gardening is not included, to our knowledge, in the TNO-GEN inventory. TNO-GEN and NH3SAT inventories being in quite good agreement in terms of budget (35 and 37 kt NH3, respectively, Table 2), further work is required to understand these discrepancies.
Finally, over the southwestern part of France (box D in Fig. 2), IASI observations only trigger slight corrections to the TNO-GEN inventory over this area (29 and 30 kt NH3, respectively), and CADASTRE-CIT is 36 % higher than TNO-GEN and NH3SAT (Table 2).
3.3 Temporal variability of the NH3 emissions at the subseasonal scale
Monthly regional budgets have been calculated for the three inventories. Figure 5 presents the monthly variability of the NH3 emissions from February to May 2011 for the four domains of interest presented above. February is only displayed here as a baseline to show the sharp peak of NH3 emissions in March over some domains. The contribution of the emissions due to livestock in the CADASTRE-CIT spring budget is also given.
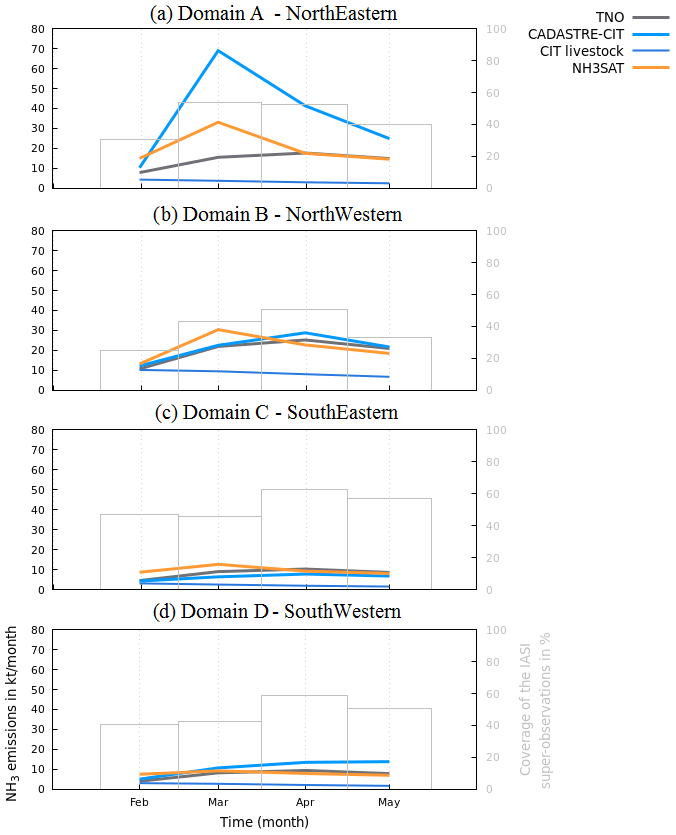
Figure 5Time series of monthly NH3 emissions estimated by TNO-GEN (in black), by NH3SAT (in orange) and by CADASTRE-CIT (in blue) inventories, from February to May 2011, for (a) domain A (northeastern), (b) domain B (northwestern), (c) domain C (southeastern) and (d) domain D (southwestern), as defined in Fig. 2. The contribution of the emissions due to livestock in the CADASTRE-CIT monthly budgets is also given. Units are kilotons of NH3 per month (kt NH3 month−1). The monthly regional coverage of the IASI super-observations is given in percentage (in grey).
The TNO-GEN inventory shows rather similar NH3 emissions from March to May for all regions, with a slight maximum in April (Fig. 5a), imposed by the GENEMIS monthly profiles used for the temporalization of emissions (Ebel et al., 1997). On the contrary, over the northeastern part of France, both NH3SAT and CADASTRE-CIT inventories show a maximum in March, and a decrease until May by about a factor of 1.5 to 2 (Fig. 5a). This maximum in March is also noticed by Tournadre et al. (2020), providing 9 years of total column observations from ground-based infrared remote sensing over the Paris megacity. We calculated the monthly contribution of livestock to the NH3 emissions based on CADASTRE-CIT, which allows one to separate this contribution from the fertilization one. As in Fig. 3, Fig. 5a confirms that NH3 emissions are mainly due to fertilization in the northeastern part of France and shows that the seasonal variation is mainly driven by this contribution. CADASTRE-CIT shows larger values than NH3SAT, which might be partly due to a possible low bias in the IASI observations (Dammers et al., 2017; Tournadre et al., 2020), combined with the fact that the TNO-GEN inventory (negatively biased compared to CADASTRE-CIT) is used as a prior for the mass balance approach with no correction applied to this prior when IASI observations are not available.
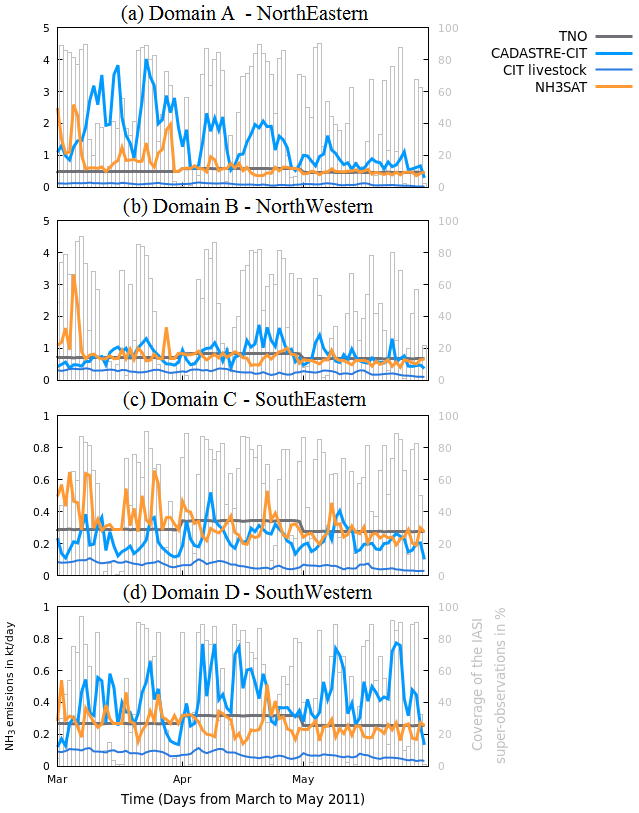
Figure 6Time series of daily NH3 emissions estimated by TNO-GEN (in black), by NH3SAT (in orange) and by CADASTRE-CIT (in blue) inventories, from March to May 2011, for (a) domain A (northeastern), (b) domain B (northwestern), (c) domain C (southeastern) and (d) domain D (southwestern), as defined in Fig. 2. Note that the scale is different between (a, b) and (c, d). Units are kilotons of NH3 per day (kt NH3 d−1). The contribution of the emissions due to livestock in the CADASTRE-CIT daily variability is also given. The daily regional coverage of the IASI super-observations is given in percentage (in grey).
To go further in the comparison, we analyzed the daily variability of the NH3SAT and CADASTRE-CIT inventories, with TNO-GEN representing no daily variability (Fig. 6). To interpret the results, some limitations of the inventories have to be considered. For NH3SAT, the corrections applied to the TNO-GEN emissions are only applied for clear-sky conditions when IASI observations are available. In the CADASTRE-CIT, fertilization days are randomly selected within two-week intervals of application extracted from the farm survey analysis (Ramanantenasoa et al., 2018); thus the actual day of fertilization is unknown. However, the NH3 volatilization is continuous over several days after spreading, reducing the uncertainty introduced by this random selection. Moreover, the random selection is made at the field scale (see Sect. 2.3), and then spatially averaging at the CHIMERE resolution should also smooth the random selection effect. Both effects of weather conditions on fertilization timing, on the one hand, and on volatilization intensity and dynamics at the time of application and after application, on the other hand, are realistically produced. Hence, the NH3 volatilization is continuous over several days after spreading, introducing additional smoothing.
The CADASTRE-CIT inventory presents a high day-to-day variability from March to May 2011 (Fig. 6a) with several strong maxima of emissions – characteristic of emissions due to fertilizer application and a significant effect of the varying meteorological conditions. Day-to-day variability is also large for NH3SAT. However, NH3SAT and CADASTRE-CIT maxima are not very well correlated. Over the first 15 d in March 2011, the high emissions occurring from 9 to 16 March in CADASTRE-CIT are not reproduced by the NH3SAT inventory, potentially because of a lack of IASI coverage for this period (only about 40 % of the domain – Fig. 6a). NH3SAT shows an emission maximum 1 week earlier from 1 to 7 March. This time gap in emission maxima could be explained by the random selection of fertilization days in CADASTRE-CIT. Over the last 15 d in March 2011 and over the first 15 d in April 2011, the maxima of emissions estimated by NH3SAT and CADASTRE-CIT are more correlated (e.g., from 7 to 11 April in CADASTRE-CIT versus from 9 to 11 March in NH3SAT). Finally, CADASTRE-CIT still shows high emissions in the last 15 d of April and in May 2011, particularly related to the use of fertilizer over corn. Despite a good coverage with IASI observations, no specific high emissions are derived from IASI for the same periods.
Over the northwestern part of France, the CADASTRE-CIT inventory is in agreement with TNO-GEN, with a slight maximum in April (Fig. 5b). The NH3SAT inventory shows a maximum in March, related to the high emissions seen during the first week of March 2011 (Fig. 6b). However, the monthly differences are much smaller than for the northeastern part of France. Also for this domain, the day-to-day variabilities provided by CADASTRE-CIT and NH3SAT are mostly uncorrelated: a strong sharp maximum of emissions during the first week of March 2011 is seen in NH3SAT – but not reproduced in CADASTRE-CIT (Fig. 6b). The highest daily emissions in CADASTRE-CIT occur during the two last weeks of April 2011 and are not reproduced by NH3SAT.
Over the southeastern and southwestern parts of France, month-to-month variations and emission amounts are much smaller than for the two previous domains (Figs. 5c, 6c and 5d, 6d, respectively). In the southeastern part of France, NH3SAT emissions are slightly larger than TNO-GEN and CADASTRE-CIT at the beginning of the period (February and March, Fig. 5c). The fertilization contribution to CADASTRE-CIT emissions decreases slightly at the end of the period. In the southwestern part of France, NH3SAT and TNO-GEN are very similar (Fig. 5d), and CADASTRE-CIT is slightly larger at the end of spring. This increase is mainly related to fertilization emissions, the livestock contribution being stable. Again, daily time series between both NH3SAT and CADASTRE-CIT inventories are uncorrelated (Fig. 6c and d).
In this study, we performed an inter-comparison of two alternative inventories with the TNO-GEN reference inventory that quantify the French NH3 emissions during spring 2011. One of the main conclusions of this study is that over regions with large mineral fertilizer use, like over the northeastern part of France, induced NH3 emissions are probably considerably underestimated by the TNO-GEN reference inventory, as both the NH3SAT (constrained by IASI observations) and CADASTRE-CIT (process level oriented) show much larger values. For instance, over northeastern France, NH3SAT and CADASTRE-CIT show, respectively, a factor 1.4 and 2.8 larger spring 2011 emissions than TNO-GEN. Over the whole of France, NH3 emissions are still more than 50 % larger in CADASTRE-CIT than in TNO-GEN. Average French NH3SAT emissions are about 10 % larger than TNO-GEN ones. Over the southern part of France, with more diverse agriculture as compared to the crop-intensive one in northeastern France, differences between the inventories are on the whole lower, and signs between CADASTRE-CIT/TNO-GEN and NH3SAT/TNO-GEN corrections are often opposite for different regions.
Month-to-month variations are again much more pronounced over northeastern France and show a maximum in March for both CADASTRE-CIT and NH3SAT. Day-to-day variations are large in CADASTRE-CIT and NH3SAT, roughly a factor of 5 between minimal and maximal values. This shows the interest in evaluating NH3 emissions at a daily scale because this input is required for chemistry transport modeling of particulate matter formation and thus air quality. However, time series delivered by CADASTRE-CIT and NH3SAT are uncorrelated for all regions considered. This result can be partly explained by the lack of data in IASI NH3 column observations under partially cloudy conditions, and by the fact that available information on agricultural practices is resolved at a 2-week scale.
Yet, current results of our study have important implications for air quality modeling over Europe. The important changes in the spatial distribution of NH3 emissions as a function of soil properties are of general concern not only for France, but for all of Europe. Soils are alkaline or neutral (pH > 6) not only over northeastern France, but also over large parts of Italy, eastern Spain or eastern Germany (Reuter et al., 2008). Over these regions, our study suggests potentially larger NH3 emissions than with a constant emission factor treatment, with impacts on fine-particle formation. These features should be included in “operational” emission inventories used for air quality modeling.
Thus, as a general conclusion, use of observational constrained or process-oriented emission inventories is clearly of added value for estimating better monthly averages over French areas with intensive mineral fertilizer use, but capacity for delivering day-to-day variations is not yet proven. This warrants further studies, including both those that refine hypotheses on days chosen by farmers for fertilizer spread out as a function of meteorological conditions and those that acquire and use continuous surface NH3 measurements for validating satellite- or process-derived NH3 emission variability.
The CHIMERE code is available here: https://www.lmd.polytechnique.fr/chimere/ (CHIMERE, 2020).
The IASI ANNI-NH3-v2.2R data are freely available through the AERIS database: https://iasi.aeris-data.fr/nh3/ (AERIS, 2018).
All authors have contributed to writing the paper (main authors: AFC, GD, SG and MB). AFC has performed the mass-balance approach to deduce NH3 emissions from NH3 total columns observed by the IASI satellite instrument. KD, JMG and SG have performed the bottom-up approach providing the CADASTRE_NH3 inventory for organic and mineral fertilization practices. FC has compiled this CADASTRE_NH3 inventory with livestock emissions from the CITEPA. LC, PFC, MVD and CC are the principal investigators of the IASI NH3 product. All authors discussed the results and contributed to the final paper.
The authors declare that they have no conflict of interest.
We acknowledge the TNO team for providing NH3 emissions. Lieven Clarisse and Martin Van Damme are research associate and postdoctoral researcher, respectively, with the Belgian F.R.S-FNRS. The authors are indebted to all those who provided input data for the CADASTRE_NH3 2010–2011 crop year: the Service de la Statistique et de la Prospective (SSP), Department of Statistics and Forecasting of the French Ministry of Agriculture, for the French cultural practices survey, supported by a public grant overseen by the French National Research Agency (ANR) as part of the “Investissements d'avenir” program (reference: ANR-10-EQPX-17 – Centre d'Accès Sécurisé aux Données – CASD); Météo-France for the data on weather conditions; the Agence de Service et de Paiement (ASP) and the Observatoire du Développement Rural (ODR) service unit for data on the Land Parcel Identification System (LPIS) for France. The authors are also grateful to Maharavo Marie Julie Ramanantenasoa for her technical assistance, funded by the Cadastre_NH3 project under agreement number ADEME 1081C0031. IASI is a joint mission of EUMETSAT and the Centre National d’Etudes Spatiales (CNES, France). The authors acknowledge the AERIS data infrastructure for providing access to the IASI data in this study. This research has been supported by the Belgian State Federal Office for Scientific, Technical and Cultural Affairs (Prodex arrangement IASI.FLOW). This work was granted access to the HPC resources of TGCC under the allocation A0070107232 made by GENCI.
For this study, Audrey Fortems-Cheiney and Karine Dufossé were funded by the Amp’Air and the PolQA Primequal projects, respectively, under agreement numbers ADEME 1660C0013 and 1662C0023.
This paper was edited by Drew Gentner and reviewed by three anonymous referees.
Adams, C., McLinden, C. A., Shephard, M. W., Dickson, N., Dammers, E., Chen, J., Makar, P., Cady-Pereira, K. E., Tam, N., Kharol, S. K., Lamsal, L. N., and Krotkov, N. A.: Satellite-derived emissions of carbon monoxide, ammonia, and nitrogen dioxide from the 2016 Horse River wildfire in the Fort McMurray area, Atmos. Chem. Phys., 19, 2577–2599, https://doi.org/10.5194/acp-19-2577-2019, 2019.
AERIS: IASI ANNI-NH3-v2.2R data, available through the AERIS database: https://iasi.aeris-data.fr/nh3/, last access: September 2018.
AGRESTE: Pratiques culturales 2006, in: “Agreste Les Dossiers”, no 8 July 2010, Ministère de l'alimentation, de l'agriculture et de la pêche, pp. 86, 2010.
AGRESTE: Enquête Pratiques culturales 2011, in: Agreste Les Dossiers, no 21 July 2014, Ministère de l’alimentation, de l’agriculture et de la pêche, pp. 70, 2014.
Azouz, N., Drouet, J.-L., Beekmann, M., Siour, G., Kruit, R. W., and Cellier, P.: Comparison of spatial patterns of ammonia concentration and dry deposition flux between a regional Eulerian chemistry-transport model and a local Gaussian plume model, Air Qual. Atmos. Hlth., 12, 719–729 https://doi.org/10.1007/s11869-019-00691-y, 2019.
Bauer, S. E., Tsigaridis, K., and Miller, R.: Significant atmosphericaerosol pollution caused by world food cultivation, Geophys. Res. Lett., 43, 5394–5400, 2016.
Boersma, K. F., Jacob, D. J., Bucsela, E. J., Perring, A. E., Dirksen, R., van der A, R. J., Yantosca, R. M., Park, R. J., Wenig, M. O., and Bertram, T. H.: Validation of OMI tropospheric NO2 observations during INTEX-B and application to constrain NOx emissions over the eastern United States and Mexico, Atmos. Environ., 42, 4480–4497, https://doi.org/10.1016/j.atmosenv.2008.02.004, 2008.
CHIMERE: CHIMERE code, available at: https://www.lmd.polytechnique.fr/chimere/, last access: April 2020.
Clarisse, L., Clerbaux, C., Dentener, F., Hurtmans,D., and Coheur, P.: Global ammonia distribution derived from infrared satellite observations, Nat. Geosci., 2, 479–483, 2009.
Clarisse, L., Shephard, M., Dentener, F., Hurtmans, D., Cady-Pereira, K., Karagulian, F., Van Damme, M., Clerbaux, C., and Coheur, P.-F.: Satellite monitoring of ammonia: A case study of the San Joaquin Valley, J. Geophys. Res., 115, D13302, https://doi.org/10.1029/2009JD013291, 2010.
Clerbaux, C., Boynard, A., Clarisse, L., George, M., Hadji-Lazaro, J., Herbin, H., Hurtmans, D., Pommier, M., Razavi, A., Turquety, S., Wespes, C., and Coheur, P.-F.: Monitoring of atmospheric composition using the thermal infrared IASI/MetOp sounder, Atmos. Chem. Phys., 9, 6041–6054, https://doi.org/10.5194/acp-9-6041-2009, 2009.
Dammers, E., Shephard, M. W., Palm, M., Cady-Pereira, K., Capps, S., Lutsch, E., Strong, K., Hannigan, J. W., Ortega, I., Toon, G. C., Stremme, W., Grutter, M., Jones, N., Smale, D., Siemons, J., Hrpcek, K., Tremblay, D., Schaap, M., Notholt, J., and Erisman, J. W.: Validation of the CrIS fast physical NH3 retrieval with ground-based FTIR, Atmos. Meas. Tech., 10, 2645–2667, https://doi.org/10.5194/amt-10-2645-2017, 2017.
Dammers, E., McLinden, C. A., Griffin, D., Shephard, M. W., Van Der Graaf, S., Lutsch, E., Schaap, M., Gainairu-Matz, Y., Fioletov, V., Van Damme, M., Whitburn, S., Clarisse, L., Cady-Pereira, K., Clerbaux, C., Coheur, P. F., and Erisman, J. W.: NH3 emissions from large point sources derived from CrIS and IASI satellite observations, Atmos. Chem. Phys., 19, 12261–12293, https://doi.org/10.5194/acp-19-12261-2019, 2019.
Ebel, A., Friedrich, R., and Rodhe, H. (Eds.): Tropospheric Modelling and Emission Estimation. Transport and Chemical Transformation of Pollutants in the Troposphere, chap. GENEMIS: Assessment, Improvement, and Temporal and Spatial Disaggregation of European Emission Data, Springer, Berlin, Germany, 1997.
EEA European Environment Agency: Effects of air pollution on European ecosystems – Past and future exposure of European freshwater and terrestrial habitats to acidifying and eutrophying air pollutants, Technical Report, available at: https://www.eea.europa.eu/publications/effects-of-air-pollution-on (last access: September 2020), 2014.
EMEP European Monitoring and Evaluation Program/EEA European Environment Agency: Air pollutant emission inventory guidebook Uncertainties, 2016.
Erisman, J. W. and Schaap, M.: The need for ammonia abatement with respect to secondary PM reductions in Europe, Environ. Pollut., 129, 159–163, https://doi.org/10.1016/j.envpol.2003.08.042, 2004.
Erisman, J. W., Bleeker, A., Galloway, J., and Sutton, M. S.: Reduced nitrogen in ecology and the environment, Environ. Pollut., 150, 140–149, https://doi.org/10.1016/j.envpol.2007.06.033,2007.
Fortems-Cheiney, A.,Dufour, G., Hamaoui-Laguel, L., Foret, G., Siour, G., Van Damme, M., Meleux, F., Coheur, P.-F., Clerbaux, C., Clarisse, L., Wallash, M. and Beekmann, M.: Unaccounted variability in NH3 agricultural sources detected by IASI contributing to European spring haze episode, Geophys. Res. Lett., 43, 5475–5482, https://doi.org/10.1002/2016GL069361, 2016.
Garcia, L., Génermont, S., Bedos, C., Simon, N. N., Garnier, P., Loubet, B., and Cellier, P.: Accounting for Surface Cattle Slurry in Ammonia Volatilization Models: The Case of Volt'Air, Soil Sci. Soc. Am. J., 76, 2184, https://doi.org/10.2136/sssaj2012.0067, 2012.
Génermont, S., Ramanantenasoa, M. M. J., Dufossé, K., Maury, O., Mignolet, C., and Gilliot, J.-M.: Data on spatio-temporal representation of mineral N fertilization and manure N application as well as ammonia volatilization in French regions for the crop year 2005/06, Data in Brief, 21, 1119–1124, https://doi.org/10.1016/j.dib.2018.09.119, 2018.
Hamaoui-Laguel, L., Meleux , F., Beekmann, M., Bessagnet, B., Genermont, S., Cellier, P., and Letinois, L.: Improving ammonia emissions in air quality modelling for France, Atmos. Environ., 92, 584–595, https://doi.org/10.1016/j.atmosenv.2012.08.002, 2014.
Hellsten, S., Dragosits, U., Place, C. J., Vieno, M., Dore, A. J., Misselbrook, T. H., Tang, Y. S., and Sutton, M. A.: Modelling the spatial distribution of ammonia emissions in the UK, Environ. Pollut, 154, 370–379, https://doi.org/10.1016/j.envpol.2008.02.017, 2008.
Jaeglé, L., Martin, R. V., Chance, K., Steinberger, L., Kurosu, T. P., Jacob, D. J., Modi, A. I., Yoboué, V., Sigha-Nkamdjou, L., and Galy-Lacaux, C.: Satellite mapping of rain-induced nitric oxide emissions from soils, J. Geophys. Res., 109, D21310, https://doi.org/10.1029/2004JD004787, 2004.
Kuenen, J. J. P., Visschedijk, A. J. H., Jozwicka, M., and Denier van der Gon, H. A. C.: TNO-MACC_II emission inventory; a multi-year (2003–2009) consistent high-resolution European emission inventory for air quality modelling, Atmos. Chem. Phys., 14, 10963–10976, https://doi.org/10.5194/acp-14-10963-2014, 2014.
Le Cadre, E.: Modélisation de la volatilisation d'ammoniac en interaction avec les processus chimiques et biologiques du sol: le modèle Volt'Air, Doctoral thesis, ABIES; UMR INRA INAPG Environnement et Grandes Cultures de Grignon, available at: http://infodoc.agroparistech.fr/index.php?lvl=notice_display&id=48284 (last access: September 2020), pp. 315, 2004.
Lelieveld, J., Evans, J. S., Fnais, M., Giannadaki, D., and Pozzer, A.: The contribution of outdoor air pollution sources to premature mortality on a global scale, Nature, 525, 367–371, https://doi.org/10.1038/nature15371, 2015.
Li, C., Martin, R. V., Shephard, M. W., Cady-Pereira, K., Cooper, M. J., Kaiser, J., Lee, C. J., Zhang, L., and Henze, D. K.: Assessing the iterative finite difference mass balance and 4D-Var methods to derive ammonia emissions over North America using synthetic observations, J. Geophys. Res.-Atmos., 124, 4222–4236, https://doi.org/10.1029/2018JD030183, 2019.
Lin, J.-T., McElroy, M. B., and Boersma, K. F.: Constraint of anthropogenic NOx emissions in China from different sectors: a new methodology using multiple satellite retrievals, Atmos. Chem. Phys., 10, 63–78, https://doi.org/10.5194/acp-10-63-2010, 2010.
Mailler, S., Menut, L., Khvorostyanov, D., Valari, M., Couvidat, F., Siour, G., Turquety, S., Briant, R., Tuccella, P., Bessagnet, B., Colette, A., Létinois, L., Markakis, K., and Meleux, F.: CHIMERE-2017: from urban to hemispheric chemistry-transport modeling, Geosci. Model Dev., 10, 2397–2423, https://doi.org/10.5194/gmd-10-2397-2017, 2017.
Menut, L., Goussebaile, A., Bessagnet B., Kyvorostiyanov, D., and Ung, A.: Impact of realistic hourly emissions profiles on air pollutants concentrations modelled with CHIMERE, Atmos. Environ., 49, 233–244, 2012.
Menut, L., Bessagnet, B., Khvorostyanov, D., Beekmann, M., Blond, N., Colette, A., Coll, I., Curci, G., Foret, G., Hodzic, A., Mailler, S., Meleux, F., Monge, J.-L., Pison, I., Siour, G., Turquety, S., Valari, M., Vautard, R., and Vivanco, M. G.: CHIMERE 2013: a model for regional atmospheric composition modelling, Geosci. Model Dev., 6, 981–1028, https://doi.org/10.5194/gmd-6-981-2013, 2013.
Nenes, A., Pilinis, C., and Pandis, S.: ISORROPIA: A new thermodynamic model for inorganic multicomponent atmospheric aerosols, Aquat. Geochem., 4, 123–152, 1998
OJEU, Official Journal of the European: Union Directive (EU) 2016/2284 of the European Parliament and of the Council of 14 December 2016 on the reduction of national emissions of certain atmospheric pollutants, amending Directive 2003/35/EC and repealing Directive 2001/81/EC, 344, 17.12.2016, p. 1–31, available at: http://data.europa.eu/eli/dir/2016/2284/oj (last access: September 2020), European Union, 2016.
Owens, R. G. and Hewson, T.: ECMWF Forecast User Guide, ECMWF, https://doi.org/10.21957/m1cs7h, 2018.
Palmer, P. I., Jacob, D. J., Fiore, A. M., Martin, R. V., Chance, K., and Kurosu, T. P.: Mapping isoprene emissions over North America using formaldehyde column observations from space, J. Geophys. Res., 108, 4180, https://doi.org/10.1029/2002JD002153, 2003.
Paulot, F., Jacob, D. J., Pinder, R. W., Bash, J. O., Travis, K., and Henze, D. K.: Ammonia emissions in the United States, European Union, and China derived by high-resolution inversion of ammonium wet deposition data: Interpretation with a new agricultural emissions inventory (MASAGE_NH3), J. Geophys. Res.-Atmos., 119, 4343–4364, https://doi.org/10.1002/2013JD021130, 2014.
Petetin, H., Sciare, J., Bressi, M., Gros, V., Rosso, A., Sanchez, O., Sarda-Estève, R., Petit, J.-E., and Beekmann, M.: Assessing the ammonium nitrate formation regime in the Paris megacity and its representation in the CHIMERE model, Atmos. Chem. Phys., 16, 10419–10440, https://doi.org/10.5194/acp-16-10419-2016, 2016.
Ramanantenasoa M. M. J., Gilliot J.-M., Mignolet C., Bedos C., Mathias E., Eglin T., Makowski D., and Génermont, S.: A new framework to estimate spatio-temporal ammonia emissions due to nitrogen fertilization in France, Sci. Total Environ., 645, 05–219, https://doi.org/10.1016/j.scitotenv.2018.06.202, 2018.
Reuter, H. I., Lado, L. R., Hengl, T., and Montanarella, L.: Continental-scale digital soil mapping using European soil profile data: soil pH, Hamburger Beiträge zur Physischen Geographie und Landschaftsökologie, 92, Heft 19/2008, 91–102, 2008.
Schauberger, B., Ben-Ari, T., Makowski, D., Kato, T., Kato, H., and Ciais, P.: Yield trends, variability and stagnation analysis of major crops in France over more than a century, Sci. Rep., 8, 16865, https://doi.org/10.1038/s41598-018-35351-1, 2018.
Skjøth, C. A., Hertel, O., Gyldenkærne, S., and Ellerman, T.: Implementing a dynamical ammonia emission parameterization in thelarge-scale air pollution model ACDEP, J. Geophys. Res., 109, D06306, https://doi.org/10.1029/2003JD003895, 2004.
Skjøth, C. A., Geels, C., Berge, H., Gyldenkærne, S., Fagerli, H., Ellermann, T., Frohn, L. M., Christensen, J., Hansen, K. M., Hansen, K., and Hertel, O.: Spatial and temporal variations in ammonia emissions – a freely accessible model code for Europe, Atmos. Chem. Phys., 11, 5221–5236, https://doi.org/10.5194/acp-11-5221-2011, 2011.
Szopa, S., Foret, G., Menut, L., and Cozic, A.: Impact of large scale circulation on European summer surface ozone: consequences for modeling, Atmos. Environ., 43, 1189–1195,https://doi.org/10.1016/j.atmosenv.2008.10.039, 2008.
Tournadre, B., Chelin, P., Ray, M., Cuesta, J., Kutzner, R. D., Landsheere, X., Fortems-Cheiney, A., Flaud, J.-M., Hase, F., Blumenstock, T., Orphal, J., Viatte, C., and Camy-Peyret, C.: Atmospheric ammonia (NH3) over the Paris megacity: 9 years of total column observations from ground-based infrared remote sensing, Atmos. Meas. Tech., 13, 3923–3937, https://doi.org/10.5194/amt-13-3923-2020, 2020.
Tuccella, P., Menut, L., Briant, R., Deroubaix, A., Khvorostyanov, D., Mailler, S., Siour, G., and Turquety, S.: Implementation of Aerosol-Cloud Interaction within WRF-CHIMERE Online Coupled Model: Evaluation and Investigation of the Indirect Radiative Effect from Anthropogenic Emission Reduction on the Benelux Union, Atmosphere, 10, 20, 2019.
Turner, A. J., Henze, D. F., Martin, R. V., and Hakami, A.: The spatial extent of source influences on modeled columns concentrations of short-lived species, Geophys. Res. Lett., 39, L12806, https://doi.org/10.1029/2012GL051832, 2012.
Van Damme, M., Clarisse, L., Heald, C. L., Hurtmans, D., Ngadi, Y., Clerbaux, C., Dolman, A. J., Erisman, J. W., and Coheur, P. F.: Global distributions, time series and error characterization of atmospheric ammonia (NH3) from IASI satellite observations, Atmos. Chem. Phys., 14, 2905–2922, https://doi.org/10.5194/acp-14-2905-2014, 2014.
Van Damme, M., Whitburn, S., Clarisse, L., Clerbaux, C., Hurtmans, D., and Coheur, P.-F.: Version 2 of the IASI NH3 neural network retrieval algorithm: near-real-time and reanalysed datasets, Atmos. Meas. Tech., 10, 4905–4914, https://doi.org/10.5194/amt-10-4905-2017, 2017.
Van Damme, M., Clarisse, L., Whitburn, S., Hadji-Lazaro, J., Hurtmans, D., Clerbaux, C., and Coheur, P.-F.: Industrial and agricultural ammonia point sources exposed, Nature, 564, 99–103, 2018.
Vestreng, V., Breivik, K., Adams, M., Wagner, A., Goodwin, J., Rozovskaya, O., and Oacyna, J.: Inventory Review 2005 – Emission Data reported to CLRTAP and under the NEC Directive – Initial review for HMs and POPs, EMEP Status report, Norwegian Meteorological Institute, Oslo, 2005.
Viatte, C., Wang, T., Van Damme, M., Dammers, E., Meleux, F., Clarisse, L., Shephard, M. W., Whitburn, S., Coheur, P. F., Cady-Pereira, K. E., and Clerbaux, C.: Atmospheric ammonia variability and link with particulate matter formation: a case study over the Paris area, Atmos. Chem. Phys., 20, 577–596, https://doi.org/10.5194/acp-20-577-2020, 2020.
WHO World Health Organization: Ambient Air Pollution: a global assessment of exposure and burden of disease, ISBN: 9789241511353, 2016.
Wichink Kruit, R. J., Schaap, M., Sauter, F. J., van Zanten, M. C., and van Pul, W. A. J.: Modeling the distribution of ammonia across Europe including bi-directional surface–atmosphere exchange, Biogeosciences, 9, 5261–5277, https://doi.org/10.5194/bg-9-5261-2012, 2012.
Zhang, L., Chen, Y., Zhao, Y., Henze, D. K., Zhu, L., Song, Y., Paulot, F., Liu, X., Pan, Y., Lin, Y., and Huang, B.: Agricultural ammonia emissions in China: reconciling bottom-up and top-down estimates, Atmos. Chem. Phys., 18, 339–355, https://doi.org/10.5194/acp-18-339-2018, 2018.
Zhu, L., Henze, D. K., Cady-Pereire, K.E, Shepard, M. W., Luo, M., Pinder, R. W., Bash, J. O. and Jeong, G.-R.: Constraining U.S. ammonia emissions using TES remote sensing observations and the GEOS-Chem adjoint model, J. Geophys. Res, 118, 1–14, https://doi.org/10.1002/jgrd.50166, 2013.
Zhu, L., Henze, D., Bash, J., Jeong, G.-R., Cady-Pereira, K., Shephard, M., Luo, M., Paulot, F., and Capps, S.: Global evaluation of ammonia bidirectional exchange and livestock diurnal variation schemes, Atmos. Chem. Phys., 15, 12823–12843, https://doi.org/10.5194/acp-15-12823-2015, 2015.