the Creative Commons Attribution 4.0 License.
the Creative Commons Attribution 4.0 License.
 | 28 Oct 2020
Global modeling of cloud water acidity, precipitation acidity, and acid inputs to ecosystems
Daniel J. Jacob
Jonathan M. Moch
Xuan Wang
Shixian Zhai
Cloud water acidity affects the atmospheric chemistry of sulfate and organic aerosol formation, halogen radical cycling, and trace metal speciation. Precipitation acidity including post-depositional inputs adversely affects soil and freshwater ecosystems. Here, we use the GEOS-Chem model of atmospheric chemistry to simulate the global distributions of cloud water and precipitation acidity as well as the total acid inputs to ecosystems from wet deposition. The model accounts for strong acids (H2SO4, HNO3, and HCl), weak acids (HCOOH, CH3COOH, CO2, and SO2), and weak bases (NH3 as well as dust and sea salt aerosol alkalinity). We compile a global data set of cloud water pH measurements for comparison with the model. The global mean observed cloud water pH is 5.2±0.9, compared to 5.0±0.8 in the model, with a range from 3 to 8 depending on the region. The lowest values are over East Asia, and the highest values are over deserts. Cloud water pH over East Asia is low because of large acid inputs (H2SO4 and HNO3), despite NH3 and dust neutralizing 70 % of these inputs. Cloud water pH is typically 4–5 over the US and Europe. Carboxylic acids account for less than 25 % of cloud water H+ in the Northern Hemisphere on an annual basis but 25 %–50 % in the Southern Hemisphere and over 50 % in the southern tropical continents, where they push the cloud water pH below 4.5. Anthropogenic emissions of SO2 and NOx (precursors of H2SO4 and HNO3) are decreasing at northern midlatitudes, but the effect on cloud water pH is strongly buffered by and carboxylic acids. The global mean precipitation pH is 5.5 in GEOS-Chem, which is higher than the cloud water pH because of dilution and below-cloud scavenging of NH3 and dust. GEOS-Chem successfully reproduces the annual mean precipitation pH observations in North America, Europe, and eastern Asia. Carboxylic acids, which are undetected in routine observations due to biodegradation, lower the annual mean precipitation pH in these areas by 0.2 units. The acid wet deposition flux to terrestrial ecosystems taking into account the acidifying potential of and in N-saturated ecosystems exceeds 50 in East Asia and the Americas, which would affect sensitive ecosystems. is the dominant acidifying species in wet deposition, contributing 41 % of the global acid flux to continents under N-saturated conditions.
- Article
(12414 KB) - Full-text XML
- BibTeX
- EndNote


Cloud water acidity (H+ concentration) affects global atmospheric chemistry in a number of ways. It controls the rates of aqueous-phase reactions that (1) oxidize sulfur dioxide (SO2) to sulfate aerosols (Martin et al., 1981; Calvert et al., 1985), (2) oxidize dissolved organic compounds to less volatile forms leading to secondary organic aerosols (Ervens et al., 2011; Herrmann et al., 2015), and (3) convert halides into halogen radicals (von Glasow and Crutzen, 2003; Platt and Hönninger, 2003). It affects the solubility and bioavailability of iron in aerosol particles and, thus, the input of this micronutrient to marine ecosystems (Mahowald et al., 2005). Acidic deposition has a range of environmental effects on soil and freshwater ecosystems (Driscoll et al., 2001). Cloud water and precipitation acidity is affected in a complex way by natural and anthropogenic emissions, but there has been little effort so far to evaluate the ability of global models to represent this. Here, we present such an evaluation using the GEOS-Chem atmospheric chemistry model and go on to discuss the factors controlling cloud water and precipitation acidity on a global scale.
Cloud water and precipitation H+ concentrations are determined by the balance between dissolved acids (H+ donors) and bases (H+ acceptors). Sulfuric acid (H2SO4), nitric acid (HNO3), and hydrogen chloride (HCl) are the major strong acids in the atmosphere, and they dissociate completely in cloud water and precipitation. The major weak acids are CO2, SO2, and carboxylic acids including formic acid (HCOOH) and acetic acid (CH3COOH). Ammonia (NH3) and alkaline dust particles are the major bases. Atmospheric acidity is commonly referenced to the CO2–H2O system (pH 5.6 at current CO2 levels), with lower pH referred to as acidic conditions and higher pH as alkaline conditions. Cloud water pH generally varies between 3 and 7, with highly acidic cloud water typically found in industrialized areas with high SO2 and nitrogen oxides (NOx) emissions and alkaline cloud water found in agricultural and dusty areas (Warneck, 2000; Pye et al., 2020). Precipitation pH varies in a similar pattern (Dentener and Crutzen, 1994; Vet et al., 2014) but differs from cloud water pH because of dilution (Weathers et al., 1988; Bormann et al., 1989), riming (Collett et al., 1993), below-cloud scavenging (Castillo et al., 1983; Zinder et al., 1988; Ayers and Gillett, 1988), and oxidation chemistry within raindrops (Overton et al., 1979; Graedel and Goldberg, 1983).
The chemical and physical processes governing cloud water and precipitation acidity have been well-established since the 1980s (Morgan, 1982; NRC, 1983; Stumm et al., 1987). They have been incorporated in many regional models focused on acid deposition (Chang et al., 1987; Venkatram et al., 1988; Carmichael et al., 1991; Hass et al., 1993; Olendrzynski et al., 2000; Langner et al., 2005) and global models focused on sulfur and nitrogen deposition (Dentener and Crutzen, 1994; Rodhe et al., 1995, 2002; Bouwman et al., 2002; Tost et al., 2007; Paulot et al., 2018). A few global modeling studies have focused on precipitation pH (Dentener and Crutzen, 1994; Rodhe et al., 1995, 2002; Tost et al., 2007). These models calculated precipitation [H+] from the precipitation concentrations of , , , , and using ionic charge balance. Rodhe et al. (2002) also included dust alkalinity. None included carboxylic acids, which are known to be important but biodegrade rapidly after deposition (Keene et al., 1983; Keene and Galloway, 1984).
Cloud water pH has received less attention in models. Some current global atmospheric chemistry models assume a constant cloud water pH for aqueous reactions (Watanabe et al., 2011; Søvde et al., 2012), whereas others calculate it explicitly from the balance of acids and bases but again generally neglecting dust alkalinity and carboxylic acids (Tost et al., 2007; Huijnen et al., 2010; Myriokefalitakis et al., 2011; Alexander et al., 2012; Lamarque et al., 2012; Simpson et al., 2012). Pye et al. (2020) presented the cloud water pH values simulated by five such models and included a limited comparison with observations. They found large differences among models particularly in dusty areas where pH estimates varied by 3–4 units. All models showed large systematic biases compared with observations. In light of these findings, Pye et al. (2020) highlighted the need for improvements in the cloud water simulations including further evaluation with observations.
Here, we present a global analysis of cloud water and precipitation pH in the GEOS-Chem model with an improved cloud water pH calculation, including in particular carboxylic acids and dust alkalinity, and an explicit precipitation pH calculation. We evaluate the simulation with extensive cloud water and precipitation measurements and determine the sources of acidity and alkalinity in different parts of the world. We examine the buffering effects of NH3 and carboxylic acids on cloud water pH as well as the changes in acid inputs to terrestrial ecosystems from post-depositional processes.
We use the GEOS-Chem atmospheric chemistry model (http://www.geos-chem.org, last access: 21 October 2020) version v11-02 with a number of modifications, some from more recent GEOS-Chem versions and some specifically from this work. The model is driven by assimilated meteorological fields from the NASA Global Modeling and Assimilation Office's Modern-Era Retrospective analysis for Research and Applications, version 2 (MERRA-2) system (Gelaro et al., 2017). These fields include in particular cloud water liquid and ice content, cloud volume fraction, and 3-D liquid and ice precipitation fluxes, updated every 3 h. GEOS-Chem includes detailed NOx–hydrocarbon–aerosol–halogen chemistry (Mao et al., 2013; Kim et al., 2015; Travis et al., 2016; Sherwen et al., 2016), and here we have added recent halogen updates (X. Wang et al., 2019). The model distinguishes between fine and coarse aerosol but does not otherwise include aerosol microphysics. Wet deposition follows the algorithm of Liu et al. (2001) including rainout (in-cloud scavenging), washout (below-cloud scavenging), and scavenging in convective updrafts, with updates by Wang et al. (2011) and Amos et al. (2012). Dry deposition follows a standard resistance-in-series scheme (Wesely, 1989; Wang et al., 1998). We conduct the simulation on a global 4∘ latitude × 5∘ longitude grid for the year 2013 following an initialization period of 1 year.
2.1 Emissions and acid-producing chemistry
Here, we describe the GEOS-Chem emissions and chemistry most relevant to the simulation of cloud water and precipitation acidity. Emissions are calculated by the Harvard-NASA Emissions Component (HEMCO; Keller et al., 2014). Default anthropogenic emissions of SO2, NOx, and NH3 are from the global CEDS emissions inventory for 2013 (Hoesly et al., 2018). They are superseded by regional emission inventories including MIX over Asia for 2010 (M. Li et al., 2017), MEIC over China for 2013 (Zheng et al., 2018), NEI 2011 over the US scaled to 2013 (Travis et al., 2016; U.S. Environmental Protection Agency, 2018), APEI over Canada for 2013 (van Donkelaar et al., 2008), EMEP 2008 over Europe scaled to 2013 (EEA, 2019), and DICE over Africa for 2013 (Marais and Wiedinmyer, 2016). Ship SO2 emissions are from Eyring et al. (2005). Ship NOx emissions are from the ICOADS inventory (Wang et al., 2008) and are preprocessed with the PARANOX ship plume model (Vinken et al., 2011; Holmes et al., 2014). Aircraft emissions are from the AEIC inventory (Stettler et al., 2011). Biomass burning emissions are from GFED v4 (van der Werf et al., 2017). Natural emissions include NOx from lightning (Murray et al., 2012) and soil (Hudman et al., 2012), volcanic SO2 (Fisher et al., 2011), marine dimethyl sulfide (DMS; Breider et al., 2017), and NH3 from oceans, natural soils, and human population (Bouwman et al., 1997). Sea salt aerosol emissions in two size classes (fine and coarse) follow Jaeglé et al. (2011). Dust emissions include desert and semi-desert sources (Fairlie et al., 2007; Ridley et al., 2013) as well as combustion and industrial sources (Philip et al., 2017) in four size classes (one fine and three coarse). Biogenic volatile organic compound (VOC) emissions are from MEGAN (Guenther et al., 2012; Hu et al., 2015).
Sulfur chemistry in GEOS-Chem includes oxidation of DMS to SO2 and methanesulfonic acid (MSA), gas-phase oxidation of SO2 to H2SO4, and aqueous-phase oxidation of SO2 to H2SO4 in clouds, rain, and alkaline sea salt aerosols (Alexander et al., 2005, 2009; Q. Chen et al., 2017). Nitrogen chemistry includes oxidation of NOx to HNO3 in the gas phase as well as in the aqueous phase of aerosols and clouds (McDuffie et al., 2018; Holmes et al., 2019). Tropospheric HCl is mainly from acid displacement reactions on sea salt aerosols (X. Wang et al., 2019).
HNO3, HCl, and NH3 are semi-volatile, and their gas–particle partitioning affects their scavenging efficiency in cloud water and precipitation (Amos et al., 2012). We calculate this partitioning at bulk thermodynamic equilibrium using ISORROPIA II for the H2SO4–HNO3–HCl–NH3–NVC metastable aqueous system, where NVC represents the non-volatile cations from fine-mode sea salt aerosol (X. Wang et al., 2019). The uptake of HNO3 and release of HCl (acid displacement) on coarse-mode sea salt aerosol is treated as a kinetic process (X. Wang et al., 2019).
2.2 Simulation of HCOOH and CH3COOH
The most important carboxylic acids for cloud water and precipitation acidity are HCOOH (pKa=3.8 at 298 K) and CH3COOH (pKa=4.8 at 298 K) (Morgan, 1982; Keene et al., 1983). (Ka is the acid dissociation constant and .) HCOOH and CH3COOH are present in the atmosphere at comparable concentrations (Talbot et al., 1997), but HCOOH is more important for contributing to acidity because of its higher Henry's law solubility and lower pKa. Sources of these acids include secondary production from VOC oxidation and direct emissions from biomass burning, fossil fuels, soils, and vegetation (Khare et al., 1999), but these are poorly understood and models greatly underestimate atmospheric concentrations (Paulot et al., 2011; Stavrakou et al., 2012; Millet et al., 2015; Khan et al., 2018). Here, we use the previous GEOS-Chem HCOOH simulation by Millet et al. (2015) which scales up the biogenic emissions from the MEGAN inventory (Guenther et al., 2012) in order to fit atmospheric observations over the US. This yields a global HCOOH source of 1900 Gmol a−1. Stavrakou et al. (2012) previously estimated a global HCOOH source of 2200–2600 Gmol a−1 from the inversion of satellite data. In addition, we assume a minimum background mixing ratio of 100 pptv (50 pptv south of 60∘ S), based on measurements in the marine boundary layer and the free troposphere (Arlander et al., 1990; Talbot et al., 1990, 1997; Legrand et al., 2004) and satellite-derived free troposphere HCOOH columns over marine areas of 1–2×10¹⁵ (Franco et al., 2020).
Our CH3COOH simulation follows the standard GEOS-Chem mechanism (Mao et al., 2013; Travis et al., 2016) without further improvement, except that the minimum background CH3COOH concentration is also taken to be 100 pptv (50 pptv south of 60∘ S), based on observations in the marine boundary layer and the free troposphere (Arlander et al., 1990; Talbot et al., 1990, 1997; Helas et al., 1992; Franco et al., 2020). The global simulated CH3COOH source is 1000 Gmol a−1. Other modeling studies attempting to fit CH3COOH observations have estimated a source in the range of 1700–3900 Gmol a−1 (Baboukas et al., 2000; Khan et al., 2018).
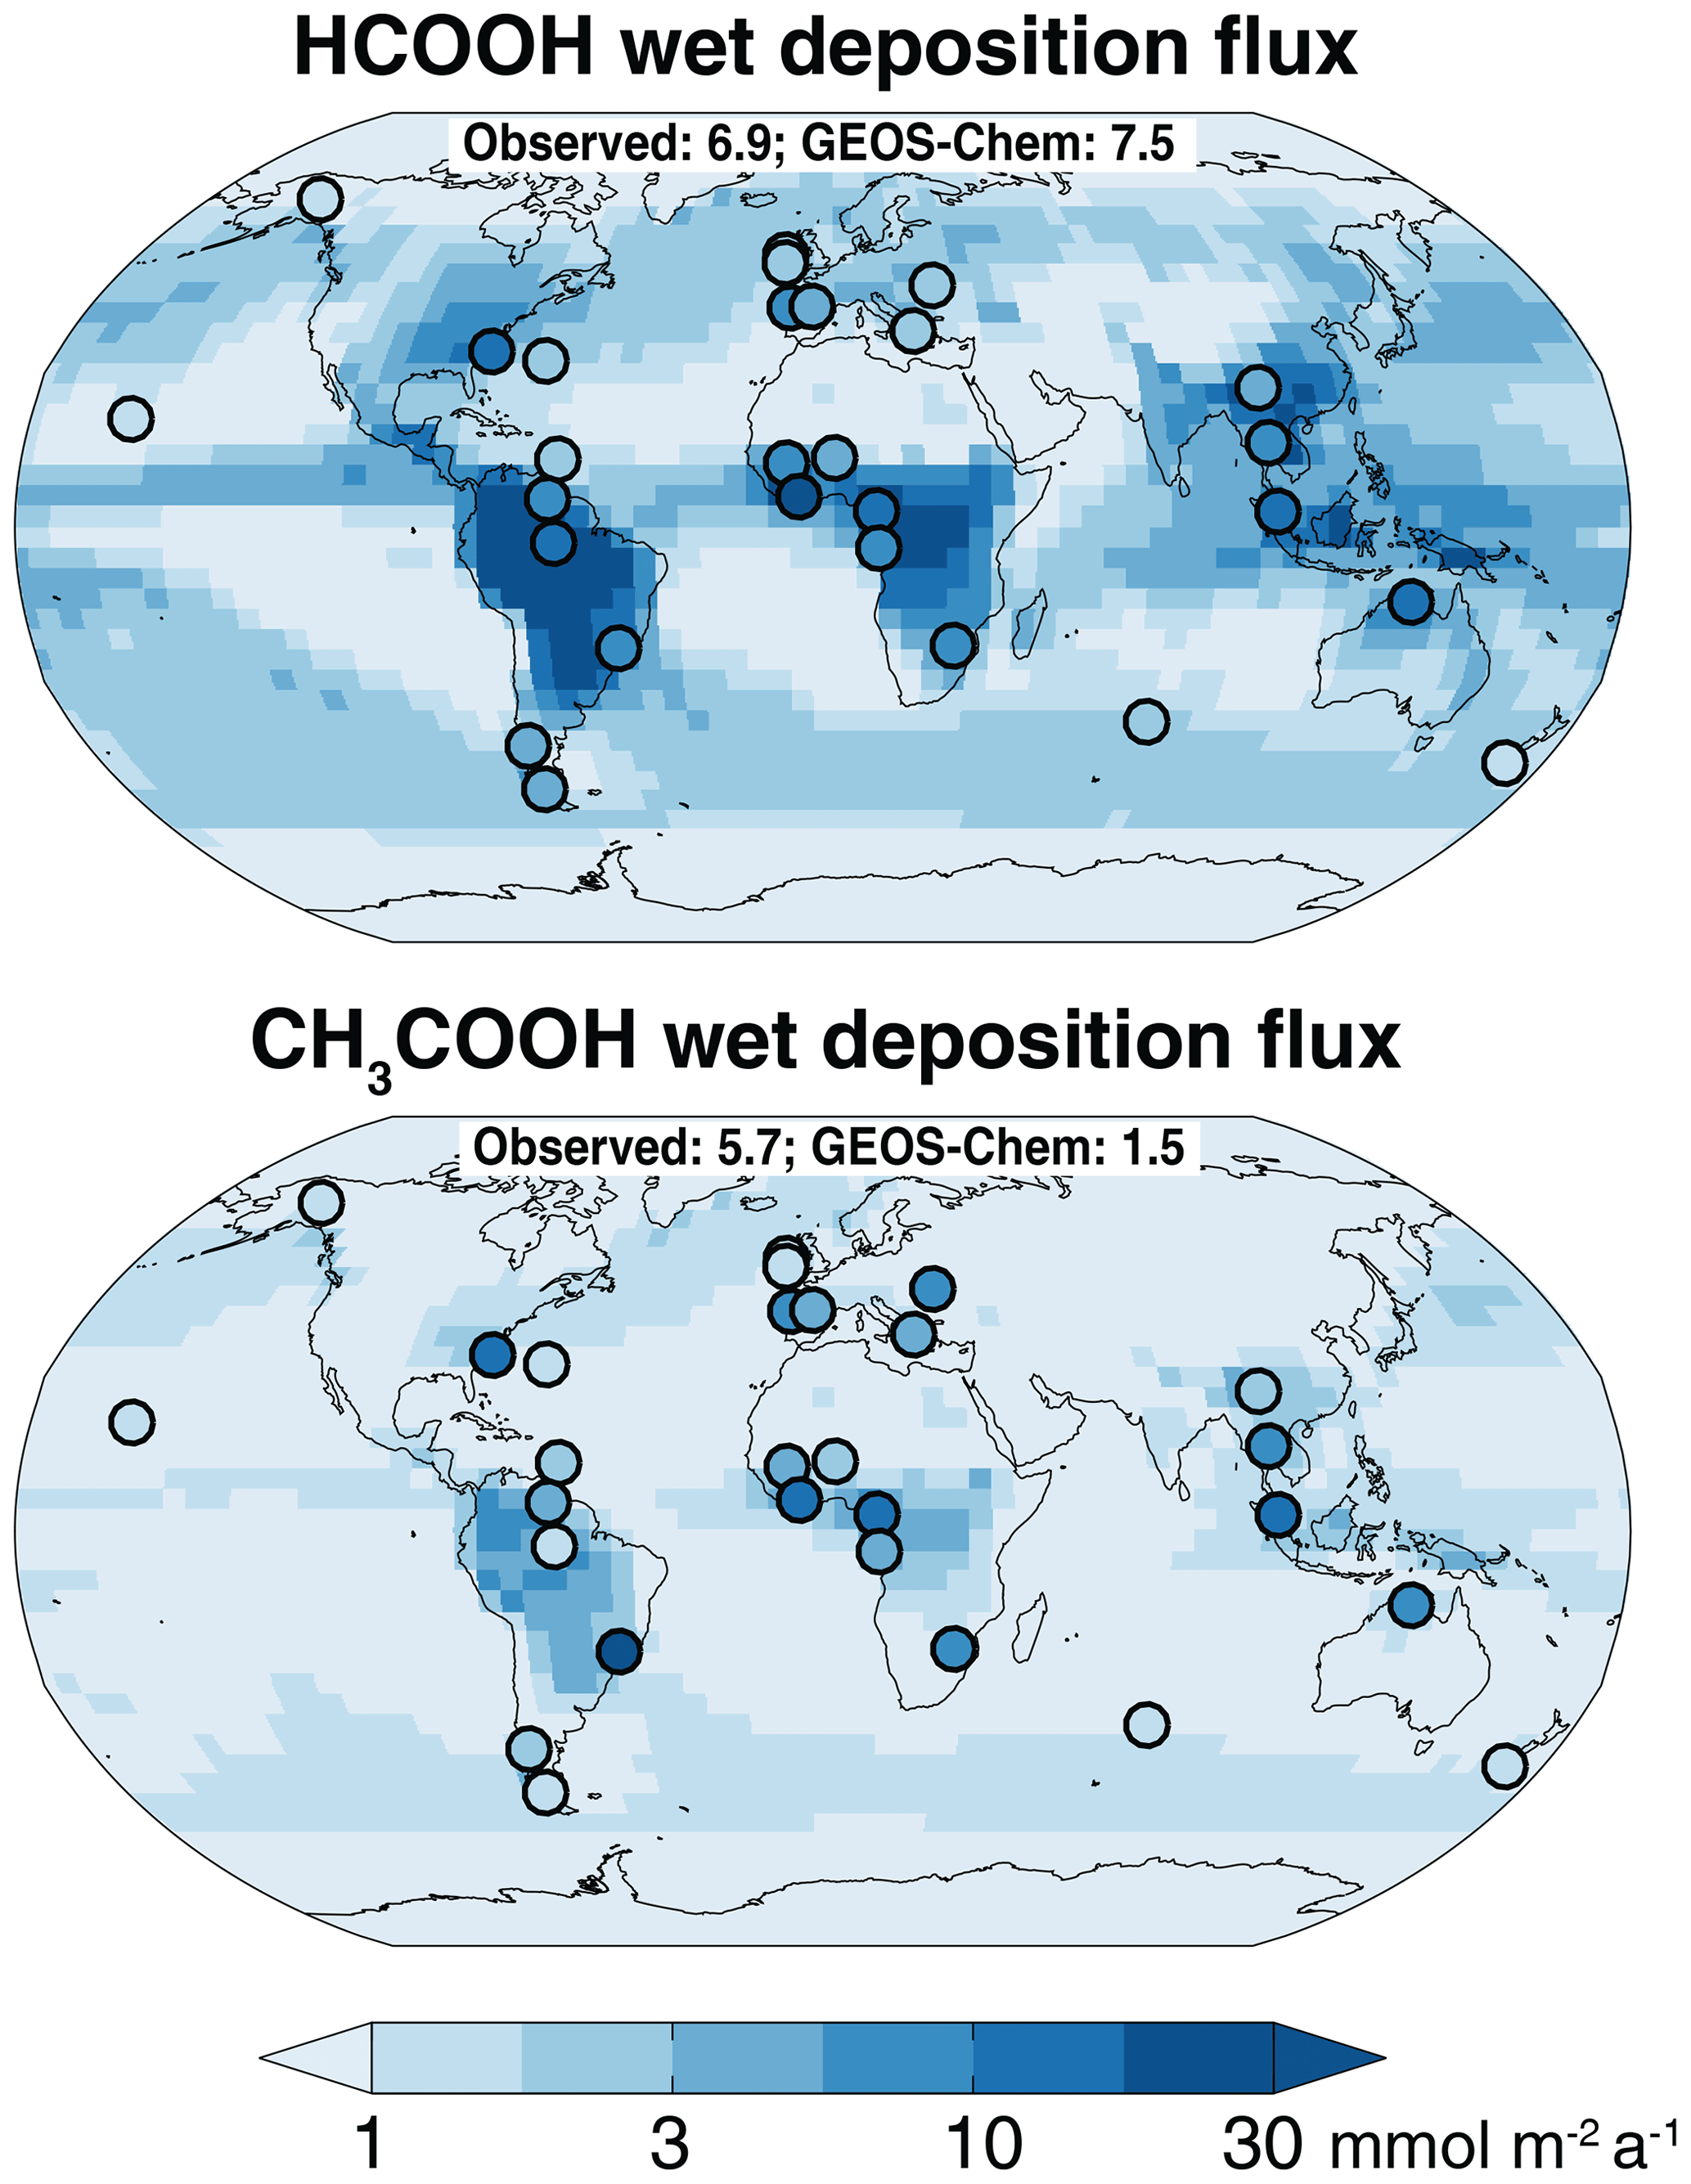
Figure 1Annual mean wet deposition fluxes of HCOOH and CH3COOH. The GEOS-Chem model values (contours) are for the year 2013, and the observations (circles) are for various years as compiled by Vet et al. (2014) and Keene et al. (2015). The compilations only include studies that used adequate methods to preserve HCOOH and CH3COOH in precipitation samples. We exclude studies with measurement periods of less than 1 year. For studies that reported only precipitation concentrations, we estimate the deposition fluxes using climatological rainfall data for the corresponding locations from the Global Precipitation Climatology Center (Meyer-Christoffer et al., 2018). The global mean observed fluxes and the corresponding GEOS-Chem fluxes are shown inset.
Figure 1 compares annual mean GEOS-Chem wet deposition fluxes of HCOOH and CH3COOH with observations from the compilations of Vet et al. (2014) and Keene et al. (2015). We find that the mean GEOS-Chem HCOOH flux (7.5 ) is consistent with the mean of the observations (6.9 ). The model captures the high fluxes observed in the tropical continents where there are large biogenic sources, and the low fluxes observed at marine sites. GEOS-Chem underestimates the CH3COOH flux by a factor of 4. The observed patterns of HCOOH and CH3COOH fluxes are similar, suggesting that model CH3COOH could be corrected similarly to HCOOH in future work by scaling up biogenic emission; however, the effect is relatively small. In the model, we find that the global mean cloud water pH would decrease by 0.05 units if we increased CH3COOH concentrations by a factor of 4.
Table 1Henry's law coefficients for the calculations of cloud water and precipitation pH∗.
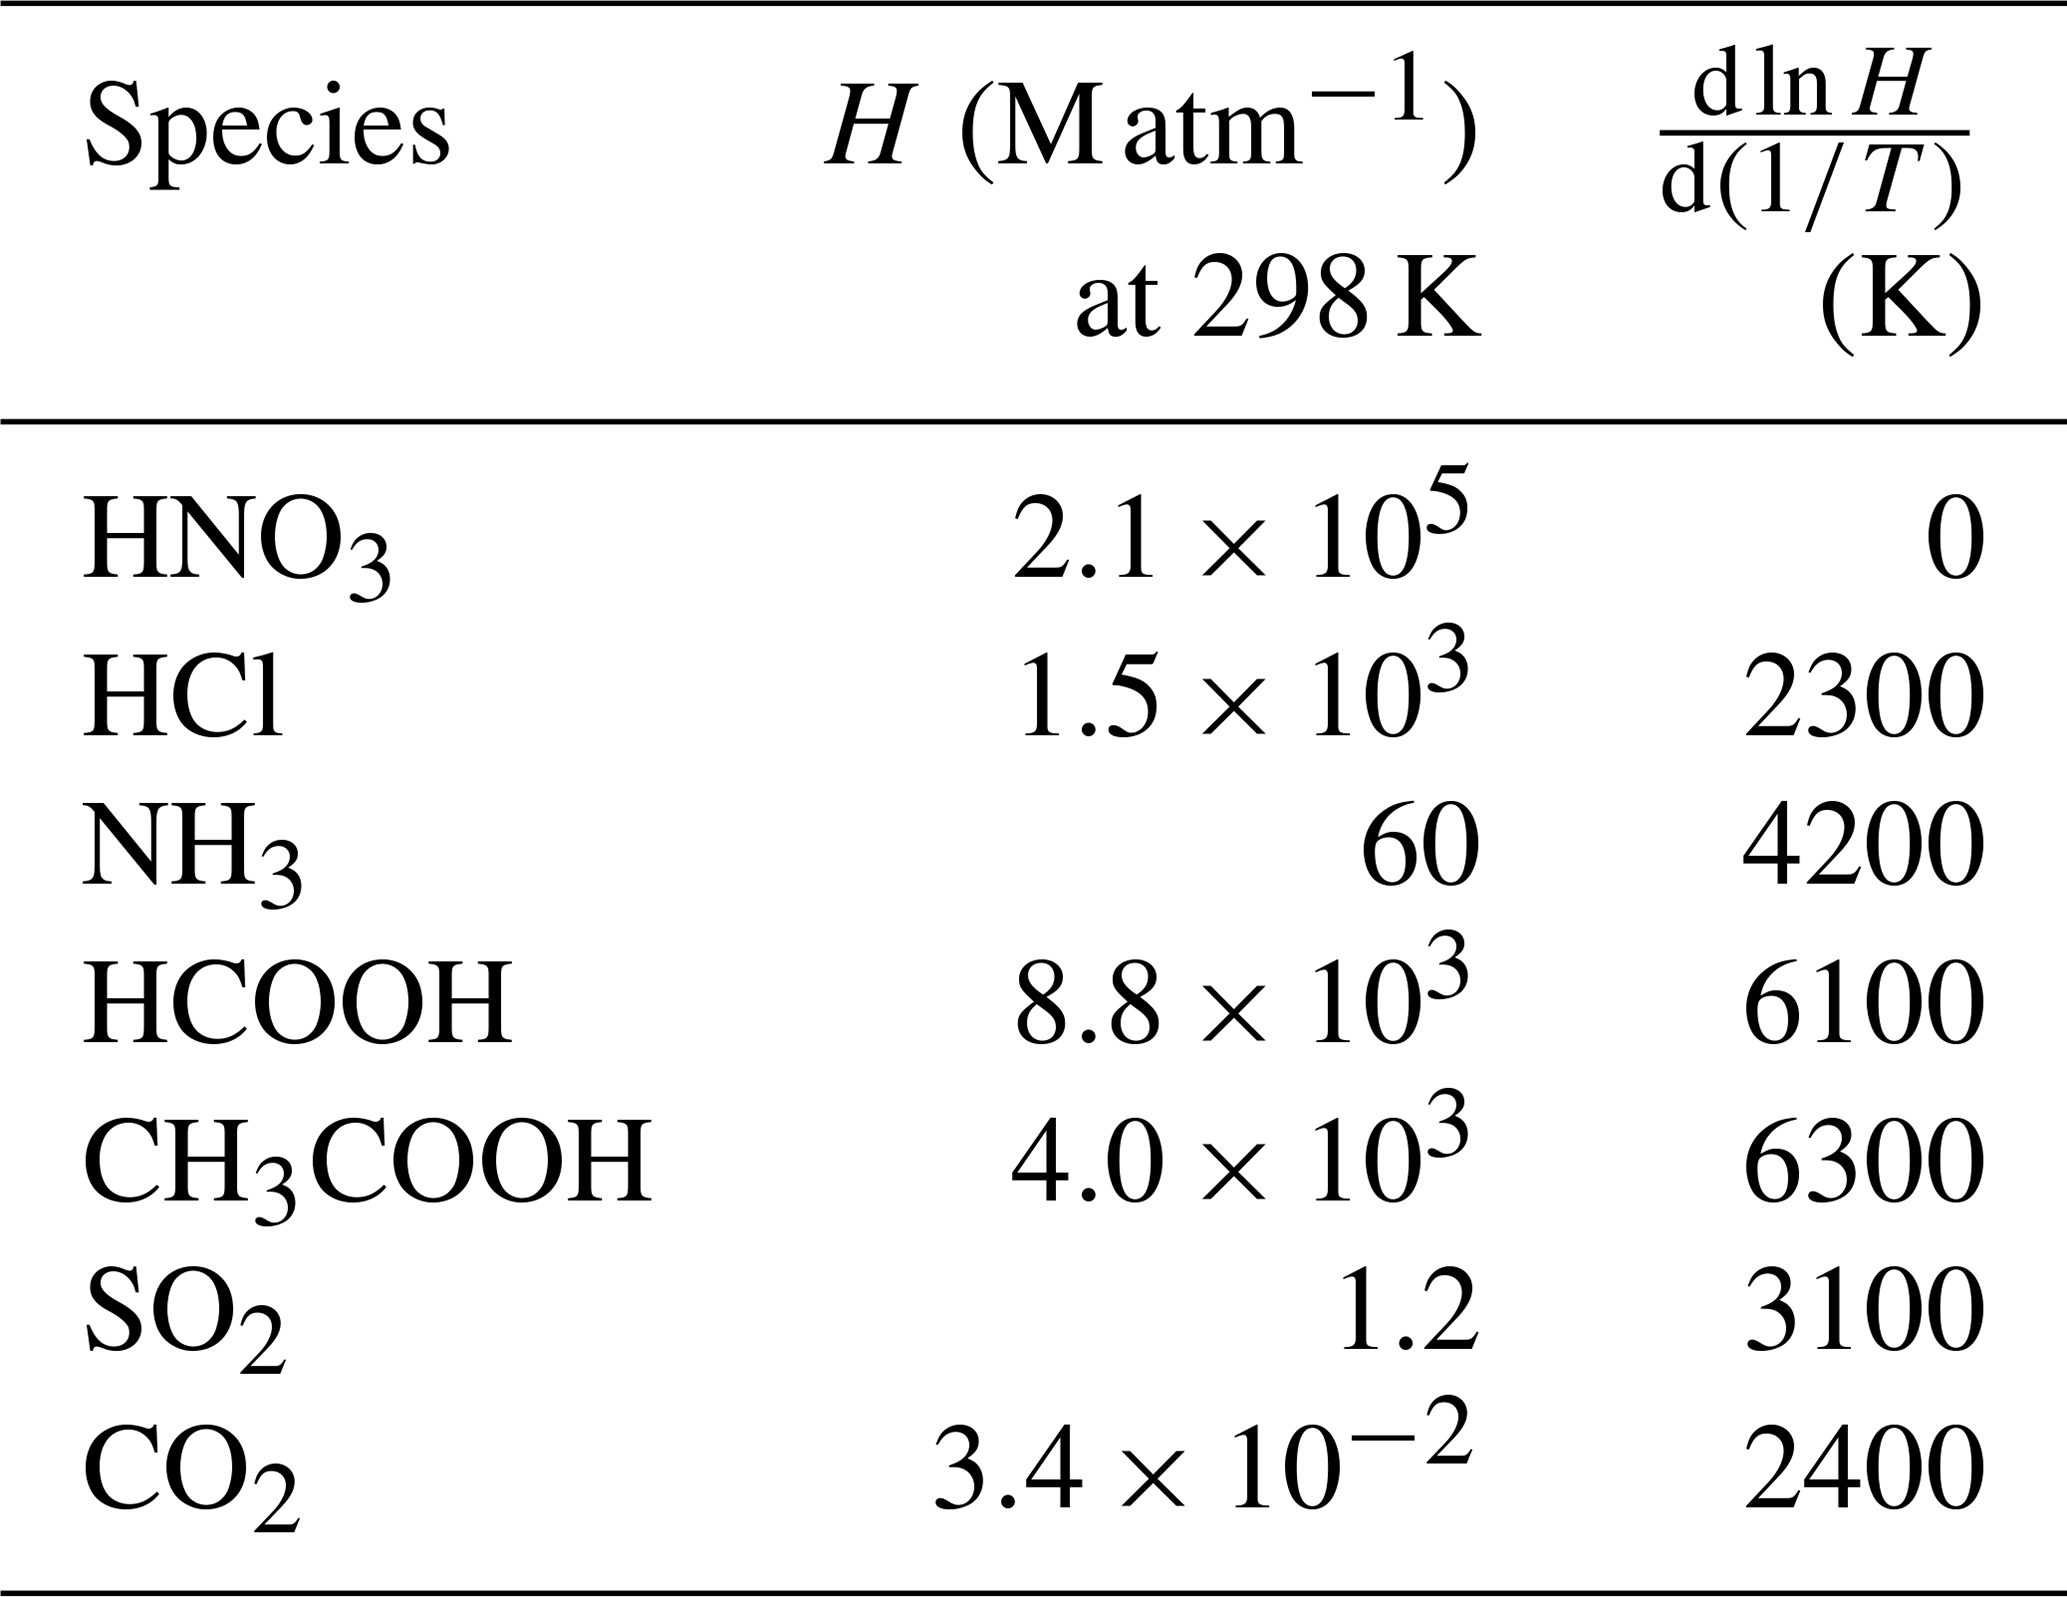
∗ From the compilation of Sander (2015).
Table 2Acid–base dissociation constants for the calculations of cloud water and precipitation pH∗.
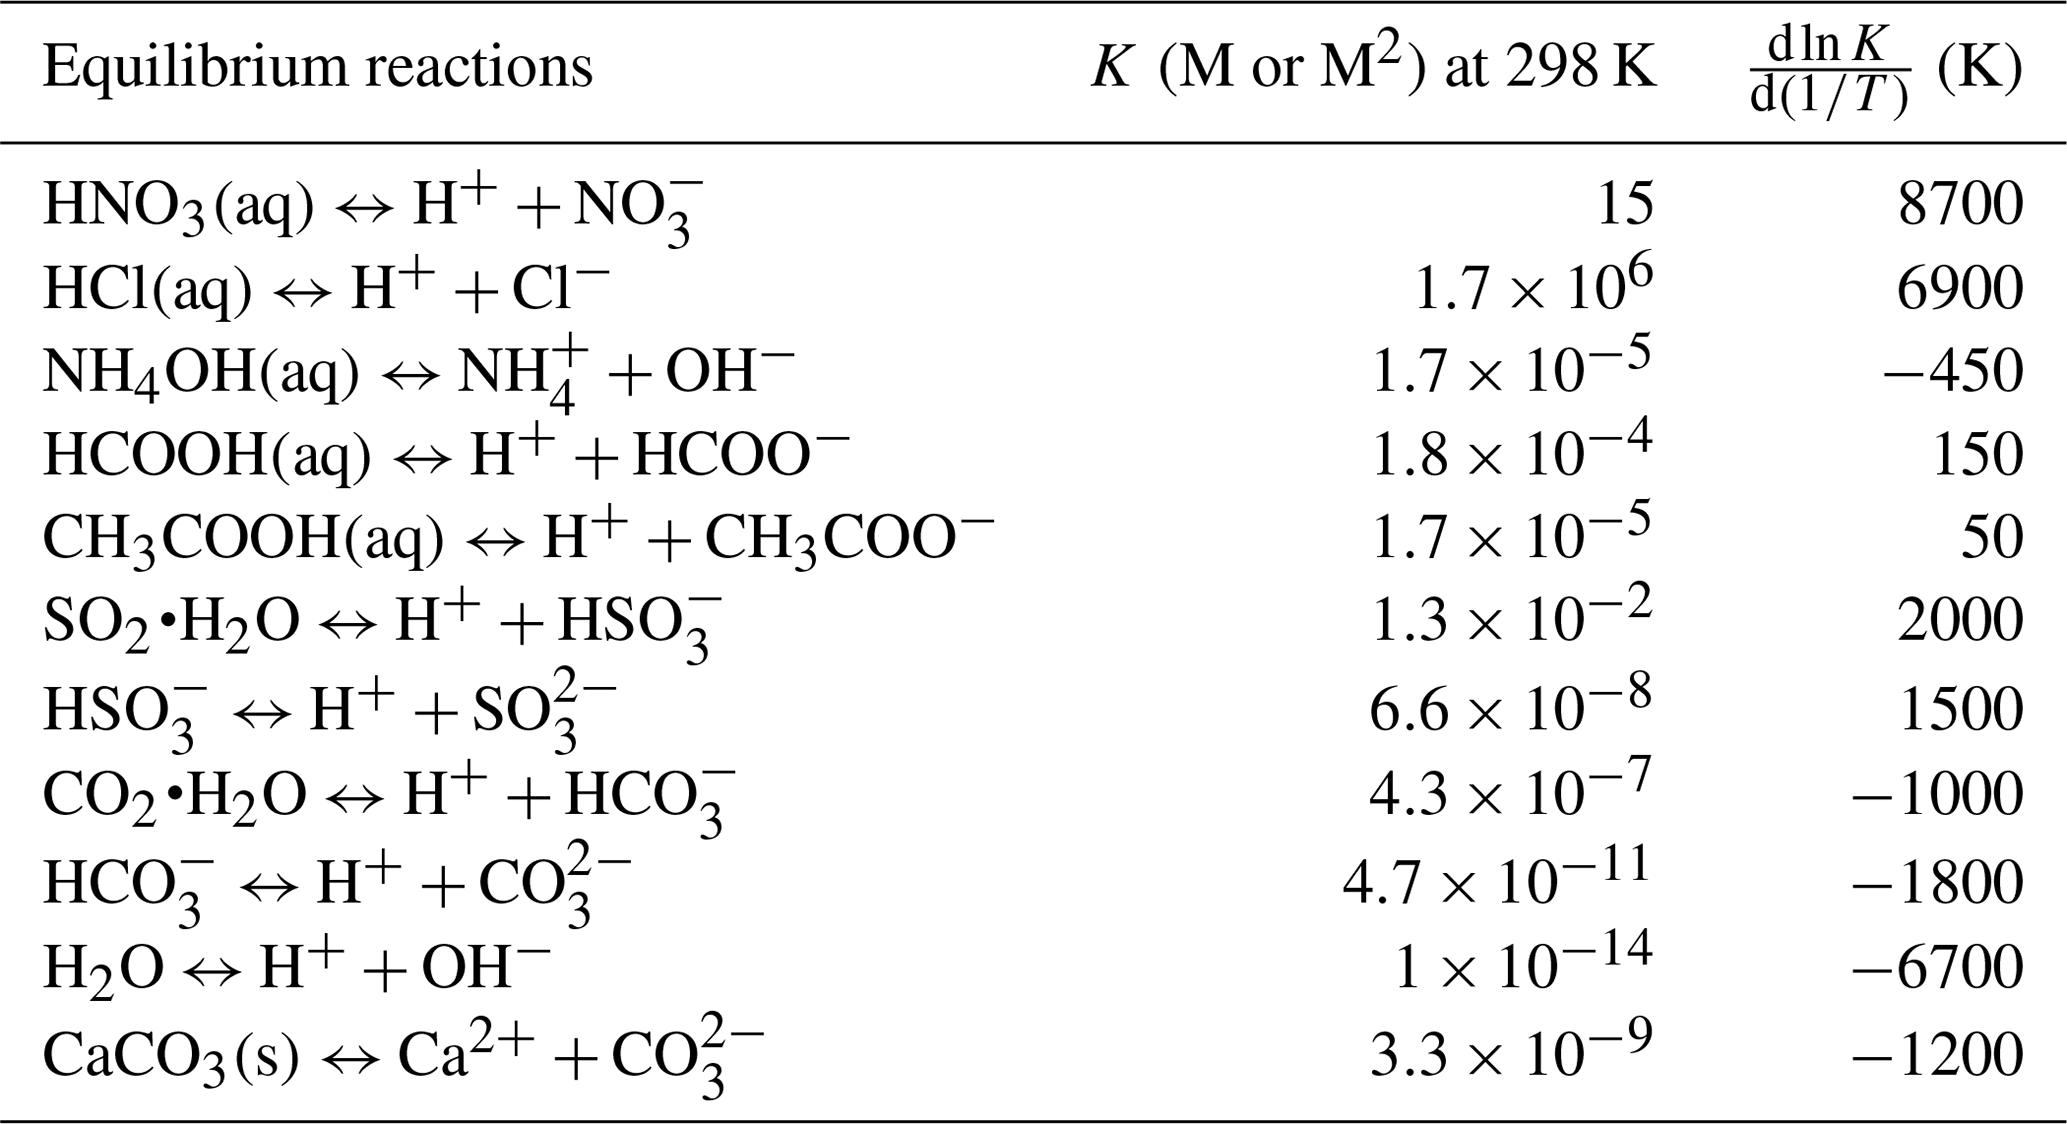
∗ From Pandis and Seinfeld (1989), except for CaCO3(s) (Nordstrom et al., 1990), and HCOOH(aq) and CH3COOH(aq) (Khare et al., 1999).
2.3 Calculation of cloud water and precipitation composition and pH
Cloud water composition is computed locally in each grid cell containing liquid cloud water over 30 min time steps using the in-cloud liquid water content and cloud volume fraction from MERRA-2. Dissolution of gases in the cloud droplets follows the Henry's law constants of Table 1 and the acid–base dissociation constants of Table 2. We assume that 70 % of fine aerosol mass and 100 % of coarse aerosol mass are partitioned into cloud water (Hegg et al., 1984; Alexander et al., 2012). Sulfate–nitrate–ammonium and sea salt particles dissolve completely in cloud water, and the alkaline component of the dust particles also dissolves. Freshly emitted sea salt particles contain an alkalinity of 0.07 eq kg−1 (Alexander et al., 2005), whereas freshly emitted dust particles contain an alkalinity of 4.5 eq kg−1 based on the assumption of 7.1 % Ca2+ and 1.1 % Mg2+ by dry mass (Engelbrecht et al., 2016) with as the anion. Sea salt NVCs are expressed as Na+ equivalents, whereas dust NVCs are expressed as Ca2+ equivalents. The upper limit of the Ca2+ concentration is set by the formation of CaCO3(s).
Table 3Species included in the cloud water pH calculationa.

a The calculation assumes a closed system for the cloudy fraction of
the model grid cell where concentration totals (T) are conserved and are
partitioned between species using the Henry's law and the acid–base dissociation
equilibria of Tables 1 and 2 as well as the local cloud water liquid water content
and temperature.
b H2SO4 has sufficiently low vapor pressure to be completely
in the cloud water phase, and H2SO4(aq) and
concentrations are negligible at typical cloud water pH (>3).
c The CO2(g) mixing ratio is taken to be 390 ppm as representative of
2013.
The calculation of cloud water composition in the cloudy fraction of each grid cell assumes a closed system where the summed concentrations of gas and cloud water species in Table 3 are conserved, and the partitioning is then computed following the equilibria of Tables 1 and 2. The calculation is done by solving the electroneutrality equation iteratively using Newton's method (Moch et al., 2020). This improves on the original calculation of the cloud water composition in GEOS-Chem (Alexander et al., 2012) through the inclusion of additional acidic and alkaline species (HCl, HCOOH, CH3COOH, and NVCs) and using a more stable numerical solver.
We will present the results as time averages (mainly annual) and spatial averages (vertical or zonal). The time- and space-averaged cloud water [H+] cannot be calculated directly from the [H+] computed at each model time step in each grid cell because [H+] is a nonconservative quantity controlled by the other acidic and basic species in cloud water (Liljestrand, 1985). Therefore, we calculate the average cloud water [H+] from the corresponding volume-weighted average (VWA) concentrations of the cloud water ions. We assume that all acids and bases except carbonates are conserved in the aqueous phase. For HCOOH and CH3COOH, the total (dissociated + undissociated) amounts are assumed to be conserved. Thus, the time- and space-averaged cloud water [H+] is given as follows:
where represents the VWA molar concentration in cloud water of species A over the time period and spatial domain of interest. We calculate from the concentration of the species, [A]i,j, and the cloud liquid water content, Li,j, at each model time step i and grid cell j:
where [1, t] is the averaging time period, and [1, m] is the ensemble of grid cells included in the average. is calculated from the total aqueous concentration, , as follows:
where Ka is the acid dissociation constant from Table 2 computed at the average cloud water temperature for the time period and spatial domain. The same procedure is used for . is calculated from equilibrium with atmospheric CO2 as follows:
where and Kc1 are the Henry's law coefficient for CO2 and the acid dissociation constant, respectively, at the average cloud water temperature for the period and domain (Tables 1 and 2); is the CO2 partial pressure, taken to be 390 ppm as representative of 2013. Substituting these values in Eq. (4), . Over the range of cloud water pH values (3–8.5), and are negligible compared with and are omitted from Eq. (1) (Stumm et al., 1987). As , , and calculated in this way depend on , Eq. (1) is cubic in . The time- and space-averaged pH () is calculated from :
There is some arbitrariness in assuming that NH3, SO2, and carboxylic acids do not equilibrate with the gas phase during averaging. We examined the sensitivity to this assumption by assuming alternatively that NH3,T, SO2,T, HCOOHT, and CH3COOHT as defined in Table 3 (sum of gas-phase and aqueous-phase concentrations) are conserved and recalculating the gas–cloud water equilibrium for the time-averaged conditions. We find no significant difference in the computed .
Calculation of precipitation VWA composition including follows the same approach as for cloud water. In that case, we use the model-archived wet deposition fluxes including contributions from in-cloud and below-cloud scavenging. We assume that SO2 is instantly oxidized by H2O2 (as available) in precipitation and is scavenged as . As with cloud water, the maximum [Ca2+] is set by the formation of CaCO3(s). Precipitation pH measurements are generally reported as monthly means and do not account for HCOOH and CH3COOH, which biodegrade rapidly. To compare with measurements, we calculate a monthly for each grid cell by removing and from the charge balance in Eq. (1). From there, we calculate the annual precipitation VWA pH:
where is the mean precipitation [H+], and Pk is the precipitation depth for month k.

Figure 2Observed and simulated cloud water pH. Panel (a) shows the GEOS-Chem annual mean cloud water pH below 700 hPa for the year 2013 along with cloud water pH observations (filled circles) collected since 1980 (Table A1). See Sect. 2.3 for the procedure to compute average pH in the model. White color denotes areas where the topographic elevation is higher than 700 hPa. The maximum modeled and observed pH values are 8.2 and 7.3, respectively. Panel (b) shows the observations grouped by region (Table A1), with means ± standard deviations calculated from the ensemble of data sets for the region, and the corresponding GEOS-Chem mean values sampled at the location and month of the measurements. The global mean ± standard deviation pH values computed from the regional mean observed and modeled values are inset in panel (b).
3.1 Global distribution of cloud water pH and composition
Figure 2 shows the global distribution of cloud water pH as simulated by GEOS-Chem and as measured at mountain sites, coastal sites (marine fog), and from aircraft campaigns (Table A1). We exclude continental fog water measurements because of their sensitivity to local emissions. The measurements span the period from 1980 to 2018, but we generally exclude observations made before 2005 in East Asia, Europe, and the US because of the strong emission trends in these areas. We include some older measurements in the western US and northern Europe when there are no recent measurements in a particular region and the sites are relatively remote. Some of the observations are taken from the Pye et al. (2020) compilation.
Figure 2a shows the mean observed and simulated pH values. The observed values are as reported in the literature, where the computation of the mean is generally based on VWA [H+]. The model values are annual means below 700 hPa (≈3 km above sea level) for the year 2013. Figure 2b shows the observations aggregated by region and arranged in ascending pH order, along with the corresponding GEOS-Chem values. For comparison with the observations, the model is sampled at the locations and months of the measurements.
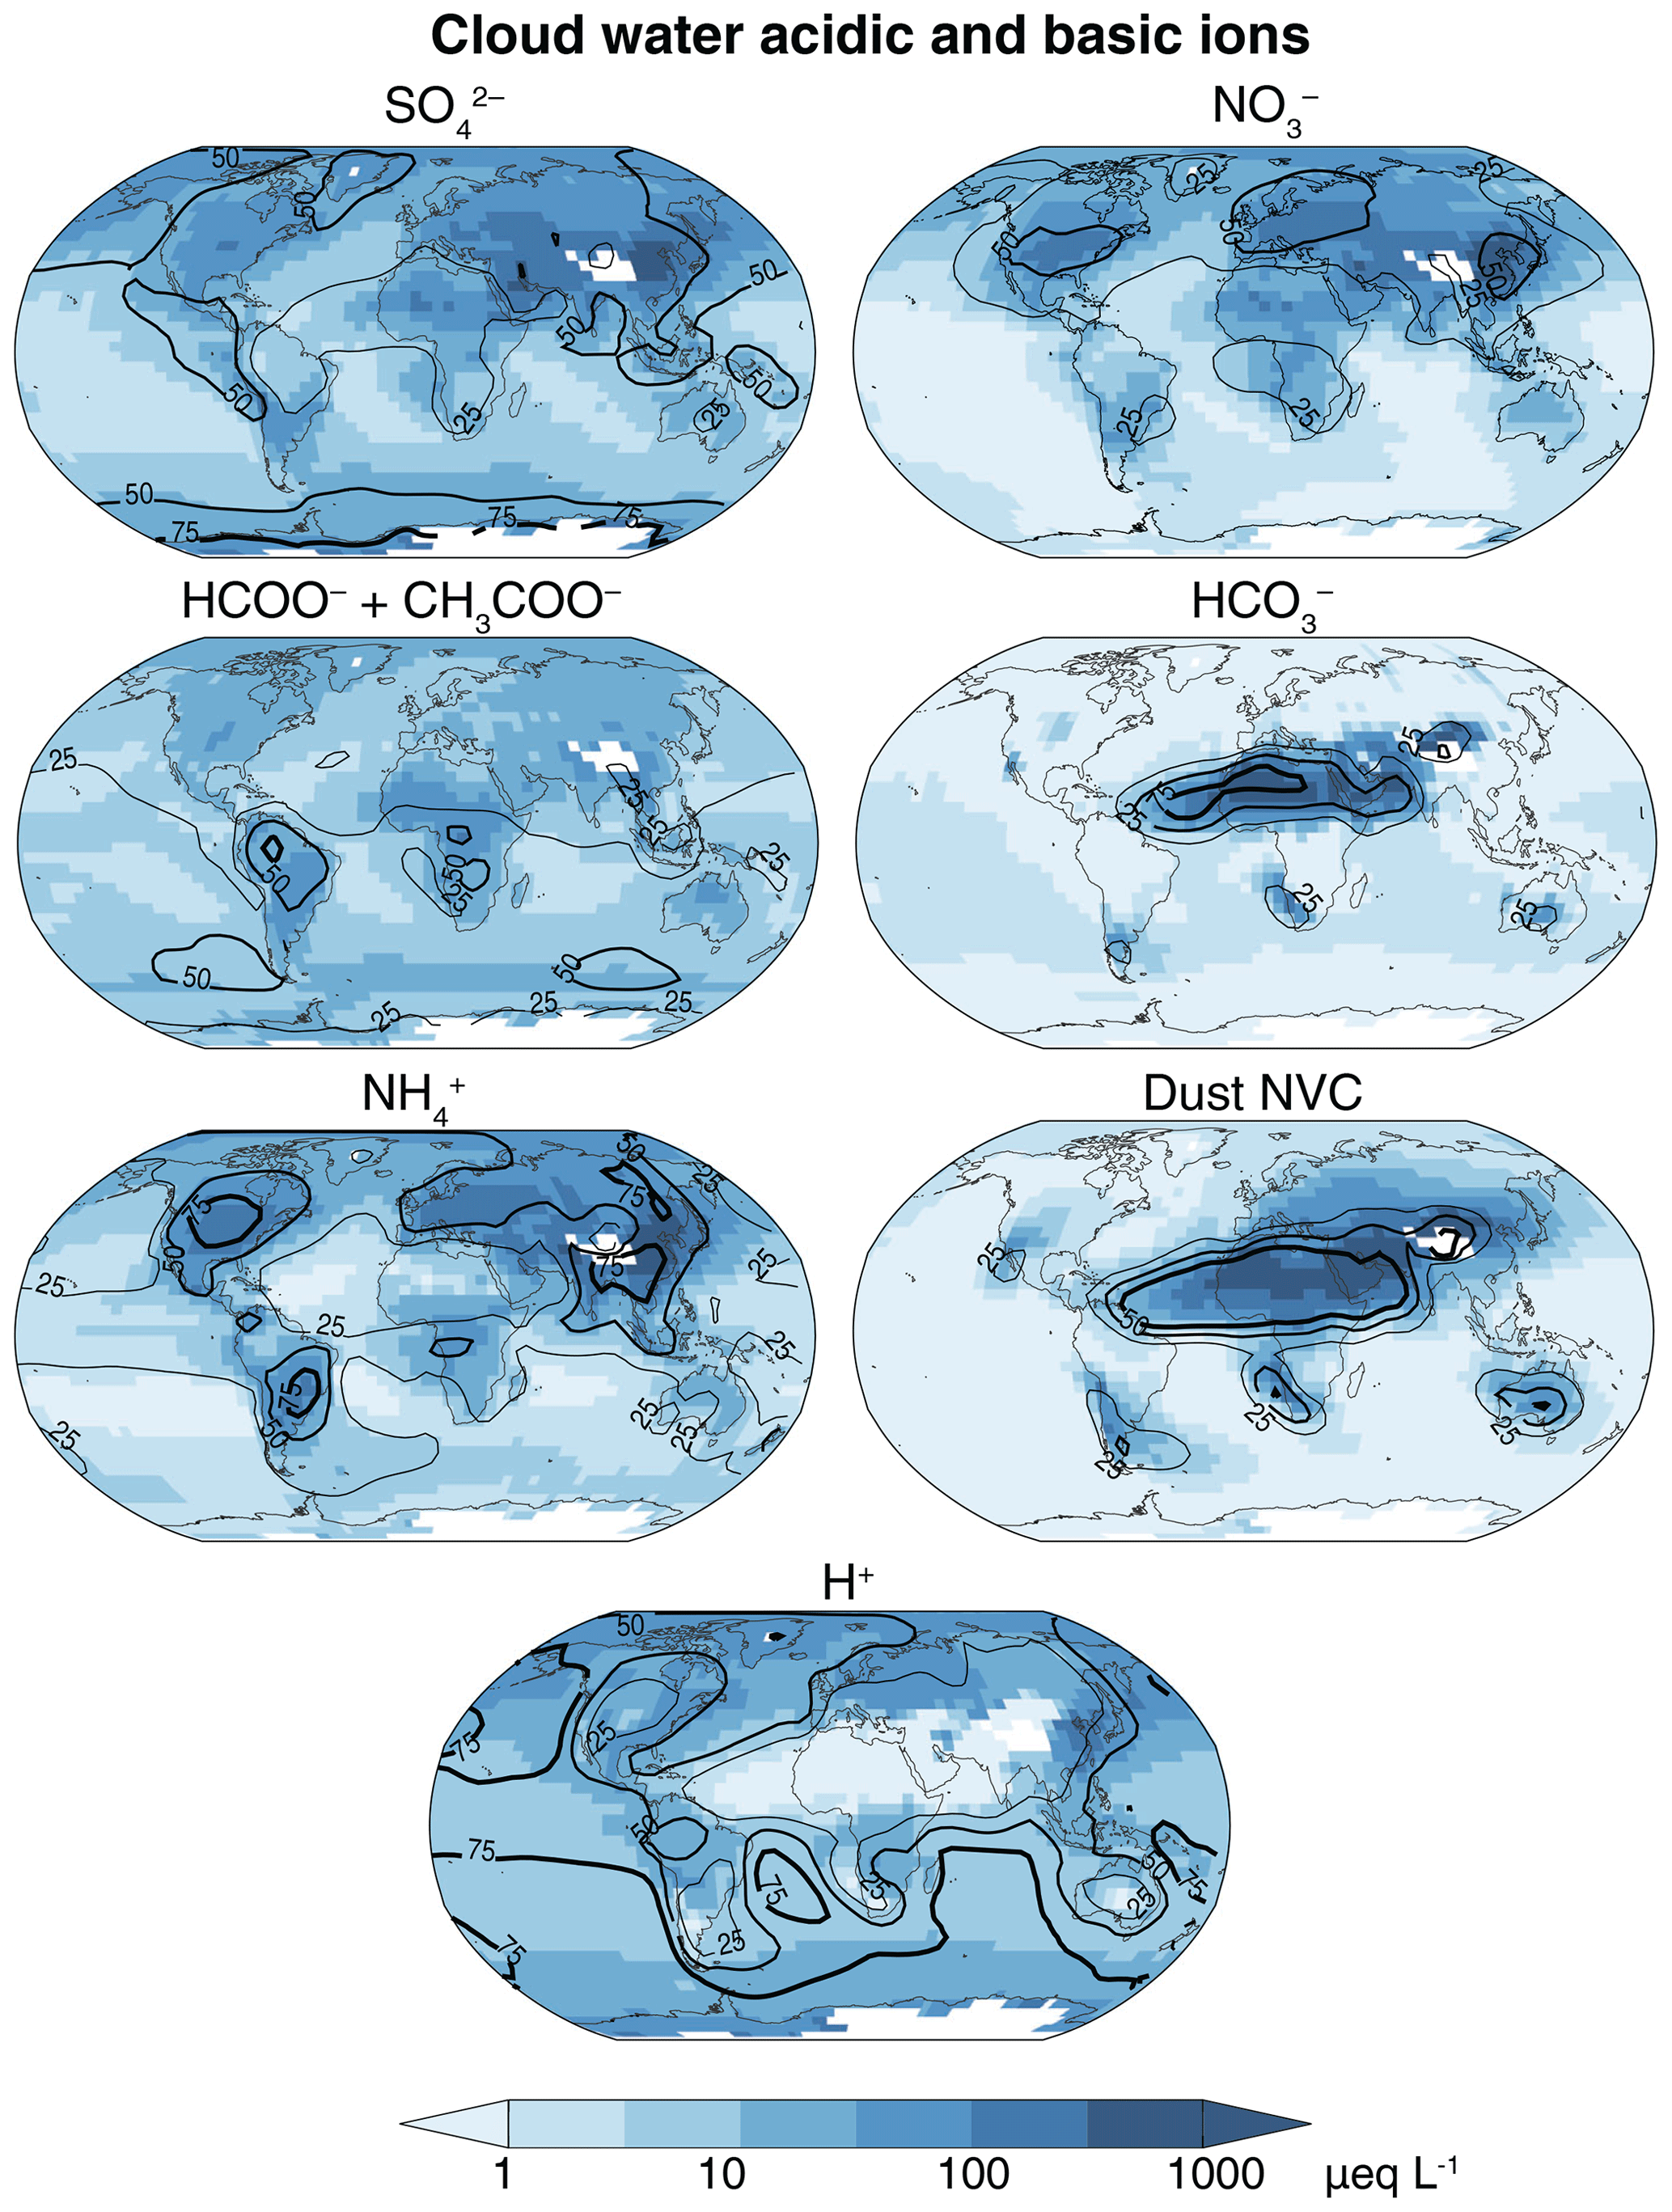
Figure 3GEOS-Chem cloud water equivalent concentrations of major acidic and basic ions. Values are annual volume-weighted averages below 700 hPa for the year 2013. The contour lines (25 %, 50 %, 75 %) show the percent contribution of each ion to the total anion or cation equivalents. Na+ and Cl− are not included in this total because they are largely in balance and make little net contribution to acidity. White color denotes areas where the topographic elevation is higher than 700 hPa.
The global mean cloud water pH in the observations is 5.2±0.9, compared to 5.0±0.8 in the model. Annual mean values in Fig. 2 range from 3 to 8, showing distinct spatial patterns. The spatial patterns can be understood from the distributions of acidic and basic ions shown in Fig. 3. Na+ and Cl− are major constituents of cloud water in marine and coastal areas, but they are not shown in the Fig. 3 because they are largely in balance and have little net effect on pH. Figure 3 also shows the percent contribution of each ion to the total anion or cation concentrations (contour lines).
The lowest pH values are generally over East Asia, both in the observations and in the model, with values mostly below 4.3 in eastern and southern China and Japan. In GEOS-Chem, this is due to extremely high [] and [], and despite 70 % of these anions being balanced by and dust cations. pH values remain low over the North Pacific (∼4.5), despite much lower acid inputs, because less than half of the acidic anions are balanced by bases.
Over the US and Europe, average pH values are in the range from 4 to 5 both in the observations and in the model, with most of the acidity as and with balancing over 50 % of the acidic anions. The model shows higher values in the central US (∼5.5) because of NH3 and dust emissions. Summertime observations in the southwest US by Hutchings et al. (2009) show a pH of 6.3 due to the large dust influence, but this seasonal dust emission is underestimated in GEOS-Chem (Fairlie et al., 2007). Over southern Europe, about 25 % of the base cations are from Saharan dust. is the main cation elsewhere in Europe. is the dominant acidic component over the northern midlatitude oceans because of the oceanic source of from the oxidation of DMS and because the continental influence extends further for than for (Heald et al., 2006). Over the Arctic, the simulated pH is much lower (4–4.5) because of the long-range transport of acidic species and less than 50 % neutralization (Fisher et al., 2011).
The carboxylate ions HCOO− and CH3COO− account for less than 25 % of H+ throughout the extra-tropical Northern Hemisphere (Fig. 3). The carboxylic acids are more important relative contributors to H+ in the tropics and in the Southern Hemisphere, exceeding 50 % in some areas of the tropical continents and southern midlatitudes. Ayers and Gillett (1988) found that carboxylic acids were responsible for an observed cloud water pH below 4 over tropical Australia, but GEOS-Chem underestimates carboxylic acids in that region (Fig. 1). Carboxylates were not measured in the Ecuadorian cloud water measurements (Makowski Giannoni et al., 2016), but we find from the model that the carboxylic acids contribute about 50 % of the H+. GEOS-Chem shows similar pH values to those observed at Cape Grim (mean of 5.5), reflecting the low concentrations of acidic and basic species from continental sources. Cloud water pH sampled on the Antarctic coast also has a mean pH of 5.5 (Saxena and Lin, 1990), but the model is much lower over the Antarctic coast because of from the oxidation of DMS. This may be because of sea salt alkalinity from blowing snow that is not accounted for in the model (Huang et al., 2018).
Alkaline cloud water (pH >5.6) is found in the observations over western India, Tibet, and Morocco, which is consistent with the model where the alkalinity is mainly from dust. GEOS-Chem simulates pH values of 6–8 over the area extending from the Sahara to the Gobi Desert. The transport of dust alkalinity from North Africa raises the cloud water pH in the Caribbean to above 5.5, both in the observations (Gioda et al., 2011) and in the model.
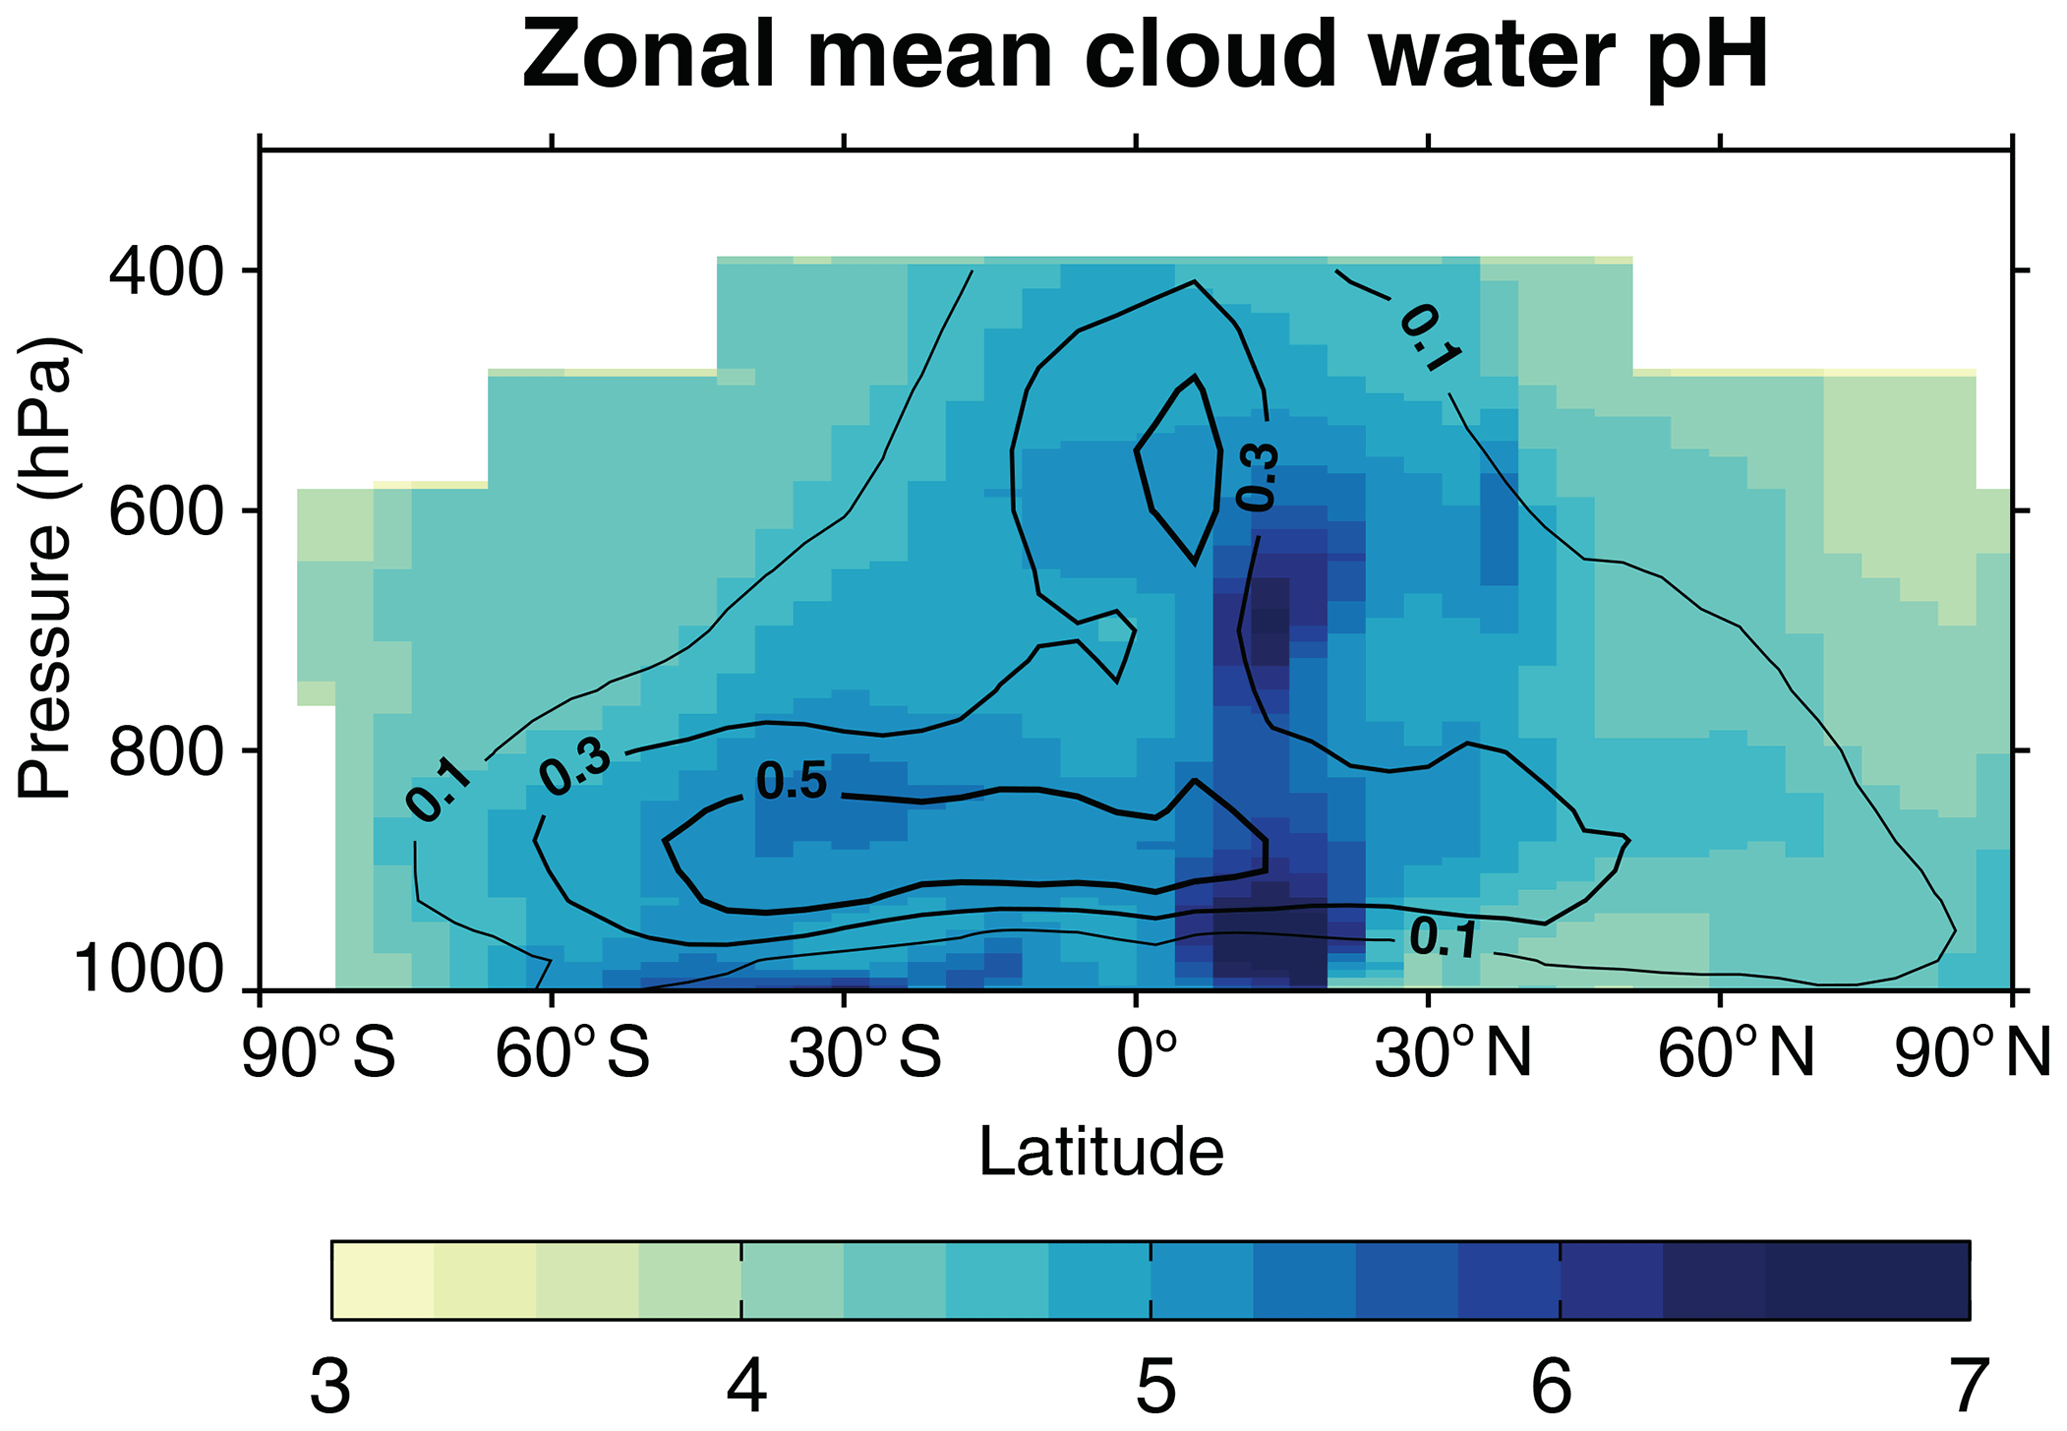
Figure 4Zonal mean cloud water pH simulated by GEOS-Chem. Values are annual volume-weighted averages for the year 2013. The contour lines show the annual mean MERRA-2 cloud liquid water content in grams per cubic meter (g m−3) for the cloudy fraction of grid cells where a liquid cloud is present. White color denotes areas where the cloud liquid water content is below 0.01 g m−3.
Figure 4 shows the zonal mean distributions of cloud water pH and cloud liquid water content (contour lines). In addition to the latitudinal variations described previously, cloud water pH increases as the cloud liquid water content increases because of the effect of dilution. Liquid water content peaks at about 900 hPa and decreases at higher altitudes, and this largely explains the mean variation of pH with altitude.

Figure 5Sensitivity of cloud water pH to decreasing acid inputs over the contiguous US. The upper bars show the volume-weighted average concentrations of acidic and basic ions for 2013, with additional dashed lines showing the undissociated concentrations of carboxylic acids (RCOOH) and the gas-phase concentration of ammonia (NH3). The lower bars show the effect of decreasing [] and [] by half relative to 2013 levels. All concentrations are expressed as cloud water equivalents. The corresponding pH values are indicated.
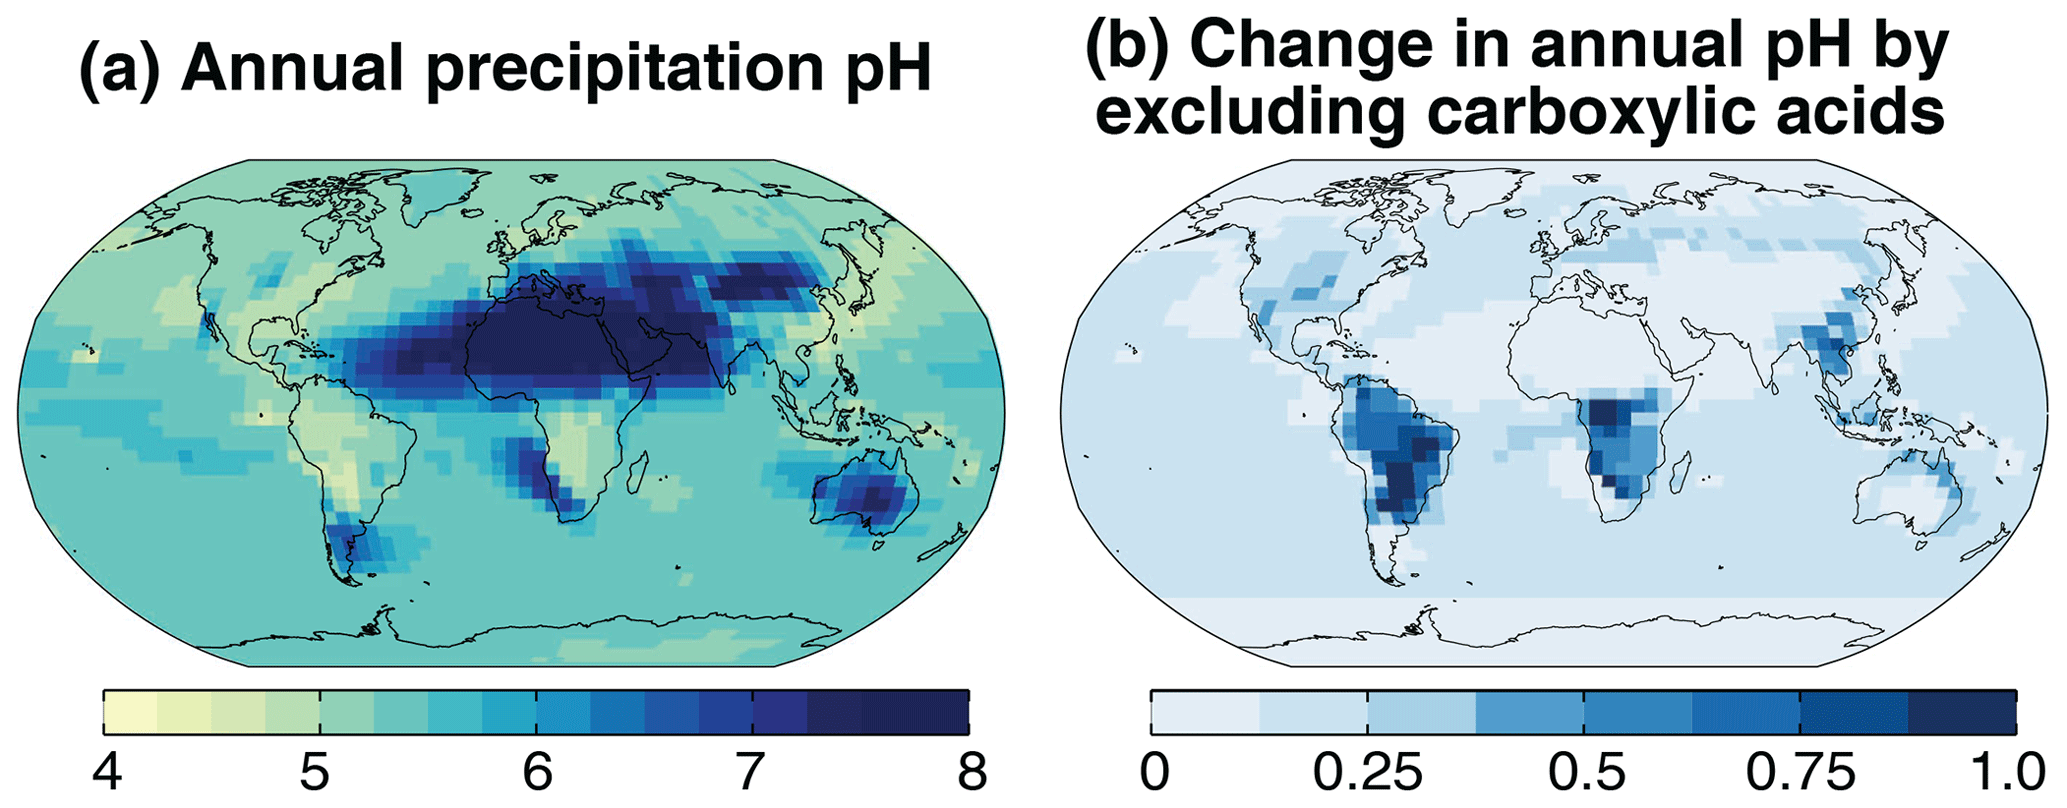
Figure 6(a) Annual mean precipitation pH simulated by GEOS-Chem for 2013. Panel (b) shows the change in precipitation pH when [HCOO−] and [CH3COO−] are excluded from the ionic charge balance. See Sect. 2.3 for the procedure to compute average pH in the model.
In their review, Pye et al. (2020) showed the annual mean tropospheric-column cloud water pH from three models: CMAQ (Community Multiscale Air Quality Modeling System; Northern Hemisphere only), TM4-ECPL (Tracer Model 4 of the Environmental Chemical Processes Laboratory), and GEOS-Chem. They calculated the annual mean pH using VWA [H+] rather than Eq. (1). We find that their calculation method underestimates the pH over alkaline regions by 1–3 units but has little error for acidic regions. The GEOS-Chem results shown in Pye et al. (2020) follow the previous cloud water [H+] calculation from Alexander et al. (2012), which is different from our calculation (Sect. 2). The resulting pH values are comparable over industrialized regions but differ by up to 2 units over tropical forests and deserts because carboxylic acids and dust alkalinity were not included. They are also generally higher than 6 over the oceans because of an error in the numerical solver. The pH values shown by Pye et al. (2020) for TM4-ECPL are lower than our simulation by 1–2 units over most areas, and they would be inconsistent with the observations shown in Fig. 2. Our pH estimates are closest to those from CMAQ, which was the only model in Pye et al. (2020) that included dust alkalinity and HCOOH in the cloud water pH calculation. The zonal mean cloud water pH values from the ECHAM5/MESSy1 (European Centre for Medium-Range Weather Forecasts Hamburg – Modular Earth Submodel System) model presented by Tost et al. (2007) are 0.2–0.3 units higher than our values, likely because of their omission of carboxylic acids.
Emissions of SO2 and NOx in the northern midlatitude continents are decreasing rapidly because of air quality concerns (Hoesly et al., 2018; Zheng et al., 2018). Considering that NH3 and dust cations presently balance over 50 % of the acidic anions over these continents (Fig. 3), one might expect large increases in the cloud water pH as SO2 and NOx emissions decrease. There is, however, a large buffering effect from the semi-volatile carboxylic acids and NH3. Consider the case of the US. Figure 5 shows the mean simulated cloud water composition for 2013 over the continental US as well as the change in composition resulting from a factor of 2 decrease in strong acidity (). The total concentrations of carboxylic acids (RCOOH) and ammonia (NH3,T) are held at 2013 levels and the gas–cloud water equilibrium is recalculated. For 2013, the mean cloud water pH is 4.7, a level at which only one-fourth of RCOOHTis present as carboxylate ions and most of the NH3,T is present as . Decreasing the strong acidity by half triples the dissociated fraction of RCOOHT and volatilizes a significant fraction of ; this limits the increase in the cloud water pH to 5.7. Without this buffering effect, the pH would have increased by 2.1 units to 6.8. volatilization exerts a stronger buffering effect than carboxylic acid dissolution because NH3,T concentrations are much larger. Buffering by CO2 and SO2 becomes important at pH values above 6 (Liljestrand, 1985), and buffering by higher organic acids is important in highly polluted areas (Collett et al., 1999).
The low sensitivity of cloud water pH to strong acidity is seen in the long-term measurements of summertime cloud water ions at Whiteface Mountain, NY (44∘22′ N, 73∘54′ W). Between 1994 and 2013, strong acidity at the site decreased by about 60 %, but cloud water pH increased by only 0.8 units (Schwab et al., 2016). At the same time, [] decreased by 45 % but co-located precipitation measurements showed no trend in NH3,T (Schwab et al., 2016), which suggests cloud water pH buffering by volatilization. Carboxylate ions were not measured.
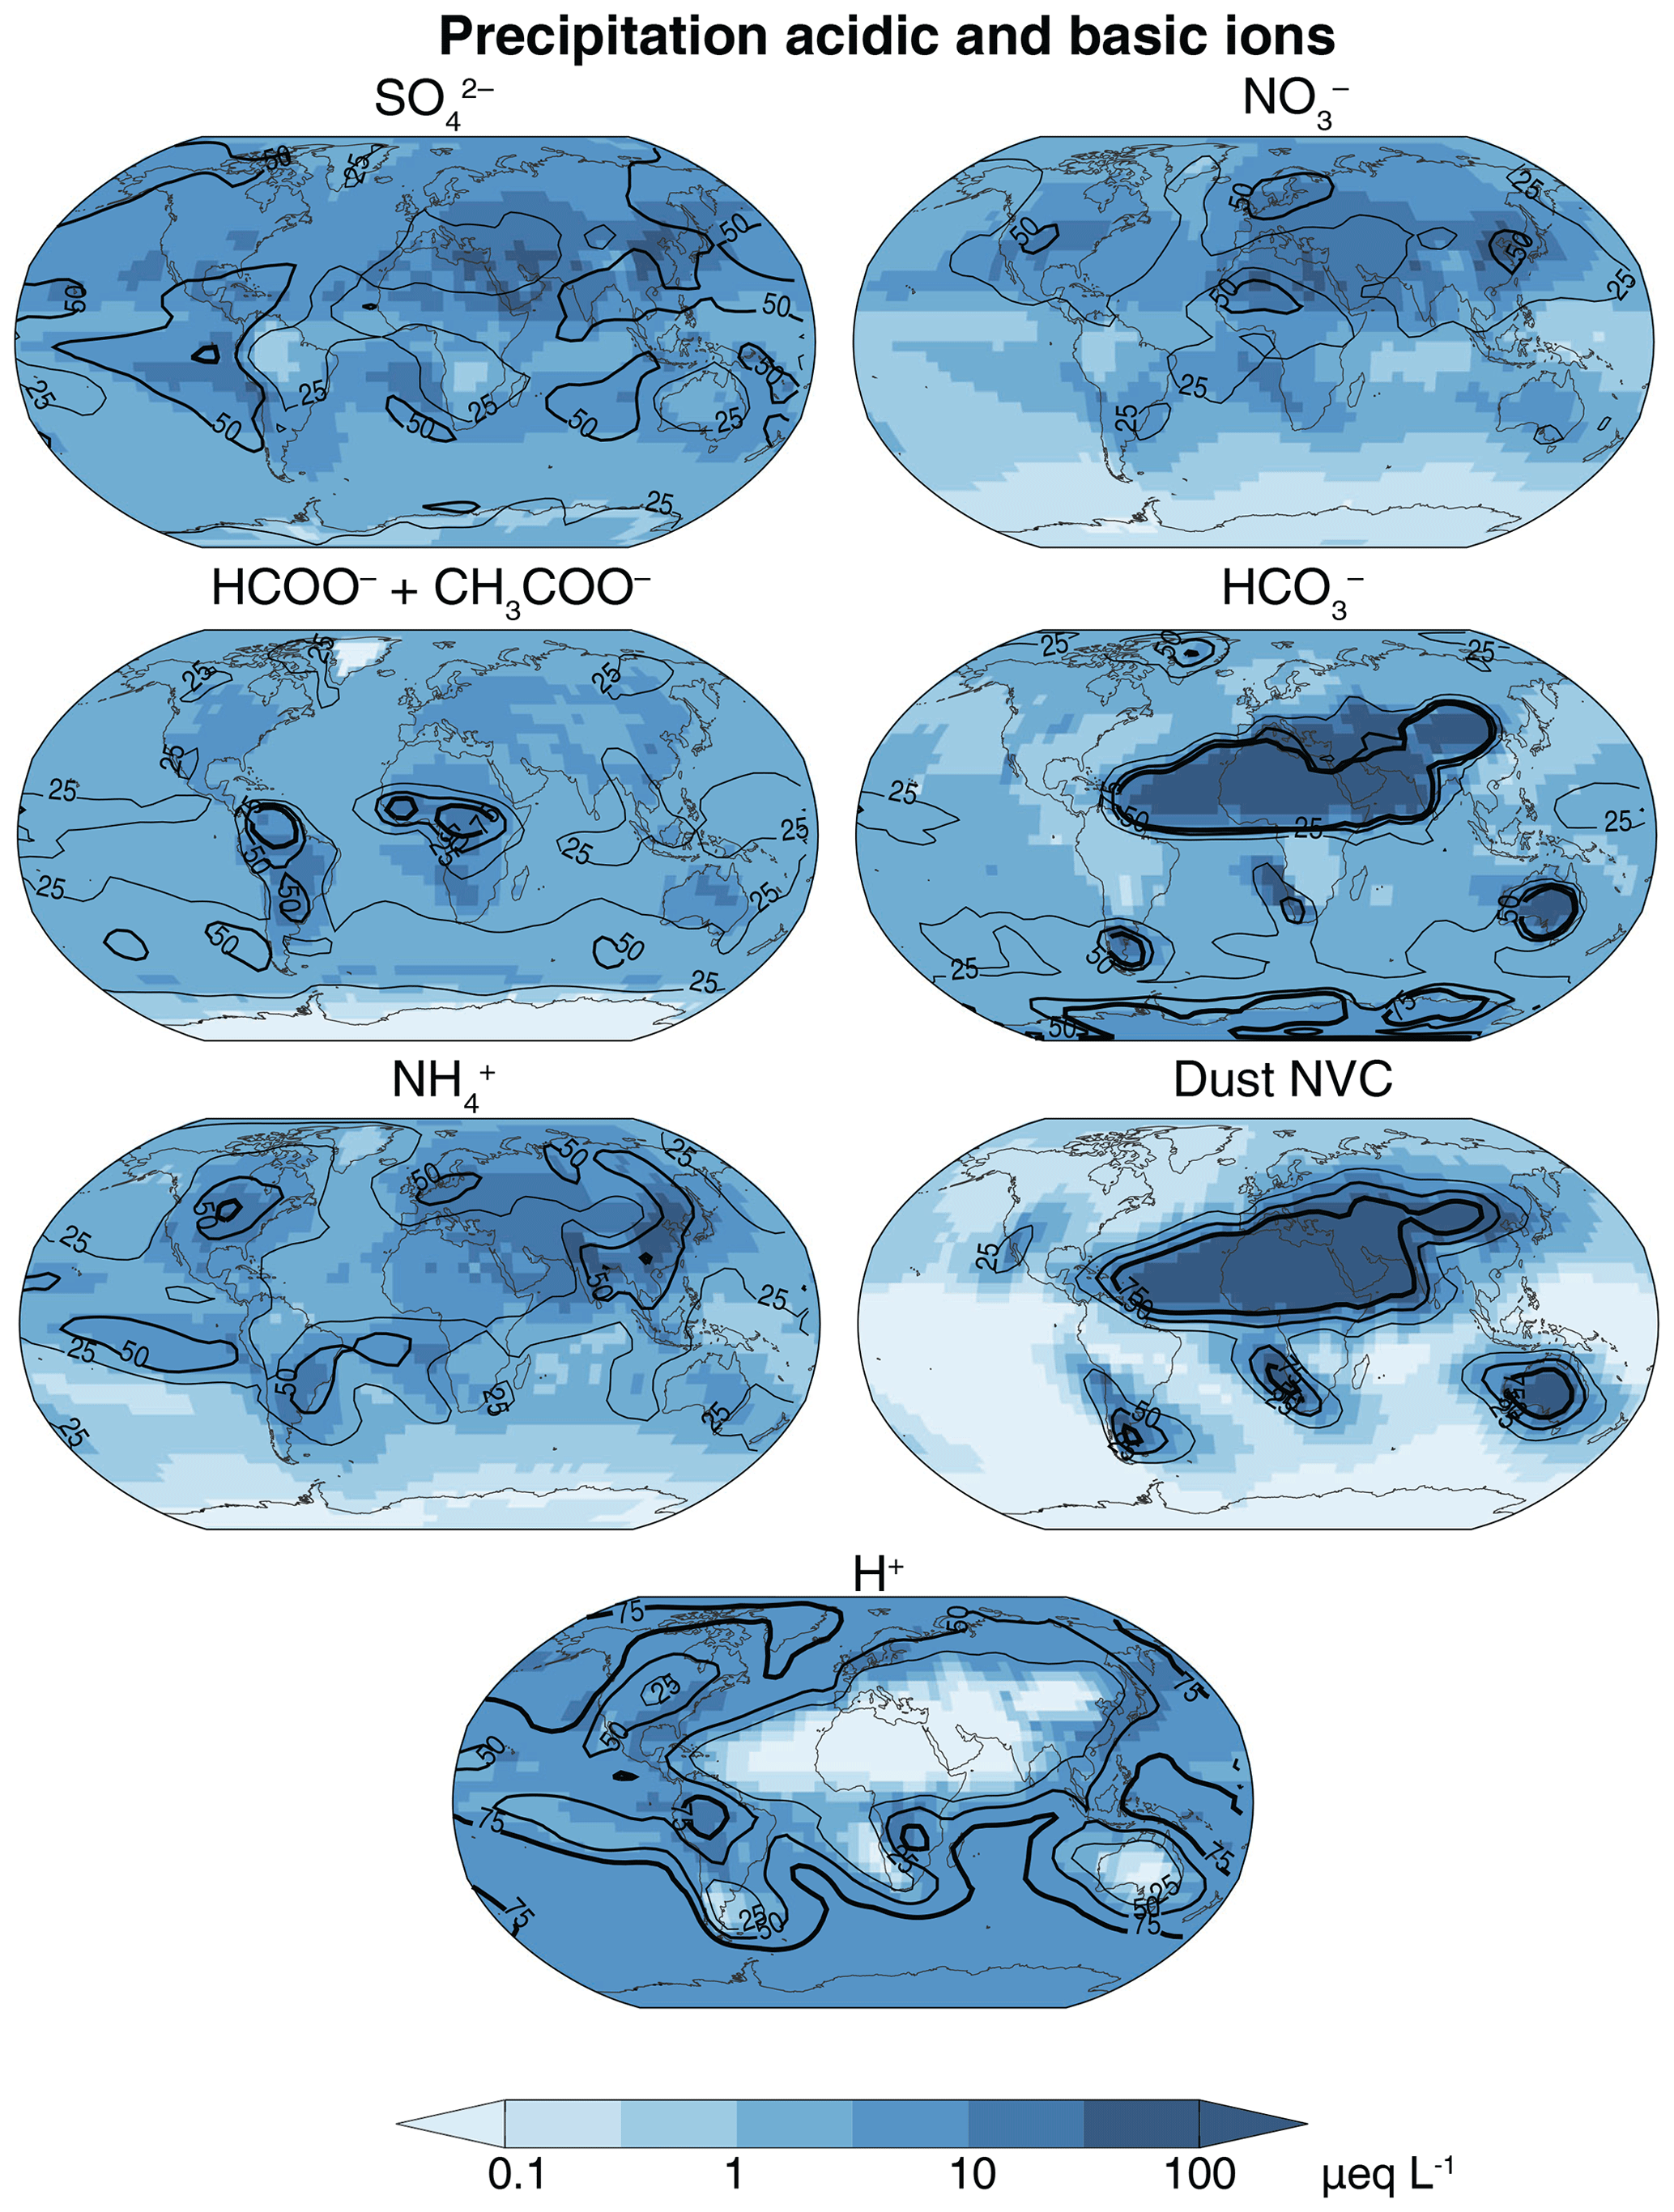
Figure 7GEOS-Chem precipitation equivalent concentrations of major acidic and basic ions for the year 2013. The contour lines (25 %, 50 %, and 75 %) show the percent contribution of each ion to the total anion or cation equivalents. Na+ and Cl− are not included in this total because they are largely in balance and make little net contribution to acidity.
3.2 Global distribution of precipitation pH and composition
Figure 6a shows the global distribution of the annual mean precipitation pH for the year 2013. The pH averaging procedure is as described in Sect. 2.3. The global mean precipitation is 5.5 and varies from 4.5 over industrialized areas and the tropical forests to 8 over deserts, showing the same spatial patterns as cloud water pH but with lower acidity because of dilution. Figure 7 shows the simulated concentrations of precipitation ions, except for Na+ and Cl− which again do not contribute significantly to net acidity. Precipitation ion concentrations are on average 4 times more dilute than cloud water concentrations (Fig. 3). The relative contribution of in industrialized regions is higher than for cloud water because of additional from below-cloud scavenging of SO2. The contribution in central Africa is higher than for cloud water because of high-altitude convective scavenging of HNO3 produced from lightning NOx. In Amazonia and tropical Africa, HCOO− and CH3COO− contribute a larger fraction of precipitation acidity compared with cloud water because of below-cloud scavenging, and as a result the precipitation pH is similar to that of cloud water. Similarly, below-cloud scavenging of desert-generated dust results in alkaline precipitation over a much larger area compared with cloud water.
Figure 6b shows the change in precipitation pH when the contribution from carboxylic acids is excluded. These acids biodegrade quickly; thus, their acidity is not generally captured by precipitation pH measurements. We find that precipitation pH increases by 0.4–1 unit in the Amazon, tropical Africa, and southeast Asia, which is consistent with observations (Andreae et al., 1990; Sanhueza et al., 1992; Sigha-Nkamdjou et al., 2003; Yoboué et al., 2005). Over the US, Europe, and eastern China the increase in pH is 0.1–0.4 units, which is similar to the observed contribution of carboxylic acids to precipitation H+ (10 %–60 %) in these areas (Keene and Galloway, 1984; Kawamura et al., 1996; Peña et al., 2002; Xu et al., 2010; Niu et al., 2018). Over the oceans, the change in pH from HCOOH and CH3COOH is small (∼0.15 units) and is in agreement with marine observations (Keene et al., 2015).
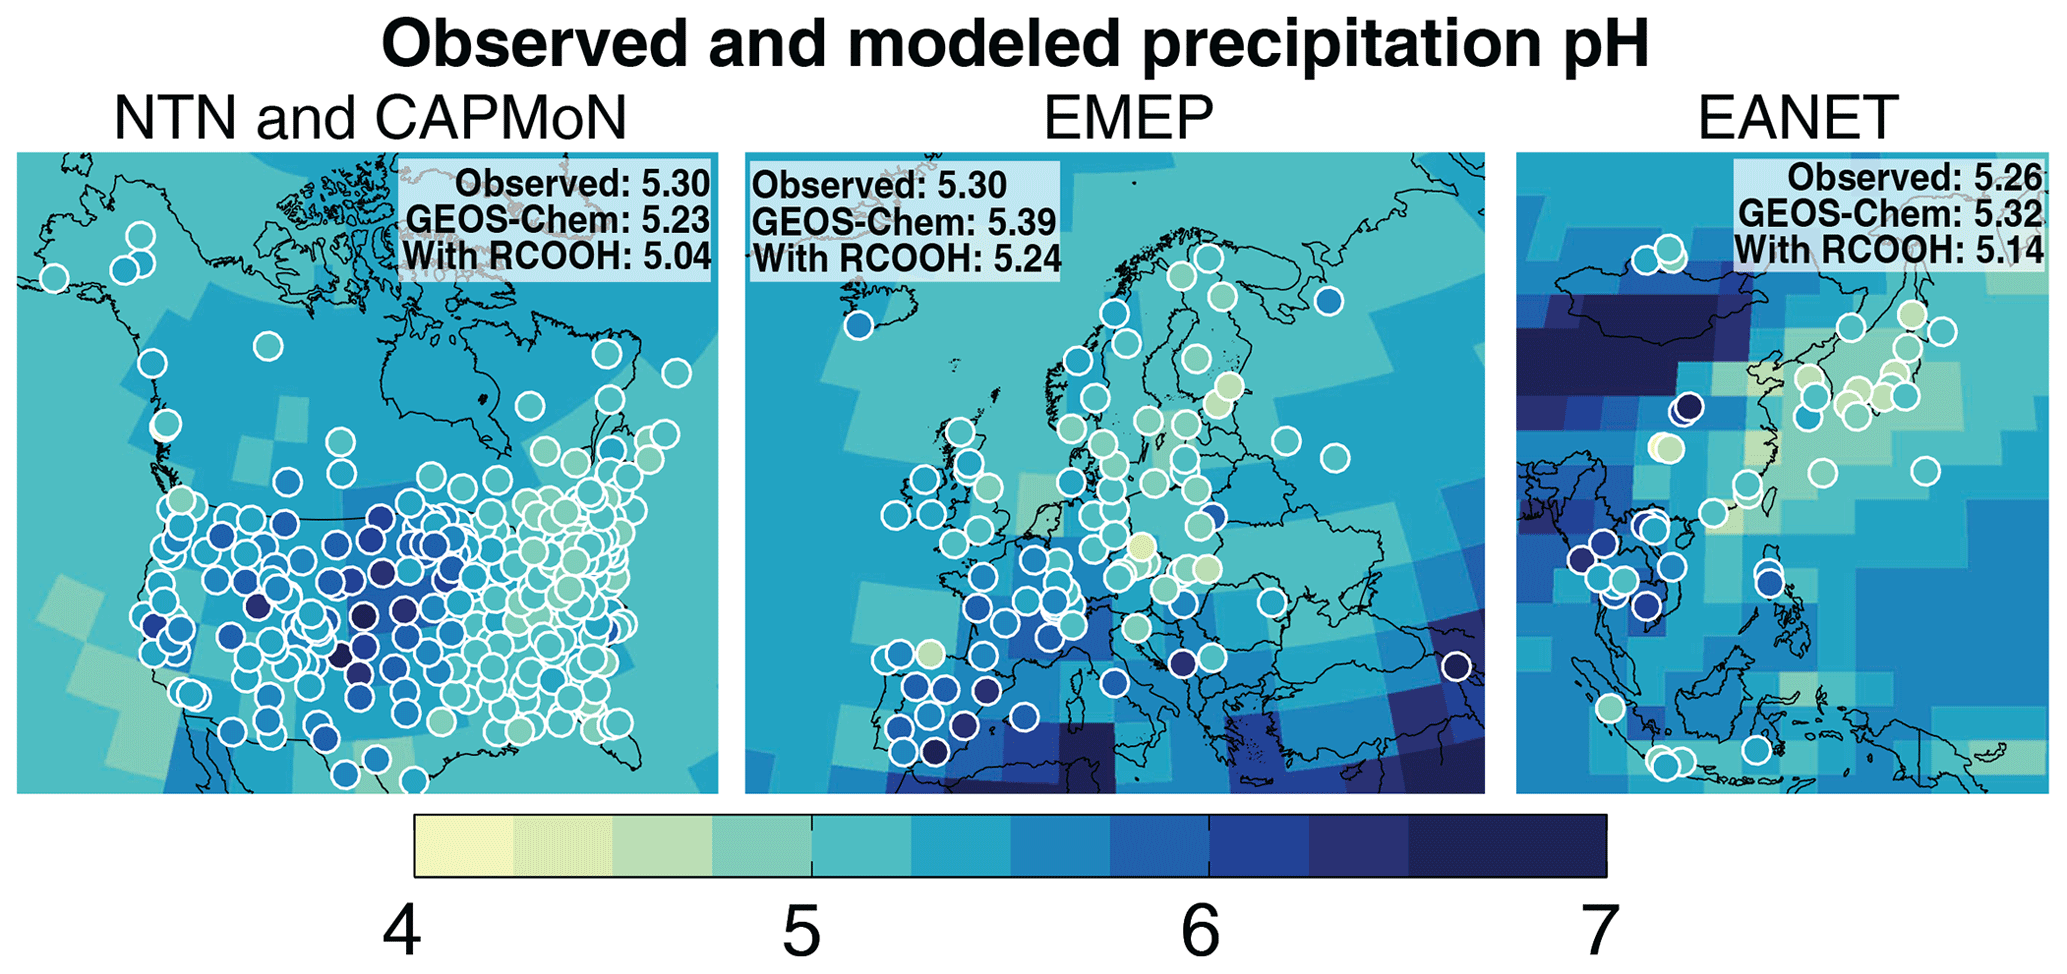
Figure 8Annual volume-weighted average (VWA) precipitation pH over North America, Europe, and East Asia for the year 2013. Values are the precipitation volume-weighted averages of the monthly means (Eq. 6). The GEOS-Chem model values (solid background) exclude RCOOH (HCOOH and CH3COOH) from the pH calculation for the comparison to observations. Observations (circles) are from the US National Trends Network (NTN), the Canadian Air and Precipitation Monitoring Network (CAPMoN), the European Monitoring and Evaluation Programme (EMEP), and the Acid Deposition Monitoring Network in East Asia (EANET). The EANET sites in Malaysia are not shown because of their different sampling procedure (see text). The insets in each panel show the spatial means of the observations for the corresponding region as well as the corresponding GEOS-Chem means at the measurement locations. The mean GEOS-Chem pH values with RCOOH included in the pH calculations are also shown.
Figure 8 compares the simulated annual VWA precipitation pH (, Eq. 6) with observations from monitoring networks for the year 2013. Precipitation (rain and snow) pH observations are from the US National Trends Network (NTN; NADP, 2019), the Canadian Air and Precipitation Monitoring Network (CAPMoN; ECCC, 2018) , the European Monitoring and Evaluation Programme (EMEP; EMEP, 2015), and the Acid Deposition Monitoring Network in East Asia (EANET; EANET, 2019). We use monthly mean measurements from NTN (249 sites), EMEP (83 sites), and EANET (45 sites) and daily measurements from CAPMoN (30 sites), which we average to a monthly VWA [H+]. The monthly [H+] values are used to calculate following Eq. (6). The acidity from HCOO− and CH3COO− is not considered in the network measurements unless treated with biocide, which is only done in Malaysia. Thus, for comparison with observations, we use the simulated calculated without HCOO− and CH3COO−.
GEOS-Chem precipitation pH values are largely consistent with the observations, reproducing the observed regional means to within 0.1 pH unit (observed: 5.26–5.30; GEOS-Chem: 5.23–5.39). Carboxylic acids lower the mean GEOS-Chem pH by 0.15–0.2 units. The model also generally reproduces the observed spatial variations within the regions. Observations and model values show a higher pH in the Midwest than in the rest of the US because of neutralization by agricultural NH3. Precipitation pH in southern Europe is also relatively high because of the Saharan dust influence. Model values there are lower than in Fig. 6 due to the different forms used to calculate the annual mean pH (Eq. 6 here instead of Eq. 1). High [] and [] lower the precipitation pH to below 4.5 in eastern China, Korea, and Japan. The high pH value observed in Xi'an (central China) is due to alkalinity from dust sources (EANET, 2016), but the corresponding dust influence in the model is shifted slightly to the northwest. The low pH observed over Chongqing (central China) is because of high SO2 and NOx emissions that are trapped locally by the surrounding terrain (Y. Chen et al., 2017).
Our global distribution of precipitation pH can be compared to previous model simulations by Rodhe et al. (2002) and Tost et al. (2007). Neither included carboxylic acids; thus, they overestimated pH values over tropical continents. Tost et al. (2007) did not include dust alkalinity either, resulting in large pH underestimates over desert regions. The pH values over eastern North America and Europe in these previous studies are about 0.5 units lower than in our simulation, reflecting the more recent decreases in SO2 and NOx emissions (Hoesly et al., 2018).
3.3 Soil and freshwater acidification by wet deposition
Acidification of soil and freshwater is one of the major adverse effects of wet deposition fluxes on ecosystems because it causes the leaching of nutrients, mobilizes toxic metals, and directly damages biota (Driscoll et al., 2001). Quantifying this effect requires accounting for post-depositional processes. The H+ flux associated with carboxylates and is not relevant because carboxylic acids are readily consumed by bacteria, and the amount of in ecosystems is controlled by the ambient CO2 concentrations (Reuss and Johnson, 1986). The acidifying effects of and depend on the biotic demand for nitrogen (N) (Reuss and Johnson, 1986). In ecosystems with high N demand (so-called N-limited ecosystems), and are readily assimilated by plants and microbes. Uptake of is accompanied by the uptake of H+ (or release of OH−), canceling the acidic effect of deposition. uptake is accompanied by the release of H+, reversing the neutralizing effect of . Therefore, in N-limited ecosystems the acidic flux is calculated as follows (Rodhe et al., 2002):
where F denotes the wet deposition flux in equivalents. However, in many industrialized regions, N deposition greatly exceeds the biotic demand and results in N-saturated conditions (Aber et al., 1989; Watmough et al., 2005; Gundersen et al., 2006; Duan et al., 2016). Under such conditions, only a small fraction of the deposited and is assimilated. The excess causes H+ accumulation, whereas the excess can be converted by microbes to (nitrification), which releases 2H+ for every converted and also results in net H+ formation. Considering the full acidifying potential of and , we calculate the acidic flux under N-saturated conditions as follows (Galloway, 1995; Rodhe et al., 2002):
can be viewed as the upper limit of acidic inputs through wet deposition as some of the accumulated can denitrify to N2.
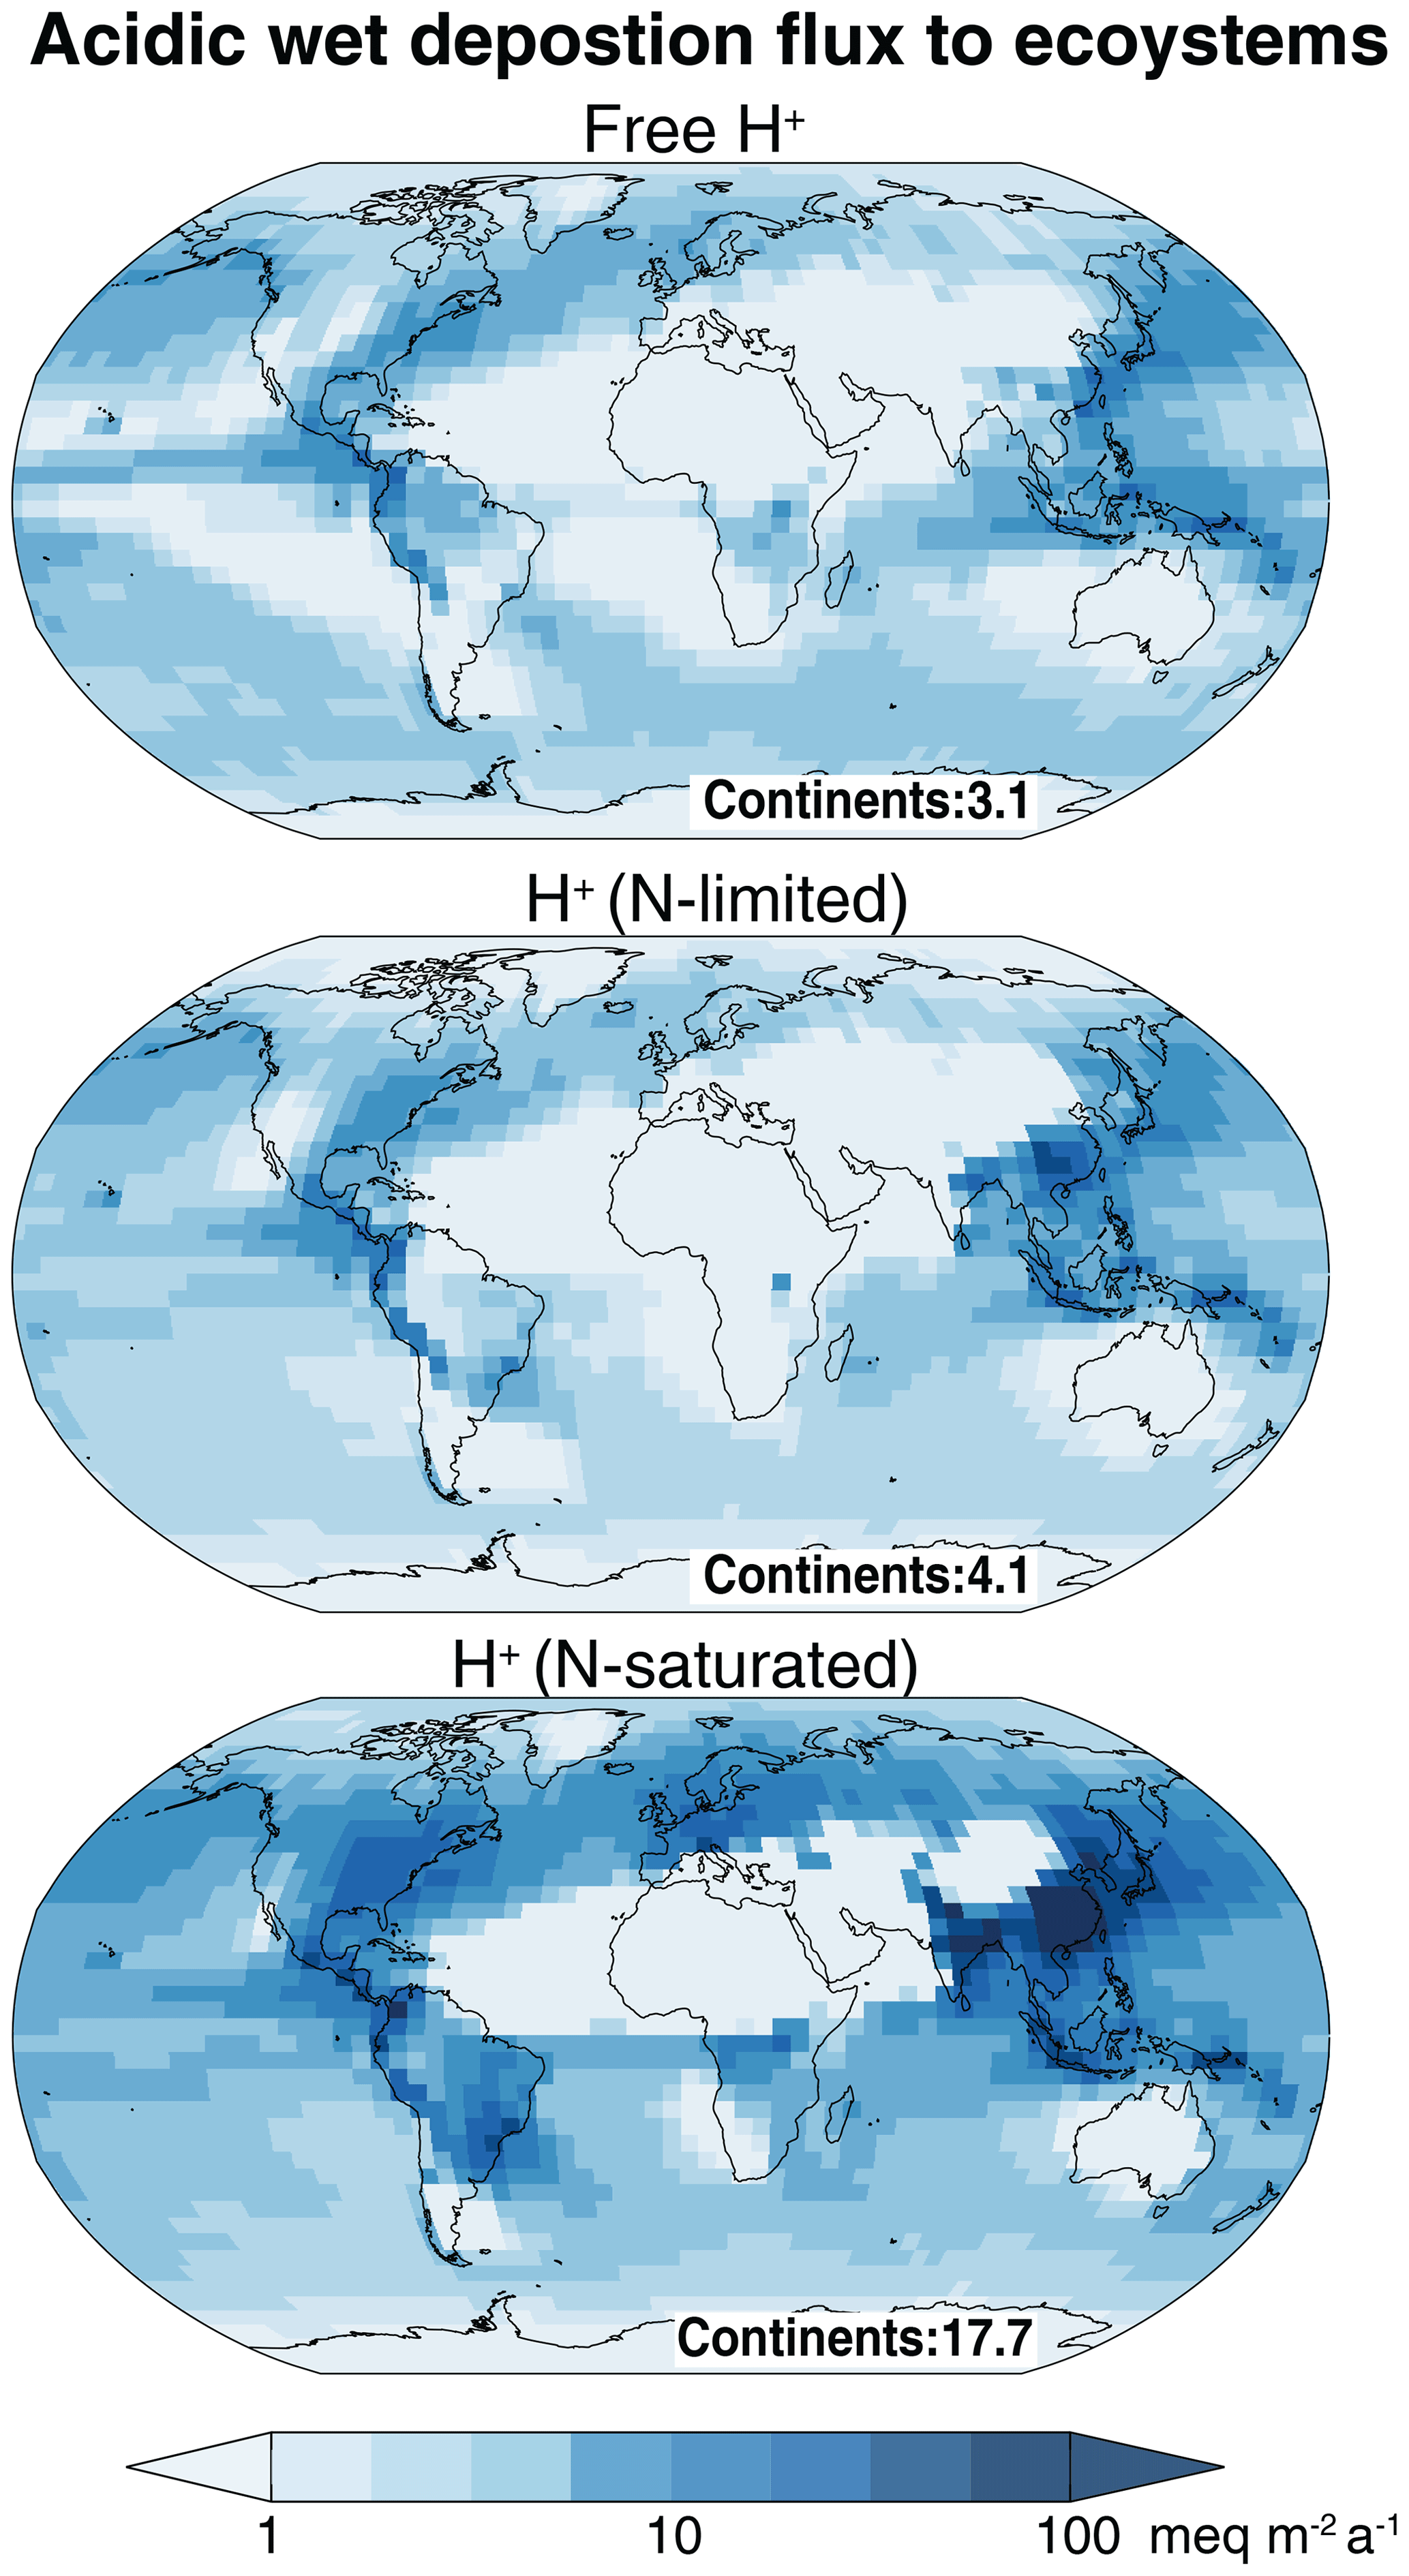
Figure 9Acid wet deposition fluxes including post-depositional effects. Values are annual means for 2013 as simulated by GEOS-Chem. H+ associated with carboxylic acids is excluded, as these acids are rapidly consumed by bacteria. The free H+ flux represents the direct H+ input to ecosystems not accounting for any post-deposition nitrogen (N) transformation. The H+ flux for N-limited conditions is computed using Eq. (7) and assumes complete assimilation of and , whereas the H+ flux for N-saturated conditions is computed using Eq. (8) and assumes complete nitrification of and no assimilation of . The global mean flux over continents in units of milliequivalents per square meter per annum () is indicated.
Figure 9 shows and , along with the free H+ flux which represents the direct acid input to ecosystems excluding carboxylic acids. The global mean over continents (4.1 ) is higher than the mean free H+ flux (3.1 ). The free H+ flux is higher than over central Africa and Amazonia because of H+ associated with and , respectively. is highest over the eastern US, Central and South America, and East Asia, reflecting high fluxes. The global mean over continents (17.7 ) is much larger than and the free H+ flux because of acidity generated from nitrification. Over eastern India, East and Southeast Asia, the eastern US, and Central and South America, is more than 50 , which exceeds the critical load for the acidification of highly sensitive ecosystems with a low acid buffering capacity (Kuylenstierna et al., 2001; Bouwman et al., 2002).
The total wet deposition of individual ions over the continents is largest for (1.3×10¹² eq a−1) followed by (1.0×10¹² eq a−1) and (0.85×10¹² eq a−1). For the year 2000, Lamarque et al. (2013) reported that the multi-model mean (± standard deviation) of the wet deposition flux over continents was higher for ( eq a−1) than for ( eq a−1) and ( eq a−1). The decrease in the wet deposition flux between 2000 and 2013 reflects the global decrease in anthropogenic SO2 emissions (Hoesly et al., 2018). We find that is now the largest source of acidifying wet deposition, contributing 41 % of over continents globally, and it will contribute even more in the future as global NH3 emissions continue to grow (Hoesly et al., 2018).
We used the GEOS-Chem global model of atmospheric chemistry to simulate the global distributions of cloud water and precipitation acidity as well as the total acid inputs from wet deposition to terrestrial ecosystems. This involved an improved pH calculation in GEOS-Chem including contributions from dust alkalinity, sea salt aerosol alkalinity, and carboxylic acids (HCOOH and CH3COOH). Our prime motivation was to better understand and evaluate the global cloud water pH distribution in the model for future simulations of sulfate, organic, and halogen chemistry. Extending the analysis to precipitation pH provided further opportunity for model evaluation and allowed us to quantify post-depositional effects in acid inputs to ecosystems on a global scale.
We compiled cloud water pH measurements worldwide from the literature and compared them to the GEOS-Chem simulation. The global mean cloud water pH is 5.2±0.9 in the observations and 5.0±0.8 in GEOS-Chem sampled at the same locations. The lowest pH values of 3–4 are over East Asia due to high acid inputs and despite an average 70 % neutralization by NH3 and dust cations. Low pH values extend across the North Pacific because of weak neutralization. Cloud water pH is 4–5 over the US and Europe with dominant acid input from HNO3 and over 50 % neutralization from NH3. Alkaline cloud water with a pH as high as 8 is found over the northern subtropical desert belt extending from the Atlantic Ocean to Mongolia, including western India. Carboxylic acids account for less than 25 % of the cloud water H+ in the Northern Hemisphere but 25 %–50 % in the Southern Hemisphere and over 50 % in the southern tropical continents, where they drive the pH to below 4.5. We find little dependence of cloud water pH on altitude other than dilution from changes in the liquid water content.
Anthropogenic emissions of SO2 and NOx are decreasing rapidly in the developed world, and this in combination with the large fraction of neutralized acidity might be expected to lead to large increases in the cloud water pH. However, there is a strong buffering effect because of the semi-volatility of and carboxylates. We find that a factor of 2 decrease in and inputs over the US increases the cloud water pH by 1 unit, compared with an increase of 2.1 units in the absence of buffering.
The global mean precipitation pH in GEOS-Chem is 5.5, which is higher than the cloud water pH because of dilution and below-cloud scavenging of bases (NH3 and dust). The precipitation pH shows spatial patterns similar to the cloud water pH but is influenced more strongly by carboxylic acids and dust near source regions because of below-cloud scavenging. GEOS-Chem is consistent with the annual mean precipitation pH observed at monitoring networks in North America, Europe, and East Asia. We find that the carboxylic acids lower the precipitation pH by up to 1 unit in the Amazon, tropical Africa, and southeast Asia, and by about 0.2 units in the US, Europe, and East Asia. This pH depression would not be seen in the observations because of the fast biological consumption of the carboxylic acids after deposition.
Carboxylic acids affect cloud water and precipitation pH globally, but their sources are uncertain. Our simulation could reproduce the observed HCOOH wet deposition flux by using scaled-up biogenic emissions, but it underestimated CH3COOH flux by a factor of 4, indicating that a better understanding of their sources is needed. Dicarboxylic acids, such as oxalic, succinic, and malonic acids, are also present in cloud water and precipitation and their effect on pH needs to be evaluated.
Lastly, we examined the total acid inputs to soil and freshwater from wet deposition, including the post-depositional effects from and utilization by the biosphere. We find that total acid inputs under N-saturated conditions exceed 50 in many parts of East Asia and the Americas, a level that can damage sensitive ecosystems. contributes 41 % of the acid input under N-saturated conditions globally.
Table A1Cloud water pH observations grouped by region and listed from west to east and north to south.
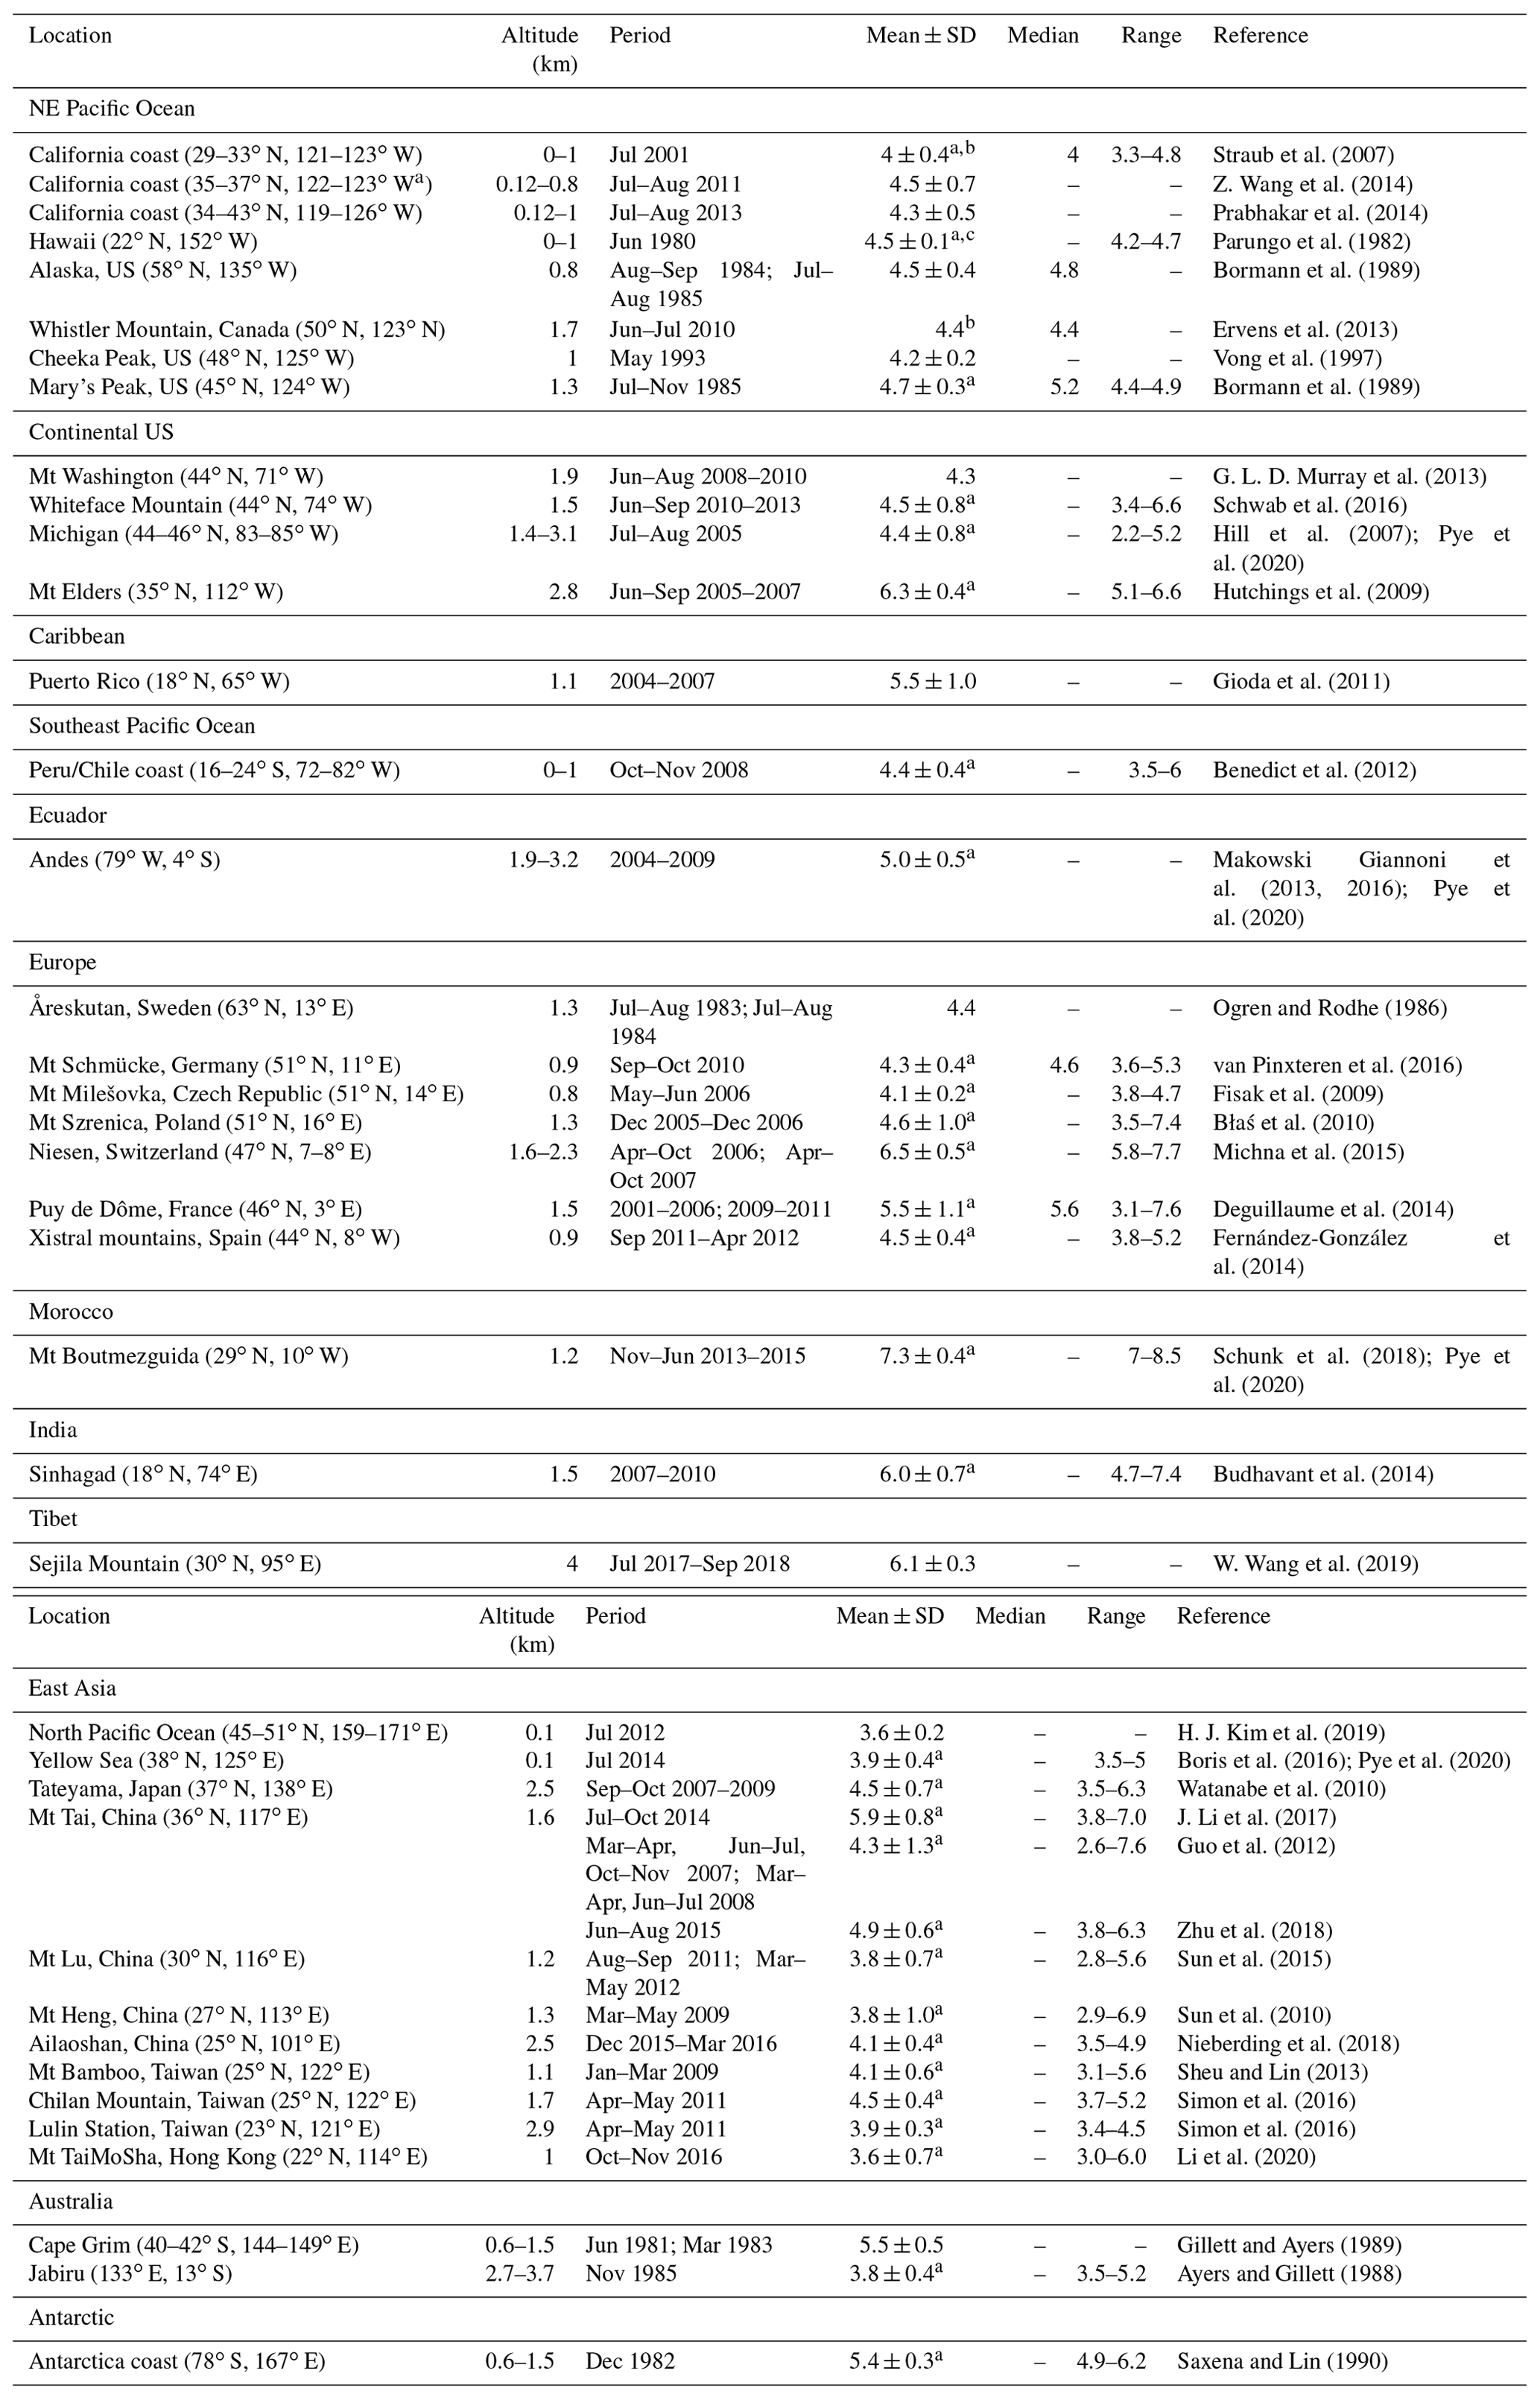
a Standard deviation estimated as range ∕ 4.
b Median value used as the mean.
c Mean estimated as .
The NTN data are available at http://nadp.slh.wisc.edu/data/NTN/ntnAllsites.aspx (last access: 11 October 2019; NADP, 2019), the CAPMoN data at http://donnees.ec.gc.ca/data/air/monitor/monitoring-of-atmospheric-precipitationchemistry/?lang=en (last access: 18 October 2019; ECCC, 2018), the EMEP data at https://projects.nilu.no//ccc/emepdata.html (last access: 1 April 2020; EMEP, 2015), and the EANET data at https://monitoring.eanet.asia/document/public/index (last access: 9 October 2019; EANET, 2019). The model results are available on request from the corresponding author.
VS and DJJ designed the study. VS carried out the modeling and analysis. JMM, XW, and SZ contributed model updates. VS and DJJ wrote the paper with input from all authors.
The authors declare that they have no conflict of interest.
We thank the US National Trends Network, the Canadian Air and Precipitation Monitoring Network, the European Monitoring and Evaluation Programme, and the Acid Deposition Monitoring Network in East Asia for the precipitation pH measurements. Viral Shah thanks Becky Alexander (UW), Dylan Millet, and Xin Chen (UMN) for helpful discussions.
This research has been supported by the National Science Foundation (grant no. AGS-1643217) and the U.S. Environmental Protection Agency (grant no. R840014).
This paper was edited by Eliza Harris and reviewed by two anonymous referees.
Aber, J. D., Nadelhoffer, K. J., Steudler, P., and Melillo, J. M.: Nitrogen Saturation in Northern Forest Ecosystems, BioScience, 39, 378–386, https://doi.org/10.2307/1311067, 1989.
Alexander, B., Park, R. J., Jacob, D. J., Li, Q. B., Yantosca, R. M., Savarino, J., Lee, C. C. W., and Thiemens, M. H.: Sulfate formation in sea-salt aerosols: Constraints from oxygen isotopes, J. Geophys. Res.-Atmos., 110, D10307, https://doi.org/10.1029/2004JD005659, 2005.
Alexander, B., Park, R. J., Jacob, D. J., and Gong, S.: Transition metal-catalyzed oxidation of atmospheric sulfur: Global implications for the sulfur budget, J. Geophys. Res., 114, D02309, https://doi.org/10.1029/2008JD010486, 2009.
Alexander, B., Allman, D. J., Amos, H. M., Fairlie, T. D., Dachs, J., Hegg, D. A., and Sletten, R. S.: Isotopic constraints on the formation pathways of sulfate aerosol in the marine boundary layer of the subtropical northeast Atlantic Ocean, J. Geophys. Res.-Atmos., 117, D06304, https://doi.org/10.1029/2011JD016773, 2012.
Amos, H. M., Jacob, D. J., Holmes, C. D., Fisher, J. A., Wang, Q., Yantosca, R. M., Corbitt, E. S., Galarneau, E., Rutter, A. P., Gustin, M. S., Steffen, A., Schauer, J. J., Graydon, J. A., Louis, V. L. St., Talbot, R. W., Edgerton, E. S., Zhang, Y., and Sunderland, E. M.: Gas-particle partitioning of atmospheric Hg(II) and its effect on global mercury deposition, Atmos. Chem. Phys., 12, 591–603, https://doi.org/10.5194/acp-12-591-2012, 2012.
Andreae, M. O., Talbot, R. W., Berresheim, H., and Beecher, K. M.: Precipitation chemistry in central Amazonia, J. Geophys. Res., 95, 16987, https://doi.org/10.1029/JD095iD10p16987, 1990.
Arlander, D. W., Cronn, D. R., Farmer, J. C., Menzia, F. A., and Westberg, H. H.: Gaseous oxygenated hydrocarbons in the remote marine troposphere, J. Geophys. Res., 95, 16391, https://doi.org/10.1029/JD095iD10p16391, 1990.
Ayers, G. P. and Gillett, R. W.: First observations of cloud water acidity in tropical Australia, Clean Air Aust., 22, 53–57, 1988.
Baboukas, E. D., Kanakidou, M., and Mihalopoulos, N.: Carboxylic acids in gas and particulate phase above the Atlantic Ocean, J. Geophys. Res.-Atmos., 105, 14459–14471, https://doi.org/10.1029/1999JD900977, 2000.
Benedict, K. B., Lee, T., and Collett, J. L.: Cloud water composition over the southeastern Pacific Ocean during the VOCALS regional experiment, Atmos. Environ., 46, 104–114, https://doi.org/10.1016/j.atmosenv.2011.10.029, 2012.
Błaś, M., Polkowska, Ż., Sobik, M., Klimaszewska, K., Nowiński, K., and Namieśnik, J.: Fog water chemical composition in different geographic regions of Poland, Atmos. Res., 95, 455–469, https://doi.org/10.1016/j.atmosres.2009.11.008, 2010.
Boris, A. J., Lee, T., Park, T., Choi, J., Seo, S. J., and Collett Jr., J. L.: Fog composition at Baengnyeong Island in the eastern Yellow Sea: detecting markers of aqueous atmospheric oxidations, Atmos. Chem. Phys., 16, 437–453, https://doi.org/10.5194/acp-16-437-2016, 2016.
Bormann, B. T., Tarrant, R. F., McClellan, M. H., and Savage, T.: Chemistry of Rainwater and Cloud Water at Remote Sites in Alaska and Oregon, J. Environ. Qual., 18, 149, https://doi.org/10.2134/jeq1989.00472425001800020003x, 1989.
Bouwman, A. F., Lee, D. S., Asman, W. A. H., Dentener, F. J., Van Der Hoek, K. W., and Olivier, J. G. J.: A global high-resolution emission inventory for ammonia, Global Biogeochem. Cycles, 11, 561–587, https://doi.org/10.1029/97GB02266, 1997.
Bouwman, A. F., Van Vuuren, D. P., Derwent, R. G., and Posch, M.: A global analysis of acidification and eutrophication of terrestrial ecosystems, Water Air. Soil Pollut., 141, 349–382, https://doi.org/10.1023/A:1021398008726, 2002.
Breider, T. J., Mickley, L. J., Jacob, D. J., Ge, C., Wang, J., Payer Sulprizio, M., Croft, B., Ridley, D. A., McConnell, J. R., Sharma, S., Husain, L., Dutkiewicz, V. A., Eleftheriadis, K., Skov, H., and Hopke, P. K.: Multidecadal trends in aerosol radiative forcing over the Arctic: Contribution of changes in anthropogenic aerosol to Arctic warming since 1980: The 1980–2010 Trends in Arctic Aerosol RF, J. Geophys. Res.-Atmos., 122, 3573–3594, https://doi.org/10.1002/2016JD025321, 2017.
Budhavant, K. B., Rao, P. S. P., Safai, P. D., Granat, L., and Rodhe, H.: Chemical composition of the inorganic fraction of cloud-water at a high altitude station in West India, Atmos. Environ., 88, 59–65, https://doi.org/10.1016/j.atmosenv.2014.01.039, 2014.
Calvert, J. G., Lazrus, A., Kok, G. L., Heikes, B. G., Walega, J. G., Lind, J., and Cantrell, C. A.: Chemical mechanisms of acid generation in the troposphere, Nature, 317, 27–35, https://doi.org/10.1038/317027a0, 1985.
Carmichael, G. R., Peters, L. K., and Saylor, R. D.: The STEM-II regional scale acid deposition and photochemical oxidant model – I. An overview of model development and applications, Atmos. Environ., 25, 2077–2090, https://doi.org/10.1016/0960-1686(91)90085-L, 1991.
Castillo, R. A., Jiusto, J. E., and Mclaren, E.: The pH and ionic composition of stratiform cloud water, Atmos. Environ., 17, 1497–1505, https://doi.org/10.1016/0004-6981(83)90303-7, 1983.
Chang, J. S., Brost, R. A., Isaksen, I. S. A., Madronich, S., Middleton, P., Stockwell, W. R., and Walcek, C. J.: A three-dimensional Eulerian acid deposition model: Physical concepts and formulation, J. Geophys. Res., 92, 14681, https://doi.org/10.1029/JD092iD12p14681, 1987.
Chen, Q., Schmidt, J. A., Shah, V., Jaeglé, L., Sherwen, T., and Alexander, B.: Sulfate production by reactive bromine: Implications for the global sulfur and reactive bromine budgets, Geophys. Res. Lett., 44, 7069–7078, https://doi.org/10.1002/2017GL073812, 2017.
Chen, Y., Xie, S., Luo, B., and Zhai, C.: Particulate pollution in urban Chongqing of southwest China: Historical trends of variation, chemical characteristics and source apportionment, Sci. Total Environ., 584–585, 523–534, https://doi.org/10.1016/j.scitotenv.2017.01.060, 2017.
Collett, J. L., Oberholzer, B., Mosimann, L., Staehelin, J., and Waldvogel, A.: Contributions of cloud processes to precipitation chemistry in mixed phase clouds, Water. Air. Soil Pollut., 68, 43–57, https://doi.org/10.1007/BF00479392, 1993.
Collett, J. L., Hoag, K. J., Rao, X., and Pandis, S. N.: Internal acid buffering in San Joaquin Valley fog drops and its influence on aerosol processing, Atmos. Environ., 33, 4833–4847, https://doi.org/10.1016/S1352-2310(99)00221-6, 1999.
Deguillaume, L., Charbouillot, T., Joly, M., Vaïtilingom, M., Parazols, M., Marinoni, A., Amato, P., Delort, A.-M., Vinatier, V., Flossmann, A., Chaumerliac, N., Pichon, J. M., Houdier, S., Laj, P., Sellegri, K., Colomb, A., Brigante, M., and Mailhot, G.: Classification of clouds sampled at the puy de Dôme (France) based on 10 yr of monitoring of their physicochemical properties, Atmos. Chem. Phys., 14, 1485–1506, https://doi.org/10.5194/acp-14-1485-2014, 2014.
Dentener, F. J. and Crutzen, P. J.: A three-dimensional model of the global ammonia cycle, J. Atmos. Chem., 19, 331–369, https://doi.org/10.1007/BF00694492, 1994.
Driscoll, C. T., Lawrence, G. B., Bulger, A. J., Butler, T. J., Cronan, C. S., Eagar, C., Lambert, K. F., Likens, G. E., Stoddard, J. L., and Weathers, K. C.: Acidic Deposition in the Northeastern United States: Sources and Inputs, Ecosystem Effects, and Management Strategies, BioScience, 51, 180, https://doi.org/10.1641/0006-3568(2001)051[0180:ADITNU]2.0.CO;2, 2001.
Duan, L., Yu, Q., Zhang, Q., Wang, Z., Pan, Y., Larssen, T., Tang, J., and Mulder, J.: Acid deposition in Asia: Emissions, deposition, and ecosystem effects, Atmos. Environ., 146, 55–69, https://doi.org/10.1016/j.atmosenv.2016.07.018, 2016.
EANET: The Third Periodic Report on the State of Acid Deposition in East Asia. Part II: National Assessments, available at: https://www.eanet.asia/wp-content/uploads/2019/03/3_PRSAD2.pdf (last access: 30 March 2020), 2016.
EANET: EANET Data on the Acid Deposition in the East Asian Region, available at: https://monitoring.eanet.asia/document/public/index, last access: 9 October 2019.
ECCC: Monitoring of Atmospheric Precipitation Chemistry, available at: http://donnees.ec.gc.ca/data/air/monitor/monitoring-of-atmospheric-precipitation-chemistry/?lang=en (last access: 18 October 2019), 2018.
EEA: National Emission Ceilings (NEC) Directive emission inventory data, available at: https://www.eea.europa.eu/data-and-maps/data/national-emission-ceilings-nec-directive-inventory-16, last access: 15 November 2019.
EMEP: EMEP measurement data online, available at: https://projects.nilu.no//ccc/emepdata.html (last access: 1 April 2020), 2015.
Engelbrecht, J. P., Moosmüller, H., Pincock, S., Jayanty, R. K. M., Lersch, T., and Casuccio, G.: Technical note: Mineralogical, chemical, morphological, and optical interrelationships of mineral dust re-suspensions, Atmos. Chem. Phys., 16, 10809–10830, https://doi.org/10.5194/acp-16-10809-2016, 2016.
Ervens, B., Turpin, B. J., and Weber, R. J.: Secondary organic aerosol formation in cloud droplets and aqueous particles (aqSOA): a review of laboratory, field and model studies, Atmos. Chem. Phys., 11, 11069–11102, https://doi.org/10.5194/acp-11-11069-2011, 2011.
Ervens, B., Wang, Y., Eagar, J., Leaitch, W. R., Macdonald, A. M., Valsaraj, K. T., and Herckes, P.: Dissolved organic carbon (DOC) and select aldehydes in cloud and fog water: the role of the aqueous phase in impacting trace gas budgets, Atmos. Chem. Phys., 13, 5117–5135, https://doi.org/10.5194/acp-13-5117-2013, 2013.
Eyring, V., Köhler, H. W., van Aardenne, J., and Lauer, A.: Emissions from international shipping: 1. The last 50 years, J. Geophys. Res.-Atmos., 110, D17305, https://doi.org/10.1029/2004JD005619, 2005.
Fairlie, T. D., Jacob, D. J., and Park, R. J.: The impact of transpacific transport of mineral dust in the United States, Atmos. Environ., 41, 1251–1266, https://doi.org/10.1016/j.atmosenv.2006.09.048, 2007.
Fernández-González, R., Yebra-Pimentel, I., Martínez-Carballo, E., Simal-Gándara, J., and Pontevedra-Pombal, X.: Atmospheric pollutants in fog and rain events at the northwestern mountains of the Iberian Peninsula, Sci. Total Environ., 497–498, 188–199, https://doi.org/10.1016/j.scitotenv.2014.07.093, 2014.
Fisak, J., Stoyanova, V., Tesar, M., Petrova, P., Daskalova, N., Tsacheva, T., and Marinov, M.: The pollutants in rime and fog water and in air at Milesovka Observatory (Czech Republic), Biologia, 64, 492–495, https://doi.org/10.2478/s11756-009-0080-0, 2009.
Fisher, J. A., Jacob, D. J., Wang, Q., Bahreini, R., Carouge, C. C., Cubison, M. J., Dibb, J. E., Diehl, T., Jimenez, J. L., Leibensperger, E. M., Lu, Z., Meinders, M. B. J., Pye, H. O. T., Quinn, P. K., Sharma, S., Streets, D. G., van Donkelaar, A., and Yantosca, R. M.: Sources, distribution, and acidity of sulfate–ammonium aerosol in the Arctic in winter–spring, Atmos. Environ., 45, 7301–7318, https://doi.org/10.1016/j.atmosenv.2011.08.030, 2011.
Franco, B., Clarisse, L., Stavrakou, T., Müller, J. -F., Taraborrelli, D., Hadji-Lazaro, J., Hannigan, J. W., Hase, F., Hurtmans, D., Jones, N., Lutsch, E., Mahieu, E., Ortega, I., Schneider, M., Strong, K., Vigouroux, C., Clerbaux, C., and Coheur, P. -F.: Spaceborne Measurements of Formic and Acetic Acids: A Global View of the Regional Sources, Geophys. Res. Lett., 47, e2019GL086239, https://doi.org/10.1029/2019GL086239, 2020.
Galloway, J. N.: Acid deposition: Perspectives in time and space, Water. Air. Soil Pollut., 85, 15–24, https://doi.org/10.1007/BF00483685, 1995.
Gelaro, R., McCarty, W., Suárez, M. J., Todling, R., Molod, A., Takacs, L., Randles, C. A., Darmenov, A., Bosilovich, M. G., Reichle, R., Wargan, K., Coy, L., Cullather, R., Draper, C., Akella, S., Buchard, V., Conaty, A., da Silva, A. M., Gu, W., Kim, G.-K., Koster, R., Lucchesi, R., Merkova, D., Nielsen, J. E., Partyka, G., Pawson, S., Putman, W., Rienecker, M., Schubert, S. D., Sienkiewicz, M., and Zhao, B.: The Modern-Era Retrospective Analysis for Research and Applications, Version 2 (MERRA-2), J. Climate, 30, 5419–5454, https://doi.org/10.1175/JCLI-D-16-0758.1, 2017.
Gillett, R. W. and Ayers, G. P.: Maritime Cloudwater Acidity Near Tasmania, Clean Air Aust., 23, 106–109, 1989.
Gioda, A., Reyes-Rodríguez, G. J., Santos-Figueroa, G., Collett, J. L., Decesari, S., Ramos, M. da C. K. V., Bezerra Netto, H. J. C., de Aquino Neto, F. R., and Mayol-Bracero, O. L.: Speciation of water-soluble inorganic, organic, and total nitrogen in a background marine environment: Cloud water, rainwater, and aerosol particles, J. Geophys. Res., 116, D05203, https://doi.org/10.1029/2010JD015010, 2011.
Graedel, T. E. and Goldberg, K. I.: Kinetic studies of raindrop chemistry: 1. Inorganic and organic processes, J. Geophys. Res., 88, 10865, https://doi.org/10.1029/JC088iC15p10865, 1983.
Guenther, A. B., Jiang, X., Heald, C. L., Sakulyanontvittaya, T., Duhl, T., Emmons, L. K., and Wang, X.: The Model of Emissions of Gases and Aerosols from Nature version 2.1 (MEGAN2.1): an extended and updated framework for modeling biogenic emissions, Geosci. Model Dev., 5, 1471–1492, https://doi.org/10.5194/gmd-5-1471-2012, 2012.
Gundersen, P., Schmidt, I. K., and Raulund-Rasmussen, K.: Leaching of nitrate from temperate forests: effects of air pollution and forest management, Environ. Rev., 14, 1–57, https://doi.org/10.1139/a05-015, 2006.
Guo, J., Wang, Y., Shen, X., Wang, Z., Lee, T., Wang, X., Li, P., Sun, M., Collett, J. L., Wang, W., and Wang, T.: Characterization of cloud water chemistry at Mount Tai, China: Seasonal variation, anthropogenic impact, and cloud processing, Atmos. Environ., 60, 467–476, https://doi.org/10.1016/j.atmosenv.2012.07.016, 2012.
Hass, H., Ebel, A., Feldmann, H., Jakobs, H. J., and Memmesheimer, M.: Evaluation studies with a regional chemical transport model (EURAD) using air quality data from the EMEP monitoring network, Atmos. Environ., 27, 867–887, https://doi.org/10.1016/0960-1686(93)90007-L, 1993.
Heald, C. L., Jacob, D. J., Turquety, S., Hudman, R. C., Weber, R. J., Sullivan, A. P., Peltier, R. E., Atlas, E. L., de Gouw, J. A., Warneke, C., Holloway, J. S., Neuman, J. A., Flocke, F. M., and Seinfeld, J. H.: Concentrations and sources of organic carbon aerosols in the free troposphere over North America, J. Geophys. Res.-Atmos., 111, D23S47, https://doi.org/10.1029/2006JD007705, 2006.
Hegg, D. A., Hobbs, P. V., and Radke, L. F.: Measurements of the scavenging of sulfate and nitrate in clouds, Atmos. Environ., 1967, 18, 1939–1946, https://doi.org/10.1016/0004-6981(84)90371-8, 1984.
Helas, G., Bingemer, H., and Andreae, M. O.: Organic acids over equatorial Africa: Results from DECAFE 88, J. Geophys. Res., 97, 6187, https://doi.org/10.1029/91JD01438, 1992.
Herrmann, H., Schaefer, T., Tilgner, A., Styler, S. A., Weller, C., Teich, M., and Otto, T.: Tropospheric Aqueous-Phase Chemistry: Kinetics, Mechanisms, and Its Coupling to a Changing Gas Phase, Chem. Rev., 115, 4259–4334, https://doi.org/10.1021/cr500447k, 2015.
Hill, K. A., Shepson, P. B., Galbavy, E. S., Anastasio, C., Kourtev, P. S., Konopka, A., and Stirm, B. H.: Processing of atmospheric nitrogen by clouds above a forest environment, J. Geophys. Res., 112, D11301, https://doi.org/10.1029/2006JD008002, 2007.
Hoesly, R. M., Smith, S. J., Feng, L., Klimont, Z., Janssens-Maenhout, G., Pitkanen, T., Seibert, J. J., Vu, L., Andres, R. J., Bolt, R. M., Bond, T. C., Dawidowski, L., Kholod, N., Kurokawa, J.-I., Li, M., Liu, L., Lu, Z., Moura, M. C. P., O'Rourke, P. R., and Zhang, Q.: Historical (1750–2014) anthropogenic emissions of reactive gases and aerosols from the Community Emissions Data System (CEDS), Geosci. Model Dev., 11, 369–408, https://doi.org/10.5194/gmd-11-369-2018, 2018.
Holmes, C. D., Prather, M. J., and Vinken, G. C. M.: The climate impact of ship NOx emissions: an improved estimate accounting for plume chemistry, Atmos. Chem. Phys., 14, 6801–6812, https://doi.org/10.5194/acp-14-6801-2014, 2014.
Holmes, C. D., Bertram, T. H., Confer, K. L., Graham, K. A., Ronan, A. C., Wirks, C. K., and Shah, V.: The Role of Clouds in the Tropospheric NOx Cycle: A New Modeling Approach for Cloud Chemistry and Its Global Implications, Geophys. Res. Lett., 46, 4980–4990, https://doi.org/10.1029/2019GL081990, 2019.
Hu, L., Millet, D. B., Baasandorj, M., Griffis, T. J., Turner, P., Helmig, D., Curtis, A. J., and Hueber, J.: Isoprene emissions and impacts over an ecological transition region in the U.S. Upper Midwest inferred from tall tower measurements: Isoprene emissions in US Upper Midwest, J. Geophys. Res.-Atmos., 120, 3553–3571, https://doi.org/10.1002/2014JD022732, 2015.
Huang, J., Jaeglé, L., and Shah, V.: Using CALIOP to constrain blowing snow emissions of sea salt aerosols over Arctic and Antarctic sea ice, Atmos. Chem. Phys., 18, 16253–16269, https://doi.org/10.5194/acp-18-16253-2018, 2018.
Hudman, R. C., Moore, N. E., Mebust, A. K., Martin, R. V., Russell, A. R., Valin, L. C., and Cohen, R. C.: Steps towards a mechanistic model of global soil nitric oxide emissions: implementation and space based-constraints, Atmos. Chem. Phys., 12, 7779–7795, https://doi.org/10.5194/acp-12-7779-2012, 2012.
Huijnen, V., Williams, J., van Weele, M., van Noije, T., Krol, M., Dentener, F., Segers, A., Houweling, S., Peters, W., de Laat, J., Boersma, F., Bergamaschi, P., van Velthoven, P., Le Sager, P., Eskes, H., Alkemade, F., Scheele, R., Nédélec, P., and Pätz, H.-W.: The global chemistry transport model TM5: description and evaluation of the tropospheric chemistry version 3.0, Geosci. Model Dev., 3, 445–473, https://doi.org/10.5194/gmd-3-445-2010, 2010.
Hutchings, J. W., Robinson, M. S., McIlwraith, H., Triplett Kingston, J., and Herckes, P.: The Chemistry of Intercepted Clouds in Northern Arizona during the North American Monsoon Season, Water Air. Soil Pollut., 199, 191–202, https://doi.org/10.1007/s11270-008-9871-0, 2009.
Jaeglé, L., Quinn, P. K., Bates, T. S., Alexander, B., and Lin, J.-T.: Global distribution of sea salt aerosols: new constraints from in situ and remote sensing observations, Atmos. Chem. Phys., 11, 3137–3157, https://doi.org/10.5194/acp-11-3137-2011, 2011.
Kawamura, K., Steinberg, S., and Kaplan, I. R.: Concentrations of monocarboxylic and dicarboxylic acids and aldehydes in southern California wet precipitations: Comparison of urban and nonurban samples and compositional changes during scavenging, Atmos. Environ., 30, 1035–1052, https://doi.org/10.1016/1352-2310(95)00404-1, 1996.
Keene, W. C. and Galloway, J. N.: Organic acidity in precipitation of North America, Atmos. Environ. 1967, 18, 2491–2497, https://doi.org/10.1016/0004-6981(84)90020-9, 1984.
Keene, W. C., Galloway, J. N., and Holden, J. D.: Measurement of weak organic acidity in precipitation from remote areas of the world, J. Geophys. Res.-Oceans, 88, 5122–5130, https://doi.org/10.1029/JC088iC09p05122, 1983.
Keene, W. C., Galloway, J. N., Likens, G. E., Deviney, F. A., Mikkelsen, K. N., Moody, J. L., and Maben, J. R.: Atmospheric Wet Deposition in Remote Regions: Benchmarks for Environmental Change, J. Atmos. Sci., 72, 2947–2978, https://doi.org/10.1175/JAS-D-14-0378.1, 2015.
Keller, C. A., Long, M. S., Yantosca, R. M., Da Silva, A. M., Pawson, S., and Jacob, D. J.: HEMCO v1.0: a versatile, ESMF-compliant component for calculating emissions in atmospheric models, Geosci. Model Dev., 7, 1409–1417, https://doi.org/10.5194/gmd-7-1409-2014, 2014.
Khan, M. A. H., Lyons, K., Chhantyal-Pun, R., McGillen, M. R., Caravan, R. L., Taatjes, C. A., Orr-Ewing, A. J., Percival, C. J., and Shallcross, D. E.: Investigating the Tropospheric Chemistry of Acetic Acid Using the Global 3-D Chemistry Transport Model, STOCHEM-CRI, J. Geophys. Res.-Atmos., 123, 6267–6281, https://doi.org/10.1029/2018JD028529, 2018.
Khare, P., Kumar, N., Kumari, K. M., and Srivastava, S. S.: Atmospheric formic and acetic acids: An overview, Rev. Geophys., 37, 227–248, https://doi.org/10.1029/1998RG900005, 1999.
Kim, H. J., Lee, T., Park, T., Park, G., Collett, J. L., Park, K., Ahn, J. Y., Ban, J., Kang, S., Kim, K., Park, S.-M., Jho, E. H., and Choi, Y.: Ship-borne observations of sea fog and rain chemistry over the North and South Pacific Ocean, J. Atmos. Chem., 76, 315–326, https://doi.org/10.1007/s10874-020-09403-8, 2019.
Kim, P. S., Jacob, D. J., Fisher, J. A., Travis, K., Yu, K., Zhu, L., Yantosca, R. M., Sulprizio, M. P., Jimenez, J. L., Campuzano-Jost, P., Froyd, K. D., Liao, J., Hair, J. W., Fenn, M. A., Butler, C. F., Wagner, N. L., Gordon, T. D., Welti, A., Wennberg, P. O., Crounse, J. D., St. Clair, J. M., Teng, A. P., Millet, D. B., Schwarz, J. P., Markovic, M. Z., and Perring, A. E.: Sources, seasonality, and trends of southeast US aerosol: an integrated analysis of surface, aircraft, and satellite observations with the GEOS-Chem chemical transport model, Atmos. Chem. Phys., 15, 10411–10433, https://doi.org/10.5194/acp-15-10411-2015, 2015.
Kuylenstierna, J. C. I., Rodhe, H., Cinderby, S., and Hicks, K.: Acidification in Developing Countries: Ecosystem Sensitivity and the Critical Load Approach on a Global Scale, AMBIO J. Hum. Environ., 30, 20–28, https://doi.org/10.1579/0044-7447-30.1.20, 2001.
Lamarque, J.-F., Emmons, L. K., Hess, P. G., Kinnison, D. E., Tilmes, S., Vitt, F., Heald, C. L., Holland, E. A., Lauritzen, P. H., Neu, J., Orlando, J. J., Rasch, P. J., and Tyndall, G. K.: CAM-chem: description and evaluation of interactive atmospheric chemistry in the Community Earth System Model, Geosci. Model Dev., 5, 369–411, https://doi.org/10.5194/gmd-5-369-2012, 2012.
Lamarque, J.-F., Dentener, F., McConnell, J., Ro, C.-U., Shaw, M., Vet, R., Bergmann, D., Cameron-Smith, P., Dalsoren, S., Doherty, R., Faluvegi, G., Ghan, S. J., Josse, B., Lee, Y. H., MacKenzie, I. A., Plummer, D., Shindell, D. T., Skeie, R. B., Stevenson, D. S., Strode, S., Zeng, G., Curran, M., Dahl-Jensen, D., Das, S., Fritzsche, D., and Nolan, M.: Multi-model mean nitrogen and sulfur deposition from the Atmospheric Chemistry and Climate Model Intercomparison Project (ACCMIP): evaluation of historical and projected future changes, Atmos. Chem. Phys., 13, 7997–8018, https://doi.org/10.5194/acp-13-7997-2013, 2013.
Langner, J., Bergström, R., and Foltescu, V.: Impact of climate change on surface ozone and deposition of sulphur and nitrogen in Europe, Atmos. Environ., 39, 1129–1141, https://doi.org/10.1016/j.atmosenv.2004.09.082, 2005.
Legrand, M., Preunkert, S., Jourdain, B., and Aumont, B.: Year-round records of gas and particulate formic and acetic acids in the boundary layer at Dumont d'Urville, coastal Antarctica, J. Geophys. Res.-Atmos., 109, D06313, https://doi.org/10.1029/2003JD003786, 2004.
Li, J., Wang, X., Chen, J., Zhu, C., Li, W., Li, C., Liu, L., Xu, C., Wen, L., Xue, L., Wang, W., Ding, A., and Herrmann, H.: Chemical composition and droplet size distribution of cloud at the summit of Mount Tai, China, Atmos. Chem. Phys., 17, 9885–9896, https://doi.org/10.5194/acp-17-9885-2017, 2017.
Li, M., Zhang, Q., Kurokawa, J.-I., Woo, J.-H., He, K., Lu, Z., Ohara, T., Song, Y., Streets, D. G., Carmichael, G. R., Cheng, Y., Hong, C., Huo, H., Jiang, X., Kang, S., Liu, F., Su, H., and Zheng, B.: MIX: a mosaic Asian anthropogenic emission inventory under the international collaboration framework of the MICS-Asia and HTAP, Atmos. Chem. Phys., 17, 935–963, https://doi.org/10.5194/acp-17-935-2017, 2017.
Li, T., Wang, Z., Wang, Y., Wu, C., Liang, Y., Xia, M., Yu, C., Yun, H., Wang, W., Wang, Y., Guo, J., Herrmann, H., and Wang, T.: Chemical characteristics of cloud water and the impacts on aerosol properties at a subtropical mountain site in Hong Kong SAR, Atmos. Chem. Phys., 20, 391–407, https://doi.org/10.5194/acp-20-391-2020, 2020.
Liljestrand, H. M.: Average rainwater pH, concepts of atmospheric acidity, and buffering in open systems, Atmos. Environ., 1967, 487–499, https://doi.org/10.1016/0004-6981(85)90169-6, 1985.
Liu, H., Jacob, D. J., Bey, I., and Yantosca, R. M.: Constraints from 210Pb and 7Be on wet deposition and transport in a global three-dimensional chemical, J. Geophys. Res., 106, 12109–12128, https://doi.org/10.1029/2000JD900839, 2001.
Mahowald, N. M., Baker, A. R., Bergametti, G., Brooks, N., Duce, R. A., Jickells, T. D., Kubilay, N., Prospero, J. M., and Tegen, I.: Atmospheric global dust cycle and iron inputs to the ocean, Global Biogeochem. Cycles, 19, GB4025, https://doi.org/10.1029/2004GB002402, 2005.
Makowski Giannoni, S., Rollenbeck, R., Fabian, P., and Bendix, J.: Complex topography influences atmospheric nitrate deposition in a neotropical mountain rainforest, Atmos. Environ., 79, 385–394, https://doi.org/10.1016/j.atmosenv.2013.06.023, 2013.
Makowski Giannoni, S., Trachte, K., Rollenbeck, R., Lehnert, L., Fuchs, J., and Bendix, J.: Atmospheric salt deposition in a tropical mountain rainforest at the eastern Andean slopes of south Ecuador – Pacific or Atlantic origin?, Atmos. Chem. Phys., 16, 10241–10261, https://doi.org/10.5194/acp-16-10241-2016, 2016.
Mao, J., Paulot, F., Jacob, D. J., Cohen, R. C., Crounse, J. D., Wennberg, P. O., Keller, C. A., Hudman, R. C., Barkley, M. P., and Horowitz, L. W.: Ozone and organic nitrates over the eastern United States: Sensitivity to isoprene chemistry, J. Geophys. Res.-Atmos., 118, 11256–11268, https://doi.org/10.1002/jgrd.50817, 2013.
Marais, E. A. and Wiedinmyer, C.: Air Quality Impact of Diffuse and Inefficient Combustion Emissions in Africa (DICE-Africa), Environ. Sci. Technol., 50, 10739–10745, https://doi.org/10.1021/acs.est.6b02602, 2016.
Martin, L. R., Damschen, D. E., and Judekis, H. S.: Sulfur oxide oxidation reaction in aqueous solution, US Environmental Protection Agency, Research Triangle Park, NC, 1981.
McDuffie, E. E., Fibiger, D. L., Dubé, W. P., Lopez-Hilfiker, F., Lee, B. H., Thornton, J. A., Shah, V., Jaeglé, L., Guo, H., Weber, R. J., Michael Reeves, J., Weinheimer, A. J., Schroder, J. C., Campuzano-Jost, P., Jimenez, J. L., Dibb, J. E., Veres, P., Ebben, C., Sparks, T. L., Wooldridge, P. J., Cohen, R. C., Hornbrook, R. S., Apel, E. C., Campos, T., Hall, S. R., Ullmann, K., and Brown, S. S.: Heterogeneous N2O5 Uptake During Winter: Aircraft Measurements During the 2015 WINTER Campaign and Critical Evaluation of Current Parameterizations, J. Geophys. Res.-Atmos., 123, 4345–4372, https://doi.org/10.1002/2018JD028336, 2018.
Meyer-Christoffer, A., Becker, A., Finger, P., Schneider, U., and Ziese, M.: GPCC Climatology Version 2018 at 0.5∘: Monthly Land-Surface Precipitation Climatology for Every Month and the Total Year from Rain-Gauges built on GTS-based and Historical Data, https://doi.org/10.5676/DWD_GPCC/CLIM_M_V2018_050, 2018.
Michna, P., Werner, R. A., and Eugster, W.: Does fog chemistry in Switzerland change with altitude?, Atmos. Res., 151, 31–44, https://doi.org/10.1016/j.atmosres.2014.02.008, 2015.
Millet, D. B., Baasandorj, M., Farmer, D. K., Thornton, J. A., Baumann, K., Brophy, P., Chaliyakunnel, S., de Gouw, J. A., Graus, M., Hu, L., Koss, A., Lee, B. H., Lopez-Hilfiker, F. D., Neuman, J. A., Paulot, F., Peischl, J., Pollack, I. B., Ryerson, T. B., Warneke, C., Williams, B. J., and Xu, J.: A large and ubiquitous source of atmospheric formic acid, Atmos. Chem. Phys., 15, 6283–6304, https://doi.org/10.5194/acp-15-6283-2015, 2015.
Moch, J. M., Dovrou, L. J., Mickley, L. J., Keutsch, F. N., Liu, Z., Wang, Y., Dombek, T. L., Kuwata, M., Budisulistiorini, S. H., Yang, L., Decesari, S., Paglione, M., Alexander, B., Shao, J., Munger, J. W., and Jacob, D. J.: Global importance of hydroxymethanesulfonate in ambient particulate matter: Implications for air quality, J. Geophys. Res.-Atmos., 125, e2020JD032706, https://doi.org/10.1029/2020JD032706, 2020.
Morgan, J. J.: Factors Governing the pH, Availability of H+, and Oxidation Capacity of Rain, in: Atmospheric Chemistry, edited by: Goldberg, E. D., pp. 17–40, Springer Berlin Heidelberg, Berlin, Heidelberg, 1982.
Murray, G. L. D., Kimball, K. D., Hill, L. B., Hislop, J. E., and Weathers, K. C.: Long-Term Trends in Cloud and Rain Chemistry on Mount Washington, New Hampshire, Water. Air. Soil Pollut., 224, 1653, https://doi.org/10.1007/s11270-013-1653-7, 2013.
Murray, L. T., Jacob, D. J., Logan, J. A., Hudman, R. C., and Koshak, W. J.: Optimized regional and interannual variability of lightning in a global chemical transport model constrained by LIS/OTD satellite data, J. Geophys. Res.-Atmos., 117, D20307, https://doi.org/10.1029/2012JD017934, 2012.
Myriokefalitakis, S., Tsigaridis, K., Mihalopoulos, N., Sciare, J., Nenes, A., Kawamura, K., Segers, A., and Kanakidou, M.: In-cloud oxalate formation in the global troposphere: a 3-D modeling study, Atmos. Chem. Phys., 11, 5761–5782, https://doi.org/10.5194/acp-11-5761-2011, 2011.
NADP: NTN data for all sites, available at: http://nadp.slh.wisc.edu/data/NTN/ntnAllsites.aspx, last access: 11 October 2019.
Nieberding, F., Breuer, B., Braeckevelt, E., Klemm, O., Song, Q., and Zhang, Y.: Fog Water Chemical Composition on Ailaoshan Mountain, Yunnan Province, SW China, Aerosol Air Qual. Res., 18, 37–48, https://doi.org/10.4209/aaqr.2017.01.0060, 2018.
Niu, Y., Li, X., Pu, J., and Huang, Z.: Organic acids contribute to rainwater acidity at a rural site in eastern China, Air Qual. Atmosphere Health, 11, 459–469, https://doi.org/10.1007/s11869-018-0553-9, 2018.
Nordstrom, D. K., Plummer, L. N., Langmuir, D., Busenberg, E., May, H. M., Jones, B. F., and Parkhurst, D. L.: Revised Chemical Equilibrium Data for Major Water–Mineral Reactions and Their Limitations, in: Chemical Modeling of Aqueous Systems II, vol. 416, edited by: Melchior, D. C. and Bassett, R. L., pp. 398–413, American Chemical Society, Washington, D.C., 1990.
NRC: Acid Deposition: Atmospheric Processes in Eastern North America, National Academies Press, Washington, D.C., 1983.
Ogren, J. and Rodhe, H.: Measurements of the chemical composition of cloudwater at a clean air site in central Scandinavia, Tellus B, 38, 190–196, https://doi.org/10.3402/tellusb.v38i3-4.15128, 1986.
Olendrzynski, K., Jonson, J. E., Bartnicki, J., Jakobsen, H. A., and Berge, E.: EMEP Eulerian model for acid deposition over Europe, Int. J. Environ. Pollut., 14, 391, https://doi.org/10.1504/IJEP.2000.000561, 2000.
Overton, J. H., Aneja, V. P., and Durham, J. L.: Production of sulfate in rain and raindrops in polluted atmospheres, Atmos. Environ., 13, 355–367, https://doi.org/10.1016/0004-6981(79)90292-0, 1979.
Pandis, S. N. and Seinfeld, J. H.: Sensitivity analysis of a chemical mechanism for aqueous-phase atmospheric chemistry, J. Geophys. Res., 94, 1105–1126, https://doi.org/10.1029/JD094iD01p01105, 1989.
Parungo, F., Nagamoto, C., Nolt, I., Dias, M., and Nickerson, E.: Chemical analysis of cloud water collected over Hawaii, J. Geophys. Res., 87, 8805, https://doi.org/10.1029/JC087iC11p08805, 1982.
Paulot, F., Wunch, D., Crounse, J. D., Toon, G. C., Millet, D. B., DeCarlo, P. F., Vigouroux, C., Deutscher, N. M., González Abad, G., Notholt, J., Warneke, T., Hannigan, J. W., Warneke, C., de Gouw, J. A., Dunlea, E. J., De Mazière, M., Griffith, D. W. T., Bernath, P., Jimenez, J. L., and Wennberg, P. O.: Importance of secondary sources in the atmospheric budgets of formic and acetic acids, Atmos. Chem. Phys., 11, 1989–2013, https://doi.org/10.5194/acp-11-1989-2011, 2011.
Paulot, F., Malyshev, S., Nguyen, T., Crounse, J. D., Shevliakova, E., and Horowitz, L. W.: Representing sub-grid scale variations in nitrogen deposition associated with land use in a global Earth system model: implications for present and future nitrogen deposition fluxes over North America, Atmos. Chem. Phys., 18, 17963–17978, https://doi.org/10.5194/acp-18-17963-2018, 2018.
Peña, R. M., García, S., Herrero, C., Losada, M., Vázquez, A., and Lucas, T.: Organic acids and aldehydes in rainwater in a northwest region of Spain, Atmos. Environ., 36, 5277–5288, https://doi.org/10.1016/S1352-2310(02)00648-9, 2002.
Philip, S., Martin, R. V., Snider, G., Weagle, C. L., van Donkelaar, A., Brauer, M., Henze, D. K., Klimont, Z., Venkataraman, C., Guttikunda, S. K., and Zhang, Q.: Anthropogenic fugitive, combustion and industrial dust is a significant, underrepresented fine particulate matter source in global atmospheric models, Environ. Res. Lett., 12, 044018, https://doi.org/10.1088/1748-9326/aa65a4, 2017.
Platt, U. and Hönninger, G.: The role of halogen species in the troposphere, Chemosphere, 52, 325–338, https://doi.org/10.1016/S0045-6535(03)00216-9, 2003.
Prabhakar, G., Ervens, B., Wang, Z., Maudlin, L. C., Coggon, M. M., Jonsson, H. H., Seinfeld, J. H., and Sorooshian, A.: Sources of nitrate in stratocumulus cloud water: Airborne measurements during the 2011 E-PEACE and 2013 NiCE studies, Atmos. Environ., 97, 166–173, https://doi.org/10.1016/j.atmosenv.2014.08.019, 2014.
Pye, H. O. T., Nenes, A., Alexander, B., Ault, A. P., Barth, M. C., Clegg, S. L., Collett Jr., J. L., Fahey, K. M., Hennigan, C. J., Herrmann, H., Kanakidou, M., Kelly, J. T., Ku, I.-T., McNeill, V. F., Riemer, N., Schaefer, T., Shi, G., Tilgner, A., Walker, J. T., Wang, T., Weber, R., Xing, J., Zaveri, R. A., and Zuend, A.: The acidity of atmospheric particles and clouds, Atmos. Chem. Phys., 20, 4809–4888, https://doi.org/10.5194/acp-20-4809-2020, 2020.
Reuss, J. O. and Johnson, D. W.: Acid Deposition and the Acidification of Soils and Waters, Springer New York, New York, NY, 1986.
Ridley, D. A., Heald, C. L., Pierce, J. R., and Evans, M. J.: Toward resolution-independent dust emissions in global models: Impacts on the seasonal and spatial distribution of dust, Geophys. Res. Lett., 40, 2873–2877, https://doi.org/10.1002/grl.50409, 2013.
Rodhe, H., Langner, J., Gallardo, L., and Kjellström, E.: Global scale transport of acidifying pollutants, Water Air. Soil Pollut., 85, 37–50, https://doi.org/10.1007/BF00483687, 1995.
Rodhe, H., Dentener, F., and Schulz, M.: The Global Distribution of Acidifying Wet Deposition, Environ. Sci. Technol., 36, 4382–4388, https://doi.org/10.1021/es020057g, 2002.
Sander, R.: Compilation of Henry's law constants (version 4.0) for water as solvent, Atmos. Chem. Phys., 15, 4399–4981, https://doi.org/10.5194/acp-15-4399-2015, 2015.
Sanhueza, E., Arias, M. C., Donoso, L., Graterol, N., Hermoso, M., Marti, I., Romero, J., Rondon, A., and Santana, M.: Chemical composition of acid rains in the Venezuelan savannah region, Tellus B, 44, 54–62, https://doi.org/10.1034/j.1600-0889.1992.00005.x, 1992.
Saxena, V. K. and Lin, N.-H.: Cloud chemistry measurements and estimates of acidic deposition on an above cloudbase coniferous forest, Atmos. Environ., 24, 329–352, https://doi.org/10.1016/0960-1686(90)90113-2, 1990.
Schunk, C., Trautwein, P., Hruschka, H., Frost, E., Dodson, L., Derhem, A., Bargach, J., and Menzel, A.: Testing Water Yield, Efficiency of Different Meshes and Water Quality with a Novel Fog Collector for High Wind Speeds, Aerosol Air Qual. Res., 18, 240–253, https://doi.org/10.4209/aaqr.2016.12.0528, 2018.
Schwab, J. J., Casson, P., Brandt, R., Husain, L., Dutkewicz, V., Wolfe, D., Demerjian, K. L., Civerolo, K. L., Rattigan, O. V., Felton, H. D., and Dukett, J. E.: Atmospheric Chemistry Measurements at Whiteface Mountain, NY: Cloud Water Chemistry, Precipitation Chemistry, and Particulate Matter, Aerosol Air Qual. Res., 16, 841–854, https://doi.org/10.4209/aaqr.2015.05.0344, 2016.
Sherwen, T., Schmidt, J. A., Evans, M. J., Carpenter, L. J., Großmann, K., Eastham, S. D., Jacob, D. J., Dix, B., Koenig, T. K., Sinreich, R., Ortega, I., Volkamer, R., Saiz-Lopez, A., Prados-Roman, C., Mahajan, A. S., and Ordóñez, C.: Global impacts of tropospheric halogens (Cl, Br, I) on oxidants and composition in GEOS-Chem, Atmos. Chem. Phys., 16, 12239–12271, https://doi.org/10.5194/acp-16-12239-2016, 2016.
Sheu, G.-R. and Lin, N.-H.: Characterizations of wet mercury deposition to a remote islet (Pengjiayu) in the subtropical Northwest Pacific Ocean, Atmos. Environ., 77, 474–481, https://doi.org/10.1016/j.atmosenv.2013.05.038, 2013.
Sigha-Nkamdjou, L., Galy-Lacaux, C., Pont, V., Richard, S., Sighomnou, D., and Lacaux, J. P.: Rainwater Chemistry and Wet Deposition over the Equatorial Forested Ecosystem of Zoétélé (Cameroon), J. Atmos. Chem., 46, 173–198, https://doi.org/10.1023/A:1026057413640, 2003.
Simon, S., Klemm, O., Tarek, E.-M., Joschka, W., Katharina, A., Po-Hsiung, L., Shih-Chieh, C., Neng-Huei, L., Guenter, E., Shih-Chieh, H., Tsong-Huei, W., Ya-Nan, W., and Yu-Chi, L.: Chemical Composition of Fog Water at Four Sites in Taiwan, Aerosol Air Qual. Res., 16, 618–631, https://doi.org/10.4209/aaqr.2015.03.0154, 2016.
Simpson, D., Benedictow, A., Berge, H., Bergström, R., Emberson, L. D., Fagerli, H., Flechard, C. R., Hayman, G. D., Gauss, M., Jonson, J. E., Jenkin, M. E., Nyíri, A., Richter, C., Semeena, V. S., Tsyro, S., Tuovinen, J.-P., Valdebenito, Á., and Wind, P.: The EMEP MSC-W chemical transport model – technical description, Atmos. Chem. Phys., 12, 7825–7865, https://doi.org/10.5194/acp-12-7825-2012, 2012.
Søvde, O. A., Prather, M. J., Isaksen, I. S. A., Berntsen, T. K., Stordal, F., Zhu, X., Holmes, C. D., and Hsu, J.: The chemical transport model Oslo CTM3, Geosci. Model Dev., 5, 1441–1469, https://doi.org/10.5194/gmd-5-1441-2012, 2012.
Stavrakou, T., Müller, J.-F., Peeters, J., Razavi, A., Clarisse, L., Clerbaux, C., Coheur, P.-F., Hurtmans, D., De Mazière, M., Vigouroux, C., Deutscher, N. M., Griffith, D. W. T., Jones, N., and Paton-Walsh, C.: Satellite evidence for a large source of formic acid from boreal and tropical forests, Nat. Geosci., 5, 26–30, https://doi.org/10.1038/ngeo1354, 2012.
Stettler, M. E. J., Eastham, S., and Barrett, S. R. H.: Air quality and public health impacts of UK airports. Part I: Emissions, Atmos. Environ., 45, 5415–5424, https://doi.org/10.1016/j.atmosenv.2011.07.012, 2011.
Straub, D. J., Lee, T., and Collett Jr., J. L.: Chemical composition of marine stratocumulus clouds over the eastern Pacific Ocean, J. Geophys. Res.-Atmos., 112, D04307, https://doi.org/10.1029/2006JD007439, 2007.
Stumm, W., Sigg, L., and Schnoor, J. L.: Aquatic chemistry of acid deposition, Environ. Sci. Technol., 21, 8–13, https://doi.org/10.1021/es00155a001, 1987.
Sun, L., Wang, Y., Yue, T., Yang, X., Xue, L., and Wang, W.: Evaluation of the behavior of clouds in a region of severe acid rain pollution in southern China: species, complexes, and variations, Environ. Sci. Pollut. Res., 22, 14280–14290, https://doi.org/10.1007/s11356-015-4674-5, 2015.
Sun, M., Wang, Y., Wang, T., Fan, S., Wang, W., Li, P., Guo, J., and Li, Y.: Cloud and the corresponding precipitation chemistry in south China: Water-soluble components and pollution transport, J. Geophys. Res., 115, D22303, https://doi.org/10.1029/2010JD014315, 2010.
Talbot, R. W., Andreae, M. O., Berresheim, H., Jacob, D. J., and Beecher, K. M.: Sources and sinks of formic, acetic, and pyruvic acids over central Amazonia: 2. Wet season, J. Geophys. Res., 95, 16799, https://doi.org/10.1029/JD095iD10p16799, 1990.
Talbot, R. W., Dibb, J. E., Lefer, B. L., Scheuer, E. M., Bradshaw, J. D., Sandholm, S. T., Smyth, S., Blake, D. R., Blake, N. J., Sachse, G. W., Collins, J. E., and Gregory, G. L.: Large-scale distributions of tropospheric nitric, formic, and acetic acids over the western Pacific basin during wintertime, J. Geophys. Res.-Atmos., 102, 28303–28313, https://doi.org/10.1029/96JD02975, 1997.
Tost, H., Jöckel, P., Kerkweg, A., Pozzer, A., Sander, R., and Lelieveld, J.: Global cloud and precipitation chemistry and wet deposition: tropospheric model simulations with ECHAM5/MESSy1, Atmos. Chem. Phys., 7, 2733–2757, https://doi.org/10.5194/acp-7-2733-2007, 2007.
Travis, K. R., Jacob, D. J., Fisher, J. A., Kim, P. S., Marais, E. A., Zhu, L., Yu, K., Miller, C. C., Yantosca, R. M., Sulprizio, M. P., Thompson, A. M., Wennberg, P. O., Crounse, J. D., St. Clair, J. M., Cohen, R. C., Laughner, J. L., Dibb, J. E., Hall, S. R., Ullmann, K., Wolfe, G. M., Pollack, I. B., Peischl, J., Neuman, J. A., and Zhou, X.: Why do models overestimate surface ozone in the Southeast United States?, Atmos. Chem. Phys., 16, 13561–13577, https://doi.org/10.5194/acp-16-13561-2016, 2016.
U.S. Environmental Protection Agency: 2011 National Emissions Inventory (NEI) Data, available at: https://www.epa.gov/air-emissions-inventories/2011-national-emissions-inventory-nei-data, last access: 23 March 2018.
van der Werf, G. R., Randerson, J. T., Giglio, L., van Leeuwen, T. T., Chen, Y., Rogers, B. M., Mu, M., van Marle, M. J. E., Morton, D. C., Collatz, G. J., Yokelson, R. J., and Kasibhatla, P. S.: Global fire emissions estimates during 1997–2016, Earth Syst. Sci. Data, 9, 697–720, https://doi.org/10.5194/essd-9-697-2017, 2017.
van Donkelaar, A., Martin, R. V., Leaitch, W. R., Macdonald, A. M., Walker, T. W., Streets, D. G., Zhang, Q., Dunlea, E. J., Jimenez, J. L., Dibb, J. E., Huey, L. G., Weber, R., and Andreae, M. O.: Analysis of aircraft and satellite measurements from the Intercontinental Chemical Transport Experiment (INTEX-B) to quantify long-range transport of East Asian sulfur to Canada, Atmos. Chem. Phys., 8, 2999–3014, https://doi.org/10.5194/acp-8-2999-2008, 2008.
van Pinxteren, D., Fomba, K. W., Mertes, S., Müller, K., Spindler, G., Schneider, J., Lee, T., Collett, J. L., and Herrmann, H.: Cloud water composition during HCCT-2010: Scavenging efficiencies, solute concentrations, and droplet size dependence of inorganic ions and dissolved organic carbon, Atmos. Chem. Phys., 16, 3185–3205, https://doi.org/10.5194/acp-16-3185-2016, 2016.
Venkatram, A., Karamchandani, P. K., and Misra, P. K.: Testing a comprehensive acid deposition model, Atmos. Environ., 22, 737–747, https://doi.org/10.1016/0004-6981(88)90011-X, 1988.
Vet, R., Artz, R. S., Carou, S., Shaw, M., Ro, C.-U., Aas, W., Baker, A., Bowersox, V. C., Dentener, F., Galy-Lacaux, C., Hou, A., Pienaar, J. J., Gillett, R., Forti, M. C., Gromov, S., Hara, H., Khodzher, T., Mahowald, N. M., Nickovic, S., Rao, P. S. P., and Reid, N. W.: A global assessment of precipitation chemistry and deposition of sulfur, nitrogen, sea salt, base cations, organic acids, acidity and pH, and phosphorus, Atmos. Environ., 93, 3–100, https://doi.org/10.1016/j.atmosenv.2013.10.060, 2014.
Vinken, G. C. M., Boersma, K. F., Jacob, D. J., and Meijer, E. W.: Accounting for non-linear chemistry of ship plumes in the GEOS-Chem global chemistry transport model, Atmos. Chem. Phys., 11, 11707–11722, https://doi.org/10.5194/acp-11-11707-2011, 2011.
Vong, R. J., Baker, B. M., Brechtel, F. J., Collier, R. T., Harris, J. M., Kowalski, A. S., McDonald, N. C., and Mcinnes, L. M.: Ionic and trace element composition of cloud water collected on the Olympic Peninsula of Washington State, Atmos. Environ., 31, 1991–2001, https://doi.org/10.1016/S1352-2310(96)00337-8, 1997.
von Glasow, R. and Crutzen, P. J.: 4.02 – Tropospheric Halogen Chemistry, in Treatise on Geochemistry, edited by: Holland, H. D. and Turekian, K. K., pp. 1–67, Pergamon, Oxford, 2003.
Wang, C., Corbett, J. J., and Firestone, J.: Improving Spatial Representation of Global Ship Emissions Inventories, Environ. Sci. Technol., 42, 193–199, https://doi.org/10.1021/es0700799, 2008.
Wang, Q., Jacob, D. J., Fisher, J. A., Mao, J., Leibensperger, E. M., Carouge, C. C., Le Sager, P., Kondo, Y., Jimenez, J. L., Cubison, M. J., and Doherty, S. J.: Sources of carbonaceous aerosols and deposited black carbon in the Arctic in winter–spring: implications for radiative forcing, Atmos. Chem. Phys., 11, 12453–12473, https://doi.org/10.5194/acp-11-12453-2011, 2011.
Wang, W., Xu, W., Collett, J. L., Liu, D., Zheng, A., Dore, A. J., and Liu, X.: Chemical compositions of fog and precipitation at Sejila Mountain in the southeast Tibetan Plateau, China, Environ. Pollut., 253, 560–568, https://doi.org/10.1016/j.envpol.2019.07.055, 2019.
Wang, X., Jacob, D. J., Eastham, S. D., Sulprizio, M. P., Zhu, L., Chen, Q., Alexander, B., Sherwen, T., Evans, M. J., Lee, B. H., Haskins, J. D., Lopez-Hilfiker, F. D., Thornton, J. A., Huey, G. L., and Liao, H.: The role of chlorine in global tropospheric chemistry, Atmos. Chem. Phys., 19, 3981–4003, https://doi.org/10.5194/acp-19-3981-2019, 2019.
Wang, Y., Jacob, D. J., and Logan, J. A.: Global simulation of tropospheric O3-NOx-hydrocarbon chemistry: 1. Model formulation, J. Geophys. Res.-Atmos., 103, 10713–10725, https://doi.org/10.1029/98JD00158, 1998.
Wang, Z., Sorooshian, A., Prabhakar, G., Coggon, M. M., and Jonsson, H. H.: Impact of emissions from shipping, land, and the ocean on stratocumulus cloud water elemental composition during the 2011 E-PEACE field campaign, Atmos. Environ., 89, 570–580, https://doi.org/10.1016/j.atmosenv.2014.01.020, 2014.
Warneck, P.: Chemistry of the Natural Atmosphere (2nd ed.), pp. 451–510, Academic Press, San Diego, 2000.
Watanabe, K., Honoki, H., Iwai, A., Tomatsu, A., Noritake, K., Miyashita, N., Yamada, K., Yamada, H., Kawamura, H., and Aoki, K.: Chemical Characteristics of Fog Water at Mt. Tateyama, Near the Coast of the Japan Sea in Central Japan, Water Air. Soil Pollut., 211, 379–393, https://doi.org/10.1007/s11270-009-0307-2, 2010.
Watanabe, S., Hajima, T., Sudo, K., Nagashima, T., Takemura, T., Okajima, H., Nozawa, T., Kawase, H., Abe, M., Yokohata, T., Ise, T., Sato, H., Kato, E., Takata, K., Emori, S., and Kawamiya, M.: MIROC-ESM 2010: model description and basic results of CMIP5-20c3m experiments, Geosci. Model Dev., 4, 845–872, https://doi.org/10.5194/gmd-4-845-2011, 2011.
Watmough, S. A., Aherne, J., Alewell, C., Arp, P., Bailey, S., Clair, T., Dillon, P., Duchesne, L., Eimers, C., Fernandez, I., Foster, N., Larssen, T., Miller, E., Mitchell, M., and Page, S.: Sulphate, Nitrogen and Base Cation Budgets at 21 Forested Catchments in Canada, the United States and Europe, Environ. Monit. Assess., 109, 1–36, https://doi.org/10.1007/s10661-005-4336-z, 2005.
Weathers, K. C., Likens, G. E., Bormann, F. Herbert., Bicknell, S. H., Bormann, B. T., Daube, B. C., Eaton, J. S., Galloway, J. N., Keene, W. C., Kimball, K. D., McDowell, W. H., Siccama, T. G., Smiley, D., and Tarrant, R. A.: Cloudwater chemistry from ten sites in North America, Environ. Sci. Technol., 22, 1018–1026, https://doi.org/10.1021/es00174a004, 1988.
Wesely, M.: Parameterization of surface resistances to gaseous dry deposition in regional-scale numerical models, Atmos. Environ., 23, 1293–1304, https://doi.org/10.1016/0004-6981(89)90153-4, 1989.
Xu, G., Lee, X., Lü, Y., Chen, Y., and Huang, D.: Seasonal variations of carboxylic acids and their contributions to the rainwater acidity: A case study of Guiyang and Shangzhong, China, Chin. Sci. Bull., 55, 1667–1673, https://doi.org/10.1007/s11434-009-3343-9, 2010.
Yoboué, V., Galy-Lacaux, C., Lacaux, J. P., and Silué, S.: Rainwater Chemistry and Wet Deposition over the Wet Savanna Ecosystem of Lamto (Côte d'Ivoire), J. Atmos. Chem., 52, 117–141, https://doi.org/10.1007/s10874-005-0281-z, 2005.
Zheng, B., Tong, D., Li, M., Liu, F., Hong, C., Geng, G., Li, H., Li, X., Peng, L., Qi, J., Yan, L., Zhang, Y., Zhao, H., Zheng, Y., He, K., and Zhang, Q.: Trends in China's anthropogenic emissions since 2010 as the consequence of clean air actions, Atmos. Chem. Phys., 18, 14095–14111, https://doi.org/10.5194/acp-18-14095-2018, 2018.
Zhu, C., Chen, J., Wang, X., Li, J., Wei, M., Xu, C., Xu, X., Ding, A., and Collett, J. L.: Chemical Composition and Bacterial Community in Size-Resolved Cloud Water at the Summit of Mt. Tai, China, Aerosol Air Qual. Res., 18, 1–14, https://doi.org/10.4209/aaqr.2016.11.0493, 2018.
Zinder, B., Schumann, T., and Waldvogel, A.: Aerosol and hydrometeor concentrations and their chemical composition during winter precipitation along a mountain slope – II. Enhancement of below-cloud scavenging in a stably stratified atmosphere, Atmos. Environ., 22, 2741–2750, https://doi.org/10.1016/0004-6981(88)90441-6, 1988.