the Creative Commons Attribution 4.0 License.
the Creative Commons Attribution 4.0 License.
Ceilometers as planetary boundary layer height detectors and a corrective tool for COSMO and IFS models
Leenes Uzan
Smadar Egert
Pavel Khain
Yoav Levi
Elyakom Vadislavsky
Pinhas Alpert
The significance of planetary boundary layer (PBL) height detection is apparent in various fields, especially in air pollution dispersion assessments. Numerical weather models produce a high spatial and temporal resolution of PBL heights; however, their performance requires validation. This necessity is addressed here by an array of eight ceilometers; a radiosonde; and two models – the Integrated Forecast System (IFS) global model and COnsortium for Small-scale MOdeling (COSMO) regional model. The ceilometers were analyzed with the wavelet covariance transform method, and the radiosonde and models with the parcel method and the bulk Richardson method. Good agreement for PBL height was found between the ceilometer and the adjacent Bet Dagan radiosonde (33 m a.s.l.) at 11:00 UTC launching time (N=91 d, ME =4 m, RMSE =143 m, R=0.83). The models' estimations were then compared to the ceilometers' results in an additional five diverse regions where only ceilometers operate. A correction tool was established based on the altitude (h) and distance from shoreline (d) of eight ceilometer sites in various climate regions, from the shoreline of Tel Aviv (h=5 m a.s.l., d=0.05 km) to eastern elevated Jerusalem (h=830 m a.s.l., d=53 km) and southern arid Hazerim (h=200 m a.s.l., d=44 km). The tool examined the COSMO PBL height approximations based on the parcel method. Results from a 14 August 2015 case study, between 09:00 and 14:00 UTC, showed the tool decreased the PBL height at the shoreline and in the inner strip of Israel by ∼100 m and increased the elevated sites of Jerusalem and Hazerim up to ∼400 m, and ∼600 m, respectively. Cross-validation revealed good results without Bet Dagan. However, without measurements from Jerusalem, the tool underestimated Jerusalem's PBL height by up to ∼600 m.
- Article
(2157 KB) - Full-text XML
- BibTeX
- EndNote
In the era of substantial industrial development, the need to mitigate the detrimental effects of air pollution exposure is unquestionable (Anenberg et al., 2019; WHO, 2016; Héroux et al., 2015; Dockery et al.,1993). However, to regulate and establish environmental thresholds, a comprehensive understanding of the air pollution dispersion processes is necessary (Luo et al., 2014; Seidel et al., 2010, 2012; Ogawa et al., 1986; Lyons, 1975). One of the critical meteorological parameters governing air pollution dispersion is planetary boundary layer (PBL) height (Sharf et al., 1993; Garratt, 1992; Ludwing, 1983; Dayan et al., 1988). PBL height is classified as the first level of the atmosphere that dictates the vertical dispersion extent of air pollution (Stull, 1988). Hence, the quality of meteorological data provided to these models is of great importance (Urbanski et al., 2010; Scarino et al., 2014; Su et al., 2018).
Numerical weather prediction (NWP) models provide a high temporal and spatial resolution of PBL height based on mathematical equations with initial assumptions, and boundary conditioned set beforehand. However, the models display difficulty in accurately simulating the PBL creation and evolution (Luo et al., 2014; Seidel et al., 2010), and validation against actual measurements is advised. In situ atmospheric measurements by radiosondes are most efficient but costly as successive measurements. Remote-sensing measurements such as wind profilers and sophisticated lidars are mostly designated for specific campaigns limited in location and operational time (Manninen et al., 2018; Mamouri et al., 2016). Ceilometers, on the other hand, are ubiquitous in airports and meteorological service centers worldwide (TOPROF of COST Action ES1303 and E-PROFILE of the EUMETNET Profiling Programme), thus providing an advantage over the relatively scarce deployment of sophisticated lidars.
Ceilometers are single-wavelength micro-lidars intended for cloud base height detection. Vaisala ceilometers produce backscatter profiles every ∼15 s with a vertical resolution of 10 m and a height range up to 8 or 15 km, depending on the ceilometer type and the atmospheric conditions (Uzan et al., 2018). Unlike sophisticated lidars, ceilometers are not equipped to provide aerosol properties such as size distribution, scattering, and absorption coefficients (Ansmann et al., 2003, 2011; Papayannis et al., 2008). Nevertheless, their advantages have been recognized as low cost, easy maintenance, and continuous unattended operation under diverse meteorological conditions (Kotthaus and Grimmond, 2018). Over the years, several studies have assigned ceilometers as PBL height detectors (Eresmaa et al., 2006; Van der Kamp and McKendry, 2010; Haeffelin and Angelini, 2012; Wiegner et al., 2014) and compared them to NWP models (Collaud et al., 2014; Ketterer et al., 2014; Gierens et al., 2018). However, scarce attention has been paid to designating ceilometers as a correction tool for NWP PBL heights. The main goal of this study is to create this tool and improve the input data for air pollution dispersion evaluations. A description of the models and instruments applied is given in Sects. 2 and 3, respectively. Section 4 presents the PBL height detection methods. Spatial and temporal analysis of the PBL heights generated by the models and instruments at six sites is shown in Sect. 5.1. The PBL height correction tool is explained in Sect. 5.2 and demonstrated by a case study employing eight ceilometer sites. A summary is provided and conclusions are drawn in Sect. 6.
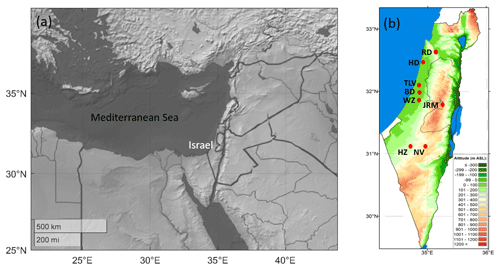
Figure 1Maps of the eastern Mediterranean (a) and the study region in Israel (b), with indications of the ceilometers' measurement sites (red circles; details given in Table 1) on a topography map, adapted from © Israeli meteorological service.
1.1 Study time and region
Located in the eastern Mediterranean, Israel contains various climate measurement sites within comparatively short distances (Fig. 1). The ceilometer array (Fig. 1, Table 1) is comprised of two coastline sites 40 km apart: Hadera (10 m a.s.l.) and Tel Aviv (5 m a.s.l.). Further inland, 12 and 23 km southeast of Tel Aviv, are Bet Dagan (33 m a.s.l.) and Weizmann (60 m a.s.l.), respectively. About 70 km southwest of the elevated Jerusalem site (830 m a.s.l.) are Hazerim (200 m a.s.l.) and Nevatim (400 m a.s.l.). Ramat David (50 m a.s.l.) represents the northern region 24 km inland.
Table 1Location and type of ceilometers.

a The maximum height decreases as the atmospheric optical density increases. b Adjacent to the radiosonde launch site.
Various institutions operate the ceilometers. In several cases, the ceilometers' output files were not methodically saved. In others, the ceilometers worked for limited periods. Following Kotthaus and Grimmond (2018), the analysis concentrated on the dry summer season due to the difficulty of evaluating the PBL height from backscatter signals during precipitation episodes. The database was narrowed down by removing dates with partial data or during dust storm events such as the unprecedented extreme dust storm in September 2015 (Uzan et al., 2018). In general, summer dust outbreaks in the eastern Mediterranean are quite rare at the low altitudes (∼1–2 km) of the PBL height (Alpert and Ziv, 1989; Alpert et al., 2000, 2002). Eventually, the analysis focused on the data available from each ceilometer within six summer months: July–September 2015 and June–August 2016.
A characteristic Israeli summer has no precipitation and mainly sporadic shallow cumulus clouds (Ziv et al., 2004; Goldreich, 2003; Saaroni and Ziv, 2000). The dominant synoptic system is the persistent Persian Trough (deep, shallow, or medium) followed by a subtropical high aloft (Alpert et al., 1990, 2004; Feliks, 1994; Dayan et al., 2002). The average summer PBL height is under 2 km a.s.l. (Dayan et al., 1988; Feliks 2004). Since backscatter signals decline with height, the conditions of low PBL heights come as an advantage.
1.2 The summer PBL height
The formation and evolution of the Israeli summer PBL height are as follows: After sunrise, ∼4:00–5:00 local standard time (LST = UTC+2), clouds initially form over the Mediterranean Sea, advect eastward to the shoreline. As the ground warms up, the nocturnal surface boundary layer dissipates, and buoyancy-induced convective updrafts instigate the formation of the sea breeze circulation (Stull, 1988). Previous research of the PBL height in Bet Dagan (33 m a.s.l. and 7.5 km east of the shoreline) has revealed an average height of ∼900 m a.g.l. after sunrise (Dayan et al., 1988; Feliks, 1994; Dayan and Rodnizki, 1999; Uzan et al., 2016; Yuval et al., 2020). The sea breeze front enters between 07:00 and 09:00 LST (Feliks, 1993; Alpert and Rabinovich-Hadar, 2003; Uzan and Alpert, 2012), depending on the time of sunrise and the different synoptic modes of the prevailing system – the Persian Trough (Alpert et al., 2004). Cool and humid marine air hinder the convective updrafts. Clouds dissolve, and the height of the shoreline boundary layer lowers by ∼250 m (Feliks, 1993, 1994; Levi et al., 2011; Uzan and Alpert, 2012). Further inland, the convective thermals continue to inflate the boundary layer (Hashmonay et al., 1991; Feliks, 1993; Lieman and Alpert, 1993). West-northwest synoptic winds enhance the sea breeze wind as it steers northwest (Neumann, 1952, 1977; Uzan and Alpert, 2012). By noontime (∼11:00–13:00 LST), maximum wind speeds further suppress the boundary layer (Uzan and Alpert, 2012). In the afternoon (∼13:00–14:00 LST), the sea breeze front reaches ∼30–50 km inland to the eastern elevated complex terrain (Hashmonay et al., 1991; Lieman and Alpert, 1993). At sunset (∼18:00–19:00 LST), as the insolation diminishes, the potential energy of the convective updrafts weakens, and the boundary layer height drops (Dayan and Rodnizki, 1999). After sunset, as ground temperature cools down, the boundary layer collapses, and a residual layer is formed above the surface boundary layer (Stull, 1988). High humidity and a low residual layer create low condensation levels, and shallow evening clouds are produced.
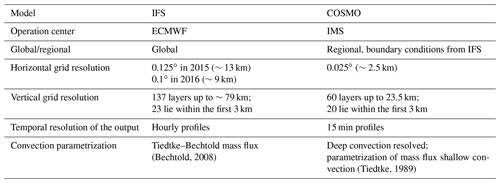
The Israeli meteorological service (IMS) utilizes two operational models: the European Centre for Medium-Range Weather Forecasts (ECMWF) Integrated Forecast System (IFS) global model and the COnsortium for Small-scale MOdeling (COSMO) regional model (Table 2).
IFS consists of 137 vertical levels. In the years 2015 and 2016, relevant to this study, the grid resolution was ∼13 and ∼10 km, respectively. IFS applies a turbulent diffusion scheme representing the vertical exchange of heat, momentum, and moisture through the sub-grid turbulence scale. A first-order K-diffusion closure based on the Monin–Obukhov similarity theory represents the surface layer turbulent fluxes. The eddy-diffusivity mass-flux framework (Koehler et al., 2011) describes the unstable conditions above the surface layer.
IMS has run COSMO over the eastern Mediterranean domain (26–36∘ N, 25–39∘ E) since 2013 with boundary and initial conditions from IFS. It consists of 60 vertical levels up to 23.5 km and a horizontal grid spacing of 2.5 km (Table 2). Primitive thermo-hydrodynamic equations represent the non-hydrostatic compressible flow in a moist atmosphere (Steppeler et al., 2003; Doms et al., 2011; Baldauf et al., 2011). The model runs a two-time-level integration scheme, based on a third-order Runge–Kutta method and a fifth-order upwind scheme for horizontal advection. Unlike in the IFS model, in the COSMO model only shallow convection is parameterized, and the deep convection is switched off (Tiedtke, 1989). The turbulence scheme of Mellor and Yamada (1982) at level 2.5 uses a reduced second-order closure with a prognostic equation for the turbulent kinetic energy. Transport and local time tendency terms in the second-order momentum equations are neglected, and the vertical turbulent fluxes are derived diagnostically (Cerenzia, 2017).
Both models estimate the PBL height by the bulk Richardson number method (described in Sect. 4.1). IFS produced hourly results, while COSMO generated profiles every 15 min. A series of trials showed that the COSMO profiles of the last 15 min within an hour best represent the hourly values of the IFS model.
3.1 Ceilometers
Vaisala Ceilometer CL31 is the primary research tool in this study (Fig. 1, Table 1). CL31 is a pulsed, elastic micro-lidar employing an indium gallium arsenide (InGaAs) laser diode transmitter of 910 nm ±10 nm near-infrared wavelength at 25 ∘C and a high pulse repetition rate of 10 kHz every 2 s (Vaisala Ceilometer CL31 user's guide: http://www.vaisala.com, last access: 24 September 2015). The backscatter signals are collected by an avalanche photodiode receiver and designed as attenuated backscatter profiles at intervals of 2–120 s (determined by the user). This study applied CL31 ceilometers except for ceilometer CL51 stationed in Weizmann Institute (Fig. 1, Table 1). CL51 consists of a higher signal and signal-to-noise ratio (SNR). Hence the backscatter profile measurement reaches ∼15 km, compared to ∼8 km of CL31. The ceilometers produce 10 m vertical resolution profiles every 15 or 16 s. Half-hourly backscatter profiles improved SNR. The second half-hour profile within each hour defined the hourly profiles.
One drawback is that calibration procedures were nonexistent at all sites. In most cases, maintenance procedures (cleaning of the ceilometer window) were not regularly carried out, except for the IMS Bet Dagan ceilometer. In the case of the backscatter coefficient detection, signal calibrations and water vapor corrections are necessary (Wiegner and Gasteiger, 2015). However, the PBL height detection method employed here (Sect. 4.3) locates the height of a pronounced change in the attenuated backscatter profile rather than a specific value. Therefore, calibration procedures are not mandatory (Wiegner et al., 2014; Gierens et al., 2018).
3.2 Radiosonde
IMS obtains systematic radiosonde atmospheric observations twice daily, at 23:00 and 11:00 UTC. The radiosonde launching site is adjacent to the Bet Dagan ceilometer (34.8∘ N, 32.0∘ E, 33 m a.s.l., 7.5 km east of the shoreline, 12 km southeast of Tel Aviv, 45 km northwest of Jerusalem; see Fig.1 and Table 1). The radiosonde, type Vaisala RS41-SG, retrieves profiles of relative humidity, temperature, pressure, wind speed, and wind direction every 10 s (∼ every 45 m), rising to ∼25 km. Here, we refer to the first 2 km for the detection of the midday summer PBL height. At this height, the average wind speed at 11:00 UTC is ∼5 m s−1 (Uzan et al., 2012). Therefore, the horizontal displacement is relatively low (∼2.5 km) and neglected. Moreover, previous research has shown the midday PBL height in Bet Dagan is below 1 km (Dayan and Rodnizki, 1999; Uzan et al., 2016; Yuval et al., 2020), corresponding to horizontal displacement of ∼0.01∘, which is well under the grid resolution of the IFS and the COSMO models.
4.1 The bulk Richardson number method
The COSMO and IFS schemes calculate the PBL height by the bulk Richardson number (Rb) method (Hanna, 1969; Zhang et al., 2014), given in the formula below:
where g is the gravitational force, θvz is the virtual potential temperature at height Z, θv0 is the virtual potential temperature at ground level (Z0), and U and V are the horizontal wind speed components at height Z (assuming U and V at surface height are insignificant and therefore negligible).
The Rb threshold determines the PBL height. The IFS model has a single threshold of 0.25 (Seidel et al., 2012). The COSMO model refers to 0.33 for stable atmospheric conditions (Wetzel, 1982) and 0.22 for unstable conditions (Vogelezang and Holtslag, 1996) in the first four levels of the model (10, 34.2, 67.9, 112.3 m a.g.l.). Linear interpolation determines the height if the detection is between two model levels. The height is assigned with a missing value if the thresholds were not reached. The models' PBL heights (given as m a.g.l.) are adjusted to the actual altitude of the ceilometer sites (Table 1). The radiosonde 11:00 UTC PBL heights were defined where the Rb profile values (derived every 10 s, corresponding to ∼45 m) altered from negative to positive. In all the dates studied, the first positive value was well above the thresholds for unstable conditions by both models (0.25 and 0.33). Therefore the PBL height was defined at the height point of the last negative value.
4.2 The parcel method
The parcel method defines the PBL height where the virtual potential temperature aloft reaches the value evaluated at the surface level (Holzworth 1964; Stull, 1988; Seidel et al., 2010). The description of the virtual potential temperature is as follows:
where P0 is the ground level pressure, P is the pressure at height Z, Rd is the dry-air gas constant, and Cp is the heat capacity of dry air. The virtual temperature (Tv) is obtained by
where T is the temperature at height Z, e is the actual vapor pressure, and ε is the ratio of molecular weights of water vapor and dry air (ε=0.622).
The virtual potential temperature profiles were computed based on the available meteorological parameters from the models and radiosonde: mixing ratio, pressure, and temperature profiles from the IFS model, and relative humidity, pressure, and temperature profiles from the COSMO model and the radiosonde. The virtual potential temperature profiles of the models at ground level were obtained by the temperature and dew point temperature at 2 m a.g.l. These parameters were derived from the models by the similarity theory. Finally, the PBL heights (given in m a.s.l.) were adjusted to the actual altitude of the ceilometer sites (Table 1).
4.3 The wavelet covariance transform method
The wavelet covariance transform (WCT) method (Baars et al., 2008; Brooks, 2003) is implemented on backscatter profiles by the formula given in Eq. (4):
where Wf(a,b) is the local maximum of the backscatter profile (f(z)) determined within the range of step (a) by the Haar step function (h). The length of the step is the number of height levels (n) multiplied by the profile height resolution (Δz) from ground level (Zb) and up (Zt). In this study, Zb was defined as the height above the perturbation of the overlap function (∼100 m), and Zt as the height with the most significant signal variance or the first appearance of negative values. Both thresholds indicate a low SNR. Zb is the lowest height among the two options. These thresholds apply under clear-sky conditions. On cloudy days, the PBL height is determined within the cloud, above the cloud base height (Wang et al., 2012; Stull, 1988).
The Haar step function given in Eq. (5) is equivalent to a derivative at height z, representing the value difference of each step (a) above and beneath a point of interest (b). In this study, b is the measurement height of the ceilometer backscatter profile. The value of the step (a) varied for each ceilometer, depending on the site location.
In arid and dusty areas such as Nevatim and Hazerim, specifically on clear days, the WCT method failed to distinguish the PBL height (Van der Kamp and McKendry, 2010; Gierens et al., 2018). Therefore, the analysis excluded these cases. The last stage consisted of manual inspection of the WCT results.
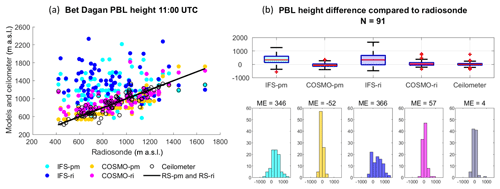
Figure 2PBL height from the Bet Dagan site at 11:00 UTC on 91 d for the periods of July–September 2015 and June–September 2016. Ceilometer profiles were analyzed with the WCT method. The IFS and COSMO models and the radiosonde profiles were analyzed with the bulk Richardson method (RS-ri, IFS-ri, COSMO-ri) and the parcel method (RS-pm, IFS-pm, COSMO-pm). The results were compared to the radiosonde (RS-ri and RS-pm produced the same heights). Statistical analysis of the scatterplot (a) is given in Table 3. PBL height difference is presented by boxplots and histograms (b). The edges of the boxplot are the 25th and 75th percentiles (q1 and q3); the whiskers enclose all data points not considered outliers (red crosses). A central red line indicates the median. Each boxplot is described by a histogram beneath.
In the Israeli summer season, stable PBL conditions are generated from sunset to an hour after sunrise (Stull, 1988). During this period the models' Rb profiles do not exceed the relevant thresholds, and a missing value is assigned (Sect. 4.1). Additionally, the difficulty of estimating the surface boundary layer by ceilometers (Gierens et al., 2018) was associated with a constant perturbation within the first range gates due to the overlap of the emitted laser beam and the receiver's field of view (Wiegner et al., 2014). Hence, the analysis focused on the midday summer PBL heights.
5.1 Spatial and temporal analysis
The analysis was performed based on six ceilometers with available data of at least 50 d within the study period: Bet Dagan, Tel Aviv, Ramat David, Weizmann, Jerusalem, and Nevatim. In Bet Dagan, the results were compared to the radiosonde; thereupon, the analysis focused on 11:00 UTC launching time. At the remaining five sites, the models were compared to the ceilometers. Statistical analysis for each site presents the mean error (ME), root mean square (RMSE), correlation (R), mean, and standard deviation (SD) given in tables and plots.
Good agreement was found between the ceilometer and the radiosonde (RS) in Bet Dagan (Fig. 2 and Table 3, ME = 4, RMSE = 143, R=0.83). The IFS analyzed with the parcel method (IFS-pm) appears to overestimate the PBL height (ME = 346, RMSE =494, R=0.14), as does the IFS analyzed with the Richardson method (IFS-ri, ME = 366, RMSE =579, ). Among the models and methods, the COSMO model by the parcel method derived the best results (COSMO-pm, ME , RMSE =146, R=0.84).
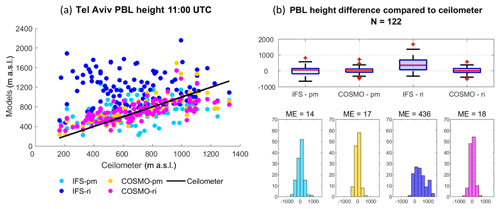
At the shoreline site of Tel Aviv (Fig. 3, Table 4), COSMO-pm displayed good agreement with the ceilometer measurements (ME =17, RMSE =183, R=0.74), similar to COSMO-ri (ME =18, RMSE =187, R=0.7). IFS-ri produced the highest overestimations (ME =436, RMSE =616, ).
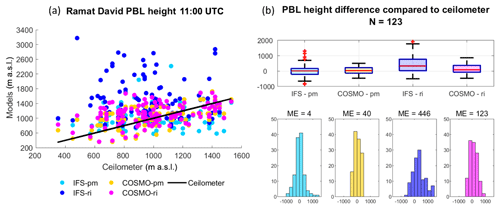
In Ramat David, stationed in the northern inner plain of Israel, the parcel method derived better results than the Richardson method in both models (Fig. 4, Table 5). Among the models, COSMO displayed better results (ME = 40, RMSE = 245, R=0.55). IFS-ri generated the poorest correlation (ME =446, RMSE =745, ).
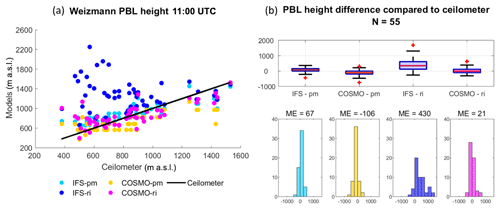
In Weizmann (Fig. 5, Table 6), 11 km southeast of Bet Dagan, IFS-ri produced poor results (ME = 430, RMSE =604, ), conversely to the good results by the parcel method (ME =67, RMSE =162, R=0.85). The COSMO model derived similar results using both methods (COSMO-pm: ME , RMSE =207, R=0.76, COSMO-ri: ME =21, RMSE =192, R=0.72).
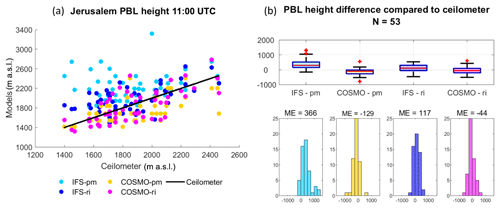
At the mountainous site of Jerusalem, the bulk Richardson method produced better results than the parcel method in both models (Fig. 6, Table 7). COSMO-pm derived good results (ME , RMSE =239, R=0.70), and IFS-ri the poorest (ME =366, RMSE =498, R=0.18).
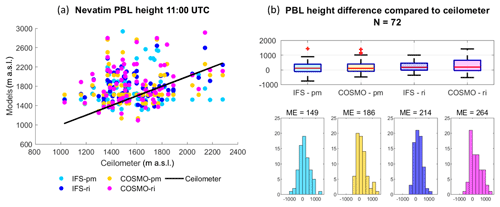
At the elevated and arid site of Nevatim (Fig. 7, Table 8), overall correlations were weak (0.1–0.3) with a high RMSE (369–488).
The main conclusions derived from Figs. 2–7 are summarized below:
-
Low correlation in Nevatim (0.1–0.3) demonstrates models' difficulty to assess the PBL height over complex terrain. Evaluation of PBL heights in complex terrain was studies by Ketterer et al. (2014) in the Swiss Alps using a ceilometer, wind profiler, and in situ continuous aerosol measurements. The ceilometers were analyzed with the gradient and STRAT-2D algorithms, and the wind profiler with the range-corrected SNR method. The results were compared to the COSMO-2 regional model. The results showed good agreement between the heights derived by the ceilometer and wind profiler during the daytime under cloud-free conditions (R2=0.81). However, in most cases, the model underestimated the PBL height. The researchers presumed the grid resolution, parametrization schemes, and surface type did not match the real topography. The comparison between a single measurement point and a grid point is not straightforward.
-
The parcel method achieved better results in Ramat David, Tel Aviv, Bet Dagan, and Weizmann. At the elevated site of Jerusalem, the correlation of COSMO-ri was the highest (R=0.7).
-
The COSMO model produced better results in the shoreline and plain regions (Ramat David, Tel Aviv, Bet Dagan) except for Weizmann (60 m a.s.l., 11.5 km from the coastline), where IFS-pm obtained the highest correlation (R=0.85).
-
The IFS model based on the bulk Richardson method overestimated the PBL heights (∼420 m) at the plain sites of Bet Dagan, Tel Aviv, Weizmann, and Ramat David. The bulk Richardson evaluation (see Sect. 4.1) includes horizontal wind speed profiles that are less accurate and may contribute to the discrepancies. Collaud et al. (2014) referred to the limitations of the bulk Richardson method of the COSMO-2 regional model (2.2 km resolution), which overestimated the convective boundary layer by 500–1000 m. They explained that the Richardson method is sensitive to the surface temperature, and errors and uncertainties in the model's temperature and relative humidity profiles could explain the significant bias. Also, the occurrence of clouds, which may be missing from the model, can lead to lower PBL heights.
5.2 COSMO PBL height correction
A correction formula for the models' PBL height employing ceilometers is given below:
where dHst is the PBL height difference between the ceilometer and the model, the altitude (hst), and distance from the shoreline (dst) for each measurement site (st). The formula runs simultaneously for all ceilometer sites to derive the dependent variables α and β, and the constant γ. The formula is suitable for both models
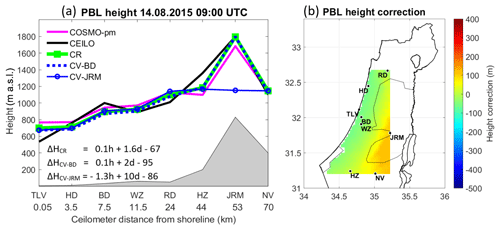
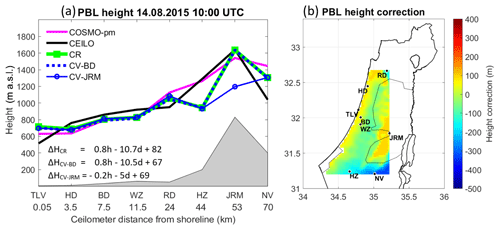
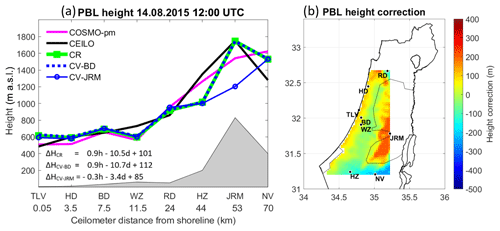
Figure 8PBL heights on 14 August 2015 at 09:00 UTC. The left panel (a) presents an east–west cross-section map, according to the ceilometers' distance from the Mediterranean shoreline. The results of the correction formula are presented; based on eight sites (ΔHCR), cross-validation for Bet Dagan (ΔHCV-BD), and cross-validation for Jerusalem (ΔHCV-JRM). The PBL heights were derived from COSMO-pm (pink line), the ceilometers (black line), the correction tool for COSMO-pm (CR, green line), cross-validation for Bet Dagan (CV-BD, dashed blue line), and cross-validation for Jerusalem (CV-JRM, unbroken blue line with circles). The right panel (b) shows a 2-D map of the height correction range, corresponding to panel (a).
A case study demonstrates the correction formula on 14 August 2015, from the COSMO model based on the parcel method (COSMO-pm) that derived good results in Sect. 5.1. The formula runs for each hour between 09:00 and 14:00 UTC for the daytime PBL height (see Sect. 5). Results are portrayed for each hour by a 2-D plot of the height correction within the area of ceilometers' deployment, along with an east–west cross-section plot, corresponding to the location of the ceilometers. Cross-validation tests for Bet Dagan and Jerusalem show the effectivity of the correction formula. The main findings for each hour are as follows:
-
09:00 UTC (Fig. 8): Along the coast, the correction tool lowers the PBL height by 70 to 670 m and increases by 90 m in the inner strip of Israel to ∼890 m a.s.l. Cross-validation for Bet Dagan (CV-BD) shows good results, whereas cross-validation for Jerusalem (CV-JRM) reduced the height by 600 m.
-
10:00 UTC (Fig. 9): The correction tool distinguishes between the coastal sites of Tel Aviv and Hadera, and the inland locations of Bet Dagan and Weizmann, only ∼10 km away from Tel Aviv. While the correction tool increased the height of the coastal stations, a slight height decrease was performed at the inner sites. In arid southern Hazerim, the correction tool lowered the PBL height by 400 m. In the desert south of Nevatim, the correction tool decreased the PBL height by 200 m. CV-JRM underestimates the PBL height in Jerusalem by 400 m.
-
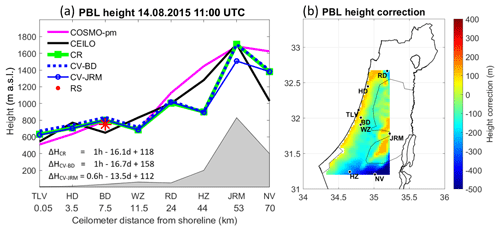
11:00 UTC (Fig. 10): A distinction between the shoreline and the inner sites is more evident, as the PBL height of Tel Aviv and Hadera is increased by ∼100 m to ∼700 m a.s.l., whereas Bet Dagan and Weizmann remained ∼800 m a.s.l. This finding corresponds to the analysis by Uzan et al. (2016) of the mean diurnal cycle of the PBL height from July to August 2014, based on ceilometer measurements. A pronounced correction is visible at the elevated southern site of Hazerim by 550 m down to 1120 m a.s.l. This gap is not surprising since NWP models have difficulty assessing the meteorological conditions over complex terrain. Here, CV-JRM underestimates the PBL height by a comparatively lower range of 200 m.
-
12:00 UTC (Fig. 11): The correction tool increased the PBL height at the coast and inland stations, but in fact the height is lower than an hour before. The PBL height in Hazerim is decreased by 300 m. CV-JRM underestimates the PBL height in Jerusalem by 600 m.
-
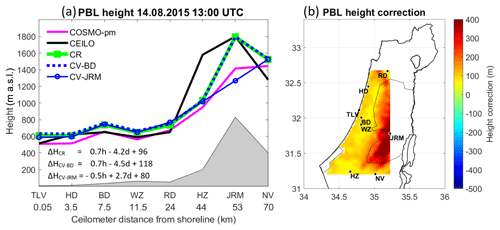
13:00 UTC (Fig. 12): The correction tool increased the PBL heights. A substantial increase of 380 m in Jerusalem generates a height of ∼1750 m a.s.l. CV-JRM underestimates the PBL height by 550 m.
-
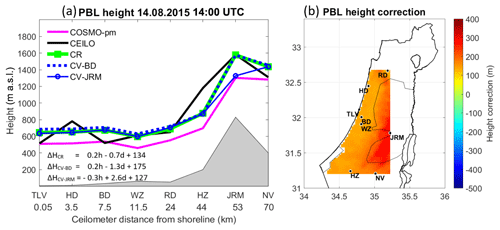
14:00 UTC (Fig. 13): Similar to an hour before, the correction increases the PBL height at all sites, but in fact the PBL heights are lower than an hour earlier, except for a mild increase at the coastal locations of Tel Aviv and Hadera. CV-JRM underestimates the PBL height by ∼300 m.
The primary purpose of this study was to improve the performance of air pollution dispersion models by providing applicable data of PBL heights from NWP models employing ceilometers. A correction tool using ceilometer measurements was established to validate the models' PBL height assessments. The study focused on the summer PBL heights (July–September 2015, June–August 2016) during daytime hours (09:00–14:00 UTC). During this period, the highest-air-pollution events occur in Israel from tall stacks (Dayan et al., 1988; Uzan and Alpert, 2012).
The study contained eight ceilometers; a radiosonde; two models: IFS and COSMO; and three PBL height analysis methods: the bulk Richardson method, the parcel method for the models and radiosonde, and the WCT method for the ceilometers. At the Bet Dagan radiosonde launching site, results revealed good agreement between the ceilometer's PBL heights and the radiosonde (N=91 d, ME =4 m, RMSE =143 m, R=0.83). In Ramat David, Tel Aviv, Weizmann, Jerusalem, and Nevatim, the models were compared to the ceilometers. The COSMO model performed better in the plain areas of Tel Aviv (10 m a.s.l.), Bet Dagan (33 m a.s.l.), and Ramat David (50 m a.s.l.) and in mountainous Jerusalem (830 m a.s.l.). The IFS model showed good agreement with the ceilometer in Weizmann (60 m a.s.l., N=55 d, ME =67 m, RMSE =162 m, R=0.85). At the arid southern site of Nevatim (400 m a.s.l.), overall correlations were poor. The IFS-pm produced better in Bet Dagan, Ramat David, Tel Aviv, and Weizmann (four out of five sites, except for Nevatim). The COSMO-pm produced better results in Bet Dagan and Ramat David, while in Tel Aviv the results generated by both methods were similar (N=123 d; COSMO-pm: ME =17 m, RMSE =183 m, R=0.74; COSMO-ri: ME =18 m, RMSE =180 m, R=0.80).
The PBL height correction tool for the NWP models is based on the altitude and the distance from the shoreline of the ceilometers' measurement sites. A case study demonstrated the tool's feasibility on 14 August 2015. Moving from 09:00 to 14:00 UTC, the correction decreased the PBL height in flat terrain (Tel Aviv, Hadera, Bet Dagan, and Ramat David). This finding corresponds with Uzan et al. (2016), analyzing the diurnal PBL height of Bet Dagan and Tel Aviv in the summer of 2014. Similar results produced in Hadera describe the summer PBL height between the period of 1997–1999 and the period of 2002–2005 based on measurements from a wind profiler (Uzan et al., 2012). Koch and Dayan (1992) revealed that air pollution episodes of sulfur dioxide increased at shallow PBL heights in the coastal plain of Israel. Uzan and Alpert (2012) showed that an average decrease of ∼100 m at the coastal PBL height resulted in an average increase of ∼200 air pollution episodes of sulfur dioxide.
The tool increased the PBL height at the elevated site of Jerusalem (830 m a.s.l.) by ∼380 m. In the arid south in Hazerim (200 m a.s.l.), the tool lowered the PBL height by ∼550 m. These significant height corrections at the elevated sites are attributed to the models' difficulty in imitating local meteorological processes in complex terrain (e.g., Alpert and Neumann, 1984). Dayan et al. (1988) presumed the diurnal cycle and the prevailing synoptic systems govern the temporal behavior of the Israeli summer PBL height, while the strength of the sea breeze determines significant variations at the inner heights.
Cross-validation for Bet Dagan produced excellent results. Bet Dagan is located in flat terrain 11 km north of the Weizmann site and 12 km southeast of the Tel Aviv site. On the other hand, without the single-measurement site in Jerusalem (830 m a.s.l.), the correction tool failed to generate Jerusalem's PBL height and produced lower values up to a 600 m difference. This finding shows the process of cross-validation can assist in defining the required ceilometers' deployment in the future.
In summary, our results offer a preview of the great potential of ceilometers as a correction tool for PBL heights derived from NWP models. This tool demonstrates the benefit of deploying ceilometers, specifically in complex terrain. Future research should include a larger dataset to create a systematic correction process and produce sufficient input data for mandatory air pollution dispersion assessments.
A route for the relevant summer climate reports is available in English (https://ims.gov.il/en/ClimateReports, Israel Meteorological Service, 2020a), and the route linking relevant relative humidity climate reports is only available in Hebrew (https://ims.gov.il/he/node/920, Israel Meteorological Service, 2020b).
Radiosonde profiles can be provided by the Israeli Meteorological Service on request.
Ceilometer profile data are owned by several institutions and can be provided on request.
LU carried out the research and prepared the manuscript under the careful guidance of PA and SE alongside a fruitful collaboration with YL, PK, and EV. The authors declare that they have no conflict of interest.
The authors declare that they have no conflict of interest.
We wish to thank the Israeli Meteorological Service, the Israeli Air Force, the Association of Towns for Environmental Protection (Sharon-Carmel), and Rafat Qubaj from the Department of Earth and Planetary Sciences at the Weizmann Institute of Science for their ceilometer data. We thank Noam Halfon from the IMS for the topography map.
This paper was edited by Timothy J. Dunkerton and reviewed by three anonymous referees.
Alpert, P. and Neumann, J.: On the enhanced smoothing over topography in some mesometeorological models, Bound. Lay.-Meteorol., 30, 293–312, 1984.
Alpert, P. and Rabinovich-Hadar, M.: Pre- and post-frontal lines – A meso gamma scale analysis over south Israel, J. Atmos. Sci., 60, 2994–3008, 2003.
Alpert, P. and Ziv, B.: The Sharav cyclone observations and some theoretical considerations, J. Geophys. Res., 94, 18495–18514, 1989.
Alpert, P., Abramsky, R., and Neeman, B. U.: The prevailing summer synoptic system in Israel-Subtropical high, not Persian Trough, Isr. J. Earth Sci., 39, 93–102, 1990.
Alpert, P., Herman, J., Kaufman, Y. J., and Carmona, I.: Response of the climatic temperature to dust forcing, inferred from TOMS Aerosol Index and the NASA assimilation model, J. Atmos. Res., 53, 3–14, 2000.
Alpert, P., Krichak, S. O., Tsidulko, M., Shafir, H., and Joseph, J. H.: A Dust Prediction System with TOMS Initialization, Mon. Weather Rev., 130, 2335–2345, 2002.
Alpert, P., Osetinsky, I., Ziv, B., and Shafir, H.: Semi-objective classification for daily synoptic systems: Application to the eastern Mediterranean climate change, Int. J. Climatol., 24, 1001–1011, 2004.
Anenberg, S., Miller, J., Henze, D., and Minjares, R.: A global snapshot of the air pollution-related health impacts of transportation sector emissions in 2010 and 2015, ICCT report, Washington, D.C., 2019.
Ansmann, A., Bösenberg, J., Chaikovsky, A., Comerón, A., Eckhardt, S., Eixmann, R., Freudenthaler, V., Ginoux P., Komguem, L., Linné, H., Márquez, M. A. L., Matthias, V., Mattis, I., Mitev, V., Müller, D., Music, S., Nickovic, S., Pelon, J., Sauvage, L., Sobolewsky, P., Srivastava, M. K., Stohl, A., Torres, O., Vaughan, G., Wandinger, U., and Wiegner, M.: Long-range transport of Saharan dust to northern Europe: The 11–16 October 2001 outbreak observed with EARLINET, J. Geophys. Res., 108, 4783, https://doi.org/10.1029/2003JD003757, 2003.
Ansmann, A., Petzold, A., Kandler, K., Tegen, I. N. A., Wendisch, M., Mueller, D., Weinzierl, B., Mueller, T., and Heintzenberg, J.: Saharan Mineral Dust Experiments SAMUM–1 and SAMUM–2: what have we learned?, Tellus B, 63, 403–429, 2011.
Baars, H., Ansmann, A., Engelmann, R., and Althausen, D.: Continuous monitoring of the boundary-layer top with lidar, Atmos. Chem. Phys., 8, 7281–7296, https://doi.org/10.5194/acp-8-7281-2008, 2008.
Baldauf, M., Seifert, A., Förstner, J., Majewski, D., Raschendorfer, M., and Reinhardt, T.: Operational Convective-Scale Numerical Weather Prediction with the COSMO Model: Description and Sensitivities, Mon. Weather Rev., 139, 3887–3905, https://doi.org/10.1175/MWR-D-10-05013.1, 2011.
Bechtold, P.: Convection parametrization, ECMWF Seminar proceedings on “The parametrization of subgrid physical processes”, 1–4 September 2008, 63–85, available at: https://www.ecmwf.int/sites/default/files/elibrary/2009/8008-convection-parametrization.pdf (last access: 21 July 2020), 2008.
Brooks, I.: Finding Boundary Layer Top: Application of a wavelet covariance transform to lidar backscatter profiles, J. Atmos. Ocean. Tech., 20, 1092–1105, 2003.
Cerenzia I.: Challenges and critical aspects in stable boundary layer representation in numerical weather prediction modeling: diagnostic analyses and proposals for improvement, PhD thesis, University of Bologna, Bolonga, Italy, 2017.
Collaud Coen, M., Praz, C., Haefele, A., Ruffieux, D., Kaufmann, P., and Calpini, B.: Determination and climatology of the planetary boundary layer height above the Swiss plateau by in situ and remote sensing measurements as well as by the COSMO-2 model, Atmos. Chem. Phys., 14, 13205–13221, https://doi.org/10.5194/acp-14-13205-2014, 2014.
Dayan, U. and Rodnizki, J.: The temporal behavior of the atmospheric boundary layer in Israel, J. Appl. Meteorol., 38, 830–836, 1999.
Dayan, U., Shenhav, R., and Graber, M.: The Spatial and temporal behavior of the mixed layer in Israel, J. Appl. Meteorol., 27, 1382–1394, 1988.
Dayan, U., Lifshitz-Goldreich B., and Pick, K.: Spatial and structural variation of the atmospheric boundary layer during summer in Israel-Pro?ler and rawinsonde measurements, J. Appl. Meteorol., 41, 447–457, 2002.
Dockery, D. W., Pope III, C. A., Xu, X., Spengler, J. D., Ware, J. H., Fay, M. E., Ferris, Jr., B. G., and Speizer, F. E.: An association between air pollution and mortality in six U.S. cities, New Engl. J. Med., 329, 1753–1759, 1993.
Doms, G., Förstner, J., Heise, E., Herzog, H.-J., Mironov, D., Raschendorfer, M., Reinhardt, T., Ritter, B., Schrodin, R., Schulz, J.-P., and Vogel, G.: A description of the nonhydrostatic regional COSMO model. Part II: Physical parameterization, Deutscher Wetterdienst, Ofenbach, 154 pp., 2011.
Eresmaa, N., Karppinen, A., Joffre, S. M., Räsänen, J., and Talvitie, H.: Mixing height determination by ceilometer, Atmos. Chem. Phys., 6, 1485–1493, https://doi.org/10.5194/acp-6-1485-2006, 2006.
Feliks, Y.: A numerical model for estimation of the diurnal fluctuation of the inversion height due to a sea breeze, Bound. Layer-Meteorol., 62, 151–161. 1993.
Feliks, Y: An analytical model of the diurnal oscillation of the inversion base due to sea breeze, J. Atmos. Sci., 51, 991–998, 1994.
Feliks, Y.: Nonlinear dynamics and chaos in the sea and land breeze, J. Atmos. Sci., 61, 2169–2187, 2004.
Garratt, J. R.: The Atmospheric Boundary Layer, Cambridge Univ. Press, Cambridge, UK, 335 pp., 1992.
Gierens, R. T., Henriksson, S., Josipovic, M., Vakkari, V., Van Zyl, P. G., Beukes J. P., Wood, C. R., and O'Connor, E. J.: Observing continental boundary layer structure and evolution over the South African savannah using a ceilometer, Theor. Appl. Climatol., 136, 333–346, https://doi.org/10.1007/s00704-018-2484-7, 2018.
Goldreich, Y.: The climate of Israel-Observations, research and applications, Springer Science and business media, New York, USA, chap. 5, 2003.
Haeffelin, M. and Angelini, F.: Evaluation of mixing height retrievals from automatic profiling lidars and ceilometers in view of future integrated networks in Europe, Bound. Lay.-Meteorol., 143, 49–75, 2012.
Hanna, S. R.: The thickness of the planetary boundary layer, Atmos. Environ., 3, 519–536, 1969.
Hashmonay, R., Cohen, A., and Dayan, U.: Lidar observations of the atmospheric boundary layer in Jerusalem, J. Appl. Meteorol, 30, 1228–1236, 1991.
Héroux, E., Brunekreef, B., Anderson, H. R., Atkinson, R., Cohen, A., Forastiere, F., Hurley, F., Katsouyanni, K., Krewski, D., Krzyzanowski, M., Künzli, N., Mills, I., Querol, X., Ostro, B., and Walton, H.: Quantifying the health impacts of ambient air pollutants: Recommendations of a WHO/Europe project, Int. J. Public Health, 60, 619–627, 2015.
Holzworth, C. G.: Estimates of mean maximum mixing depths in the contiguous United States, Mon. Weather Rev., 92, 235–242, 1964.
Israel Meteorological Service: Climate Reports, available at: https://ims.gov.il/en/ClimateReports, last access: 25 July 2020a.
Israel Meteorological Service: Climate Analysis, available at: https://ims.gov.il/he/node/920, last access: 25 July 2020b (in Hebrew).
Ketterer, C., Zieger, P., and Bukowiecki, N.: Investigation of the planetary boundary layer in the Swiss Alps using remote sensing and in situ measurements, Bound. Lay.-Meteol., 151, 317–334, https://doi.org/10.1007/s10546-013-9897-8, 2014.
Koch, J. and Dayan, U.: A synoptic analysis of the meteorological conditions affecting dispersion of pollutants emitted from tall stacks in the coastal plain of Israel, Atmos. Environ., 26, 2537–2543, 1992.
Koehler, M., Ahlgrimm, M., and Beljaars, A.: Unified treatment of dry convective and stratocumulus-topped boundary layers in the ECMWF model, Q. J. Roy. Meteorol. Soc., 137, 43–57, 2011.
Kotthaus, S. and Grimmond, C. S. B.: Atmospheric boundary-layer characteristics from ceilometer measurements. Part 1: a new method to track mixed layer height and classify clouds, Q. J. Roy. Meteorol. Soc., 144, 1525–1538, https://doi.org/10.1002/qj.3299, 2018.
Levi, Y., Shilo, E., and Setter, I.: Climatology of a summer coastal boundary layer with 1290-MHz wind profiler radar and a WRF simulation, J. Appl. Meteorol. Clim., 50, 1815–1826, https://doi.org/10.1175/2011JAMC2598.1, 2011.
Lieman, R. and Alpert, P.: Investigation of the planetary boundary layer height variations over complex terrain, Bound. Lay.-Meteorol., 62, 129–142, 1993.
Ludwing, F. L.: A review of coastal zone meteorological processes important to the modeling of air pollution, Air pollution modeling and its application IV, edited by: De Wispelaere, C., NATO, Challenges of modern society, 7, 1983.
Luo, T., Yuan, R., and Wang, Z.: On factors controlling marine boundary layer aerosol optical depth, J. Geophys. Res.-Atmos., 119, 3321–3334, https://doi.org/10.1002/2013JD020936, 2014.
Lyons, W. A.: Turbulent diffusion and pollutant transport in shoreline environments. Lectures on air pollution and environmental impact analysis, edited by: Haugen, D. A., American Meteorological Society, 136–208, 1975.
Mamouri, R.-E., Ansmann, A., Nisantzi, A., Solomos, S., Kallos, G., and Hadjimitsis, D. G.: Extreme dust storm over the eastern Mediterranean in September 2015: satellite, lidar, and surface observations in the Cyprus region, Atmos. Chem. Phys., 16, 13711–13724, https://doi.org/10.5194/acp-16-13711-2016, 2016.
Manninen A. J., Marke T., Tuononen M. J., and O'Connor E. J.: Atmospheric boundary layer classification with Doppler lidar, J. Geophys. Res.-Atmos., 123, 8172–8189, https://doi.org/10.1029/2017JD028169, 2018.
Mellor, M. J. and Yamada, T.: Development of a turbulence closure model for geophysical fluid problems, Rev. Geophys. Space Ge., 20, 851–875, https://doi.org/10.1029/RG020i004p00851, 1982.
Neumann, J.: Diurnal variations of the subsidence inversion and associated radio wave propagation phenomena over the coastal area of Israel. Israeli Meteorological Service, Bet Dagan, Israel, Series A, Meteorological Notes No. 6, 16 pp., 1952.
Neumann, J.: On the rotation rate of the direction of sea and land breezes, J. Atmos. Sci., 34, 1913–1917, 1977.
Ogawa, Y., Ohara, T., Wakamatsu, S., Diosey, P. G., and Uno, I.: Observations of lake breeze penetration and subsequent development of the thermal internal boundary layer for the Nontecore II shoreline diffusion experiment, Bound. Lay.-Meteorol., 35, 207–230, 1986.
Papayannis, A., Amiridis, V., Mona, L., Tsaknakis, G., Balis, D., Bösenberg, J., Chaikovski, A., De Tomasi, F., Grigorov, I., Mattis, I., and Mitev, V.: Systematic lidar observations of Saharan dust over Europe in the frame of EARLINET (2000–2002), J. Geophys. Res.-Atmos., 113, D10204, https://doi.org/10.1029/2007JD009028, 2008.
Saaroni, H. and Ziv B.: Summer Rainfall in a Mediterranean Climate – The Case of Israel: Climatological – Dynamical Analysis, Int. J. Climatol., 20, 191–209, 2000.
Scarino, A. J., Obland, M. D., Fast, J. D., Burton, S. P., Ferrare, R. A., Hostetler, C. A., Berg, L. K., Lefer, B., Haman, C., Hair, J. W., Rogers, R. R., Butler, C., Cook, A. L., and Harper, D. B.: Comparison of mixed layer heights from airborne high spectral resolution lidar, ground-based measurements, and the WRF-Chem model during CalNex and CARES, Atmos. Chem. Phys., 14, 5547–5560, https://doi.org/10.5194/acp-14-5547-2014, 2014.
Seidel, D. J., Zhang, Y., Beljaars, A., Golaz, J.-C., and Medeiros, B.: Climatology of the planetary boundary layer over continental United States and Europe, J. Geophys. Res., 117, D17106, https://doi.org/10.1029/2012JD018143, 2012.
Seidel, D. J., Ao, C. O., and Li, K.: Estimating climatological planetary boundary layer heights from radiosonde observations: Comparison of methods and uncertainty analysis, J. Geophys. Res., 115, D16113, https://doi.org/10.1029/2009JD013680, 2010.
Sharf, G., Peleg, M., Livnat, M., and Luria, M.: Plume rise measurements from large point sources in Israel, Atmos. Environ., 27, 1657–1663, 1993.
Steppeler, J., Doms, G., Schattler, U., Bitzer, H. W., Gassmann, A., Damrath, U., and Gregoric, G.: Meso gamma scale forecasts by nonhydrostatic model LM, Meteorological Atmospheric Physics, 82, 75–96, 2003.
Stull, R. B.: An introduction to boundary layer meteorology, Kluwer Academic Publishers, the Netherlands, 666 pp., 1988.
Su, T., Li, Z., and Kahn, R.: Relationships between the planetary boundary layer height and surface pollutants derived from lidar observations over China: regional pattern and influencing factors, Atmos. Chem. Phys., 18, 15921–15935, https://doi.org/10.5194/acp-18-15921-2018, 2018.
Tiedtke, M.: A Comprehensive Mass Flux Scheme for Cumulus Parameterization in Large-Scale Models, Mon. Weather Rev., 117, 1779–1800, 1989.
Urbanski, S., Kovalev, V. A., Hao, W. M., Wold, C., and Petkov, A.: Lidar and airborne investigation of smoke plume characteristics: Kootenai Creek Fire case study, Proceedings of 25th International Laser Radar Conference, St. Petersburg, Russia, Tomsk. Publishing House of IAO SB RAS, 1051–1054, 2010.
Uzan, L. and Alpert, P.: The coastal boundary layer and air pollution – a high temporal resolution analysis in the East Mediterranean Coast, The Open Atmospheric Science Journal, 6, 9–18, 2012.
Uzan, L., Egert, S., and Alpert, P.: Ceilometer evaluation of the eastern Mediterranean summer boundary layer height – first study of two Israeli sites, Atmos. Meas. Tech., 9, 4387–4398, https://doi.org/10.5194/amt-9-4387-2016, 2016.
Uzan, L., Egert, S., and Alpert, P.: New insights into the vertical structure of the September 2015 dust storm employing eight ceilometers and auxiliary measurements over Israel, Atmos. Chem. Phys., 18, 3203–3221, https://doi.org/10.5194/acp-18-3203-2018, 2018.
Van der Kamp, D. and McKendry, I.: Diurnal and seasonal trends in convective mixed-layer heights estimated from two years of continuous ceilometer observations in Vancouver, BC, Bound. Lay.-Meteorol., 137, 459–475, 2010.
Vogelezang, D. H. P. and Holtslag, A. A. M.: Evaluation and model impacts of alternative boundary-layer height formulations, Bound.-Lay. Meteorol., 81, 245–269, 1996.
Wang, Z., Cao, X., Zhang, L., Notholt, J., Zhou, B., Liu, R., and Zhang, B.: Lidar measurement of planetary boundary layer height and comparison with microwave profiling radiometer observation, Atmos. Meas. Tech., 5, 1965–1972, https://doi.org/10.5194/amt-5-1965-2012, 2012.
Wetzel, P. J.: Toward parametrization of the stable boundary layer, J. Appl. Meteorol., 21, 7–13, 1982.
World Health Organization: Ambient air pollution – a global assessment of exposure and burden of disease, 1–122, available at: https://www.who.int/phe/publications/air-pollution-global-assessment/en/ (last access: 30 July 2020), 2016.
Wiegner, M. and Gasteiger, J.: Correction of water vapor absorption for aerosol remote sensing with ceilometers, Atmos. Meas. Tech., 8, 3971–3984, https://doi.org/10.5194/amt-8-3971-2015, 2015.
Wiegner, M., Madonna, F., Binietoglou, I., Forkel, R., Gasteiger, J., Geiß, A., Pappalardo, G., Schäfer, K., and Thomas, W.: What is the benefit of ceilometers for aerosol remote sensing? An answer from EARLINET, Atmos. Meas. Tech., 7, 1979–1997, https://doi.org/10.5194/amt-7-1979-2014, 2014.
Yuval, Levi, I., Dayan, U., Levy, I., and Broday, D. M.: On the association between characteristics of the atmospheric boundary layer and air pollution concentrations, Atmos. Res., 231, 104675, https://doi.org/10.1016/j.atmosres.2019.104675, 2020.
Zhang, Y., Gao, Z., Li, D., Li, Y., Zhang, N., Zhao, X., and Chen, J.: On the computation of planetary boundary-layer height using the bulk Richardson number method, Geosci. Model Dev., 7, 2599–2611, https://doi.org/10.5194/gmd-7-2599-2014, 2014.
Ziv, B., Saaroni, H., and Alpert, P.: The factors governing the summer regime of the eastern Mediterranean, Int. J. Climatol., 24, 1859–1871, 2004.


