the Creative Commons Attribution 4.0 License.
the Creative Commons Attribution 4.0 License.
 | 19 Oct 2020
Sources and sinks driving sulfuric acid concentrations in contrasting environments: implications on proxy calculations
Ilona Ylivinkka
Rima Baalbaki
Chang Li
Yishuo Guo
Nina Sarnela
Tuija Jokinen
Kaspar R. Daellenbach
Rujing Yin
Chenjuan Deng
Tuomo Nieminen
Yonghong Wang
Zhuohui Lin
Roseline C. Thakur
Jenni Kontkanen
Dominik Stolzenburg
Mikko Sipilä
Tareq Hussein
Pauli Paasonen
Federico Bianchi
Imre Salma
Tamás Weidinger
Michael Pikridas
Jean Sciare
Jingkun Jiang
Yongchun Liu
Tuukka Petäjä
Veli-Matti Kerminen
Markku Kulmala
Sulfuric acid has been shown to be a key driver for new particle formation and subsequent growth in various environments, mainly due to its low volatility. However, direct measurements of gas-phase sulfuric acid are oftentimes not available, and the current sulfuric acid proxies cannot predict, for example, its nighttime concentrations or result in significant discrepancies with measured values. Here, we define the sources and sinks of sulfuric acid in different environments and derive a new physical proxy for sulfuric acid to be utilized in locations and during periods when it is not measured. We used H2SO4 measurements from four different locations: Hyytiälä, Finland; Agia Marina, Cyprus; Budapest, Hungary; and Beijing, China, representing semi-pristine boreal forest, rural environment in the Mediterranean area, urban environment and heavily polluted megacity, respectively. The new proxy takes into account the formation of sulfuric acid from SO2 via OH oxidation and other oxidation pathways, specifically via stabilized Criegee intermediates. The sulfuric acid sinks included in the proxy are its condensation sink (CS) and atmospheric clustering starting from H2SO4 dimer formation. Indeed, we found that the observed sulfuric acid concentration can be explained by the proposed sources and sinks with similar coefficients in the four contrasting environments where we have tested it. Thus, the new proxy is a more flexible and an important improvement over previous proxies. Following the recommendations in this paper, a proxy for a specific location can be derived.
- Article
(1404 KB) - Full-text XML
-
Supplement
(2676 KB) - BibTeX
- EndNote


Atmospheric new particle formation (NPF) events and their subsequent growth have been observed as taking place almost everywhere in the world (Kulmala et al., 2004; Kerminen et al., 2018). Many of these observations are based on continuous measurements, and some include more than a year of measurement data (Nieminen et al., 2018). The importance of NPF events on the global aerosol budget and cloud condensation nuclei formation has been well established (Spracklen et al., 2008, 2010; Merikanto et al., 2009; Kerminen et al., 2012; Gordon et al., 2017). Recently, the contribution of NPF to haze formation, which was still controversial, is being investigated in an increasing number of studies from Chinese megacities (Guo et al., 2014; Kulmala et al., 2020).
Sulfuric acid (H2SO4), which has a very low saturation vapor pressure and strong hydrogen bonding capability (Zhang et al., 2011), has been found to be the major precursor of atmospheric NPF (Weber et al., 1996; Kulmala et al., 2004; Sihto et al., 2006; Sipilä et al., 2010; Erupe et al., 2011; Lehtipalo et al., 2018; Ma et al., 2019) and is often used in global models for simulating the occurrence and intensity of new particle formation events (Dunne et al., 2016). However, atmospheric measurements of gas-phase sulfuric acid are rare, mainly due to its low concentration (106–107 molecules cm−3 or below) that can only be measured using state-of-the-art instruments (Mikkonen et al., 2011), such as the chemical ionization atmospheric-pressure interface time-of-flight spectrometer (CI-APi-ToF) (Eisele and Tanner, 1993; Jokinen et al., 2012). Therefore, a physically and chemically sound proxy is needed to estimate H2SO4 concentrations in various environments where NPF events are observed, but H2SO4 concentrations are not continuously measured.
Due to its important participation in clustering and thus in the NPF process, several studies have tried to produce proxies for H2SO4 in order to fill gaps in data. For example, Petäjä et al. (2009) developed an approximation of gas-phase H2SO4 concentration in Hyytiälä, southern Finland, using its source from reactions between SO2 and OH radicals and its loss by condensation onto preexisting particles (condensation sink, CS). Later, Mikkonen et al. (2011) developed H2SO4 proxies based on measurements at six urban, rural and forest areas in European and North American sites. Proxies developed by Mikkonen et al. (2011) suggested that the sulfuric acid concentration depends mostly on the available radiation and SO2 concentration, with little influence by CS. However, Lu et al. (2019), who developed a daytime proxy based on measurements in Beijing, China, suggested the need for taking the CS into account when approximating gaseous H2SO4, especially in areas where the condensational sink can be relatively high. The proxy developed by Lu et al. (2019) takes into consideration the formation pathways of H2SO4 via OH radicals from both the conventional photolysis of O3 and from the photolysis of HONO, as well as the loss of H2SO4 via CS. Besides the previously developed proxies, an additional proxy is still needed for representing nighttime periods that were not considered previously.
Here, we derive a new proxy that takes into account the production of gaseous sulfuric acid from SO2 with oxidation by OH and stabilized Criegee intermediates (Mauldin et al., 2012) reactions, and its losses onto preexisting aerosol particles (condensation sink) and due to molecular cluster formation. In order to evaluate our hypothesized sources and sinks and derive the proxy equations, we utilize measurements from four different locations: (1) Hyytiälä, Finland; (2) Agia Marina, Cyprus; (3) Budapest, Hungary; and (4) Beijing, China, representing a semi-pristine boreal forest environment, rural environment in the Mediterranean area, urban environment, and heavily polluted megacity, respectively. To evaluate the predictive power of the derived proxies, the equations are further tested on independent data sets. We compare the coefficients of production and losses in each environment in order to understand the prevailing mechanism of the H2SO4 budget in each of the studied environments. As a result of this investigation, a well-defined sulfuric acid concentration can be derived for multiple areas around the world and even extended during times when it was not measured (gap filling, forecast, prediction, estimation, etc.).
2.1 Locations
2.1.1 Semi-pristine boreal forest environment: Hyytiälä, Finland
Measurements were conducted at the SMEAR II-station (Station for Measuring Ecosystem–Atmosphere Relations), located in Hyytiälä (61.1∘ N, 24.17∘ E; 181 ; Hari and Kulmala, 2005), southern Finland. Here we used measurements from 18 August 2016 to 5 June 2017 and from 8 March 2018 to 28 February 2019. The data from 2016, 2018 and 2019 were used as a training data set for developing the proxy equation, while the data from 2017 were used for testing the predictive power of the developed proxy. A summary for all locations and the instrumentation used is given in Tables S1 (training data sets) and S2 (testing data sets) in the Supplement.
2.1.2 Rural background site: Agia Marina, Cyprus
Measurements were conducted at the Cyprus Atmospheric Observatory (CAO) (35.03∘ N, 33.05∘ E; 532 ), a rural background site located close to Agia Marina Xyliatou village, between 22 February and 3 March 2018. For more details, see, e.g., Pikridas et al. (2018). The data set from this location is used solely as a training data set.
2.1.3 Semi-urban site: Helsinki, Finland
Measurements were conducted at the SMEAR III-station, located in Helsinki (60.20∘ N, 24.96∘ E; 25 ). For more details about the location see, e.g., Hussein et al. (2008). Here, we measured from 1 to 16 July 2019 as a testing data set.
2.1.4 Urban location: Budapest, Hungary
The measurements took place at the Budapest platform for Aerosol Research Training (BpART) Research Laboratory (47.47∘ N, 19.06∘ E; 115 ) of the Eötvös University situated on the bank of the Danube between 21 March and 17 April 2018. The site represents a well-mixed average atmosphere of the city center (Salma et al., 2016a). The data set from this location is used solely as a training data set.
2.1.5 Polluted megacity: Beijing, China
Here, observations performed at the west campus of Beijing University of Chemical Technology (39.94∘ N, 116.30∘ E) between 15 March and 15 June 2019 were used as a training data set, while observations from 8 September to 15 October 2019 were used as a testing data set. The sampling took place from outside the window on the fifth floor of a university building adjacent to a busy street. For more details, see, e.g., Lu et al. (2019) and Zhou et al. (2020).
2.1.6 Near an oil refinery in an industrial area: Kilpilahti, Finland
The measurement took place at Nyby measurement station (60.31∘ N, 25.50∘ E) between 7 and 29 June 2012. The site is within 1.5 km of the Neste Oyj oil refinery and Kilpilahti industrial area. For more information on the site, please see Sarnela et al. (2015). The data set from this location is used solely as a testing data set.
2.2 Instrumentation
2.2.1 Trace gases
A summary for all locations and instrumentation is given in Tables S1 and S2. Measurements of different variables within the same location are performed at the same platform unless specified otherwise. In all locations, the sulfuric acid concentrations were measured using a Chemical ionization atmospheric pressure interface time-of-flight spectrometer (CI-APi-ToF) (Eisele and Tanner, 1993; Jokinen et al., 2012) with as a reagent ion and analyzed using a tofTools package based on MATLAB software (Junninen et al., 2010). In all locations, the CI-APi-ToF instruments were calibrated in a similar way prior to the campaign using the method presented by Kurten et al. (2012) to ensure the results from different sites are comparable. In Hyytiälä, the sulfuric acid concentrations were measured at the tower 35 In Helsinki, the sulfuric acid concentrations were measured from the fourth-floor window (∼ 12 ) of the university building adjacent (∼ 200 m) to the SMEAR III station.
In Hyytiälä and Beijing, the SO2 and O3 concentrations were measured using an SO2 analyzer (Model 43i, Thermo, USA) with a detection limit of 0.1 ppbv and a O3 analyzer (Model 49i, Thermo, USA), respectively. In Hyytiälä, the trace gas concentrations were measured at the tower 16.8 In Agia Marina, SO2 is monitored using Ecotech Instrument (9850). In Helsinki, the SO2 concentrations were monitored at a 32 m tower at the SMEAR III station using UV fluorescence (Horiba APSA 360). Concentrations of SO2 in Budapest were measured by UV fluorescence (Ysselbach 43C) with a time resolution of 1 h at a station of the National Air Quality Network located 1.7 km in the upwind-prevailing direction from the BpART site. It was shown earlier that the hourly average SO2 concentrations (see Fig. S1 in the Supplement) in central Budapest are ordinarily distributed without large spatial gradients (Salma and Németh, 2019; Mikkonen et al., 2020). In Kilpilahti, SO2 concentrations were measured using a Thermo Scientific™ Model 43i SO2 Analyzer at Neste Oil refinery. Trace gases measured during the short campaign periods in Agia Marina and Budapest are representative of yearly concentrations in respective locations when compared to longer-term measurements at the same site (Salma et al., 2016b; Baalbaki, 2020; Mikkonen et al., 2020).
2.2.2 Particle number size distribution
The condensation sink (CS) was calculated using the method proposed by Kulmala et al. (2012) from number size distribution measurements. In Hyytiälä, the particle number size distribution was measured using a twin differential mobility particle sizer (DMPS) (Aalto et al., 2001). In Agia Marina, the particle number size distribution between 2 and 800 nm was reconstructed from two instruments: an Airel NAIS (Neutral cluster and Air Ion Spectrometer, 2–20 nm) and TSI SMPS (Scanning Mobility Particle Sizer, 20–800 nm). In Helsinki, a twin-DMPS system (diameter 3–950 nm) was used to monitor the particle number size distribution. In Budapest, the particle number size distribution was measured by a flow-switching type DMPS in a diameter range from 6 to 1000 nm in the dry state of particles (RH < 30 %) in 30 channels with a time resolution of 8 min (Salma et al., 2016a). In Beijing, the particle number size distribution between 3 and 850 nm was measured using a Particle Size Distribution System (PSD, Liu et al., 2016). Condensation sink obtained at Kilpilahti was acquired from particle number size distribution measured using a DMPS (6–1000 nm). Despite having a diurnal cycle, condensation sink values obtained during the short campaign periods in Agia Marina and Budapest are representative of yearly concentrations in those respective locations when compared to longer-term measurements at the same site (Salma et al., 2016b; Baalbaki, 2020).
2.2.3 Radiation
In Hyytiälä, Global radiation (GlobRad) was measured using a SK08 solar pyranometer until 24 August 2017 and after that using a EQ08-S solar pyranometer. The measurements were relocated from 18 m height to 37 m height on 14 February 2017. Global Radiation from the Agia Marina is monitored using a weather station (Campbell Scientific Europe). In Helsinki, the global radiation is measured using Kipp and Zonen CNR1 at 31 in the SMEAR III station. In Budapest, global radiation was measured by an SMP3 pyranometer (Kipp and Zonen, the Netherlands) on the roof of the building complex with a time resolution of 1 min. Its operation was checked by comparing the measured data with those obtained from regular radiation measurements performed by a CMP11 pyranometer (Kipp and Zonen, the Netherlands) at the Hungarian Meteorological Service (HMS) at a distance of 10 km. The annual mean GlobRad ratio and SD of the 1 h values for the BpART and HMS stations were 1.03 ± 0.23 for GlobRad > 100 W m−2, which changed to 1.01 ± 0.05 when considering clear sky conditions. In Beijing, GlobRad intensity from 285 to 2800 nm was measured at the rooftop of the five-floor building using a CMP11 pyranometer (Kipp and Zonen, Delft, the Netherlands). The radiometer was maintained weekly to ensure the orientation was horizontal and clean. In order to do the fitting for the nighttime data, zero values were replaced by the detection limit of the instrument, assumed to be half the minimum measured radiation. In Kilpilahti, no global radiation measurements were available, so we relied on radiation data measured at the SMEAR III station, which is around 32 km from the measurement site.
2.2.4 Alkenes
Volatile organic compounds (VOCs) were measured with a proton transfer reaction quadrupole mass spectrometer (PTR-MS, Ionicon Analytik GmbH) in Hyytiälä. Ambient mixing ratios are measured every third hour from several different measurement heights. In this study, we use monoterpene concentration from 16.8 m height. The instrument is calibrated regularly with standard gas (Apel-Riemer Environmental, Inc.) (Taipale et al., 2008). The same instrumentation was used to measure monoterpene concentrations in Kilpilahti every 1 h.
In Beijing, VOCs were measured using single-photon ionization time-of-flight mass spectrometer (SPI-MS 3000R, Hexin Mass Spectrometry) with unit mass resolution (UMR) (Gao et al., 2013). The alkenes included here are butylene, butadiene, isoprene, pentene and hexene. As the instrument cannot distinguish conformers, the pentene and hexene could also be cyclopentene and cyclohexene. Correlation coefficients between the different variables used in our study (training data sets) in all four locations are shown in Figs. S2–S6 in the Supplement.
2.2.5 Meteorological parameters
Temperature (T) and relative humidity (RH) in Hyytiälä were measured at 16.8 m using four-wire PT-100 sensors and relative humidity sensors (Rotronic Hygromet MP102H with Hygroclip HC2-S3, Rotronic AG, Bassersdorf, Switzerland), respectively. In Agia Marina, T and RH were measured using a weather station (Campbell Scientific Europe). T and RH were measured at the Physicum rooftop 26 and 220 m northeast from SMEAR III using a Pentronics PT100 sensor and Vaisala HMP243 transmitter, respectively. In Budapest, T and RH were measured using temperature probe and a Vaisala HMP45D humidity transmitter at the Hungarian Meteorological Service (HMS) within a 10 km radius from the BpArt station. In Beijing, meteorological parameters are monitored by a Vaisala weather station data acquisition system (AWS310).
We applied the following equation to describe the time-evolution of gas-phase sulfuric acid concentration:
Here, k0 represents the coefficient of H2SO4 production term due to the well-known SO2–OH reaction (Petäjä et al., 2009) and k2 is the coefficient of H2SO4 production via stabilized Criegee intermediates (sCI) produced by the ozonolysis of alkenes (Mauldin et al., 2012). We use available monoterpene concentration (MT) here as a proxy for alkenes in Hyytiälä as they are the dominating species in the boreal forest environment (Hakola et al., 2012; Hellén et al., 2018; Rinne et al., 2005). For Beijing, we use urban-dominating aromatic alkenes. As no VOC measurements are performed in either Agia Marina or Budapest, we evaluate the proxy without the stabilized Criegee intermediates source term. It is important to note here that the coefficient for sCI is a “bulk” term and that it varies from place to place due to the differences in sCI structures and different production efficiency from different alkene species (Novelli et al., 2017; Sipilä et al., 2014). The third term in Eq. (1) represents the loss of H2SO4 onto preexisting aerosol particles, known as condensation sink (CS) and is calculated by multiplying the CS calculated for sulfuric acid with the concentration of sulfuric acid monomer. The fourth term in Eq. (1) is defined as the square of sulfuric acid concentration multiplied by clustering coefficient k3. The square of sulfuric acid represents the collision of two sulfuric acid monomers forming a sulfuric acid dimer, which was found to be the first step of atmospheric cluster formation (Yao et al., 2018). Therefore, this term takes into account the additional loss of H2SO4 due to cluster formation not included in the term containing CS. This is necessary because CS is only inferred from size distribution measurements at maximum down to 1.5 nm, i.e., not containing any cluster concentrations and hence losses onto these clusters. This term is written in the form of sulfuric acid dimer production, which seems to be the first step of cluster formation once stabilized by bases (Kulmala et al., 2013; Almeida et al., 2013; Yao et al., 2018).
Since measuring the OH concentration is challenging, we first replaced it with the UVB radiation intensity, which has been shown to be a good proxy for the OH concentration (Berresheim et al., 2002; Lu et al., 2019; Rohrer and Berresheim, 2006). Unfortunately, UVB was not measured in all the field studies considered here. Alternatively, GlobRad, a commonly measured quantity, tends to correlate well with UVB and can generally replace it, as used previously by Petäjä et al. (2009). We confirmed the strong correlation between UVB radiation and global radiation in two locations, Hyytiälä and Beijing (Fig. S7–S8 in the Supplement). Accordingly, the coefficient k1 here replaces the coefficient of H2SO4 production k0 terms (Eq. 2). We proceed here using only GlobRad in the proxy to be consistent with the two other locations where UVB was not measured (Agia Marina and Budapest).
By assuming a steady state between H2SO4 production and loss, the H2SO4 concentration can be solved directly from Eq. (2).
In order to evaluate the importance of each of the source terms in determining the change in sulfuric acid concentration, we refitted the data after excluding the stabilized Criegee intermediates source pathway, as shown in Eq. (4).
In order to evaluate the importance of each of the sink terms in determining the sulfuric acid concentration, we refitted the data after excluding the loss of sulfuric acid via the cluster formation pathway using Eq. (5).
We also refitted the data using the simple proxy proposed by Petäjä et al. (2009), by excluding the formation of sulfuric acid via stabilized Criegee intermediates source pathway and loss of sulfuric acid via the cluster formation pathway using Eq. (6).
We then evaluated our new proposed proxy by comparing it to the original Petäjä et al. (2009) proxy using Eq. (7) and to Mikkonen et al. (2011) using Eq. (8) below (which corresponds to Eq. 11 in Mikkonen et al., 2011). The calculation of the scaled reaction constant k used in Eq. (8) is given in Sect. 1 in the Supplement.
The equations derived for each of the sites can be found in Table 1. The fitting coefficients were obtained by minimizing the sum of the squared logarithm of the ratio between the proxy values and measured sulfuric acid concentration using the method described by Lagarias et al. (1998), a built-in function fminsearch of MATLAB, giving the optimal values for the coefficients. The data were subject to 10 000 bootstrap resamples when getting each of the k values as a measure of accuracy in terms of bias, variance, confidence intervals or prediction error (Efron and Tibshirani, 1994). We accounted for the systematic uncertainty in H2SO4 and predictor variables. For every bootstrap fit, we assumed both H2SO4 and all predictor variables to be affected by independent systematic errors between their lower and upper accuracy limits. More details on the bootstrap resampling method and uncertainty introduction can be found in the Supplement. The 25th percentile and 75th percentiles of the coefficients are shown for all locations together with the median k values in Table 2. The median k values from the bootstrap resamples were used in the equations for deriving sulfuric acid concentrations at each site. Figures S2–S6 present the correlation matrix between the different variables participating in H2SO4 formation and loss in all locations (training data sets). The goodness of the fit and the probability of overfitting or under-fitting was evaluated using the Akaike Information Criterion (AIC; Fig. S9 in the Supplement), which also compares the proxies given in Eqs. (2), (4), (5) and (6). The criterion uses the sample size (number of points), the number of parameters (terms in the equation) and the sum of the squared estimate of errors (SSE, i.e., deviations predicted from actual empirical values of data) to estimate the quality of each model, relative to each of the other models, and thus provides means for model selection (McElreath, 2018).
Table 1Equations for sulfuric acid proxy derivation at each of the measurement locations.
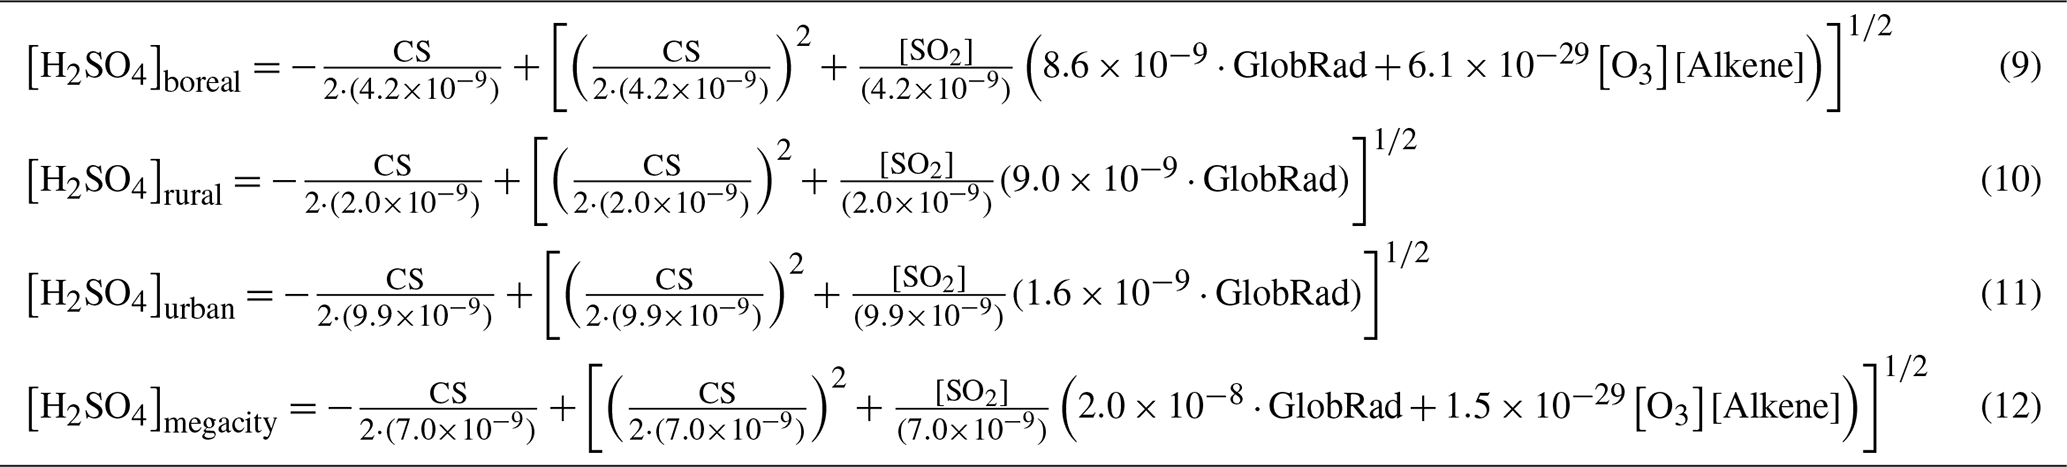
Table 2Coefficients used in the proxy equation in all four environments. Numbers in parentheses represent the 25th and 75th percentiles of bootstrapped data (including outliers). See Sect. 2 in the Supplement for more details.
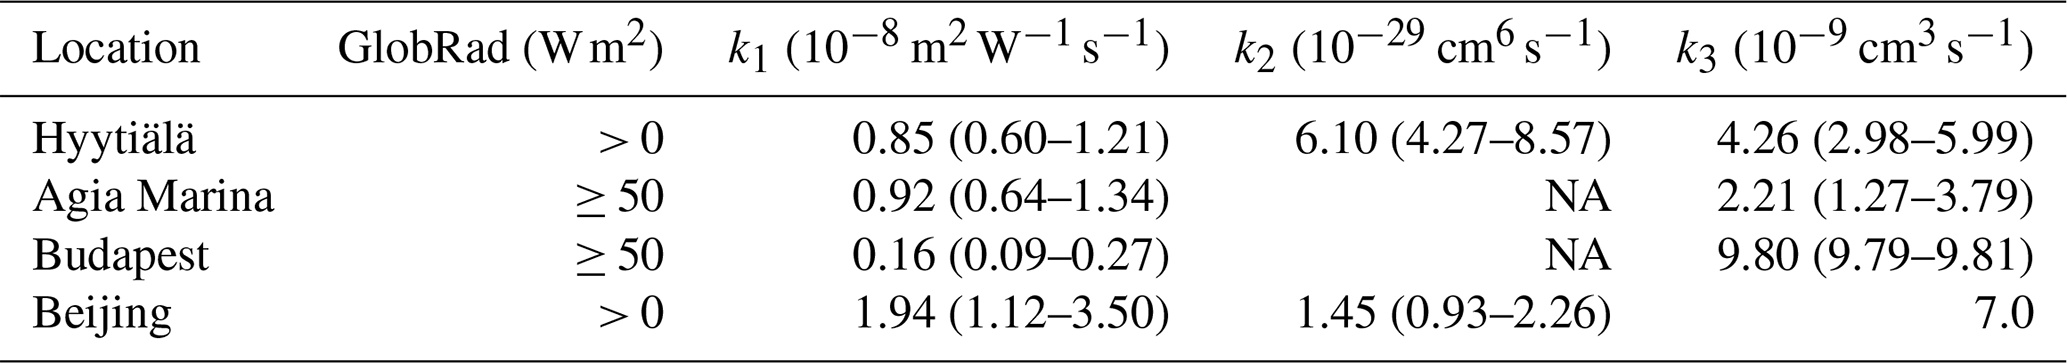
NA: not available

Figure 1Sulfuric acid proxy concentration as a function of measured sulfuric acid. Observation at SMEAR II station, Hyytiälä, Finland. The observed concentrations from the training data set are measured for 2016–2019 using CI-APi-ToF and are 3 h medians, resulting in a total of 1860 data points. In (a), the full Eq. (2) is used, in (b) the equation without the stabilized Criegee intermediates source (Eq. 4) is used, in (c) the equation without the cluster sink term (Eq. 5) is used, and in (d) the equation without the stabilized Criegee intermediates source and the cluster sink term (Eq. 6) is used. The “fit” refers to the fitting between the measured and the proxy-calculated sulfuric acid concentration ().
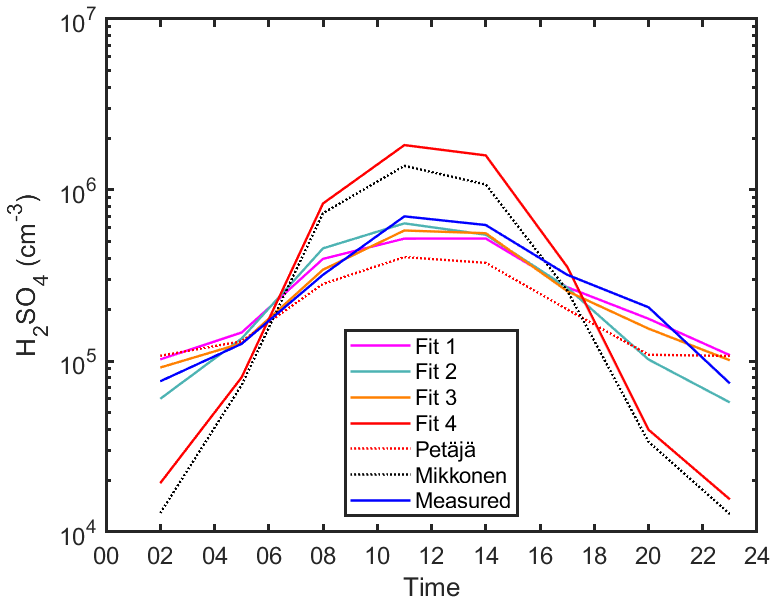
Figure 2The diurnal variation of sulfuric acid proxy concentrations using different fits and observed concentrations at SMEAR II in Hyytiälä, Finland. Median values are shown. Fits 1, 2, 3 and 4 correspond to Eqs. (2) and (4), (5), and (6), respectively. The Petäjä fit shown is applied using the coefficients reported in Petäjä et al. (2009) (Eq. 7). The Mikkonen fit shown is applied using the coefficients reported in Mikkonen et al. (2011) (Eq. 8).
4.1 The sulfuric acid proxy for Hyytiälä SMEAR II station
Figure 1a shows the scatterplot between the observed H2SO4 concentrations and that derived by the proxy using the full Eq. (2). The correlation coefficient was 0.84 (1860 data points). The data were related to 3 h medians, as the monoterpene concentration was measured only every third hour. In Fig. 1b–d, the proxy is refitted after removing one of the source or sink terms (Eqs. 4–6), in order to evaluate the sensitivity of the proxy to each of the terms and to show the improvement of the proxy using the additional source and sink (Fig. 1a) in comparison to the simple proxy that was used by Petäjä et al. (2009) (Fig. 1d). Our results show that the integration of additional terms of H2SO4 formation (i.e., the stabilized Criegee Intermediates) and loss (atmospheric cluster formation) gives the new proxy the ability to accurately capture the diurnal variation of the H2SO4 concentration, demonstrating a clear improvement over the earlier physical proxy (Petäjä et al., 2009).
In Fig. 1b, the corresponding data are shown without the alkene term (Eq. 4). The correlation is substantially weaker (0.74) than with the full equation. Even more importantly, we cannot estimate the contribution of the alkene term to the sulfuric acid concentration (Fig. 2 – Fit 2) as the fit also results in an unphysical coefficient for cluster formation (Kürten et al., 2015) and the fit fails to capture the diurnal pattern during dark hours after 16:00 LT (Fig. 2 – Fit 2). When fitting the data without the cluster source term (Eq. 5), the correlation coefficient is high (Fig. 1c), yet the goodness of the fit is not as good as when the cluster source term is taken into account (Table S4 in the Supplement – Fig. S9). Furthermore, we derived an additional proxy equation using CS corrected for hygroscopic growth (Laakso et al., 2004) to be used when calculating a more robust proxy for Hyytiälä. The details, equation and results are shown in Figs. S10–S12 in the Supplement.
Note that we opted for deriving a bulk proxy (daytime and nighttime together) instead of two independent proxies, one for daytime and one for nighttime separately. Our results show that one bulk equation is able to explain the Hyytiälä sulfuric acid daytime and nighttime sources accurately. Additionally, separating the bulk equation into two distinct equations results in bias towards the pattern of one of the predictor variables. For instance, the k1 value during daytime follows the cycle of global radiation, while that of k2 follows the cycle of alkenes. Therefore, in order to accurately reflect the continuum of source and sink terms throughout the day, we decided on the bulk proxy. Additionally, one bulk equation was able to predict sulfuric acid concentrations during daytime and nighttime with high accuracy (slope of ∼ 1), as further discussed in Sect. 4.5.
The fit was able to reproduce the sulfuric acid concentration in such a clean environment without the cluster term (Fig. 2 – Fit 3), perhaps due to low concentrations of bases participating in clustering in Hyytiälä (Jen et al., 2014). Finally, the corresponding data without both the alkene source term and cluster formation source term (Eq. 6, Fig. 1d) shows a weaker correlation between the measured and modeled sulfuric acid concentration (0.70), but more importantly it deviates far from the 1:1 line during both daytime and nighttime (Fig. 2 – Fit 4). It is important to note here that when deriving the Petäjä proxy (Petäjä et al. 2009), the model relied on summer data between April and June 2007, which could explain the misfit with the current data from Hyytiälä that spans the whole year. See also Figs. S13 and S14 in the Supplement for scatterplots comparing the measured sulfuric acid concentrations of the training data set with Petäjä et al. (2009) and Mikkonen et al. (2011), respectively. In general, using all four terms in Eq. (2) shows improvement over all other combinations (Eqs. 4–6), not only in terms of correlation coefficients and accurate diurnal cycle between measured and calculated concentrations of sulfuric acid as shown in Figs. 1 and 2 but also by showing a better goodness of the fit as shown in Table S4 and Fig. S9 when using the AIC statistical method. The final equation for the boreal forest environment can be found in Table 1, Eq. (9).
4.2 Sulfuric acid proxy at a rural site: Agia Marina, Cyprus
Since there were no direct measurements of alkenes in Agia Marina, we had to exclude the formation of H2SO4 in the oxidation by sCI from the proxy, and therefore we derived only the daytime H2SO4 proxy concentration. The correlation between the measured and proxy concentration of H2SO4 was 0.88 (96 data points), which shows that the chosen predictors were able to largely explain the measured sulfuric acid concentration (Fig. 3). However, the slope deviates from the 1-to-1 line, which could be attributed to the additional formation mechanisms that we could not include with the current data. However, the addition of the cluster loss mechanism shows a noticeable improvement over the simple proxy in Fig. 3b (R=0.80). The cluster loss term starts to become more important in this rural environment in comparison to the boreal forest, which could be due to a higher concentration of stabilizing bases in Agia Marina compared with Hyytiälä. Although both fits of Eqs. (4) and (6) show similar diurnal patterns (Fig. 4, Fits 2 and 4), the loss term due to H2SO4 cluster formation improved the precision of the new proxy (Fig. 3). According to the statistical AIC method, the goodness of the fit improved from 70 to 33, with and without the clustering term, as shown in Fig. S9. Also, even without the alkene term, the newly derived coefficients improved the proxy in comparison to Petäjä et al. (2009) and Mikkonen et al. (2011), as shown in Figs. 4, S13 and S14. The final equation for the rural site can be found in Table 1, Eq. (10).

Figure 3Sulfuric acid proxy concentration as a function of measured sulfuric acid. Observation at Agia Marina, Cyprus, excluding the alkene term. The observed numbers concentrations are measured during February–March 2018 using CI-APi-ToF and are hourly medians resulting in a total of 96 data points. Sulfuric acid proxy concentration as a function of measured sulfuric acid. In (a), the equation without the stabilized Criegee intermediates source (Eq. 4) is used, and in (b) the equation with neither the stabilized Criegee intermediates source nor the cluster sink term (Eq. 6) is used. The “fit” refers to the fitting between the measured and the proxy-calculated sulfuric acid concentration ().
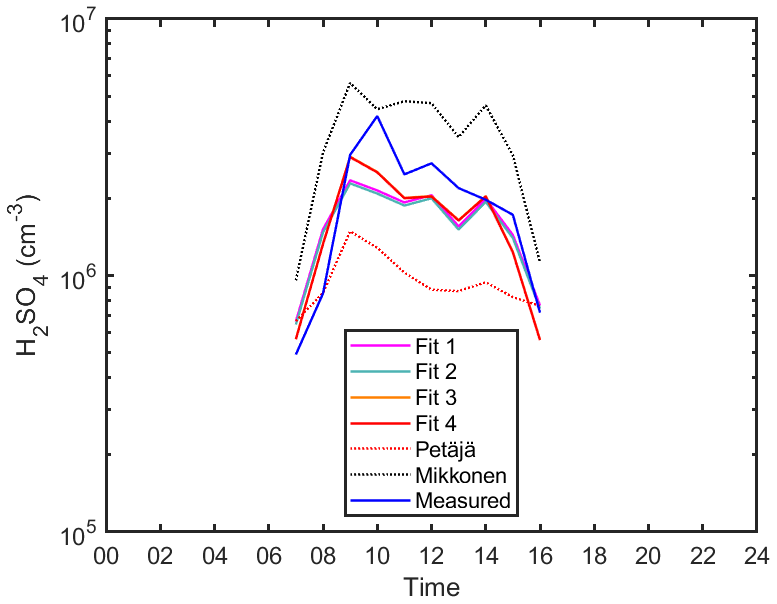
Figure 4The diurnal variation of sulfuric acid proxies and observed concentrations in Agia Marina, Cyprus. Hourly median values are shown. Fits 2 and 4 correspond to Eqs. (4) and (6), respectively (see also Fig. 3a and b, respectively). The Petäjä fit shown is applied using the coefficients reported in Petäjä et al. (2009) (Eq. 7). The Mikkonen fit shown is applied using the coefficients reported in Mikkonen et al. (2011) (Eq. 8).
4.3 Proxy for urban environment: Budapest, Hungary
Next we try to understand the mechanisms of sulfuric acid formation and losses in an even more complex environment, i.e., urban Budapest (Figs. 5 and 6). Since there were no direct measurements of alkenes there or of its proxies, such as monoterpenes, or anthropogenic volatile organic compounds, we derived the sulfuric acid proxy excluding the formation due to stabilized Criegee intermediates pathway, as in Eq. (4). In comparison to the simple proxy (Fig. 5b; R=0.49; 263 data points), the correlation between the measured and proxy concentration of H2SO4 improved with the addition of the loss term due to cluster formation, R=0.59 (Fig. 5a). The correlation between measured and modeled values of sulfuric acid became weaker in Budapest in comparison to Hyytiälä and Agia Marina, which could be attributed to a more complex environment, and additional pathways of sulfuric acid formation and losses. Additionally, we observed a sudden SO2 concentration change in the middle of the campaign, possibly due to sudden change in local meteorology and air mass transport, which could also explain the weaker correlation (See Fig. S1). The loss term due to H2SO4 dimerization improved the precision of the new proxy in comparison to the simple model, as well as the Petäjä et al. (2009) or the Mikkonen et al. (2011) derivation, as shown in Figs. 6, S13 and S14. We think that the overestimation in the Petäjä proxy is because of its dependence on the SO2∕CS ratio. The proxy is originally derived in Hyytiälä, and when we apply the same coefficients to Budapest it gives a higher estimated concentration when compared to the measured one since the SO2∕CS ratio is smaller in Budapest (Fig. 9). Although the proxy developed by Mikkonen et al. (2011) has been shown to work in varying environments, it clearly overestimates the sulfuric acid concentration in Budapest for perhaps the same reasons (its dependence on the SO2∕CS ratio). It is also visible from Figs. 5 and 6 that the addition of the dimerization term was capable of better capturing the lower H2SO4 concentrations in comparison to fitting the data without the dimerization term. In comparison to both Hyytiälä and Agia Marina, the coefficient associated with dimerization in Budapest is slightly higher, which can be attributed to the availability of a possibly facilitated clustering due to higher abundance of stabilizing bases such as amines and ammonia (discussed in Sect. 4.6). The final equation for the urban environment can be found in Table 1, Eq. (11).
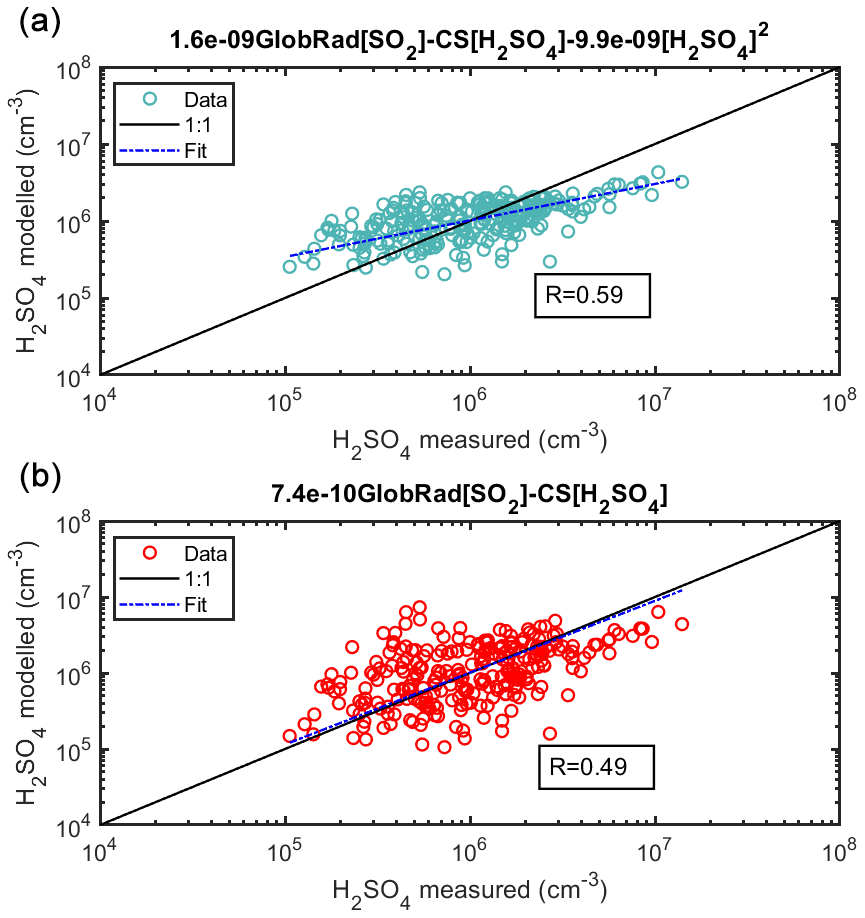
Figure 5Sulfuric acid proxy as a function of measured sulfuric acid at Budapest station, excluding the alkene term. The observed numbers are measured during spring 2018 using CI-APi-ToF and are 1 h medians coinciding with the measurement of trace gases and global radiation every hour resulting in a total of 263 data points. In (a), the equation without the stabilized Criegee Intermediates source (Eq. 4) was used, and in (b) the equation with neither the stabilized Criegee intermediates source nor the cluster sink term (Eq. 6) was used. The “fit” refers to the fitting between the measured and the proxy-calculated sulfuric acid concentration ().
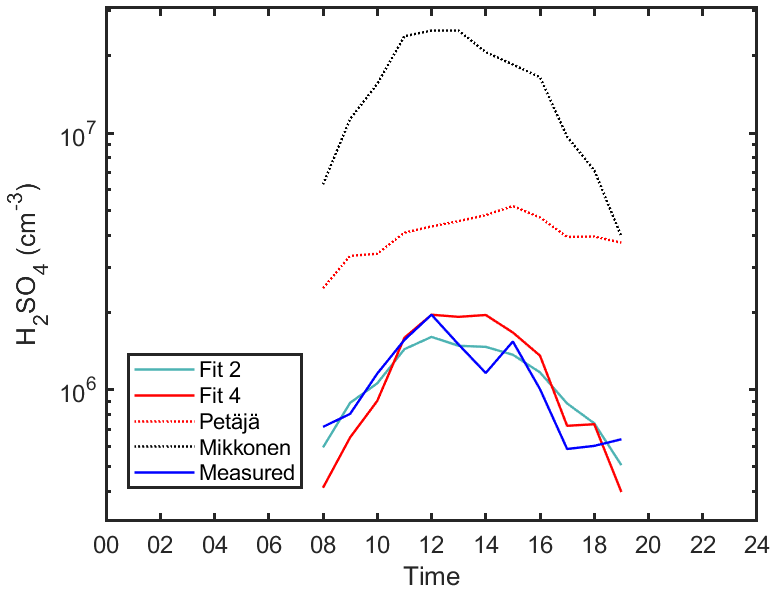
Figure 6The diurnal variation of sulfuric acid proxies and measured concentrations in Budapest. Hourly median values are shown. Fits 2 and 4 correspond to Eqs. (4) and (6), respectively. The Petäjä fit shown is applied using the coefficients reported in Petäjä et al. (2009) (Eq. 7). The Mikkonen fit shown is applied using the coefficients reported in Mikkonen et al. (2011) (Eq. 8).
4.4 Proxy for megacity: Beijing, China
In megacities, in our case Beijing, the sulfuric acid concentration is particularly high during nighttime, which confirms the need for determining the contribution of sources other than OH (radiation) to its formation. Our observations emphasize the contribution of the alkene pathway, as without considering this route we would not replicate morning hours correctly. During daytime, there is enhanced dimerization and cluster formation due to the abundance of stabilizing bases (Yao et al., 2018). We assessed the derivation of the proxy equation first using daytime data and nighttime data separately and found that such a separation results in an unphysical k3 value since clustering in Beijing happens mostly during daytime (Zhou et al., 2020). This obstacle was also observed when deriving a bulk equation. To overcome it, we set an upper limit for the k3 value at 7 × 10⁻⁹ obtained from the fitting of daytime data (GlobRad ≥ 50 W m2). The reason for such an observation is that, in such a complex environment, sulfuric acid might originate from sources other than the ones we accounted for in our calculation, especially during nighttime, e.g., through the hydrolysis of SO3 formed from non-photochemical processes (Yao et al., 2020). The alkenes or volatile organic compounds during daytime are different from those during nighttime and might vary between seasons, which could be attributed to a different fleet composition during those times or the biogenic activity (Yang et al., 2019). However, the derived Eq. (12) (derived from spring data) is able to predict the daytime and nighttime sulfuric acid concentrations during summer and autumn (See more in Sect. 4.5).
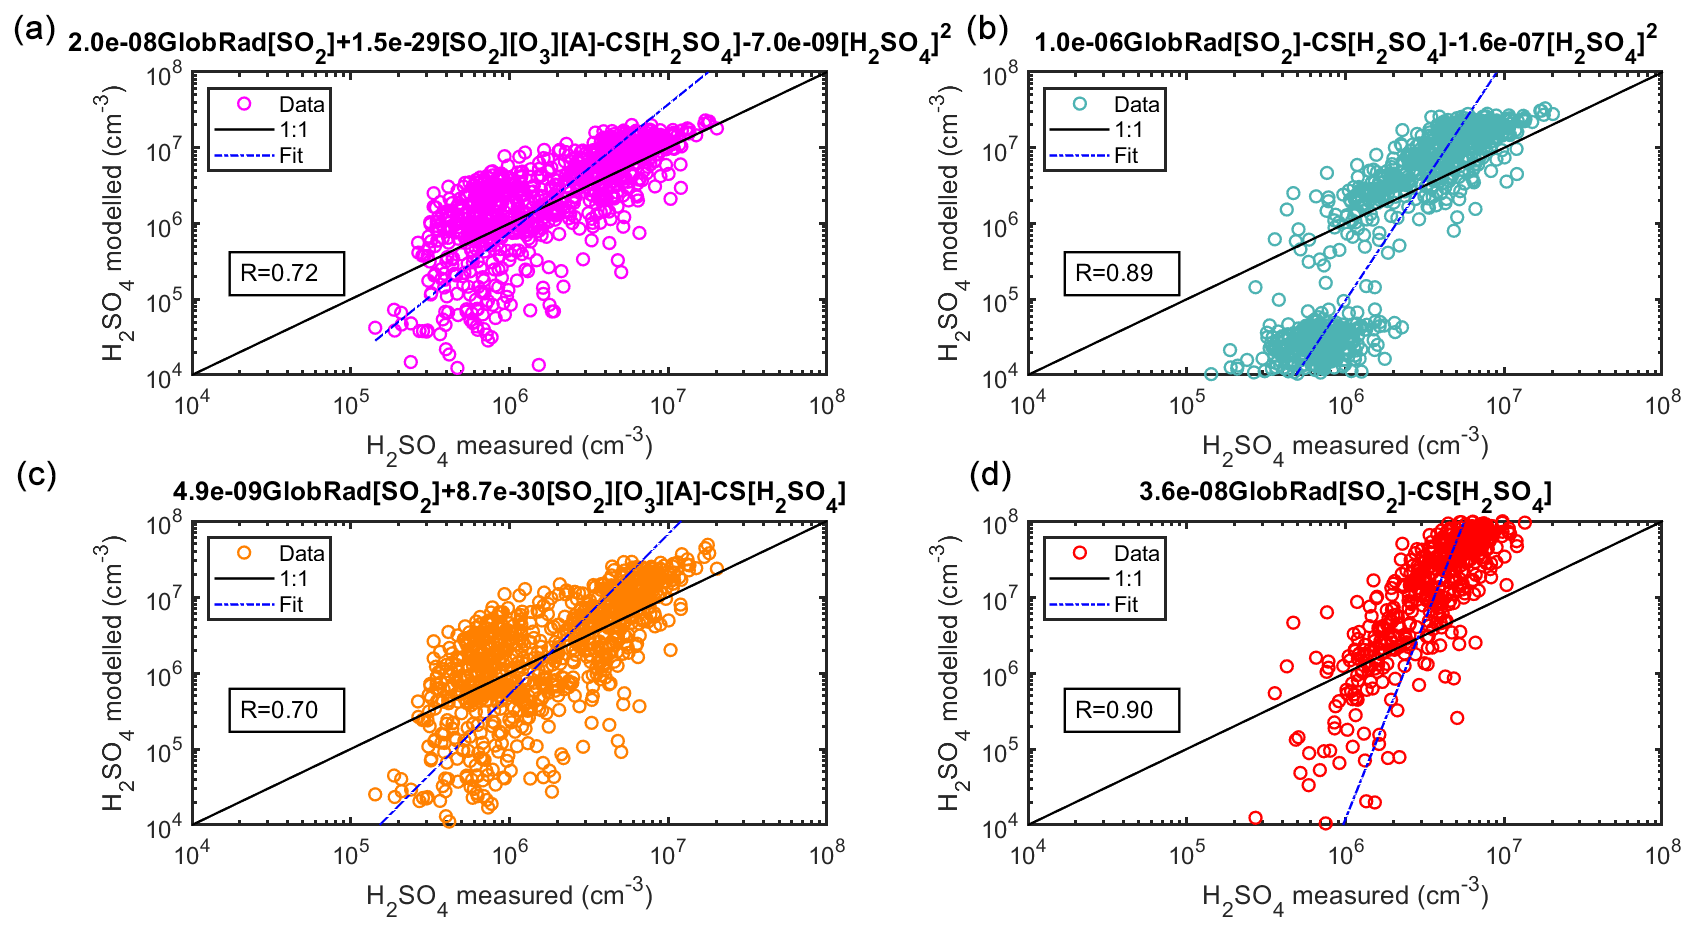
Figure 7(a) Sulfuric acid proxy concentration as a function of measured sulfuric acid. Observation at Beijing, China. The observed concentrations of the training data set were measured in 2019 using CI-APi-ToF and are 1 h medians, resulting in a total of 877 data points. In (a), the full Eq. (2) is used, in (b) the equation without the stabilized Criegee intermediates source (Eq. 4) is used, in (c) the equation without the cluster sink term (Eq. 5) is used, and in (d) the equation without the stabilized Criegee intermediates source or the cluster sink term (Eq. 6) was used. Coefficients shown on top of the subplots relate to the daytime values. The “fit” refers to the fitting between the measured and the proxy-calculated sulfuric acid concentration ().
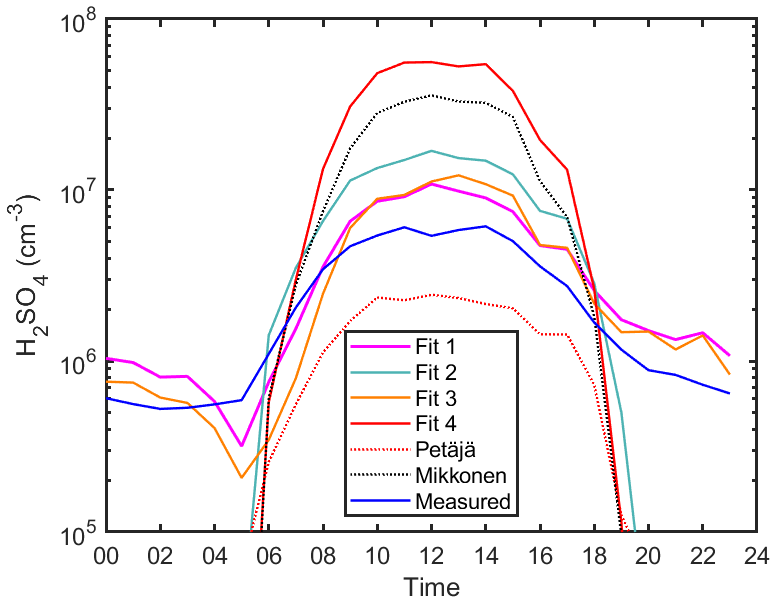
Figure 8The diurnal variation of sulfuric acid proxy concentrations using different fits and observed concentrations at Beijing, China. Median values are shown. Fits 1, 2, 3 and 4 correspond to Eqs. (2) and (4), (5), and (6), respectively. The Petäjä fit shown is applied using the coefficients reported in Petäjä et al. (2009) (Eq. 7). The Mikkonen fit shown is applied using the coefficients reported in Mikkonen et al. (2011) (Eq. 8).
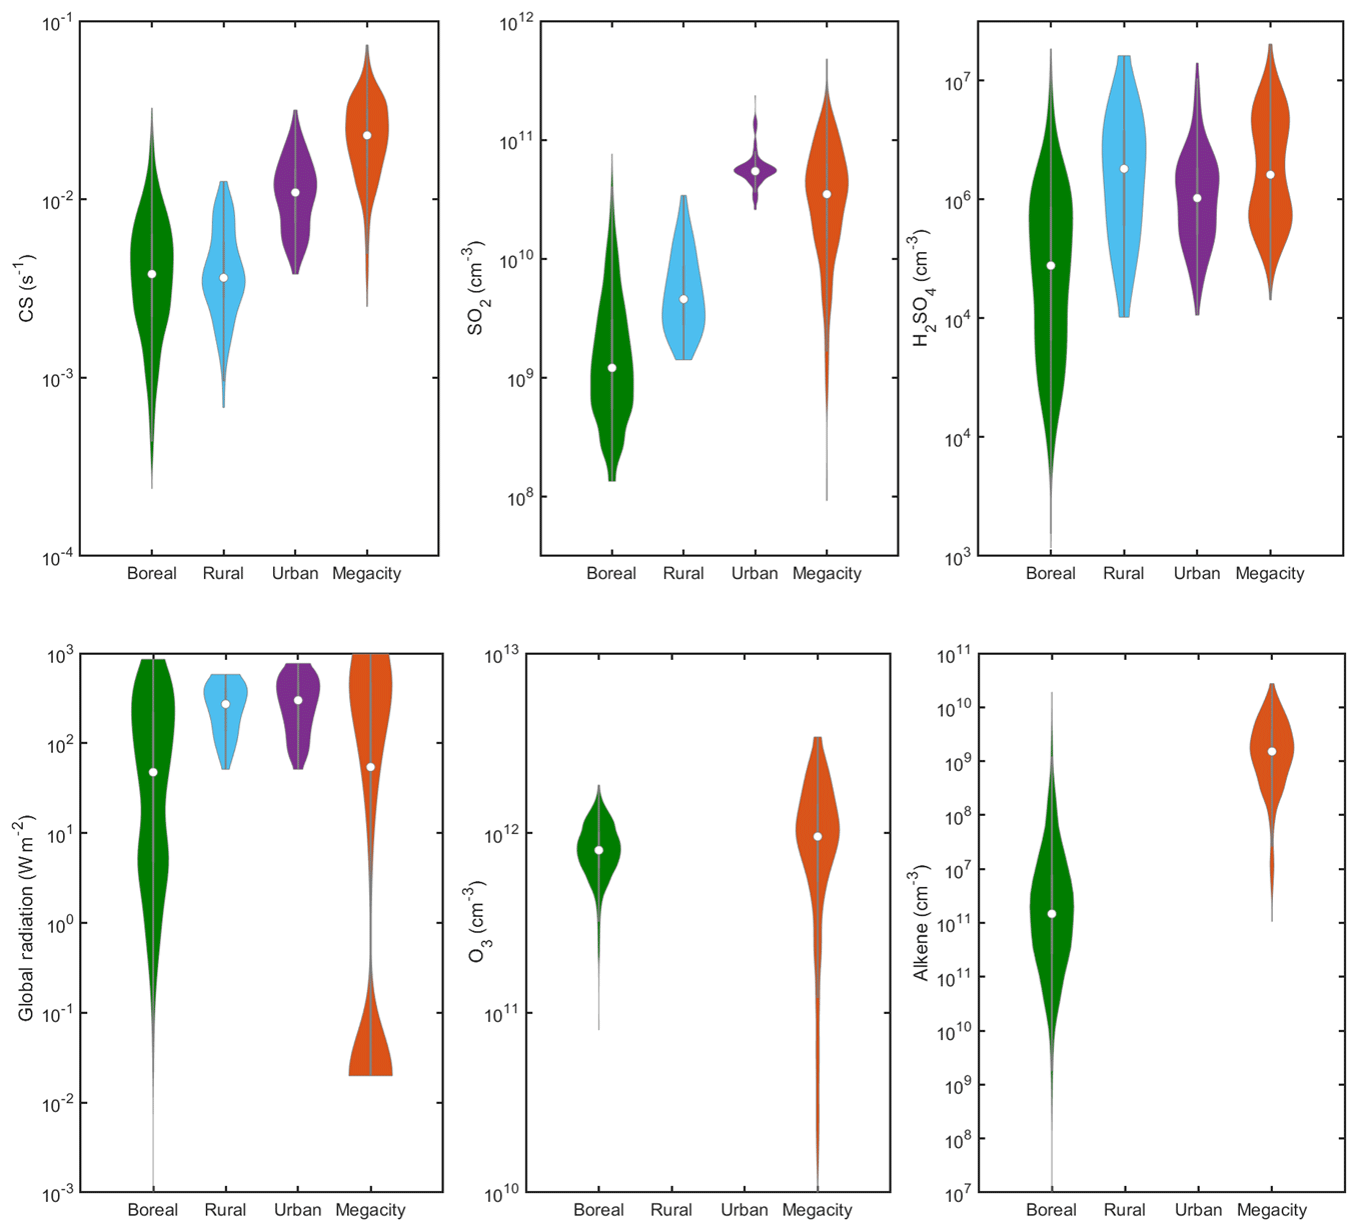
Figure 9Characteristic predictor variables and H2SO4 concentrations in different environments. O3 and alkene data are available from the boreal forest (Hyytiälä) and megacity (Beijing) environments. This figure could be used in order to choose the equation and coefficients for calculating sulfuric acid proxy at a new location. The alkenes in the boreal environment are monoterpenes (e.g., alpha-pinene) and in the megacity are anthropogenic volatile organic compounds (butylene, butadiene, isoprene, pentene and hexene). The concentrations are displayed as violin plots, which are a combination of boxplot and a kernel distribution function on each side of the boxplots. The white circles define the median of the distribution and the edges on the inner grey boxes refer to the 25th and 75th percentiles, respectively. Whole day data are shown for Hyytiälä and Beijing, while daytime data are shown (GlobRad > 50 W m2) for Agia Marina and Budapest. Daytime data (GlobRad > 50 W m2) are shown in Fig. S15 in the Supplement. The correlations between the different variables at each site are shown in Figs. S2–S6.
In Fig. 7, we see an improvement of the new proxy (Eq. 2) in comparison to the simple proxy (Eq. 6) derived by Petäjä et al. (2009) as the former takes into the account the additional sources and sinks of H2SO4 that were not considered in previous works (see also Fig. S9). Introducing the alkene production term improved the accuracy of the H2SO4 concentration during both daytime and nighttime (Figs. 7 and 8), which supports our assumption that H2SO4 formation during nighttime is driven by stabilized Criegee intermediates. In Fig. 7b we show the proxy without the alkene term is unable to capture the nighttime concentrations. In Fig. 8, we see the importance of all sources and sinks predicted for sulfuric acid, as Fit 1 (Eq. 2) best predicts the measured sulfuric acid concentration. Additionally, according to the statistical AIC method, using the full equation has the least probability of inaccuracy and error in estimating the sulfuric acid concentration (Fig. S9). Moreover, it is clear that the addition of the cluster sink term in the megacity environment is required due to its large contribution as a sink for H2SO4, especially due to higher concentrations of stabilizing molecules; the cluster mode (sub-3 nm) particle concentration is the highest in Chinese megacities (Zhou et al., 2020). The final equation for the megacity can be found in Table 1, Eq. (12).
4.5 Predictive power of proxy equations
Each of the proxies of the boreal forest environment, the rural background and the megacity were tested for predictive power on independent data sets using extended data sets from the same location or using measurements from locations with similar characteristics. The sulfuric acid concentrations at each of these locations is modeled using the equation (with median k per source/sink term) relevant to the site and compared to the measured concentrations. The derivation of the sulfuric acid concentrations using 10 000 combinations of k values, as well as the error in the predictions, are shown in the Supplement. Note that the testing data sets are not subject to any bootstrap resampling or uncertainty additions but are instead used as is for testing the predictive power of the suggested proxy.
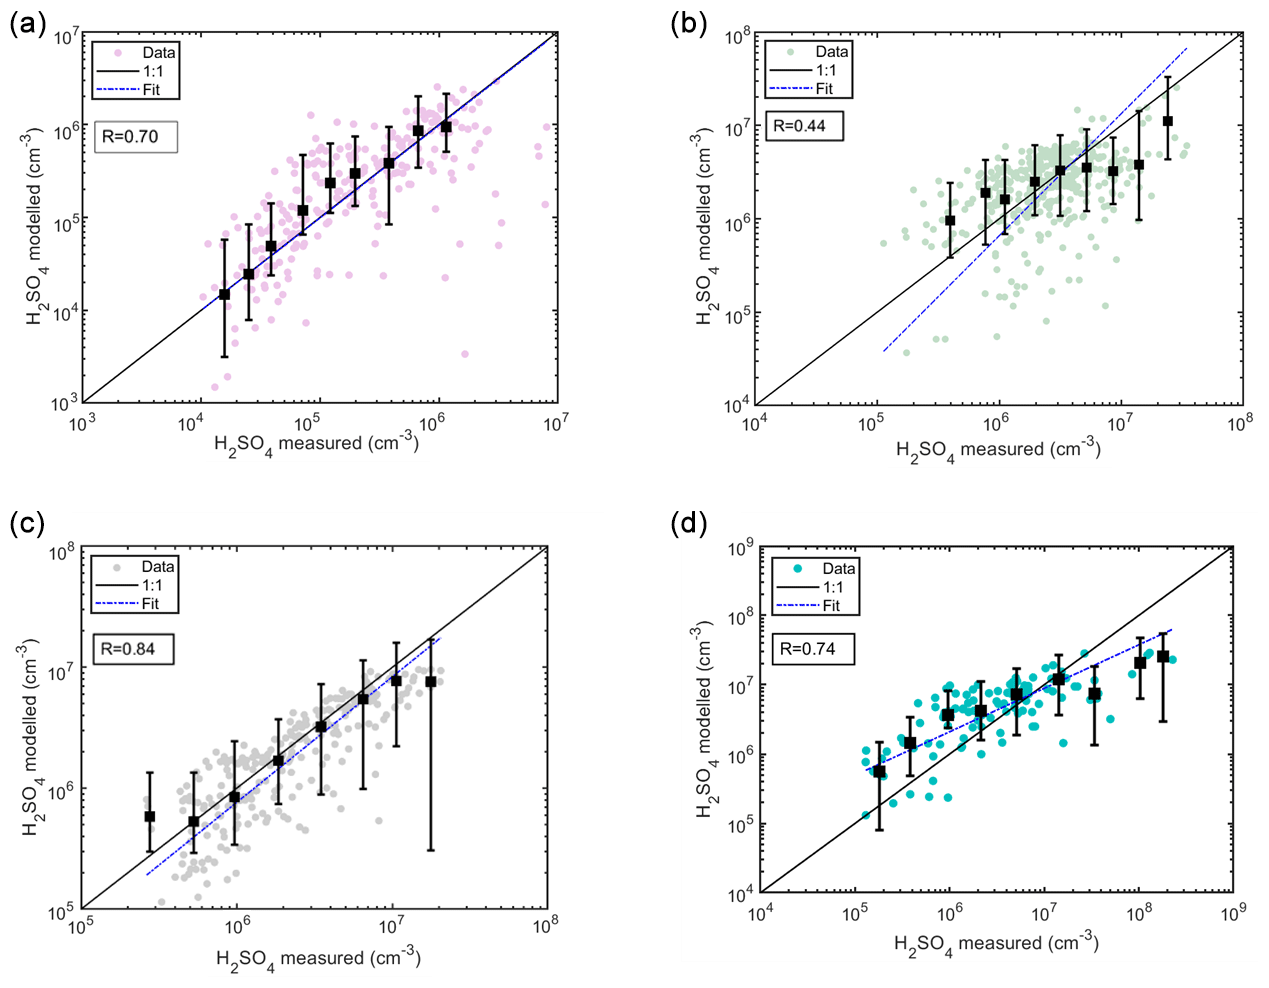
Figure 10Sulfuric acid concentrations modeled as a function of measured sulfuric acid using testing data sets. The colored data points refer to the modeled (predicted) concentrations, and the dashed blue line refers to the fit () of the aforementioned data points. The black squares are the median modeled concentrations in logarithmically spaced measured sulfuric acid bins, and their lower and upper whiskers correspond to 25th and 75th percentiles of the predicted concentrations. (a) Hyytiälä SMEAR II station: the concentrations shown are 3 h medians coinciding with the alkene measurements every 3 h, resulting in a total of 257 data points. The modeled concentrations are derived using Eq. (9). (b) Helsinki SMEAR III station: the concentrations shown are 1 h medians, resulting in a total of 416 data points. The modeled concentrations are derived using Eq. (10). (c) Beijing: the concentrations shown are 1 h medians resulting in a total of 268 data points. The modeled concentrations are derived using Eq. (12). (d) Kilpilahti: the concentrations shown are 1 h medians resulting in 114 data points. The modeled concentrations are derived using Eq. (9).
4.5.1 Boreal forest environment: Hyytiälä
For testing the predictive power of the boreal forest proxy (Eq. 9), we use an independent testing data set from the same location measured from 1 January to 5 June 2017. Results show that the modeled sulfuric acid concentrations correlate well (R=0.7) with the measured sulfuric concentrations, with a slope of 0.997 for the testing data set (Figs. 10a and S16 in the Supplement). Moreover, we tested the four fits on the testing data set, i.e., the full Eq. (2), the equation without the stabilized Criegee intermediates source (Eq. 4), the equation without the cluster sink term (Eq. 5), and the equation with neither the stabilized Criegee intermediates source nor the cluster sink term (Eq. 6), and found that Fit 1 (Eq. 4) best defines the measured sulfuric acid concentration in comparison to the rest of the equations (Fig. S17 in the Supplement). The diurnal cycle is also accurately described by Eq. (4), which captures both nighttime and daytime values (Fig. S18 in the Supplement).
4.5.2 Semi-urban location: Helsinki
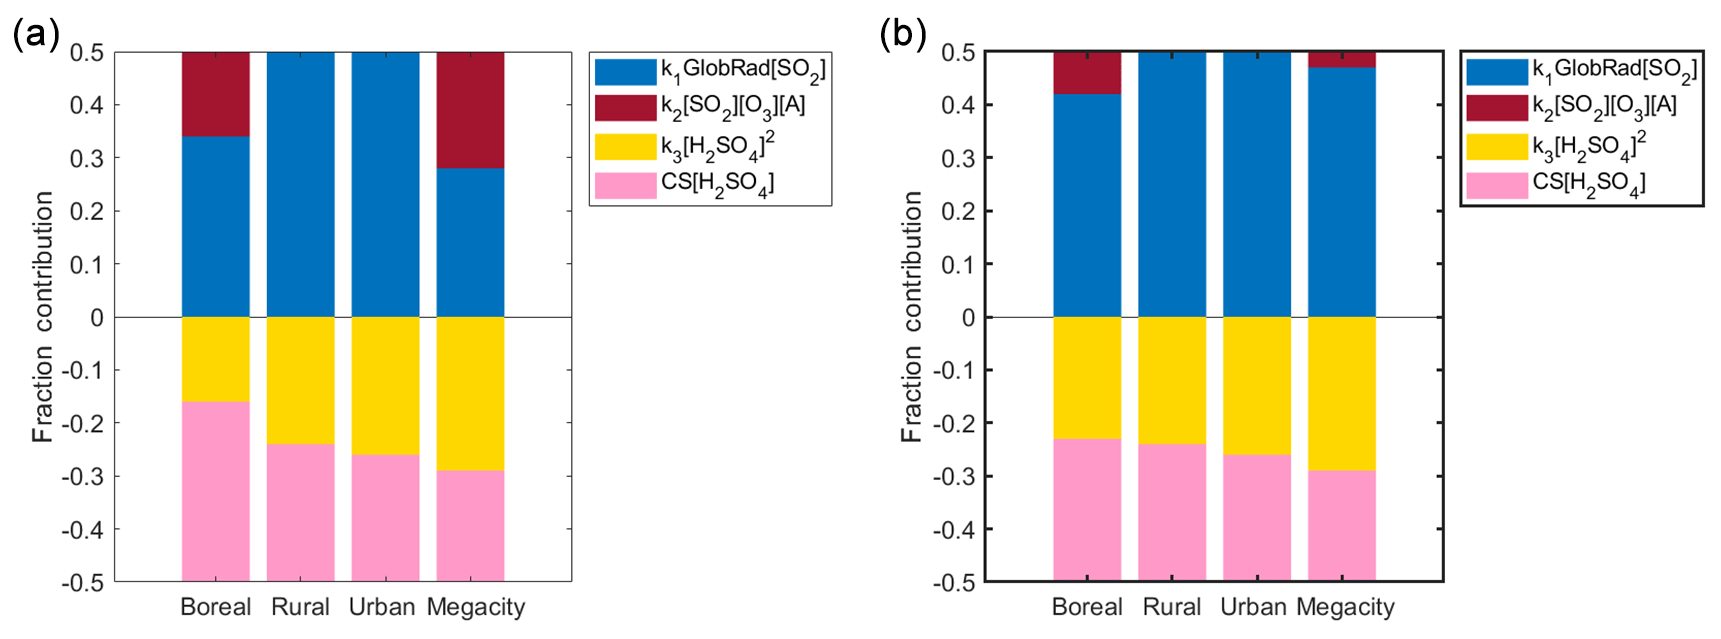
Figure 11Fraction contribution of each source and sink term to the change in H2SO4 concentration. Figure 11 is complementary to Table 3. The boreal, rural, urban and megacity labels refer to the Hyytiälä, Agia Marina, Budapest and Beijing sites, respectively. Note that the fraction of the alkene term contribution is not zero for the rural or urban sites but is due to unavailable alkene data from these sites. In (a) we show all day medians for Hyytiälä and Beijing, and in (b) we show daytime medians for all sites.
For testing the predictive power of the rural background site proxy (Eq. 10), we use an independent testing data set from a semi-urban location in Helsinki, Finland, measured from 1 to 16 July 2019 during daytime (GlobRad ≥ 50 W m2). The rural background site Eq. (10) is used as the condensation sink, and SO2 concentrations in the testing location are within the interquartile span of the Agia Marina measurements (Fig. 9, Table S3 in the Supplement). Results show that although the modeled sulfuric acid concentrations do not correlate as well as in other locations (R=0.44), the bias could be attributed to the missing source (alkene) in the original equation (Fig. 10b). Indeed, looking at the binned data, we find that at within each concentration bin the modeled sulfuric acid concentrations tend to span the 1:1 line. Actually, the discrepancy between the measured and the modeled concentration is smaller than the model prediction error (Fig. S19 in the Supplement). Note that the model prediction error is estimated as the interquartile range of the modeled H2SO4 concentration of a single point in time arising from the uncertainty in k values. For the rural background site, we also found that the diurnal cycle is better described when introducing the additional clustering sink term (Fig. S20 in the Supplement).
4.5.3 Megacity: Beijing
For testing the predictive power of the megacity proxy (Eq. 12), we use an independent testing data set from the same location (Beijing) measured from 1 September to 15 October 2019. Results show that the modeled sulfuric acid concentrations correlate well (R=0.83) with the measured sulfuric concentrations, with a slope of ∼ 1.1 for the testing data set (Fig. 10c). Also for this site, we tested the four fits on the testing data set, i.e., the full Eq. (2), the equation without the stabilized Criegee intermediates source (Eq. 4), the equation without the cluster sink term (Eq. 5), and the equation with neither the stabilized Criegee intermediates source nor the cluster sink term (Eq. 6), and found that Fit 1 (Eq. 4) best defines the measured sulfuric acid concentration in comparison to the rest of the equations (Fig. S22 in the Supplement). The diurnal cycle is also described by Eq. (4), which captures both nighttime and daytime (Fig. S23 in the Supplement).
4.5.4 Industrial area: Kilpilahti
Finally, we tested the predictive power of our developed proxy on a data set measured at an industrial area in close proximity to an oil refinery. Interestingly, the median CS at the location lies within the interquartile range of the CS measured in Hyytiälä and that measured in Agia Marina (Table S3, Fig. 9). The SO2 concentrations at the measurement site are higher than in both Hyytiälä and Agia Marina but are smaller than the ones reported in Budapest. Additionally, we observed alkene concentrations at Kilpilahti that are within the range of those monitored in Hyytiälä attributed to the green belt in the area (Sarnela et al., 2015). Accordingly, we test the proxy Eq. (9) on the Kilpilahti data set. Our results show that Eq. (9) is able to predict the sulfuric acid concentrations in Kilpilahti with a high correlation coefficient (R=0.74) (Fig. 10d). Similar to other locations, the Fit 1 (Eq. 4) best describes the sources and sinks at the location (Fig. S25). The discrepancy between the measured and the modeled concentration is smaller than the model prediction error for less than 50 % of the data points only (Fig. S24 in the Supplement). This observation is consistent with the diurnal cycle (Fig. S26 in the Supplement). During certain mornings (04:00–08:00 LT), when the measured sulfuric concentrations are particularly high, the model was unable to predict the concentrations accurately. These high concentrations were attributed to air masses coming from the oil refinery (Sarnela et al., 2015). Indeed, our proxy was not able to explain these morning peaks using biogenic alkenes, however, in such an industrial area, anthropogenic sources could play a role in determining the magnitude of sulfuric acid concentrations. With the condensation sink being rather low (median ∼ 0.005 s−1), the impact of direct H2SO4 emissions cannot be ruled out either.
Table 3Fraction of each source and sink term for the change in H2SO4 concentration. Median of bootstrap resampling results and their 25th and 75th percentiles are shown.
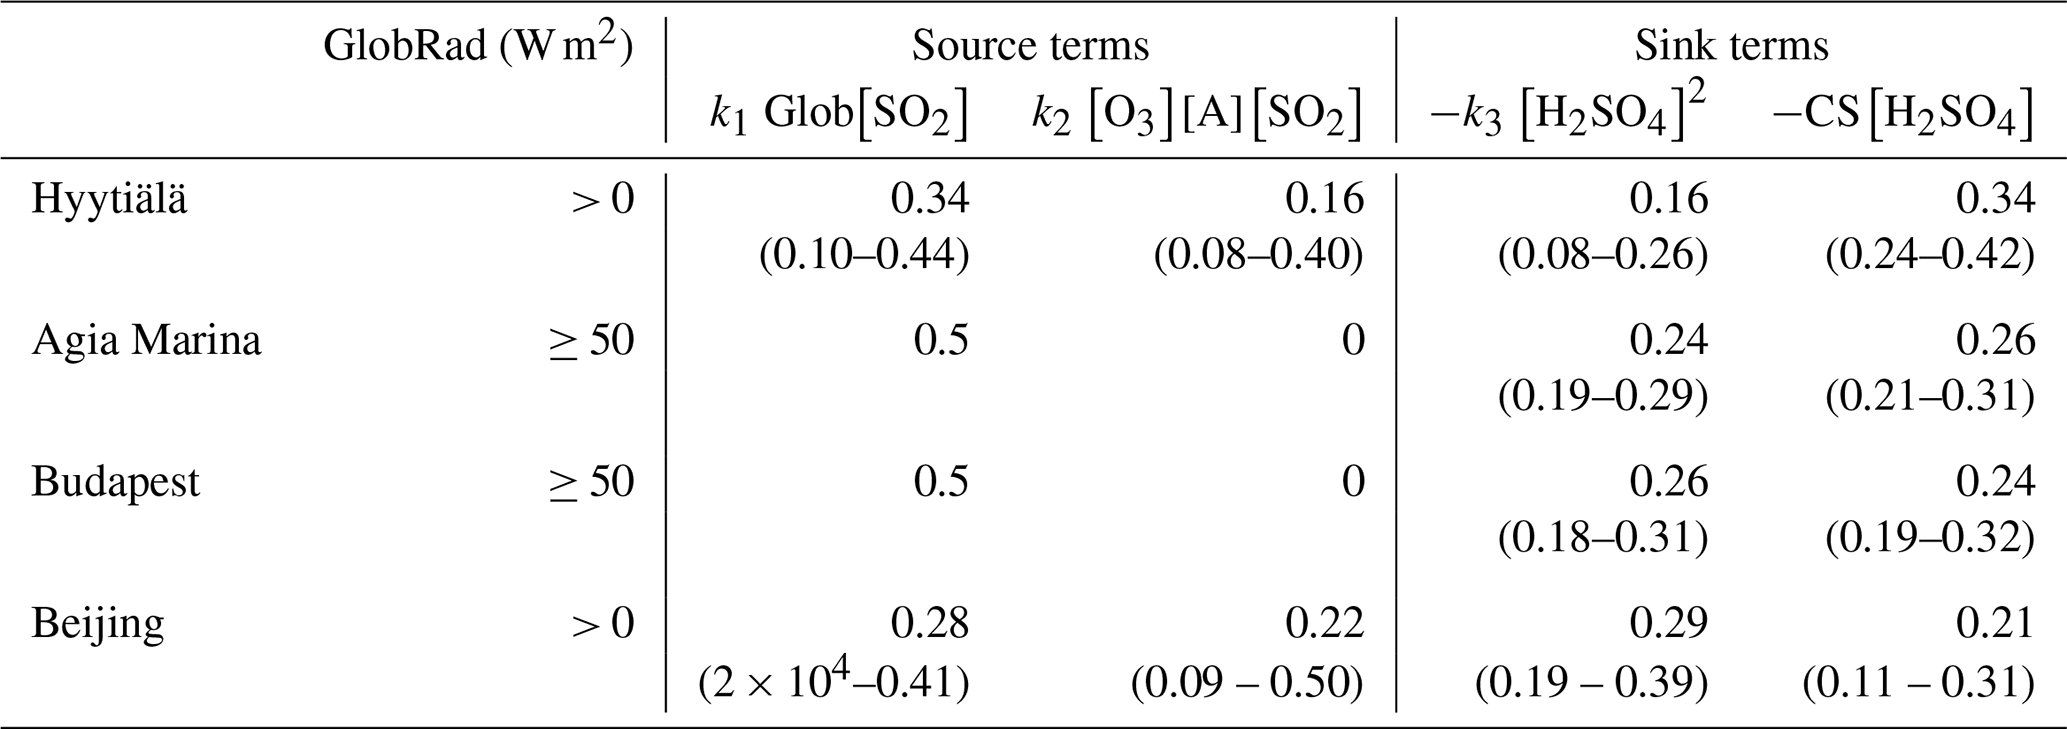

Figure 12(a) Monthly variation of each source and sink term fraction contribution to the change in H2SO4 concentration in Hyytiälä within the training data set 2016–2019. (b) Monthly variation of each source and sink term to the change in H2SO4 concentration in Beijing within the training and testing data sets in 2019; the data outside the training and testing data sets have missing measured sulfuric acid concentrations, thus proxy concentrations were used in obtaining this figure. (c) Diurnal variation of each source and sink term to the change in H2SO4 concentration in Hyytiälä within the training data set. (d) Diurnal variation of each source and sink term to the change in H2SO4 concentration in Beijing within the training and testing data sets.
4.6 Sensitivity of the proxy to the H2SO4 sources and sinks
The variations of coefficients related to Eq. (3) can be used to get insights into the general chemical behavior under current atmospheric conditions, as well as into the mechanisms of sulfuric acid formation and losses in various environments. The contribution of different terms in different locations seem to vary significantly. The new loss term taking into account clustering starting from dimer formation needs to be taken into account in all the environments in daytime. On the other hand, without alkene term it is in practice impossible to get nighttime concentrations correct.
In Table 2, we have presented the fitted coefficients (Eq. 3) for all our sites, whereas the contributions of the different terms in the balance equation are given during daytime in Fig. 11 and Table 3. The contribution of the various source and sink terms to the change of H2SO4 concentrations are determined using Eq. (2). The median-derived k1, k2 and k3 values, together with the measured H2SO4, CS, trace gases and GlobRad per site, were used to calculate each of the terms. Source term 1 refers to k1 × GlobRad × [SO2], source term 2 refers to k2 × [O3] × [Alkene] × [SO2], sink term 3 refers to k3 × [H2SO4]2 and sink term 4 refers to CS × [H2SO4]. The contribution of each term is then calculated as the median or percentiles of the normalized term to the sum of all terms. The variability of the coefficients (Table 2), as well as the relative contributions of each term to the change in sulfuric acid concentration (Table 3), could give valuable information on the mechanisms resulting in sulfuric acid formation and losses. At steady state (Eq. 2), the sources and sinks are in balance with each other during both daytime and nighttime, but there were clear differences in the individual contributions. For instance, a variation in k1 could be due to variations in OH sources and sinks. Although in urban locations OH sinks are expected to be higher and therefore k1 to be lower, additional sources of OH are available in such locations, for example HONO (Zhang et al., 2019). The alkene and Criegee intermediates terms was found to be an important H2SO4 source (Figs. 1, 2, 7 and 8), as without it we are not able predict night or morning concentrations of H2SO4 properly. The alkene source term contributed up to almost 100 % of the H2SO4 sources during nighttime in Beijing and up to 90 % of the sources during nighttime in Hyytiälä (Fig. 12). The Criegee intermediates term showed its importance mostly when global radiation is low, not only in nighttime but also during winter (Fig. 12) in both Hyytiälä and Beijing. It is important to note here that Criegee intermediates vary between locations, and they also form in different yield percentages from different alkenes (Novelli et al., 2017; Sipilä et al., 2014). These stabilized Criegee intermediates also react differently under different environmental conditions.
The CS term had the highest contribution to the total sink in Hyytiälä. Its contribution decreased when moving towards more polluted environments (Fig. 11) to become regardless of the relatively high condensation sink in Megacities, smaller in Beijing than that of the cluster sink term (Laakso et al., 2006; Monkkonen et al., 2004, 2005; Yao et al., 2018). This observation might be attributed to decreased effectiveness of condensation sink in more polluted environments (Kulmala et al., 2017), but also to increased contribution of the clustering sink term in such environments where the concentration of stabilizing bases is highest, particularly in daytime (Yao et al., 2018; Yan et al., 2018). It should be noted that measurements of ammonia and similar bases are rare, so their exact contribution is difficult to estimate. The cluster term is found to contribute most during spring daytime in Hyytiälä (Fig. 12a and c), which is the time window during which clustering and thus new particle formation events happen (Dada et al., 2017, 2018). The same is observed for Beijing, where the clustering term contributed up to 70 % of the total sink terms during daytime (Fig. 12d), especially during summer when the CS is lowest (Deng et al., 2020).
Sulfuric acid is a key gas-phase compound linked to secondary aerosol production in the atmosphere. The concentration of sulfuric acid in the gas phase is governed by several sources and sinks. In this paper we defined the sources and sinks of H2SO4 and derived a physically and chemically sound proxy for the sulfuric acid concentration using measurements at four different locations, including a boreal forest environment (Hyytiälä, Finland), a rural Mediterranean site (Agia Marina, Cyprus), an urban area (Budapest, Hungary) and a megacity (Beijing, China). When describing the change in gas-phase sulfuric acid concentration, we took into account two source terms: (1) photochemical oxidation of sulfur dioxide and (2) sulfuric acid originating from alkene and ozone reactions and the associated stabilized Criegee intermediates pathway. For the sink terms, we considered (3) the loss rate to the preexisting aerosol described by condensation sink and (4) the loss rate of sulfuric acid monomer due to the clustering process.
In general, the variation in the environmental conditions and the difference in concentrations of air pollutants affects the coefficients derived, and therefore it is important to derive location-specific coefficients. The derived coefficients give insights into the general chemical behavior and into the mechanisms of sulfuric acid formation and losses in various environments. As there are improvements from previously derived proxies, without the alkene H2SO4 formation pathway, it is in practice impossible to get nighttime concentrations. On the other hand, the additional loss term taking into account clustering starting from dimer formation needs to be taken into account in all the environments, especially those with higher cluster formation probabilities due to availability of stabilizing bases.
The coefficients derived do not differ substantially between the different locations. The proxy could therefore be used at locations with no prior H2SO4 measurements, provided that the environmental conditions are approximately similar to those in one of the four sites described here. More specifically, the proxies could be utilized to derive long-term data sets for H2SO4 concentrations, which would be essential in performing various kinds of trend analyses. In order to derive the long term sulfuric acid concentrations, we recommend deriving in-house coefficients in cases where sulfuric acid concentrations are directly measured rather than using the ones from already-derived studies. The choice of equation depends on the availability of the data on site. In cases where alkenes or their proxies are measured and sulfuric acid is measured, derivation of the coefficients should be based on Eq. (2). In cases where neither alkenes nor their proxies are measured but sulfuric acid is measured, the coefficients and therefore the proxy for daytime only can be derived using Eq. (4). In cases where sulfuric acid is not measured, one can calculate the sulfuric acid proxy using Eqs. (2) or (4), depending on whether the alkene data are available or not, respectively, using the coefficients suggested in Table 1 that are relevant to the site of interest. In order to make the best choice for the coefficients, Fig. 9 can be followed in order to decide which description fits the location of interest best. For example, in cases where the condensation sink is between 2 × 10⁻³ and 6 × 10⁻³ s−1 and the SO2 concentration is lower than 2 × 10⁹ molecules cm−3, coefficients of Hyytiälä or the boreal forest are to be used.
The data used in the paper are available from the first author at lubna.dada@helsinki.fi. The plug and play MATLAB code used to calculate a location-specific H2SO4 proxy using the coefficients derived in this paper can be found at https://doi.org/10.5281/zenodo.4048329 (Dada, 2020).
The supplement related to this article is available online at: https://doi.org/10.5194/acp-20-11747-2020-supplement.
MK came up with the idea. LD, IY, CL and RB analyzed the data. YG, CD, RY, CY, LY, JJ, YL, BC, ZL and YW performed the measurements in Beijing and preprocessed the raw data. NS, TJ, MS and TP performed the measurements in Hyytiälä and preprocessed the raw data. LD, TN, JK, KRD, DS, TH, PP, FB, VMK and MK provided useful discussion and ideas. IS, TW, RB and TJ performed the measurements in Budapest and preprocessed the raw data. MP, JS, RB and TJ performed the measurements in Agia Marina and preprocessed the raw data. RCT, TJ and MS performed the sulfuric acid measurements in Helsinki and preprocessed the raw data. LD and KRD introduced the error and bootstrap resampling analyses. LD, VMK and MK wrote the manuscript. All co-authors contributed to reviewing the manuscript and to the discussions related to it.
The authors declare that they have no conflict of interest.
We thank Veronika Varga and Zoltán Németh of the Eötvös University for their help in the experimental work in Budapest, Kimmo Neitola and Tiia Laurila for their help at Agia Marina, and Lauriane Quéléver and Tuuli Lehmusjärvi for their help in setting up the sulfuric acid measurement in Helsinki. This publication has been produced within the framework of the EMME-CARE project, which has received funding from the European Union's Horizon 2020 Research and Innovation Programme (under grant agreement no. 856612) and the Government of Cyprus. The sole responsibility of this publication lies with the author. The European Union is not responsible for any use that may be made of the information contained therein.
This project has received funding from the National Natural Science Foundation of China (project no. 41877306), the National Key R&D Program of China (grant no. 2017YFC0209503), and the National Research, Development and Innovation Office, Hungary (grant nos. K116788 and K132254). This research has been supported by the European Research Council under the following programs: ATM-GTP (grant no. 742206), CHAPAs (grant no. 850614), EMME-CARE (grant no. 856612), ACTRIS PPP (grant no. 739530), ACTRIS-2 (grant no. 654109), and GASPARCON (grant no. 714621). It has also been supported by the Academy of Finland (grant nos. 307331, 316114, 311932, and 296628).
This paper was edited by Kari Lehtinen and reviewed by Santtu Mikkonen and one anonymous referee.
Aalto, P., Hameri, K., Becker, E., Weber, R., Salm, J., Makela, J. M., Hoell, C., O'Dowd, C. D., Karlsson, H., Hansson, H. C., Vakeva, M., Koponen, I. K., Buzorius, G., and Kulmala, M.: Physical characterization of aerosol particles during nucleation events, Tellus B, 53, 344–358, https://doi.org/10.1034/j.1600-0889.2001.530403.x, 2001.
Almeida, J., Schobesberger, S., Kurten, A., Ortega, I. K., Kupiainen-Maatta, O., Praplan, A. P., Adamov, A., Amorim, A., Bianchi, F., Breitenlechner, M., David, A., Dommen, J., Donahue, N. M., Downard, A., Dunne, E., Duplissy, J., Ehrhart, S., Flagan, R. C., Franchin, A., Guida, R., Hakala, J., Hansel, A., Heinritzi, M., Henschel, H., Jokinen, T., Junninen, H., Kajos, M., Kangasluoma, J., Keskinen, H., Kupc, A., Kurten, T., Kvashin, A. N., Laaksonen, A., Lehtipalo, K., Leiminger, M., Leppa, J., Loukonen, V., Makhmutov, V., Mathot, S., McGrath, M. J., Nieminen, T., Olenius, T., Onnela, A., Petaja, T., Riccobono, F., Riipinen, I., Rissanen, M., Rondo, L., Ruuskanen, T., Santos, F. D., Sarnela, N., Schallhart, S., Schnitzhofer, R., Seinfeld, J. H., Simon, M., Sipila, M., Stozhkov, Y., Stratmann, F., Tome, A., Trostl, J., Tsagkogeorgas, G., Vaattovaara, P., Viisanen, Y., Virtanen, A., Vrtala, A., Wagner, P. E., Weingartner, E., Wex, H., Williamson, C., Wimmer, D., Ye, P. L., Yli-Juuti, T., Carslaw, K. S., Kulmala, M., Curtius, J., Baltensperger, U., Worsnop, D. R., Vehkamaki, H., and Kirkby, J.: Molecular understanding of sulphuric acid-amine particle nucleation in the atmosphere, Nature, 502, 359–363, https://doi.org/10.1038/nature12663, 2013.
Baalbaki, R., Pikridas M., Jokinen T., Dada L., Ahonen L., Lehtipalo K., Petäjä T., Sciare J., and Kulmala M.: Towards understanding the mechanisms of new particle formation in the Eastern Mediterranean, in preparation, 2020.
Berresheim, H., Elste, T., Tremmel, H. G., Allen, A. G., Hansson, H. C., Rosman, K., Dal Maso, M., Makela, J. M., Kulmala, M., and O'Dowd, C. D.: Gas-aerosol relationships of H2SO4, MSA, and OH: Observations in the coastal marine boundary layer at Mace Head, Ireland, J. Geophys. Res.-Atmos., 107, 8100, https://doi.org/10.1029/2000jd000229, 2002.
Dada, L.: Sulfuric acid proxy calculation using coefficients derived from four contrasting environments, Zenodo, https://doi.org/10.5281/zenodo.4048329, 2020.
Dada, L., Paasonen, P., Nieminen, T., Buenrostro Mazon, S., Kontkanen, J., Peräkylä, O., Lehtipalo, K., Hussein, T., Petäjä, T., Kerminen, V.-M., Bäck, J., and Kulmala, M.: Long-term analysis of clear-sky new particle formation events and nonevents in Hyytiälä, Atmos. Chem. Phys., 17, 6227–6241, https://doi.org/10.5194/acp-17-6227-2017, 2017.
Dada, L., Chellapermal, R., Buenrostro Mazon, S., Paasonen, P., Lampilahti, J., Manninen, H. E., Junninen, H., Petäjä, T., Kerminen, V.-M., and Kulmala, M.: Refined classification and characterization of atmospheric new-particle formation events using air ions, Atmos. Chem. Phys., 18, 17883–17893, https://doi.org/10.5194/acp-18-17883-2018, 2018.
Deng, C., Fu, Y., Dada, L., Yan, C., Cai, R., Yang, D., Zhou, Y., Yin, R., Lu, Y., Li, X., Qiao, X., Fan, X., Nie, W., Kontkanen, J., Kangasluoma, J., Chu, B., Ding, A., Kerminen, V.-M., Paasonen, P., Worsnop, D. R., Bianchi, F., Liu, Y., Zheng, J., Wang, L., Kulmala, M., and Jiang, J.: Seasonal Characteristics of New Particle Formation and Growth in Urban Beijing, Environ. Sci. Technol., 54, 8547–8557, https://doi.org/10.1021/acs.est.0c00808, 2020.
Dunne, E. M., Gordon, H., Kurten, A., Almeida, J., Duplissy, J., Williamson, C., Ortega, I. K., Pringle, K. J., Adamov, A., Baltensperger, U., Barmet, P., Benduhn, F., Bianchi, F., Breitenlechner, M., Clarke, A., Curtius, J., Dommen, J., Donahue, N. M., Ehrhart, S., Flagan, R. C., Franchin, A., Guida, R., Hakala, J., Hansel, A., Heinritzi, M., Jokinen, T., Kangasluoma, J., Kirkby, J., Kulmala, M., Kupc, A., Lawler, M. J., Lehtipalo, K., Makhmutov, V., Mann, G., Mathot, S., Merikanto, J., Miettinen, P., Nenes, A., Onnela, A., Rap, A., Reddington, C. L. S., Riccobono, F., Richards, N. A. D., Rissanen, M. P., Rondo, L., Sarnela, N., Schobesberger, S., Sengupta, K., Simon, M., Sipilaa, M., Smith, J. N., Stozkhov, Y., Tome, A., Trostl, J., Wagner, P. E., Wimmer, D., Winkler, P. M., Worsnop, D. R., and Carslaw, K. S.: Global atmospheric particle formation from CERN CLOUD measurements, Science, 354, 1119–1124, https://doi.org/10.1126/science.aaf2649, 2016.
Efron, B. and Tibshirani, R. J.: An introduction to the bootstrap, CRC Press, 29 West 35th Street New York, NY 10001, USA, 1994.
Eisele, F. L. and Tanner, D. J.: Measurement of the Gas-Phase Concentration of H2SO4 and Methane Sulfonic-Acid and Estimates of H2SO4 Production and Loss in the Atmosphere, J. Geophys. Res.-Atmos., 98, 9001–9010, https://doi.org/10.1029/93jd00031, 1993.
Erupe, M. E., Viggiano, A. A., and Lee, S.-H.: The effect of trimethylamine on atmospheric nucleation involving H2SO4, Atmos. Chem. Phys., 11, 4767–4775, https://doi.org/10.5194/acp-11-4767-2011, 2011.
Gao, W., Tan, G., Hong, Y., Li, M., Nian, H., Guo, C., Huang, Z., Fu, Z., Dong, J., Xu, X., Cheng, P., and Zhou, Z.: Development of portable single photon ionization time-of-flight mass spectrometer combined with membrane inlet, Int. J. Mass Spectrom., 334, 8–12, https://doi.org/10.1016/j.ijms.2012.09.003, 2013.
Gordon, H., Kirkby, J., Baltensperger, U., Bianchi, F., Breitenlechner, M., Curtius, J., Dias, A., Dommen, J., Donahue, N. M., Dunne, E. M., Duplissy, J., Ehrhart, S., Flagan, R. C., Frege, C., Fuchs, C., Hansel, A., Hoyle, C. R., Kulmala, M., Kurten, A., Lehtipalo, K., Makhmutov, V., Molteni, U., Rissanen, M. P., Stozkhov, Y., Trostl, J., Tsagkogeorgas, G., Wagner, R., Williamson, C., Wimmer, D., Winkler, P. M., Yan, C., and Carslaw, K. S.: Causes and importance of new particle formation in the present-day and preindustrial atmospheres, J. Geophys. Res.-Atmos., 122, 8739–8760, https://doi.org/10.1002/2017jd026844, 2017.
Guo, S., Hu, M., Zamora, M. L., Peng, J., Shang, D., Zheng, J., Du, Z., Wu, Z., Shao, M., Zeng, L., Molina, M. J., and Zhang, R.: Elucidating severe urban haze formation in China, P. Natl. Acad. Sci. USA, 111, 17373–17378, https://doi.org/10.1073/pnas.1419604111, 2014.
Hakola, H., Hellén, H., Hemmilä, M., Rinne, J., and Kulmala, M.: In situ measurements of volatile organic compounds in a boreal forest, Atmos. Chem. Phys., 12, 11665–11678, https://doi.org/10.5194/acp-12-11665-2012, 2012.
Hari, P. and Kulmala, M.: Station for measuring ecosystem-atmosphere relations (SMEAR II), Boreal Environ. Res., 10, 315–322, 2005.
Hellén, H., Praplan, A. P., Tykkä, T., Ylivinkka, I., Vakkari, V., Bäck, J., Petäjä, T., Kulmala, M., and Hakola, H.: Long-term measurements of volatile organic compounds highlight the importance of sesquiterpenes for the atmospheric chemistry of a boreal forest, Atmos. Chem. Phys., 18, 13839–13863, https://doi.org/10.5194/acp-18-13839-2018, 2018.
Hussein, T., Martikainen, J., Junninen, H., Sogacheva, L., Wagner, R., Dal Maso, M., Riipinen, I., Aalto, P. P., and Kulmala, M.: Observation of regional new particle formation in the urban atmosphere, Tellus B, 60, 509–521, 2008.
Jen, C. N., McMurry, P. H., and Hanson, D. R.: Stabilization of sulfuric acid dimers by ammonia, methylamine, dimethylamine, and trimethylamine, J. Geophys. Res.-Atmos., 119, 7502–7514, 2014.
Jokinen, T., Sipilä, M., Junninen, H., Ehn, M., Lönn, G., Hakala, J., Petäjä, T., Mauldin III, R. L., Kulmala, M., and Worsnop, D. R.: Atmospheric sulphuric acid and neutral cluster measurements using CI-APi-TOF, Atmos. Chem. Phys., 12, 4117–4125, https://doi.org/10.5194/acp-12-4117-2012, 2012.
Junninen, H., Ehn, M., Petäjä, T., Luosujärvi, L., Kotiaho, T., Kostiainen, R., Rohner, U., Gonin, M., Fuhrer, K., Kulmala, M., and Worsnop, D. R.: A high-resolution mass spectrometer to measure atmospheric ion composition, Atmos. Meas. Tech., 3, 1039–1053, https://doi.org/10.5194/amt-3-1039-2010, 2010.
Kerminen, V.-M., Paramonov, M., Anttila, T., Riipinen, I., Fountoukis, C., Korhonen, H., Asmi, E., Laakso, L., Lihavainen, H., Swietlicki, E., Svenningsson, B., Asmi, A., Pandis, S. N., Kulmala, M., and Petäjä, T.: Cloud condensation nuclei production associated with atmospheric nucleation: a synthesis based on existing literature and new results, Atmos. Chem. Phys., 12, 12037–12059, https://doi.org/10.5194/acp-12-12037-2012, 2012.
Kerminen, V.-M., Chen, X., Vakkari, V., Petäjä, T., Kulmala, M., and Bianchi, F.: Atmospheric new particle formation and growth: review of field observations, Environ. Res. Lett., 13, 103003, https://doi.org/10.1088/1748-9326/aadf3c, 2018.
Kulmala, M., Vehkamäki, H., Petäjä, T., Dal Maso, M., Lauri, A., Kerminen, V.-M., Birmili, W., and McMurry, P. H.: Formation and growth rates of ultrafine atmospheric particles: a review of observations, J. Aerosol Sci., 35, 143–176, https://doi.org/10.1016/j.jaerosci.2003.10.003, 2004.
Kulmala, M., Petaja, T., Nieminen, T., Sipila, M., Manninen, H. E., Lehtipalo, K., Dal Maso, M., Aalto, P. P., Junninen, H., Paasonen, P., Riipinen, I., Lehtinen, K. E. J., Laaksonen, A., and Kerminen, V. M.: Measurement of the nucleation of atmospheric aerosol particles, Nat. Protoc., 7, 1651–1667, https://doi.org/10.1038/nprot.2012.091, 2012.
Kulmala, M., Kontkanen, J., Junninen, H., Lehtipalo, K., Manninen, H. E., Nieminen, T., Petaja, T., Sipila, M., Schobesberger, S., Rantala, P., Franchin, A., Jokinen, T., Jarvinen, E., Aijala, M., Kangasluoma, J., Hakala, J., Aalto, P. P., Paasonen, P., Mikkila, J., Vanhanen, J., Aalto, J., Hakola, H., Makkonen, U., Ruuskanen, T., Mauldin, R. L., Duplissy, J., Vehkamaki, H., Back, J., Kortelainen, A., Riipinen, I., Kurten, T., Johnston, M. V., Smith, J. N., Ehn, M., Mentel, T. F., Lehtinen, K. E. J., Laaksonen, A., Kerminen, V. M., and Worsnop, D. R.: Direct Observations of Atmospheric Aerosol Nucleation, Science, 339, 943–946, https://doi.org/10.1126/science.1227385, 2013.
Kulmala, M., Kerminen, V. M., Petaja, T., Ding, A. J., and Wang, L.: Atmospheric gas-to-particle conversion: why NPF events are observed in megacities?, Faraday Discuss., 200, 271–288, https://doi.org/10.1039/c6fd00257a, 2017.
Kulmala, M., Dada, L., Dällenbach, K., Yan, C., Stolzenburg, D., Kontkanen, J., Ezhova, E., Hakala, S., Tuovinen, S., Kokkonen, T., Kurppa, M., Cai, R., Zhou, Y., Yin, R., Baalbaki, R., Chan, T., Chu, B., Deng, C., Fu, Y., Ge, M., He, H., Heikkinen, L., Junninen, H., Nei, W., Rusanen, A., Vakkari, V., Wang, Y., Wang, L., yao, l., Zheng, J., Kujansuu, J., Kangasluoma, J., Petäjä, T., Paasonen, P., Järvi, L., Worsnop, D., Ding, A., Liu, Y., Jiang, J., Bianchi, F., Yang, G., Liu, Y., Lu, Y., and Kerminen, V.-M.: Is reducing new particle formation a plausible solution to mitigate particulate air pollution in Beijing and other Chinese megacities?, Faraday Discuss., https://doi.org/10.1039/D0FD00078G, accepted, 2020.
Kurten, A., Rondo, L., Ehrhart, S., and Curtius, J.: Calibration of a chemical ionization mass spectrometer for the measurement of gaseous sulfuric acid, Phys. Chem. A, 116, 6375–6386, https://doi.org/10.1021/jp212123n, 2012.
Kürten, A., Williamson, C., Almeida, J., Kirkby, J., and Curtius, J.: On the derivation of particle nucleation rates from experimental formation rates, Atmos. Chem. Phys., 15, 4063–4075, https://doi.org/10.5194/acp-15-4063-2015, 2015.
Laakso, L., Petäjä, T., Lehtinen, K. E. J., Kulmala, M., Paatero, J., Hőrrak, U., Tammet, H., and Joutsensaari, J.: Ion production rate in a boreal forest based on ion, particle and radiation measurements, Atmos. Chem. Phys., 4, 1933–1943, https://doi.org/10.5194/acp-4-1933-2004, 2004.
Laakso, L., Koponen, I. K., Monkkonen, P., Kulmala, M., Kerminen, V. M., Wehner, B., Wiedensohler, A., Wu, Z. J., and Hu, M.: Aerosol particles in the developing world; A comparison between New Delhi in India and Beijing in China, Water Air Soil Poll., 173, 5–20, https://doi.org/10.1007/s11270-005-9018-5, 2006.
Lagarias, J. C., Reeds, J. A., Wright, M. H., and Wright, P. E.: Convergence Properties of the Nelder–Mead Simplex Method in Low Dimensions, SIAM J. Optimiz., 9, 112–147, https://doi.org/10.1137/s1052623496303470, 1998.
Lehtipalo, K., Yan, C., Dada, L., Bianchi, F., Xiao, M., Wagner, R., Stolzenburg, D., Ahonen, L. R., Amorim, A., Baccarini, A., Bauer, P. S., Baumgartner, B., Bergen, A., Bernhammer, A.-K., Breitenlechner, M., Brilke, S., Buchholz, A., Mazon, S. B., Chen, D., Chen, X., Dias, A., Dommen, J., Draper, D. C., Duplissy, J., Ehn, M., Finkenzeller, H., Fischer, L., Frege, C., Fuchs, C., Garmash, O., Gordon, H., Hakala, J., He, X., Heikkinen, L., Heinritzi, M., Helm, J. C., Hofbauer, V., Hoyle, C. R., Jokinen, T., Kangasluoma, J., Kerminen, V.-M., Kim, C., Kirkby, J., Kontkanen, J., Kürten, A., Lawler, M. J., Mai, H., Mathot, S., Mauldin, R. L., Molteni, U., Nichman, L., Nie, W., Nieminen, T., Ojdanic, A., Onnela, A., Passananti, M., Petäjä, T., Piel, F., Pospisilova, V., Quéléver, L. L. J., Rissanen, M. P., Rose, C., Sarnela, N., Schallhart, S., Schuchmann, S., Sengupta, K., Simon, M., Sipilä, M., Tauber, C., Tomé, A., Tröstl, J., Väisänen, O., Vogel, A. L., Volkamer, R., Wagner, A. C., Wang, M., Weitz, L., Wimmer, D., Ye, P., Ylisirniö, A., Zha, Q., Carslaw, K. S., Curtius, J., Donahue, N. M., Flagan, R. C., Hansel, A., Riipinen, I., Virtanen, A., Winkler, P. M., Baltensperger, U., Kulmala, M., and Worsnop, D. R.: Multicomponent new particle formation from sulfuric acid, ammonia, and biogenic vapors, Sci. Adv., 4, eaau5363, https://doi.org/10.1126/sciadv.aau5363, 2018.
Liu, J., Jiang, J., Zhang, Q., Deng, J., and Hao, J.: A spectrometer for measuring particle size distributions in the range of 3 nm to 10 µm, Front. Env. Sci. Eng., 10, 63–72, https://doi.org/10.1007/s11783-014-0754-x, 2016.
Lu, Y., Yan, C., Fu, Y., Chen, Y., Liu, Y., Yang, G., Wang, Y., Bianchi, F., Chu, B., Zhou, Y., Yin, R., Baalbaki, R., Garmash, O., Deng, C., Wang, W., Liu, Y., Petäjä, T., Kerminen, V.-M., Jiang, J., Kulmala, M., and Wang, L.: A proxy for atmospheric daytime gaseous sulfuric acid concentration in urban Beijing, Atmos. Chem. Phys., 19, 1971–1983, https://doi.org/10.5194/acp-19-1971-2019, 2019.
Ma, F., Xie, H.-B., Elm, J., Shen, J., Chen, J., and Vehkamäki, H.: Piperazine Enhancing Sulfuric Acid-Based New Particle Formation: Implications for the Atmospheric Fate of Piperazine, Environ. Sci. Technol., 53, 8785–8795, https://doi.org/10.1021/acs.est.9b02117, 2019.
Mauldin, R. L., Berndt, T., Sipila, M., Paasonen, P., Petaja, T., Kim, S., Kurten, T., Stratmann, F., Kerminen, V. M., and Kulmala, M.: A new atmospherically relevant oxidant of sulphur dioxide, Nature, 488, 193–196, https://doi.org/10.1038/nature11278, 2012.
McElreath, R.: Statistical rethinking: A Bayesian course with examples in R and Stan, Chapman and Hall/CRC, Taylor & Francis Group 6000 Broken Sound Parkway NW, Suite 300 Boca Raton, FL 33487-2742, USA, 2018.
Merikanto, J., Spracklen, D. V., Mann, G. W., Pickering, S. J., and Carslaw, K. S.: Impact of nucleation on global CCN, Atmos. Chem. Phys., 9, 8601–8616, https://doi.org/10.5194/acp-9-8601-2009, 2009.
Mikkonen, S., Romakkaniemi, S., Smith, J. N., Korhonen, H., Petäjä, T., Plass-Duelmer, C., Boy, M., McMurry, P. H., Lehtinen, K. E. J., Joutsensaari, J., Hamed, A., Mauldin III, R. L., Birmili, W., Spindler, G., Arnold, F., Kulmala, M., and Laaksonen, A.: A statistical proxy for sulphuric acid concentration, Atmos. Chem. Phys., 11, 11319–11334, https://doi.org/10.5194/acp-11-11319-2011, 2011.
Mikkonen, S., Németh, Z., Varga, V., Weidinger, T., Leinonen, V., Yli-Juuti, T., and Salma, I.: Decennial time trends and diurnal patterns of particle number concentrations in a Central European city between 2008 and 2018, Atmos. Chem. Phys. Discuss., https://doi.org/10.5194/acp-2020-305, in review, 2020.
Monkkonen, P., Koponen, I. K., Lehtinen, K. E. J., Uma, R., Srinivasan, D., Hameri, K., and Kulmala, M.: Death of nucleation and Aitken mode particles: observations at extreme atmospheric conditions and their theoretical explanation, J. Aerosol Sci., 35, 781–787, https://doi.org/10.1016/j.jaerosci.2003.12.004, 2004.
Mönkkönen, P., Koponen, I. K., Lehtinen, K. E. J., Hämeri, K., Uma, R., and Kulmala, M.: Measurements in a highly polluted Asian mega city: observations of aerosol number size distribution, modal parameters and nucleation events, Atmos. Chem. Phys., 5, 57–66, https://doi.org/10.5194/acp-5-57-2005, 2005.
Nieminen, T., Kerminen, V.-M., Petäjä, T., Aalto, P. P., Arshinov, M., Asmi, E., Baltensperger, U., Beddows, D. C. S., Beukes, J. P., Collins, D., Ding, A., Harrison, R. M., Henzing, B., Hooda, R., Hu, M., Hőrrak, U., Kivekäs, N., Komsaare, K., Krejci, R., Kristensson, A., Laakso, L., Laaksonen, A., Leaitch, W. R., Lihavainen, H., Mihalopoulos, N., Németh, Z., Nie, W., O'Dowd, C., Salma, I., Sellegri, K., Svenningsson, B., Swietlicki, E., Tunved, P., Ulevicius, V., Vakkari, V., Vana, M., Wiedensohler, A., Wu, Z., Virtanen, A., and Kulmala, M.: Global analysis of continental boundary layer new particle formation based on long-term measurements, Atmos. Chem. Phys., 18, 14737–14756, https://doi.org/10.5194/acp-18-14737-2018, 2018.
Novelli, A., Hens, K., Tatum Ernest, C., Martinez, M., Nölscher, A. C., Sinha, V., Paasonen, P., Petäjä, T., Sipilä, M., Elste, T., Plass-Dülmer, C., Phillips, G. J., Kubistin, D., Williams, J., Vereecken, L., Lelieveld, J., and Harder, H.: Estimating the atmospheric concentration of Criegee intermediates and their possible interference in a FAGE-LIF instrument, Atmos. Chem. Phys., 17, 7807–7826, https://doi.org/10.5194/acp-17-7807-2017, 2017.
Petäjä, T., Mauldin, III, R. L., Kosciuch, E., McGrath, J., Nieminen, T., Paasonen, P., Boy, M., Adamov, A., Kotiaho, T., and Kulmala, M.: Sulfuric acid and OH concentrations in a boreal forest site, Atmos. Chem. Phys., 9, 7435–7448, https://doi.org/10.5194/acp-9-7435-2009, 2009.
Pikridas, M., Vrekoussis, M., Sciare, J., Kleanthous, S., Vasiliadou, E., Kizas, C., Savvides, C., and Mihalopoulos, N.: Spatial and temporal (short and long-term) variability of submicron, fine and sub-10 µm particulate matter (PM1, PM2.5, PM10) in Cyprus, Atmos. Environ., 191, 79–93, https://doi.org/10.1016/j.atmosenv.2018.07.048, 2018.
Rinne, J., Ruuskanen, T. M., Reissell, A., Taipale, R., Hakola, H., and Kulmala, M.: On-line PTR-MS measurements of atmospheric concentrations of volatile organic compounds in a European boreal forest ecosystem, Boreal Environ. Res., 10, 425–436, 2005.
Rohrer, F. and Berresheim, H.: Strong correlation between levels of tropospheric hydroxyl radicals and solar ultraviolet radiation, Nature, 442, 184–187, https://doi.org/10.1038/nature04924, 2006.
Salma, I. and Németh, Z.: Dynamic and timing properties of new aerosol particle formation and consecutive growth events, Atmos. Chem. Phys., 19, 5835–5852, https://doi.org/10.5194/acp-19-5835-2019, 2019.
Salma, I., Németh, Z., Kerminen, V.-M., Aalto, P., Nieminen, T., Weidinger, T., Molnár, Á., Imre, K., and Kulmala, M.: Regional effect on urban atmospheric nucleation, Atmos. Chem. Phys., 16, 8715–8728, https://doi.org/10.5194/acp-16-8715-2016, 2016a.
Salma, I., Németh, Z., Weidinger, T., Kovács, B., and Kristóf, G.: Measurement, growth types and shrinkage of newly formed aerosol particles at an urban research platform, Atmos. Chem. Phys., 16, 7837–7851, https://doi.org/10.5194/acp-16-7837-2016, 2016b.
Sarnela, N., Jokinen, T., Nieminen, T., Lehtipalo, K., Junninen, H., Kangasluoma, J., Hakala, J., Taipale, R., Schobesberger, S., Sipila, M., Larnimaa, K., Westerholm, H., Heijari, J., Kerminen, V. M., Petaja, T., and Kulmala, M.: Sulphuric acid and aerosol particle production in the vicinity of an oil refinery, Atmos. Environ., 119, 156–166, https://doi.org/10.1016/j.atmosenv.2015.08.033, 2015.
Sihto, S.-L., Kulmala, M., Kerminen, V.-M., Dal Maso, M., Petäjä, T., Riipinen, I., Korhonen, H., Arnold, F., Janson, R., Boy, M., Laaksonen, A., and Lehtinen, K. E. J.: Atmospheric sulphuric acid and aerosol formation: implications from atmospheric measurements for nucleation and early growth mechanisms, Atmos. Chem. Phys., 6, 4079–4091, https://doi.org/10.5194/acp-6-4079-2006, 2006.
Sipilä, M., Berndt, T., Petäjä, T., Brus, D., Vanhanen, J., Stratmann, F., Patokoski, J., Mauldin, R. L., Hyvärinen, A.-P., Lihavainen, H., and Kulmala, M.: The Role of Sulfuric Acid in Atmospheric Nucleation, Science, 327, 1243–1246, https://doi.org/10.1126/science.1180315, 2010.
Sipilä, M., Jokinen, T., Berndt, T., Richters, S., Makkonen, R., Donahue, N. M., Mauldin III, R. L., Kurtén, T., Paasonen, P., Sarnela, N., Ehn, M., Junninen, H., Rissanen, M. P., Thornton, J., Stratmann, F., Herrmann, H., Worsnop, D. R., Kulmala, M., Kerminen, V.-M., and Petäjä, T.: Reactivity of stabilized Criegee intermediates (sCIs) from isoprene and monoterpene ozonolysis toward SO2 and organic acids, Atmos. Chem. Phys., 14, 12143–12153, https://doi.org/10.5194/acp-14-12143-2014, 2014.
Spracklen, D. V., Carslaw, K. S., Kulmala, M., Kerminen, V. M., Sihto, S. L., Riipinen, I., Merikanto, J., Mann, G. W., Chipperfield, M. P., and Wiedensohler, A.: Contribution of particle formation to global cloud condensation nuclei concentrations, Geophy. Res. Lett., 35, L06808, https://doi.org/10.1029/2007GL033038, 2008.
Spracklen, D. V., Carslaw, K. S., Merikanto, J., Mann, G. W., Reddington, C. L., Pickering, S., Ogren, J. A., Andrews, E., Baltensperger, U., Weingartner, E., Boy, M., Kulmala, M., Laakso, L., Lihavainen, H., Kivekäs, N., Komppula, M., Mihalopoulos, N., Kouvarakis, G., Jennings, S. G., O'Dowd, C., Birmili, W., Wiedensohler, A., Weller, R., Gras, J., Laj, P., Sellegri, K., Bonn, B., Krejci, R., Laaksonen, A., Hamed, A., Minikin, A., Harrison, R. M., Talbot, R., and Sun, J.: Explaining global surface aerosol number concentrations in terms of primary emissions and particle formation, Atmos. Chem. Phys., 10, 4775–4793, https://doi.org/10.5194/acp-10-4775-2010, 2010.
Taipale, R., Ruuskanen, T. M., Rinne, J., Kajos, M. K., Hakola, H., Pohja, T., and Kulmala, M.: Technical Note: Quantitative long-term measurements of VOC concentrations by PTR-MS – measurement, calibration, and volume mixing ratio calculation methods, Atmos. Chem. Phys., 8, 6681–6698, https://doi.org/10.5194/acp-8-6681-2008, 2008.
Weber, R. J., Marti, J. J., McMurry, P. H., Eisele, F. L., Tanner, D. J., and Jefferson, A.: Measured Atmospheric New Particle Formation Rates: Implications For Nucleation Mechanisms, Chem. Eng. Commun., 151, 53–64, https://doi.org/10.1080/00986449608936541, 1996.
Yan, C., Dada, L., Rose, C., Jokinen, T., Nie, W., Schobesberger, S., Junninen, H., Lehtipalo, K., Sarnela, N., Makkonen, U., Garmash, O., Wang, Y., Zha, Q., Paasonen, P., Bianchi, F., Sipilä, M., Ehn, M., Petäjä, T., Kerminen, V.-M., Worsnop, D. R., and Kulmala, M.: The role of H2SO4−NH3 anion clusters in ion-induced aerosol nucleation mechanisms in the boreal forest, Atmos. Chem. Phys., 18, 13231–13243, https://doi.org/10.5194/acp-18-13231-2018, 2018.
Yang, D., Zhang, S., Niu, T., Wang, Y., Xu, H., Zhang, K. M., and Wu, Y.: High-resolution mapping of vehicle emissions of atmospheric pollutants based on large-scale, real-world traffic datasets, Atmos. Chem. Phys., 19, 8831–8843, https://doi.org/10.5194/acp-19-8831-2019, 2019.
Yao, L., Garmash, O., Bianchi, F., Zheng, J., Yan, C., Kontkanen, J., Junninen, H., Mazon, S. B., Ehn, M., Paasonen, P., Sipilä, M., Wang, M., Wang, X., Xiao, S., Chen, H., Lu, Y., Zhang, B., Wang, D., Fu, Q., Geng, F., Li, L., Wang, H., Qiao, L., Yang, X., Chen, J., Kerminen, V.-M., Petäjä, T., Worsnop, D. R., Kulmala, M., and Wang, L.: Atmospheric new particle formation from sulfuric acid and amines in a Chinese megacity, Science, 361, 278–281, https://doi.org/10.1126/science.aao4839, 2018.
Yao, L., Fan, X., Yan, C., Kurtén, T., Daellenbach, K. R., Wang, Y., Guo, Y., Li, C., Dada, L., Cai, J., Jun, T. Y., Zha, Q., Du, W., Yu, M., Zheng, F., Zhou, Y., Chan, T., Shen, J., Kujansuu, J. T., Kangasluoma, J., Jiang, J., Li, H., Wang, L., Worsnop, D. R., He, H., Petäjä, T., Kerminen, V.-M., Liu, Y., Chu, B., Kulmala, M., and Bianchi, F.: Unprecedented ambient sulphur trioxide (SO3) detection: possible formation mechanism and atmospheric implications, Environ. Sci. Technol. Lett., accepted, 2020.
Zhang, R., Khalizov, A., Wang, L., Hu, M., and Xu, W.: Nucleation and growth of nanoparticles in the atmosphere, Chem. Rev., 112, 1957–2011, 2011.
Zhang, W., Tong, S., Ge, M., An, J., Shi, Z., Hou, S., Xia, K., Qu, Y., Zhang, H., Chu, B., Sun, Y., and He, H.: Variations and sources of nitrous acid (HONO) during a severe pollution episode in Beijing in winter 2016, Sci. Total Environ., 648, 253–262, https://doi.org/10.1016/j.scitotenv.2018.08.133, 2019.
Zhou, Y., Dada, L., Liu, Y., Fu, Y., Kangasluoma, J., Chan, T., Yan, C., Chu, B., Daellenbach, K. R., Bianchi, F., Kokkonen, T. V., Liu, Y., Kujansuu, J., Kerminen, V.-M., Petäjä, T., Wang, L., Jiang, J., and Kulmala, M.: Variation of size-segregated particle number concentrations in wintertime Beijing, Atmos. Chem. Phys., 20, 1201–1216, https://doi.org/10.5194/acp-20-1201-2020, 2020.