the Creative Commons Attribution 4.0 License.
the Creative Commons Attribution 4.0 License.
 | 09 Oct 2020
Characterizing the spatiotemporal nitrogen stable isotopic composition of ammonia in vehicle plumes
Wendell W. Walters
Linlin Song
Jiajue Chai
Yunting Fang
Nadia Colombi
Meredith G. Hastings
Vehicle emissions have been identified as an important urban source of ammonia (NH3). However, there are large uncertainties regarding the contribution of vehicle emissions to urban NH3 budgets, as well as the role of NH3 in spatiotemporal fine particulate matter (PM2.5) formation and nitrogen (N) deposition patterns. The N stable isotopic composition (δ15N) may be a useful observational constraint to track NH3 emission sources and chemical processing, but previously reported vehicle δ15N(NH3) emission signatures have reported a wide range of values, indicating the need for further refinement. Here we have characterized δ15N(NH3) spatiotemporal variabilities from vehicle plumes in stationary and on-road measurements in the USA and China using an active NH3 collection technique demonstrated to accurately characterize δ15N(NH3) on the order of hourly time resolution. Significant spatial and temporal δ15N(NH3) variabilities were observed and suggested to be driven by vehicle fleet composition and influences from NH3 dry deposition on tunnel surfaces. Overall, a consistent δ15N(NH3) signature of 6.6±2.1 ‰ (; n=80) was found in fresh vehicle plumes with fleet compositions typical of urban regions. Our recommended vehicle δ15N(NH3) signature is significantly different from previous reports. This difference is due to a large and consistent δ15N(NH3) bias of approximately −15.5 ‰ between commonly employed passive NH3 collection techniques and the laboratory-tested active NH3 collection technique. This work constrains the δ15N(NH3) urban traffic plume signature, which has important implications for tracking vehicle NH3 in urban-affected areas and highlights the importance of utilizing verified collection methods for accurately characterizing δ15N(NH3) values.
- Article
(3086 KB) - Full-text XML
-
Supplement
(1364 KB) - BibTeX
- EndNote


Atmospheric ammonia (NH3) is a critical component of the atmosphere and the global nitrogen (N) cycle (Behera et al., 2013; Galloway et al., 2004). As the primary atmospheric alkaline molecule, NH3 plays an essential role in the neutralization of sulfuric acid (H2SO4) and nitric acid (HNO3), leading to the formation of ammonium nitrate (NH4NO3), ammonium bisulfate (NH4HSO4), and ammonium sulfate ((NH4)2SO4) (Behera and Sharma, 2012). These compounds are the most abundant secondary components of inorganic fine particulate matter (PM2.5), which has important implications for air quality, human health, visibility, and global climate change (Behera and Sharma, 2010; Updyke et al., 2012; Wang et al., 2015). Deposition of NH3 and its secondary product, particulate ammonium (), have critical environmental consequences, including soil acidification (via plant assimilation, nitrification, and NH3 volatilization), eutrophication, and decreased biodiversity in sensitive ecosystems (Bolan et al., 1991; Erisman et al., 2008; Galloway et al., 2004; Sutton et al., 2008). In recent years, N deposition in the form of NHx (= NH3 + ) has come to dominate total inorganic reactive N deposition across most of the United States (Li et al., 2016). To evaluate the influence of NH3 on climate and the environment, an accurate understanding of NH3 atmospheric concentrations, emission sources, and spatiotemporal distributions is critical. However, the quantification of NH3 emission budgets remains uncertain (Clarisse et al., 2009), and recent high-resolution satellite NH3 observations imply that anthropogenic emission inventories are substantially underestimated (Van Damme et al., 2018).
While agricultural activities are known to dominate the emission of NH3, accounting for over 60 % of the global inventory (Bouwman et al., 1997), there are significant spatiotemporal variabilities due to its short atmospheric lifetime that is on the order of several hours to a day and its multitude of emission sources (e.g., Hu et al., 2014). In urban regions, vehicle-derived emissions have been identified as a major NH3 source (Decina et al., 2017; Gong et al., 2011; Li et al., 2006; Livingston et al., 2009; Meng et al., 2011; Nowak et al., 2012; Sun et al., 2014, 2017). Recently, vehicle NH3 emissions have been suggested to be a key driver of N deposition in urban and urban-affected regions (Fenn et al., 2018). However, relating urban NH3 emission sources to spatiotemporal N deposition patterns can be challenging due to the variety of potential emission sources that exist in the urban atmosphere including stationary fossil fuel combustion, waste containers, sewerage systems, transport from agricultural areas, and vehicles (Decina et al., 2017, 2020; Gong et al., 2011; Hu et al., 2014; Meng et al., 2011; Saylor et al., 2010; Sun et al., 2014, 2017; Sutton et al., 2000; Whitehead et al., 2007). The N stable isotopic composition (δ15N) of NH3 could be a valuable observational constraint to track source contributions and validate model apportionments (Felix et al., 2013, 2017). However, δ15N(NH3) source characterization studies are limited, particularly for non-agricultural NH3 emissions (Chang et al., 2016; Felix et al., 2013; Freyer, 1978; Heaton, 1987; Smirnoff et al., 2012); thus, to quantitatively utilize this tracer for NH3 source apportionment requires further improvements in δ15N(NH3) source emission signatures and an increased understanding of spatiotemporal variabilities.
Tracking the contribution of vehicle NH3 emissions might be possible using δ15N(NH3) (e.g., Felix et al., 2017). However, previous measurements of vehicle δ15N(NH3) signatures are limited and have reported a wide range of values from −17.8 ‰ to 0.4 ‰ (Chang et al., 2016; Felix et al., 2013; Smirnoff et al., 2012), which overlaps with agriculture-derived NH3 that has been measured to range from −15.2 ‰ to −8.9 ‰ in animal sheds (Heaton, 1987; Freyer, 1978). To quantitatively utilize δ15N(NH3) for NH3 source apportionment requires distinguishable isotopic signatures, such that we need to understand the drivers behind the reported large variability in δ15N(NH3) from vehicle emissions. The previous vehicle δ15N(NH3) characterization studies have included tunnel monitoring in the United States (Felix et al., 2013), tunnel monitoring in China (Chang et al., 2016), and near-highway monitoring in Canada (Smirnoff et al., 2012), with reported δ15N(NH3) averages () of ‰ (n=2), ‰ (n=8), and ‰ (n=11), respectively. We note that the observed variability may be related to spatiotemporal differences in the vehicle-emitted δ15N(NH3), as the studies conducted in the US and Canada have reported relatively consistent values that are higher than those in China, but the factors influencing this potential spatiotemporal δ15N(NH3) pattern are unknown (Chang et al., 2016; Felix et al., 2013; Smirnoff et al., 2012). Notably, the reported δ15N(NH3) source measurements were conducted using a variety of NH3 capture techniques for offline δ15N(NH3) quantification that have included both passive samplers (Chang et al., 2016; Felix et al., 2013) and active collection using a filter pack (Smirnoff et al., 2012). Indeed, it has been shown that different active and passive NH3 collection devices – including a gas-scrubbing bubbler, moss bag, shuttle sampler, and diffusion tube – resulted in significant δ15N(NH3) differences and variance when sampling the same emission source (Skinner et al., 2006). Thus, there could be inaccuracies in the previously reported δ15N(NH3) emission values related to the collection technique used to concentrate ambient NH3 for offline δ15N(NH3) characterization.
To improve the δ15N(NH3) source inventory for accurate NH3 source apportionment, we need to quantify δ15N(NH3) using accurate methods and address spatiotemporal variabilities. In this study, δ15N(NH3) was characterized in a variety of integrated vehicle plumes with a combination of stationary and mobile on-road measurements, utilizing a laboratory-verified active collection technique shown to be accurate for δ15N(NH3) quantification (Walters and Hastings, 2018). Stationary measurements were conducted during the summer and winter at a near-highway monitoring site in Providence, RI, USA, and within a tunnel in Shenyang, Liaoning, China. A broad spatial survey of on-road mobile measurements was also conducted in the northeastern USA to evaluate the influences of a variety of real-world vehicle fleet compositions and driving modes on the traffic δ15N(NH3) signature. Passive NH3 samplers, which have been used in previous δ15N(NH3) source characterization studies (Chang et al., 2016; Felix et al., 2013, 2017), were also deployed in the near-highway and tunnel-monitoring campaigns and compared with the active collection technique verified for δ15N(NH3) accuracy (Walters and Hastings, 2018). Overall, these data will better define the δ15N(NH3) source signature for urban vehicle plumes, with implications for tracking emission contributions to urban atmospheric NH3 concentrations and N deposition.
2.1 Sampling sites
2.1.1 Near-highway measurements (Providence, RI, USA)
Stationary measurements were conducted at an air-monitoring station in Providence, RI, USA (41∘49′46.0′′ N, 71∘25′03.0′′ W), maintained by the Rhode Island Department of Environmental Management (RI-DEM) and Rhode Island Department of Health (RI-DOH) during the summer and winter (Fig. S1 in the Supplement). The air-monitoring station is located 4.62 m east of the northbound I-95, a major interstate highway with a traffic volume of ∼ 200 000 vehicles d−1 (HERE Traffic Analysis; https://company.here.com/automotive/traffic/traffic-analytics/, last access: September 2019), dominated by light-duty gasoline-powered vehicles. Continuous online measurements of CO (Thermo Scientific 48i) were monitored at the sampling location, and meteorological parameters, including temperature, relative humidity, wind speed, and wind direction, were recorded at the Urban League RI-DEM monitoring site, which is 2.4 km south of the near-highway site (Fig. S1). Collections of speciated NHx were conducted using an active sampling technique (denuder-filter pack; described in Sect. 2.2) with 6 h sampling intervals that included 00:30–06:30, 06:30–12:30, 12:30–18:30, and 18:30–00:30 LT during summer (9 to 18 August 2017) and 00:00–06:00, 06:00–12:00, 12:00–18:00, and 18:00–00:00 LT during winter (21 January to 1 February 2018). During the sampling periods, NHx collections were not conducted during precipitation periods (or forecasted precipitation periods) due to the potential role of wet scavenging to alter δ15N(NH3) (Xiao et al., 2015). NH3 was also collected using a passive sampler (ALPHA), in which NH3 diffuses through a PTFE membrane and accumulates on an acid-coated (5 % citric acid (w∕v) in water) cellulose filter (Albet, grade 604, 24 mm diameter) housed in a protective case. Replicate passive samplers were deployed during the winter for NH3 collection for two separate approximate 1 week collection periods during winter (10–17 and 17–25 February 2018) for a total of four collected samples at the near-highway monitoring site. All samplers were secured on the roof (∼3.85 ) of the air-monitoring station on the underside of a weatherproof shelter.
2.1.2 Tunnel measurements (Shenyang, China)
From 30 October to 5 November in 2018, stationary tunnel measurements were conducted in the middle of an underground tunnel of a north–south expressway in Shenyang, Liaoning Province, China (41∘48′16.0′′ N, 123∘26′54.0′′ E). This tunnel is approximately 2360 m long and experiences approximately 28 804 vehicles d−1 during the weekday and 26 237 vehicles d−1 during the weekend (data from real-time traffic control system, Shenyang Wu'ai Tunnel Management Co., Ltd.). The tunnel was open to vehicle passage from 05:00 to 23:00, and collections of speciated NHx were conducted using a denuder-filter pack at 8 h intervals (approximately 06:00 to 14:00, 14:00 to 22:00, and 22:00 to 06:00 LT). Sampling from 22:00 to 06:00 LT included the period that the tunnel was closed to vehicle passage (i.e., 23:00 to 05:00 LT). The denuder-filter pack samplers were mounted on an elevated platform approximately 1.5 (Fig. S2). Three ALPHA samplers were also mounted on the elevated platform and simultaneously collected NH3 during the sampling campaign (∼ 7 d). The relative humidity and temperature within the tunnel were monitored (iButton®, DS1923, Wdsen Electronic Technology Co., Ltd.) from 31 October 2018, at 14:00 LT, to the end of the sampling campaign that included measurements for 16 out of the 21 collection periods.
2.1.3 Mobile on-road measurements (northeastern USA)
Mobile on-road measurements were conducted in the northeastern USA from 20 to 24 February 2018, for approximately 21 h, and spanned ∼ 2125 km. The mobile laboratory consisted of a pickup truck (Ford F-150) equipped with a denuder-filter sampling device, a CO analyzer (American Ecotech Serinus 30), a temperature and relative humidity probe (Elitech GSP-6), and a GPS tracking application (Map Plus). The denuder-filter pack samplers were placed in a weatherproof enclosure that was secured in the truck bed (∼ 1 m above the truck bed), and collections were conducted for approximately 1 h (Fig. S3). Sampling was temporarily ceased during periods in which our vehicle speed was lower than 15 km h−1 to limit the possibility of sampling self-emissions. The CO analyzer was placed inside the truck and kept at a similar temperature to calibration conditions in the laboratory, and an air sampling inlet (PTFE tubing, 6.35 mm o.d.) was secured to the roof of the truck. Due to the significant power demands of the onboard instruments and collection equipment (i.e., vacuum pump), a gasoline-powered generator (Champion 1200 W portable generator) was used to power all equipment. The exhaust from the generator was diverted and emitted alongside the truck exhaust.
2.2 Active collection of NHx
Active speciated NHx collection was conducted using a glass honeycomb denuder-filter pack sampling system (ChemComb speciation cartridge) during all campaigns. This collection system has been extensively described for its ability to speciate between reactive inorganic gases and particulate matter for offline concentration determination (Koutrakis et al., 1988, 1993). Briefly, ambient air is drawn into the sampler, and reactive gases are removed under laminar flow conditions such that radial mixing can only be achieved via diffusion-based processes. Particulates, with their much lower diffusion velocity compared to gases, cannot migrate to the walls of the denuder during the residence time within the unit and are collected on a downstream filter pack. The samplers are also held vertically to limit the potential for gravitational settling of particles onto the denuder surfaces, such that particulates do not contribute to the denuder extract (Ali et al., 1989). The sampler consisted of a PTFE-coated inlet to minimize reactive gas loss, a PM2.5 impactor plate, a base-coated honeycomb denuder (2 % carbonate (w∕v) +1 % glycerol (w∕v) in 80:20 water–methanol (v∕v) solution), acid-coated honeycomb denuder (2 % citric acid (w∕v) +1 % glycerol (w∕v) in 20:80 water–methanol (v∕v) solution) to collect NH3, and a filter pack to collect . The base-coated denuder was used to remove atmospheric acids (e.g., HNO3, SO2, and hydrochloric acid (HCl)) as a precaution to reduce collection-related gas–particle interactions. Recently, this sampling system has been shown to quantify δ15N(NH3) with a precision (±1σ) of ±0.8 ‰ from laboratory experiments and field testing (Walters and Hastings, 2018). The PTFE-coated air inlet (∼4 cm) has been shown to lead to a negligible loss of NH3 and induce insignificant δ15N(NH3) fractionation (Koutrakis et al., 1993; Walters and Hastings, 2018). The samplers were directly exposed to ambient air without the use of an additional inlet tubing to prevent the loss of NH3.
In the first measurement campaign (near-highway monitoring in summer of 2017), was collected using a single Fluoropore PTFE membrane filter (Millipore, 1.0 µm pore, 47 mm diameter). However, due to potential loss of semivolatile NH4NO3, all subsequent campaigns utilized a nylon filter (Cole-Parmer, 0.8 µm pore, 47 mm diameter) that has been shown to collect and retain quantitatively (Yu et al., 2005). A significant fraction of collected on denuded nylon filters may volatilize (Yu et al., 2006), such that a backup acid-coated (5 % citric acid (w∕v) in water) cellulose filter (Whatman, 8 µm pore, 47 mm diameter) is used to capture any volatilized NH3 from the collected particles and/or NH3 breakthrough during conditions of denuder saturation (Walters et al., 2019). All collections were conducted at a flow rate of 10 L min−1 using a mass-flow controller (Dakota mass-flow controller 6AGC1AL55-10AB2; precision ±1 %) attached to an oilless vacuum pump (Welch 2546B-01). All denuder and filter preparation, handling, and extraction techniques have been previously described (Walters et al., 2019; Walters and Hastings, 2018) and are summarized in the Supplement (Sect. S1).
2.3 Concentration and δ15N(NHx) isotopic analysis
The concentrations of the denuder and filter extraction solutions were analyzed using a combination of standardized colorimetry and/or ion chromatography analytical techniques. Colorimetric analysis included measurement of based on the indophenol blue method with absorbance detection at 625 nm (e.g., US EPA Method 350.1), as well as via diazotization with sulfanilamide dihydrochloride followed by detection of absorbance at 520 nm (e.g., US EPA Method 353.2) that was automated using a discrete UV–visible spectrophotometer (Westco SmartChem discrete analyzer) at Brown University. These analyses were conducted for all samples collected in the US (i.e., near-highway and mobile measurements). Pooled standard deviations (SDs) (±1σ) of replicate measurements of quality control standards were ±0.35 µmol L−1 (n=48) and ±0.23 µmol L−1 (n=60), and the average relative SDs (RSDs) were 1.3 % and 0.81 % for and , respectively. All samples collected in the Shenyang tunnel were analyzed for , , , and using ion chromatography (Dionex™ ICS-600) at the Institute of Applied Ecology, Chinese Academy of Sciences. Cations were quantified using a Dionex™ CS12A column and CQ12A guard column with 10 mmol L−1 methanesulfonic acid as the eluent. Anions were quantified using a Dionex™ AS22 column and AQ22 guard column with 4.5 mmol L−1 sodium carbonate and 1.4 mmol L−1 sodium bicarbonate as the eluent. For all quantified ions, the RSD was less than 1.5 %. The limit of detection (LOD) values of the quantified ions were no higher than 0.5, 0.2, 2.0, and 1.5 µmol L−1 for , , , and , respectively. The measured was used to calculate the concentrations of NH3 and in the traffic plumes, while was quantified because it will interfere with nitrogen isotopic analysis of (Zhang et al., 2007), but was never measured above the LOD. The gases collected on the base-coated denuder were generally below detection limits and were not reported in this work.
The quantification of was performed separately for the acid-coated honeycomb denuder, the particulate filter, and the acid-coated cellulose filter extraction solutions, corresponding to NH3, , and volatilized (and/or NH3 breakthrough during denuder saturation conditions), respectively. Briefly, was measured based on an established offline wet-chemistry technique involving hypobromite (BrO−) oxidation and acetic acid/sodium azide reduction (Zhang et al., 2007), which was conducted for samples with > 2 µmol L−1. Samples were diluted to at least 10 µmol L−1 of and then oxidized to using BrO− in an alkaline solution as previously described (Zhang et al., 2007). After a reaction time of at least 30 min, the reaction was stopped by 0.4 mL addition of 0.4 mol L−1 sodium arsenite to remove excess BrO−. The concentration of the product () was then measured to confirm the quantitative conversion of to . The product () was reduced to nitrous oxide (N2O) using sodium azide buffered in an acetic acid solution based on previously described chemical protocols (McIlvin and Altabet, 2005).
Samples were then analyzed for their δ15N(N2O) composition using an automated N2O extraction system coupled to a continuous-flow isotope ratio mass spectrometer for m∕z 44, 45, and 46 measurements. These measurements were conducted at Brown University for samples collected within the USA and at the Institute of Applied Ecology, Chinese Academy of Sciences, for samples collected within the Shenyang tunnel. In each batch analysis, samples were calibrated relative to internationally recognized N isotopic reference materials. These reference materials underwent the same chemical processing as the samples and were used to correct for isotopic fractionation and blank effects resulting from the chemical conversion of to N2O. At Brown University, two international reference materials were used that included IAEA-N2 and USGS25 with values of 20.3 ‰ and −30.3 ‰, respectively (Böhlke et al., 1993; Gonfiantini, 1984). Repeated measurements of these reference materials yielded SDs (±1σ) of ±0.65 ‰ (IAEA-N2; n=25) and ±0.73 ‰ (USGS25; n=25) and an overall pooled SD of ±0.69 ‰ (n=50). At the Institute of Applied Ecology, Chinese Academy of Sciences, three reference materials were used that included IAEA-N1, USGS25, and USGS26 with values of 0.4 ‰, −30.3 ‰, and 53.7 ‰ (Böhlke et al., 1993; Gonfiantini, 1984), respectively. These materials had measured SDs of ±0.53 ‰ (IAEA-N1; n=8), ±0.24 ‰ (USGS25; n=8), and ±0.45 ‰ (USGS26; n=8) and an overall pooled SD of ±0.42 ‰ (n=24). All N isotopic compositions are reported relative to reference standards using delta (δ) notation in units of per mill (‰).
where R is the ratio of the heavy to light isotope (i.e., 15N∕14N) for the sample and reference, respectively. Atmospheric nitrogen (N2) is the established international delta-scale reference for N isotopic composition.
2.4 Data analysis
The targeted analytes were corrected for field blanks, and ambient air concentrations were then calculated based on the volume of sampled air and reported in units of parts per billion by volume (ppbv) and microgram per cubic meter (µg m−3) for NH3 and , respectively. The effective volume of air sampled by the ALPHA passive sampler was calculated as the following:
where V is the volume of sampled air (m3), D is the NH3 diffusion constant (= 2.09 × 10⁻⁵ m2 s−1), L is the stationary air layer within the sampler (= 0.006 m), t is the time of exposure (h), and A is the cross sectional area (= 3.4636 × 10⁻⁴ m2) (from ALPHA Sampler User Instructions).
The method detection limit (MDL) for [NH3] and determination for the active sampling technique (i.e., denuder-filter pack) was calculated as 3 times the SD of the field blanks. The MDL was reported based on the typical collection times and reported separately for each sampling environment (Table 1). The reported [NH3] and precisions using the denuder-filter pack sampling device were based on five separate replicate sample collections conducted at the near-highway stationary site and expressed as the relative SD (RSD %) (Table 1). The error bars of [NH3] and quantified using the denuder-filter pack in subsequent figures represent the ± RSD % when above the MDL. Some collections had below the MDL, and these samples were reported as 0.5±0.5 MDL. Multiple passive samplers (i.e., ALPHA) were always simultaneously collected, such that RSD % was not explicitly determined, and results were reported as of the multiple collections.
Table 1Summary of method detection limit (MDL), pooled relative SDs (RSD), and δ15N reproducibility of NH3 determined from active sampling using a denuder-filter pack (ChemComb speciation cartridge). The MDL is reported in units of ppbv for NH3 and µg m−3 for . The MDL is reported for each sampling environment, including the near-highway (NH) monitoring location in Providence, RI, USA, during the summer (Summer-NH) and winter (Winter-NH) on-road mobile measurements in the northeastern USA (Mobile) and the tunnel in Shenyang, Liaoning, China (Tunnel).
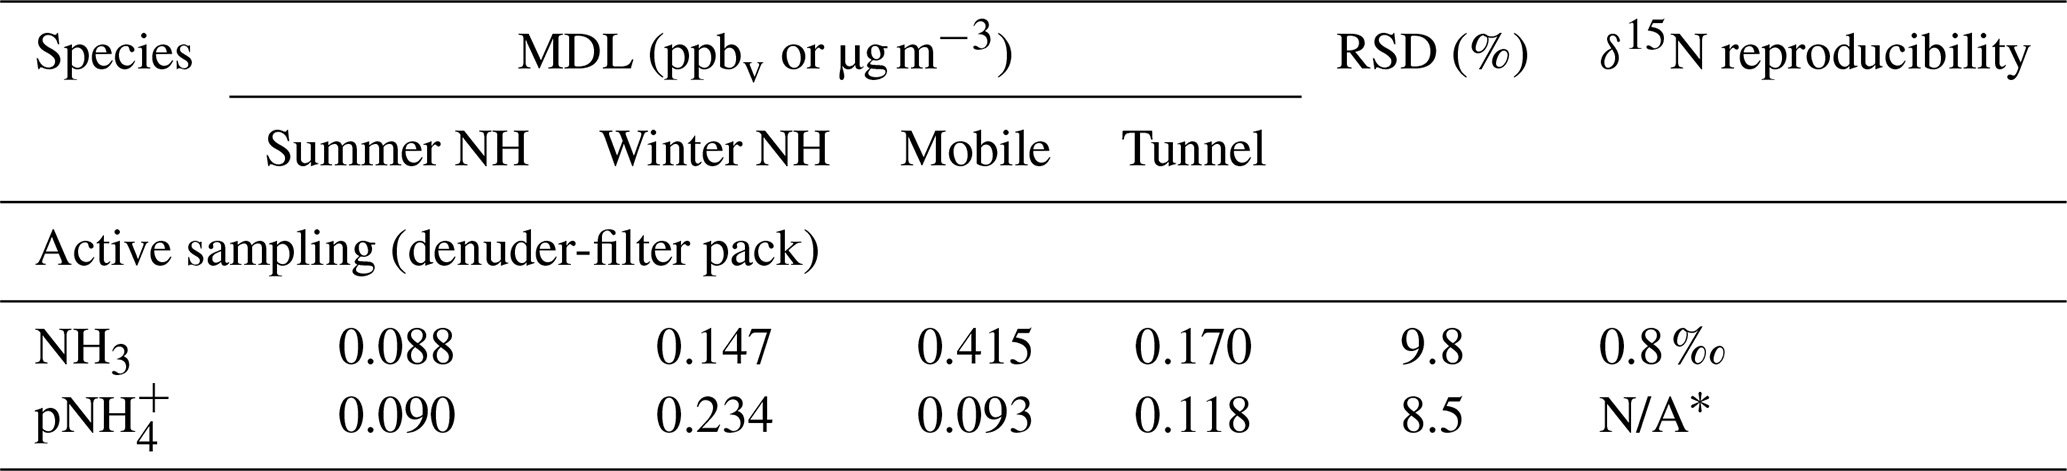
NA: not available. * Separate measurement of was not conducted due to sample mass limitations.
Significant field blanks were found on the acid-coated honeycomb denuder and the acid-coated cellulose filter. A subset of these blanks was analyzed for and found to have relatively consistent values of ‰ (n=3) and ‰ (n=3) for the acid-coated honeycomb denuder and acid-coated cellulose filter, respectively. Corrections for δ15N were made based on mass balance to account for the observed blanks as previously described (Walters et al., 2019):
Blank corrections were made for all samples when the fraction of the field blank () was less than 30 % of the total collected , as the propagated δ15N uncertainty generally did not exceed ±2.5 ‰ for this fBlank value. Samples with an fBlank that exceeded 30 % were not reported for δ15N. This requirement as well as the azide method detection limit (i.e., 2 µmol L−1) limited our ability to quantify for samples collected at the near-highway monitoring site and mobile on-road measurements, such that only δ15N(NH3) was reported for the collections conducted in the USA. The collection media blank also impacted the mobile δ15N(NH3) measurements, as 6 out of 20 samples had a fBlank > 30 %. Error bars reported for subsequent δ15N values represent the propagated uncertainty that includes the collection uncertainty and the blank contribution. Replicate collected samples at the near-highway site indicated that δ15N(NH3) from NH3 collected using an acid-coated denuder had an average reproducibility within 0.8 ‰ (n=5) (Table 1), consistent with previous field measurements (Walters and Hastings, 2018).
3.1 Near-highway measurements (Providence, RI, USA)
Seasonal NHx collections at the near-highway monitoring site were performed under a variety of environmental conditions (Table 2). Overall, the near-highway [NH3] ranged between 5.8 and 20.2 ppbv during summer and 2.4 and 20.9 ppbv during winter at the near-highway monitoring location (Fig. 1a). The average [NH3] () was 14.0±4.0 ppbv (n=32) and 12.0±4.8 ppbv (n=22) for summer and winter, respectively (Table 2), which was not found to be significantly different (p>0.05). Diel [NH3] patterns were observed during both summer and winter, with significantly lower values occurring during the night and/or early morning collection period (Table 2). The dependence of [NH3] on the vector-averaged wind direction is shown in Fig. 2. Overall, the near-highway monitoring site was downwind of I-95 for 51 out of 54 NHx collection periods (Fig. 2). The [NH3] was significantly lower when the wind direction indicated the monitoring site was upwind of I-95 compared to when downwind of I-95, with averages of 5.8±2.7 ppbv (n=3) and 13.6±4.2 ppbv, respectively (p<0.01). Strong positive linear correlations were found between [NH3] and the mean [CO] during each collection period during summer (r=0.736, p<0.01) and winter (r=0.821, p<0.01), with slopes (mol mol−1) of 0.025±0.005 and 0.027±0.005, respectively (Fig. 3). These observed relations between [NH3] and [CO] were similar to previously reported values of 0.031±0.005 from on-road measurements in New Jersey and California in the United States using high-resolution open-pathway sensors (Sun et al., 2014, 2017), as well as 0.031 to 0.038 based on fitted NHx and CO slopes from aircraft measurements in the Californian South Coast Air Basin (Nowak et al., 2012). The similarity of these measurements indicated that the traffic plumes measured in this study were representative of previous literature reports in the USA, and the active collection of NH3 using a denuder-filter pack sampling technique was suitable for reproducing accurate [NH3] under traffic plume environmental conditions.
Table 2Summary of the near-highway (Providence, RI, USA) environmental conditions including temperature (Temp), relative humidity (RH), wind direction, and NHx data including [NH3], , f(NH3), and δ15N(NH3) sorted by NHx collection period (local time) for both summer and winter. Data are reported as for each collection period during summer and winter, respectively. The number of collections made during each collection period (n) is indicated.
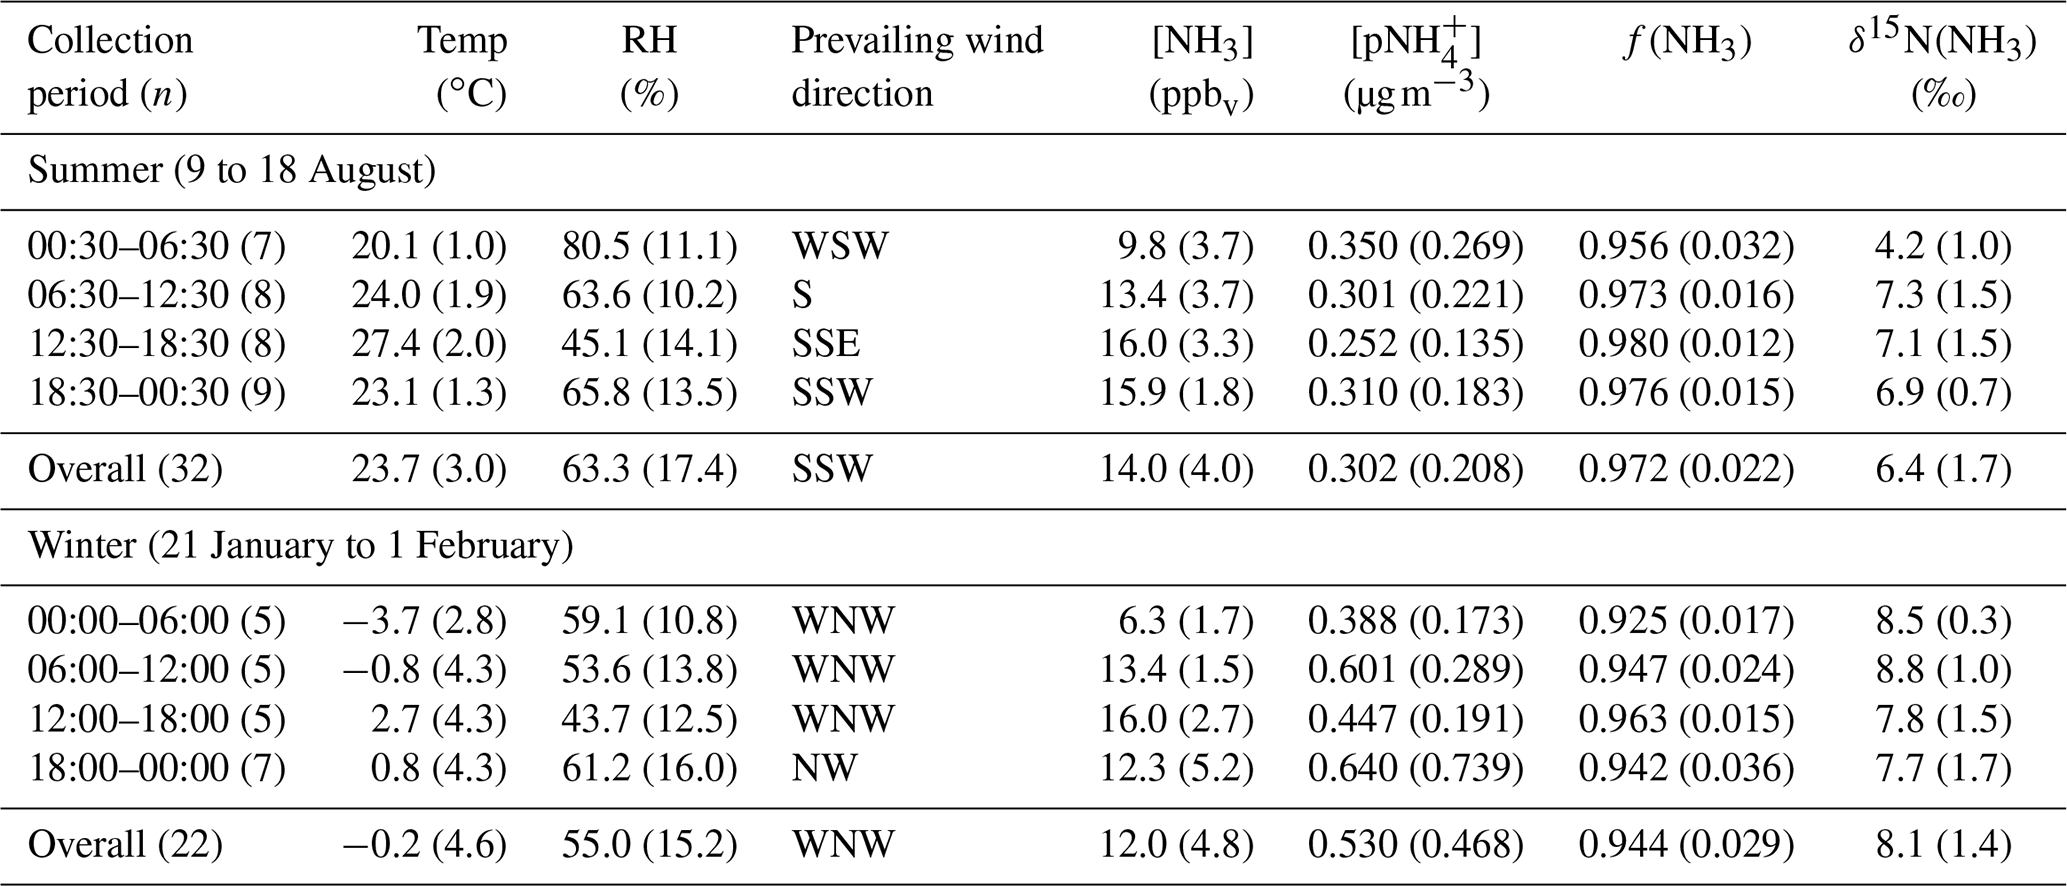
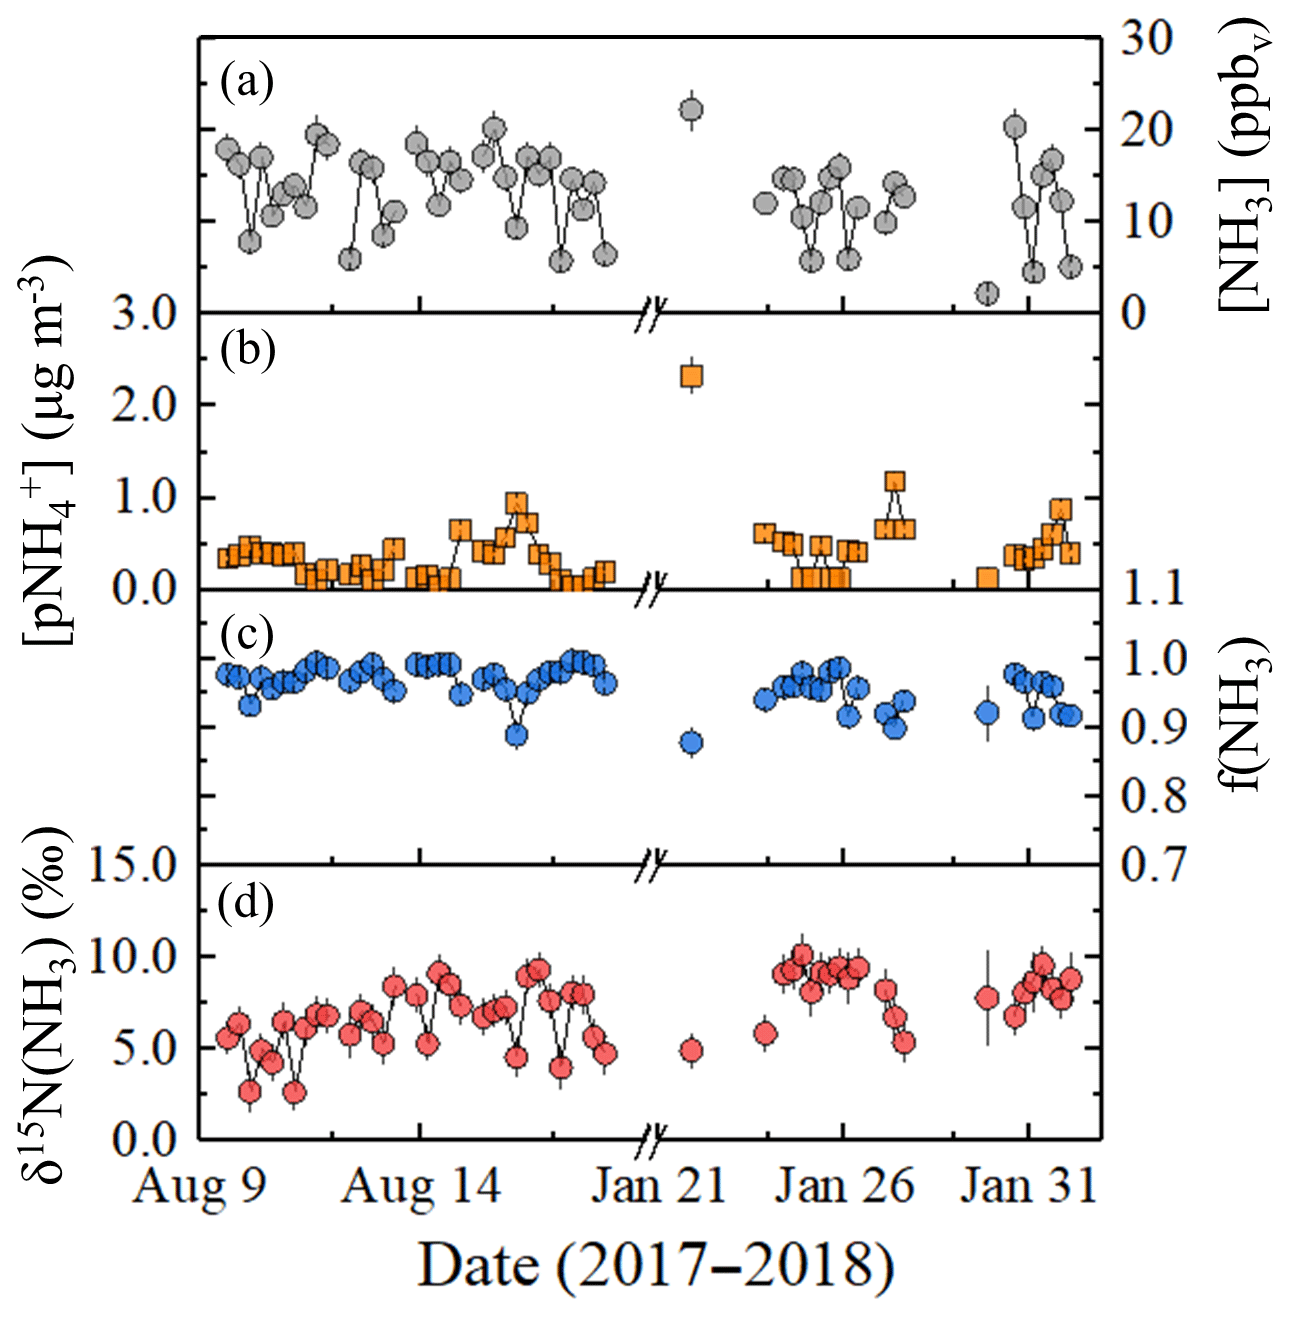
Figure 1Near-highway (Providence, RI, USA) data summary of (a) [NH3], (b) , (c) f(NH3) (= [NH3](mol) ∕ [NHx](mol)), and (d) δ15N(NH3). The NHx data were generated from an active collection technique using a denuder-filter pack with a collection time of 6 h, and the error bars for concentrations and δ15N(NH3) measurements shown as black vertical lines represent the RSD (%) and propagated error, respectively. The breaks in the x axes separate the summer and winter measurements.
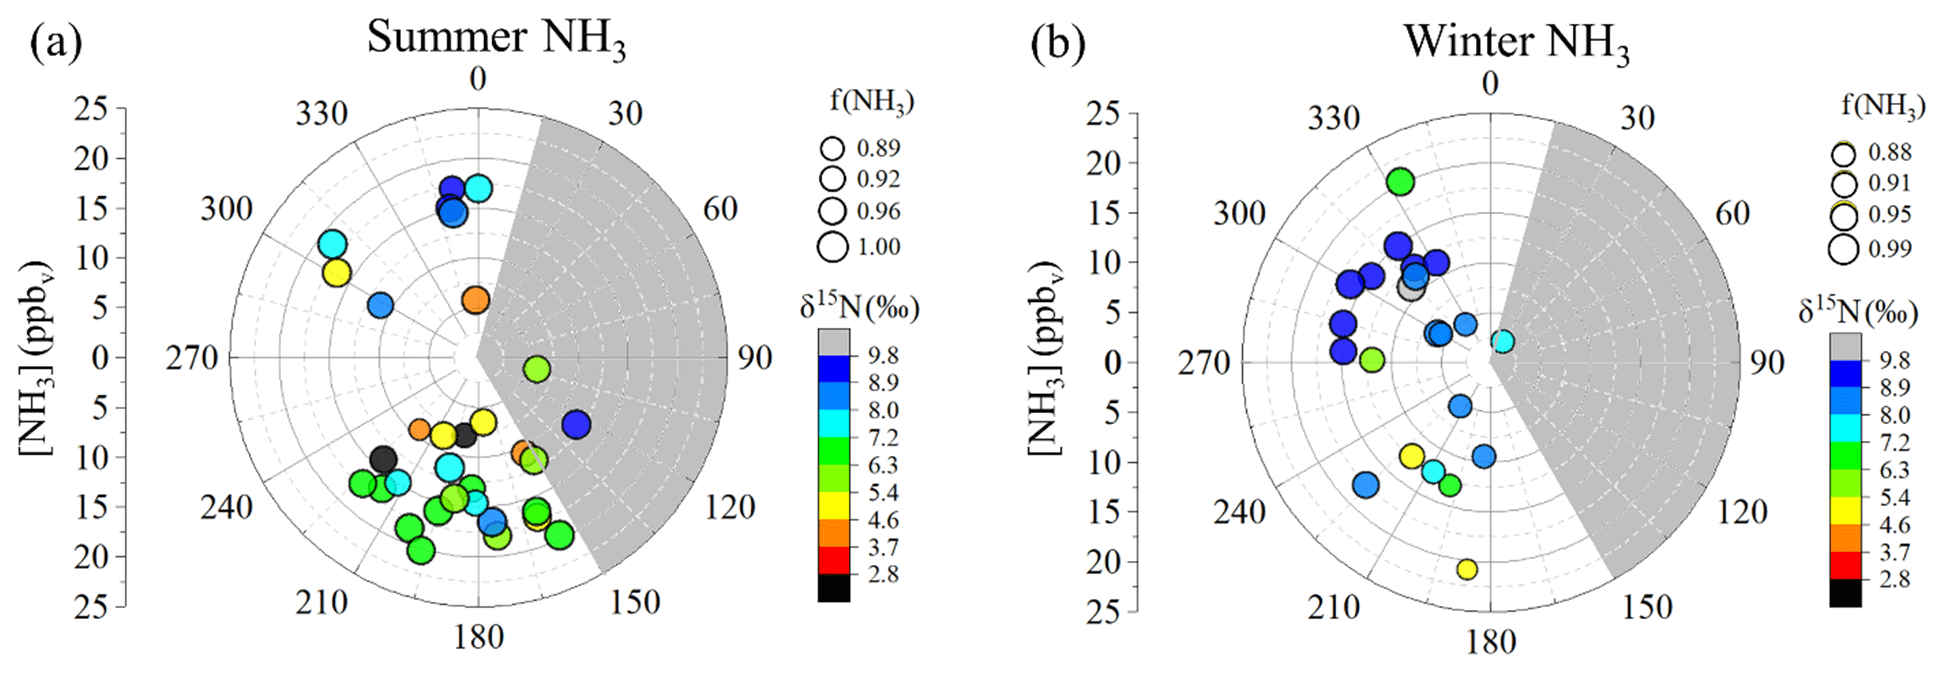
Figure 2Wind sector analysis of samples collected at the near-highway monitoring site (Providence, RI, USA) for [NH3] (circles) in (a) summer and (b) winter. The data are coded by size for f(NH3) and color-coded for δ15N(NH3) (‰). The monitoring location is downwind of I-95 except for wind directions 15 to 150∘ (grey shaded region).
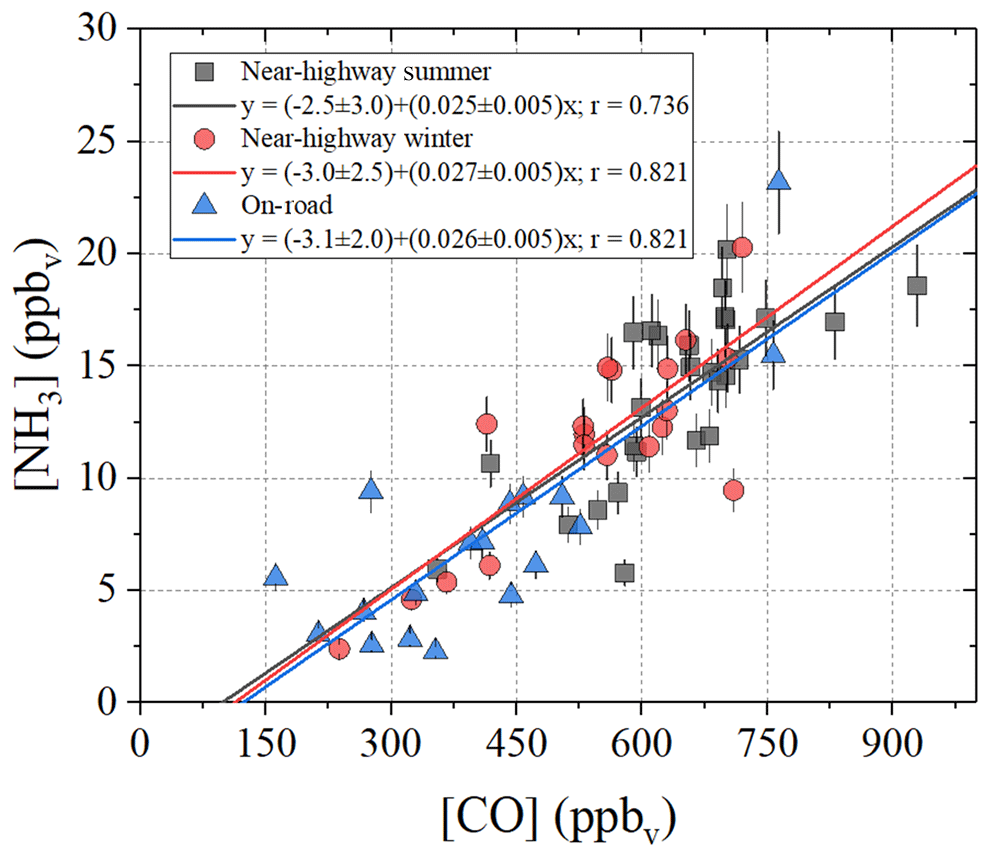
Figure 3Linear relations between [NH3] and [CO] from the near-highway (Providence, RI, USA) and mobile on-road (northeastern USA) measurements. The [NH3] data were based on acid-coated denuder collection, and the [CO] represents the average of the online-determined concentrations over the collection period. The linear regressions (solid lines) and Pearson's correlation coefficients (r) are provided for each respective measurement location.
Roadside ranged from 0.045 to 0.938 µg m−3 and from 0.117 to 2.327 µg m−3 during summer and winter, respectively (Fig. 1b). The average was 0.302±0.208 µg m−3 (n=32) and 0.530±0.468 µg m−3 (n=22) during summer and winter, respectively (Table 2), which was significantly different (p<0.05). During winter, a outlier of 2.327 µg m−3 was identified based on a Grub's t test (p<0.05). However, even with the removal of this outlier, the seasonal average was found to be significantly different (p<0.05). NHx speciation was quantified as f(NH3):
Overall, f(NH3) ranged from 0.889 to 0.996 during summer and from 0.878 to 0.986 during winter (Fig. 1c), indicating that NH3 was the dominant NHx species during both summer and winter. The average f(NH3) was 0.972±0.022 (n=32) and 0.944±0.029 (n=22) during summer and winter, respectively (Table 2). The average seasonal f(NH3) was found to be statistically different (p<0.05), indicating a greater extent of NH3 partitioning to during winter. Significant correlations were observed between f(NH3) and relative humidity for both summer (, p<0.01) (Fig. S4) and winter (, p<0.01) (Fig. S5).
The measured δ15N(NH3) ranged from 2.6 ‰ to 9.3 ‰ and from 4.9 ‰ to 10.1 ‰ during the summer and winter, respectively (Fig. 1d). The δ15N(NH3) averages were 6.4±1.7 ‰ (n=32) and 8.1±1.4 ‰ (n=22) during summer and winter, respectively (Table 2), which were significantly different (p<0.05). The dependence of δ15N(NH3) on the vector-averaged wind direction is shown in Fig. 2. Overall, the δ15N(NH3) values were not found to be significantly different when the monitoring site was upwind or downwind of I-95, with averages of 7.6±1.4 ‰ (n=3) and 7.1±1.8 ‰ (n=51), respectively (p>0.05), which is likely due to the proximity of the sampling location to air masses significantly influenced by vehicle emissions. No statistical difference was found between the collection period and δ15N(NH3) during the winter (p>0.05), but significantly lower δ15N(NH3) values were observed during the summer for the night and/or early morning sample (00:30 to 06:30) (p<0.05) (Table 2). Significant correlations between δ15N(NH3) and f(NH3) were observed for both summer (r=0.349, p<0.05) (Fig. S4) and winter (r=0.535, p<0.05) (Fig. S5). However, these correlations were found to be impacted by influential f(NH3) values during the summer and winter of 0.889 and 0.878, respectively (Figs. S4 and S5). Removing these influential f(NH3) observations resulted in an insignificant correlation between δ15N(NH3) and f(NH3) for both summer (r=0.300, p>0.05) (Fig. S4) and winter (r=0.378, p>0.05) (Fig. S5).
3.2 Tunnel measurements (Shenyang, Liaoning, China)
Tunnel temperature and relative humidity conditions remained relatively consistent throughout our sampling campaign and averaged 19.3±1.6 ∘C and 35.4±6.7 %, respectively (Table 3). Due to the elevated concentrations in the tunnel, the amount of collected NH3 on the acid-coated honeycomb denuders averaged 406±125 µg, indicating the laboratory-determined operative capacity of ∼400 µg was often exceeded (Walters and Hastings, 2018). The citric acid coated filter collected no more than 275 µg of NH3, which was within the laboratory-determined operative capacity of at least 350 µg (Walters et al., 2019). Thus, our NHx measurements are expected to be accurate, but there could be uncertainty in the NHx speciation; this is because the extracted from the acid-coated denuder and nylon filter will have a low bias due to denuder saturation and volatilization, respectively, and extracted from the acid-coated filter will derive from both NH3 breakthrough and NH3 volatilized from the nylon filter. Therefore, our concentration results and analysis of samples collected in the Shenyang tunnel will focus on [NHx]. Overall, [NHx] ranged from 64.4 to 210.6 ppbv and averaged 132.5±45.8 (n=21) (Fig. 4a; Table 3). An obvious [NHx] diel cycle was observed in which higher concentrations occurred during periods when the tunnel was open compared to sampling periods in which the tunnel was closed to vehicle passage, with averages of 136.8±18.8 ppbv (n=7), 181.2±23.0 ppbv (n=7), and 79.4±14.4 ppbv (n=7) for the 06:00 to 14:00, 14:00 to 22:00, and 22:00 to 06:00 LT collection periods, respectively (Table 3).
Table 3Summary of the Shenyang, China, tunnel data including temperature (Temp), relative humidity (RH), [NHx], f(NH3), [NH3], and δ15N(NHx). Data are reported as ) for each collection period and the overall monitoring period during summer and winter. The number of collections made during each collection period (n) is also indicated.

a f(NH3) was calculated from estimated using ion-mass balance based on the [NHx], , and measurements (see Eq. 6).
b Due to the elevated f(NH3), the measured δ15N(NHx) ≈ δ15N(NH3).

Figure 4Tunnel (Shenyang, Liaoning, China) data summary of (a) [NHx], (b) concentrations of (blue square) and (red triangle), (c) f(NH3) calculated using ion-mass balance (open circle) and modeled using ISORROPIA (purple diamond), and (d) δ15N(NHx). The data were generated using a denuder-filter pack with a collection time of approximately 8 h. Error bars for concentrations and δ15N(NHx) measurements shown as black vertical lines represent the RSD (%) and propagated error, respectively. ISORROPIA was not run for five collection periods, due to the absence of relative humidity and temperature data.
We have estimated f(NH3), assuming that the in PM2.5 was linked to the -- thermodynamic system and that the influence of other ions (e.g., Na+, Ca2+, or Cl−) had a negligible impact on the chemistry of this system (Shah et al., 2018). Ion-mass balance was utilized to calculate the expected for each collection period based on the measured and (Fig. 4b) from the aqueous filter extracts:
Utilizing the ion-mass balance approach, f(NH3) was estimated to range between 0.856 and 0.997 and averaged 0.956±0.038 (Fig. 4c; Table 3). NHx speciation was also estimated using ISORROPIA, which is a gas–aerosol equilibrium partitioning model (Fountoukis and Nenes, 2007; Nenes et al., 1998). Model inputs included the measured [NHx], , and and average relative humidity and temperature for each collection period, and the model was run in the forward direction in the metastable state. The f(NH3) was then calculated based on the model output of [NH3] and (Table S1 in the Supplement). Overall, there was a near-exact agreement in f(NH3) between the ion-mass balance and the ISORROPIA approaches, noting that ISORROPIA was not used for the first five collection periods due to the absence of relative humidity and temperature data (Fig. 4c). Overall, this analysis indicated that NHx in the tunnel was primarily in the form of NH3, consistent with the near-highway stationary observations.
The measured δ15N from extracted from the acid-coated denuders, nylon filters, and acid-coated filters averaged 6.0±5.6 ‰ (n=21), 1.0±10.7 ‰ (n=21), and ‰ (n=21) (Fig. S6), respectively. These δ15N differences, to some degree, reflect differences in the δ15N of ambient NH3 and but are difficult to interpret due to the ambiguity in NHx speciation. Since NHx speciation was not achieved in the tunnel collections due to denuder saturation, our reported isotopic results and analysis will focus on δ15N(NHx), with the expectation that it primarily represents NH3. The δ15N(NHx) was calculated for each sampling period using mass balance:
where , , and represent the fractions of extracted from the denuder, nylon filter, and acid-coated filter, respectively, for each sampling event. Overall, the δ15N(NHx) ranged from −1.6 ‰ to 9.2 ‰ (Fig. 4d) and had a numerical average of 2.9±2.5 ‰ (n=21) (Table 3). There was a strong diel cycle in δ15N(NHx) in which the 22:00 to 06:00 LT collection period that included the period the tunnel was closed to vehicle passage (i.e., 23:00 to 05:00 LT) resulted in a statistically lower δ15N(NHx) of 0.1±1.3 ‰ (n=7), relative to the 06:00 to 14:00 and 14:00 to 22:00 LT collection periods that averaged 3.6±1.0 ‰ (n=7) and 4.8±2.0 ‰ (n=7), respectively (p<0.05) (Table 3).
3.3 Mobile on-road NH3 survey (northeastern USA)
Overall, the on-road [NH3] ranged from 2.3 to 23.2 ppbv and averaged 7.3±4.7 ppbv (n=20) (Fig. 5b). The highest [NH3] were found to occur during collection periods near urban cores that included Boston, MA, Providence, RI, New York City, NY, and Washington, DC (Fig. 6a). The on-road [NH3] was significantly correlated with [CO] (r=0.821, p<0.01), and the linear relationship between NH3 and CO had a slope (NH3(mol):CO(mol)) of 0.026±0.005 (Fig. 3), which was similar to the near-highway relation of 0.025±0.005 and 0.0270±0.005, observed during summer and winter, respectively. On-road [NH3] was found to be significantly correlated with vehicle speed (r= −0.673, p<0.01) (Fig. S7). On-road ranged from 0.047 to 0.710 µg m−3 (Fig. 5c) and averaged 0.204±0.176 µg m−3 (n=20). NHx speciation indicated that NH3 was the dominant species, which is consistent with our stationary observations, as f(NH3) ranged from 0.800 to 0.987 (Fig. 5d) and averaged 0.934±0.050 (n=20).
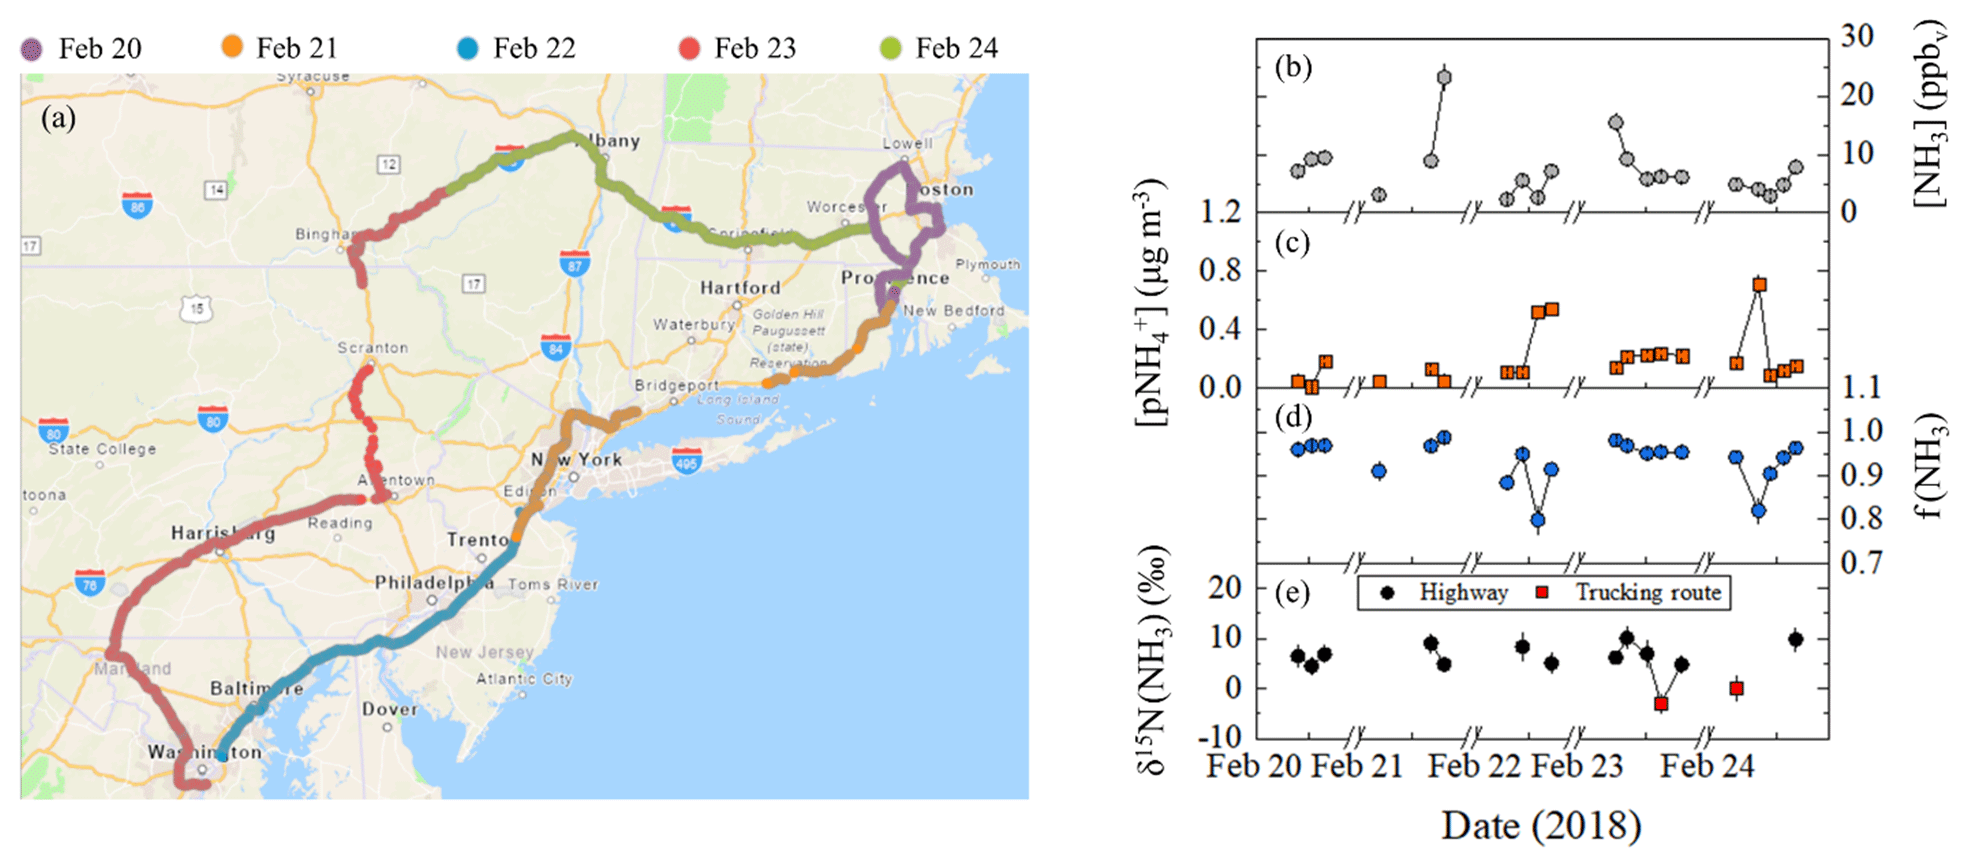
Figure 5Mobile on-road (northeastern USA) measurements including (a) spatial mapping of measurement path sorted by date and data summary of (b) [NH3], (c) , (d) f(NH3) (= [NH3](mol)/[NHx](mol)), and (e) δ15N(NH3) for highway (black circle) and trucking routes (red square). The NHx data were generated using a denuder-filter pack with a collection time of approximately 1 h, and the error bars for concentrations and δ15N(NH3) measurements shown as black vertical lines represent the RSD (%) and propagated error, respectively. The breaks in the x axes separate breaks in the mobile measurements. Image (a) was created using ArcGIS Copyright© 1995–2019 Esri.
On-road δ15N(NH3) ranged from −3.0 ‰ to 10.1 ‰ (Fig. 5e) and averaged 5.7±3.5 ‰ (n=14). On-road δ15N(NH3) was not found to be significantly correlated with f(NH3) (r=0.249, p>0.05) or average vehicle speed (r= −0.179, p>0.05) (Fig. S7). Spatial mapping of δ15N(NH3) indicated the highest values near urban cores (Fig. 6b). Each collection period was categorized as either a trucking or highway route using the percentage of annual average daily truck traffic contributions to annual average daily traffic (U.S. Dept of Transportation, 2013) similar to that previously described (Miller et al., 2017). Routes on our on-road measurements with diesel trucks that comprised at least 25 % of the annual average daily traffic and at least a yearly average of 8500 diesel trucks per day were identified (U.S. Dept of Transportation, 2013), which were located on rural highways typically outside of urban areas. This categorization technique was used to qualitatively identify differences in vehicle fleet compositions during our measurements since real-time vehicle count data were not collected. Two sampling collection periods were identified as a trucking route, including (1) from outside Harrisburg, PA, to New Smithville, PA, along I-81 and I-78 and (2) from Kirkwood, PA, to Colliersville, NY, along I-81 and I-88. Though the number of measurements conducted on trucking routes was limited in this case study, the average on-road δ15N(NH3) values on highway and trucking routes were 6.9±1.9 ‰ (n=12) and ‰ (n=2), respectively, which were found to be significantly different (p<0.01).
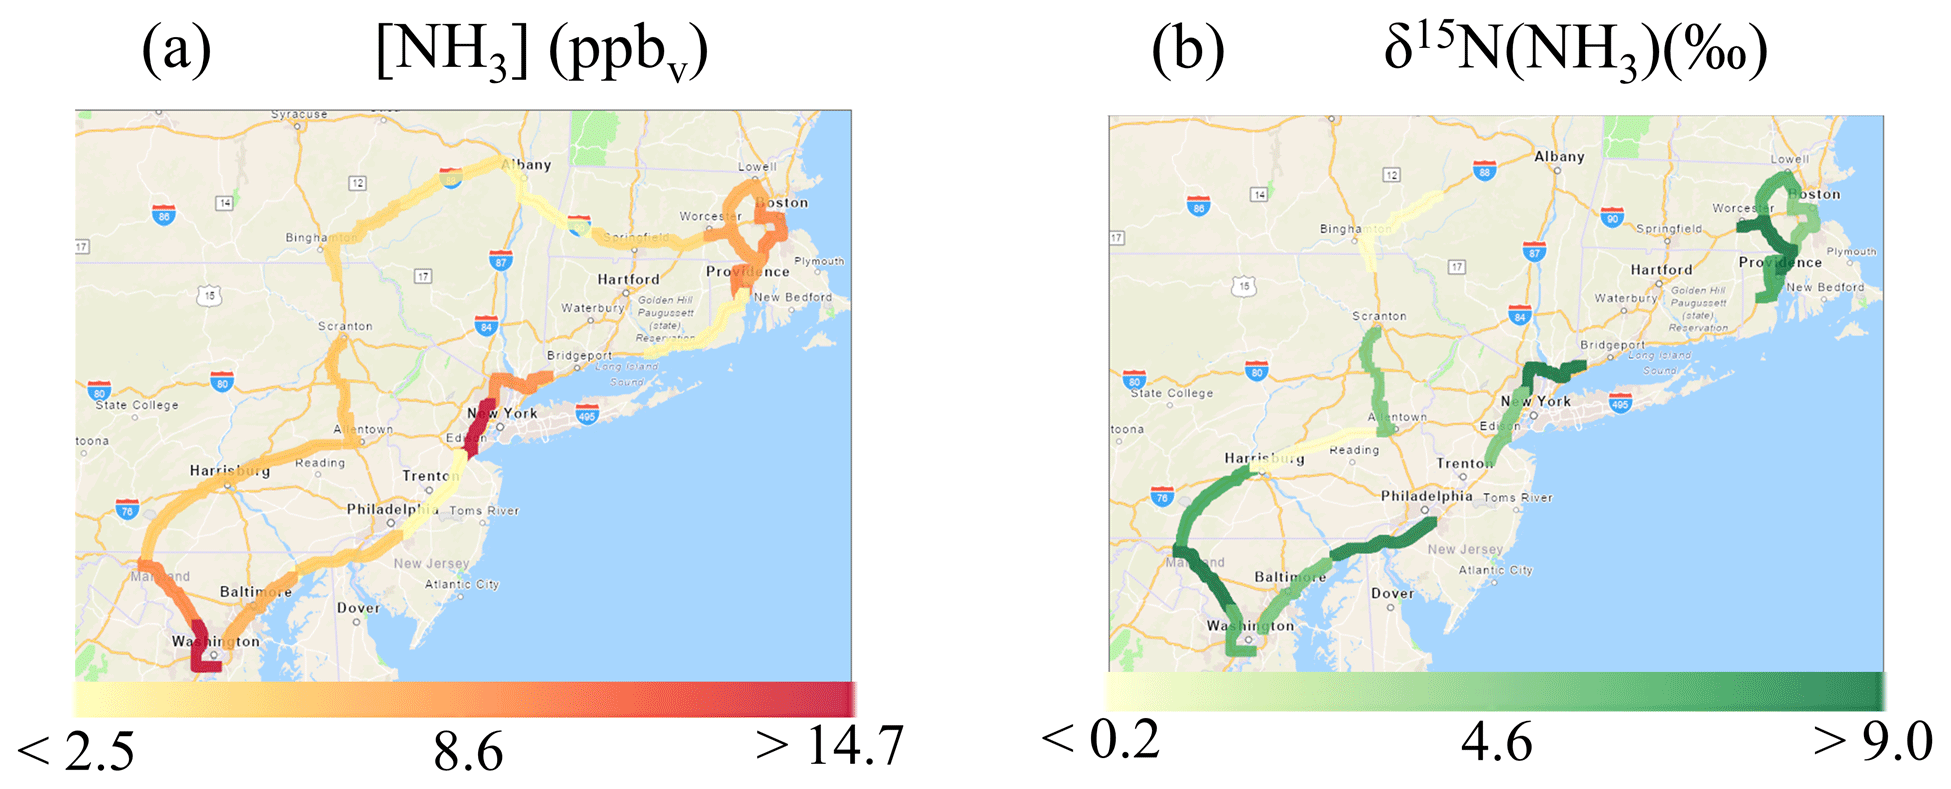
Figure 6Spatial maps of (a) mean [NH3] (ppbv) and (b) δ15N(NH3) (‰) from on-road collections in the northeastern USA. Each color represents one concentration or isotope measurement for NH3 collected over a highway segment at an approximate 1 h resolution using an acid-coated denuder. Note that there are fewer reported δ15N(NH3) values than [NH3], because some samples had an elevated blank (i.e., fBlank > 30 %) and were not measured for δ15N(NH3). Images were created using ArcGIS Copyright© 1995–2019 Esri.
3.4 Comparison between active and passive NH3 collection
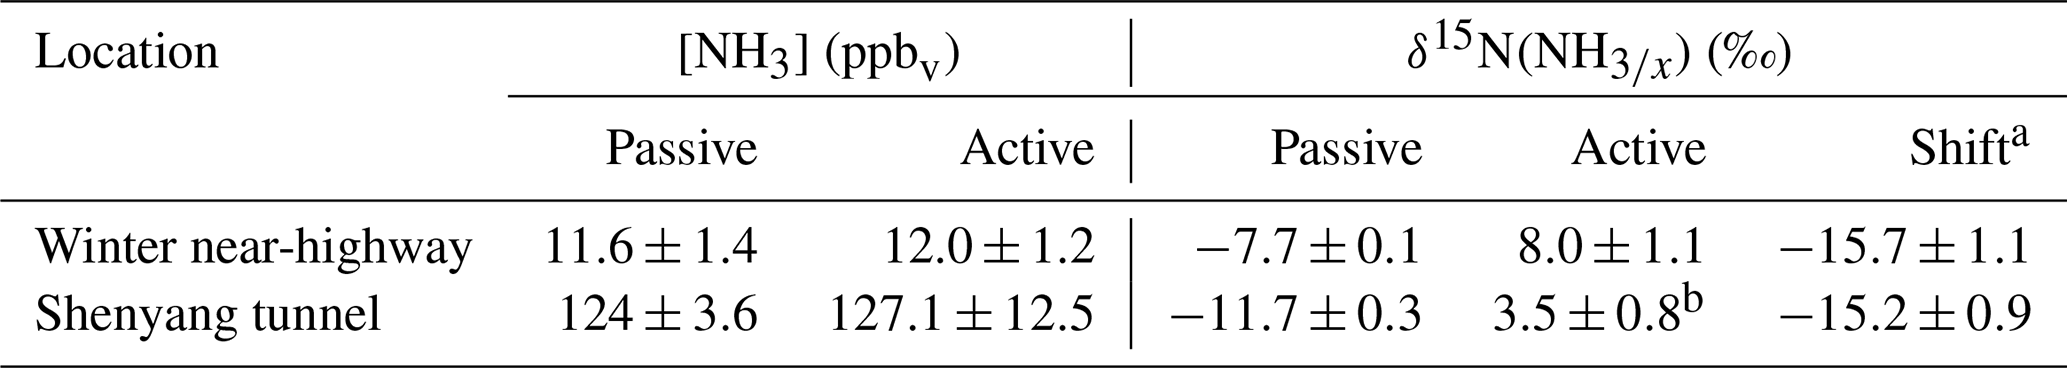
A comparison between the active and passive collection of NH3 for concentration and δ15N(NH3) characterization is summarized in Table 4. The active collection sampling technique resulted in [NH3] of 12.0±1.2 ppbv and 127.1±12.5 ppbv over the entire winter near-highway and Shenyang tunnel sampling campaigns, respectively. These concentrations were calculated from the total collected over the sampling campaign divided by the total volume of collected air for each respective campaign, and the reported uncertainty represents the RSD of the active collection technique of 9.8 %. We note that [NH3] in the Shenyang tunnel determined using the denuder-filter pack was not measured directly but was calculated from the measured [NHx] and estimated f(NH3). The passive collection resulted in [NH3] values of 11.6 ± 1.4 ppbv (n=4) and 124±3.6 ppbv (n=3) during winter at the near-highway monitoring location and in the Shenyang tunnel, respectively, which was in close agreement with the active collection technique. The mass-weighted δ15N(NHx) values using the active collection technique were 8.0±1.1 ‰ and 3.5±0.8 ‰ during winter at the near-highway monitoring location and in the Shenyang tunnel, respectively, where the uncertainty represents the propagated error (Table 4). We note that the tunnel δ15N(NH3) technically represents δ15N(NHx); however, due to the elevated estimated f(NH3), δ15N(NHx) ≈ δ15N(NH3). The passive NH3 collection technique resulted in an average δ15N(NH3) of ‰ (n=4) and ‰ (n=3) during winter at the near-highway monitoring location and in the Shenyang tunnel, respectively, which was found to be significantly different from the δ15N(NH3) measured using the active collection for each sampling campaign (p<0.01). The δ15N(NH3) difference values between passive and active collection were calculated to be ‰ and ‰ during winter at the near-highway monitoring location and in the tunnel in Shenyang China, respectively (Table 4), indicating a consistent δ15N(NH3) offset between the active and passive sampling collection techniques.
Table 4Summary of [NH3] and δ15N(NH3) from the passive and active collection of NH3 at the winter near-highway and Shenyang stationary monitoring locations.
a Calculated as the δ15N difference between passive and active NH3 collections. The uncertainty represents the propagated error between these two measurements.
b The Shenyang tunnel active measurements represent δ15N(NHx); however, due to elevated f(NH3) that averaged, δ15N(NHx) ∼ δ15N(NH3).
4.1 Traffic-plume δ15N(NH3) variability
Here we assess the drivers behind the δ15N(NH3) variabilities measured within each sampling campaign, including the seasonal difference measured at the near-highway monitoring site, the temporal variation observed during summer at the near-highway site and the Shenyang tunnel, and the spatial patterns observed from the on-road measurements. We hypothesize that the observed δ15N(NH3) variabilities could be related to (1) f(NH3) partitioning, (2) NH3 dry deposition, (3) background NH3 contributions, and/or (4) vehicle fleet composition differences.
Previously, it has been theoretically estimated and shown from field observations and laboratory studies that isotopic N equilibrium and reactions between NH3 and can scramble the 14N and 15N distributions between these molecules, leading to the preferential partitioning of 15N into (Kawashima and Ono, 2019; Savard et al., 2017; Urey, 1947; Walters et al., 2018). A significant positive correlation between f(NH3) and δ15N(NH3) during both summer and winter was observed at the near-highway monitoring location, which is consistent with influences from N isotopic equilibrium reactions. However, the δ15N(NH3) and f(NH3) relations were affected by a single influential f(NH3) value during both summer and winter, and removal of these points resulted in an insignificant relation between δ15N(NH3) and f(NH3) (Figs. S4 and S5). The temporal tunnel variability is not likely to be driven by f(NH3) partitioning influences as the estimated f(NH3) was not found to be significantly different between periods when the tunnel was open or closed (p>0.05), indicating a significant change in NH3 and partitioning did not occur during these periods. Thus, we do not expect f(NH3) partitioning and NH3 reactive sink to have played a significant role in the δ15N(NH3) variability observed at the various sampling sites. We note that the influence of N isotopic exchange reactions on δ15N(NH3) depends on the degree of NH3 and partitioning. Typically, f(NH3) was observed to be > 0.934, which would limit the influence of equilibrium exchange reactions to alter the measured δ15N(NH3) values. We also note that there is an equilibration time needed before N isotopic equilibrium between NH3 and is achieved, but this rate is currently unknown. Thermodynamic gas–fine-aerosol equilibrium has been calculated to have an equilibration time on the order of tens of minutes to several hours, depending on ambient conditions and particle characteristics (Meng and Seinfeld, 1996). Assuming a similar equilibration rate for N isotopic exchange between NH3 and would indicate that complete N isotopic equilibrium would likely not be achieved near NH3 emission sources, which is consistent with our observations.
NH3 dry deposition was not expected to contribute to the observed variability in the well-ventilated sampling conditions at the near-highway monitoring location and the on-road measurements. These measurements were conducted close to the emitted NH3 (e.g., typically within 5 m at the near-highway monitoring site), which should have minimized NH3 loss via dry deposition (Asman et al., 1998). However, NH3 dry deposition may have played an important role under the closed sampling environment of the tunnel and may explain the observed δ15N(NHx) temporal variability with higher values observed when the tunnel was open (4.2±1.7 ‰, n=14) compared to samples collected during periods when the tunnel was closed to traffic (0.1±1.3 ‰, n=7) (Table 3). Previously, lower NH3 emission ratios were reported from traffic plumes in tunnels relative to on-road highway measurements, which was concluded to result from contributions of NH3 dry deposition on the tunnel surfaces (Sun et al., 2017). If NH3 dry deposition is influenced by N isotopic equilibrium reactions between NH3 and the surface deposited , this would have resulted in NH3 depleted in 15N as it is removed from the atmosphere, resulting in lower δ15N(NH3) values (Walters et al., 2018). Indeed, a previous NH3 absorption–desorption study on minerals has shown the preferential removal of 15NH3 from the gaseous phase, with the degree of 15N depletion of the gaseous NH3 dependent upon the adsorbed NH3 amount (Sugahara et al., 2017). Thus, as the traffic plume ages in the absence of fresh emissions, we would expect NH3 dry deposition influences and the potential for N isotopic exchange reactions between the air and tunnel surface to be most significant, which might explain the lower δ15N(NHx) values observed during periods when the tunnel was closed. Dry deposition of NH3 during the day in the tunnel could have also impacted the measured δ15N(NH3) values, but the constant emission of NH3 likely resulted in nonequilibrium conditions, such that N isotopic equilibrium between the ambient NH3 and surface deposited would not have been fully achieved.
Background NH3 contributions are important to identify as a possible driver of δ15N(NH3) variability. At the near-highway monitoring site, wind sector analysis found no statistical difference in δ15N(NH3) when sorted by wind direction for either summer or winter (Fig. 2). This indicates that transport from local NH3 point sources other than vehicle emissions played a minor role in the seasonal δ15N(NH3) difference. Additionally, the similar seasonal relations between [NH3] and [CO] at the near-highway monitoring site (Fig. 3) indicate that seasonal variations in background NH3 influences at the near-highway monitoring site were minor. While dilution by background air into the Shenyang tunnel during the periods when the tunnel was closed to traffic should be considered a driver of the temporal δ15N(NHx) variability, the average [NHx] and f(NH3) values were not consistent with significant mixing in of background air. When the tunnel was closed, [NHx] averaged 79.4±14.4 ppbv (Table 3), which is elevated compared to urban background [NH3] measurements previously reported from a megacity in China (Beijing) during winter of 5.22±3.75 µg m−3 (or 6.9±4.9 ppbv) (Ianniello et al., 2010). Additionally, f(NH3) was elevated during the collection period that the tunnel was closed, averaging 0.937 ± 0.045 (Table 3), consistent with local emissions rather than contributions from background air that tends to have a lower f(NH3) value such as reported to be typically below 0.6 during November based on data collected from Beijing, China (Zhang et al., 2018). Thus, we do not expect the background NH3 contribution to have played a significant role in the tunnel temporal δ15N(NHx) variability. Furthermore, we do not expect background NH3 contributions to have played a significant role in the spatial δ15N(NH3) variability observed from the on-road measurements in the northeastern USA. While lower δ15N(NH3) values in non-urban regions might be consistent with an increased contribution from background agricultural emissions, which tend to have a low δ15N(NH3) signature (e.g., −31 ‰ to −14 ‰; Hristov et al., 2011), we expect these temperature-dependent emissions to be minimal during the winter when the on-road measurements were conducted.
Vehicle fleet compositions could have a strong influence on the measured δ15N(NH3) variabilities if gasoline- and diesel-powered engines, which utilize different types of NOx reduction technologies that lead to NH3 emissions (Suarez-Bertoa and Astorga, 2018), have different δ15N(NH3) emission signatures. Categorization of our on-road collection routes into highway routes and trucking routes resulted in statistically significantly different δ15N(NH3) values of 6.9±1.9 ‰ (n=12) and ‰ (n=2), respectively, supporting the idea that the δ15N(NH3) spatial variation was influenced by fleet composition. This would also be consistent with previous findings that vehicle fleet composition was the main driver of spatial on-road variability observed for δ15N(NOx) (Miller et al., 2017). Vehicle fleet NH3 emissions driven by reduction technologies may have also influenced the seasonal δ15N(NH3) difference observed at the near-highway monitoring location. Under cold ambient conditions of −7 ∘C, diesel-powered vehicles equipped with the selective catalytic reduction (SCR) technology were reported to have minimal emission of NH3. In comparison, gasoline-powered vehicles equipped with a three-way catalytic converter (TWCC) were reported to have increased NH3 emissions relative to warmer conditions at 23 ∘C (Suarez-Bertoa and Astorga, 2018). Vehicle fleet composition may also explain the significantly lower δ15N(NH3) values during the summer night and/or early morning collection period at the near-highway monitoring site (Table 2). Vehicle fleet composition was not monitored in this study, but a previous study has reported relatively higher truck traffic compared to gasoline vehicles from near-highway measurements during the night and/or early morning before morning rush hour (Wang et al., 2018). A lower δ15N(NH3) signature from diesel emissions compared to gasoline, as supported by our on-road measurements, would explain both the seasonal differences in δ15N(NH3) and the temporal δ15N(NH3) variability observed primarily during summer. To date, there are neither direct tailpipe measurements of δ15N(NH3) from gasoline- and diesel-powered vehicle nor an explanation for the expected δ15N(NH3) signatures of vehicle-derived emissions. Future work is needed to evaluate direct tailpipe δ15N(NH3) signatures from gasoline- and diesel-powered vehicles to test our hypothesis. We note that while there was a statistically significant seasonal difference in the measured δ15N(NH3) at the near-highway monitoring site, the absolute difference of ∼ 1.7 ‰ was small.
4.2 Comparison between active and passive NH3 collection
A comparison between active and passive sampling was conducted to evaluate the performance of the varying NH3 collection techniques. Overall, remarkably similar [NH3] values were determined using the active (i.e., denuder-filter pack) and passive (i.e., ALPHA) sampling techniques (Table 4). The finding of similar [NH3] values between passive (ALPHA) and active sampling of NH3 is consistent with previous comparisons (Day et al., 2012; Pan et al., 2020) and provides support that passive collection of NH3 may be a convenient approach for spatial documentation of near-surface [NH3].
While the two sampling techniques produced consistent [NH3], significant differences in δ15N(NH3) were observed. The mass-weighted δ15N(NH3) values using the active sampling technique were 8.0±1.1 ‰ and 3.5±0.8 ‰, while the values using the passive sampling technique were ‰ (n=4) and ‰ (n=3) at the near-highway site (winter) and in the Shenyang tunnel, respectively (Table 4). The measured traffic-derived δ15N(NH3) values via the passive sampler were similar to previous measurements utilizing a similar sampling approach that included measurements in a tunnel in the USA and a tunnel in China with reported values of ‰ (n=2) (Felix et al., 2013) and ‰ (n=8) (Chang et al., 2016), respectively. While our passive δ15N(NH3) values were generally consistent with previous reports, there are large offsets between the passive and active sampling techniques that were calculated to be ‰ and ‰ at the near-highway site and in the Shenyang tunnel, respectively (Table 4). These δ15N(NH3) offsets between passive and active NH3 collection techniques are in agreement with a value of −15.4 ‰ observed from urban background measurements conducted in Beijing, which has been concluded to be due to a diffusive isotope fractionation (Pan et al., 2020). Overall, the large δ15N(NH3) offsets observed between passive and active NH3 collection and the potential δ15N(NH3) bias in the passive collection of NH3 have several important implications. The majority of reported δ15N(NH3) source signatures have been characterized using passive sampling techniques and might be biased by approximately −15.5 ‰ under the environmental conditions during our sampling periods. These previous measurements could potentially be corrected, but further characterization of the passive sampler δ15N(NH3) offset is needed.
4.3 Urban traffic plume δ15N(NH3) signature
The measured δ15N(NH3) traffic plume signatures utilizing the active sampling technique demonstrate an overall range from −3.0 ‰ to 10.1 ‰ (Fig. 7). Our analysis indicated that δ15N(NH3) variability was influenced by fleet composition and NH3 dry deposition in aged vehicle plumes measured in a tunnel. Thus, for deriving an urban traffic plume δ15N(NH3) signature, we have considered measurements conducted under fresh plume conditions and on or near highway measurements as representative of urban vehicle NH3 emissions. These observations included the near-highway measurements conducted during both summer and winter, the mobile on-road measurements conducted on highways, and the Shenyang tunnel during operation. While there are δ15N(NH3) differences between sampling environments for this subset of observations (Fig. 7), the absolute difference in the mean δ15N(NH3) was quite small (generally within ∼ 3 ‰) and may reflect actual differences in urban vehicle fleet compositions. Overall, the constrained observations assumed to be representative of urban vehicle emissions reduces the δ15N(NH3) variability with a range of 2.1 ‰ to 10.1 ‰ (Fig. 7). The constrained δ15N(NH3) has a combined numerical average of 6.6±2.1 ‰ (n=80) (Fig. 7), which was found to not significantly differ from a normal distribution (Kolmogorov–Smirnov test of normality, p=0.528), and it is suggested to be the urban vehicle-derived traffic plume δ15N(NH3) source signature.
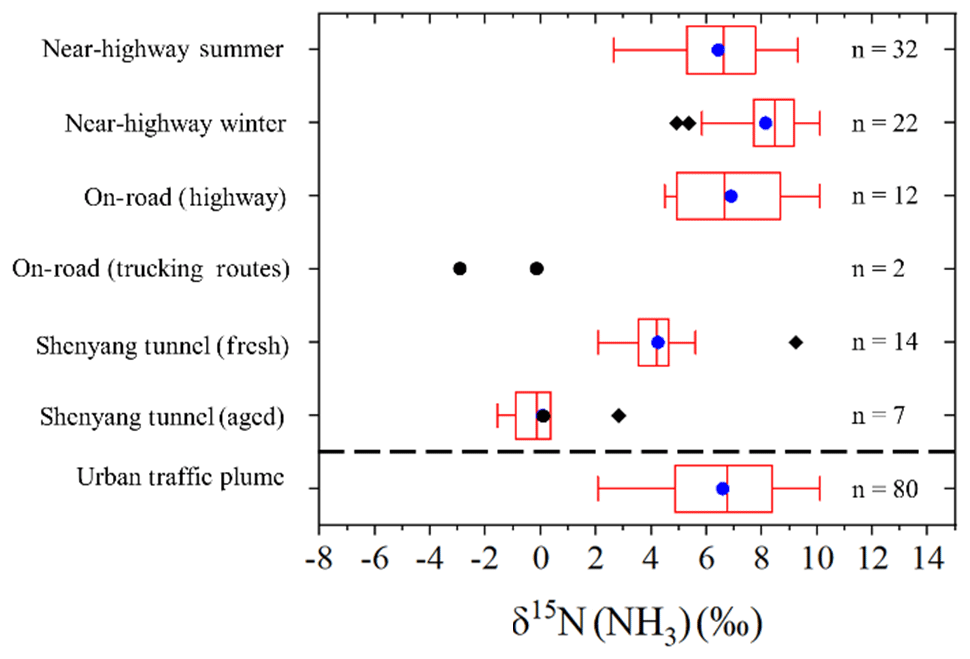
Figure 7Box and whisker plot summarizing the distribution (lower extreme, lower quartile, median (blue circle), upper quartile, upper extreme, and outliers (black diamond)) of δ15N(NH3) measurements from near-highway, on-road, and tunnel sampling. The “Urban traffic plume” category represents the combination of δ15N(NH3) measurements from the near-highway, on-road (highway), and Shenyang tunnel (fresh) sampling. No statistical summary is provided for “On-road (trucking routes)”, due to the limited number of samples in this category.
The recommended δ15N(NH3) vehicle-derived traffic signature of 6.6±2.1 ‰ (n=80) has a narrower range and higher value than previously reported vehicle signatures of −17.8 ‰ to 0.4 ‰ (Chang et al., 2016; Felix et al., 2013; Smirnoff et al., 2012). The difference between the recommended δ15N(NH3) vehicle-derived source signature and previous reports by Chang et al. (2016) and Felix et al. (2013) was found to be caused by a δ15N(NH3) bias from passive NH3 collection that was suggested to be driven by a diffusion isotope effect. The recommended δ15N(NH3) vehicle-derived source signature was also found to be statistically different from a previous report that actively sampled NH3 using a filter pack collection system, which reported an average δ15N(NH3) of ‰ (Smirnoff et al., 2012). Differences between our recommended δ15N(NH3) value and previous reports by Smirnoff et al. (2012) are difficult to identify and may be related to differences in vehicle fleet compositions. Additionally, we note that this difference may be related to the potential for a positive sampling artifact associated with filter pack collection using a particulate filter and subsequent acid-coated filter for separate and NH3 collection, respectively, as volatilization of the collected could have resulted in a NH3 collection bias (Yu et al., 2006). Indeed, previous laboratory experiments have shown that NH3 volatilized from NH4 and NO3 particles collected from filters have a δ15N(NH3) value lower than the δ15N () by 28.6±2.7 ‰ (Walters et al., 2019). Thus, volatilization could have artificially lowered the reported δ15N(NH3) value and may explain the lower δ15N(NH3) values reported in Smirnoff et al. (2012) compared to our results.
We characterized the δ15N(NH3) signatures from a variety of temporal and spatial traffic-derived plumes utilizing a laboratory-verified active collection technique demonstrated to reflect accurate δ15N(NH3) values. Overall, our measurements indicate a δ15N(NH3) range of −3.0 ‰ to 10.1 ‰ from vehicle-derived plumes representing a variety of driving conditions and fleet compositions that included stationary measurements conducted in Providence, RI, USA, and Shenyang, Liaoning, China, and mobile on-road measurements performed in the northeastern USA. These δ15N(NH3) values were found to be higher than previous reports of traffic-derived measurements that ranged between −17.8 ‰ and 0.4 ‰. Our results indicate that the majority of these previously reported lower values were due to a δ15N(NH3) collection bias of approximately −15.5 ‰ associated with passive NH3 collection, highlighting the critical need to utilize accurate δ15N(NH3) collection techniques.
Significant spatial and temporal δ15N(NH3) variabilities were observed in the seasonal and summer diel measurements conducted at the near-highway monitoring site, in aged traffic plumes in the Shenyang tunnel, and along rural trucking routes in the northeastern USA. Vehicle fleet composition was suggested to drive significant δ15N(NH3) variability, as suspected higher diesel NH3 emissions during summer relative to winter and mobile measurements conducted on trucking routes were found to result in lower δ15(NH3) values, which likely reflects differences in NH3 production via three-way catalytic converter and selective catalytic reduction technologies. Additionally, physical processing associated with NH3 dry deposition was suspected of having lowered the observed δ15N(NH3) values in the tunnel when vehicle passage was ceased. The reactive NH3 sink associated with formation was found to play a minor role in the δ15N(NH3) variability due to elevated f(NH3). Accounting for these influences, our results constrain the δ15N(NH3) signature from urban traffic-derived fresh plume emissions to 6.6±2.1 ‰ (; n=80). In addition to δ15N(NH3) characterization, our measurements demonstrate elevated NH3 emissions from vehicle plumes and a strong relationship between [NH3] and [CO] (mol mol−1) with fitted slopes of 0.025±0.005, 0.027±0.005, and 0.026±0.005 for summer near-highway, winter near-highway, and on-road measurements, respectively, which are in agreement with recent measurements in other regions. Overall, our results highlight the significance of traffic-derived NH3 emissions and demonstrate the potential to use δ15N(NH3) to track its contributions to chemistry and N deposition budgets.
The results of this study have important implications for evaluating NH3 budgets, particularly in urban regions. The measured δ15N(NH3) traffic signature (6.6±2.1 ‰, n=80) is unique as it is the only source that has a reported positive δ15N(NH3) value. Thus, δ15N(NH3) may be a useful tracer to evaluate the contribution of traffic-derived emissions in urban regions and to evaluate the connection between urban NH3 emissions and its role in PM2.5 formation. Our demonstrated approach for utilizing a laboratory-verified technique with potential for hourly time resolution is applicable for constraining other important NH3 emission sources and to produce a consistent database of δ15N(NH3) source signature values. Future work is needed to accurately characterize and improve upon the δ15N(NH3) source inventory and evaluate potential fractionation influences associated with NHx plume aging and deposition.
Data presented in this article are available on the Brown Digital Repository at https://doi.org/10.26300/q3h4-7s93 (Walters, 2020).
The supplement related to this article is available online at: https://doi.org/10.5194/acp-20-11551-2020-supplement.
WWW, LS, JC, YF, and MGH designed varying aspects of the field sampling plan. WWW, LS, JC, and NC were involved in carrying out the field measurements. WWW and LS conducted all laboratory analyses of data. WWW prepared the article with contributions from all co-authors.
The authors declare that they have no conflict of interest.
Wendell W. Walters acknowledges support from an Atmospheric and Geospace Sciences National Science Foundation Postdoctoral Fellowship during this study. We thank Ruby Ho, Joseph Orchardo, Yihang Duan, and many others for sampling and laboratory assistance. We are grateful to Paul Theroux of RI-DEM/RI-DOH for access and support at the RI-DEM air-monitoring site and for providing data. from these sites for our analyses.
This research has been supported by the National Science Foundation, Division of Atmospheric and Geospace Sciences (grant nos. 1624618 and 1351932), the National Key R&D Program (grant no. 2017YFC0212704), the National Research Program for Key Issues in Air Pollution Control (grant no. DQGG0105-02), and the Institute at Brown for Environment and Society (internal grant no. GR300123).
This paper was edited by Steven Brown and reviewed by two anonymous referees.
Ali, Z., Thomas, C. L. P., and Alder, J. F.: Denuder tubes for sampling of gaseous species. A review, Analyst, 114, 759–769, 1989.
Asman, W. A., Sutton, M. A., and Schjørring, J. K.: Ammonia: emission, atmospheric transport and deposition, New Phytol., 139, 27–48, 1998.
Behera, S. N. and Sharma, M.: Investigating the potential role of ammonia in ion chemistry of fine particulate matter formation for an urban environment, Sci. Total Environ., 408, 3569–3575, 2010.
Behera, S. N. and Sharma, M.: Transformation of atmospheric ammonia and acid gases into components of PM2.5: an environmental chamber study, Environ. Sci. Pollut. R., 19, 1187–1197, 2012.
Behera, S. N., Sharma, M., Aneja, V. P., and Balasubramanian, R.: Ammonia in the atmosphere: a review on emission sources, atmospheric chemistry and deposition on terrestrial bodies, Environ. Sci. Pollut. R., 20, 8092–8131, 2013.
Bohlke, J. K., Gwinn, C. J., and Coplen, T. B.: New Reference Materials for Nitrogen-Isotope-Ratio Measurements, Geostandard. Newslett., 17, 159–164, 1993.
Bolan, N. S., Hedley, M. J., and White, R. E.: Processes of soil acidification during nitrogen cycling with emphasis on legume based pastures, Plant Soil, 134, 53–63, 1991.
Bouwman, A. F., Lee, D. S., Asman, W. A. H., Dentener, F. J., Van Der Hoek, K. W., and Olivier, J. G. J.: A global high-resolution emission inventory for ammonia, Global Biogeochem. Cy., 11, 561–587, 1997.
Chang, Y., Liu, X., Deng, C., Dore, A. J., and Zhuang, G.: Source apportionment of atmospheric ammonia before, during, and after the 2014 APEC summit in Beijing using stable nitrogen isotope signatures, Atmos. Chem. Phys., 16, 11635–11647, https://doi.org/10.5194/acp-16-11635-2016, 2016.
Clarisse, L., Clerbaux, C., Dentener, F., Hurtmans, D., and Coheur, P.-F.: Global ammonia distribution derived from infrared satellite observations, Nat. Geosci., 2, 479–483, 2009.
Day, D. E., Chen, X., Gebhart, K. A., Carrico, C. M., Schwandner, F. M., Benedict, K. B., Schichtel, B. A., and Collett, J. L.: Spatial and temporal variability of ammonia and other inorganic aerosol species, Atmos. Environ., 61 (Supplement C), 490–498, 2012.
Decina, S. M., Templer, P. H., Hutyra, L. R., Gately, C. K., and Rao, P.: Variability, drivers, and effects of atmospheric nitrogen inputs across an urban area: emerging patterns among human activities, the atmosphere, and soils, Sci. Total Environ., 609, 1524–1534, 2017.
Decina, S. M., Hutyra, L. R., and Templer, P. H.: Hotspots of nitrogen deposition in the world's urban areas: a global data synthesis, Front. Ecol. Environ., 18, 92–100, 2020.
Erisman, J. W., Sutton, M. A., Galloway, J., Klimont, Z., and Winiwarter, W.: How a century of ammonia synthesis changed the world, Nat. Geosci., 1, 636–639, 2008.
Felix, D. J., Elliott, E. M., Gish, T. J., McConnell, L. L., and Shaw, S. L.: Characterizing the isotopic composition of atmospheric ammonia emission sources using passive samplers and a combined oxidation-bacterial denitrifier approach, Rapid Commun. Mass Sp., 27, 2239–2246, 2013.
Felix, J. D., Elliott, E. M., and Gay, D. A.: Spatial and temporal patterns of nitrogen isotopic composition of ammonia at U.S. ammonia monitoring network sites, Atmos. Environ., 150 (Supplement C), 434–442, 2017.
Fenn, M. E., Bytnerowicz, A., Schilling, S. L., Vallano, D. M., Zavaleta, E. S., Weiss, S. B., Morozumi, C., Geiser, L. H., and Hanks, K.: On-road emissions of ammonia: An underappreciated source of atmospheric nitrogen deposition, Sci. Total Environ., 625, 909–919, 2018.
Fountoukis, C. and Nenes, A.: ISORROPIA II: a computationally efficient thermodynamic equilibrium model for K+–Ca2+–Mg2+––Na+–––Cl−–H2O aerosols, Atmos. Chem. Phys., 7, 4639–4659, https://doi.org/10.5194/acp-7-4639-2007, 2007.
Freyer, H. D.: Seasonal trends of and nitrogen isotope composition in rain collected at Jülich, Germany, Tellus, 30, 83–92, 1978.
Galloway, J. N., Dentener, F. J., Capone, D. G., Boyer, E. W., Howarth, R. W., Seitzinger, S. P., Asner, G. P., Cleveland, C., Green, P., and Holland, E.: Nitrogen cycles: past, present, and future, Biogeochemistry, 70, 153–226, 2004.
Gonfiantini, R.: Stable isotope reference samples for geochemical and hydrological investigations, Rep. Advis. Group, Vienna, 1984.
Gong, L., Lewicki, R., Griffin, R. J., Flynn, J. H., Lefer, B. L., and Tittel, F. K.: Atmospheric ammonia measurements in Houston, TX using an external-cavity quantum cascade laser-based sensor, Atmos. Chem. Phys., 11, 9721–9733, https://doi.org/10.5194/acp-11-9721-2011, 2011.
Heaton, T. H. E.: 15N14N ratios of nitrate and ammonium in rain at Pretoria, South Africa, Atmos. Environ. 1967, 21, 843–852, 1987.
Hristov, A. N., Hanigan, M., Cole, A., Todd, R., McAllister, T. A., Ndegwa, P. M., and Rotz, A.: Review: ammonia emissions from dairy farms and beef feedlots, Can. J. Anim. Sci., 91, 1–35, 2011.
Hu, Q., Zhang, L., Evans, G. J., and Yao, X.: Variability of atmospheric ammonia related to potential emission sources in downtown Toronto, Canada, Atmos. Environ., 99 (Supplement C), 365–373, 2014.
Ianniello, A., Spataro, F., Esposito, G., Allegrini, I., Rantica, E., Ancora, M. P., Hu, M., and Zhu, T.: Occurrence of gas phase ammonia in the area of Beijing (China), Atmos. Chem. Phys., 10, 9487–9503, https://doi.org/10.5194/acp-10-9487-2010, 2010.
Kawashima, H. and Ono, S.: Nitrogen Isotope Fractionation from Ammonia Gas to Ammonium in Particulate Ammonium Chloride, Environ. Sci. Technol., 53, 10629–10635, 2019.
Koutrakis, P., Wolfson, J. M., and Spengler, J. D.: An improved method for measuring aerosol strong acidity: results from a nine-month study in St Louis, Missouri and Kingston, Tennessee, Atmos. Environ. 1967, 22, 157–162, 1988.
Koutrakis, P., Sioutas, C., Ferguson, S. T., Wolfson, J. M., Mulik, J. D., and Burton, R. M.: Development and evaluation of a glass honeycomb denuder/filter pack system to collect atmospheric gases and particles, Environ. Sci. Technol., 27, 2497–2501, 1993.
Li, Y., Schwab, J. J., and Demerjian, K. L.: Measurements of ambient ammonia using a tunable diode laser absorption spectrometer: Characteristics of ambient ammonia emissions in an urban area of New York City, J. Geophys. Res.-Atmos., 111, D10S02, 2006.
Li, Y., Schichtel, B. A., Walker, J. T., Schwede, D. B., Chen, X., Lehmann, C. M. B., Puchalski, M. A., Gay, D. A., and Collett, J. L.: Increasing importance of deposition of reduced nitrogen in the United States, P. Natl. Acad. Sci. USA, 113, 5874–5879, 2016.
Livingston, C., Rieger, P., and Winer, A.: Ammonia emissions from a representative in-use fleet of light and medium-duty vehicles in the California South Coast Air Basin, Atmos. Environ., 43, 3326–3333, 2009.
McIlvin, M. R. and Altabet, M. A.: Chemical Conversion of Nitrate and Nitrite to Nitrous Oxide for Nitrogen and Oxygen Isotopic Analysis in Freshwater and Seawater, Anal. Chem., 77, 5589–5595, 2005.
Meng, Z. and Seinfeld, J. H.: Time scales to achieve atmospheric gas-aerosol equilibrium for volatile species, Atmos. Environ., 30, 2889–2900, 1996.
Meng, Z. Y., Lin, W. L., Jiang, X. M., Yan, P., Wang, Y., Zhang, Y. M., Jia, X. F., and Yu, X. L.: Characteristics of atmospheric ammonia over Beijing, China, Atmos. Chem. Phys., 11, 6139–6151, https://doi.org/10.5194/acp-11-6139-2011, 2011.
Miller, D. J., Wojtal, P. K., Clark, S. C., and Hastings, M. G.: Vehicle NOx emission plume isotopic signatures: Spatial variability across the eastern United States, J. Geophys. Res.-Atmos., 122, 4698–4717, https://doi.org/10.1002/2016JD025877, 2017.
Nenes, A., Pandis, S. N., and Pilinis, C.: ISORROPIA: A new thermodynamic equilibrium model for multiphase multicomponent inorganic aerosols, Aquat. Geochem., 4, 123–152, 1998.
Nowak, J. B., Neuman, J. A., Bahreini, R., Middlebrook, A. M., Holloway, J. S., McKeen, S. A., Parrish, D. D., Ryerson, T. B., and Trainer, M.: Ammonia sources in the California South Coast Air Basin and their impact on ammonium nitrate formation, Geophys. Res. Lett., 39, L07804, https://doi.org/10.1029/2012GL051197, 2012.
Pan, Y., Gu, M., Song, L., Tian, S., Wu, D., Walters, W. W., Yu, X., Lü, X., Ni, X., and Wang, Y.: Systematic low bias of passive samplers in characterizing nitrogen isotopic composition of atmospheric ammonia, Atmos. Res., 243, 105018, https://doi.org/10.1016/j.atmosres.2020.105018, 2020.
Savard, M. M., Cole, A., Smirnoff, A., and Vet, R.: δ15N values of atmospheric N species simultaneously collected using sector-based samplers distant from sources – Isotopic inheritance and fractionation, Atmos. Environ., 162, 11–22, 2017.
Saylor, R. D., Edgerton, E. S., Hartsell, B. E., Baumann, K., and Hansen, D. A.: Continuous gaseous and total ammonia measurements from the southeastern aerosol research and characterization (SEARCH) study, Atmos. Environ., 44, 4994–5004, 2010.
Shah, V., Jaeglé, L., Thornton, J. A., Lopez-Hilfiker, F. D., Lee, B. H., Schroder, J. C., Campuzano-Jost, P., Jimenez, J. L., Guo, H., Sullivan, A. P., Weber, R. J., Green, J. R., Fiddler, M. N., Bililign, S., Campos, T. L., Stell, M., Weinheimer, A. J., Montzka, D. D., and Brown, S. S.: Chemical feedbacks weaken the wintertime response of particulate sulfate and nitrate to emissions reductions over the eastern United States, P. Natl. Acad. Sci. USA, 115, 8110–8115, 2018.
Skinner, R., Ineson, P., Jones, H., Sleep, D., and Theobald, M.: Sampling systems for isotope-ratio mass spectrometry of atmospheric ammonia, Rapid Commun. Mass Sp., 20, 81–88, 2006.
Smirnoff, A., Savard, M. M., Vet, R., and Simard, M.-C.: Nitrogen and triple oxygen isotopes in near-road air samples using chemical conversion and thermal decomposition, Rapid Commun. Mass Sp., 26, 2791–2804, 2012.
Suarez-Bertoa, R. and Astorga, C.: Impact of cold temperature on Euro 6 passenger car emissions, Environ. Pollut., 234, 318–329, 2018.
Sugahara, H., Takano, Y., Ogawa, N. O., Chikaraishi, Y., and Ohkouchi, N.: Nitrogen Isotopic Fractionation in Ammonia during Adsorption on Silicate Surfaces, ACS Earth Space Chem., 1, 24–29, 2017.
Sun, K., Tao, L., Miller, D. J., Khan, M. A., and Zondlo, M. A.: On-Road Ammonia Emissions Characterized by Mobile, Open-Path Measurements, Environ. Sci. Technol., 48, 3943–3950, 2014.
Sun, K., Tao, L., Miller, D. J., Pan, D., Golston, L. M., Zondlo, M. A., Griffin, R. J., Wallace, H. W., Leong, Y. J., Yang, M. M., Zhang, Y., Mauzerall, D. L., and Zhu, T.: Vehicle Emissions as an Important Urban Ammonia Source in the United States and China, Environ. Sci. Technol., 51, 2472–2481, 2017.
Sutton, M. A., Dragosits, U., Tang, Y. S., and Fowler, D.: Ammonia emissions from non-agricultural sources in the UK, Atmos. Environ., 34, 855–869, 2000.
Sutton, M. A., Erisman, J. W., Dentener, F., and Möller, D.: Ammonia in the environment: from ancient times to the present, Environ. Pollut., 156, 583–604, 2008.
Updyke, K. M., Nguyen, T. B., and Nizkorodov, S. A.: Formation of brown carbon via reactions of ammonia with secondary organic aerosols from biogenic and anthropogenic precursors, Atmos. Environ., 63, 22–31, 2012.
Urey, H. C.: The thermodynamic properties of isotopic substances, J. Chem. Soc., 7, 562–581, 1947.
U.S. Department of Transportation: Major truck routes on the NHS: 2011, Federal Highway Administration, Office of Freight Management and Operations, freight analysis framework, version 3.4, 2013.
Van Damme, M., Clarisse, L., Whitburn, S., Hadji-Lazaro, J., Hurtmans, D., Clerbaux, C., and Coheur, P.-F.: Industrial and agricultural ammonia point sources exposed, Nature, 564, 99–103, 2018.
Walters, W.: Data for “Constraining Ammonia Emissions in Traffic-Derived Plumes Utilizing Nitrogen Stable Isotopes”, Brown University Open Data Collection. Brown Digital Repository, Brown University Library, https://doi.org/10.26300/q3h4-7s93, 2020.
Walters, W. W. and Hastings, M. G.: Collection of Ammonia for High Time-Resolved Nitrogen Isotopic Characterization Utilizing an Acid-Coated Honeycomb Denuder, Anal. Chem., 90, 8051–8057, 2018.
Walters, W. W., Chai, J., and Hastings, M. G.: Theoretical Phase Resolved Ammonia–Ammonium Nitrogen Equilibrium Isotope Exchange Fractionations: Applications for Tracking Atmospheric Ammonia Gas-to-Particle Conversion, ACS Earth Space Chem., 3, 79–89, 2018.
Walters, W. W., Blum, D. E., and Hastings, M. G.: Selective Collection of Particulate Ammonium for Nitrogen Isotopic Characterization Using a Denuder–Filter Pack Sampling Device, Anal. Chem., 91, 7586–7594, 2019.
Wang, J. M., Jeong, C.-H., Zimmerman, N., Healy, R. M., and Evans, G. J.: Real world vehicle fleet emission factors: Seasonal and diurnal variations in traffic related air pollutants, Atmos. Environ., 184, 77–86, 2018.
Wang, S., Nan, J., Shi, C., Fu, Q., Gao, S., Wang, D., Cui, H., Saiz-Lopez, A., and Zhou, B.: Atmospheric ammonia and its impacts on regional air quality over the megacity of Shanghai, China, Sci. Rep.-UK, 5, 15842, https://doi.org/10.1038/srep15842, 2015.
Whitehead, J. D., Longley, I. D., and Gallagher, M. W.: Seasonal and Diurnal Variation in Atmospheric Ammonia in an Urban Environment Measured Using a Quantum Cascade Laser Absorption Spectrometer, Water Air Soil Poll., 183, 317–329, 2007.
Xiao, H.-W., Xiao, H.-Y., Long, A.-M., and Liu, C.-Q.: variations of rainwater: Application of the Rayleigh model, Atmospheric Res., 157, 49–55, 2015.
Yu, X.-Y., Lee, T., Ayres, B., Kreidenweis, S. M., Collett Jr., J. L., and Malm, W.: Particulate Nitrate Measurement Using Nylon Filters, JAPCA J. Air Waste Ma., 55, 1100–1110, 2005.
Yu, X.-Y., Lee, T., Ayres, B., Kreidenweis, S. M., Malm, W., and Collett, J. L.: Loss of fine particle ammonium from denuded nylon filters, Atmos. Environ., 40, 4797–4807, 2006.
Zhang, L., Altabet, M. A., Wu, T., and Hadas, O.: Sensitive measurement of 15N∕14N() at natural abundance levels in fresh and saltwaters, Anal. Chem., 79, 5297–5303, 2007.
Zhang, Y., Tang, A., Wang, D., Wang, Q., Benedict, K., Zhang, L., Liu, D., Li, Y., Collett Jr., J. L., Sun, Y., and Liu, X.: The vertical variability of ammonia in urban Beijing, China, Atmos. Chem. Phys., 18, 16385–16398, https://doi.org/10.5194/acp-18-16385-2018, 2018.