the Creative Commons Attribution 4.0 License.
the Creative Commons Attribution 4.0 License.
 | 07 Oct 2020
Formation and sink of glyoxal and methylglyoxal in a polluted subtropical environment: observation-based photochemical analysis and impact evaluation
Zhenhao Ling
Qianqian Xie
Min Shao
Xuemei Wang
The dicarbonyls glyoxal (Gly) and methylglyoxal (Mgly) have been recognized as important precursors of secondary organic aerosols (SOAs) through the atmospheric heterogeneous process. In this study, field measurement was conducted at a receptor site in the Pearl River Delta (PRD) region in southern China, and an observation-based photochemical box model was subsequently applied to investigate the production and evolution of Gly and Mgly as well as their contributions to SOA formation. The model was coupled with a detailed gas-phase oxidation mechanism of volatile organic compounds (VOCs) (i.e., Master Chemical Mechanism, MCM, v3.2), heterogeneous processes of Gly and Mgly (i.e., reversible partitioning in aqueous phase, irreversible volume reactions and irreversible surface uptake processes), and the gas–particle partitioning of oxidation products. The results suggested that without considering the heterogeneous processes of Gly and Mgly on aerosol surfaces, the model would overpredict the mixing ratios of Gly and Mgly by factors of 3.3 and 3.5 compared to the observed levels. The agreement between observation and simulation improved significantly when the irreversible uptake and the reversible partitioning were incorporated into the model, which in total both contributed ∼ 62 % to the destruction of Gly and Mgly during daytime. Further analysis of the photochemical budget of Gly and Mgly showed that the oxidation of aromatics by the OH radical was the major pathway producing Gly and Mgly, followed by degradation of alkynes and alkenes. Furthermore, based on the improved model mechanism, the contributions of VOC oxidation to SOA formed from gas–particle partitioning (SOAgp) and from heterogeneous processes of Gly and Mgly (SOAhet) were also quantified. It was found that o-xylene was the most significant contributor to SOAgp formation (∼ 29 %), while m,p-xylene and toluene made dominant contributions to SOAhet formation. Overall, the heterogeneous processes of Gly and Mgly can explain ∼ 21 % of SOA mass in the PRD region. The results of this study demonstrated the important roles of heterogeneous processes of Gly and Mgly in SOA formation and highlighted the need for a better understanding of the evolution of intermediate oxidation products.
- Article
(2065 KB) - Full-text XML
-
Supplement
(398 KB) - BibTeX
- EndNote


Organic aerosols (OAs) are important components of atmospheric aerosols, with important impacts on radiation balance, air quality, atmospheric oxidative capacity and climate change (Zhu et al., 2011; Carlton et al., 2009; Hoyle et al., 2009). In addition to the primary organic components (primary OA, POA) directly emitted from various sources in the particulate form, a large fraction of OAs are secondarily produced (SOA) through the aging of POAs and through complex homogenous and/or heterogeneous reactions of volatile or semivolatile organic compounds (VOCs, SVOCs) (Jimenez et al., 2009; Steinfeld et al., 1998). SOA has frequently been observed to dominate the OA in many regions, particularly during severe haze pollution events (Guo et al., 2012; Zhang et al., 2017). However, the characteristics of SOAs are still poorly understood because of their complicated formation mechanisms, various chemical compositions and multitude of precursors from diverse emissions, thus making SOAs an important research topic in the field of the atmospheric environment.
In addition to primary precursors including isoprene, terpene and aromatic hydrocarbons, glyoxal (Gly) and methylglyoxal (Mgly) have been recognized to be of critical importance to SOA formation, especially through heterogeneous and multiphase processes, in many laboratory and model studies (Waxman, et al., 2013, 2015; McNeill et al., 2015; De Haan et al., 2009; Fu et al., 2008). Many efforts have been made to investigate the sources, evolution of Gly and Mgly and their contributions to SOA (Benavent et al., 2019; Zhang et al., 2016; Sumner et al., 2014; DiGangi et al., 2012; Stavarakou et al., 2009). For example, Li et al. (2015) constructed a master chemical mechanism with an equilibrium partitioning module and coupled it in the Community Multiscale Air Quality Model (CMAQ) to predict the regional concentrations of SOA from VOCs in the eastern United States (US). It was found that those SOAs formed from Gly and Mgly accounted for more than 35 % of total SOA. Similarly, Ying et al. (2015) used a modified SAPRC-11 (S11) photochemical mechanism, considering the surface-controlled reactive uptake of Gly and Mgly, and incorporated the mechanism in the CMAQ model to simulate ambient SOA concentrations during summer in the eastern US. The results showed that the uptake of Gly and Mgly resulted in the significant improvement in predicated SOA concentration, and the aerosol surface uptake of isoprene-generated Gly, Mgly and epoxydiol accounted for more than 45 % of total SOA.
As the two smallest dicarbonyl compounds, the sources of Gly and Mgly are complicated. It has been well documented that Gly and Mgly have limited primary sources except biomass burning and biofuel combustion (Grosjean et al., 2001; Zhang et al., 2016). Furthermore, the primary emissions of Gly and Mgly were much less significant than those secondarily from photochemical reactions (Lv et al., 2019). Fu et al. (2008) estimated that primary emissions only accounted for about 4 % and 17 % of the total emissions of Mgly and Gly, respectively. On a global scale, isoprene and ethyne are the most important precursors of Gly and Mgly; on the local scale, however, degradation of aromatics is the major pathway for the production of Gly and Mgly in urban and suburban areas. For example, the oxidation of aromatics contributed to approximately 75 % of Gly formation in Mexico City (Li et al., 2014; Volkamer et al., 2007).
As for the atmospheric sink for Gly and Mgly, the photolysis, reaction with OH, dry deposition and heterogenous processes are considered as the main loss pathways, among which aerosol uptake is most complicated and needs more comprehensive exploration (De Haan et al., 2018; McNeill, 2015; Knote et al., 2014; Fu et al., 2008). The uptake of Gly and Mgly onto inorganic or organic particles has been studied in laboratory experiments under controlled conditions (De Haan et al., 2018; Liggio et al., 2005), and uptake coefficients (γ) were measured by the loss of gas-phase concentration or the increase in particle organic mass, within the range of ∼ 10−4 to 10−2 (De Haan et al., 2018; Pye et al., 2017; Liggio et al., 2005). The lower γ value was probably related to the kinetic limitations (Ervens and Volkman, 2010), while the higher γ value may be associated with the increased particle acidity (Liggio et al., 2005), relative humidity (De Haan et al., 2018; Corrigan et al., 2008) and ionic strength (Kroll et al., 2005). In addition, ammonium-catalyzed and OH reactions were found to have significant influences on the surface uptake of dicarbonyls (Knote et al., 2014; Kampf et al., 2013; Noziere et al., 2008), and the rate coefficients were found to increase with the increasing ammonium ion activity (a) and pH (Noziere et al., 2008). The “salting-in” effects resulting from the increased ionic strength could cause significant increase (∼ 3 orders of magnitude) of Henry's law constant for Gly, affecting the gas-aqueous partitioning of Gly and enhanced the available Gly for aqueous reactions (Kampf et al., 2013; Knote et al., 2014; Waxman et al., 2015).
The uptake processes of Gly and Mgly derived from the laboratory studies were incorporated into different models to investigate their formation and destruction (Knote et al., 2014; Pye et al., 2017; Yu et al., 2011). It was found that solely incorporating the irreversible uptake pathways of dicarbonyls could lead to a high discrepancy between the observation and simulation results from the global 3D model and other models (Hu et al., 2017; N. Li et al., 2013; Li et al., 2014), highlighting the needs to consider more comprehensive processes including both reversible and irreversible pathways for better simulating the dicarbonyls. Those previous studies showed that the contribution of heterogeneous processes to the destruction of dicarbonyls varied in the range of 0 %–80 %, which depended on the relative humidity, the precursors incorporated into the model and the aerosol concentrations for the given region (Knote et al., 2014).
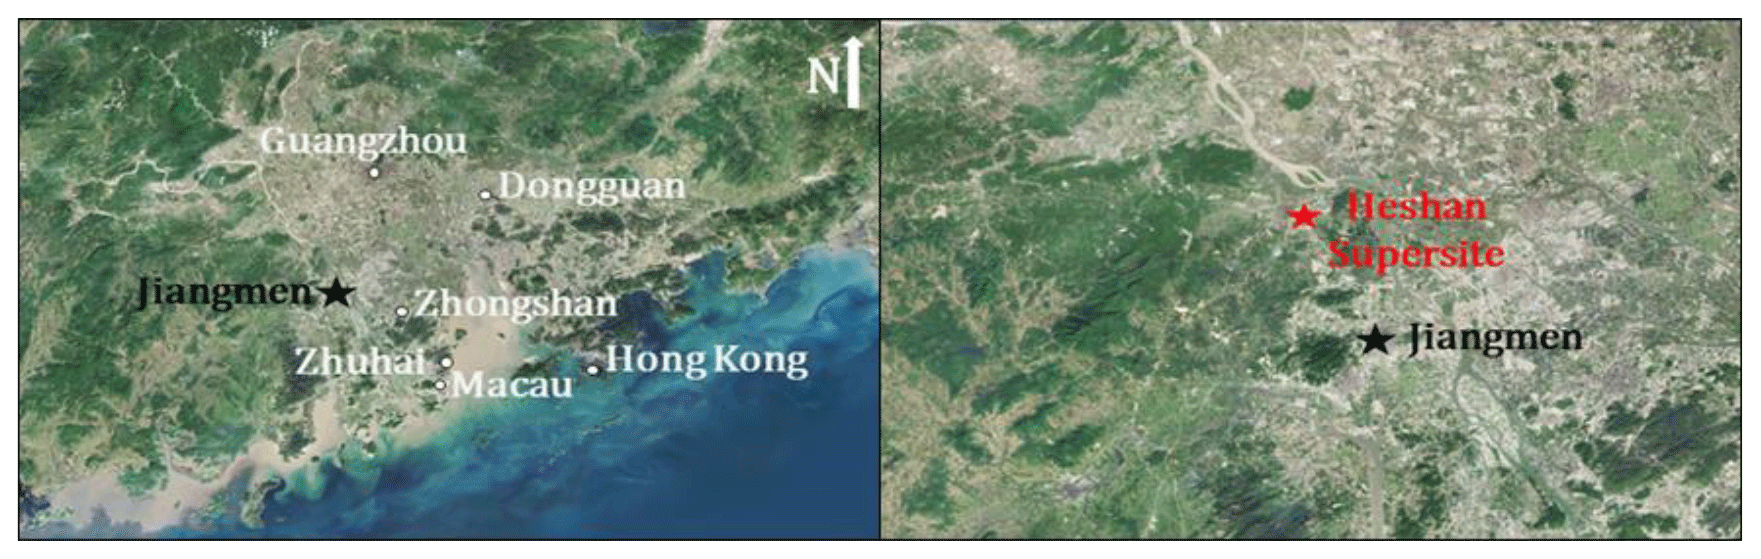
Figure 1The location of sampling site and its surrounding environment in the Pearl River Delta region. The base map is from © Google Maps.
The Pearl River Delta (PRD) region has been experiencing rapid industrialization and urbanization in the last 3 decades, making it one of the most developed regions in China. The filed measurement results suggested that OA contributed 30 %–40 % to PM2.5 mass and that SOA dominated the OA with fractions up to ∼ 80 % in the PRD (Huang et al., 2014; He et al., 2011). Furthermore, the contribution of SOA in PM2.5 has been increasing in recent years, highlighting the necessity for better understanding the formation of SOA in this region (Wu et al., 2019; Wang et al., 2019). However, a model simulation that provides robust information on the influence of physical processes and chemical degradation in SOA formation still underpredicts the SOA abundance with only traditional VOC precursors incorporated, hindering better understanding of the sources and formation mechanism of SOA in the PRD (Wu et al., 2019; Fu et al., 2012; Wang et al., 2009). It was found that incorporating emissions of Gly and Mgly and their degradation mechanisms could effectively narrow the gap between the measured and modeled SOA (Fu et al., 2012; N. Li et al., 2013). However, only the simple parameterization of surface uptake of Gly and Mgly without detailed physical and chemical processes (e.g., reversible partitioning of Gly and Mgly into deliquesced droplets) in the model could bias the evolution of Gly and Mgly, leading to the poor understanding of the budgets of Gly and Mgly, their relationship with precursors, and the contributions of precursors to SOA formation in the PRD (De Haan et al., 2018; Waxman et al., 2015; Knote et al., 2014; N. Li et al., 2013; X. Li et al., 2013; Li et al., 2014; Lu et al., 2013). Therefore, to improve the model performance for the simulation of Gly and Mgly and to investigate their evolution and contribution to SOA formation, the observation data from a receptor site in the PRD region were analyzed by a photochemical box model with near-explicit chemical mechanisms (i.e., the Master Chemical Mechanism, MCM), improvements with reversible and irreversible heterogeneous processes of Gly and Mgly, and the gas–particle partitioning of oxidation products in the present study. The production and evolution of Gly, Mgly and other intermediate products were investigated. The observed and simulated levels of Gly and Mgly were compared to evaluate the performance of the model, which was further used to quantify the contributions of individual VOCs to SOA formation at the receptor site of PRD.
2.1 Field measurement
Field measurements were carried out at Guangdong provincial atmospheric supersite located at Heshan (22.728∘ N, 112.929∘ E, 60 m above sea level) in the city of Jiangmen in the PRD region. The sampling site is located about 50 and 80 km southwest from Foshan and Guangzhou, respectively. The Heshan site is surrounded by mountain areas with trees and subtropical plants, and the location of the site is showed in Fig. 1. Ambient measurement of VOCs, carbonyls and other trace gases was conducted during 2–8 January 2017, when the dominant wind was mainly from the southeast where the center of PRD (i.e., Zhuhai and Zhongshan) was located. A detailed description of the Heshan site and the measurement methodology was provided in our previous studies (Chang et al., 2019; Yun et al., 2018).
Briefly, mono-carbonyls, Gly and Mgly were collected with 2,4-dinitrophenylhydrazine cartridges every 3 h and detected using a high-performance liquid chromatography (HPLC) system (PerkinElmer 200 Series, US). The hourly VOCs were measured using a cryogen-free automatic gas chromatograph system equipped with a mass spectrometer and a flame ionization detector (GC-MS/FID) (Wang et al., 2014). CO, SO2 and O3 were measured using a gas filter correlation analyzer, a pulsed fluorescence analyzer and a UV photometric analyzer, respectively (Thermo Scientific 48i, 43i, 49i). NO and NO2 were detected using a chemiluminescence instrument (Thermo Scientific 42i) with a photolytic converter (Xu et al., 2013). The method detection limits for non-methane hydrocarbons (NMHCs), carbonyls, CO, SO2, O3, NO and NO2 were 20–300, 20–450, 4000, 100, 500, 60 and 300 pptv, respectively (Yun et al., 2018; Chang et al., 2019; Li et al., 2020). The measurement method uncertainty in the retrieved Gly and Mgly mixing ratios was estimated around 15 % (Chang et al., 2019; Li et al., 2020). Furthermore, hourly meteorological parameters including temperature, wind speed, wind direction, pressure and relative humidity were recorded using a pyranometer (CMP22, Kipp & Zonen B.V., Holland) and a portable weather station (model WXT520, Vaisala, Finland).
2.2 Photochemical box model with Master Chemical Mechanism (PBM-MCM) and gas–particle partitioning SOA scheme
Photochemical box model (PBM) was employed in this study to simulate the oxidation of Gly, Mgly and different VOCs, based on a master chemical mechanism (MCM) coupled with a gas–particle partitioning module to represent the SOA formation scheme. The MCM (version 3.2) is a near-explicit mechanism including ∼ 16 500 reactions involving ∼ 6000 chemical species with the latest IUPAC inorganic nomenclature, which described the chemical degradation of ∼ 143 primary VOCs and their oxidation products. The MCM scheme has been applied to different photochemical box models to investigate the oxidation and reactivates of various VOCs, the formation of photochemical O3 and secondary organic products, the atmospheric radical budget and propagation, and the policy evaluation on mitigating the photochemical smog (e.g., Ling et al., 2014, 2019; Wang et al., 2017; Lyu et al., 2015; Xue et al., 2014a, b). The physical processes including dry deposition and atmospheric dilution due to the variations in planetary boundary layer heights (configured according to the local observation in the PRD region from previous studies (Li et al., 2014; Wang et al., 2013; Fan et al., 2011) were considered in the model. Similar to other box models in simulating the degradation of VOCs and formation of SOA (Aumont et al., 2012; Lee-Taylor et al., 2011; Zhang and Seinfeld, 2013), the PBM-MCM model was developed by assuming a well-mixed box without consideration of vertical and horizontal transport, and air pollutants were assumed to be homogeneous (Lam et al., 2013; Ling et al., 2014). Thus, the influence of horizontal and vertical transport on air pollutants was not considered in this study.
In addition to the gas-phase degradation of VOCs, a gas–particle partitioning module for the oxidation products of VOCs and those compounds with an estimated normal boiling temperature greater than 450 K, as developed by Johnson et al. (2006), was incorporated into the model to represent the SOA formation scheme (Johnson et al., 2005, 2006; Kamens et al., 1999). In brief, the gas-to-particle equilibrium partitioning of the species was described by the partitioning coefficient (Kp; unit: m3 µg−1) using Eq. (1) (Johnson et al., 2006).
where R, T, MWom and ξ are the ideal gas constant (8.314 J K−1 mol−1), temperature (K), mean molecular weight of the absorbing particle organic matter (g mol−1) and activity coefficient of species in the condensed organic phase, respectively. is the liquid vapor pressure and was estimated using a semiempirical expression of the Clausius–Clapeyron equation (Eq. 2):
where Tb was the boiling temperature of different species, which was estimated using a previously described fragmentation method (Stein and Brown, 1994; Johnson et al., 2006). ΔSvap (Tb) was the vaporization entropy change at Tb, which was estimated using the Trouton–Hildebrand–Everett rule with corrections for polar compounds and compounds with hydrogen-bonding capacity (Baum 1997). The concentration of species j in the condensed organic phase (Fj,om) can be calculated by the following equation (Eq. 3):
where Mom is the total mass concentration of each condensed organic material from gas–particle partitioning; Aj is its gas-phase concentration, and Kp,j is its partitioning coefficient of species j (Johnson et al., 2006).
The partitioning process was dynamically represented as an equilibrium between absorption and desorption, as described by Kamens et al. (1999). Briefly, the species-dependent Kp values were defined in terms of absorption (kin) and desorption (kout) rate coefficients, with . The value for kin ( m3 µg−1 s−1) was configured as suggested by Johnson et al. (2006). Thus, the Kp could be expressed in terms of kout. More detailed description of the equations and parameters are given by Johnson et al. (2005, 2006) and Kamens et al. (1999).
The above gas–particle partitioning of low-volatility compounds formed by the gas-phase oxidation of VOCs and other precursors (Aumont et al., 2012; Lee-Taylor et al., 2011) was configured in the model to estimate the SOA formation. However, the recent experimental results suggested that the formation of SOA in laboratory chambers may be suppressed due to losses of SOA to chamber walls, which leads to underestimates of SOA in air quality and climate models (Matsunaga and Ziemann, 2010; Zhang et al., 2014). Therefore, to consider the wall loss of SOA, the average wall loss rate coefficient of s−1 was adopted in the model configuration according to previous studies on the basis of calculated organic material using an assumed density of 1 g cm−3 (Johnson et al., 2004, 2005). In addition, the wall loss of other gaseous compounds (O3, NO2 and HNO3) were implemented in the box model with the average parameters of s−1, s−1 and s−1, respectively. The detailed information for the calculation of the above parameters was provided in Bloss et al. (2005).
2.3 Partitioning and reactions of gas-phase dicarbonyls on particles
The partitioning and reactions of dicarbonyls in the aerosol aqueous phase may involve both irreversible and reversible processes (Ervens and Volkamer, 2010). In the present study, we follow the mechanism proposed by Knote et al. (2014) and consider the reversible partitioning in aqueous phase, the irreversible volume reactions and the irreversible surface uptake processes in our model.
The reversible partitioning of Gly and Mgly on aerosols aqueous phase is usually described by Henry's law equilibrium (Kampf et al., 2013) (Eq. 4):
However, hydration of carbonyl function groups and salt–Gly interactions could have significant influences on the KH value of Gly (Kampf et al., 2013; Waxman et al., 2015), and an effective Henry's law coefficient expressed by Eq. (5) was often used.
where the Cas and Can represent the concentrations of ammonium sulfate and nitrate. Detailed information on each parameter in these equations has been provided in Kampf et al. (2013), Waxman et al. (2015) and the Supplement of the present study. As variations were found for the value of KH,effective under different concentrations of ammonium sulfate and nitrate in previous studies (Knote et al., 2014; Kampf et al., 2013; Ervens and Volkamer, 2010), the Cas and Can values were calculated every hour in the present study from the measured ammonium sulfate (and ammonium nitrate) concentrations (mol m−3) divided by aerosol liquid water content (ALWC; kg m−3), which was determined by the aerosol inorganics model (AIM-IV; http://www.aim.env.uea.ac.uk/aim/model4/model4a.php, last access: 3 February 2020) with inputs of the observed parameters (e.g., ambient relative humidity, temperature and the moles of each ion) at the Heshan site (Chang et al., 2019).
The reversible formation of monomers (i.e., glyoxal, glyoxal monohydrate and glyoxal dihydrate) and oligomers is considered with the two important reservoirs (i.e., monomer and oligomer pools, represented as pool 1 and pool 2) (Knote et al., 2014). The variations in the glyoxal monomer, [Glyp1], and oligomer concentrations, [Glyp2], with time can be represented by the following equations (Ervens and Volkamer, 2010; Kampf et al., 2013; Knote et al., 2014):
The equilibrium partitioning between monomers and oligomers was presented as Kolig (Eq. 8). The definition and configuration of each parameter above were provided in the Supplement (Sect. S2) according to Knote et al. (2014) and Kampf et al. (2013).
In addition, three irreversible pathways of Gly, including (1) the ammonium-catalyzed volume pathway, (2) the OH-reaction volume pathway and (3) the irreversible surface uptake, were parameterized in the model (Knote et al., 2014; Ervens and Volkman, 2010). The ammonium-catalyzed reactions, with rate constant depending on both particle acidity (pH) and the activity of the ammonium ion (a), were parameterized as follows when the monomer and oligomer concentrations were in equilibrium (Eq. 9):
This parameterization was configured based on the assumption that total concentration in the monomer pool was the only particulate glyoxal available to the ammonium-catalyzed reaction, as the reversibly formed oligomers do not evaporate easily (Knote et al., 2014; De Haan et al., 2009; Noziere et al., 2008).
For OH pathway, the gas-phase OH was in equilibrium with liquid-phase OH by a Henry's law constant (KI,OH=25 M atm−1) with the consideration of the salting-in impact (Ervens and Volkamer 2010), and the constant of reactions between OH and Gly was M−1 s−1 (Buxton et al., 1997). As suggested by Knote et al. (2014), the Gly concentration available to the OH-reaction pathway was the total glyoxal concentration in the monomer pool.
Surface-controlled irreversible uptake of Gly has been widely employed in different modeling studies (Ervens et al., 2011; Li et al., 2014; Liu et al., 2008) and was parameterized as follows (Eq. 10):
where C* and ν are the gas-phase concentration and mean molecular velocity, respectively. γ represents the uptake coefficient for Gly and Mgly. Here we use the surface uptake coefficients ( and ) to account for the irreversible surface uptake of Gly and Mgly, respectively. It is noted that the surface uptake coefficient of Gly was configured according to the results of uptake kinetics experiments from Schweitzer et al. (1998), which has been used in the model simulation of Gly in the previous PRD study (Li et al., 2014). On the other hand, the surface uptake coefficient of Mgly was obtained via scaling to glyoxal uptake coefficient by the relative Henry's law coefficient suggested by Pye et al. (2017). , is the RH-corrected aerosol surface area (Li et al., 2014). The value for a (2.06) was configured as those suggested previously (Liu et al., 2008), while the dry aerosol surface concentration (Sa) was obtained from the measurement at the Heshan site (Yun et al., 2018). In this study, the mean molecular velocities of Gly were calculated by the HyperPhysics model (http://hyperphysics.phy-astr.gsu.edu/hbase, last access: 6 June 2019). The carbonaceous and insoluble components were considered as an aqueous shell for aerosols, whereas the aerosol surface was fully covered with an aqueous layer (Li et al., 2015).
On the other hand, though heterogeneous processes of Mgly are similar to those of Gly, some difference between these two species were found. The Henry's law constant for Mgly is not as effective as that for Gly. Hence, we used a Henry's law constant (3.7×10³ M atm−1) for Mgly (Zhou and Mopper, 1990). In fact, Kroll et al. (2005) suggested that no obvious aerosol growth was observed from gas-phase Mgly, presumably because of its more stable (less electron deficient) ketone moiety, and a recent study indicated that less Mgly would partition into the aerosols than expected according to Henry's law (Waxman et al., 2015). In addition, the surface uptake coefficient () suggested by Pye et al. (2017) is lower than that extracted from the chamber study (De Haan et al., 2018), which reported the value of γMgly could increase to at 95 % RH and even larger than Gly in a high-relative-humidity environment (≥ 95 %). However, they also figured out that treating the surface uptake of Mgly on aerosols as an irreversible pathway could probably overestimate its positive effect on SOA formation via heterogeneous processes, because ∼ 20 % of SOAs which were formed from Mgly via aqueous processes would further hydrolyze.
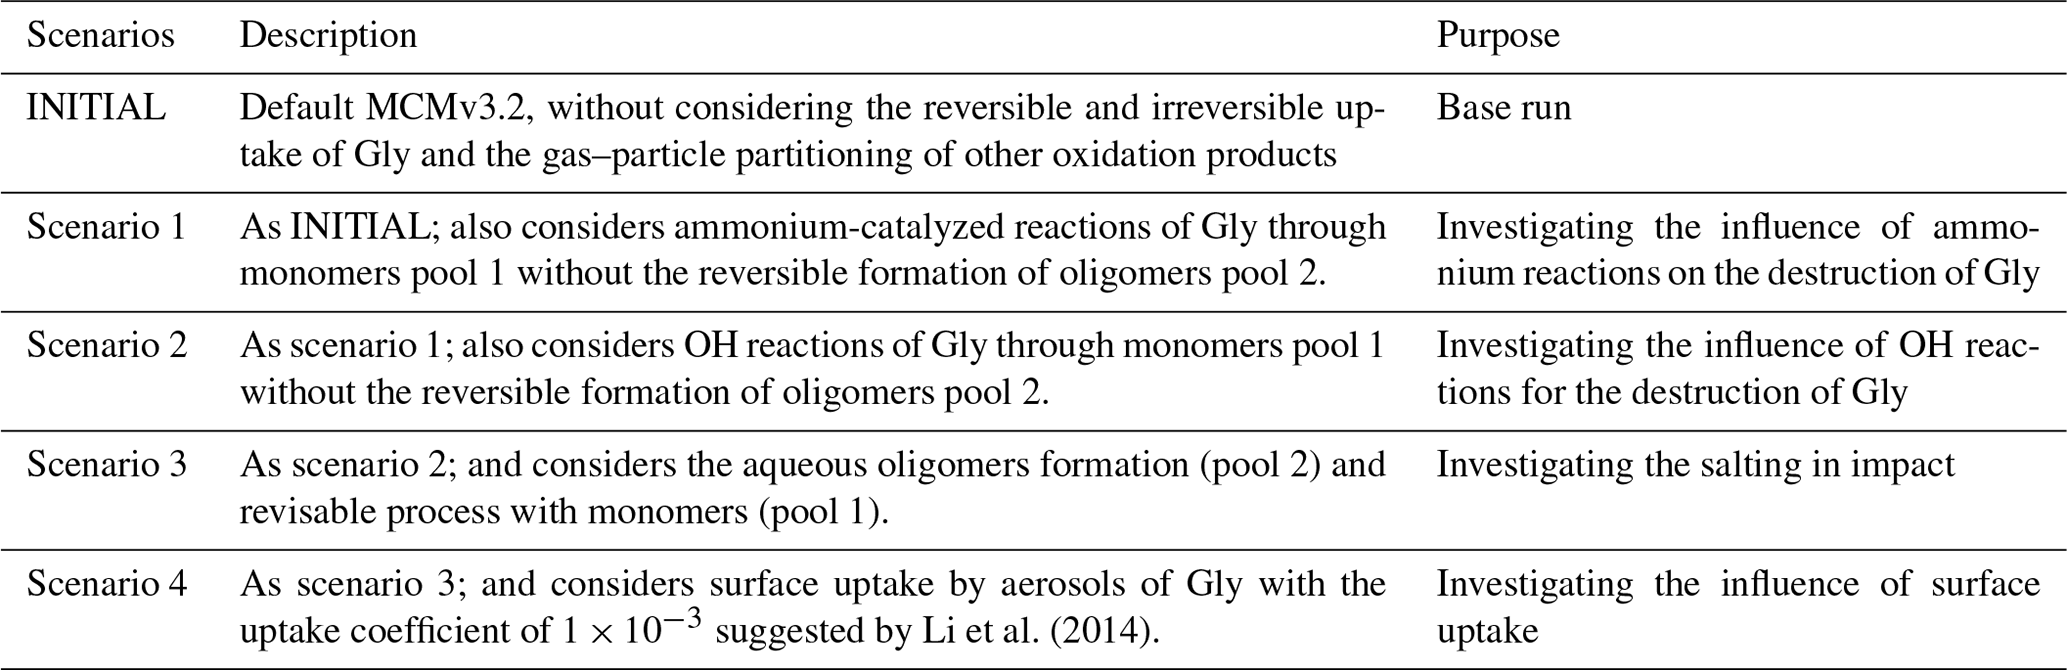
2.4 Model scenarios
According to the discussion above, it can be seen that the heterogeneous processes we described for Gly were more complicated than that for Mgly, as the parameterization for the sink of Gly from laboratory and model studies was more robust. Therefore, the present study put more emphasis on the evolution of Gly for better understanding and evaluating the effects of the different sink pathways on dicarbonyls and their influence on SOA formation. Table 1 provides detailed information regarding all the model scenarios for the simulation of Gly, while the model scenarios for Mgly are given in Table S1 in the Supplement.
In this study, hourly observation data of CO, SO2, NO, NO2, O3, NMHC and meteorological parameters were used as input and constraints in the model. By taking the NMHC species incorporated in the MCM mechanism into account (MCM website; http://mcm.leeds.ac.uk/MCM/roots.http, lasts access: 22 June 2020), observations of a total of 44 NMHC species, including 18 alkanes, 11 alkenes, ethyne and 14 aromatics, were used as input for the model simulation (Table S2 in the Supplement). The selected NMHCs contributed about 98 % and 99 % to the total mixing ratios and photochemical reactivities of all measured NMHCs at the Heshan site. Furthermore, the selected VOCs are the major precursors for Gly, Mgly, photochemical O3 and SOA (Ding et al., 2016, 2017; Li et al., 2014; Lou et al., 2010; Yuan et al., 2013), and they have been frequently used to drive box model for studies of SOA, photochemical O3 and photochemical reactivity (Hofzumahaus et al., 2009; Lee-Taylor et al., 2011).
The photolysis rates, which were not measured, were modified in the model using the photon fluxes from the Tropospheric Ultraviolet and Visible Radiation (TUV-v5) model (Madronich and Flocke, 1997) according to the sampling location and modeling period. Model simulation of Gly and Mgly was performed on 7–8 January 2017, when both daily Gly and Mgly data were available, with 00:00 LT (local time) as the initial time. Before the simulation, the model was pre-run for 5 d using the observed variability in the input species during the whole sampling period to achieve a steady state for the unmeasured species with a short lifetime, i.e., OH and HO2 radicals (Xue et al., 2014a, b).
In this study, the simulation of the diurnal variations in OH and HO2 was performed well, with peak values at noon, consistent with those measured and simulated in the PRD (Hofzumahaus et al., 2009, and related papers; Tan et al., 2019). The simulated mean mixing ratios of OH and HO2 radicals from the model in the present study were molecule cm−3 and molecule cm−3, which are comparable to the winter observations in Beijing, Tokyo and New York (Kanaya et al., 2007; Ren et al., 2006; Ma et al., 2019) and lower than the measurement and simulation values in summer (e.g., July) or autumn (e.g., October to November) in the PRD region (Table S3 in the Supplement) (Hofzumahaus et al., 2009; Tan et al., 2019). Note that the variations in simulation results in the present study and those observation results in previous studies in the PRD may be associated with differences in the levels of O3 and its precursors, different photolysis rates and, to a lesser extent, meteorological conditions (Hofzumahaus et al., 2009). The higher OH and HO2 mixing ratios were expected in summer and autumn rather than winter due to the stronger solar radiation and higher temperature, as well as the variations in O3 and its precursors in different sites, though the measurement of OH and HO2 radicals has been very challenging, and significant uncertainties still exist in the measurement values of the radicals (Hofzumahaus et al., 2009; Tan et al., 2019). Furthermore, the comparison between the simulation of a box model and observation results suggested that the higher observed mixing ratios of OH and HO2 radicals were related to an unidentified source of OH at the Backgarden site of PRD in summer of 2006, while the comparison between the observed OH∕HO2 variations and those calculated from the parameterization of HOx () production and destruction indicated a missing OH source of 4–6 ppbv h−1 and an unknown RO2 loss at the Heshan site in autumn of 2014.
In addition to the simulation of OH and HO2 radicals, as there were no direct measured SOA data in this study (Chang et al., 2019), the model performance was evaluated by the comparison between model-simulated SOA and those calculated using the EC (elemental carbon)-tracer method and by the comparison between the simulated and observed concentrations of other secondary products, which have been provided in detail in the Supplement (Sect. S3). For example, the simulated concentration of SOA was about 85 % of those calculated by the EC-tracer method based on the observed hourly data (Chang et al., 2019). Furthermore, the simulated concentrations of acetic acid, formic acid and pyruvic acid were close to those observed at the Heshan site, accounting for ∼ 80 %, 70 % and 88 % of observed values for acetic acid, formic acid and pyruvic acid, respectively. The results confirmed that secondary formation was the dominant source of the above species at the Heshan site and suggested that the PBM-MCM model could provide robust performance while simulating the abundance of the above secondary species and SOA.
2.5 Model uncertainty
Uncertainties in the simulation of Gly and Mgly by the model were noted. The total model errors could be calculated conservatively from (1) the uncertainties in the measurement of trace gases and NMHCs; (2) the measured data of meteorological parameters, i.e., temperature T, pressure P and the calculated photolysis frequencies J based on meteorological conditions; (3) reaction rate constants k; and (4) the dry deposition. In this study, following Li et al. (2014) and Lu et al. (2013), the uncertainty factors for the above parameters were adopted as suggested previously (Table S4 in the Supplement), and all parameters were divided into three groups (i.e., physical parameters, radical and trace gas concentrations, and reaction rate constants of non-photolytic reactions). Each parameter was multiplied by its uncertainty factor first, and the Gaussian error propagation was then applied within each group. We ran the model n times (n is the number of parameters considered). The mean diurnal variation in the uncertainty in modeled Gly and Mgly is shown in Fig. S1. The total uncertainties in the modeled Gly and Mgly were both estimated to be around 39 %, with the contributions from radical and trace gas concentrations (∼ 19 %), physical parameters (∼ 13 %) (included photolysis frequencies, deposition lifetime, T, etc.) and reaction rate constants of non-photolytic reactions (∼ 7 %), respectively.
3.1 Comparison between the simulation and observation
In this study, the simulated Gly and Mgly were secondarily formed from the oxidation of their VOC precursors. Therefore, before the comparison between the simulation and observation results, the contributions of primary and secondary sources to the measured Gly and Mgly were preliminarily estimated by a correlation-based source apportionment method suggested by previous studies (Friedfeld et al., 2002; Yuan et al., 2013). Table S5 in the Supplement shows linear regression coefficients and relative source contributions of Gly and Mgly. It was found that the contributions from primary sources (3.46 % and 3.51 % for Gly and Mgly, respectively) were significantly lower than those from secondary sources (96.14 % and 96.44 %, respectively), confirming that observed Gly and Mgly in the present study were mostly related to secondary formation.
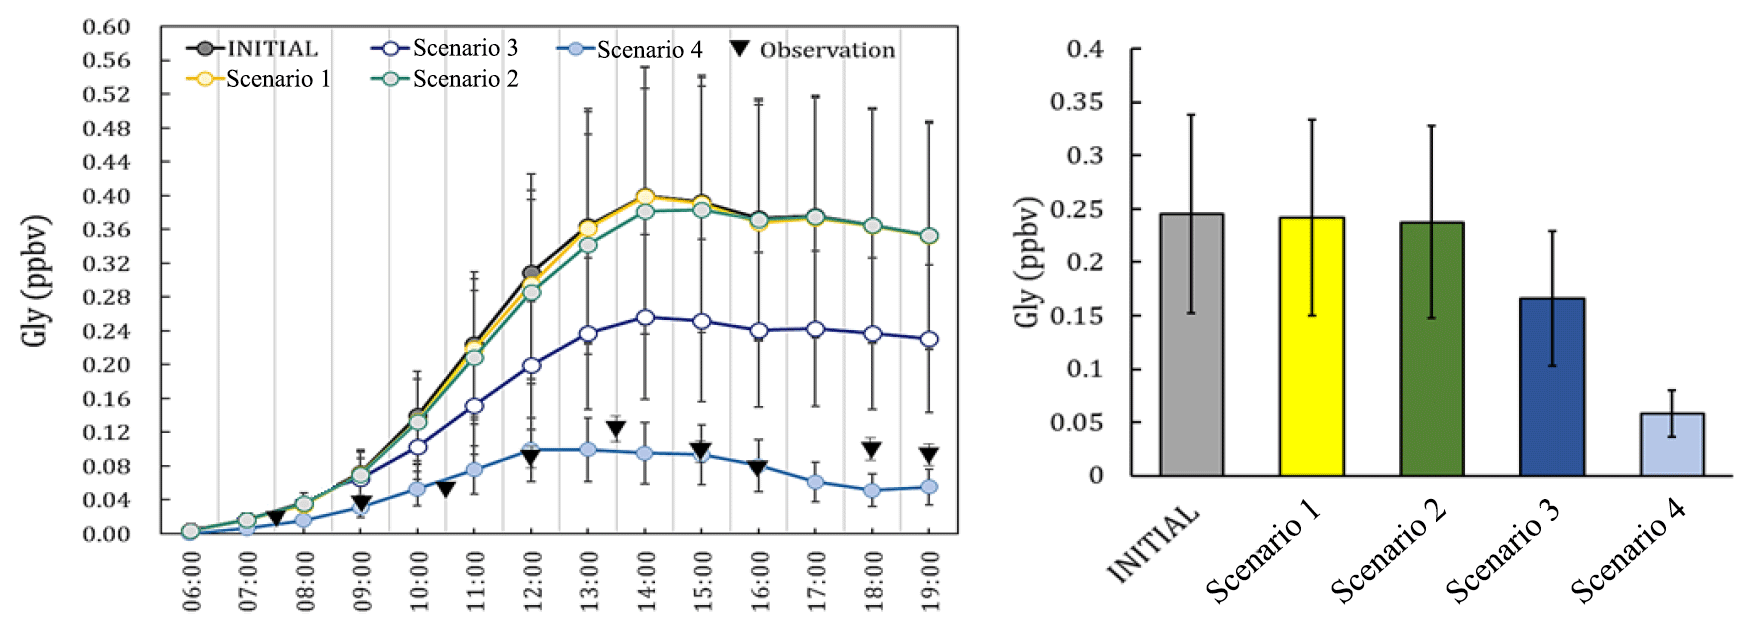
Figure 2The observation data (measured at local time), the concentrations and the daily average concentration of Gly predicted from the different scenarios.
The simulated Gly and Mgly from the photochemical box model under different scenarios were examined and compared with the observations. The predicted Gly and Mgly from in situ formation in the INITIAL scenario was found to generally overpredict the mixing ratios of Gly and Mgly and were about 3.3 and 3.5 times of the observed concentrations at the Heshan site, respectively. Similar overestimation has been reported in previous modeling studies, for example, the simulations with only the MCM gas-phase schemes overpredicted the Gly concentration by factors of 2–6 in both urban Mexico City (Volkamer et al., 2007) and a semirural site of the PRD region (Li et al., 2014). The significant overestimation in simulation results indicated that there were important loss pathways for Gly and Mgly other than the oxidation reactions (e.g., by OH and NO3 radicals). A sensitivity analysis was firstly conducted with twice the dilution rate (and deposition velocities) in the INITIAL scenario, which resulted in the reduction of modeled concentrations of Gly and Mgly by 9.2 % (3.2 %) and 7.9 % (2.8 %), respectively (Table S6 in the Supplement). Though these enlarged rates were higher than the upper limits of the dilution rate and deposition velocities in previous studies (Fan et al., 2011; Wang et al., 2013; Li et al., 2014), the predicted mixing ratios of Gly and Mgly were still 3 times higher than the measured levels, suggesting that the dilution and dry deposition configuration could not be the main causes for the overestimation of modeled Gly and Mgly mixing ratios (Volkamer et al., 2006, 2007).
To identify the causes of discrepancy and improve model performance, sensitivity analysis with different heterogenous mechanisms incorporated in the model scheme (as scenarios listed in Table 1) was conducted. The average diurnal patterns of Gly simulated by different model scenarios are showed in Fig. 2. It can be seen that in the early morning (i.e., 06:00 to 08:00 LT, local time), the predicted mixing ratios of Gly in different scenarios were comparable to the observations. In contrast, the difference became larger from 09:00 LT onwards, though the predicted peaks of Gly by different model scenarios were all presented in the early afternoon, followed by a slow decrease in the late afternoon. The model results from Scenario 4 were more consistent with the observational data. The relative changes of modeled Gly concentrations by adding additional heterogeneous processes to the model scenario INITIAL (i.e., model scenarios 1–4) were summarized in Table S7 in the Supplement.
On average, by including additional irreversible and reversible pathways, the modeled Gly concentrations during daytime (06:00–19:00) decrease by 72.3 % of the values predicted by the INITIAL scenario, and a significant decrease in Gly concentration occurred by adding the effect of surface uptake pathway (i.e., model scenarios 3 and 4). Similar results have been obtained in a previous study in summer in the PRD region (Li et al., 2014), which found that the simulated Gly concentration decreases significantly (∼ 45 %) in the daytime (i.e., 06:00 to 19:00 LT) when heterogeneous uptake process was considered with the incorporation of a single uptake coefficient.
The contribution of different heterogeneous sink pathways is calculated based on scenario 4 (Fig. S2). The irreversible pathways of Gly (i.e., surface uptake by aerosols, OH and ammonium reactions) accounted for 67.3 % of the total sink of Gly, among which the surface uptake was a dominant pathway (62 %), compared to the ammonium and OH reactions (2.4 % and 2.9 %, respectively). The reversible pathway made a relatively lower contribution to the total sink of Gly (32.7 %).
In addition, the heterogeneous irreversible and reversible pathways of Mgly were also investigated in the sensitivity analysis (i.e., model scenarios M1 and M2; listed in Table S8 in the Supplement), and the predicted Mgly concentrations during daytime (06:00–19:00 LT) decreased by 73.0 % of the values estimated in the INITIAL model scenario. The surface uptake pathway in scenario M2 was found to be the most important heterogeneous pathway for the loss of Mgly and contributed to 64.1 % of the total heterogeneous sink of Mgly. The contribution of the reversible pathway to the destruction of Mgly was around 35.9 % (Fig. S3).
Overall, by incorporating a more detailed heterogeneous processes of Gly and Mgly, the results of scenarios 4 and M2 provided better agreement between the modeled and measured Gly and Mgly. The results demonstrated the significance of heterogeneous uptake processes on the destruction of Gly and Mgly, and adopting the irreversible and/or reversible pathways (i.e., the reversible partitioning, volume reactions and the surface uptake) could reasonably reproduce the variations in Gly and Mgly at the Heshan site in the PRD region.
Table 2Production and destruction of Gly and Mgly from model simulation in the daytime.

a Molar yields were taken from previous studies (Fu et al., 2008; Fick et al., 2003; Nishino et al., 2010; Calvert, 2000; Volkamer et al., 2006). b Alkenes with carbon numbers >2 (includes three alkenes) and alkanes with carbon numbers >3 (includes 17 alkanes) are represented in this study as a single lumped species (Lv et al., 2019). c “−” symbol: not applicable. d Considered both irreversible and reversible parameterizations of the aerosol sinks (i.e., scenarios 4 and M2 in the Supplement).
3.2 Process analysis of the production and destruction of Gly and Mgly
The simulations of scenarios 4 and M2 with the best agreement with measurement were further analyzed to investigate the photochemical budget of Gly and Mgly at the Heshan site, respectively (Tables 2 and S1). It was found that OH oxidation of aromatics was the most important contributor for the Gly and Mgly production, with mean contributions of ∼ 80 % and ∼ 94 %, respectively. Among all the aromatic precursors, toluene and m,p-xylene were the two major precursors for the formation of Gly and Mgly, with total contributions of ∼ 43 % and ∼ 56 % of Gly and Mgly formation, respectively. In contrast, because of the relatively low photochemical reactivity, benzene and alkanes had lower contributions to the formation of Gly and Mgly, although they can travel a long distance and contribute to secondary Gly and Mgly in areas far from their emissions (Lv et al., 2019). Different from previous studies that found the isoprene as the key precursor for Gly and Mgly formation (Li et al., 2014; Lou et al., 2010), the contributions of isoprene oxidation at the Heshan site in the present study were much lower than those of aromatics, with only mean contributions of ∼ 2 % and ∼ 3 %, respectively. It can be attributed to the lower mixing ratios of isoprene (i.e., 70±10 pptv) observed at the Heshan site because of the lower temperature in winter, compared to the much higher concentration observed during summer (average of ∼ 1 ppbv and maximum of ∼ 4 ppbv in the afternoon) in the rural and forest areas in this region (Li et al., 2014; Lou et al., 2010).
In addition, the relative contributions of different loss pathways of Gly and Mgly, including physical processes (vertical dilution and dry deposition), reaction with radicals (e.g., OH and NO3), and the heterogeneous processes of Gly and Mgly on aerosols in the daytime were also estimated from the PBM-MCM model results (Table 2). Consistent with previous studies (Atkinson and Arey, 2003; Ervens et al., 2011), heterogeneous processes were the most important pathway for the destruction of Gly and Mgly (with contributions of ∼ 62 % during daytime), followed by photolysis (with contributions of ∼ 26 % and ∼ 25 %, respectively). It should be noted that the oxidation of Gly and Mgly by O3 was not considered in this study as the reaction rate constants of Gly and Mgly with O3 are < and < cm3 molecule−1 s−1, respectively, which are 6 orders of magnitude lower than the reaction rate constants with NO3 (which are > and >2 cm3 molecule−1 s−1, respectively), and are 9 orders of magnitude lower than the reaction rate constants with OH ( and cm3 molecule−1 s−1 for the reactions of Gly and Mgly with O3, respectively) (Mellouki et al., 2015). Therefore, we believe that the influence of O3 on the removal of Gly and Mgly was negligible (Mellouki et al., 2015). Furthermore, there were few parameterizations for the reaction mechanism of Gly ∕ Mgly with O3 due to their low reaction rates with O3.
On the other hand, at nighttime, only the heterogenous processes made the main contribution to Gly and Mgly destruction, with contributions to the total destruction of Gly and Mgly being higher than 90 % at night (Table S9 in the Supplement), consistent with previous studies (Washenfelder et al., 2011; Gomez et al., 2015). The lower contributions of Gly and Mgly with radicals were mainly because of the low OH concentration at night and their relatively lower reactivities with the NO3 radical (e.g., the reaction rate constants of Gly ∕ Mgly with NO3 are ∼ 1000 times lower than those with OH radical) (Calvert et al., 2011; Mellouki et al., 2015).
3.3 Implications for secondary organic aerosol formation
By incorporating both the traditional gas–particle partitioning (of VOC oxidation products) and the heterogeneous processes (of Gly and Mgly) into the model, we investigated the contributions of different mechanisms in SOA formation through sensitivity analysis. The contributions of VOC oxidations to SOA formed from gas–particle partitioning (SOAgp) and SOA formed from heterogeneous processes of Gly and Mgly (SOAhet) were quantified.
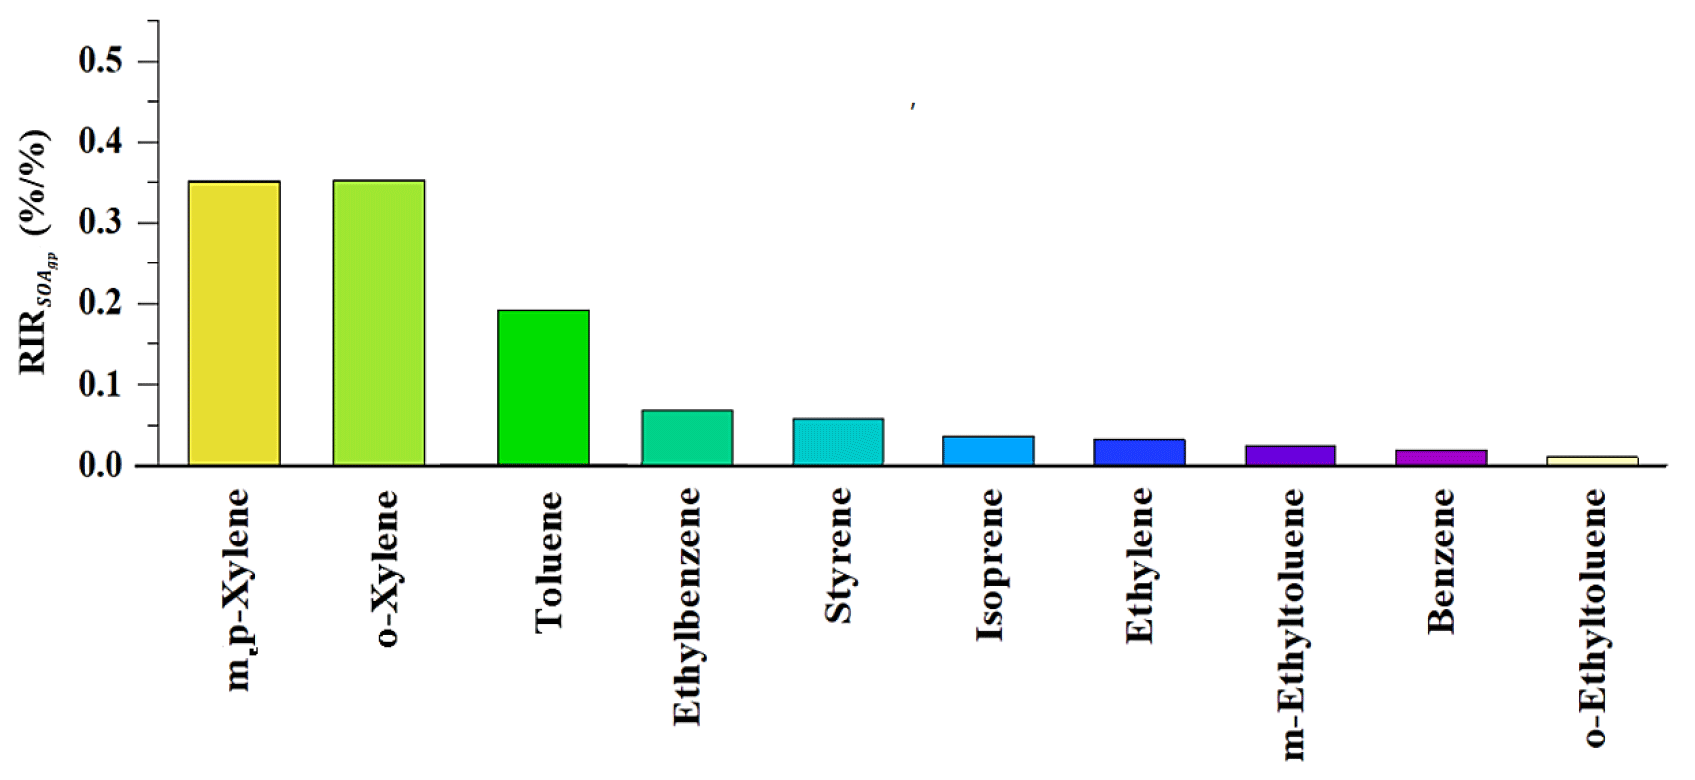
On the other hand, only based on the SOAgp formation scheme, the relative importance of each VOC precursor in SOAgp formation was further evaluated to provide a complete picture for SOAgp formation and its relationship with precursors. As with O3 formation, the roles of individual VOC precursors in SOAgp formation were calculated using the relative increment reactivity (RIR) method, which has been widely used to present the percentage change in the production of secondary products per percent change in precursors. The RIR of a specific precursor X at site Z is given by Eq. (11):
where Z(X) represents the measured concentration of precursor X, including the amounts emitted at the site and those transported to the site, and ΔX is the change in the concentration of precursor X caused by a hypothetical change ΔZ(X) – a 10 % Z(X) in this study. Here, represents the SOAgp formation potential. A large positive RIR value of a specific precursor suggests that SOAgp formation could be significantly decreased if the emissions of this precursor were controlled. Figure 3 depicts the top 10 VOC precursors with high RIR values in the daytime. Both m,p-xylene and o-xylene had the highest RIR value (∼ 0.35), followed by toluene (∼ 0.2) and ethylbenzene (∼ 0.06). As m,p-xylene, o-xylene and toluene can also have a significant impact on dicarbonyls production, they are likely to make a noticeable contribution to both SOAgp and SOAhet formation.

Figure 4The average diurnal variations in SOAgp, SOAhet (Gly) (i.e., SOAhet formed from heterogeneous processes of Gly), SOAhet (Mgly) (i.e., SOAhet formed heterogeneous processes from Mgly) and total SOA formation (SOAgp + SOAhet) are shown in (a) and (b) (local time). The proportion of SOAgp, SOAhet (Gly) and SOAhet (Mgly) in total SOA, as well as the contribution of VOC precursors to SOAgp, SOAhet (Gly) and SOAhet (Mgly) formation, is represented in the pie charts in (c).
The SOA production from Gly and Mgly was further explored by the model simulation with and without the consideration of Gly and Mgly. It was found that by incorporating the evolution of Gly and Mgly, the SOA production has been improved apparently from 1.83 to 2.47 µg m−3. The total contribution of the Gly and Mgly contributed ∼ 26 % to the simulated SOA concentrations, of which ∼ 21 % was from the heterogeneous processes of Gly and Mgly (SOAhet), further demonstrating that the heterogeneous processes have significant influences on the SOA formation from Gly and Mgly.
To further highlight the roles of heterogeneous processes of Gly and Mgly on the SOA production (SOAhet) and to evaluate the contributions of different VOCs, the average diurnal variations in SOAhet concentration formed from the heterogeneous processes of Gly and Mgly are shown in Fig. 4. Both SOAhet (Gly) and SOAhet (Mgly) concentrations presented photochemistry-driven diurnal patterns and started to increase in the morning before reaching the maximum value (0.52 and 0.42 µg m−3) at 14:00 and 12:00 LT, respectively. This is consistent with the diurnal pattern of SOAgp, which could be formed from the oxidation of VOCs (including NMHCs and the gaseous oxidation of Gly and Mgly, which were formed from the oxidation of NMHCs), due to the high photochemical reactivity at noon, which further converted to SOAgp through gas–particle partitioning. In general, SOAgp made a higher contribution to total SOA (78.6 %) than SOAhet (21.4 %). Previous studies have indicated that the more abundant anthropogenic precursors rather than biogenic ones under an NOx-saturated environment could lead to greater contribution of SOAgp to total SOA, despite the fact that the oxidation of anthropogenic species (i.e., aromatics) could lead to relatively higher yields of Gly and Mgly (Knote et al., 2014; Ervens et al., 2011). Ervens et al. (2011) has found that in areas with high concentrations of biogenic precursors at high relative humidity, SOAhet and SOAgp were equally important for total SOA, while in the anthropogenic-dominated areas, the contribution of SOAhet to the total predicted SOA mass was around 30 %. Similarly, the formation of SOAgp and SOAhet were both dominated by xylenes and toluene, contributing to ∼ 74 %, ∼ 62 % and ∼ 69 % of SOAgp, SOAhet (Gly) and SOAhet (Mgly), respectively. Furthermore, o-xylene was the most important precursor to the SOAgp (∼ 29 %) but only contributed ∼ 16 % and ∼ 13 % to SOAhet (Gly) and SOAhet (Mgly) formation, respectively. The toluene and m,p-xylene made the most significant contributions to the SOAhet (Gly) (∼ 26 %) and SOAhet (Mgly) (∼ 32 %) formation, respectively, consistent with the chamber results from the oxidations of different precursors (Ervens et al., 2011).
3.4 Comparison with previous studies in the PRD
Previous studies have been conducted to investigate the evolution of Gly and/or Mgly using observation and model simulation in the PRD region. However, one must bear in mind that the mechanisms of the formation and evolution of Gly and/or Mgly were more detailed in the present study, as previous studies in the PRD only incorporated the irreversible surface uptake process with a single coefficient for the heterogeneous pathway for dicarbonyls. This may not reflect the current knowledge for the formation and evolution of Gly and/or Mgly and their influence on SOA formation (Knote et al., 2014; Waxman et al., 2015; Sumner et al., 2014).
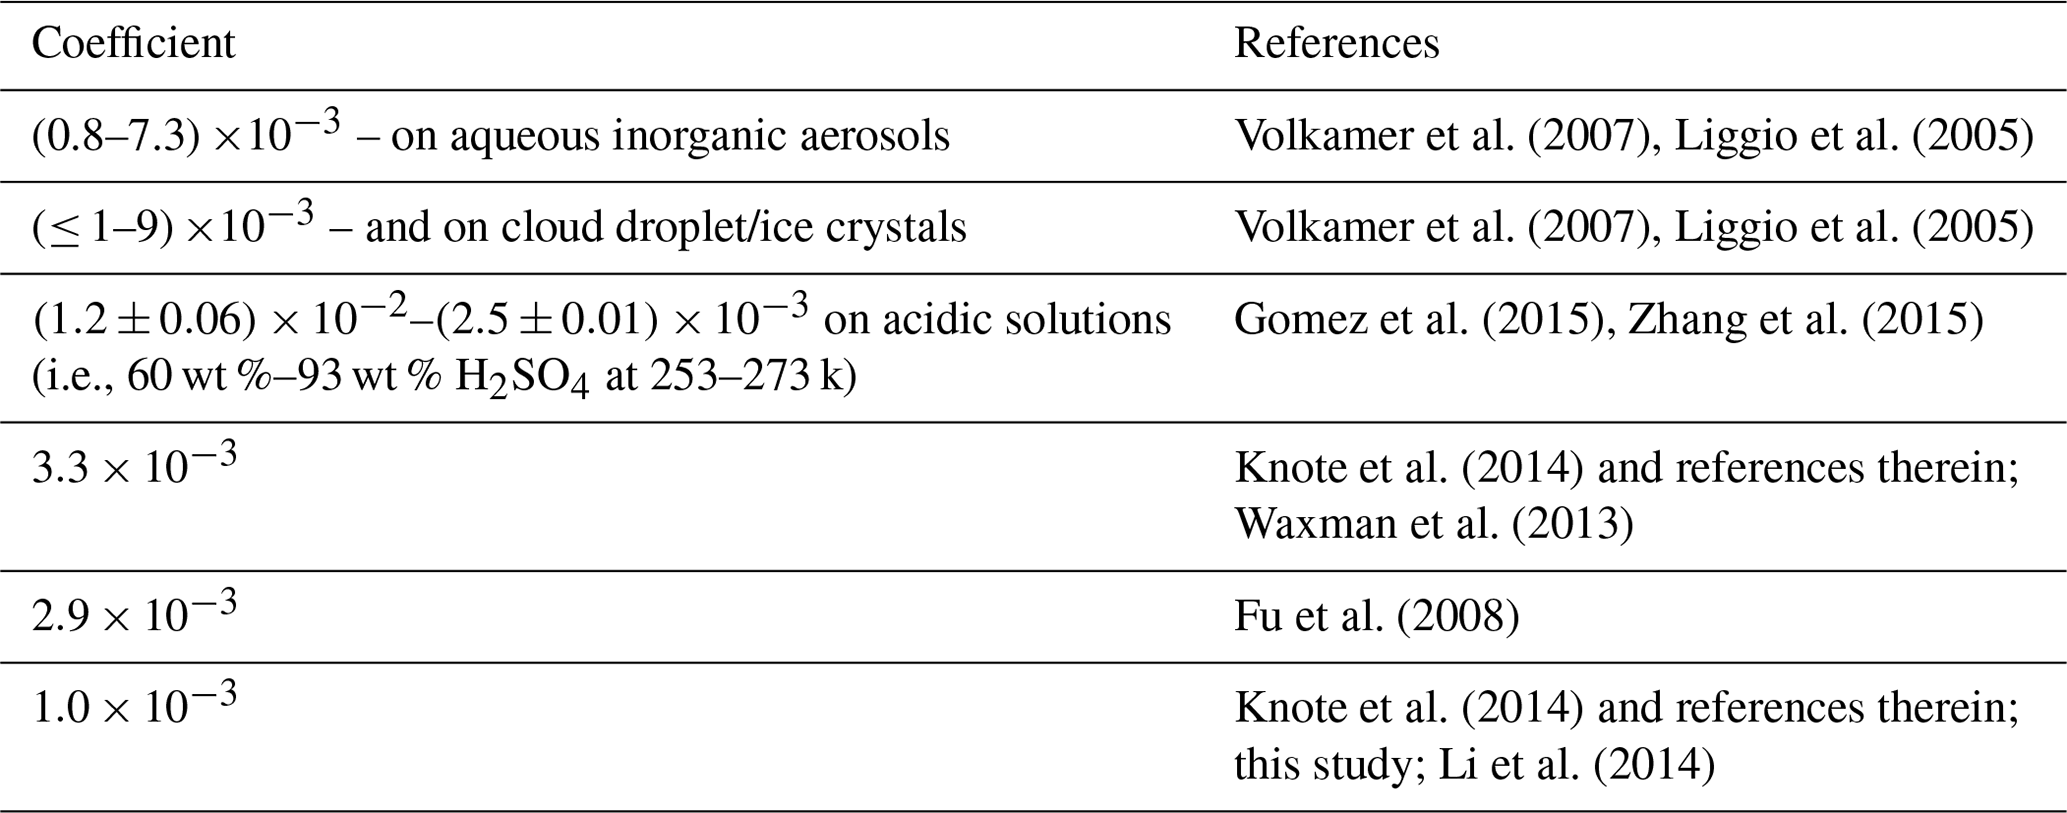
Table 3Surface uptake coefficient of Gly from laboratory experiments and used in the model simulation in the present and previous studies.
N. Li et al. (2013) used the regional air quality model CMAQ to investigate the contributions of the aerosol surface uptake of Gly and Mgly to SOA formation in the PRD region, and an uptake coefficient of was used for both Gly and Mgly in the model. Interestingly, the results from their model were about 30 % higher than that in our study (Table S10 in the Supplement). For example, N. Li et al. (2013) concluded that SOA formed from the heterogeneous processes of dicarbonyls may contribute more than 50 % to the total SOA mass in the PRD region, while our study showed that the contribution of SOAhet to total SOA mass was ∼ 21 % (i.e., ∼ 11 % of SOAhet formed from Gly; ∼ 10 % of SOAhet formed from Mgly). In addition, the averaged concentration of SOAhet from Gly (0.28 µg m−3) and Mgly (0.25 µg m−3) in our study is 1 order of magnitude lower than that in N. Li et al. (2013) (i.e., 2.33 and 2.51 µg m−3, respectively). The discrepancy was mainly due to the different parameterizations of heterogeneous processes of dicarbonyls. The parameterization in N. Li et al. (2013) and other previous studies did not consider the reversible processes of dicarbonyls but used one constant surface uptake coefficient to represent all the heterogeneous processes, which could result in bias in SOA formation if there are available aerosol surfaces without consideration being made for the influence of aerosols composition and phase state. Moreover, most of the previous studies using higher surface uptake coefficients intended to narrow the discrepancy between observed and simulated SOA mass without direct comparison between observed and simulated concentrations of dicarbonyls (i.e., N. Li et al., 2013; Waxman et al., 2013; Fu et al., 2008; Volkamer et al., 2007). For example, Knote et al. (2014) conducted a total of seven simulations to investigate the SOA formation from Gly over California. Their results showed that the SOA concentration in the SIMPLE scenario (characterized by a single uptake coefficient of ) was an order of magnitude higher than that in the HYBRID scenario (characterized by an uptake coefficient of and also considered more comprehensive parameterization of heterogeneous processes). In fact, if we only consider the surface uptake by aerosols for dicarbonyls using the same uptake coefficient for dicarbonyls () as N. Li et al. (2013), the contribution of SOAhet to total SOA mass would increase to 72 % (i.e., 37 % of SOAhet formed from Gly; 35 % of SOAhet formed from Mgly) (Table S10 in the Supplement). However, this configuration may not reflect the real evolution of dicarbonyls, resulting in the underestimation of the dicarbonyls concentrations (i.e., the simulated concentration is at least 1 order of magnitude lower than the observation) (Fig. S4) and overprediction of the contribution of SOAhet to total SOA mass in this study (∼ 51 %).
Table 3 compares the surface uptake coefficient derived from laboratory experiments and those used in different model simulation. It was found that there were a large variation range for the surface uptake coefficients of Gly, while the studies on Mgly were still limited. For example, the laboratory experiment reported the surface uptake coefficients of Gly in the range of (0.8–6.6) and (≤ 1–9) on aqueous inorganic aerosols and cloud droplet/ice crystals, respectively (Volkamer et al., 2007; Liggio et al., 2005), and the coefficients were found to be > for particles with high acidity (pH values within the range of −0.44 to −1.3) (Liggio et al., 2005). On the other hand, Schweitzer et al. (1998) reported that the uptake coefficient of > 0.001 was only observed for lower-temperature conditions, and the experimentally measured coefficient ranged from to on acidic solution (i.e., 60 wt %–93 wt % H2SO4) at 253–273 k (Gomez et al., 2015; Zhang et al., 2015). It is suggested that more accurate and comprehensive parameterization of heterogeneous processes of dicarbonyls still needs deeper exploration for further model development. The parameterization used in this study was mostly adopted from previous results; though they may still have limitations and uncertainties, the results of simulation at this site show better agreement with the observations.
A photochemical box model coupled with MCM (v3.2) (PBM-MCM) and further improvements on the evolution of semi- and non-volatile oxidation products to a condensed particle-phase was used to investigate the production and heterogeneous processes of Gly and Mgly, as well as the SOA–precursor relationship at a receptor site (i.e., the Heshan site) for the first time in the PRD region. Compared to the measurements, the initial model configuration overestimated the Gly and Mgly concentrations by a factor of 3.3 and 3.5, respectively. This discrepancy occurred largely due to the absence of irreversible uptake and reversible partitioning. Model investigation regarding the production of Gly and Mgly revealed that the oxidation of aromatics by OH radicals was the most important contributor to the formation of Gly and Mgly, with mean contributions of ∼ 80 % and ∼ 94 %, respectively, with toluene and m,p-xylene acting as the most important precursors for Gly and Mgly. For SOA formation, the heterogeneous processes of Gly and Mgly probably can explain ∼ 21 % of SOA mass in the PRD. Toluene and m,p-xylene were the main precursors for SOAhet formation, while o-xylene was the most important precursor of SOAgp. Overall, this study evaluated the formation and heterogeneous processes of Gly and Mgly in a polluted subtropical environment and highlighted the important role of intermediate products that are produced from photochemical oxidation of VOCs in SOA formation. The results of this study are expected to provide a better understanding of the evolution of VOC precursors, intermediate products and the heterogeneous process of the dicarbonyls, and the developed model modules can provide a robust tool for investigating SOA formation in the PRD region and other regions in China.
The underlying research data and the newly developed MCM scheme of Gly and Mgly in this study are available to the community and can be accessed by request to Zhenhao Ling (lingzhh3@mail.sysu.edu.cn) of Sun Yat-sen University.
The supplement related to this article is available online at: https://doi.org/10.5194/acp-20-11451-2020-supplement.
In this study, the model was developed by ZL and QX. MS and ZW provided the raw data for the model input. The whole structure for the article was designed by ZL, MS, XW and ZW. QX, ZL and ZW wrote the article. ZW provided the observed data. All the authors have made substantial contributions to the work reported in the paper. ZL and QX contribute equally to this article.
The authors declare that they have no conflict of interest.
This article is part of the special issue “Multiphase chemistry of secondary aerosol formation under severe haze”. It is not associated with a conference.
The authors thank the Collaborative Innovation Center of Climate Change, Jiangsu Province, and they also thank Barbara Ervens for her constructive comments for the article.
This research has been supported by the National Key Research and Development Program of China (grant nos. 2017YFC0210106, 2016YFC0202206 and 2016YFC0203305), the National Natural Science Foundation of China (grant nos. 91644215, 41775114 and 91744204), the Research Grant Council of the Hong Kong Special Administrative Region, China (grant nos. 15265516, 25221215 and T24/504/17), the Pearl River Science and Technology Nova Program of Guangzhou (grant no. 201806010146), the Fundamental Research Funds for the Central Universities (grant no. 19lgzd06), and the Special Fund Project for Science and Technology Innovation Strategy of Guangdong Province (grant no. 2019B121205004).
This paper was edited by Jingkun Jiang and reviewed by two anonymous referees.
Atkinson, R. and Arey, J.: Atmospheric degradation of volatile organic compounds, Chem. Rev., 103, 4605–4658, 2003.
Aumont, B., Valorso, R., Mouchel-Vallon, C., Camredon, M., Lee-Taylor, J., and Madronich, S.: Modeling SOA formation from the oxidation of intermediate volatility n-alkanes, Atmos. Chem. Phys., 12, 7577–7589, https://doi.org/10.5194/acp-12-7577-2012, 2012.
Baum, E.: Chemical property estimation: theory and application, Crc Press, 1997.
Benavent, N., Garcia-Nieto, D., Wang, S. S., and Saiz-Lopez, A.: Max-DOAS measurements and vertical profiles of glyoxal and formaldehyde in Madrid, Spain, Atmos. Environ., 199, 357–367, 2019.
Bloss, C., Wagner, V., Bonzanini, A., Jenkin, M. E., Wirtz, K., Martin-Reviejo, M., and Pilling, M. J.: Evaluation of detailed aromatic mechanisms (MCMv3 and MCMv3.1) against environmental chamber data, Atmos. Chem. Phys., 5, 623–639, https://doi.org/10.5194/acp-5-623-2005, 2005.
Buxton, G. V., Malone, T. N., and Salmon, G. A.: Arthur Salmon, G.: Oxidation of glyoxal initiated by OH in oxygenated aqueous solution, J. Chem. Soc. Faraday Trans., 93, 2889–2891, 1997.
Calvert, G.: Evidence from functional magnetic resonance imaging of crossmodal binding in the human heteromodal cortex, Curr. Biol., 10, 649–657, 2000.
Calvert, J., Mellouki, A., Orlando, J., Pilling, M., and Wallington, T.: Mechanisms of atmospheric oxidation of the oxygenates, OUP USA, 2011.
Carlton, A. G., Wiedinmyer, C., and Kroll, J. H.: A review of Secondary Organic Aerosol (SOA) formation from isoprene, Atmos. Chem. Phys., 9, 4987–5005, https://doi.org/10.5194/acp-9-4987-2009, 2009.
Chang, D., Wang, Z., Guo, J., Li, T., Liang, Y. H., Kang, L. Y., Xia, M., Wang, Y., Yu, C., Yun, H., Yue, D. L., and Wang, T.: Characterization of organic aerosols and their precursors in southern China during a severe haze episode in January 2017, Sci. Total Environ., 691, 101–111, 2019.
Corrigan, A. L., Hanley, S. W., and De Haan, D. O.: Uptake of glyoxal by organic and inorganic aerosol, Environ. Sci. Technol., 42, 4428–4433, 2008.
De Haan, D. O., Corrigan, A. L., Tolbert, M. A., Jimenez, J. L., Wood, S. E., and Turley, J. J.: Secondary organic aerosol formation by sel-reactions of methylglyoxal and glyoxal in evaporating droplets, Environ. Sci. Technol., 43, 8184–8190, 2009.
De Haan, D. O., Jimenez, N. G., De Loera, A., Cazaunau, M., Gratien, A., and Pangui, E.: Methylglyoxal Uptake Coefficients on Aqueous Aerosol Surfaces. J. Phys. Chem. A., 122, 4854–4860, 2018.
DiGangi, J. P., Henry, S. B., Kammrath, A., Boyle, E. S., Kaser, L., Schnitzhofer, R., Graus, M., Turnipseed, A., Park, J.-H., Weber, R. J., Hornbrook, R. S., Cantrell, C. A., Maudlin III, R. L., Kim, S., Nakashima, Y., Wolfe, G. M., Kajii, Y., Apel, E. C., Goldstein, A. H., Guenther, A., Karl, T., Hansel, A., and Keutsch, F. N.: Observations of glyoxal and formaldehyde as metrics for the anthropogenic impact on rural photochemistry, Atmos. Chem. Phys., 12, 9529–9543, https://doi.org/10.5194/acp-12-9529-2012, 2012.
Ding, X., He, Q. F., Shen, R. Q., Yu, Q. Q., Zhang, Y. Q., Xin, J. Y., Wen, T. X., and Wang, X. M.: Spatial and seasonal variations of isoprene secondary organic aerosol in China: Significant impact of biomass burning during winter, Sci. Rep., 6, 20411, https://doi.org/10.1038/srep20411, 2016.
Ding, X., Zhang, Y. Q., He, Q. F., Yu, Q. Q., Wang, J. Q., Shen, R. Q., Song, W., Wang, Y. S., and Wang, X. M.: Significant increase of aromatics-derived secondary organic aerosol during fall to winter in China, Environ. Sci. Technol. 51, 7432–7441, 2017.
Ervens, B. and Volkamer, R.: Glyoxal processing by aerosol multiphase chemistry: towards a kinetic modeling framework of secondary organic aerosol formation in aqueous particles, Atmos. Chem. Phys., 10, 8219–8244, https://doi.org/10.5194/acp-10-8219-2010, 2010.
Ervens, B., Turpin, B. J., and Weber, R. J.: Secondary organic aerosol formation in cloud droplets and aqueous particles (aqSOA): a review of laboratory, field and model studies, Atmos. Chem. Phys., 11, 11069–11102, https://doi.org/10.5194/acp-11-11069-2011, 2011.
Fan, S. J., Fan, Q., Yu, W., Luo, X. Y., Wang, B. M., Song, L. L., and Leong, K. L.: Atmospheric boundary layer characteristics over the Pearl River Delta, China, during the summer of 2006: measurement and model results, Atmos. Chem. Phys., 11, 6297–6310, https://doi.org/10.5194/acp-11-6297-2011, 2011.
Fick, J., Pommer, L., Nilsson, C., and Andersson, B.: Effect of OH radicals, relative humidity, and time on the composition of the products formed in the ozonolysis of α-pinene, Atmos. Environ., 37, 4087–4096, 2003.
Friedfeld, S., Fraser, M., Ensor, K., Tribble, S., Rehle, D., Leleux, D., and Tittel, F.: Statistical analysis of primary and secondary atmospheric formaldehyde, Atmos. Environ., 36, 4767–4775, 2002.
Fu, T.-M., Jacob, D. J., Wittrock, F., Burrows, J. P., Vrekoussis, M., and Henze, D. K.: Global budgets of atmospheric glyoxal and methylglyoxal, and implications for formation of secondary organic aerosols, J. Geophys. Res., 113, D15303, https://doi.org/10.1029/2007JD009505, 2008.
Fu, T.-M., Cao, J. J., Zhang, X. Y., Lee, S. C., Zhang, Q., Han, Y. M., Qu, W. J., Han, Z., Zhang, R., Wang, Y. X., Chen, D., and Henze, D. K.: Carbonaceous aerosols in China: top-down constraints on primary sources and estimation of secondary contribution, Atmos. Chem. Phys., 12, 2725–2746, https://doi.org/10.5194/acp-12-2725-2012, 2012.
Gomez, M. E., Lin, Y., Guo, S., and Zhang, R.: Heterogeneous chemistry of glyoxal on acidic solutions. An oligomerization pathway for secondary organic aerosol formation, J. Phys. Chem. A., 119, 4457–4463, 2015.
Grosjean, D., Grosjean, E., and Gertler, A.: On-road emissions of carbonyls from light-duty and heavy-duty vehicles, Environ. Sci. Technol., 351, 45–53, 2001.
Guo, S., Hu, M., Guo, Q., Zhang, X., Zheng, M., Zheng, J., Chang, C. C., Schauer, J. J., and Zhang, R.: Primary sources and secondary formation of organic aerosols in Beijing, China, Environ. Sci. Technol., 46, 9846–9853, 2012.
He, L.-Y., Huang, X.-F., Xue, L., Hu, M., Zheng, J., Zhang, R. Y., and Zhang, Y. H.: Submicron aerosol analysis and organic source apportionment in an urban atmosphere in Pearl River Delta of China using high-resolution aerosol mass spectrometry, J. Geophys. Res., 116, D12304, https://doi.org/10.1029/2010JD014566, 2011.
Hofzumahaus, A., Rohrer, F., Lu, K. D., Bohn, B., Brauers, T., Chang, C.-C., Fuchs, H., Holland, F., Kita, K., Kondo, Y., Li, X., Lou, S. R., Shao, M., Zeng, L., Wahner, A., and Zhang, Y. H.: Amplified trace gas removal in the troposphere, Science, 324, 1702–1704, 2009.
Hoyle, C. R., Myhre, G., Berntsen, T. K., and Isaksen, I. S. A.: Anthropogenic influence on SOA and the resulting radiative forcing, Atmos. Chem. Phys., 9, 2715–2728, https://doi.org/10.5194/acp-9-2715-2009, 2009.
Hu, J., Wang, P., Ying, Q., Zhang, H., Chen, J., Ge, X., Li, X., Jiang, J., Wang, S., Zhang, J., Zhao, Y., and Zhang, Y.: Modeling biogenic and anthropogenic secondary organic aerosol in China, Atmos. Chem. Phys., 17, 77–92, https://doi.org/10.5194/acp-17-77-2017, 2017.
Huang, R. J., Zhang, Y. L., Bozzetti, C., Ho, K. F., Cao, J. J., Han, Y. M., Daellenbach, K. R., Slowik, J. G., Platt, S. M., Canonaco, F., Zotter, P., Wolf, R., Pieber, S. M., Bruns, E. A., Crippa, M., Ciarelli, G., Piazzalunga, A., Schwikowski, M., Abbaszade, G., Schnelle-Kreis, J., Zimmermann, R., An, Z. S., Szidat, S., Baltensperger, U., Haddad, I. E., and Prévôt, A. S. H.: High secondary aerosol contribution to particulate pollution during haze events in China, Nature, 514, 218–222, 2014.
Jimenez, J. L., Canagaratna, M. R., Donahue, N. M., Prevot, A. S., Zhang, Q., Kroll, J. H., Decarlo, P. F., Allan, J. D., Coe, H., and Ng, N. L.: Evolution of organic aerosols in the atmosphere, Science, 326, 1525–1529, 2009.
Johnson, D., Jenkin, M. E., Wirtz, K., and Martin-Reviejo, M.: Simulating the formation of secondary organic aerosol from the photooxidation of toluene, Environ. Chem., 1, 150–165, 2004.
Johnson, D., Jenkin, M. E., Wirtz, K., and Martin-Reviejo, M.: Simulating the formation of secondary organic aerosol from the photooxidation of aromatic hydrocarbons, Environ. Chem., 2, 35–48, 2005.
Johnson, D., Utembe, S. R., and Jenkin, M. E.: Simulating the detailed chemical composition of secondary organic aerosol formed on a regional scale during the TORCH 2003 campaign in the southern UK, Atmos. Chem. Phys., 6, 419–431, https://doi.org/10.5194/acp-6-419-2006, 2006.
Kamens, R., Jang, M., Chien, C. J., and Leach, K.: Aerosol Formation from the Reaction of α-Pinene and Ozone Using a Gas-Phase Kinetics-Aerosol Partitioning Model, Environ. Sci. Technol. 33, 1430–1438, 1999.
Kampf, C. J., Waxman, E. M., Slowik, J. G., Dommen, J., Pfaffenberger, L., Praplan, A. P., Prévôt, A. S. H., Baltensperger, U., Hoffmann, T., and Volkamer, R.: Effective Henry's law partitioning and the salting constant of glyoxal in aerosols containing sulfate, Environ. Sci. Technol., 47, 4236–4244, 2013.
Kanaya, Y., Cao, R., Akimoto, H., Fukuda, M., Komazaki, Y., Yokouchi, Y., Koike, M., Tanimoto, H., Takegawa, N., and Kondo, Y.: Urban photochemistry in central Tokyo: 1. Observed and modeled OH and HO2 radical concentrations during the winter and summer of 2004, J. Geophys. Res., 112, https://doi.org/10.1029/2007JD008670, 2007.
Knote, C., Hodzic, A., Jimenez, J. L., Volkamer, R., Orlando, J. J., Baidar, S., Brioude, J., Fast, J., Gentner, D. R., Goldstein, A. H., Hayes, P. L., Knighton, W. B., Oetjen, H., Setyan, A., Stark, H., Thalman, R., Tyndall, G., Washenfelder, R., Waxman, E., and Zhang, Q.: Simulation of semi-explicit mechanisms of SOA formation from glyoxal in aerosol in a 3-D model, Atmos. Chem. Phys., 14, 6213–6239, https://doi.org/10.5194/acp-14-6213-2014, 2014.
Kroll, J. H., Ng, N. L., Murphy, S. M., Flagan, R. C., and Seinfeld, J. H.: Secondary organic aerosol formation from isoprene photooxidation under high-NOx conditions, Geophys. Res. Lett., 32, L18808, https://doi.org/10.1029/2005GL023637, 2005.
Lam, S. H. M., Saunders, S. M., Guo, H., Ling, Z. H., Jiang, F., Wang, X. M., and Wang, T. J.: Modelling VOC source impacts on high ozone episode days observed at a mountain summit in Hong Kong under the influence of mountain-valley breezes, Atmos. Environ., 81, 166–176, 2013.
Lee-Taylor, J., Madronich, S., Aumont, B., Baker, A., Camredon, M., Hodzic, A., Tyndall, G. S., Apel, E., and Zaveri, R. A.: Explicit modeling of organic chemistry and secondary organic aerosol partitioning for Mexico City and its outflow plume, Atmos. Chem. Phys., 11, 13219–13241, https://doi.org/10.5194/acp-11-13219-2011, 2011.
Li, J., Cleveland, M., Ziemba, L. D., Griffin, R. J., Barsanti, K. C., and Pankow, J. F.: Modeling regional secondary organic aerosol using the Master Chemical Mechanism, Atmos. Environ., 102, 52–61, 2015.
Li, N., Fu, T. M., Cao, JJ., Lee, S., Huang, X. F., He, L. Y., Ho, K. F., Fu, J. S., and Lam, Y. F.: Sources of secondary organic aerosols in the Pearl River Delta region in fall: Contributions from the aqueous reactive uptake of dicarbonyls, Atmos. Environ., 763, 200–207, 2013.
Li, T., Wang, Z., Wang, Y., Wu, C., Liang, Y., Xia, M., Yu, C., Yun, H., Wang, W., Wang, Y., Guo, J., Herrmann, H., and Wang, T.: Chemical characteristics of cloud water and the impacts on aerosol properties at a subtropical mountain site in Hong Kong SAR, Atmos. Chem. Phys., 20, 391–407, https://doi.org/10.5194/acp-20-391-2020, 2020.
Li, X., Brauers, T., Hofzumahaus, A., Lu, K., Li, Y. P., Shao, M., Wagner, T., and Wahner, A.: MAX-DOAS measurements of NO2, HCHO and CHOCHO at a rural site in Southern China, Atmos. Chem. Phys., 13, 2133–2151, https://doi.org/10.5194/acp-13-2133-2013, 2013.
Li, X., Rohrer, F., Brauers, T., Hofzumahaus, A., Lu, K., Shao, M., Zhang, Y. H., and Wahner, A.: Modeling of HCHO and CHOCHO at a semi-rural site in southern China during the PRIDE-PRD2006 campaign, Atmos. Chem. Phys., 14, 12291–12305, https://doi.org/10.5194/acp-14-12291-2014, 2014.
Liggio, J., Li, S. M., and Mclaren, R.: Reactive uptake of glyoxal by particulate matter, J. Geophys. Res., 110, D10304, https://doi.org/10.1029/2004JD005113, 2005.
Ling, Z. H., Guo, H., Lam, S. H. M., Saunders, S. M., and Wang, T.: Atmospheric photochemical reactivity and ozone production at two sites in Hong Kong: Application of a master chemical mechanism–photochemical box model, J. Geophys. Res., 119, 10567–10582, 2014.
Ling, Z. H., He, Z. R., Wang, Z., Shao, M., and Wang, X. M.: Sources of methacrolein and methyl vinyl ketone and their contributions to methylglyoxal and formaldehyde at a receptor site in Pearl River Delta, J. Environ. Sci., 5, 1–10, 2019.
Liu, X. G., Cheng, Y. F., Zhang, Y. H., Jung, J. S., Sugimoto, N., Chang, S.-Y., Kim, Y. J., Fan, S. J., and Zeng, L. M.: Influences of relative humidity and particle chemical composition on aerosol scattering properties during the 2006 PRD campaign, Atmos. Environ., 42, 1525–1536, 2008.
Lou, S., Holland, F., Rohrer, F., Lu, K., Bohn, B., Brauers, T., Chang, C. C., Fuchs, H., Häseler, R., Kita, K., Kondo, Y., Li, X., Shao, M., Zeng, L., Wahner, A., Zhang, Y., Wang, W., and Hofzumahaus, A.: Atmospheric OH reactivities in the Pearl River Delta – China in summer 2006: measurement and model results, Atmos. Chem. Phys., 10, 11243–11260, https://doi.org/10.5194/acp-10-11243-2010, 2010.
Lu, K. D., Hofzumahaus, A., Holland, F., Bohn, B., Brauers, T., Fuchs, H., Hu, M., Häseler, R., Kita, K., Kondo, Y., Li, X., Lou, S. R., Oebel, A., Shao, M., Zeng, L. M., Wahner, A., Zhu, T., Zhang, Y. H., and Rohrer, F.: Missing OH source in a suburban environment near Beijing: observed and modelled OH and HO2 concentrations in summer 2006, Atmos. Chem. Phys., 13, 1057–1080, https://doi.org/10.5194/acp-13-1057-2013, 2013.
Lv, S., Gong, D., Ding, Y., Lin, Y., Wang, H., and Ding, H.: Elevated levels of glyoxal and methylglyoxal at a remote mountain site in southern China: Prompt in-situ formation combined with strong regional transport, Sci. Total Environ., 672, 869–882, 2019.
Lyu, X. P., Chen, N., Guo, H., Zhang, W. H., and Liu, M.: Ambient volatile organic compounds and their effect on ozone production in Wuhan, central China, Sci. Total Environ., 541, 200–209, 2015.
Ma, X., Tan, Z., Lu, K., Yang, X., Liu, Y., Li, S., Li, X., Chen, S., Novelli, A., Cho, C., and Zeng, L.: Winter photochemistry in Beijing: Observation and model simulation of OH and HO2 radicals at an urban site, Sci. Total Environ., 685, 85–95, 2019.
Madronich, S. and Flocke, S.: Theoretical estimation of biologically effective UV radiation at the Earth's surface, in: Solar ultraviolet radiation, 152, 23–48, 1997.
Matsunaga, A. and Ziemann, P. J.: Gas-wall partitioning of organic compounds in a Teflon film chamber and potential effects on reaction product and aerosol yield measurements, Aerosol Sci. Technol., 44, 881–892, 2010.
McNeill, V. F.: Aqueous Organic Chemistry in the Atmosphere: Sources and Chemical Processing of Organic Aerosols, Environ. Sci. Technol., 49, 1237–1244, 2015.
Mellouki, A., Wallington, T. J., and Chen, J.: Atmospheric chemistry of oxygenated volatile organic compounds: impacts on air quality and climate, Chem. Rev., 10, 3984–4014, 2015.
Nishino, N., Arey, J., and Atkinson, R.: Formation yields of glyoxal and methylglyoxal from the gas-phase OH radical-initiated reactions of toluene, xylenes, and trimethylbenzenes as a function of NO2 concentration, J. Phys. Chem. A., 114, 10140–10147, 2010.
Noziere, B., Dziedzic, P., and Córdova, A.: Products and kinetics of the liquid-phase reaction of glyoxal catalyzed by ammonium ions (NH), J. Phys. Chem. A., 113, 231–237, 2008.
Pye, H. O. T., Murphy, B. N., Xu, L., Ng, N. L., Carlton, A. G., Guo, H., Weber, R., Vasilakos, P., Appel, K. W., Budisulistiorini, S. H., Surratt, J. D., Nenes, A., Hu, W., Jimenez, J. L., Isaacman-VanWertz, G., Misztal, P. K., and Goldstein, A. H.: On the implications of aerosol liquid water and phase separation for organic aerosol mass, Atmos. Chem. Phys., 17, 343–369, https://doi.org/10.5194/acp-17-343-2017, 2017.
Ren, X., Brune, W. H., Mao, J., Mitchell, M. J., Lesher, R. L., Simpas, J. B., Metcalf, A. R., Schwab, J. J., Cai, C., Li, Y., and Demerjian, K. L.: Behavior of OH and HO2 in the winter atmosphere in New York City, Atmos. Environ., 40, 252–263, 2006.
Schweitzer, F., Magi, L., Mirabel, P., and George, C.: Uptake rate measurements of methanesulfonic acid and glyoxal by aqueous droplets, J. Phys. Chem. A., 102, 593–600, 1998.
Stavrakou, T., Müller, J.-F., De Smedt, I., Van Roozendael, M., Kanakidou, M., Vrekoussis, M., Wittrock, F., Richter, A., and Burrows, J. P.: The continental source of glyoxal estimated by the synergistic use of spaceborne measurements and inverse modelling, Atmos. Chem. Phys., 9, 8431–8446, https://doi.org/10.5194/acp-9-8431-2009, 2009.
Stein, S. E. and Brown, R. L.: Estimation of normal boiling points from group contributions, J. Chem. Info. Comp. Sci., 34, 581–587, 1994.
Steinfeld, J. I., Francisco, J. S., and Hase, W. L.: Chemical Kinetics and Dynamics, 2nd edn., Pearson, 1998.
Stroud, C. A., Makar, P. A., Michelangeli, D. V., Mozurkewich, M., Hastie, D. R., Barbu, A., and Humble, J.: Simulating organic aerosol formation during the photooxidation of toluene/Nox mixtures: comparing the equilibrium and kinetic assumption, Environ. Sci. Technol., 38, 1471–1479, 2004.
Sumner, A. J., Woo, J. L., and McNeill, V. F.: Model Analysis of secondary organic aerosol formation by glyoxal in laboratory studies: The case for photoenhanced chemistry, Environ. Sci. Technol., 48, 11919–11925, 2014.
Tan, Z., Lu, K., Hofzumahaus, A., Fuchs, H., Bohn, B., Holland, F., Liu, Y., Rohrer, F., Shao, M., Sun, K., Wu, Y., Zeng, L., Zhang, Y., Zou, Q., Kiendler-Scharr, A., Wahner, A., and Zhang, Y.: Experimental budgets of OH, HO2, and RO2 radicals and implications for ozone formation in the Pearl River Delta in China 2014, Atmos. Chem. Phys., 19, 7129–7150, https://doi.org/10.5194/acp-19-7129-2019, 2019.
Volkamer, R., Barnes, I., Platt, U., Molina, L. T., and Molina, M. J.: Remote sensing of glyoxal by differential optical absorption spectroscopy (DOAS): Advancements in simulation chamber and field experiments, in: Environmental Simulation Chambers: Application to Atmospheric Chemical Processes, Springer, 2006.
Volkamer, R., San Martini, F., Molina, L. T., Salcedo, D., Jimenez, J. L., and Molina, M. J.: A missing sink for gas-phase glyoxal in Mexico City: Formation of secondary organic aerosol, Geophys. Res. Lett., 34, 255–268, 2007.
Wang, M., Zeng, L., Lu, S., Shao, M., Liu, X., and Yu, X.: Development and validation of a cryogen-free automatic gas chromatograph system (GC-MS/FID) for online measurements of volatile organic compounds, Anal. Methods., 6, 9424–9434, 2014.
Wang, S., Wu, D., Wang, X. M., Fung, J. C. H., and Yu, J. Z.: Relative contributions of secondary organic aerosol formation from toluene, xylenes, isoprene, and monoterpenes in Hong Kong and Guangzhou in the Pearl River Delta, China: an emission-based box modeling study, J. Geophys. Res., 118, 507–519, 2013.
Wang, X. M.: Study on the roles of semi-volatile organic compound in the formation of secondary organic aerosol in East China. NSFC briefing in Guangzhou, China, p. 3, 2019.
Wang, X. M., Wu, Z. Y., and Liang, G. X.: WRF/CHEM modeling of impacts of weather conditions modified by urban expansion on secondary organic aerosol formation over Pearl River Delta, Particuology, 7, 384–391, 2009.
Wang, Y., Wang, H., Guo, H., Lyu, X., Cheng, H., Ling, Z., Louie, P. K. K., Simpson, I. J., Meinardi, S., and Blake, D. R.: Long-term O3–precursor relationships in Hong Kong: field observation and model simulation, Atmos. Chem. Phys., 17, 10919–10935, https://doi.org/10.5194/acp-17-10919-2017, 2017.
Washenfelder, R. A., Young, C. J., Brown, S. S., Angevine, W. M., Atlas, E. L., Blake, D. R., Bon, D. M., Cubison, M. J., De Gouw, J. A., Dusanter, S., Flynn, J., Gilman, J. B., Graus, M., Griffith, S., Grossberg, N., Hayes, P. L., Jimenez, J. L., Kuster, W. C., Lefer, B. L., Pollack, I. B., Ryerson, T. B., Stark, H., Stevens, P. S., and Trainer, M. K.: The glyoxal budget and its contribution to organic aerosol for Los Angeles, California, during CalNex 2010, J. Geophys. Res., 116, D00V02, https://doi.org/10.1029/2011JD016314, 2011.
Waxman, E. M., Dzepina, K., Erves, B., Lee-Taylor, J., Aumont, B., Jimenez, J. L., Madronich, S., and Volkamer, R.: Secondary organic aerosol formation from semi- and intermediate volatility organic compounds and glyoxal: relevance of O/C as a tracer for aqueous multiphase chemistry, Geophys. Res. Lett., 40, 978–982, 2013.
Waxman, E. M., Elm, J., Kurtén, T., Mikkelsen, K. V., Ziemann, P. J., and Volkamer, R.: Glyoxal and methylglyoxal setschenow salting constants in sulfate, nitrate, and chloride solutions: Measurements and Gibbs energies, Environ. Sci. Technol., 49, 11500–11508, 2015.
Wu, L., Wang, X., Lu, S., Shao, M., and Ling, Z.: Emission inventory of semi-volatile and intermediate-volatility organic compounds and their effects on secondary organic aerosol over the Pearl River Delta region, Atmos. Chem. Phys., 19, 8141–8161, https://doi.org/10.5194/acp-19-8141-2019, 2019.
Xu, Z., Wang, T., Xue, L. K., Louie, P. K. K., Luk, C. W. Y., and Gao, J.: Evaluating the uncertainties of thermal catalytic conversion in measuring atmospheric nitrogen dioxide at four differently polluted sites in China, Atmos. Environ., 76, 221–226, 2013.
Xue, L. K., Wang, T., Gao, J., Ding, A. J., Zhou, X. H., Blake, D. R., Wang, X. F., Saunders, S. M., Fan, S. J., Zuo, H. C., Zhang, Q. Z., and Wang, W. X.: Ground-level ozone in four Chinese cities: precursors, regional transport and heterogeneous processes, Atmos. Chem. Phys., 14, 13175–13188, https://doi.org/10.5194/acp-14-13175-2014, 2014a.
Xue, L. K., Wang, T., Louie, P. K. K., Luk, C. W. Y., Blake, D. R., and Xu, Z.: Increasing external effects negate local efforts to control ozone air pollution: a case study of Hong Kong and implications for other Chinese cities, Environ. Sci. Technol., 48, 10769–10775, 2014b.
Ying, Q., Li, J., and Kota, S. H.: Significant contributions of isoprene to summertime secondary organic aerosol in eastern United States, Environ. Sci. Technol., 49, 7834–7842, 2015.
Yu, G., Bayer, A. R., Galloway, M. M., Korshavn, K. J., Fry, C. G., and Keutsch, F. N.: Glyoxal in aqueous ammonium sulfate solutions: products, kinetics and hydration effects, Environ. Sci. Technol., 45, 6336–6342, 2011.
Yuan, B., Hu, W. W., Shao, M., Wang, M., Chen, W. T., Lu, S. H., Zeng, L. M., and Hu, M.: VOC emissions, evolutions and contributions to SOA formation at a receptor site in eastern China, Atmos. Chem. Phys., 13, 8815–8832, https://doi.org/10.5194/acp-13-8815-2013, 2013.
Yun, H., Wang, W., Wang, T., Xia, M., Yu, C., Wang, Z., Poon, S. C. N., Yue, D., and Zhou, Y.: Nitrate formation from heterogeneous uptake of dinitrogen pentoxide during a severe winter haze in southern China, Atmos. Chem. Phys., 18, 17515–17527, https://doi.org/10.5194/acp-18-17515-2018, 2018.
Zhang, R. Y., Wang, G. H., Guo, S., Zamora, M. L., Ying, Q., Lin, Y., Wang, W. G., Hu, M., and Wang, Y.: Formation of urban fine particle matter, Chem. Rev., 115, 3803–3855, 2015.
Zhang, X. and Seinfeld, J. H.: A functional group oxidation model (FGOM) for SOA formation and aging, Atmos. Chem. Phys., 13, 5907–5926, https://doi.org/10.5194/acp-13-5907-2013, 2013.
Zhang, X., Cappa, C. D., Jathar, S. H., McVay, R. C., Ensberg, J. J., Kleeman, M. J., and Seinfeld, J. H.: Influence of vapor wall loss in laboratory chambers on yields of secondary organic aerosol, P. Natl. Acad. Sci., 111, 5802–5807, 2014.
Zhang, Y. L., Wang, X. M., Sheng, W., Herrmann, H., Yang, W. Q., Huang, X. Y., Zhou, Z., Huang, Z. H., He, Q. F., and George, C.: On-road vehicle emissions of glyoxal and methylglyoxal from tunnel tests in urban Guangzhou, China. Atmos. Environ., 127, 55–60, 2016.
Zhang, Z., Wang, H., Chen, D., Li, Q., Thai, P., and Gong, D.: Emission characteristics of volatile organic compounds and their secondary organic aerosol formation potentials from a petroleum refinery in pearl river delta, China, Sci. Total Environ., 584–585, 1162–1174, 2017.
Zhou, X. and Mopper, K.: Measurement of sub-parts-per-billion levels of carbonyl compounds in marine air by a simple cartridge trapping procedure followed by liquid chromatography, Environ. Sci. Technol., 24, 1482–1485, 1990.
Zhu, T., Shang, J., and Zhao, D. F.: The roles of heterogeneous chemical processes in the formation of an air pollution complex and gray haze, Sci. China. Chem., 54, 145–153, 2011.