the Creative Commons Attribution 4.0 License.
the Creative Commons Attribution 4.0 License.
 | 05 Oct 2020
Electricity savings and greenhouse gas emission reductions from global phase-down of hydrofluorocarbons
Lena Höglund-Isaksson
John Dulac
Nihar Shah
Max Wei
Peter Rafaj
Wolfgang Schöpp
Hydrofluorocarbons (HFCs) are widely used as cooling agents in refrigeration and air conditioning, as solvents in industrial processes, as fire-extinguishing agents, for foam blowing, and as aerosol propellants. They have been used in large quantities as the primary substitutes for ozone-depleting substances regulated under the Montreal Protocol. However, many HFCs are potent greenhouse gases (GHGs) and as such subject to global phase-down under the Kigali Amendment (KA) to the Montreal Protocol. In this study, we develop a range of long-term scenarios for HFC emissions under varying degrees of stringency in climate policy and assess co-benefits in the form of electricity savings and associated reductions in GHG and air pollutant emissions. Due to technical opportunities to improve energy efficiency in cooling technologies, there exist potentials for significant electricity savings under a well-managed phase-down of HFCs. Our results reveal that the opportunity to simultaneously improve energy efficiency in stationary cooling technologies could bring additional climate benefits of about the same magnitude as that attributed to the HFCs phase-down. If technical energy efficiency improvements are fully implemented, the resulting electricity savings could exceed 20 % of future global electricity consumption, while the corresponding figure for economic energy efficiency improvements would be about 15 %. The combined effect of HFC phase-down, energy efficiency improvement of the stationary cooling technologies, and future changes in the electricity generation fuel mix would prevent between 411 and 631 Pg CO2 equivalent of GHG emissions between 2018 and 2100, thereby making a significant contribution towards keeping the global temperature rise below 2 ∘C. Reduced electricity consumption also means lower air pollution emissions in the power sector, estimated at about 5 %–10 % for sulfur dioxide (SO2), 8 %–16 % for nitrogen oxides (NOx), and 4 %–9 % for fine particulate matter (PM2.5) emissions compared with a pre-Kigali baseline.
- Article
(5346 KB) - Full-text XML
-
Supplement
(1690 KB) - BibTeX
- EndNote


Hydrofluorocarbons (HFCs) are widely used as cooling agents in refrigeration and air conditioning, as solvents in certain industrial processes, as fire-extinguishing agents, for foam blowing, and as aerosol propellants. As well, HFC-23 is generated as a byproduct of chlorodifluoromethane (HCFC-22) production used in refrigerants and as a chemical feedstock for manufacturing synthetic polymers. HFC emissions have increased significantly in recent years in response to increased demand for cooling services and the phaseout of ozone-depleting substances under the Montreal Protocol (UNEP, 2007; Velders et al., 2009, 2012, 2015; Gschrey et al., 2011; Fang et al., 2016, 2018; Purohit and Höglund-Isaksson, 2017). Many HFCs are potent greenhouse gases (GHGs) with a global warming potential (GWP) up to 12400 times that of CO2 per mass unit (IPCC, 2013) over a 100-year time horizon. As users phase out chlorofluorocarbons (CFCs) and hydrochlorofluorocarbons (HCFCs) under the Montreal Protocol, they have often made choices between high-GWP HFC alternatives and alternatives that are more climate friendly, e.g., hydrocarbons, ammonia, pressurized carbon dioxide, and unsaturated HFCs (i.e., hydrofluoroolefins or HFOs in short). In particular, countries subject to Article 5 under the Montreal Protocol (i.e., developing countries) now have the opportunity to leapfrog from the current use of HCFCs and HFCs to alternative technologies with low global warming potential (low GWP) that are often also more energy efficient (UNEP, 2016a).
The Kigali Amendment (KA) to the Montreal Protocol agreed upon in October 2016 and which entered into force on 1 January 2019 is a global agreement1 to phase down and almost eliminate the consumption of HFCs by 2050 (UNEP, 2016b). Under the KA, countries have been attributed to four different party groups2 (Table S1 in the Supplement), in which each is subject to an emission reduction schedule outlining target reduction over the next 3 decades. While previous Montreal Protocol agreements have resulted in improvements in the design and energy performance of equipment (IPCC/TEAP, 2005), the KA is the first time that maintaining and/or enhancing the energy efficiency of equipment is explicitly included as a goal (EIA, 2016). Hence, the environmental impact of a transition away from HFCs is not only associated with the radiative properties and lifetime of the cooling agents, but also with the lower carbon dioxide (CO2), methane (CH4), and air-pollution emissions associated with the reduced energy used to power the cooling equipment over its entire lifetime. The switch to low-GWP cooling technology accordingly offers an opportunity to redesign equipment and improve its energy efficiency (UNEP, 2016a). Due much to a lack of detailed estimations at the sector, technology, and HFC species levels, there is currently limited understanding of the potential future impacts of the KA on global warming and possible co-benefits from savings in electricity (Shah et al., 2019). This study is, as far as we are aware, the first attempt to try to quantify the overall effects of the KA on both greenhouse gas and air pollutant emissions. Similarly, there is a need to better understand the implications of going beyond the KA targets and aiming at a close to complete phaseout of HFC emissions globally at an earlier point in time than required under the KA. Addressing these knowledge gaps is the purpose of this study.
The Greenhouse gas–Air pollution Interactions and Synergies (GAINS) model developed by the International Institute for Applied Systems Analysis (IIASA) has previously been used to produce detailed future scenarios for HFC emissions extending to 2050 (Höglund-Isaksson et al., 2017; Purohit and Höglund-Isaksson, 2017), which have fed into climate models to assess potential impacts on global warming (e.g., UNEP/CCAC, 2018; Rogelj et al., 2018; UNEP, 2017b; Gambhir et al., 2017). This study extends previous work by producing long-term scenarios of HFC emissions to the year 2100 under varying degrees of stringency in climate policy and by assessing potential co-benefits in the form of savings in electricity and associated reductions in greenhouse gas and air pollution emissions.
The paper is set out as follows: Sect. 2 presents the methodology used to generate baseline and alternative scenarios for HFC emissions and for estimating potentials for electricity savings in the cooling sector; Sect. 3 presents the low-GWP options considered as replacements for the use of high-GWP HFCs in the GAINS model; Sect. 4 presents results, while Sect. 5 concludes the key findings.
2.1 Baseline scenarios
For the purpose of this study, baseline scenarios for global HFC emissions have been developed under the assumption that the KA is not implemented. Although pre-KA baseline scenarios may be seen as outdated and therefore uninteresting given that the KA has already entered into force, it is still necessary to first generate baselines as consistent bases for the construction of future emission reduction scenarios. The demand for cooling is here expressed in terms of equivalent mass units of HFCs consumed. The starting point is the current consumption of HFCs by species and sector as reported by countries to the United Nations Framework Convention on Climate Change (UNFCCC) or derived in the GAINS model using a consistent methodology (Purohit and Höglund-Isaksson, 2017). To the extent that alternative technologies are already adopted due to existing national and regional regulations (see Sect. S1 in the Supplement), impacts are reflected in both historical HFC consumption levels and in future baseline scenarios. Future demand for HFCs in a pre-KA setting is projected using population, macroeconomic variables (GDP and value added from industry and services), and cooling degree days (CDDs) as drivers and under the assumption that the use of HFCs for cooling continues into the future. The pre-KA baseline scenarios provide a primary point of reference for evaluating the need for – and impact of – alternative technologies. Hence, the mitigation scenarios developed here assume the same demand for cooling services as in the respective baselines but with the consumption of high-GWP HFCs replaced by alternative low-GWP technologies. The choice and order of adoption of technologies in a given sector are determined by marginal abatement cost curves estimated on the basis of baseline HFC consumption (Höglund-Isaksson et al., 2017). For descriptions of key drivers at the sectoral level, source-specific emission factors and implemented control policies, see the supplementary material of Purohit and Höglund-Isaksson (2017).
The baseline scenarios improve upon those presented in Purohit and Höglund-Isaksson (2017) and Höglund-Isaksson et al. (2017) not only by extending the scenarios to 2100, but also by making use of the information on historical HFC consumption by sector and HFC species that has recently become available at increasingly greater detail from the national reporting to the UNFCCC. The principal information sources used to estimate historical HFC consumption and emissions are as follows: (1) robust historical HFC consumption data by sector (2005, 2010, and 2015) for developed countries derived from their UNFCCC National Inventory Submissions (UNFCCC, 2017); (2) historical HFC consumption data for China and India and with some additional information for other developing countries from various national and international sources3; (3) data on historical HCFC consumption from UNEP (2017a), part of which has been replaced by HFCs; and (4) assumed effective control of HFC-23 (CHF3) emissions from the manufacture of HCFC-22 (CHClF2) in China (Simmonds et al., 2017; UNEP, 2018) and India (GoI, 2016; Say et al., 2019). From these compiled datasets, historical HFC consumption is derived for 174 countries and regions and for 14 separate source sectors – including aerosols, commercial refrigeration, domestic refrigerators, fire extinguishers, ground source heat pumps, HCFC-22 production for emissive and feedstock applications, one-component and other foams, industrial refrigeration, mobile air conditioning, solvents, stationary air conditioning (including commercial and residential – and transport refrigeration) – and 13 different HFC species (HFC-23, HFC-32, HFC-125, HFC-134, HFC-134a, HFC-143, HFC-143a, HFC-152a, HFC-245fa, HFC-365mfc, HFC-43-10mee, HFC-227ea, HFC-236fa). Blends of HFCs have been decomposed and attributed to respective HFC species4. Moreover, the commercial refrigeration and air-conditioning sectors are subdivided into small and large systems to allow for adoption of different low-GWP alternatives for small and large units in mitigation scenarios. The same level of detail at the country, sector and HFC species levels as for historical emissions is maintained in the construction of future emission scenarios.
In this study, we have chosen to follow the convention of the policy community to use IPCC global warming potentials over 100 years (GWP100) without climate–carbon feedback effects to convert the varying atmospheric lifetimes and warming potentials for different HFC species to equivalent CO2 (CO2 eq) units (IPCC, 2013). This convention has been adopted in negotiations for several international climate agreements, e.g., the Kyoto Protocol, the draft text of the Paris Agreement (UNFCCC, 2018), the standardized life-cycle assessment (LCA) and carbon-foot printing approaches (ISO, 2006), and in media and among the general public for assessing the relative climate impacts of given products or activities (Lynch et al., 2020). Despite there being good reasons for questioning this convention, in particular when analyzing the impact of short-lived climate forcers (Cain et al., 2019), we find it well motivated to apply the standard GWP100 metric here as it facilitates the discussion of results in the policy context. A broader assessment of implications of results on global warming in the short and long run could be an interesting topic for future research but is considered out of scope for this paper.
For the development of the baseline scenarios in the timeframe extending to 2040, we use the existing model setup in GAINS, which for global scenarios uses drivers consistent with macroeconomic and energy sector projections from the IEA World Energy Outlook 2017 (IEA-WEO, 2017).5 To reflect the emission impact range of a continued fossil-fuel-driven development relative to a decarbonization of the energy systems, the analysis use implied emission factors from three IEA-WEO2017 scenarios: Current Policies Scenario (CPS)6, New Policies Scenario (NPS),7 and Sustainable Development Scenario (SDS).8 For stationary air conditioning, the global stock of air conditioners in buildings modeled in GAINS were adjusted to approximate the stocks estimated by the IEA (2018). The extension in demand for cooling services between 2040 and 2100, expressed here in tonnes of HFC consumed, has been generated to be consistent with the growth in population and macroeconomic indicators of the third Shared Socioeconomic Pathway (SSP3) (IIASA, 2017),9 and the expected future increase in regional CDDs10 received from IEA (2018). The reason for selecting the SSP3 scenario as the primary driver for the extension to 2100 is that for the period 2005 to 2040 it comes close to the IEA-WEO (2017) in terms of growth in global population and GDP levels (see Fig. S1 in the Supplement). The SSP3 is, however, a relatively pessimistic future scenario, with the highest growth in global population and one of the lowest GDP growth rates among all SSP scenarios. We have therefore prepared alternative projections to 2100 using the more optimistic SSP1 scenario as a sensitivity case.11 The difference in HFC emission projections, compared to the SSP3, turned out to be minimal. Since the mitigation potential relative to the baseline is similar for different SSP scenarios, this kind of sensitivity analysis only brings added value in a baseline setting (addressing a variation in baseline demand for cooling services). The SSP1 scenario is therefore not analyzed in a mitigation context.
Exposure to health risks due to extreme temperatures has been growing worldwide (Mueller et al., 2016; Pal and Eltahir, 2016; Mora et al., 2017; Russo et al., 2017), and a significant number of heat-related deaths are reported annually during the summer months in both the Northern Hemisphere and Southern Hemisphere, particularly among the elderly and the poor and in densely populated cities (Mastrucci et al., 2019). Global heat stress is projected to increase in a world that is 1.5 ∘C warmer (IPCC, 2018). Compared to a 1961–1990 level, climate change could by 2030 be responsible for additional annual deaths of 38 000 people from heat stress, particularly among the elderly (WHO, 2014). Each 1 ∘C increase could reduce work productivity by 1 %–3 % for people working outdoors or without air conditioning, typically the poorer segments of the workforce (Park et al., 2015). The increased use of air conditioning enhances resilience to heat stress (Petkova et al., 2017). However, due to its high cost, air conditioning is considered a luxury, and only 8 % of the 2.8 billion people living in the world's hottest regions possess an air-conditioning unit today (IEA, 2018). In addition, almost 1 billion people lack access to electricity (IEA, 2019), and at least 1 billion live in slum conditions (World Bank, 2019), both of which make access to space cooling challenging. Cooling contributes significantly to peak load and is therefore an important consideration when deciding on capacity of electricity networks (Shah et al., 2015). The lack of access to essential indoor cooling is a major equity issue and is increasingly seen as a dimension of energy poverty and wellbeing that demands attention from policymakers. Therefore, in parallel with the SSP3 baseline scenario and drawing on previous work by IEA (IEA, 2018), a Cooling for All12 scenario has been developed, which is an alternate baseline scenario that focuses on how we embed growing cooling demands that can reach everyone within a clean energy transition and, in turn, support faster progress to achieve the goals of the KA. In this alternate baseline scenario, we do not model demand for cooling services in the residential sector only as a function of population, macroeconomic drivers, and changes in CDDs but rather assume in addition that in countries and regions with climates on average exceeding 1000 CDDs,13 the uptake of residential air conditioners is at least one per household by 2050 (and takes place irrespective of income constraints). Similarly, the uptake of domestic refrigerators in the Cooling for All scenario is assumed to be at least one per household by 2050 irrespective of income constraints.
Energy efficient buildings, shading, cool/green roofs, etc. could substantially reduce HFC and electricity consumption in residential and commercial buildings (Goetzler et al., 2016). However, in this study we have not considered such options, partly due to a lack of detailed information about their potential at the country level and partly due to the focus of this study on direct replacement of current and future use of HFCs with alternative substances. Furthermore, effective cooling is essential to preserve food and medicine (Peters, 2018). The increased demand for cooling to preserve food in a warmer world, including the associated increase in electricity consumption, is considered in the baseline scenarios for emissions developed here. Extended refrigeration of food would also mean reduced food losses, which apart from having important implications for meeting nutritional needs, would also contribute to reduced greenhouse gas emissions from food production and better use of the 23 %–24 % of global cropland and fertilizers currently used to produce food that is eventually wasted (Kummu et al., 2012; Hiç et al., 2016). Hence, reducing global food supply chain losses have several important secondary benefits including conservation of energy and other resources (Kummu et al., 2012) as these are freed up to be converted into other productive activities (Ingram, 2011; Beddington et al., 2012; Kummu et al., 2012; Hiç et al., 2016; Lamb et al., 2016). Due to a lack of detailed information on impacts on food supply chains, such secondary benefits from extended use of industrial and commercial refrigeration and refrigerated transport are not considered in this study.
2.2 HFC reduction scenarios
We develop alternative HFC reduction scenarios in consistency with the demand for cooling modeled in the pre-KA baseline scenarios described in Sect. 2.1. The key contribution of this task is not to determine the reduction levels in HFC consumption (as these are already predetermined by the regional targets of the KA and by the almost complete reductions possible under the maximum technically feasible reduction – MTFR) but rather to investigate the content of the HFC phase-down in terms of the order and extent to which various alternative technologies are picked up in the different sectors and regions. This is important as it is only by understanding the content of the low-GWP technology uptake that we can get an idea of the expected degree of employment of different technologies and their respective contributions to electricity savings and reductions in GHGs and air pollution, which tend to differ by region, sector, and technology (Höglund-Isaksson et al., 2017).
The order of technology uptake to meet the KA targets is determined by the marginal abatement cost curves (MACCs), which for a given technology and sector are defined using country-, sector-, and year-specific information (Höglund-Isaksson et al., 2016, 2017). For example, the variation in unit costs reflects variations between countries and over time in electricity prices and labor costs. For this study, we have used MACCs to simulate technology uptake every 5 years until 2050 and assume the relative employment of technology in 2050 to remain constant until 2100 at the country and sector level. Given the high uncertainty about future technology developments, we find that it does not make much sense to model individual technology uptake in greater detail than this in the period post 2050. To model the sector technology uptake required to meet the KA, we have produced emission scenarios with cost curves including all HFC source sectors – i.e., in addition to cooling, we also include HFC emissions from aerosols, foams, industrial processes, and other sources. This is necessary because the relative contribution of each sector towards the predetermined regional reduction targets (see Sect. S2 in the Supplement) can only be determined when all HFC sectors are included in the analysis. Note that for given technology options, potential effects of future technological development on costs and the efficiency in reducing the climate impact of cooling when replacing HFCs have not been considered here. It would also not have a significant impact on conclusions of this study, since the use of HFCs in cooling can be completely replaced by existing alternative low-GWP measures, and costs are not assessed at the absolute level but for the sole purpose of using MACCs to determine the order of technology uptake. Technological development could also mean even larger potentials for energy efficiency improvements than those considered here as technical and economic potentials. Not considering this here may be considered a conservative assumption, as there could be some potential for even larger electricity savings in the future.
Once we have determined the types of technology and the extent to which they are expected to be employed in different countries and sectors, we can start quantifying the electricity savings expected from several of the technology switches that replace the use of HFCs. Hence, in addition to the direct climate benefits of HFC emission reductions, transitioning away from HFCs can catalyze additional climate benefits through improvements in the energy efficiency of the refrigerators, air conditioners, freezers, and other products and equipment that currently use HFCs. Historically, refrigerant conversions, driven by refrigerant phaseouts under the Montreal Protocol, have catalyzed significant improvements in the energy efficiency of refrigeration and AC systems – up to 60 % in some subsectors (Zaelke et al., 2013). Similar improvements are expected under an HFC phase-down following the KA targets. For example, recent demonstration projects for utilizing low-GWP alternatives to HFCs presented by the Climate and Clean Air Coalition (CCAC) calculated energy savings of 15 %–30 % and carbon footprint reductions of 60 %–85 % for refrigeration in commercial food stores (Borgford-Parnell et al., 2015; UNEP, 2016a). According to three research studies completed in Brazil, inverter units using lower-GWP refrigerants can save up to 67 % energy compared to fixed speed units with high GWP HFC-410A (UNEP/TEAP, 2019). Energy-related emissions can be reduced with lowered cooling demands, more efficient equipment, and operating strategies that maximize system performance (Calm, 2006; Mills, 2011; Sharma et al., 2014, 2017; Shah et al., 2015; Purohit et al., 2016; Dreyfus et al., 2017; Zaelke and Borgford-Parnell, 2015; IEA, 2018; P. Purohit et al., 2018; Park et al., 2019; Godwin and Ferenchiak, 2020). Shah et al. (2013) found that even the best currently available technology offers large efficiency improvement opportunities (35 %–70 % reduction in energy consumption from the market average) in room air conditioners. The current cost-effective efficiency improvements range from 20 % to 30 % reduction in energy consumption from a consumer perspective. Based on their operating profiles, even small efficiency improvements translate into significant reductions in GHG emissions (Phadke et al., 2014). Goetzler et al. (2016) estimated that 73 %–76 % of global CO2 eq emissions from air-conditioning systems in 2010 to be indirect emissions from the energy use. Recent estimates based on scientific assessments of ozone depletion indicate that improvements in energy efficiency in refrigeration and air-conditioner equipment during the KA transition to low-GWP alternative refrigerants, can potentially double the climate benefits of the HFC phase-down (WMO, 2018). In addition to energy efficiency improvements from technical adjustments of the cooling equipment (viz. stationary air conditioning and commercial, domestic, industrial, and transport refrigerators), there is also expected a small potential for energy efficiency improvement from the transition of high-GWP into low-GWP HFCs for given cooling equipment (Schwarz et al., 2011; Barrault et al., 2018; Shah et al., 2019; Anderson et al., 2020). Both these sources of energy efficiency improvements are considered in this study, while only the latter was considered in Purohit and Höglund-Isaksson (2017) and Höglund-Isaksson et al. (2017).
For the purpose of this study, information on expected energy efficiency improvement potentials through technical adjustments in stationary cooling equipment were provided by the Lawrence Berkeley National Laboratory (see Table S2 in the Supplement). Two different sets of assumptions were provided, a “technical” and an “economic” energy efficiency potential. The former reflects the efficiency improvement potential considered technically possible, i.e., representing an upper limit for expected energy efficiency improvements, while the latter reflects a minimum energy efficiency improvement that is considered economically profitable. Note that energy efficiency improvements take place also when HFCs are replaced in mobile air conditioners (MAC) (Blumberg et al., 2019). These are however not accounted for here as the drivers for associated emission changes are very different from those in stationary sources and more complex to estimate. Note also that while building design and urban planning can significantly reduce heating or cooling load14 (IEA, 2013), such options were not considered in this study as the focus here is on energy efficiency enhancements due to uptake of alternative cooling technologies to replace HFCs. Finally, note that the technical losses of electricity in transmission and distribution (T&D) segments have been taken into account (Brander et al., 2011), whereas nontechnical losses (NTLs),15 e.g., due to theft, have not been considered in the estimation of electricity-saving potentials. Table S2 provides information on the unit energy consumption (UEC) of stationary cooling technologies identified by LBNL and how these have been interpreted in this study in terms of energy efficiency improvement potentials in different sectors/technologies when moving from a pre-KA baseline to low-GWP alternative scenarios.
Lower electricity consumption translates into reduced emissions of GHGs, i.e., CO2 from fuel use and fugitive CH4 from fuel production, storage, and distribution, and air pollutants such as sulfur dioxide (SO2), nitrogen oxides (NOx) and particulate matter below 2.5 µm (PM2.5), and black and organic carbon (BC andOC). BC, OC, CH4, and HFCs are short-lived climate pollutants (SLCPs) with stronger warming impacts in the short than in the long run. While reductions in greenhouse gas emissions add to climate change mitigation, co-benefits in the form of reduced air pollution translate into health and ecosystem improvements (Nemet et al., 2010; Markandya et al., 2018; Vandyck et al., 2018). Commercial and residential buildings are known to use more electricity on hotter days (Schaeffer et al., 2012; Valor et al., 2001). The electricity generation plants (e.g., coal-, oil- and gas-fired power plants) that respond to this increased demand are major contributors to SO2 and NOx emissions (IEA, 2016), both of which have direct impacts on public health and contribute to the formation of secondary pollutants (Amann et al., 2020; Purohit et al., 2019) including ozone and PM2.5. Abel et al. (2017) found a 3.9 % increase in electricity generation per degree Celsius (∘C) that was consistent with the Sailor (2001) 0.4 %–5.3 % ∘C−1 sensitivity range. Further, NOx emissions sensitivity of 3.60 % ± 0.49 % ∘C−1 (Abel et al., 2017) was consistent with the range in He et al. (2013) of 2.5 %–4.0 % ∘C−1 using a similar methodology and region but a different time period. The atmospheric fate and climate impacts of BC from different regions could differ considerably (Berntsen et al., 2006; Reddy and Boucher, 2007). The net effects of BC and organic carbon (OC) on temperature and precipitation are potentially significant, especially at regional scales, because BC and OC have relatively short atmospheric lifetimes (days to weeks). These features mean BC and OC are not well mixed in the atmosphere (Bond et al., 2004; Hansen and Nazarenko, 2004; Forster et al., 2007), and therefore it is not possible to relatively easily convert into CO2 eq terms using GWPs.
The GAINS model contains a database on country-, sector-, and fuel-specific emission factors for a range of air pollutants and greenhouse gases from energy production and consumption (IIASA-GAINS, 2019). From this source, we take implied emission factors per gigawatt hour (GW h) electricity consumed for each pollutant listed above and in reflection of expected country- and year-specific fuel mixes used in power plants in the respective IEA-WEO 2017 energy scenarios CPS, NPS, and SDS, in the timeframe extending to 2040 (see Fig. S2 in the Supplement). While the implied emission factors for all other pollutants but CH4 reflect country- and year-specific emissions from combustion of fuels in the power sector, upstream CH4 emissions from extraction, storage and distribution of fossil fuels used in the power sector are only assessed at the global level due to a lack of information about future fossil fuel trade flows. Hence, the implied emission factors for CH4 reflect global year-specific factors consistent with the weighted average of upstream CH4 emissions embedded in an average unit of electricity consumed. Note that the SDS represents a low-carbon scenario consistent with a 2 ∘C (i.e., 450 ppm) global warming target for this century and with considerably lower air pollution due to a high degree of replacement of fossil fuel use with renewable energy. Detailed implied emission factors are available from IIASA's GAINS model only in the timeframe extending to 2040. The country-specific implied emission factors for air pollutants per gigawatt hour (GW h) electricity consumed representative for year 2040 have therefore been kept constant over the entire period 2040 to 2100.
Table 1Overview of the 31 variants of HFC and co-benefits emission scenarios analyzed in this study (CPS refers to the Current Policies Scenario, NPS to New Policies Scenario, and SDS to Sustainable Development Scenario of IEA-WEO 2017).
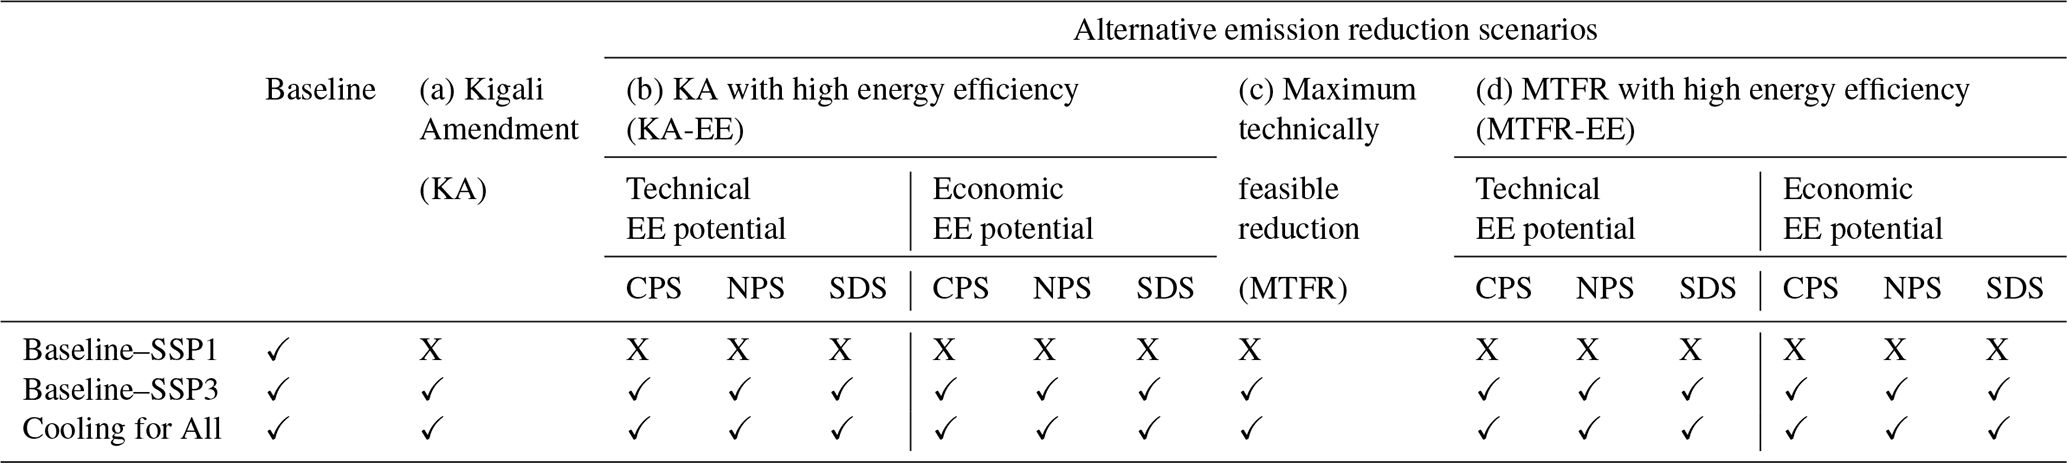
In conclusion, Table 1 summarizes the 31 different scenarios generated and analyzed in this study. As outlined in Sect. 2.1, there are three pre-KA baseline scenarios: Baseline–SSP1, Baseline–SSP3, and a Cooling for All baseline. The Baseline–SSP3 and the Cooling for All baseline have been used as starting points for four alternative HFC reduction scenarios; a Kigali Amendment (KA) scenario, a KA high energy efficiency (KA-EE) scenario, a maximum technically feasible reduction (MTFR) scenario, and a MTFR high energy efficiency (MTFR-EE) scenario. The high energy efficiency scenarios are specified for the “technical” and “economic” energy efficiency improvement potentials described above. For each of the four HFC reduction scenarios with energy efficiency improvements, global and regional estimates of expected electricity savings and associated impacts on GHGs and air pollutants have been estimated assuming compliance with the KA targets and under MTFR. Finally, for each high-EE scenario, three variants of implied emission factors for GHGs (CO2 and CH4) and air pollutants have been used, reflecting the three IEA-WEO 2017 energy scenarios, namely CPS, NPS, and SDS. In this way, the future air pollution projections span a wide range of possible future energy sector developments.
The KA scenarios (KA and KA-EE) have been developed to analyze the implications of achieving the HFC phase-down targets set out in the KA and specified for four different country/party groups. For each group, the relative HFC phase-down targets differ due to different baselines, HFC consumption freeze years, and HFC phase-down schedules (see Sect. S2). The sector-specific mitigation strategy identified for each of the four KA party groups is determined by the respective MACCs (Höglund-Isaksson et al., 2017). Savings on electricity costs make up an important part of the abatement cost. This study assumes larger potentials for energy efficiency improvements than in Höglund-Isaksson et al. (2017), and marginal abatement costs are therefore generally lower. Accordingly, a revised set of MACCs have been generated for all HFC sectors, by each party group, and for each 5-year interval to understand the expected technology compositions after countries have taken action to meet the KA targets. The MTFR scenarios have been developed to assess the maximum reduction of HFCs when not considering cost constraints but assuming the same sets of energy efficiency improvements as outlined in the KA-EE scenarios.
To avoid the use and emissions of both HFCs and HCFCs, a variety of climate-friendly, energy efficient, safe, and proven alternatives are available today (UNEP, 2011; CCAC, 2019). In fact, for most applications where HFCs and HCFCs are still used, more climate friendly alternatives can be found. However, due to different thermodynamic and safety properties of the alternatives, there is no ”one-size-fits-all” solution applicable to all equipment categories. The suitability of a certain alternative must be evaluated for each category of product and equipment and also must take account of the level of ambient temperature at the location where the product and equipment is being used and other factors such as safety codes and flammability ratings (Abdelaziz et al., 2016; N. Purohit et al., 2018). In recent years, there has been a focus on natural refrigerants (pressurized CO2, hydrocarbons, and ammonia), low-GWP HFCs, and HFOs used alone or in blends with HFCs to replace fluids with high-GWP (Beshr et al., 2015; McLinden et al., 2017; Anderson et al., 2020; Heredia-Aricapa et al., 2020). A recent increased use of hydrocarbons (e.g., isobutane and propane), ammonia, and pressurized carbon dioxide is expected to continue into the future (UNEP, 2016a). Many of these alternatives are widely used in non-Article 5 (developed countries) countries in response to national or regional regulations that require reductions in HFC use. The availability and uptake of these alternatives is rapidly increasing also in Article 5 countries (Reese, 2018; UNEP, 2019). Table 2 lists alternatives that are currently used on a commercial scale and considered in the GAINS model for assessing mitigation potentials. Moreover, the model considers good practice measures: leakage control during use and recovery of the refrigerant after end of life of the equipment.
Table 2Sector specific alternative options for high-GWP HFCs considered in the GAINS model.

∗ GAINS also consider a complete ban on HFC-based solvents as a control option.
4.1 HFC emissions
Pre-KA baseline HFC and/or HCFC emissions consistent with the macroeconomic development of the IEA-WEO 2017 in the period 2005–2040 and with the SSP3 in the period 2040–2100 are presented in Fig. 1. For historical years 2005, 2010, and 2015, the contribution from HFC emissions to global greenhouse gas emissions are estimated at 0.46, 0.73, and 1.1 Pg CO2 eq, respectively, with an additional 0.27, 0.40, and 0.23 Pg CO2 eq release of HCFCs in the respective years. In 2010, 22 % of HFC emissions are released from stationary air conditioning, 15 % as HFC-134a from mobile air conditioners, 31 % from commercial, industrial, transport, and domestic refrigeration, 18 % as HFC-23 emissions from HCFC-22 production for emissive and feedstock use, and 14 % from use in aerosols, foams, solvents, fire extinguishers, and ground source heat pumps. Hence, stationary cooling equipment releases more than half of global HFC emissions.
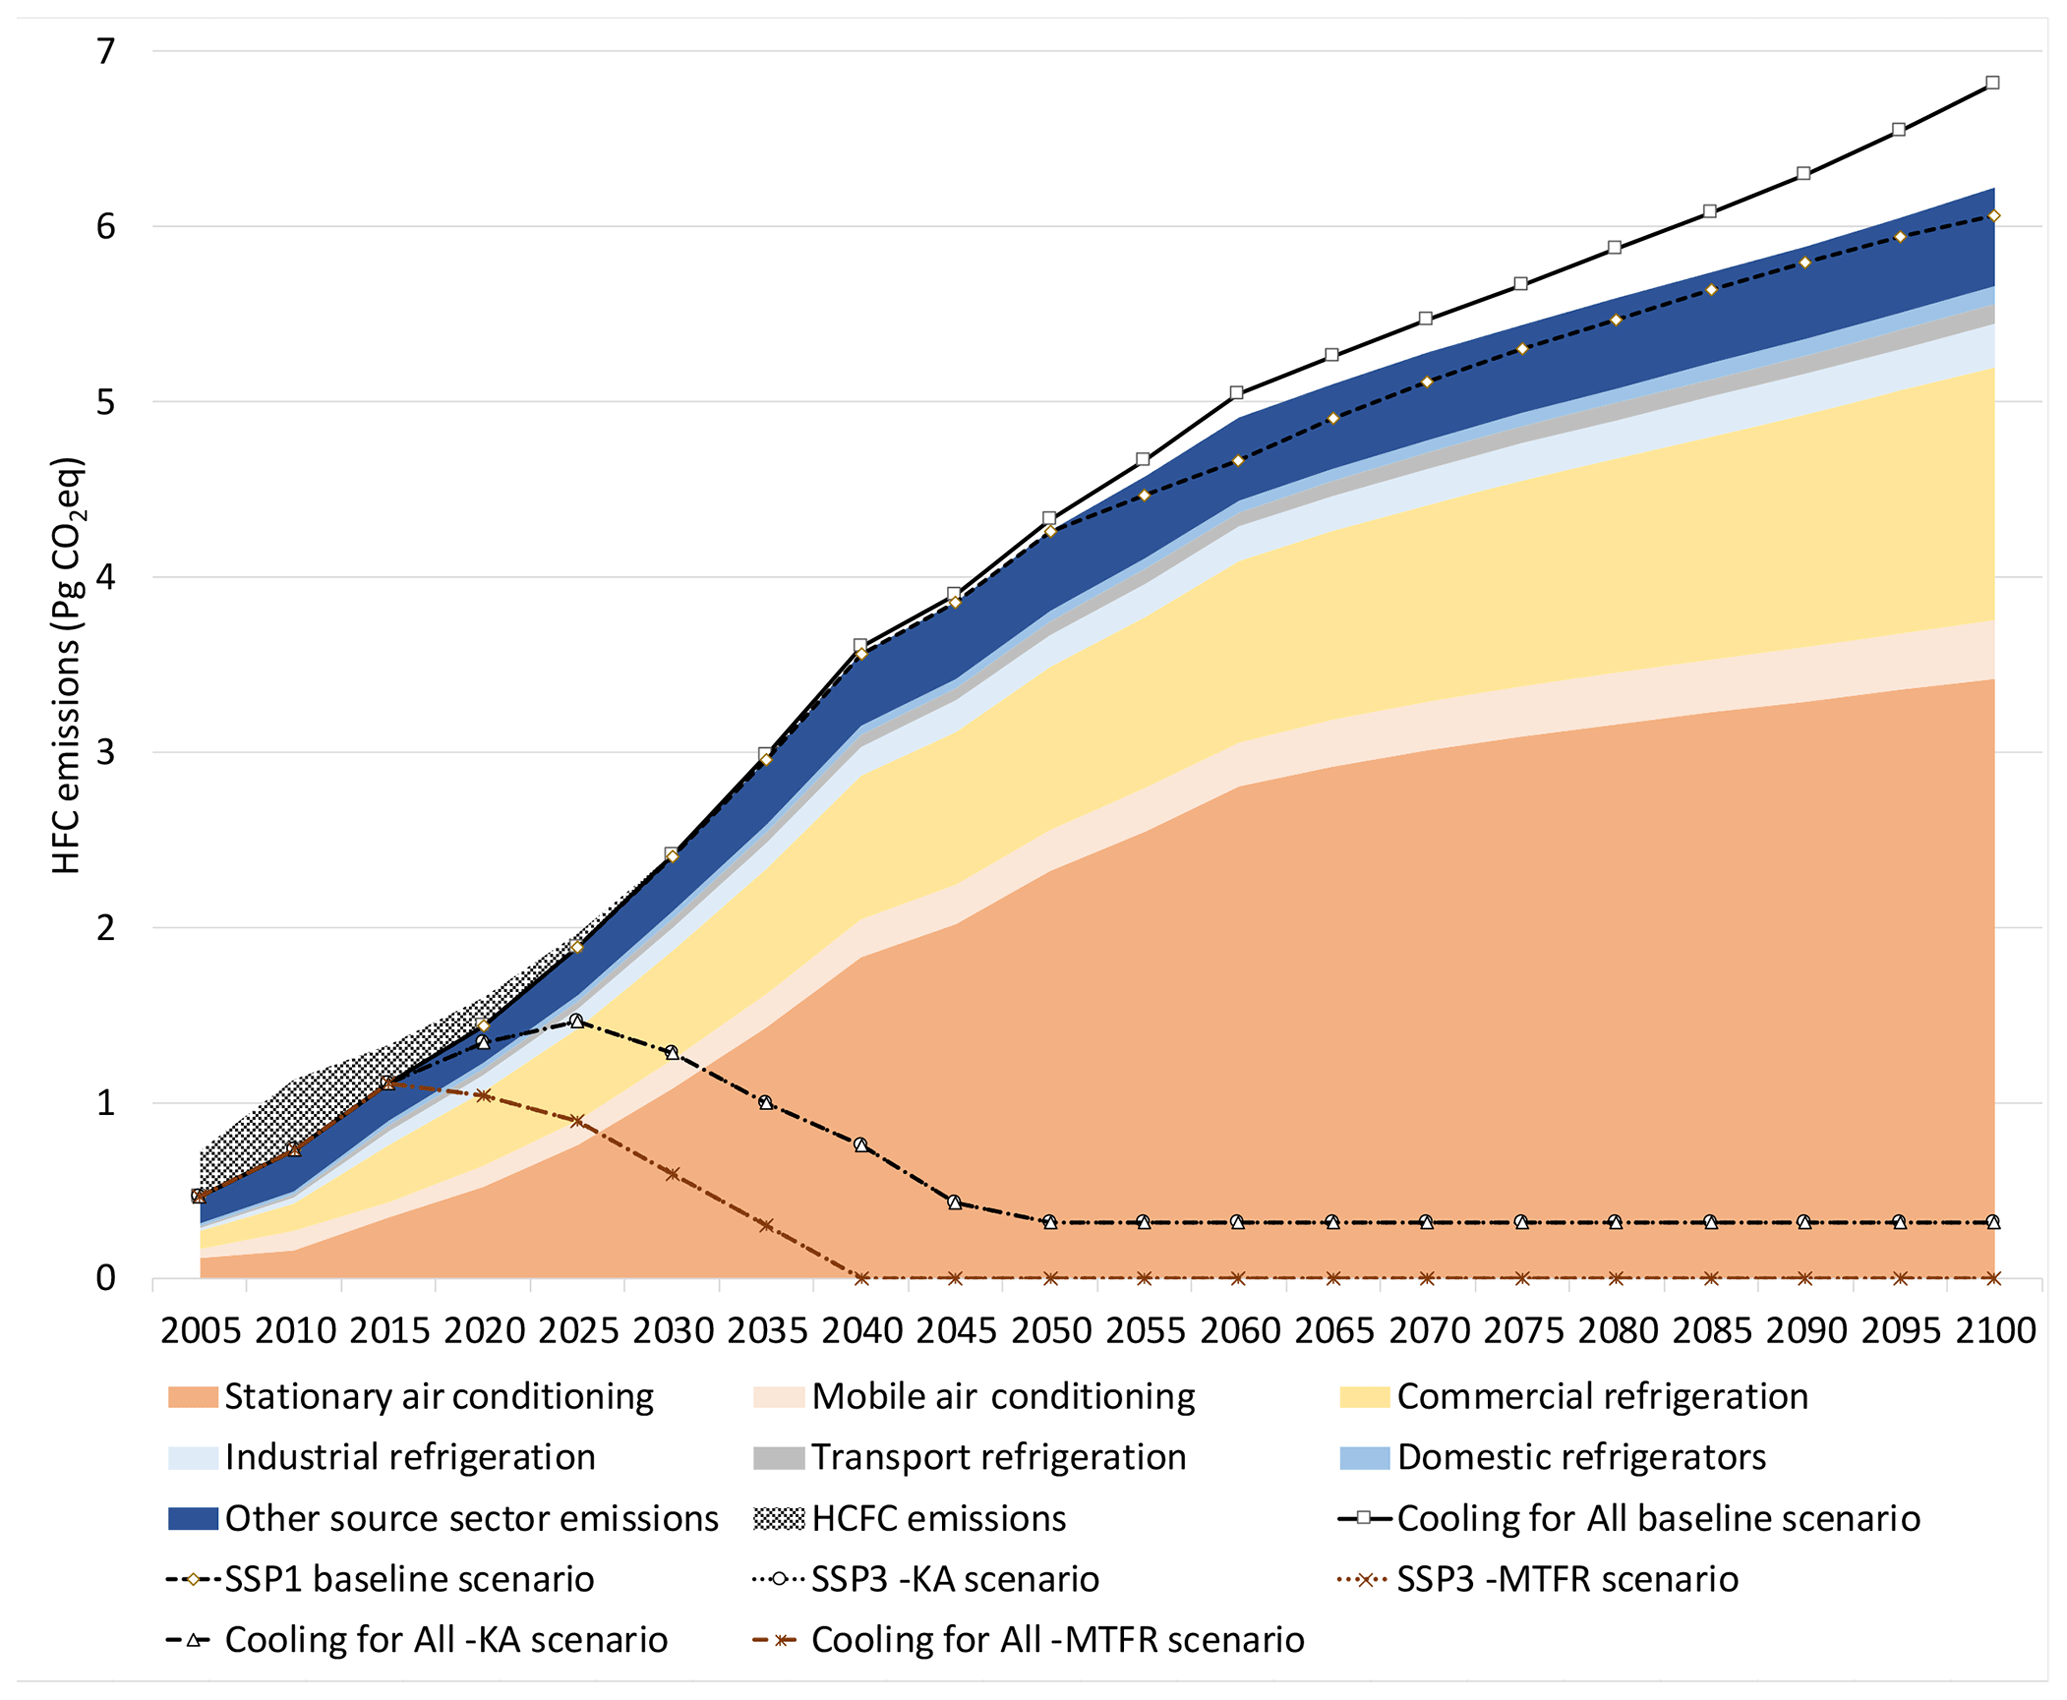
Figure 1Pre-Kigali SSP3 baseline HFC emissions (with baseline SSP1 and Cooling for All shown for comparison) and respective alternative scenarios (Kigali Amendment – KA and Maximum technically feasible reduction – MTFR). Note that Cooling for All -KA and Cooling for All -MTFR scenarios are not visible due to the small differences in mitigation scenarios to SSP3-KA and SSP3-MTFR.
Between 2005 and 2050, pre-KA baseline HFC emissions are estimated to increase by a factor of 9, as shown in Fig. 1. The growth is mainly driven by a 12-fold increase in demand for refrigeration and air-conditioning services, which in turn is driven by an expected increase in per capita wealth in developing countries combined with the effect of replacing CFCs and HCFCs with HFCs in accordance with the revised Montreal Protocol preceding the KA. Under the revised Montreal Protocol, HCFCs in emissive use should be virtually phased out by 2030, but it still allows for servicing of the existing stock until 2040. Baseline HFC emissions are expected to increase to 4.3 Pg CO2 eq in 2050 and to 6.2 Pg CO2 eq in 2100. The slower increase in the second half of the century is due to saturation in many markets. The expected pre-KA baseline HFC emissions in 2050 are within the range (4.0–5.3 Pg CO2 eq) of previous estimates by Velders et al. (2015).

As shown in Fig. 2, rapid growth in pre-KA baseline emissions is expected in Article 5 (mainly developing) countries with an approximately 11-fold increase between 2005 and 2100. China is expected to contribute one-quarter of global HFC emissions in 2050, closely followed by India (21 %). Between 2050 and 2100, HFC use in China and India is increasingly saturated, and these two countries emit about one-third of global HFC emissions in 2100. For the EU-28, pre-KA baseline HFC emissions in 2050 are lower than in 2005 due to implementation of stringent F-gas regulations, whereas corresponding emissions in the USA increase by a factor of 2 under existing regulations.
Table 3Pre-Kigali baseline HFC emissions per capita in residential air conditioning and domestic refrigerators under the SSP3 and Cooling for All scenarios.

HFC emissions per capita in residential air conditioning and domestic refrigeration sectors in the SSP3 and Cooling for All pre-KA baseline scenarios are presented in Table 3. Due to the increased penetration of room air conditioners and domestic refrigerators in the Cooling for All baseline scenario, HFC emissions per capita in Article 5 parties are 7 % and 36 % higher in 2050 and 2100, respectively, as compared to the SSP3 baseline scenario.
Table 4Cumulative HFC emissions in the pre-Kigali Baseline and corresponding Kigali Amendment (KA) and maximum technically feasible reduction (MTFR) scenarios by KA party groups and over the entire period 2018 to 2100.
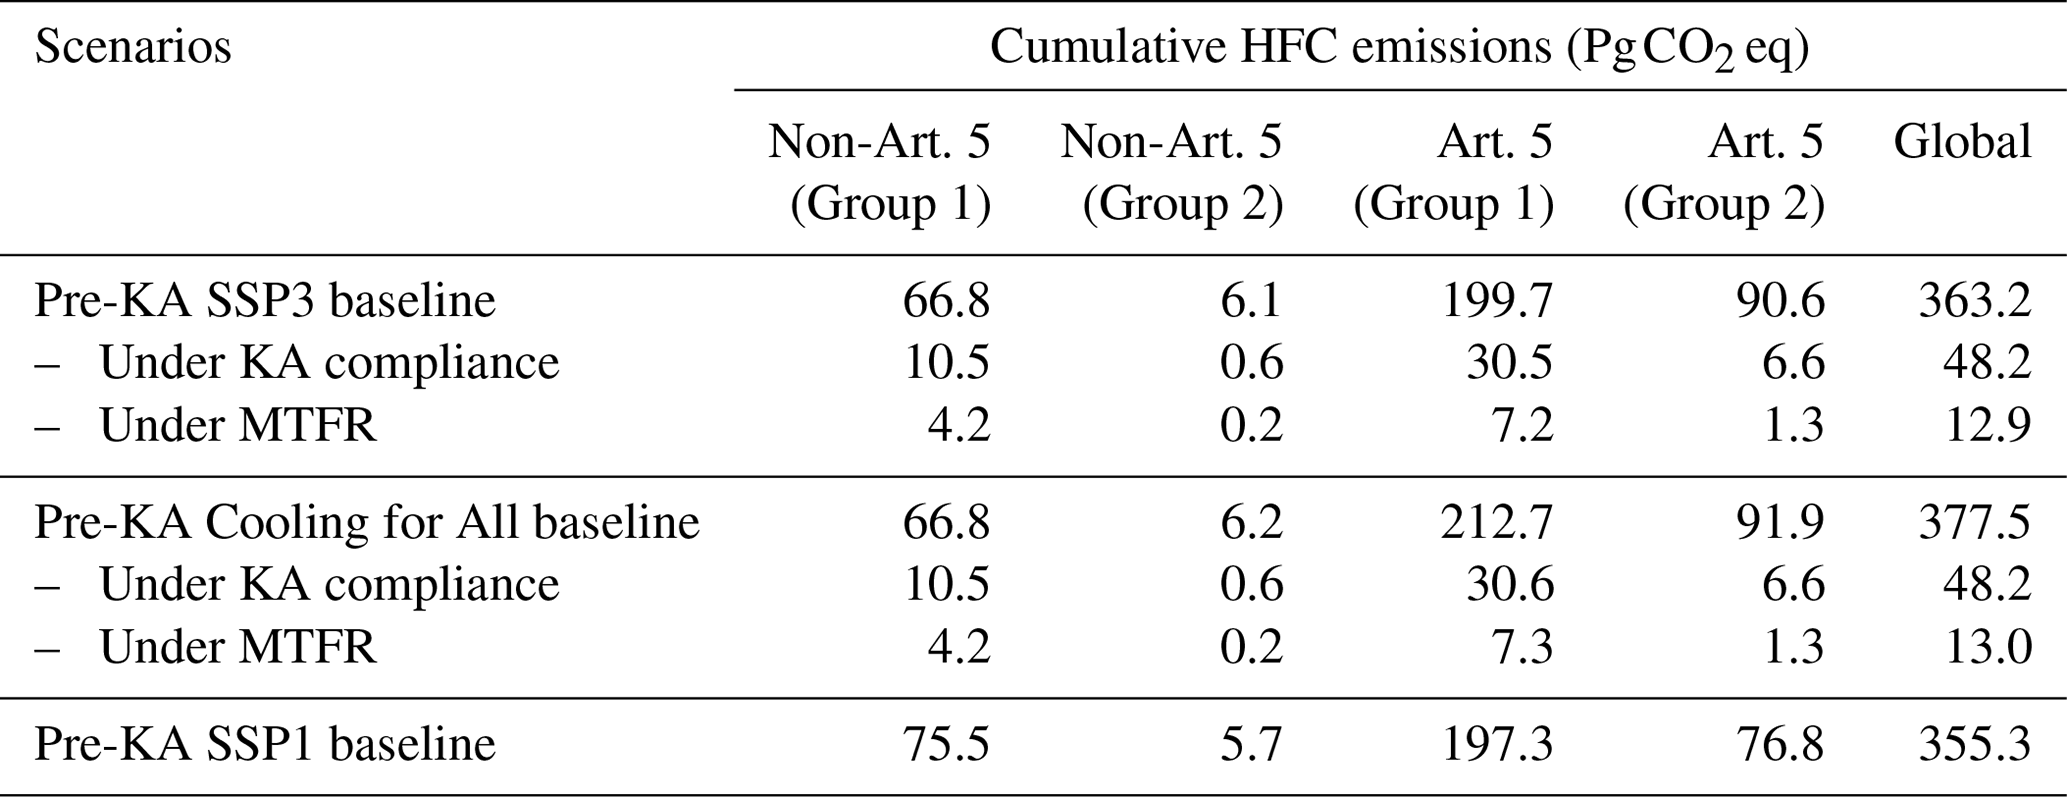
Figure 1 also presents global pre-KA HFC baseline emissions by key cooling sectors in the three baseline scenarios discussed in Sect. 2 (including also SSP1). In the Cooling for All baseline scenario, HFC emissions could reach 6.8 Pg CO2 eq by 2100, driven primarily by an increased cooling demand in the residential sector. As a sensitivity case, HFC emissions in the SSP1 baseline scenario reach 6.1 Pg CO2 eq by 2100. Hence, the SSP3 pre-KA baseline emissions fall between the Cooling for All and the SSP1 baseline scenarios. In the SSP3-KA scenario, HFC emissions decline gradually over the analyzed period reaching 92 % and 95 % removal of pre-KA baseline emissions on an annual basis in 2050 and 2100, respectively. Faster emission reductions than those mandated by the KA represent an additional opportunity for climate change mitigation (Cseh, 2019). The SSP3-MTFR scenario (lowest dashed line in Fig. 1) shows that it is considered technically feasible for KA party groups to move earlier in terms of emission reductions and to remove more than 99 % of annual emissions in the period 2035 to 2100. Figure S3 in the Supplement presents the HFC and/or HCFC emissions under the pre-KA baseline and alternative scenarios by different party groups.
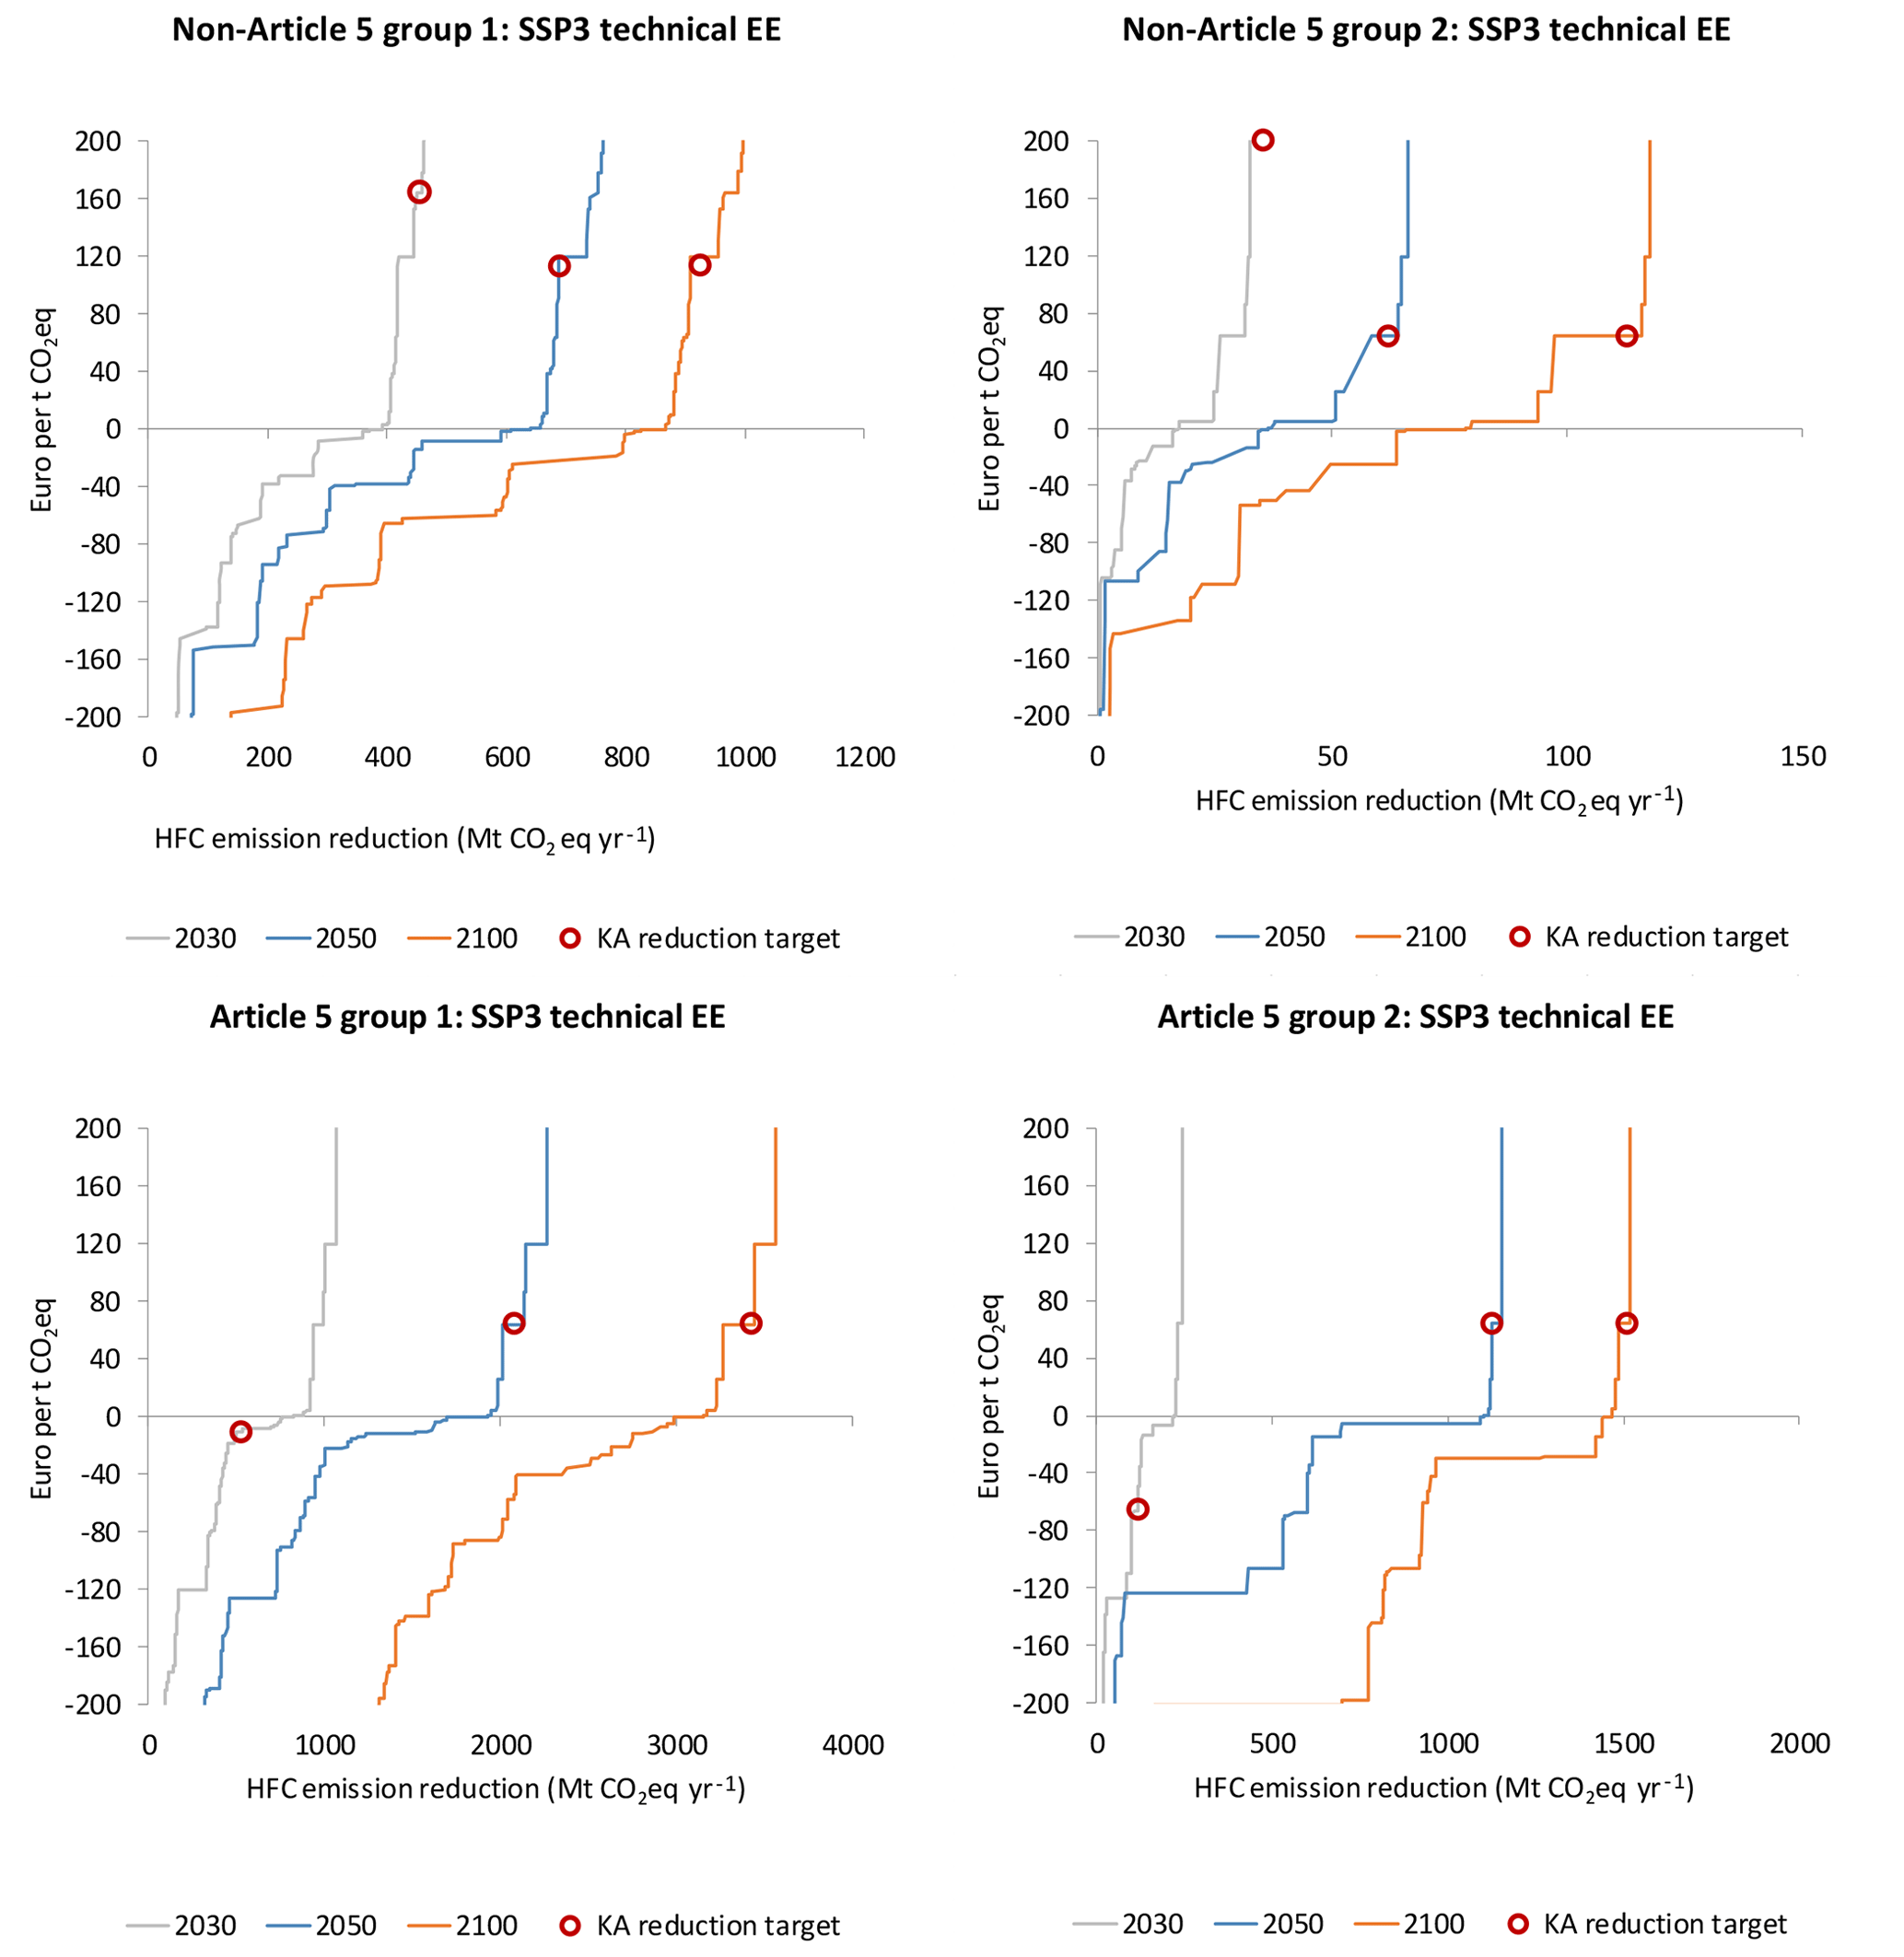
Figure 3Marginal abatement cost curves (MACCs) starting from a pre-Kigali SSP3 baseline consistent with the IEA-WEO17 New Policies scenario and reducing HFC emissions by Kigali Amendment (KA) party groups under technical energy efficiency improvements and indicating the KA HFC reduction targets in 2030, 2050, and 2100.
Table 4 presents the corresponding cumulative emissions over the entire period 2018 to 2100. At the global level, cumulative HFC emissions are estimated at 363 Pg CO2 eq in the pre-KA SSP3 baseline scenario and at 378 Pg CO2 eq in the pre-KA Cooling for All baseline scenario. In the sensitivity case using the SSP1 drivers, global cumulative HFC emissions are estimated at 355 Pg CO2 eq, which is about 2 % less than in the SSP3 baseline scenario. For both the SSP3 and Cooling for All baseline scenarios, stringent compliance with the KA is expected to reduce cumulative HFC emissions by 87 % below baseline, whereas the expected cumulative reduction in MTFR is nearly 97 % below baseline. This converts into cumulative HFC emissions of 48 Pg CO2 eq when complying with the KA and 13 Pg CO2 eq if implementing MTFR. For respective KA party groups, the relative reductions in cumulative emissions 2018–2100 ranges between 84 % and93 % for full compliance with the KA and between 94 % and 99 % for full implementation of MTFR. The lower range values represent party groups with countries that already have legislation implemented to limit the use of HFCs. In non-Article 5 countries (mainly developed countries), national and regional (e.g., EU) regulations have been implemented to limit the use of high-GWP HFCs through limiting imports, production and exports prior to the KA entering into force (Sect. S1).
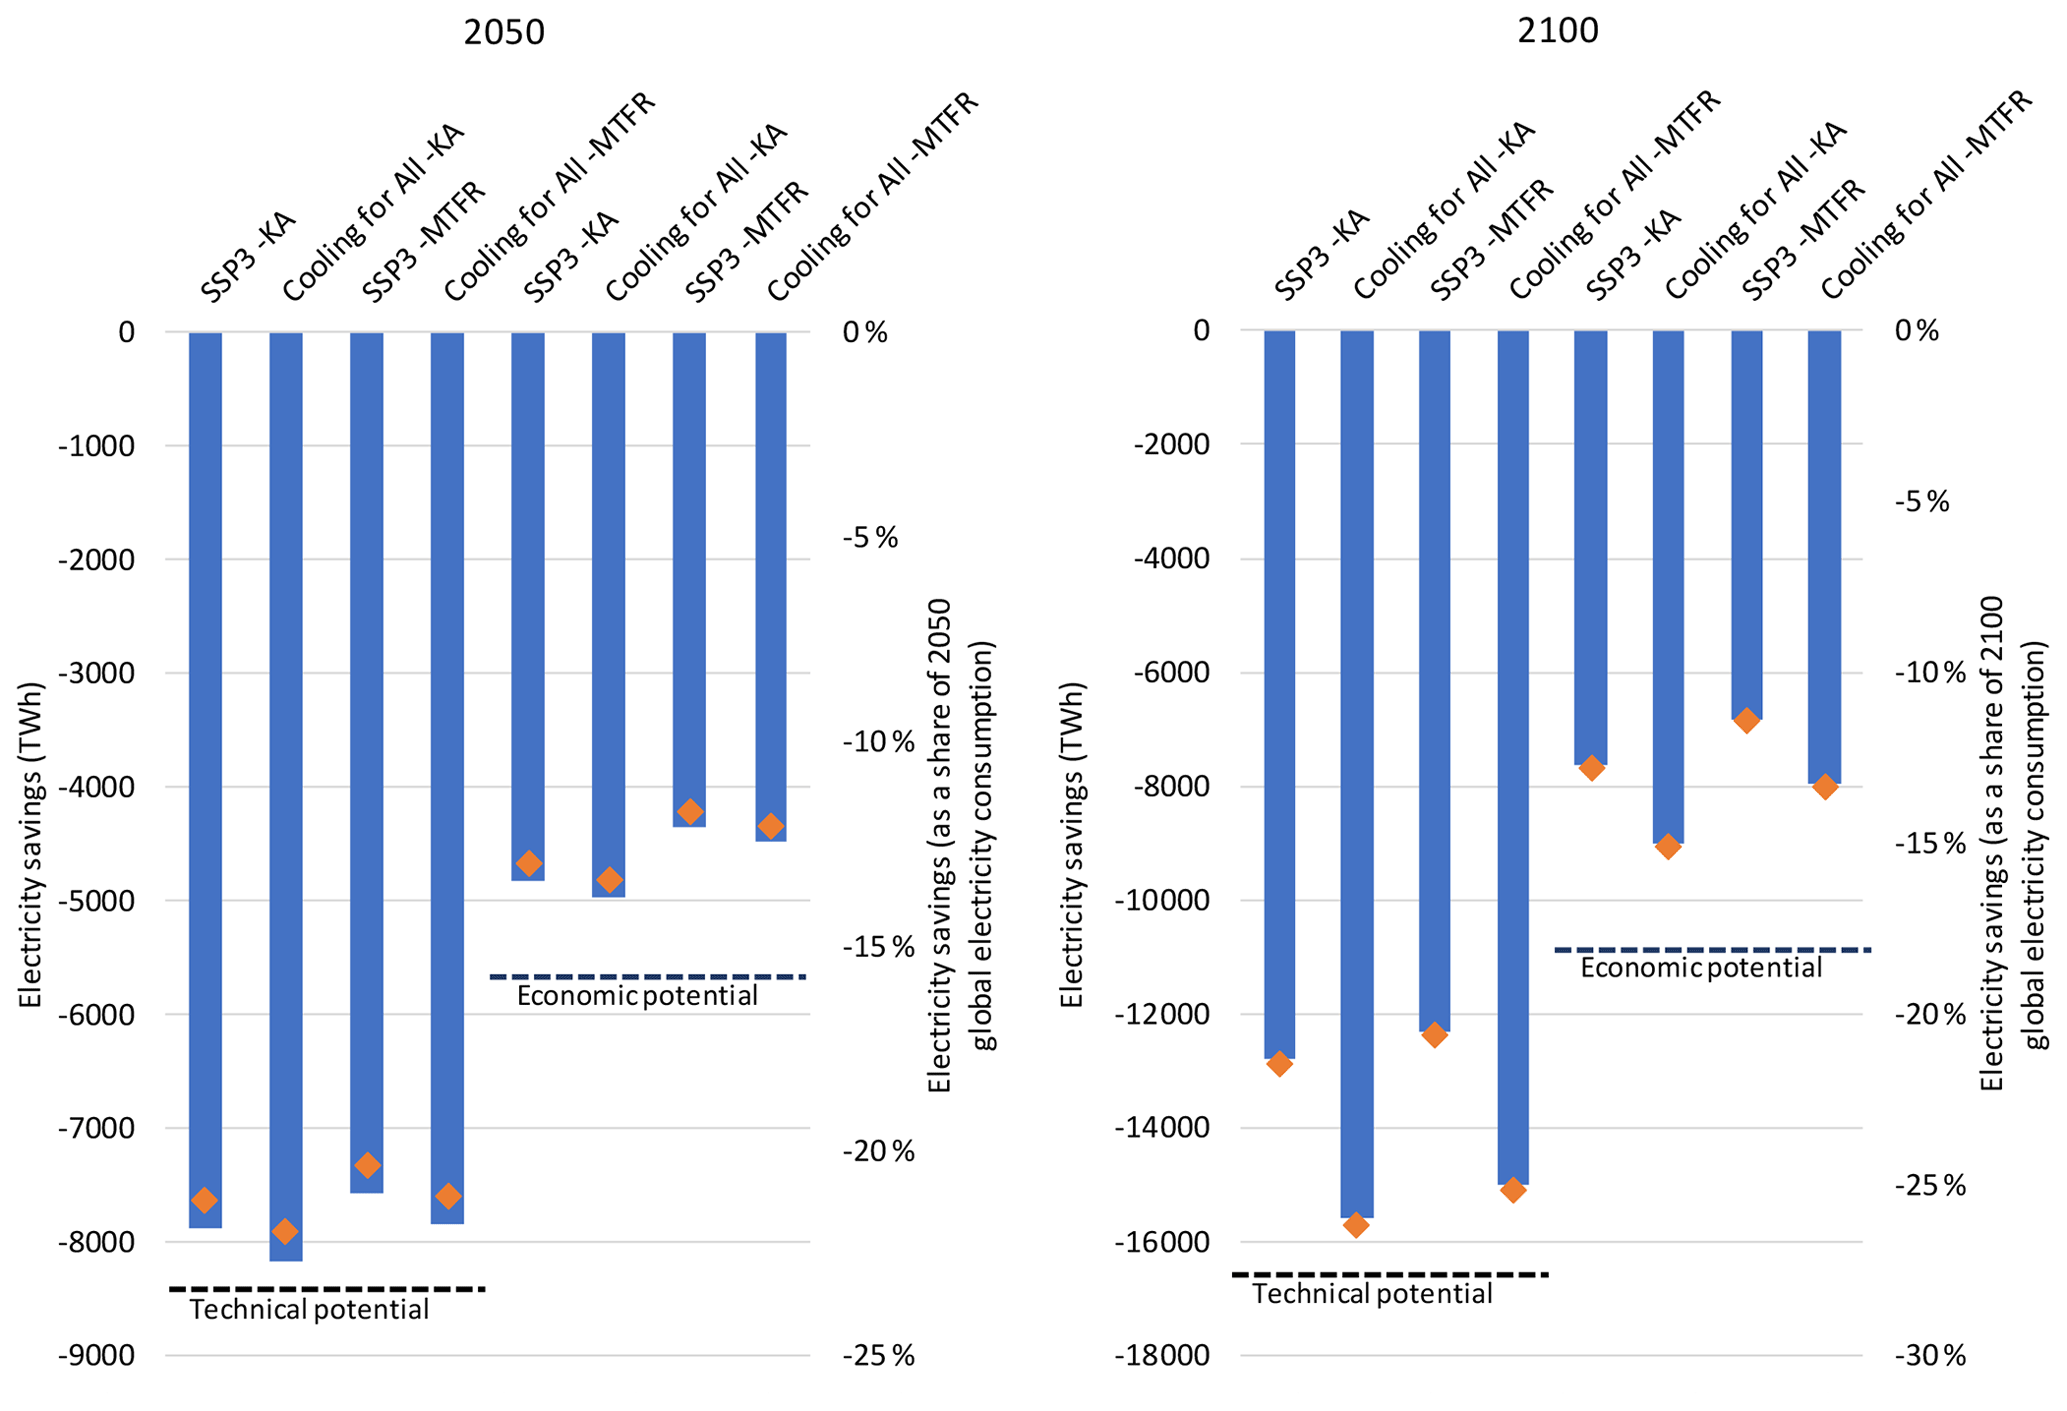
Figure 4Annual electricity-saving potentials when moving from pre-Kigali baselines (SSP3 and Cooling for All) to HFC reduction scenarios (Kigali Amendment – KA and maximum technically feasible reduction – MTFR), in absolute terawatt hours (TW h) (blue bars) and as a fraction of expected future global electricity consumption in the AIM/CGE SSP3 baseline scenario (Riahi et al., 2017) (orange dots).
4.2 Cost curves
Figure 3 shows the estimated marginal abatement cost curves for global HFC emission reductions under technical energy efficiency potentials in 2030, 2050, and 2100, respectively. The curves describe the marginal abatement cost paths between the pre-KA baseline and the MTFR emission levels. The red circles in Fig. 3 indicate the respective points at the cost curves where the KA targets are being met. For Article 5 countries, there are low-cost or even negative-cost (i.e., net profitable)options available to meet the KA targets until 2030 due to large potentials to improve on the energy efficiency in cooling technologies. The more ambitious KA targets for 2050 and 2100 are, however, expected to come at a positive marginal cost and would accordingly require implementation of additional policy incentives. The marginal abatement cost for achieving the KA targets is relatively high for non-Article 5 countries in 2030 due to low-cost options already adopted in response to existing F-gas regulations in many developed countries (Sect. S1). Similarly, Fig. S4 in the Supplement presents the MACCs for global HFC emission reductions under economic energy efficiency potentials in 2030, 2050, and 2100, respectively. The abatement potential extends over time, primarily due to the expected increase in pre-KA baseline emissions but also due to a gradual phase-in of alternative technology in the short run as technical and economic barriers prevent an immediate full uptake of available technology. Net savings on abatement costs are primarily expected from replacing HFCs with NH3 in industrial refrigeration, switching from HFCs to propane (HC-290) in residential air conditioning, substituting HFCs for isobutane (HC-600a) in domestic refrigerators, replacing HFCs with hydrocarbons (HC-290) in vending machines, using pressurized CO2 in remote and integral display cabinets in commercial refrigeration, switching from HFCs to CO2-based systems in transport refrigeration, and switching from high- to low-GWP HFCs (e.g., HFC-152a) or CO2-based systems in foam blowing.
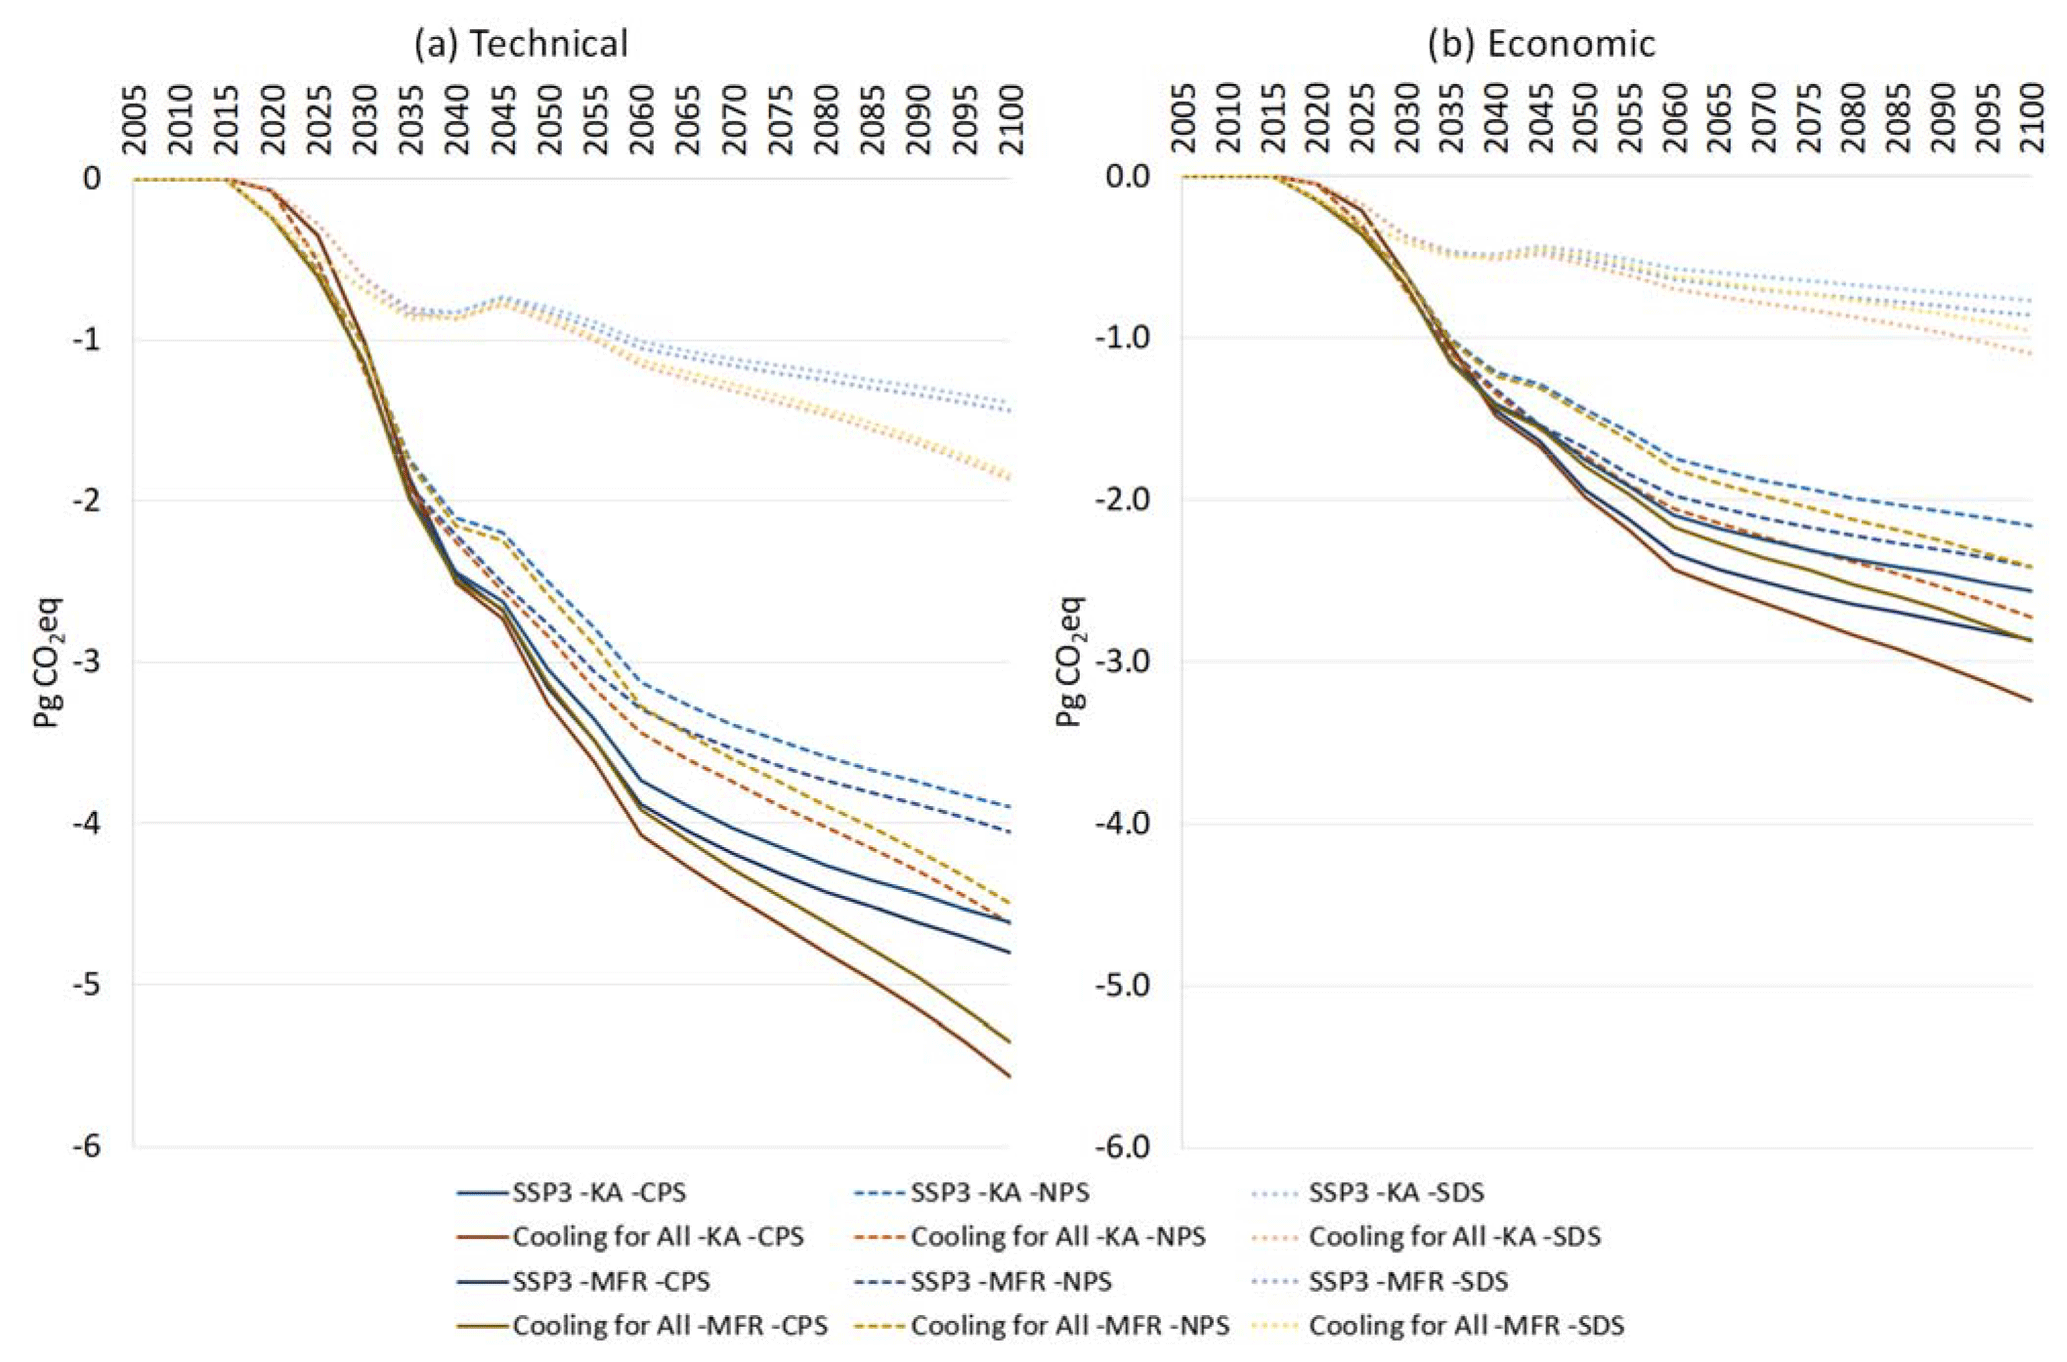
Figure 5Annual greenhouse gas emission reductions from electricity savings in the Kigali Amendment (KA) and maximum technically feasible reduction (MTFR) scenarios relative to the pre-Kigali baseline scenarios (SSP3 and Cooling for All). Results for technical energy efficiency improvements are shown in (a) and for economic energy efficiency improvements in (b).
4.3 Co-benefits due to HFC phase-down with enhanced energy efficiency
4.3.1 Electricity savings
Figure 4 presents the technical and economic electricity-saving (TW h) potentials when moving from the pre-KA baselines (SSP3 and Cooling for All) to corresponding alternative scenarios (KA and MTFR). Globally, the annual technical and economic electricity-saving potentials under the KA are estimated at 7882 and 4821 TW h, respectively, in 2050 relative to the SSP3 baseline scenario. The annual electricity-saving potentials almost double in absolute terms by 2100 as compared to 2050. In the Cooling for All scenario the annual technical electricity-saving potentials are slightly higher than in the SSP3, reaching 8169 TW h in 2050 and 15 595 TW h in 2100. The annual technical and economic electricity-saving potentials in the alternative scenarios (KA and MTFR) by different party groups are illustrated in Fig. S5 and Table S3 in the Supplement. Note that in the MTFR scenarios, the estimated technical potential is slightly smaller than in the KA scenario. The reason is that the KA scenario is constructed assuming uptake of technologies (to meet the KA reduction targets) in the order of increasing marginal cost for HFC replacement. Options at the very high end of the marginal abatement cost curve (e.g., pressurized CO2) not only have slightly lower warming potentials than hydrocarbons, but also use more electricity (Groll and Kim, 2007; Astrain et al., 2019). It is accordingly an effect of technology switches at the very high end of the marginal abatement cost curve, e.g., hydrocarbons and HFOs replaced by pressurized CO2.
For illustrative purposes, Fig. 4 also displays a comparison of future annual electricity savings to the total global consumption of electricity as estimated for years 2050 and 2100 in the AIM/CGE SSP3 baseline scenario (Riahi et al., 2017). As shown, if the full technical potential to improve energy efficiency in cooling is implemented as part of efforts to comply with the KA targets, the electricity savings would make up 26 % and 22 % of expected global electricity consumption in 2050 and 2100, respectively. If only the economic potential to improve energy efficiency in cooling is implemented, the corresponding savings would make up 15 % and 13 % of expected global electricity consumption in 2050 and 2100, respectively. Hence, the future electricity-saving potentials in the cooling sector are significant.

Figure 6Greenhouse gas emission mitigation (in Pg CO2 eq) due to enhanced energy efficiency benefits under Kigali amendment (KA) in the alternative scenarios with respect to the (a) SSP3 baseline scenario and (b) Cooling for All baseline scenario. In 2050 and 2100 differences between KA and maximum technically feasible reduction (MTFR) scenarios are negligible.
4.3.2 Impacts on greenhouse gas emissions
Figure 4 shows how electricity savings convert into approximate reductions in GHG (CO2 and CH4) emissions from electricity generation in the respective IEA-WEO 2017 energy scenarios CPS, NPS, and SDS (see also Fig. S2). Figure 5 presents GHG emission reductions in the alternative (KA and MTFR) scenarios due to electricity savings induced by HFC phase-down and under full implementation of technical (Fig. 5a) and economic (Fig. 5b) energy efficiency improvements, respectively, as well as for a range of implied emission factors deriving from the CPS, NPS, and SDS energy scenarios. CH4 reductions have here been converted into equivalent CO2 (CO2 eq) units and added to reductions in CO2 emissions. The corresponding GHG emission reductions using technical and economic electricity-saving potentials by different KA party groups are presented in Figs. S6 and S7 in the Supplement. Relative to a pre-KA SSP3 baseline scenario and using GAINS implied emission factors derived for the CPS energy scenario, compliance with the KA and realization of the full technical energy efficiency improvement potentials convert into annual greenhouse gas emission reductions from electricity savings of 3 Pg CO2 eq in 2050 and 5.5 Pg CO2 eq in 2100. Out of these, annual reductions in CO2 emissions from reduced fuel use are estimated at 1.4 Pg CO2 in 2050 and 4.4 Pg CO2 in 2100, while the corresponding reductions in annual global CH4 emissions from extraction, storage, and distribution of fossil fuels are estimated at 9 and 15 Tg CH4 in 2050 and 2100, respectively. This corresponds to about 2 % of expected business-as-usual CH4 emissions from global anthropogenic sources in 2050 (Höglund-Isaksson et al., 2020). Greenhouse gas savings when realizing the full economic potential for electricity savings are estimated at about half of the reductions from realizing the full technical potential. As expected, the corresponding annual CO2 mitigation relative to the Cooling for All baseline is slightly larger at 1.5 Pg CO2 eq in 2050 and 5.1 Pg CO2 eq in 2100. The estimated reductions in CO2 and CH4 emissions from electricity savings are lower when using implied emission factors derived for the IEA-WEO17 NPS and SDS energy sector scenarios than for the CPS, because of higher penetration of clean fuels (gas, renewables, etc.) and uptake of energy efficiency measures in the power sector.
Table 5Cumulative reductions in greenhouse gas emissions 2018–2100 due to electricity savings induced by HFC phase-down when assuming technical and economic energy efficiency improvement potentials, by Kigali Amendment party groups.
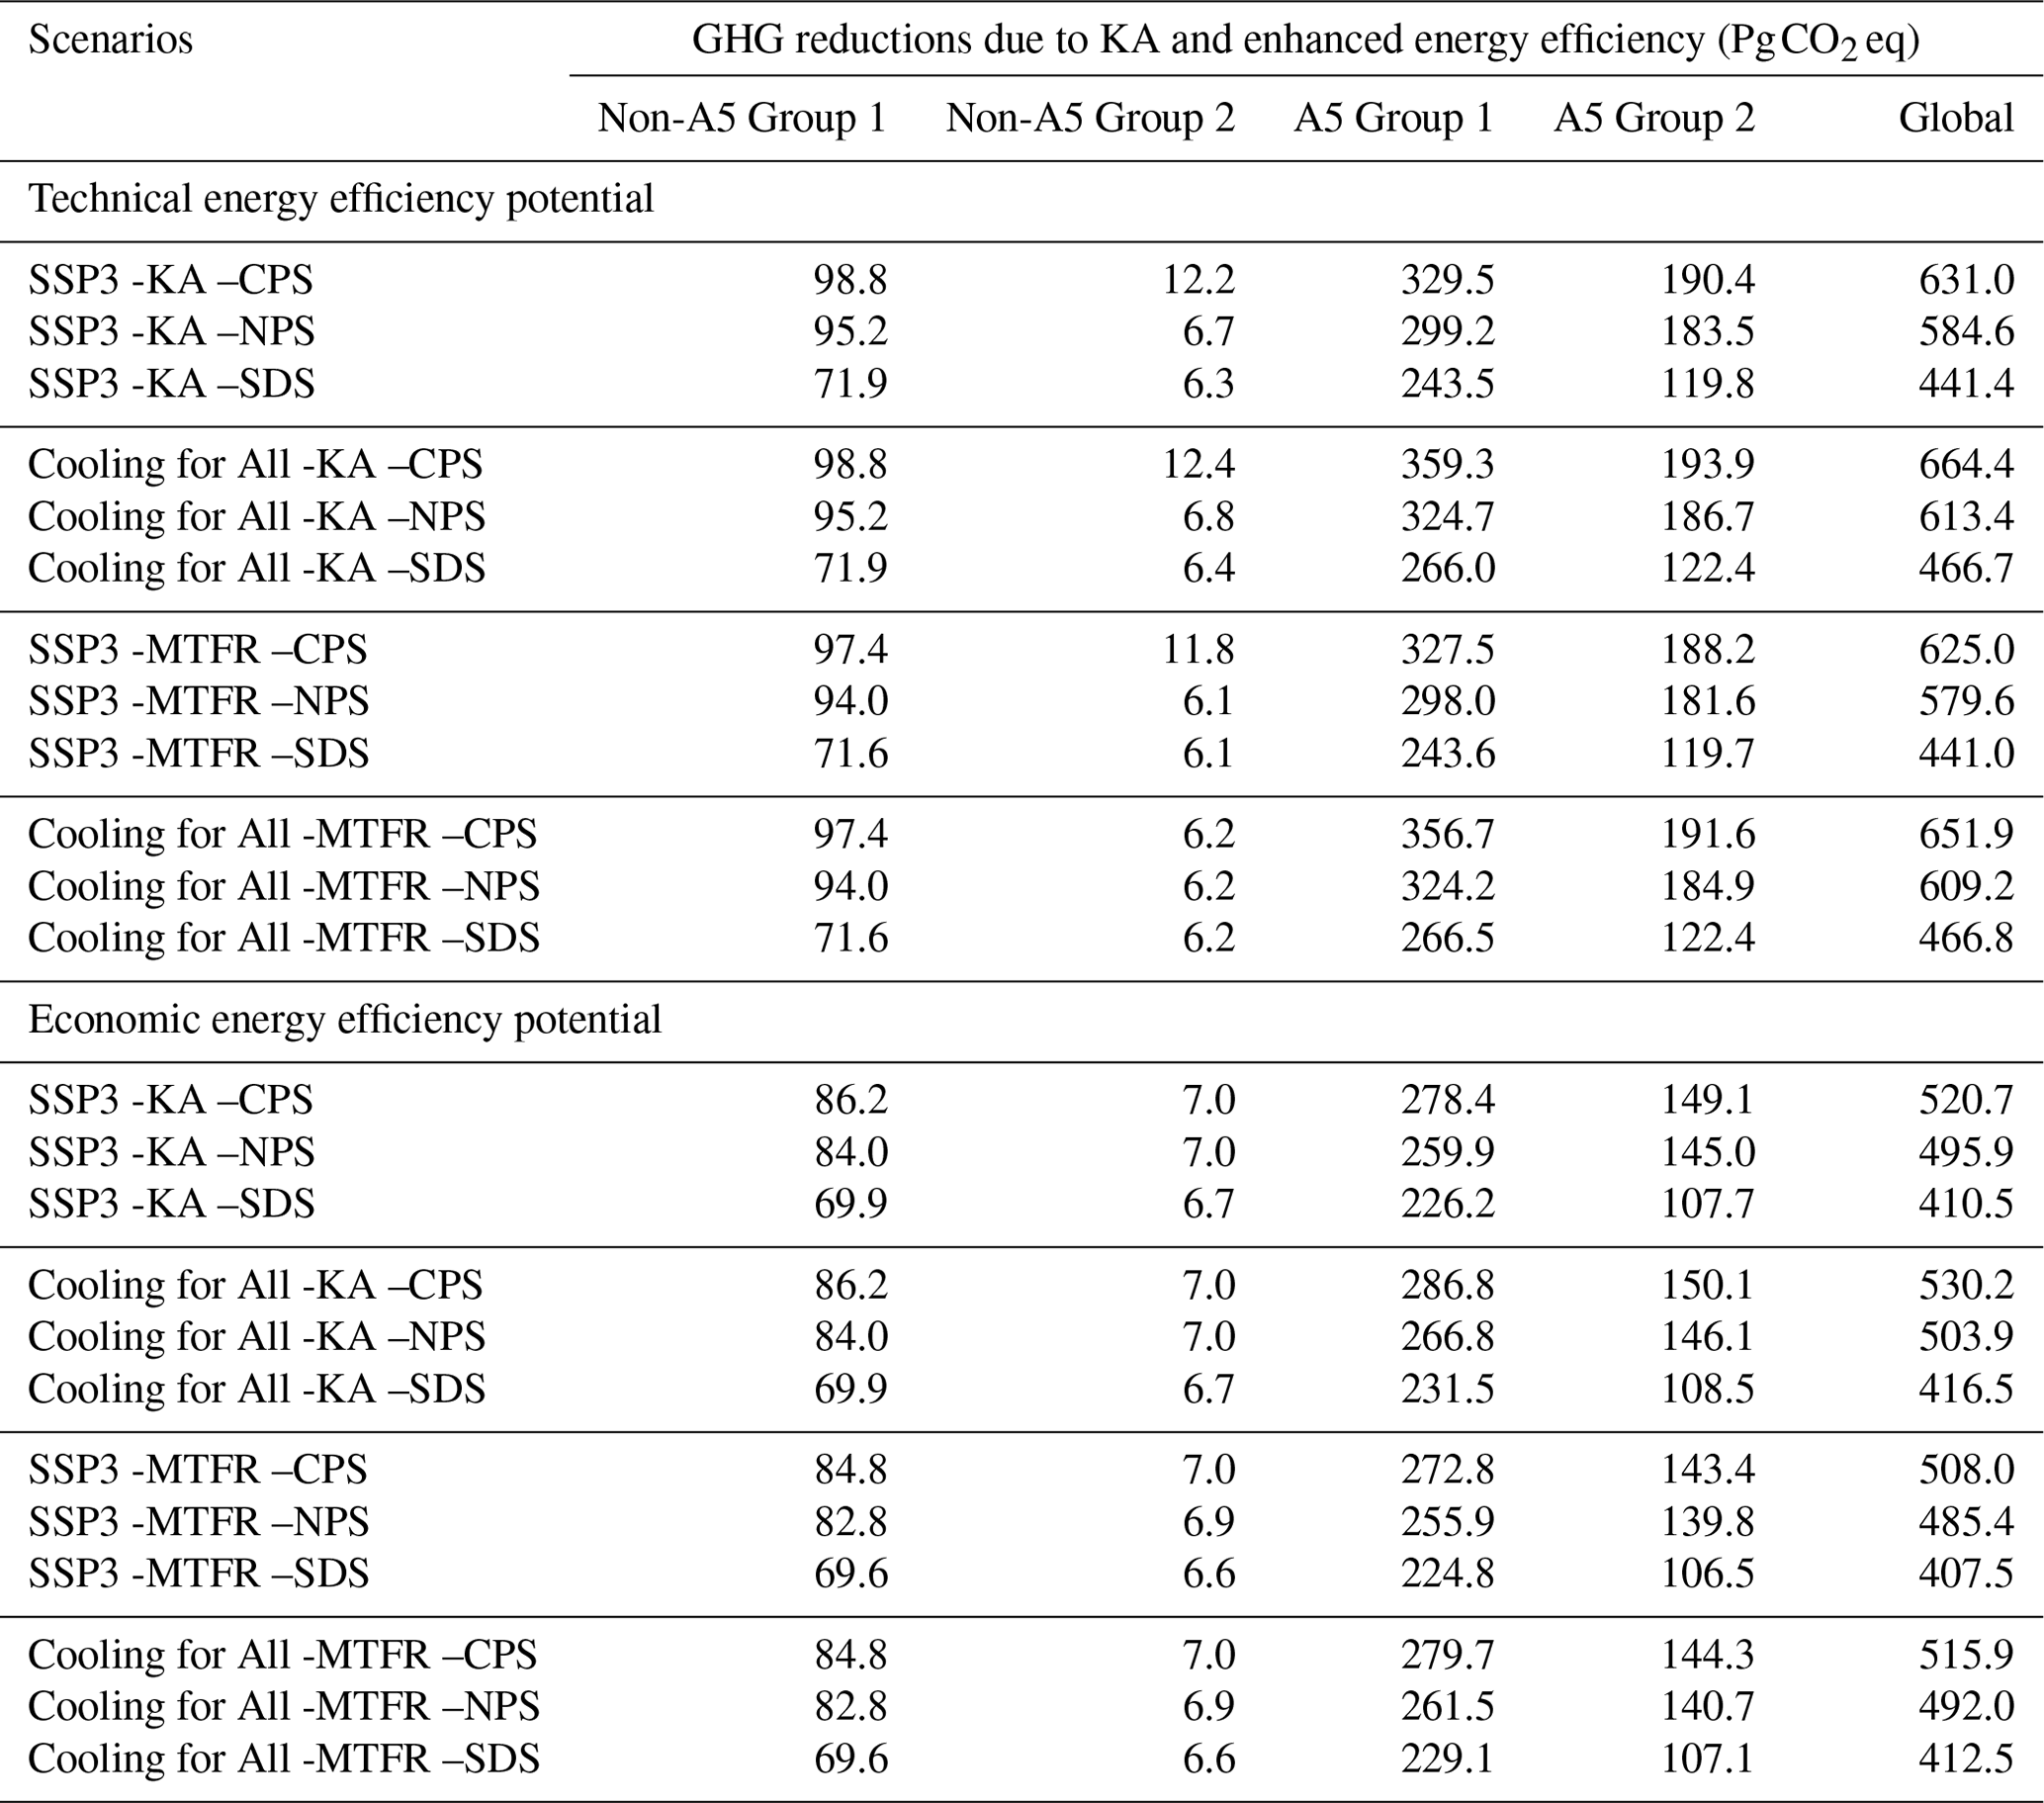
We can also convert the reduction in HFC emissions into CO2 eq terms and add these to the GHG reductions from electricity savings, which gives us an estimate of total reductions in greenhouse gas emissions due to a phase-down of HFCs. These are shown in Fig. 6 with GHG reductions relative to a pre-KA SSP3 baseline shown in Fig. 6a and relative to a pre-KA Cooling for All baseline shown in Fig. 6b. Results are presented for all the variants of future energy sector development pathways considered (i.e., CPS, NPS, and SDS). Compared to a pre-KA baseline, meeting the KA means total annual GHG emissions are lower by between 4.8 and 7.3 Pg CO2 eq in the year 2050 and between 7.3 and 12.1 Pg CO2 eq in 2100. Table 5 presents the cumulative reductions in overall GHG emissions due to both HFC phase-down and the associated electricity savings. Results are presented by KA party groups and globally for technical and economic energy efficiency improvements. Hence, compliance with the KA targets and full implementation of energy efficiency improvements mean avoiding between 411 and 631 Pg CO2 eq of greenhouse gas emissions between 2018 and 2100. About 58 % of this cumulative reduction can be attributed to the substitution of HFCs with other low-GWP alternatives, while about 42 % can be attributed to electricity savings that derive from the realization of the technical potential to improve energy efficiency.
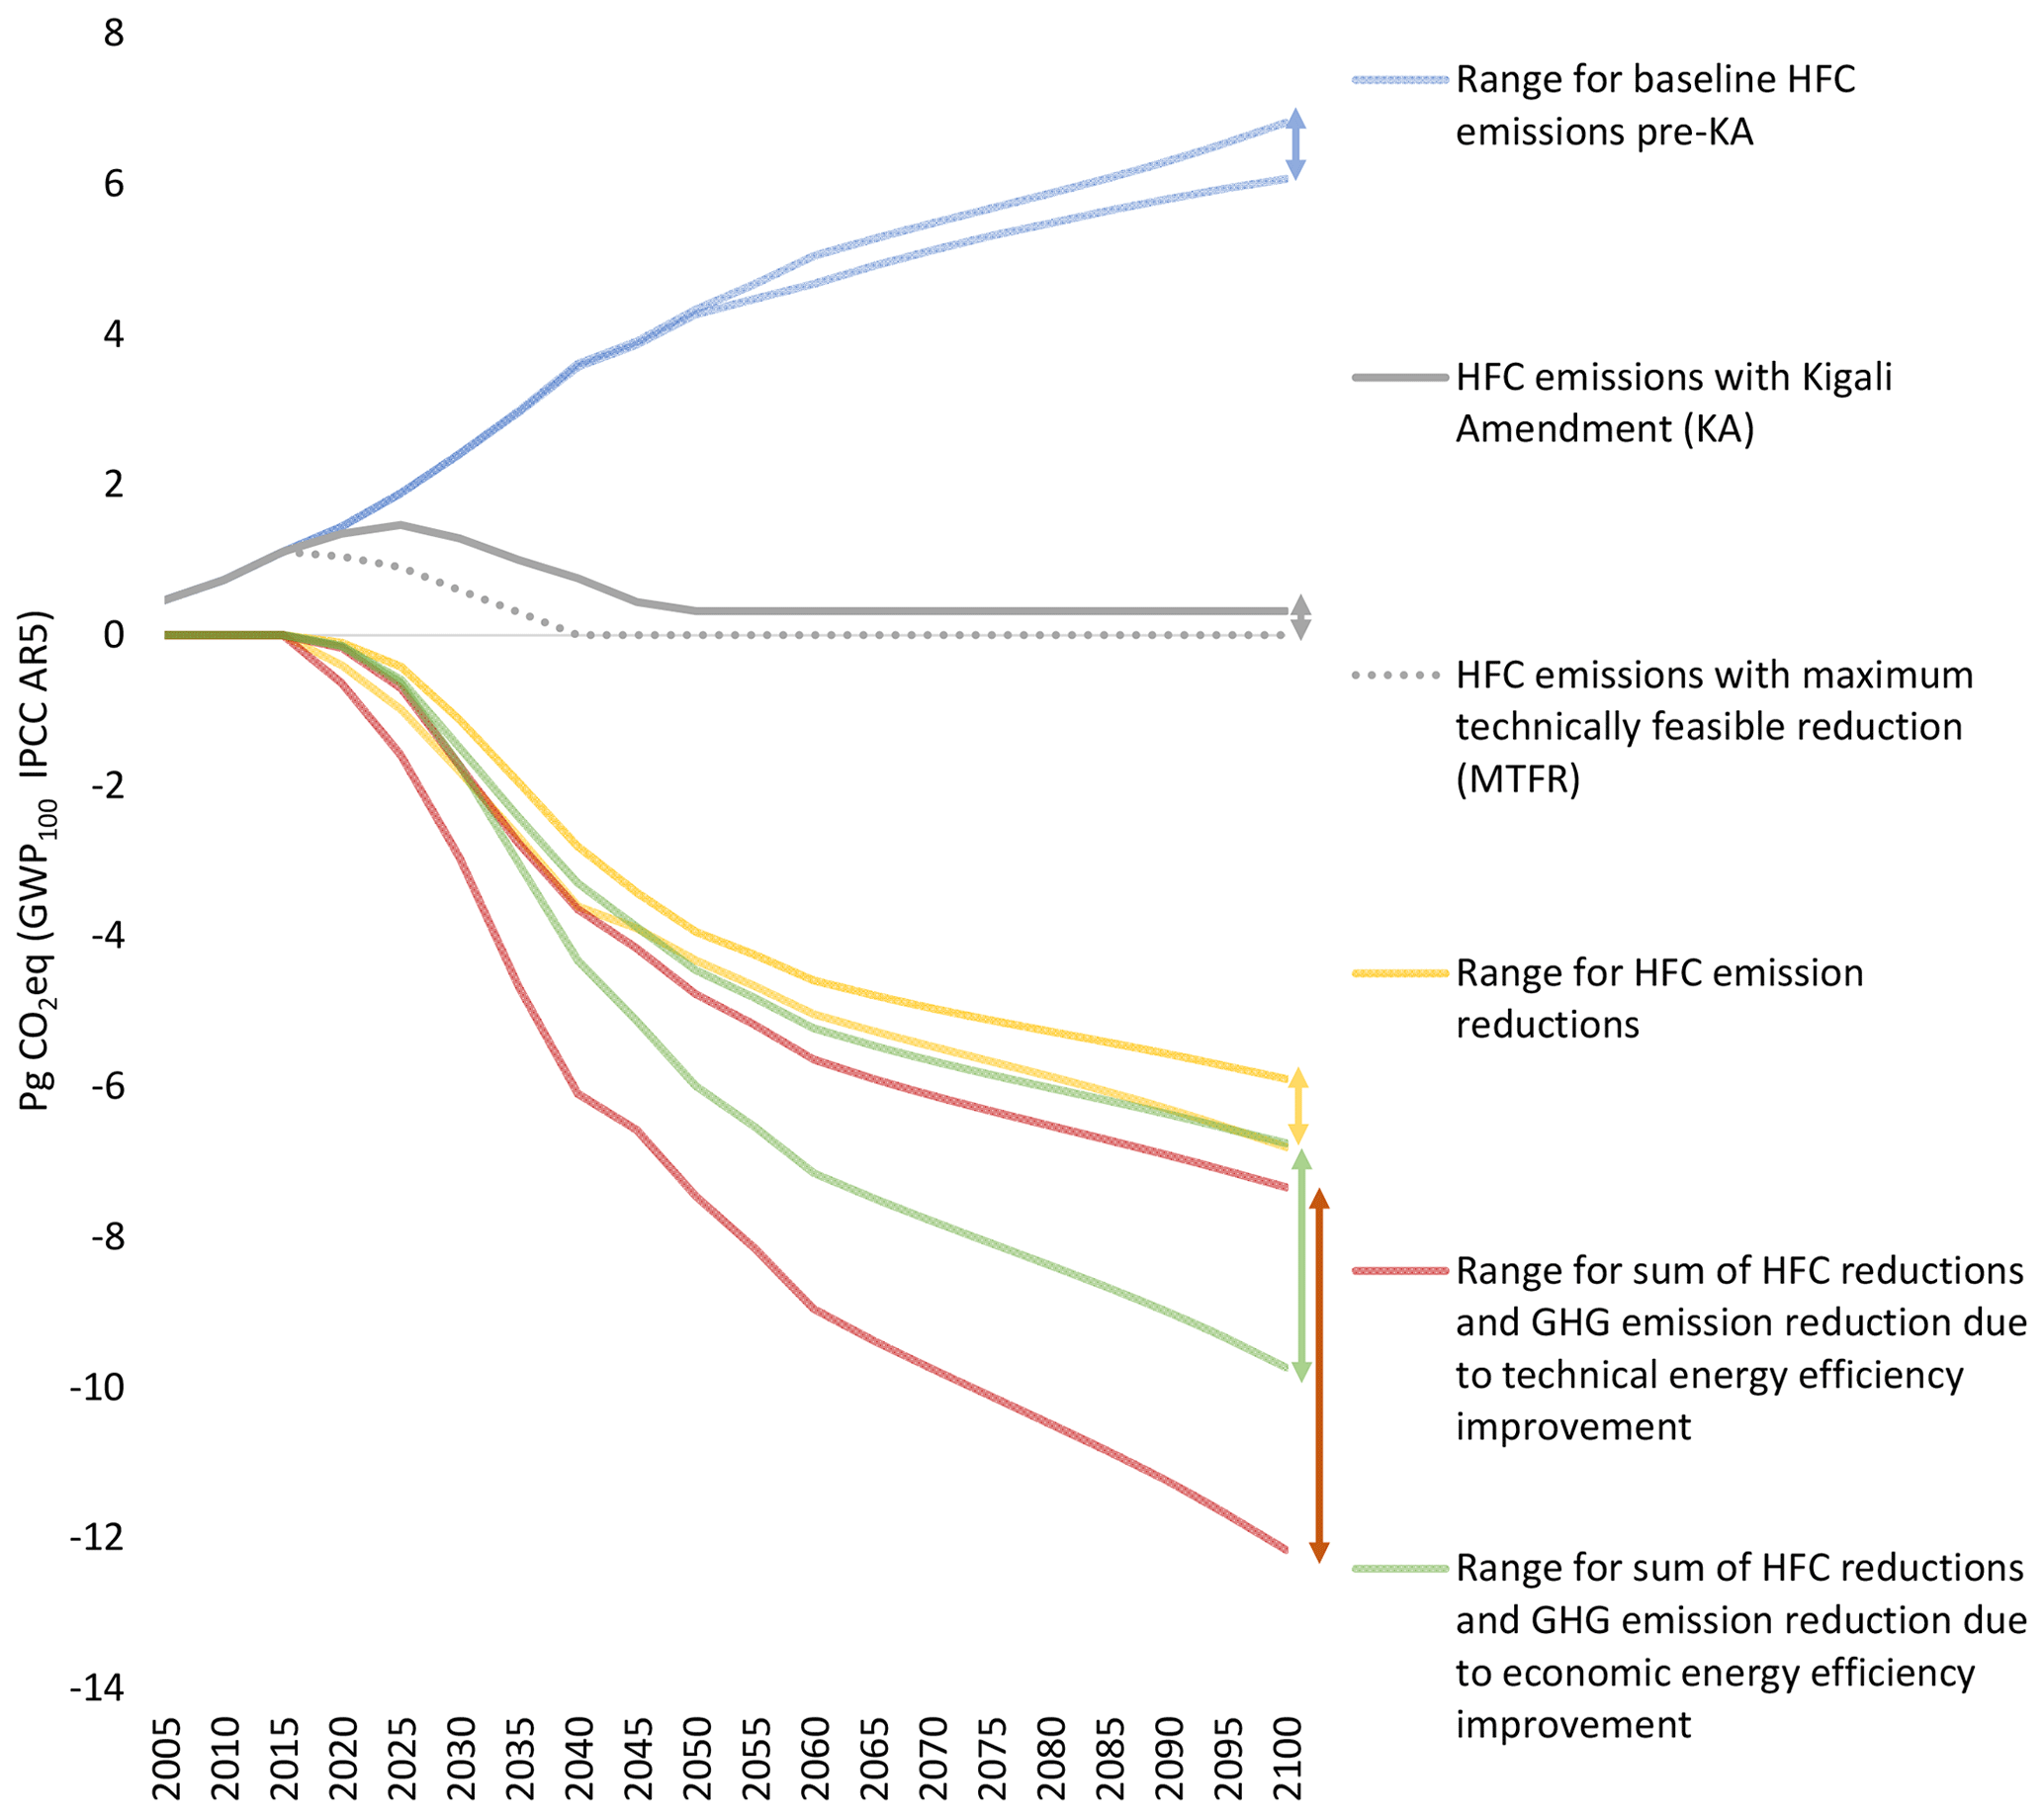
Figure 7Full range of HFC emissions and mitigation potential under baselines and Kigali Amendment (KA) and maximum technically feasible reduction (MTFR) scenarios along with HFC and other greenhouse gas mitigation under technical and economic energy efficiency improvement scenarios analyzed in this study.
Figure 7 summarizes impacts on GHG emissions and presents in the upper half the full range of HFC emissions under the three baselines (SSP1, SSP3, and Cooling for All) and the alternative KA and MTFR scenarios. In the lower half, Fig. 7 shows the full ranges of HFC mitigation potentials under the alternative KA and MTFR scenarios along with the ranges for the sum of reduction potentials in HFC and other greenhouse gases (CO2 and CH4 from electricity savings) induced by a HFC phase-down. The full ranges reflect implementation of technical and economic energy efficiency improvements, respectively, for the ranges of implied emission factors consistent with the CPS, NPS, and SDS energy scenarios when meeting the KA targets or under MTFR.
4.3.3 Impacts on air pollution
Other potentially important environmental benefits of reduced demand for electricity in cooling are reduced air pollution and related adverse effects on human health and ecosystems. Figure 8 presents reductions in air pollutant emissions due to electricity savings associated with the alternative (KA and MTFR) scenarios. The upper set of graphs (Fig. 8a–c) show emission reductions when technical energy efficiency improvement potentials are fully implemented, while the bottom set of graphs (Fig. 8d–f) show the corresponding impacts when economic energy efficiency improvement potentials are fully implemented. In 2015, space cooling was responsible for 9 % of global emissions of SO2 emissions from the power sector and 8 % of NOx and PM2.5 emissions from the power sector (IEA, 2018). Our results indicate that meeting the KA targets means global SO2 emissions in the power sector are reduced by 10 % and 12 % relative to the SSP3 and Cooling for All baselines, respectively, and when assuming implied emission factors from the CPS energy scenario (Fig. 8a). For the same set of assumptions, annual global NOx emissions in the power sector are expected to be 16 % lower than baseline emissions in 2050 (Fig. 8b), while global PM2.5 emissions from the power sector are 8 % and 9 % lower than in the SSP3 and Cooling for All baselines, respectively (Fig. 8c). Due to a higher penetration of clean fuels in the power sector, reductions in all air pollutant emissions are more limited in the NPS and SDS energy scenarios.
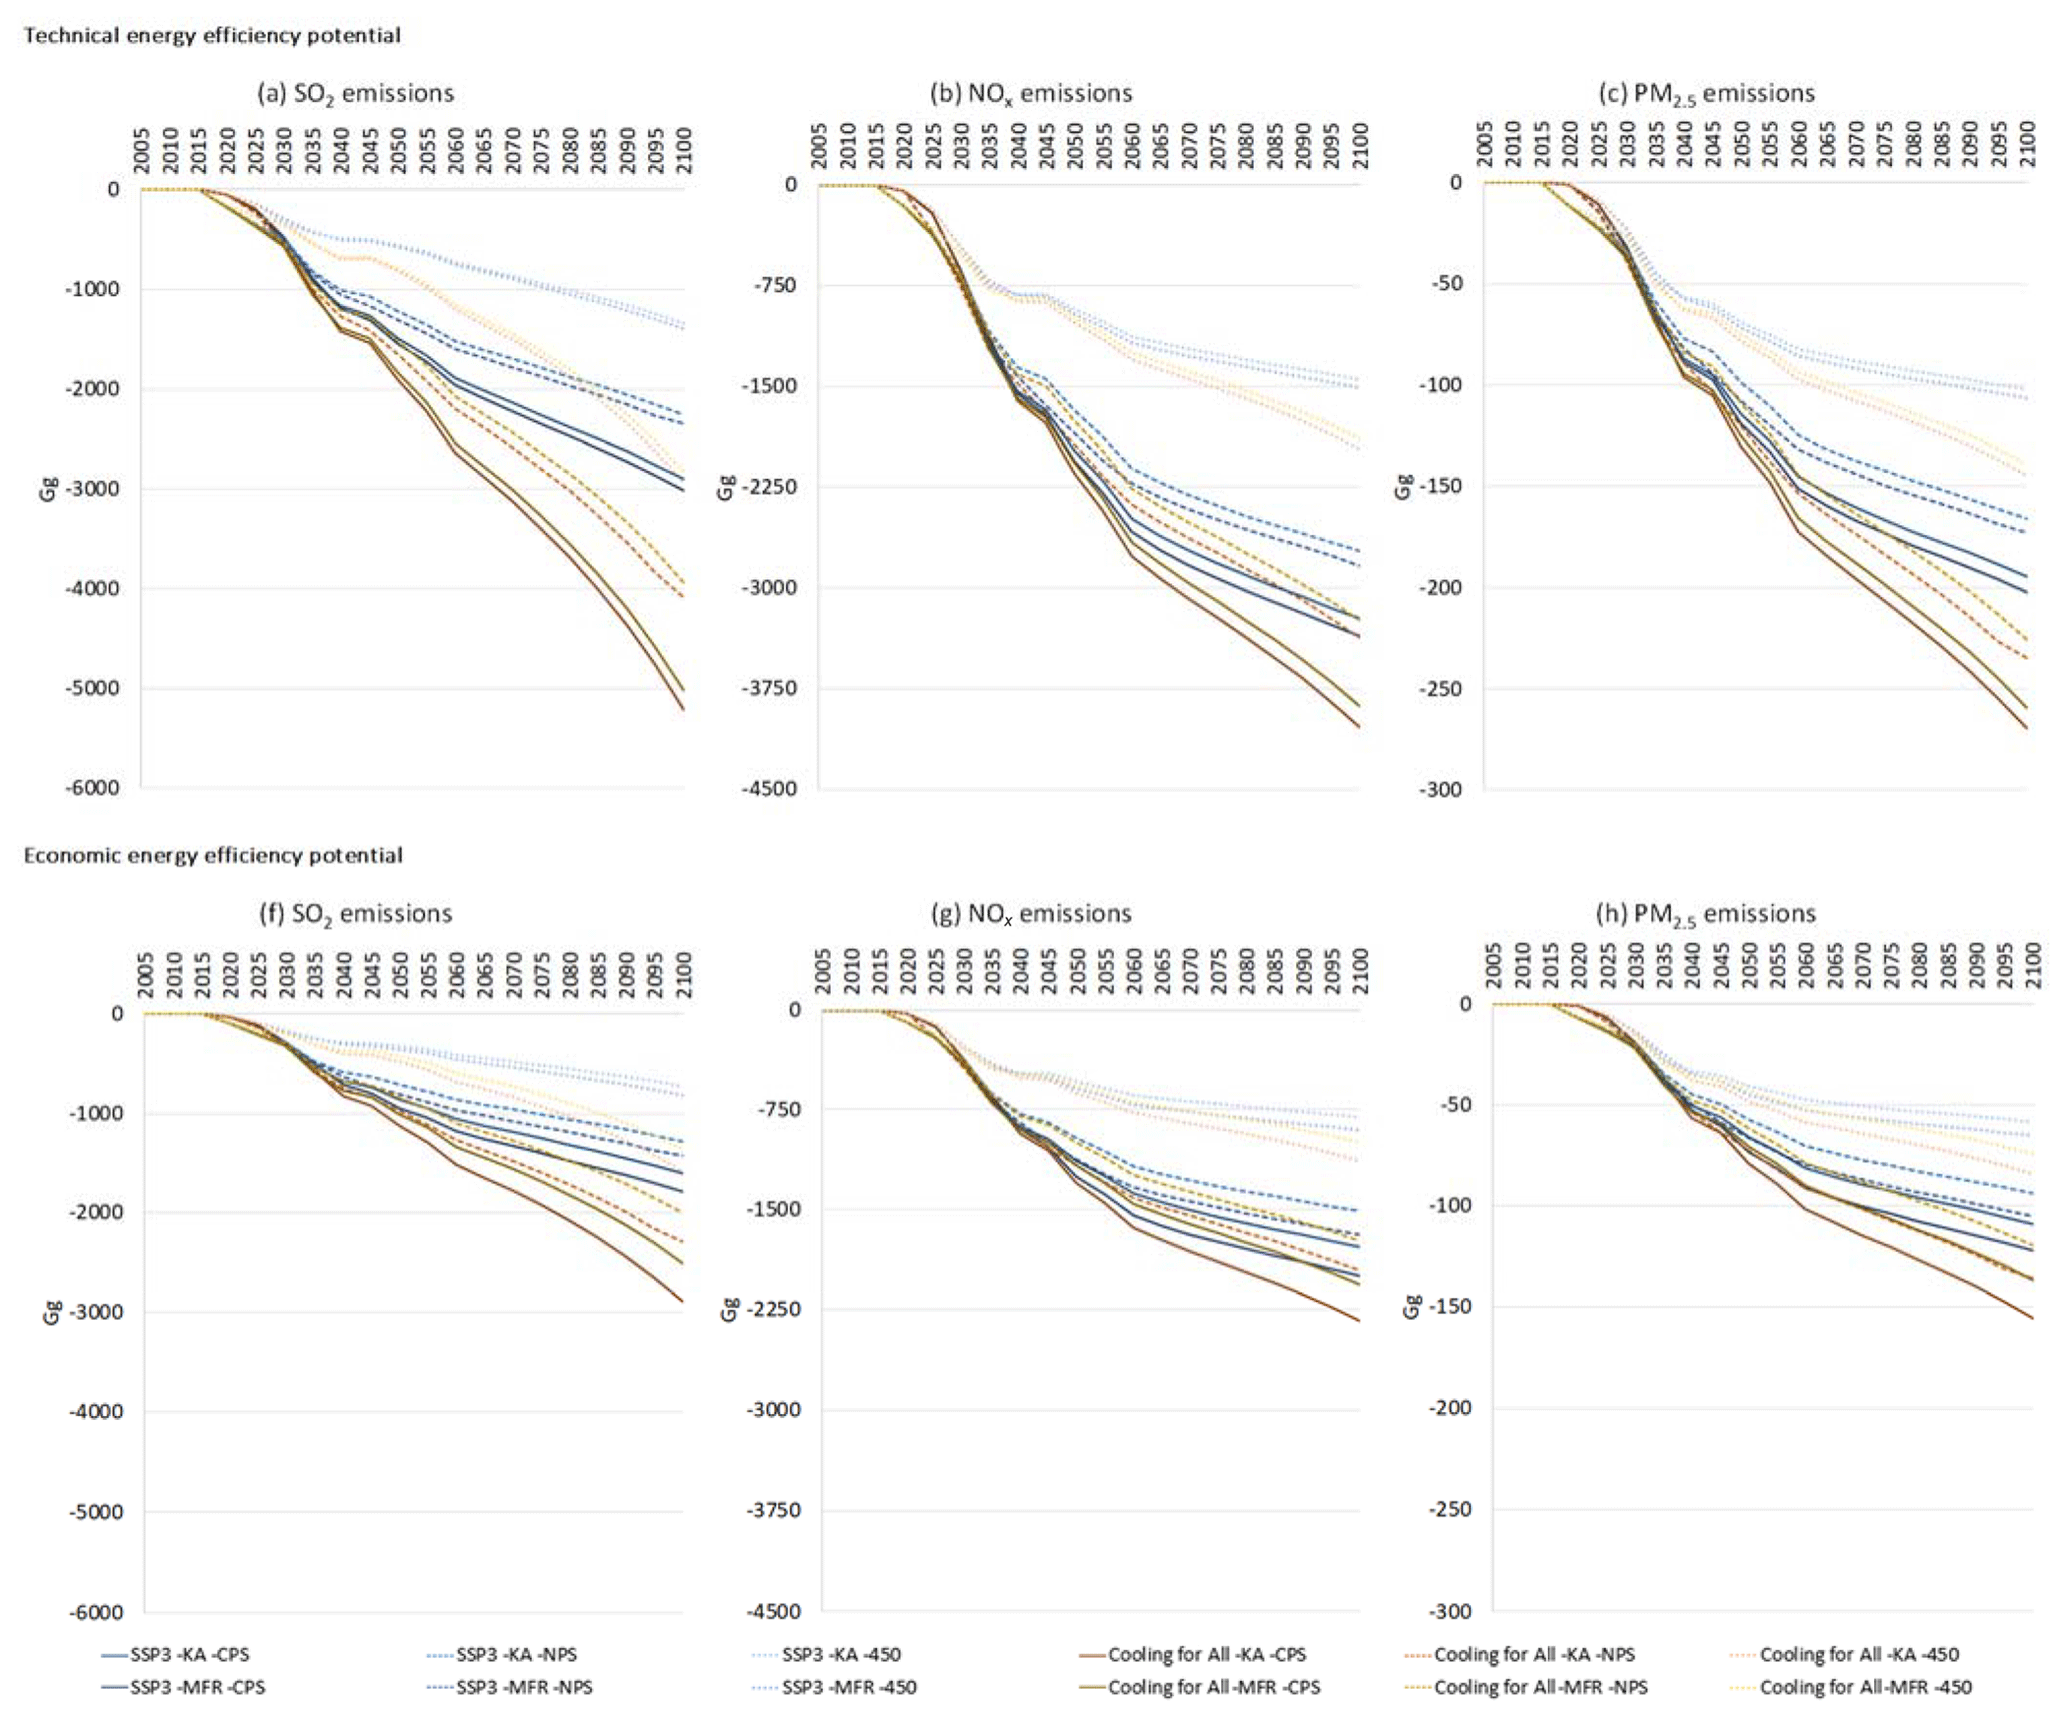
Figure 8Impacts on air pollutant emissions due to electricity savings associated with alternative HFC phase-down pathways.
Considering the limited contribution of the power sector to total global emissions of these air pollutants, the overall impact on global air pollutant emissions is relatively small at less than 4 % according to information on total global emissions in 2050 taken from the GAINS model (IIASA-GAINS, 2019) for the same energy scenario. This small impact makes it difficult to quantify any potential health and ecosystems impacts in a meaningful way. Because BC andOC emissions are not well mixed in the atmosphere and therefore do not easily convert into CO2 eq units despite being a SLCP, we present results for BC and OC impacts in Fig. S8 in the Supplement instead of together with the impacts on GHGs in Fig. 6. The results indicate that meeting the KA targets means global BC emissions from the power sector are 4 % lower in 2030 and 6 % lower in 2050 relative to the baseline scenarios (Fig. S8a). Similarly, global OC emissions from power plants are 13 % lower in 2050 relative to the baseline scenarios (Fig. S8b). Considering that the power plant sector accounts for less than 0.5 % of global BC and OC emissions from all sources (IIASA-GAINS, 2019), the global impact on these emissions from a HFC phase-down range is negligible at 0.03 % and 0.065 %, respectively.
Hydrofluorocarbons (HFCs) are manufactured to be used as substitutes for ozone-depleting substances that are being phased out globally under Montreal Protocol regulations. HFCs are strong greenhouse gases, with a global warming effect up to 12 400 times greater than carbon dioxide, and their emissions are rising strongly. The Kigali Amendment (KA) to the Montreal Protocol from 2016 sets out phase-down pathways to 2050 for the worldwide use of HFCs. Users are encouraged to transition to alternative agents with low global warming potentials. Enhancement of energy efficiency as part of such a transition is a strategic, near-term opportunity to reap significant additional climate and clean air benefits. This study presents long-term scenarios of HFC emissions to the year 2100 under varying degrees of stringency in climate policy and assesses potential co-benefits in the form of electricity savings and associated reductions in greenhouse gas and air pollutant emissions through improved energy efficiency in stationary cooling. The following inferences can be drawn from this study:
-
Prior to the commitments made under the KA, baseline annual emissions of HFCs are expected to increase from about 0.5 to 4.3 Pg CO2 eq between 2005 and 2050, reaching between 6.2 and 6.8 CO2 eq in 2100, depending on whether or not all households in hot climatic conditions install residential air conditioning. The growth is mainly driven by an 18-fold increase in demand for refrigeration and air-conditioning services, which in turn is driven by an expected increase in per capita wealth in developing countries, a warmer future climate, combined with the effect of replacing chlorofluorocarbons (CFCs) and hydrochlorofluorocarbons (HCFCs) with HFCs in accordance with the 2007 revision of the Montreal Protocol. Cumulative HFC emissions over the period 2018 to 2100 are estimated at 363 and 378 Pg CO2 eq in respective baseline scenarios. This is a considerable share of the entire future budget of less than 800 Pg CO2 eq that IPCC (2018) estimates as available for the world to remain well below 2 ∘C warming above the preindustrial level.
-
Full compliance with the commitments made by parties to the KA through replacement of HFCs with low-GWP alternatives (e.g., hydrocarbons, hydrofluoroolefins, ammonia, water, and CO2) means cumulative HFC emissions of less than 50 Pg CO2 eq between 2018 and 2100. With maximum technically feasible implementation of existing control technology and without the delays in implementation built into the KA, cumulative HFC emissions could be as low as 13 Pg CO2 eq between 2018 and 2100, thereby removing about 97 % of cumulative pre-KA baseline emissions.
-
If carefully addressed during the transition to low-GWP alternatives, improvement potentials for energy efficiency in cooling technologies are extensive and can bring significant electricity savings. When fully implementing the technical potential for energy efficiency improvements, we estimate that compliance with the KA can bring electricity savings that correspond to more than 20 % of the world's entire future electricity consumption. With the energy efficiency improvements limited to the economically profitable applications, electricity savings in cooling could still make up as much as 15 % of future electricity consumption.
-
Compliance with the KA means avoiding between 441 and 631 Pg CO2 eq of greenhouse gas emissions between 2018 and 2100. About 58 % of this cumulative reduction can be attributed to the substitution of HFCs with other low-GWP alternatives, while about 42 % can be attributed to electricity savings that derive from the realization of the technical potential to improve energy efficiency in cooling equipment. Hence, significant additional reductions in global warming can be achieved if policymakers, manufacturers, industry, and other stakeholders (consumers, utilities, etc.) address energy efficiency improvements in cooling technology simultaneously with requirements for HFCs substitution.
-
Electricity savings also mean reduced air pollutant emissions from the power sector with associated positive effects on human health and ecosystems. We estimate that meeting the KA targets while also implementing the full technical potential for energy efficiency improvements in cooling technologies can lower future global sulfur dioxide (SO2) emissions from the power sector by up to 10 %–12 %. Corresponding future impacts on emissions of nitrogen oxides (NOx) from power plants are 16 % lower relative to the baselines and 8 %–9 % lower for fine particulate matter (PM2.5) emissions. It may be noted that the higher range follows the assumption that the current technologies are used to generate electricity under the current policies scenario, whereas the lower range reflects transition towards sustainable energy under the sustainable development scenario. Considering that the power sector accounts for a smaller share of global emissions of SO2, NOx, and PM2.5, the overall impact of electricity savings in cooling on global air pollutant emissions is less than 4 %. The impact on global black carbon (BC) and organic carbon (OC) emissions is negligible.
A key policy finding is the importance of paying careful attention to the electricity savings that can be reaped in the transition away from HFCs in stationary cooling appliances, as the associated greenhouse gas emission reductions are significant.
The authors confirm that the data supporting the findings of this study are available within the article and its Supplement. An additional supplementary file in Excel format provides co-benefits of global HFC phase-down in technical and economic energy efficiency scenarios. Further details are available on request: please contact purohit@iiasa.ac.at.
The supplement related to this article is available online at: https://doi.org/10.5194/acp-20-11305-2020-supplement.
PP and LH-I conceived and designed the analysis. JD provided input data on regional development of cooling degree days and contributed to analysis design; NS and MW provided input information on technology efficiency improvement potentials; PR worked on the implementation of IEA-WEO energy data scenarios in GAINS, and WS derived implied regional air pollution emission factors from information in GAINS. PP and LH-I performed the analysis, and PP drafted the manuscript. All authors provided critical feedback and helped shape the research, analysis, and manuscript.
The authors declare that they have no conflict of interest.
The authors would like to thank the anonymous reviewers for their helpful and constructive comments that greatly contributed to improving the final version of the paper. Financial support from the ClimateWorks Foundation (grant number #IIA-18-1452) is gratefully acknowledged. The authors would like to thank Gabrielle Dreyfus from the Institute for Governance & Sustainable Development (IGSD) and Jyoti Prasad Painuly from UNEP/DTU Partnership for their helpful and constructive comments on an initial version of the paper. We would also like to thank Adriana Gomez-Sanabria for research assistance when deriving implied emission factors for electricity consumption from the GAINS model.
This research has been supported by the ClimateWorks Foundation (grant no. #IIA-18-1452).
This paper was edited by Frank Dentener and reviewed by Guus Velders and one anonymous referee.
Abdelaziz, O., Shrestha, S., Shen, B., Elatar, A., Linkous, R., Goetzler, W., Guernsey, M., and Bargach, Y.: Alternative Refrigerant Evaluation for High-Ambient-Temperature Environments: R-22 and R-410A – Alternatives for Rooftop Air Conditioners, ORNL/TM-2016/513, Oak Ridge National Laboratory (ORNL), Oak Ridge, USA, 2016.
Abel, D., Holloway, T., Kladar, R. M., Meier, P., Ahl, D., Harkey, M., and Patz, J.: Response of Power Plant Emissions to Ambient Temperature in the Eastern United States, Environ. Sci. Technol., 51, 5838–5846, https://doi.org/10.1002/grl.50967, 2017.
Amann, M., Kiesewetter, G., Schoepp, W., Klimont, Z., Winiwarter,W., Cofala, J., Rafaj, P., Hoglund-Isaksson, L., Gomez-Sabriana, A., Heyes, C., Purohit, P., Borken-Kleefeld, J., Wagner, F., Sander, R., Fagerli, H., Nyiri, A., Cozzi, L., and Pavarini, C.: Reducing global air pollution: The scope for further policy interventions, Philos. T. Roy. Soc. A., 378, 27 pp., https://doi.org/10.1098/rsta.2019.0331, 2020.
Anderson, S. O., Bandarra, E., Bhushan, C, Borgford-Parnell, N., Chen, Z., Christensen, J., Devotta, S., Lal Dhasan, M., Dreyfus, G. B., Dulac, J., Elassaad, B., Fahey, D. W., Gallagher, G., Gonzalez, M., Höglund Isaksson, L., Hu, J., Jiang, Y., Lane, K., Mangotra, K., Masson, N., de Oña, A., Oppelt, D., Peters, T., McMahon, J., Picolotti, R., Purohit, P., Schaeffer, M., Shah, N., Siderius, H. P., Wei, M., and Xu, Y.: Cooling Emissions and Policy Synthesis Report: Benefits of cooling efficiency and the Kigali Amendment, United Nations Environment Programme and International Energy Agency, available at: https://www.ccacoalition.org/en/resources/cooling-emissions-and-policy-synthesis-report-benefits-cooling-efficiency-and-kigali, last access: 15 August 2020.
Astrain, D., Merino, A., Catalán, L., Aranguren, P., Araiz, M., Sánchez, D., Cabello, R., and Llopis, R.: Improvements in the cooling capacity and the COP of a transcritical CO2 refrigeration plant operating with a thermoelectric subcooling system, Appl. Therm. Eng., 155, 110–122, https://doi.org/10.1016/j.applthermaleng.2019.03.123, 2019.
Barrault, S., Calmels, O., Clodic, D., and Michineau, T.: Energy efficiency state of the art of available low-GWP refrigerants and systems, Study commissioned by the AFCE and carried out by EReIE, the Cemafroid, and the CITEPA, available at: http://www.afce.asso.fr/wp-content/uploads/2018/10/Final-rapport-energy-efficiency-GWP-2018.pdf (last assess: 27 January 2020), 2018.
Beddington, J., Asaduzzaman, M., Clark, M., Fernández, A., Guillou, M., Jahn, M., Erda, L., Mamo, T., Van Bo, N., Nobre, C. A., Scholes, R., Sharma, R., and Wakhungu, J.: Achieving food security in the face of climate change: Final report from the Commission on Sustainable Agriculture and Climate Change, CGIAR Research Program on Climate Change, Agriculture and Food Security (CCAFS), Copenhagen, 2012.
Berntsen, T., Fuglestvedt, J., Myhre, G., Stordal, F., and Berglen, T. F.: Abatement of Greenhouse Gases: Does Location Matter?, Climatic Change, 74, 377–411, https://doi.org/10.1007/s10584-006-0433-4, 2006.
Beshr, M., Aute, V., Sharma, V., Abdelaziz, O., Fricke, B., and Radermacher, R.: A comparative study on the environmental impact of supermarket refrigeration systems using low GWP refrigerants, Int. J. Refrig., 56, 154–164, https://doi.org/10.1016/j.ijrefrig.2015.03.025, 2015.
Blumberg, K., Isenstadt, A., Taddonio, K. N., Andersen, S. O., and Sherman, N. J.: Mobile air conditioning: The life-cycle costs and greenhouse-gas benefits of switching to alternative refrigerants and improving system efficiencies, International Council on Clean Transportation (ICCT), Washington, D.C., available at: https://www.theicct.org/sites/default/files/publications/ICCT_mobile-air-cond_CBE_201903.pdf, last access: 15 March 2019.
Bond, T. C., Streets, D. G., Yarber, K. F., Nelson, S. M., Woo, J. H., and Klimont, Z.: A technology-based global inventory of black and organic carbon emissions from combustion, J. Geophys. Res.-Atmos., 109, D14203, https://doi.org/10.1029/2003JD003697, 2004.
Borgford-Parnell, N., Beaugrand, M., Andersen, S. O., and Zaelke, D.: Phasing Down the Use of Hydrofluorocarbons (HFCs), Contributing paper for Seizing the Global Opportunity: Partnerships for Better Growth and a Better Climate, New Climate Economy, London and Washington, D.C., available at: http://newclimateeconomy.report/misc/working-papers (last access: 19 January 2019), 2015.
Brander, M., Sood, A., Wylie, C., Haughton, A., and Lovell, J.: Electricity-specific Emission Factors for Grid Electricity, available at: https://ecometrica.com/assets/Electricity-specific-emission-factors-for-grid-electricity.pdf (last access: 9 August 2017), 2011.
Cain, M., Lynch, J., Allen, M. R., Fuglestvedt, J. S., Frame, D. J., and Macey, A. H.: Improved calculation of warming-equivalent emissions for short-lived climate pollutants, npj Clim. Atmos. Sci., 2, 29, https://doi.org/10.1038/s41612-019-0086-4, 2019.
Calm, J. M.: Comparative efficiencies and implications for greenhouse gas emissions of chiller refrigerants, Int. J. Refrig., 29, 833–841, https://doi.org/10.1016/j.ijrefrig.2005.08.017, 2006.
CCAC: Lower-GWP Alternatives in Stationary Air Conditioning: A Compilation of Case Studies, Climate and Clean Air Coalition (CCAC), Paris, October 2019.
Cseh, A.: Aligning climate action with the self-interest and short-term dominated priorities of decision-makers, Clim. Policy, 19, 139–146, https://doi.org/10.1080/14693062.2018.1478791, 2019.
Depuru, S. S. S. R., Wang, L., and Devabhaktuni, V.: Electricity theft: Overview, issues, prevention and a smart meter-based approach to control theft, Energ. Policy, 39, 1007–1015, https://doi.org/10.1016/j.enpol.2010.11.037, 2011.
Dreyfus, G. B., Andersen, S. O., Kleymayer, A. M., and Zaelke, D.: Primer on Energy Efficiency, Institute for Governance and Sustainable Development (IGSD), Washington, D.C., USA, available at: http://www.igsd.org/wp-content/uploads/2019/10/EE-Primer-11.13.17.pdf (last access: 9 May 2018), 2017.
EIA: Kigali amendment to the Montreal Protocol – A Crucial Step in the Fight Against Catastrophic Climate Change, Environmental Investigation Agency (EIA) briefing to the 22nd Conference of the Parties (CoP22) to the United Nations Framework Convention on Climate Change (UNFCCC), Marrakech, Morocco, 7–18 November, 2016.
Fang, X., Velders, G. J. M., Ravishankara, A. R., Molina, M. J., Hu, J., and Prinn, R. G.: Hydrofluorocarbon (HFC) Emissions in China: An Inventory for 2005–2013 and Projections to 2050, Environ. Sci. Technol., 50, 2027–2034, https://doi.org/10.1021/acs.est.5b04376, 2016.
Fang, X., Ravishankara, A. R., Velders, G. J. M., Molina, M. J., Su, S., Zhang, J., Zhou, X., Hu, J., and Prinn, R. G.: Changes in Emissions of Ozone-Depleting Substances from China Due to Implementation of the Montreal Protocol, Environ. Sci. Technol., 52, 11359–11366, https://doi.org/10.1021/acs.est.8b01280, 2018.
Forster, P., Ramaswamy, V., Artaxo, P., Berntsen, T., Betts, R., Fahey, D. W., Haywood, J., Lean, J., Lowe, D. C., Myhre, G., Nganga, J., Prinn, R., Raga, G., Schulz, M., and Van Dorland, R.: Changes in Atmospheric Constituents and in Radiative Forcing, in: Climate Change 2007: The Physical Science Basis, Contribution of Working Group I to the Fourth Assessment Report of the Intergovernmental Panel on Climate Change, edited by: Solomon, S., Qin, D., Manning, M., Chen, Z., Marquis, M., Averyt, K. B., Tignor, M., and Miller, H. L., Cambridge University Press, Cambridge, UK and New York, NY, USA, 2007.
Gambhir, A., Napp, T., Hawkes, A., Höglund-Isaksson, L., Winiwarter, W., Purohit, P., Wagner, F., Bernie, D., and Lowe, J.: The contribution of non-CO2 greenhouse gas mitigation to achieving long-term temperature goals, Energies, 10, 602, https://doi.org/10.3390/en10050602, 2017.
Godwin, D. S. and Ferenchiak, R.: The implications of residential air conditioning refrigerant choice on future hydrofluorocarbon consumption in the United States, J. Integr. Environ. Sci., https://doi.org/10.1080/1943815X.2020.1768551, in press, 2020.
Goetzler, W., Guernsey, M., Young, J., Fuhrman, J., and Abdelaziz, O.: The Future of Air Conditioning for Buildings: Executive Summary, Oak Ridge National Laboratory, DOE/EE-1394, Oak Ridge, available at: https://pdfs.semanticscholar.org/eae6/b95997141e62f745290f4ab3eb60d4d7bc39.pdf (last access: 26 January 2019), 2016.
GoI: Control of emission/venting of Hydrofluorocarbon (HFC)-23, produced as by product while manufacturing of Hydrochlorofluorocarbon (HCFC)-22, in the atmosphere, Ozone Cell, Ministry of Environment, Forest & Climate Change, Government of India (GoI), New Delhi, available at: http://www.ozonecell.com/viewsection.jsp?lang=0&id=0,256,743 (last access: 17 December 2018), 2016.
Groll, E. A. and Kim, J.-H.: Review of Recent Advances toward Transcritical CO2 Cycle Technology, HVAC&R Res., 13, 499–520, https://doi.org/10.1080/10789669.2007.10390968, 2007.
Gschrey, B., Schwarz, W., Elsner, C., and Engelhardt, R.: High increase of global F-gas emissions until 2050, Greenhouse Gas Measurement and Management, 1, 85–92, https://doi.org/10.1080/20430779.2011.579352, 2011.
Hansen, J. and Nazarenko, L.: Soot climate forcing via snow and ice albedos, P. Natl. Acad. Sci. USA, 101, 423–428, https://doi.org/10.1073/pnas.2237157100, 2004.
He, H., Hembeck, L., Hosley, K. M., Canty, T. P., Salawitch, R. J., and Dickerson, R. R.: High ozone concentrations on hot days: The role of electric power demand and NOx emissions, Geophys. Res. Lett., 40, 5291–5294, 2013.
Heredia-Aricapa, Y., Belman-Flores, J. M., Mota-Babiloni, A., Serrano-Arellano, J., and García-Pabón, J. J.: Overview of low GWP mixtures for the replacement of HFC refrigerants: R134a, R404A and R410A, Int. J. Refrig., 111, 13–123, https://doi.org/10.1016/j.ijrefrig.2019.11.012, 2020.
Hiç, C., Pradhan, P., Rybski, D., and Kropp, J. P.: Food Surplus and Its Climate Burdens, Environ. Sci. Technol., 50, 4269–4277, https://doi.org/10.1021/acs.est.5b05088, 2016.
Höglund Isaksson, L., Winiwarter, W., Purohit, P., and Gomez-Sanabria, A.: Non-CO2 greenhouse gas emissions in the EU-28 from 2005 to 2050: GAINS model methodology, IIASA Report, Laxenburg, Austria, available at: http://pure.iiasa.ac.at/id/eprint/13398/ (last access: 17 November 2018), 2016.
Höglund-Isaksson, L., Purohit, P., Amann, M., Bertok, I., Rafaj, P., Schöpp, W., and Borken-Kleefeld, J.: Cost estimates of the Kigali Amendment to phase-down hydrofluorocarbons, Environ. Sci. Policy, 75, 138–147, https://doi.org/10.1016/j.envsci.2017.05.006, 2017.
Höglund-Isaksson, L., Gómez-Sanabria, A., Klimont, Z., Rafaj, P., and Schöpp, W.: Technical potentials and costs for reducing global anthropogenic methane emissions in the 2050 timeframe – results from the GAINS model, Environ. Res. Commun., 2, 025004, https://doi.org/10.1088/2515-7620/ab7457, 2020.
IEA: Transition to Sustainable Buildings: Strategies and Opportunities to 2050, International Energy Agency (IEA), Paris, France, 2013.
IEA: Energy and Air Pollution: World Energy Outlook Special Report 2016, International Energy Agency (IEA), Paris, France, 2016.
IEA: The Future of Cooling, International Energy Agency (IEA), Paris, France, 2018.
IEA: World Energy Outlook 2019, International Energy Agency (IEA), Paris, France, 2019.
IEA-WEO: World Energy Outlook (WEO) 2017, International Energy Agency (IEA), Paris, France, 2017.
IIASA: SSP Database (Shared Socioeconomic Pathways) – Version 1.1, International Institute for Applied Systems Analysis, Laxenburg, Austria, available at: https://secure.iiasa.ac.at/web-apps/ene/SspDb/dsd?Action=htmlpage&page=about (last access: 23 July 2018), 2017.
IIASA-GAINS: Greenhouse gas Air pollution INteractions and Synergies (GAINS) Model, International Institute for Applied Systems Analysis, Laxenburg, Austria, available at: http://gains.iiasa.ac.at/models/gains_models3.html, last access: 28 September 2019.
Ingram, J.: A food systems approach to researching food security and its interactions with global environmental change, Food Secur., 3, 417–431, https://doi.org/10.1007/s12571-011-0149-9, 2011.
IPCC: Climate Change 2013: The Physical Science Basis, Working Group I Contribution to the Fifth Assessment Report of the Intergovernmental Panel on Climate Change (IPCC), Cambridge University Press, Cambridge, UK and New York, USA, 2013.
IPCC: Global Warming of 1.5 ∘C: An IPCC Special Report on the impacts of global warming of 1.5 ∘C above pre-industrial levels and related global greenhouse gas emission pathways, in the context of strengthening the global response to the threat of climate change, sustainable development, and efforts to eradicate poverty, Intergovernmental Panel on Climate Change (IPCC), Geneva, available at: https://www.ipcc.ch/sr15/ (last access: 13 March 2019), 2018.
IPCC/TEAP: IPCC/TEAP Special Report on Safeguarding the Ozone Layer and the Global Climate System: Issues Related to Hydrofluorocarbons and Perfluorocarbons, Intergovernmental Panel on Climate Change (IPCC) and Technology and Economic Assessment Panel (TEAP), Cambridge University Press, Cambridge, UK and New York, USA, 2005.
ISO: Environmental Management – Life Cycle Assessment – Requirements and Guidelines, ISO-14044, 2006.
Kummu, M., de Moel, H., Porkka, M., Siebert, S., Varis, O., and Ward, P. J.: Lost food wasted resources: Global food supply chain losses and their impacts on freshwater, cropland, and fertilizer use, Sci. Total Environ., 438, 477–489, https://doi.org/10.1016/j.scitotenv.2012.08.092, 2012.
Lamb, A., Green, R., Bateman, I., Broadmeadow, M., Bruce, T., Burney, J., Carey, P., Chadwick, D., Crane, E., Field, R., Goulding, K., Griffiths, H., Hastings, A., Kasoar, T., Kindred, D., Phalan, B., Pickett, J., Smith, P., Wall, E., zu Ermgassen, E. K. H. J., and Balmford, A.: The potential for land sparing to offset greenhouse gas emissions from agriculture, Nat. Clim. Change, 6, 488–492, https://doi.org/10.1038/nclimate2910, 2016.
Lynch, J., Cain, M., Pierrehumbert, R., and Allen, M.: Demonstrating GWP: a means of reporting warming-equivalent emissions that captures the contrasting impacts of short- and long-lived climate pollutants, Environ. Res. Lett., 15, 044023, https://doi.org/10.1088/1748-9326/ab6d7e, 2020.
Markandya, A., Sampedro, J., Smith, S. J., van Dingenen, R., Pizarro-Irizar, C., Arto, I., and González-Eguino, M.: Health co-benefits from air pollution and mitigation costs of the Paris Agreement: a modelling study, Lancet Planet. Health, 2, e126–e133, 2018.
Mastrucci, A., Byers, E., Pachauri, S., and Rao, N. D.: Improving the SDG energy poverty targets: Residential cooling needs in the Global South, Energ. Buildings, 186, 405–415, https://doi.org/10.1016/j.enbuild.2019.01.015, 2019.
McLinden, M. O., Brown, J. S., Brignoli, R., Kazakov, A. F., and Domanski, P. A.: Limited options for low-global warming potential refrigerants, Nat. Commun., 8, 14476, https://doi.org/10.1038/ncomms14476, 2017.
Mills, E.: Building commissioning: a golden opportunity for reducing energy costs and greenhouse gas emissions in the United States, Energ. Effic., 4, 145–173, https://doi.org/10.1007/s12053-011-9116-8, 2011.
Mora, C., Dousset, B., Caldwell, I. R., Powell, F. E., Geronimo, R. C., Bielecki, C. R., Counsell, C. W. W., Dietrich, B. S., Johnston, E. T., Louis, L. V., Lucas, M. P., Mckenzie, M. M., Shea, A. G., Tseng, H., Giambelluca, T. W., Leon, L. R., Hawkins, E., and Trauernicht, C.: Global risk of deadly heat, Nat. Clim. Change, 7, 501–506, https://doi.org/10.1038/nclimate3322, 2017.
Mueller, B., Zhang, X., and Zwiers, F. W.: Historically hottest summers projected to be the norm for more than half of the world's population within 20 years, Environ. Res. Lett., 11, 044011, https://doi.org/10.1088/1748-9326/11/4/044011, 2016.
Nemet, G. F., Holloway, T., and Meier, P.: Implications of incorporating air-quality co-benefits into climate change policymaking, Environ. Res. Lett., 5, 014007, https://doi.org/10.1088/1748-9326/5/1/014007, 2010.
Pal, J. S. and Eltahir, E. A. B.: Future temperature in southwest Asia projected to exceed a threshold for human adaptability, Nat. Clim. Change, 6, 197–200, https://doi.org/10.1038/nclimate2833, 2016.
Park, J., Hallegatte, S., Bangalore, M., and Sandhoefner, E.: Households and heat stress estimating the distributional consequences of climate change, Policy Research Working Paper No. WPS7479, World Bank Group, Washington, D.C., available at: http://documents.worldbank.org/curated/en/103721468000929054/pdf/WPS7479.pdf (last access: 13 March 2019), 2015.
Park, W. Y., Shah, N., and Phadke, A.: Enabling access to household refrigeration services through cost reductions from energy efficiency improvements, Energ. Effic., 12, 1795–1819, https://doi.org/10.1007/s12053-019-09807-w, 2019.
Peters, T: A Cool World Defining the Energy Conundrum of Cooling for All, University of Birmingham, UK, available at: https://www.birmingham.ac.uk/Documents/college-eps/energy/Publications/2018-clean-cold-report.pdf (last access: 17 January 2019), 2018.
Petkova, E. P., Vink, J. K., Horton, P. M., Gasparrini, A., Bader, D. A., Francis, J. D., and Kinney, P. L.: Towards more comprehensive projections of urban heat-related mortality: estimates for New York city under multiple population, adaptation, and climate scenarios, Environ. Health. Persp., 125, 47–55, https://doi.org/10.1289/EHP166, 2017.
Phadke, A., Abhyankar, N., and Shah, N.: Avoiding 100 New Power Plants by Increasing Efficiency of Room Air Conditioners in India: Opportunities and Challenges, LBNL-6674e, Lawrence Berkeley National Laboratory (LBNL), Berkley, June 2014.
Purohit, N., Sharma, V., Sawalha, S., Fricke, B., Llopis, R., and Dasgupta, M. S.: Integrated supermarket refrigeration for very high ambient temperature, Energy, 165A, 572–590, https://doi.org/10.1016/j.energy.2018.09.097, 2018.
Purohit, P. and Höglund-Isaksson, L.: Global emissions of fluorinated greenhouse gases 2005–2050 with abatement potentials and costs, Atmos. Chem. Phys., 17, 2795–2816, https://doi.org/10.5194/acp-17-2795-2017, 2017.
Purohit, P., Höglund-Isaksson, L., Bertok, I., Chaturvedi, V., and Sharma, M.: Scenario Analysis for HFC Emissions in India: Mitigation potential and costs, CEEW-IIASA Report, New Delhi, available at: (last access: 18 November 2018), 2016.
Purohit, P., Höglund-Isaksson, L., and Wagner, F.: Impacts of the Kigali Amendment to phase-down hydrofluorocarbons (HFCs) in Asia, International Institute for Applied Systems Analysis (IIASA) Report, Laxenburg, Austria, available at: http://pure.iiasa.ac.at/id/eprint/15274/1/Impacts%2520of%2520the%2520Kigali%2520Amendment.pdf (last access: 17 November 2019), 2018.
Purohit, P., Amann, M., Kiesewetter, G., Rafaj, P., Chaturvedi, V., Dholakia, H. H., Koti, P. N., Klimont, Z., Borken-Kleefeld, J., Gomez-Sanabria, A., Schöpp, W., and Sander, R.: Mitigation pathways towards national ambient air quality standards in India, Environ. Int., 133A, 105147, https://doi.org/10.1016/j.envint.2019.105147, 2019.
Rafaj, P., Kiesewetter, G., Gül, T., Schöpp, W., Cofala, J., Klimont, Z., Purohit, P., Heyes, C., Amann, M., Borken-Kleefeld, J., and Cozzi, L.: Outlook for clean air in the context of sustainable development goals, Global Environ. Chang., 53, 1–11, https://doi.org/10.1016/j.gloenvcha.2018.08.008, 2018.
Reddy, M. S. and Boucher, O.: Climate impact of black carbon emitted from energy consumption in the world's regions, Geophys. Res. Lett., 34, L11802, https://doi.org/10.1029/2006GL028904, 2007.
Reese, A.: Slow coolant phaseout could worsen warming, Science, 359, 1084, https://doi.org/10.1126/science.359.6380.1084, 2018.
Riahi, K., van Vuuren, D. P., Kriegler, E., Edmonds, J., O'Neill, B., Fujimori, S., Bauer, N., Calvin, K., Dellink R, Fricko, O., Lutz, W., Popp, A., Cuaresma, J. C., Samir, K. C., Leimback, M., Jiang, L., Kram, T., Rao, S., Emmerling, J., Ebi, K., Hasegawa, T., Havlik, P., Humpenöder, F., Da Silva, L. A., Smith, S., Stehfest, E., Bosetti, V., Eom, J., Gernaat, D., Masui, T., Rogelj, J., Strefler, J., Drouet, L., Krey, V., Luderer, G., Harmsen, M., Takahashi, K., Baumstark, L., Doelman, J., Kainuma, M., Klimont, Z., Marangoni, G., Lotze-Campen, H., Obersteiner, M., Tabeau, A., and Tavoni, M.: The Shared Socioeconomic Pathways and their energy, land use, and greenhouse gas emissions implications: An overview, Global Environ. Chang., 42, 153–168, https://doi.org/10.1016/j.gloenvcha.2016.05.009, 2017.
Rogelj, J., Shindell, D., Jiang, K., Fifita, S., Forster, P., Ginzburg, V., Handa, C., Kheshgi, H., Kobayashi, S., Kriegler, E., Mundaca, L., Séférian, R., and Vilariño, M. V.: Chapter 2: Mitigation Pathways Compatible with 1.5 ∘C in the Context of Sustainable Development, in: Global Warming of 1.5 ∘C: An IPCC Special Report on the impacts of global warming of 1.5 ∘C above pre-industrial levels and related global greenhouse gas emission pathways, in the context of strengthening the global response to the threat of climate change, sustainable development, and efforts to eradicate poverty, The Intergovernmental Panel on Climate Change (IPCC), Geneva, 2018.
Russo, S., Sillmann, J., and Sterl, A.: Humid heat waves at different warming levels, Sci. Rep.-UK, 7, 1–7, https://doi.org/10.1038/s41598-017-07536-7, 2017.
Sailor, D. J.: Relating residential and commercial sector electricity loads to climate – evaluating state level sensitivities and vulnerabilities, Energy, 26, 645–657, https://doi.org/10.1016/S0360-5442(01)00023-8, 2001.
Say, D., Ganesan, A. L., Lunt, M. F., Rigby, M., O'Doherty, S., Harth, C., Manning, A. J., Krummel, P. B., and Bauguitte, S.: Emissions of halocarbons from India inferred through atmospheric measurements, Atmos. Chem. Phys., 19, 9865–9885, https://doi.org/10.5194/acp-19-9865-2019, 2019.
Schaeffer, R., Szklo, A. S., Pereira de Lucena, A. F., Moreira Cesar Borba, B. S., Pupo Nogueira, L. P., Fleming, F. P., Troccoli, A., Harrison, M., and Boulahya, M. S.: Energy sector vulnerability to climate change: A review, Energy, 38, 1–12, https://doi.org/10.1016/j.energy.2011.11.056, 2012.
Schwarz, W., Gschrey, B., Leisewitz, A., Herold, A., Gores, S., Papst, I., Usinger, J., Oppelt, D., Croiset, I., Pedersen, H., Colbourne, D., Kauffeld, M., Kaar, K., and Lindborg, A.: Preparatory study for a review of Regulation (EC) No 842/2006 on certain fluorinated greenhouse gases, Final Report Prepared for the European Commission in the context of Service Contract No 070307/2009/548866/SER/C4, European Commission, Brussels, 2011.
Shah, N., Waide, P., and Phadke, A.: Cooling the Planet: Opportunities for Deployment of Superefficient Room Air Conditioners, LBNL-6164E, Lawrence Berkeley National Laboratory (LBNL), Berkley, 2013.
Shah, N., Wei, M., Letschert, V. E., and Phadke, A.: Benefits of Leapfrogging to Superefficiency and Low Global Warming Potential Refrigerants in Room Air Conditioning, LBNL-1003671, Lawrence Berkeley National Laboratory (LBNL), Berkley, CA, 2015.
Shah, N., Wei, M., Letschert, V. E., and Phadke, A.: Benefits of Energy Efficient and Low-Global Warming Potential Refrigerant Cooling Equipment, LBNL-2001229, Lawrence Berkeley National Laboratory (LBNL), Berkley, CA, 2019.
Sharma, M., Chaturvedi, V., and Purohit, P.: Long-term carbon dioxide and hydrofluorocarbon emissions from commercial space cooling and refrigeration in India: a detailed analysis within an integrated assessment modelling framework, Climatic Change, 143, 503–517, https://doi.org/10.1007/s10584-017-2002-4, 2017.
Sharma, V., Fricke, B., and Bansal, P.: Comparative analysis of various CO2 configurations in supermarket refrigeration systems, Int. J. Refrig., 46, 86–99, https://doi.org/10.1016/j.ijrefrig.2014.07.001, 2014.
Simmonds, P. G., Rigby, M., McCulloch, A., O'Doherty, S., Young, D., Mühle, J., Krummel, P. B., Steele, P., Fraser, P. J., Manning, A. J., Weiss, R. F., Salameh, P. K., Harth, C. M., Wang, R. H. J., and Prinn, R. G.: Changing trends and emissions of hydrochlorofluorocarbons (HCFCs) and their hydrofluorocarbon (HFCs) replacements, Atmos. Chem. Phys., 17, 4641–4655, https://doi.org/10.5194/acp-17-4641-2017, 2017.
UN: Chapter XXVII – Environment (2.f Amendment to the Montreal Protocol on Substances that Deplete the Ozone Layer), Treaty Section, Office of Legal Affairs, United Nations, New York, available at: https://treaties.un.org/pages/ViewDetails.aspx?src=TREATY&mtdsg_no=XXVII-2-a&chapter=27&lang=en, last access: 12 June 2020.
UNEP: Report of the task force on HCFC issues and emissions reduction benefits arising from earlier HCFC phase-out and other practical measures, United Nations Environment Programme (UNEP), Nairobi, Kenya, 2007.
UNEP: HFCs – A Critical Link in Protecting Climate and the Ozone Layer: A UNEP Synthesis Report, United Nations Environment Programme (UNEP), Nairobi, Kenya, 2011.
UNEP: Lower-GWP Alternatives in Commercial and Transport Refrigeration: An expanded compilation of propane, CO2, ammonia and HFO case studies, Climate and Clean Air Coalition (CCAC), United Nations Environment Programme (UNEP), Paris, France, 2016a.
UNEP: Further Amendment of the Montreal Protocol: Submitted by the Contact group on HFCs, Twenty-Eighth Meeting of the Parties to the Montreal Protocol on Substances that Deplete the Ozone Layer, United Nations Environment Programme (UNEP), 10–14 October 2016, Kigali, Rwanda, UNEP/OzL.Pro.28/CRP/10, 2016b.
UNEP: Ozone Secretariat – Data Access Centre, United Nations Environment Programme (UNEP), Nairobi, Kenya, available at: https://ozone.unep.org/countries/data-table, last access: 5 November 2017a.
UNEP: The Emissions Gap Report 2017, United Nations Environment Programme (UNEP), Nairobi, Kenya, 2017b.
UNEP: Cost-effective options for controlling HFC-23 by-product emissions, UNEP/OzL.Pro/ExCom/82/68, United Nations Environment Programme (UNEP), Nairobi, available at: http://multilateralfund.org/82/English/1/8268.pdf, last access: 13 December 2018.
UNEP: Project Proposal China – Executive Committee of the Multilateral Fund for the implementation of the Montreal Protocol, Eighty-fourth Meeting, 16–20 December 2019, UNEP/OzL.Pro/ExCom/84/42, Montreal, 2019.
UNEP/CCAC: Integrated Assessment of Short-lived Climate Pollutants in Latin America and the Caribbean, United Nations Environment Programme (UNEP) and Climate and Clean Air Coalition (CCAC), Paris, 2018.
UNEP/TEAP: Volume 4 – Decision XXX/5 Task Force Report on Cost and Availability of Low-GWP Technologies/Equipment that Maintain/Enhance Energy Efficiency, Report of the Technology and Economic Assessment Panel (TEAP), United Nations Environment Programme (UNEP), Nairobi, May 2019.
UNFCCC: National Inventory Submissions 2017, United Nations Framework Convention on Climate Change (UNFCCC), Bonn, available at: http://unfccc.int/national_reports/annex_i_ghg_inventories/national_inventories_submissions/items/10116.php, last access: 27 September 2017.
UNFCCC: Presidency consultations on modalities, procedures and guidelines under the Paris Agreement with a focus on transparency, Draft Report Version 1, United Nations Framework Convention on Climate Change (UNFCCC), Bonn, Germany, 2018.
Valor, E., Meneu, V., and Caselles, V.: Daily Air Temperature and Electricity Load in Spain, J. Appl. Meteorol., 40, 1413–1421, https://doi.org/10.1175/1520-0450(2001)040<2178:IOLFCT>2.0.CO;2, 2001.
Vandyck, T., Keramidas, K., Kitous, A., Spadaro, J. V., van Dingenen, R., Holland, M., and Saveyn, B.: Air quality co-benefits for human health and agriculture counterbalance costs to meet Paris Agreement pledges, Nat. Commun., 9, 4939, https://doi.org/10.1038/s41467-018-06885-9, 2018.
Velders, G. J. M., Fahey, D. W., Daniel, J. S., McFarland, M., and Andersen, S. O.: The large contribution of projected HFC emissions to future climate forcing, P. Natl. Acad. Sci. USA, 106, 10949–10954, https://doi.org/10.1073/pnas.0902817106, 2009.
Velders, G. J. M., Ravishankara, A. R., Miller, M. K., Molina, M. J., Alcamo, J., Daniel, J. S., Fahey, D. W., Montzka, S. A., and Reimann, S.: Preserving Montreal protocol climate benefits by limiting HFCs, Science, 335, 922–923, https://doi.org/10.1126/science.1216414, 2012.
Velders, G. J. M., Fahey, D. W., Daniel, J. S., Andersen, S. O., and McFarland, M.: Future atmospheric abundances and climate forcings from scenarios of global and regional hydrofluorocarbon (HFC) emissions, Atmos. Environ., 123A, 200–209, https://doi.org/10.1016/j.atmosenv.2015.10.071, 2015.
WHO: Quantitative risk assessment of the effects of climate change on selected causes of death, 2030s and 2050s, World Health Organization (WHO), Geneva, Switzerland, 2014.
WMO: Scientific Assessment of Ozone Depletion 2018: Executive Summary, World Meteorological Organization (WMO), Geneva, Switzerland, 2018.
World Bank: World Development Indicators, The World Bank, Washington, D.C., available at: https://data.worldbank.org/data-catalog/world-development-indicators, last access: 24 January 2019.
Zaelke, D. and Borgford-Parnell, N.: The importance of phasing down hydrofluorocarbons and other short-lived climate pollutants, J. Environ. Stud. Sci., 5, 169–175, https://doi.org/10.1007/s13412-014-0215-7, 2015.
Zaelke, D., Borgford-Parnell, N., and Grabiel, D. F.: Primer on Hydrofluorocarbons – Fast action under the Montreal Protocol can limit growth of HFCs, prevent up to 100 billion tonnes of CO2-eq emissions by 2050, and avoid up to 0.5 ∘C of warming by 2100, Institute for Governance & Sustainable Development (IGSD) Working Paper, Washington, DC, October 2013.
Ninety-five signatories have ratified the Kigali Amendment to the Montreal Protocol on phasing down HFCs worldwide, as of 12 June 2020 (UN, 2020).
The Montreal Protocol Parties are split into four Kigali Amendment groups: (a) Non-Article 5, earlier start – Most non-Article 5 countries; (b) Non-Article 5, later start – Russia, Belarus, Kazakhstan, Tajikistan, and Uzbekistan; (c) Article 5, Group 1 – Most Article 5 countries; and (d) Article 5, Group 2 – Bahrain, India, Iran, Iraq, Kuwait, Oman, Pakistan, Qatar, Saudi Arabia, and UAE.
This includes HFC inventories prepared by Climate & Clean Air Coalition (CCAC) and United Nations Development Programme (UNDP), UNEP Ozone Secretariat, non-Annex-I parties national communication to the UNFCCC, etc.
For e.g., HFC-410A is a zeotropic mixture of 50 % HFC-32 and 50 % HFC-125. Similarly, HFC-407C is a zeotropic mixture of 23 % HFC-32, 25 % HFC-125, and 52 % HFC-134a.
GAINS relies on import of externally produced macroeconomic and energy sector projections. In this case, the range of energy sector scenarios produced for the IEA-WEO 2017 was used.
This scenario considers the impact of those policies and measures that are firmly enshrined in legislation as of mid-2017. It provides a cautious assessment of where momentum from existing policies might lead the energy sector in the absence of any other impetus from government.
The NPS aims to provide a sense of where today's policy ambitions seem likely to take the energy sector. It incorporates not only the policies and measures that governments around the world have already put in place, but also the likely effects of announced policies, including the nationally determined contributions (NDCs) made for the Paris Agreement (PA).
This scenario outlines an integrated approach to achieving internationally agreed objectives on climate change, air quality, and universal access to modern energy. Further information is available in IEA-WEO (2017) and Rafaj et al. (2018).
The SSPs are based on five narratives describing the alternative socioeconomic developments “sustainable development” (SSP1), “middle-of-the-road development” (SSP2), “regional rivalry” (SSP3), “inequality” (SSP4), and “fossil-fueled development” (SSP5) (Riahi et al., 2017).
Cooling degree days (CDDs) are country/region specific and measure how much (in degrees) and for how long (in days) outside air temperature was higher than a specific base temperature. For the purposes of this study, CDDs are measured in ∘C, standardized to 18 ∘C, and adopted at a country and regional level consistent with IEA (2018).
With the exception of SSP5 and as shown in Fig. S1, SSP1 and SSP3 represent roughly the full range of future population and GDP developments among the SSPs. SSP5 is not considered as a baseline in this study, since the dimension of a continued fossil-fuel intensive future vs. a decarbonized future is already integrated in the analysis through the range of country-specific implied emission factors from the CPS vs. the SDS scenarios of the IEA-WEO2017. In the period beyond 2040, the country-, sector-, and fuel-specific emission factors derived from these scenarios for the year 2040 are kept constant.
The Cooling for All initiative (IEA, 2018) focuses on how we provide sustainable access to cooling within a clean energy transition and, in turn, support faster progress to achieve the goals of the Kigali Amendment.
For regions with CDDs < 1000, it is assumed that the households will use other cooling appliances (fan, evaporative coolers, etc.) if they cannot afford room air conditioners. By 2050, approximately 183 million households (or nearly 1 billion people) in hot countries will have at least one air conditioner in the Cooling for All scenario.
The building envelope determines the amount of energy needed to heat and cool a building and hence needs to be optimized to keep heating and cooling loads to a minimum. A high-performance building envelope in a cold climate requires just 20 %–30 % of the energy required to heat the current average building in the Organisation of Economic Co-operation and Development (OECD). In hot climates, the energy savings potential from reduced energy needs for cooling are estimated at between 10 % and 40 % (Dreyfus et al., 2017).
Technical losses occur naturally due to power dissipation in transmission lines, transformers, etc. Electricity theft forms a major chunk of the NTL that includes illegal tapping of electricity from the feeder, bypassing the energy meter, tampering with the energy meter, and several physical methods to evade payment to the utility company (Depuru et al., 2011).