the Creative Commons Attribution 4.0 License.
the Creative Commons Attribution 4.0 License.
 | 02 Oct 2020
Hygroscopicity of urban aerosols and its link to size-resolved chemical composition during spring and summer in Seoul, Korea
Najin Kim
Minsu Park
Jong Sung Park
Hye Jung Shin
Joon Young Ahn
Chemical effects on the size-resolved hygroscopicity of urban aerosols were examined based on the Korea–US Air Quality Study (KORUS-AQ, 2020) field campaign data. The information on size-resolved hygroscopicity and the chemical composition of aerosols were obtained by a hygroscopic tandem differential mobility analyzer (HTDMA) and a high-resolution time-of-flight aerosol mass spectrometer (HR-ToF-AMS), respectively. Good correspondence was shown between measured and estimated κ values calculated from the combination of bulk chemical composition data and oxidation parameters of organic aerosols (f44 and O∕C). These results imply that chemical composition is closely associated with aerosol hygroscopicity. However, the correlation between measured and estimated κ values degraded as particle size decreased, implying that size-resolved chemical composition data are required for more detailed hygroscopicity analysis. In addition to size-resolved chemical data, the m∕z tracer method was applied for size-resolved organic factors. Specifically, m∕z 57 and 44 were used as AMS spectral markers for hydrocarbon-like organic aerosol (HOA) and oxygenated organic aerosol (OOA), respectively. These size-resolved chemical composition data were found to be critical in explaining size-dependent hygroscopicity, as well as the diurnal variation in κ for small particles, i.e., low κ in the morning and high κ in the afternoon. Additionally, aerosol mixing state information was associated with the size-resolved chemical composition data. That is to say that the relationship between the number fraction of each hygroscopicity mode and the volume fraction of different chemical composition was investigated. For example, the HOA volume fraction comprised about 60 % of the variation in less hygroscopic (LH) mode number fractions for externally mixed aerosols.
- Article
(5474 KB) - Full-text XML
-
Supplement
(933 KB) - BibTeX
- EndNote


Aerosol hygroscopicity, an ability of aerosols to absorb water vapor, describes an interaction between water vapor and particles under subsaturated and supersaturated conditions and determines the critical supersaturation for cloud droplet activation (McFiggans et al., 2006; Swietlicki et al., 2008). In general, aerosols can be characterized as hygroscopic, neutral, or hydrophobic depending on their affinity for water (Rogers and Yau; 1989). Hygroscopicity of aerosols is considered a crucial parameter in aerosol studies as it affects the number concentration of cloud condensation nuclei (CCN) and the lifetime of clouds and thereby indirectly influences regional and global climate change (Zhang et al., 2008; Su et al., 2010; IPCC, 2013; Rosenfeld et al., 2014). Moreover, hygroscopicity is responsible for the degradation of visibility and multiphase chemical reactions which are closely related to air quality as cross-sectional areas of aerosol particles increase after particles take up water vapor with humidity (Tang, 1996; Cheng et al., 2008; Liu et al., 2013; Zheng et al., 2015).
Hygroscopicity measurements were mainly performed with a hygroscopic tandem differential mobility analyzer (HTDMA) introduced by Liu et al. (1978) and/or with a combined system of a CCN counter (CCNC), a differential mobility analyzer (DMA), and a condensation particle counter (CPC) (Moore et al., 2010; Kim et al., 2011). Particularly, HTDMA provides information of the hygroscopic growth factor (GF) distribution at a given dry particle diameter for a fixed relative humidity (RH). Furthermore, we can infer the extent of the mixing state of aerosols, i.e., external vs. internal mixing, through HTDMA measurements (Swietlicki et al., 2008). If internally mixed, all particles are considered to have an identical composition and hygroscopicity, whereas external mixing indicates that particles of different composition and hygroscopicity coexist in a sample volume. So, even if the sizes of particles are the same, the critical supersaturation for activation could vary depending on the mixing state of atmospheric particles. From HTDMA measurements, we may obtain a monomodal GF distribution for perfect internal mixtures or bimodal or trimodal GF distribution (sometimes more than trimodal) for the external mixture of atmospheric aerosols. Various field experiments around the world have conducted hygroscopicity measurements for ambient aerosols. In marine environments, including Pacific, Atlantic, Indian, and Arctic oceans, atmospheric particles had a higher GF than in other environments and mostly showed a monomodal pattern of GF distribution (Berg et al., 1998; Maßling et al., 2003; Massling et al., 2007; Swietlicki et al., 2000; Tomlinson et al., 2007; Zhou et al., 2001). In rural sites, both aged and freshly formed particles were observed, and mixing state patterns tended to be different depending on location. Aerosols in the pristine Amazon forest showed moderate GF values due to organic compounds (Rissler et al., 2004; Thalman et al., 2017; Zhou et al., 2002). Hygroscopic properties of aerosols in urban regions where considerable anthropogenic emissions exist have been measured actively in recent years (Baltensperger et al., 2002; Cocker et al., 2001; Massling et al., 2005; Wang et al., 2017; Wu et al., 2016). The external mixture of hygroscopic aerosols from the background and freshly emitted hydrophobic aerosols was dominantly observed in these regions.
In addition to direct measurements, various estimation methods to derive aerosol hygroscopicity have been suggested based on the relationship between chemical composition and hygroscopicity (Chang et al., 2010; Gunthe et al., 2009; Gysel et al., 2007; Wu et al., 2013). In general, the Zdanovskii–Stokes–Robinson (ZSR) mixing rule (Zdanovskii, 1948; Stokes and Robinson, 1966) was applied for the estimates. Inorganic aerosols are well known to be hygroscopic from many field and laboratory studies. However, the hygroscopicity of organic materials that occupied a significant portion of atmospheric aerosols (Zhang et al., 2007) is relatively unknown and shows various water uptake abilities. Recent studies have focused on examining the hygroscopic properties of organics based on the measurements of the organic fraction in various environments (Chang et al., 2010; Wu et al., 2013; Mei et al., 2013; Hong et al., 2015, 2018). According to several previous studies, the oxidation level of organics is the main factor that affects the water uptake ability of the organic fraction in aerosols. Despite these efforts, knowledge on aerosol hygroscopicity is still limited and subject to significant uncertainties due to difficulties in the identification and quantification of numerous organic compounds in ambient aerosols and their hygroscopic properties. Notably, various emission sources and complex chemical mechanisms of aerosol production and the aging processes in urban areas make it difficult to fully understand the hygroscopic properties of aerosols and their link to aerosol chemical composition.
The Seoul metropolitan area (SMA) is one of the largest metropolitan areas in the world where the commercial, residential, and industrial facilities of Korea are concentrated on a massive scale. The air masses in SMA are influenced not only by local anthropogenic emission sources but also by biogenic sources to the east (Kim et al., 2010) and industrial emissions to the west of SMA (H. Kim et al., 2018). Furthermore, long-range transport of air pollutants from the Asian continent significantly impacts SMA air quality. In addition to local and regional sources, atmospheric processes and meteorological conditions affect aerosol properties. Nevertheless, knowledge of aerosol properties and their impact on air quality in SMA is still limited. Therefore, understanding the various sources and complex mechanisms of atmospheric aerosols in SMA is critical in establishing appropriate and effective environmental policies to mitigate air quality problems. Moreover, an enhanced understanding of these characteristics of urban aerosols based on reliable measurement data can eventually be utilized to improve the estimation of global climate change.
The Korea–US Air Quality Study (KORUS-AQ) is an international cooperative air quality field study that was conducted over Korea during spring and summer 2016. A comprehensive set of measurements from aircraft, ships, satellite, and ground sites along with air quality model calculations was made to assemble integrated observational data and examine the factors controlling the air quality in East Asia, where air pollution has increased so much in the past decades due to fast industrialization and urbanization (Swietlicki et al., 2008; Larkin et al., 2016). As part of the KORUS-AQ campaign, ground measurements of aerosol properties, gas-phase concentration, and meteorological parameters in SMA were conducted at Olympic Park, a supersite of the campaign.
In this study, we focus on the measurement of size-resolved hygroscopicity and size-resolved chemical composition by a hygroscopic tandem differential mobility analyzer (HTDMA) and a high-resolution time-of-flight aerosol mass spectrometer (HR-ToF-AMS), respectively. Our study aims to identify the relationship between chemical composition and the hygroscopicity of aerosols in SMA. For this effort, aerosol hygroscopicity is analyzed in association not only with the size-resolved chemical composition data but also with the size-resolved organic factor data. In addition, aerosol hygroscopicity and CCN capability are examined in relation to the mixing state of aerosols.
2.1 Measurement site
The KORUS-AQ field campaign was conducted at multiple ground sites, as well as in the air above the Korean Peninsula, by aircraft (DC-8 and King Air) from May to June 2016. This study focuses only on the ground measurements at Olympic Park, the main supersite of KORUS-AQ, in SMA (37.6∘ N, 127.04∘ E). The measurement period was 9 May–15 June. Although the measurement shelter was surrounded by the trees and grass fields of the park, this site was mainly influenced by anthropogenic sources from nearby residential areas and heavy road traffic. A detailed description of the site and the meteorological conditions during the campaign can be found in N. Kim et al. (2018). Briefly, Olympic Park, in general, was affected by dominant westerly winds. However, in some periods during the campaign, this pattern disappeared. Specifically, a persistent high pressure with stagnant conditions prevailed on 17–21 May (Period A in Fig. 1), and pollution transport from southwestern China occurred on 25–28 May (Period B in Fig. 1). As for meteorological conditions, campaign-averaged values for relative humidity (RH) and temperature (T) were 61.0 % and 20.8 ∘C, respectively. Both RH and T in May are generally lower than those in June. The instruments installed in the measurement shelter are described in the following section.
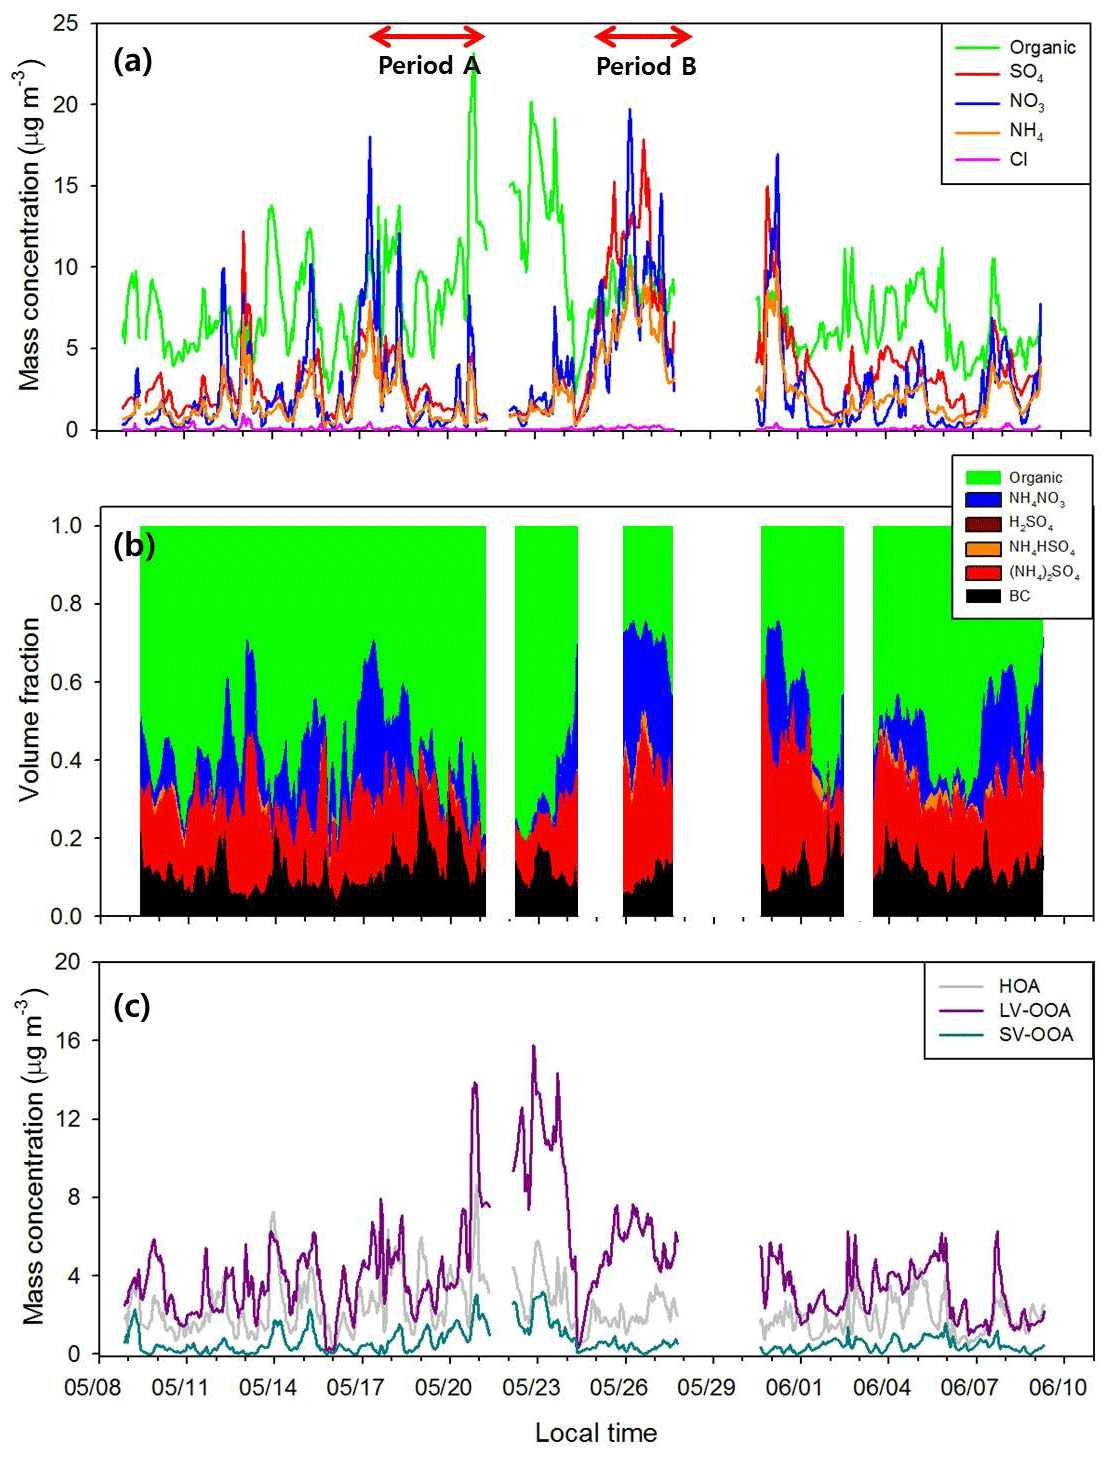
Figure 1Time series of (a) mass concentration and (b) volume fraction of aerosol chemical composition, and (c) mass concentration of three organic aerosol (OA) factors (additional blanks in the time series of the volume fraction of chemical composition in panel b is due to BC data).
2.2 HTDMA measurement
The measurement of size-resolved hygroscopicity by HTDMA in Seoul is detailed in N. Kim et al. (2017, 2018) and therefore briefly described here. First, ambient aerosols were dried to below 20 % RH by silica gel. Next, dry aerosols were neutralized by Kr-85 aerosol neutralizer and then were classified to produce monodisperse particles by the first DMA. These classified particles grew under the humid conditions of 85 % RH. The number size distribution of grown particles was measured by the second DMA with a TSI CPC 3010. Two RH sensors were placed at the exit of the Nafion humidifier and sheath air of the second DMA. After the campaign, we conducted the deliquescence relative humidity (DRH) measurement for NaCl and (NH4)2SO4 to validate the HTDMA measurement. In this study, four different dry diameters of 30, 50, 100, and 150 nm were chosen as classifiers in the first DMA for hygroscopicity analysis. The hygroscopic GF and the ratio of humidified (dw) and dry (dd) particle mode diameters at a given RH can be derived from HTDMA output (Eq. 1):
In this study, we obtained the GF distribution for each dry diameter with 3 min time resolution. The experiment was repeated five times for each size. Simultaneously, the information of the mixing state was estimated from the shape of GF distribution and GF values themselves. Kim et al. (2017) suggested an aerosol type classification based on mixing state and GF values as will be briefly introduced later.
2.3 Aerosol chemical composition
Real-time measurement of size-resolved chemical composition is done with a high-resolution time-of-flight aerosol mass spectrometer (HR-ToF-AMS; Aerodyne Research Inc, USA). It is based on the highly successful design of the first generation quadrupole-based system, the Q-AMS. However, the ToF-AMS differs from the Q-AMS as the quadrupole mass filter is replaced by a time-of-flight mass spectrometer. In this study, the non-refractory (NR) PM1 (NR-PM1), particulate matter with an aerodynamic diameter smaller than 1 µm that evaporates rapidly at 600 ∘C under vacuum conditions, was collected using a PM1 cyclone (URG-2000-30EN, URG, USA). A Nafion drier (Perma-Pure, Toms River, NJ, USA) was used to dry the sampled ambient air. For calibration purposes, ammonium nitrate and polystyrene latex sphere (PSL) particles were produced by using a constant output atomizer (TSI 3936, TSI Inc., USA) from ammonium nitrate and PSL solution, respectively. Ammonium nitrate particles with 300 nm and PSL particles ranging from 50 to 450 nm were used to calibrate the ionization efficiency (IE) and particle size distribution using a DMA. Mass spectrum data were saved at 5 min resolution. A collection efficiency of 0.5 was applied to all species. The software SQUIRREL v. 1.51H and PIKA v. 1.10H were used to analyze the collected data.
For the specification of organics, a positive matrix factorization (PMF) analysis was performed using the organic compounds of submicron particles. The PMF analysis of organic matter that accounts for more than 30 % of ultra-fine particles was used to identify aerosol characteristics depending on the oxidation state. PMF results could provide information about the aging characteristic of organic matter such as the effect of direct emission or long-distance transport. The PMF Evaluation Tool (PET V 2.06) was used to analyze the mass spectrum for mass-to-charge ratios (m∕z) from 12 to 100. The modeling conditions are as follows: (1) MDL (method detection limit) equals 0.15 µg m−3; (2) down weighting of low signal-to-noise ratio (SNR; 0.2–2) data; (3) not using bad SNR (under 0.2) data; and (4) down weighting of repeated information (m∕z 44 and related m∕z values). Factor analysis was performed according to the PMF analysis procedure described by Zhang et al. (2005), and the preprocessing of input data for each step of PMF followed the method suggested by Ulbrich et al. (2009). Down weighting is a process of lowering the weight of m∕z, which may have higher noise than signal, and thereby lowering the error and Q value (Paatero and Hopke 2003). In this study, three organic aerosol (OA) factors are used: (1) hydrocarbon-like organic aerosol (HOA), (2) semi-volatile oxygenated organic aerosol (SV-OOA), and (3) low-volatility oxygenated organic aerosol (LV-OOA). Figure S1 in the Supplement shows the high-resolution mass spectra and time series of the three OA factors.
Mass concentration of black carbon (BC) was measured by the multi-angle absorption photometer (MAAP) with a PM2.5 inlet system as HR-ToF-AMS only provides information on the chemical composition of non-refractory aerosols. In this study, other refractory and semi-refractory aerosols like mineral dust and sea salt aerosols that have their own hygroscopic properties were not considered as they were likely to account for a small portion of submicron aerosols. For example, sea salt aerosol occupied less than 3 % of PM2.5 aerosols from a 24 h air sample collection period in Seoul (Heo et al., 2009). The very good κ-closure results in Fig. 3, which did not consider mineral dust and sea salt, perhaps infer that mineral dust and sea salt aerosols had little effect on the κ-closure analysis.
3.1 Temporal variation in aerosol chemical composition
Figure 1 shows the temporal variations in aerosol chemical compositions, including sulfate, nitrate, ammonium, and organics, at Olympic Park during the campaign period. The bulk mass concentration of PM1 (= NR-PM1+ BC) ranged from 4.4 to 57.1 µg m−3 with a mean value of 19.1 µg m−3, and there was substantial variation in chemical composition (Fig. 1a). Among non-refractory aerosols, organics occupied about 42.5 % of the total mass concentration of PM1 aerosols during the whole period, followed by sulfate (28.4 %), nitrate (16.3 %), ammonium (12.2 %), and chloride (0.6 %). The campaign-averaged BC mass concentration was about 2.5 µg m−3. In this study, 1300 and 1700 kg m−3 were assumed for densities of organics (Cross et al., 2007; Florou et al., 2017) and BC (Wu et al., 2013), respectively, to calculate the volume for each species. For BC, PM2.5 mass concentration is used for calculation, assuming that BC mass is mainly determined by submicron particles (e.g., Clarke et al., 2004; Wu et al., 2013). It can be said from the good agreement between predicted and measured that observed anions (, , and Cl−) are fully neutralized by (Fig. S2) and that ion species mainly existed in the form of (NH4)2SO4 and NH4NO3 (Reilly and Wood, 1969; Gysel et al., 2007). Predominant volume fractions of (NH4)2SO4 and NH4NO3 among inorganic compounds can also be found in Fig. 1b. For organics, HOA, SV-OOA, and LV-OOA accounted for 32.0 %, 8.8 %, and 59.2 %, respectively, of the total OA mass concentration during the campaign.
The chemical composition of PM1 aerosol showed substantial variation, especially for periods A and B. Organics were dominant in Period A when stagnant conditions prevailed due to persistent high atmospheric pressure and weak synoptic flow (N. Kim et al., 2018). The average ratio of organics to inorganics plus BC was 1.60±0.82, ranging from 0.48 to 3.60. The average mass concentrations of each chemical species during Period A were 7.9 µg m−3 (organic), 3.7 µg m−3 (sulfate), 2.9 µg m−3 (nitrate), 2.2 µg m−3 (ammonium), and 2.4 µg m−3 (BC). At the beginning of Period A, mass concentrations of both HOA and LV-OOA increased sharply, and that of LV-OOA remained high until 23 May (Fig. 1c). For Period B, total mass concentration increased as polluted air masses were transported directly from southwestern China, and inorganics were dominantly observed with a mean value of 0.32 for the ratio of organics ∕ inorganics plus BC. The volume fraction of inorganics reached up to 80 % during Period B. These contrasting chemical compositions of the two periods result in very different hygroscopic properties of aerosols (N. Kim et al., 2018). For example, hygroscopicity values of Period A, an organic-dominant period, were much lower than the normal period that excludes periods A and B, although particle sizes are larger than those in the normal period.
3.2 Size-resolved hygroscopicity of urban aerosols
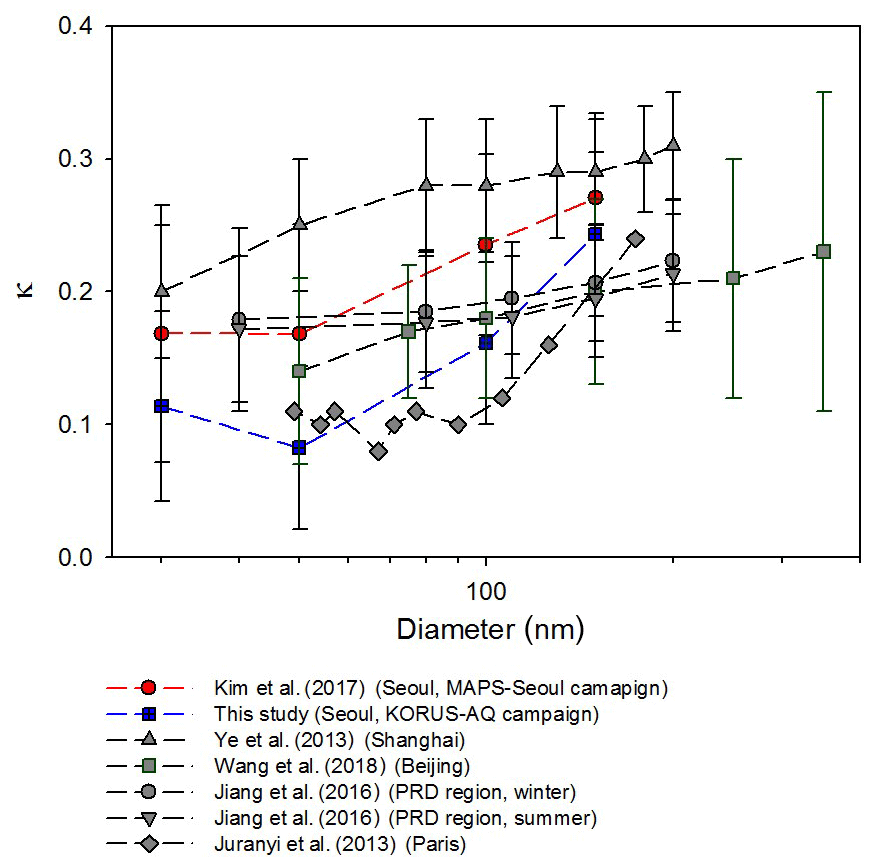
As mentioned above, size-resolved hygroscopicity for four dry diameters (30, 50, 100, and 150 nm) was measured during the campaign. The average value of κ, a representative single hygroscopicity parameter (Petters and Kreidenweis, 2007), ranged from 0.11 to 0.24 with distinct diurnal variation (N. Kim et al., 2018). Figure 2 shows the size-resolved κ values measured in SMA from the two campaigns (MAPS-Seoul and KORUS-AQ), as well as the results from some other urban measurements including Shanghai (Ye et al., 2013), Beijing (Wang et al., 2018), the Pearl River Delta (PRD) region (Jiang et al., 2016), and Paris (Jurányi et al., 2013). The κ values in the figure were derived from HTDMA GF measurements except for Paris whose κ values were derived from CCN measurements. The κ values of SMA were lower than those in Shanghai and similar to Beijing, but the lowest κ values were observed in Paris for most diameters. According to Fig. 2, most κ values increase with particle size. It is closely related to the fact that the mass fraction of inorganic species increases with increasing particle size (Fig. S3). Inorganic components measured by AMS are considered the major water-soluble chemical components influencing the hygroscopic behavior of atmospheric aerosols. Wu et al. (2016) showed an increase in the particle number fraction of the hydrophilic mode with increasing particle size, and this trend was more conspicuous for smaller particles (<150 nm). The size-dependency of κ is also shown in other environments such as the coastline in the UK (Gysel et al., 2007), forested sites in Colorado (Levin et al., 2012, 2014) and Wakayama, Japan (Deng et al., 2019), and the boreal environment in Finland (Paramonov et al., 2013). Although the Kelvin effect may cause some decrease in κ with decreasing particle size, this effect is small, less than 5 %, for particles in the diameter range of 50 to 200 nm (Swietlicki et al., 2008; Wang et al., 2018). The average κ values of urban aerosols shown in Fig. 2 are smaller than 0.3 for diameters smaller than 300 nm, implying that the suggested typical continental κ value of 0.3 by Andreae and Rosenfeld (2008) is an overestimation for these urban aerosols. Consequently, it can cause the overprediction of the CCN number concentration (NCCN) in urban areas.
3.3 The κ closure
The closure on hygroscopicity has been studied to understand the relationship between chemical composition and aerosol hygroscopicity (Chang et al., 2010; Gunthe et al., 2009; Gysel et al., 2007; Kim et al., 2017; Wu et al., 2013). The ZSR mixing rule (Eq. 2) with a volume fraction of aerosol composition is generally applied for the hygroscopicity closure:
where κchem is the κ value of the mixed particle, κi is the hygroscopicity value of the chemical component (i) in pure form and εi is the volume fraction of this chemical component. Unlike inorganic species, the hygroscopicity of organic aerosol (OA) is relatively unknown, and many estimation methods have been suggested for κ closure. In general, oxidation parameters like O∕C and f44 are used for the organic hygroscopicity. Among them, we compared the two methods suggested by Kim et al. (2017), which uses O∕C (Eq. 3), and by Mei et al. (2013) (Eq. 4), which uses f44:
For the inorganics (NH4)2SO4 and NH4NO3, κ values of 0.47 and 0.58 are applied, respectively (Gysel et al., 2007; Topping et al., 2005). BC is assumed to be hydrophobic.
Figure 3 presents the scatterplot of κHTDMA vs. κchem, which incorporates the κorg values derived from the two estimation methods above. Only 150 nm results are used for κHTDMA. The agreement between κHTDMA and κchem looks good regardless of the κorg estimation method, and therefore it can be said that such oxidation parameters are suitable to use for estimating the hygroscopicity of organic aerosols. Perhaps the similar results of the two methods were in part due to the fact that inorganic species having high κ values compared to organics occupied a major portion of the total mass. In this study, we adopted the method using f44 for further analysis because it produced better results than the method using O∕C in terms of the linear regression analysis (i.e., slope and the coefficient of determination) and the average ratio between κHTDMA and κchem values (Table S1). According to Fig. 4, however, good agreement between κHTDMA and κchem is shown only for 150 nm. As particle size becomes smaller, widely dispersed scatterplots between κHTDMA and κchem are shown. Furthermore, the overestimation of κchem is clearly shown for small particles. It is because large particles mainly determine the volume fraction in bulk chemical composition data. This result implies that size-resolved chemical composition data should be included when we analyze the relationship between hygroscopicity and chemical composition, especially for small particles.
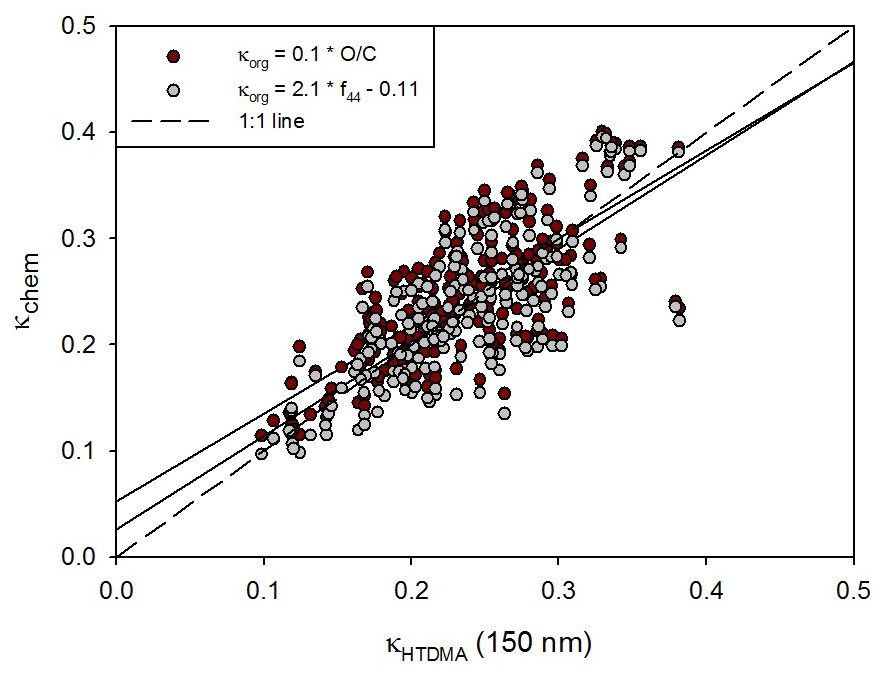
Figure 3Scatterplot between κHTDMA and κchem using two different organic κ estimation methods. The dashed line and solid line indicate the 1 : 1 line and linear regression line, respectively.

Figure 4Scatterplot between κHTDMA and κchem for four different diameters. The dashed line and solid line indicate the 1 : 1 line and linear regression line, respectively.
4.1 Size-resolved chemical composition
The importance of size-resolved chemical composition data has been manifested in the analyses of the size-resolved hygroscopicity of aerosols (Bhattu et al., 2016; Levin et al., 2014; Meng et al., 2014). However, the particle time-of-flight (P-ToF) mode for the size-resolved species cannot provide sufficient information of mass size distribution directly because of the relatively low signal-to-noise ratio compared to the bulk mass concentration from the mass spectrum (MS) mode. Instead, reconstructed size-resolved mass concentration is applied which combines with a bulk mass concentration from the MS mode and a size-resolved mass distribution from the P-ToF mode for individual species as described in Eq. (5) (Thalman et al., 2017):
where Mi,b is the bulk mass concentration from MS mode measurements for chemical species i and ) is the average mass size distribution for chemical species i with respect to log Dp. Dp,max and Dp,min indicate the maximum and minimum diameters of the average mass size distribution, respectively. The average mass size distribution for the whole campaign period is shown in Fig. S3; from now on, the reconstructed mass size distribution is denoted as “size-resolved” for simplicity. It is noted that size-resolved composition data for particles smaller than 70 nm are excluded due to high uncertainties. According to Fig. S3, the mass fraction of organics increases as the particle diameter decreases as expected. Notably, organics occupied more than 70 % of aerodynamic diameters smaller than 150 nm. In other words, specified organic factor information should be included, especially for small particles, to analyze the size-resolved aerosol hygroscopicity.
4.2 Size-resolved organic factors
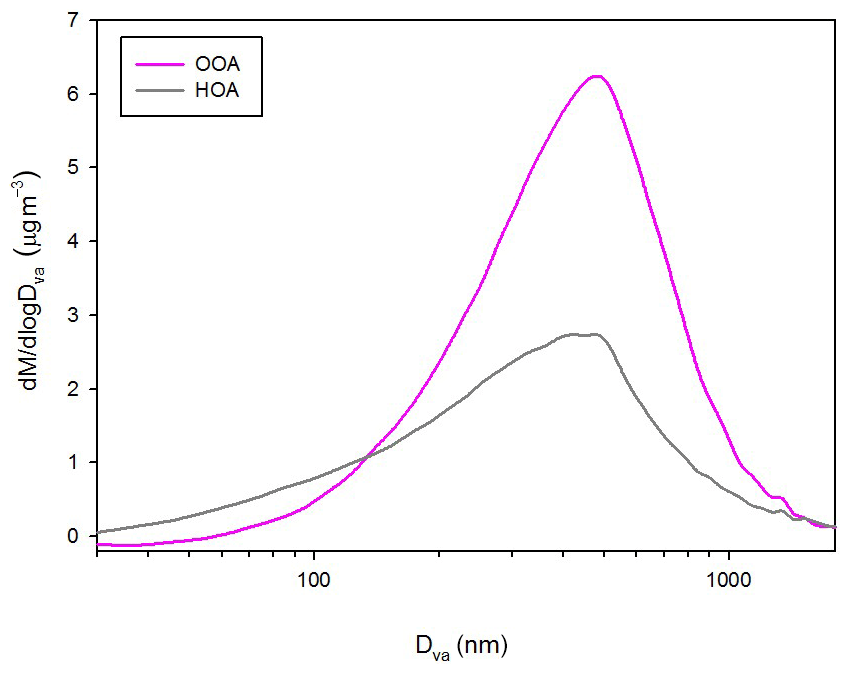
Zhang et al. (2005) proposed a technique that uses m∕z 57 and 44 as AMS mass spectral markers to quantify the mass concentrations of HOA and OOA (= SV-OOA + LV-OOA) using highly time-resolved organic mass spectra obtained with HR-ToF-AMS. The tracer m∕z 44, most likely , is known to be a major oxygenated organic species in AMS mass spectra and often increases in the afternoon when the photochemical reaction is active (Alfarra et a., 2004; Zhang et al., 2005), whereas m∕z 57, most likely , is known to be a major species in mass spectra of hydrocarbon, which is associated with combustion exhaust and often increases at rush hour (Allan et al., 2004, 2003; Alfarra et al., 2004; Canagaratna et al., 2004). Good correspondences between m∕z 57 and HOA and between m∕z 44 and OOA for bulk chemical data (not shown) support these assumptions. Although m∕z 43 is also known to show a prominent peak for combustion exhaust like m∕z 57, it is also influenced by oxygenated organic aerosols (C2H3O+), and perhaps that is the reason why the correlation with HOA is not as good as that between HOA and m∕z 57 (Fig. S4). Size-resolved organic factors are reconstructed by multiplying a number for each size bin. This number for each reconstructed HOA and OOA is the slope of the linear regression between each organic factor (HOA and OOA) and m∕z (57 and 44) from bulk mass concentration. The slopes of the linear regressions are 35.29 and 7.89 for HOA and OOA, respectively. Each reconstructed organic factor is well correlated with the measured one, and the reconstructed organic mass concentration (= HOA + OOA) shows a good correspondence with measured bulk organic mass concentration (Fig. S5). In other words, organic mass concentration in this study can be explained substantially by the two organic factors. Also, m∕z 57 and 44 can be considered first-order tracers of the two major organic components. The correlation coefficient between measured and reconstructed HOA is slightly lower than that of OOA (Fig. S5) because the contribution of m∕z 57 to HOA varies depending on time and/or sources, whereas m∕z 44 contains a broader range of OOAs. Figure 5 shows the campaign-averaged size distribution of reconstructed HOA and OOA (from now on, “reconstructed” HOA and OOA are just called as HOA and OOA in short.). The mode diameter of OOA is somewhat larger than that of HOA. The mass fraction of HOA is larger than that of OOA for small particles (<120 nm), but the opposite is true for larger particles (>120 nm).
4.3 Size-resolved chemical effect on hygroscopicity
Figure 6 presents the campaign-averaged size-resolved volume fraction of chemical species with size-resolved κ values. For direct comparison between aerosol hygroscopicity and chemical composition, the conversion of diameter is essential due to different particle sizing techniques (i.e., mobility diameter, dm, for HTDMA and vacuum aerodynamic diameter, dva, for AMS). Under the assumption of a spherical particle, dva can be converted into dm with density information as described in Eq. (6) (DeCarlo et al., 2004):
where ρp is the particle density and ρ0 is the standard density (1000 kg m−3). In this study, 1300 kg m−3 is used as the particle density since organics are the most dominant chemical composition in the particle size range of hygroscopicity measurements. As mentioned above, the κ value of 30 nm particle is excluded due to high uncertainties. Densities of chemical species are assumed for the calculation of the volume fraction: 930 kg m−3 (HOA), 1500 kg m−3 (OOA), and 1769 kg m−3 (inorganics). For small particles, the volume fraction is dominated by organics (= HOA + OOA), and HOA, widely known to be hydrophobic, comprises more than 50 %. However, the volume fraction of inorganics, which is hygroscopic, increases as particle size increases. Among organics, a sharp decrease in HOA volume fraction and an increase in OOA with size are clearly shown. These results support the size-dependent hygroscopicity. Moreover, the dominant organic volume fraction for small particles (dva<100 nm) manifests the importance of size-resolved organic factors to explain the variation in hygroscopicity. Figure 7 illustrates the diurnal variation in κ with the chemical composition for 50 and 150 nm particles. For 50 nm (Fig. 7a), HOA comprised more than 50 % of the chemical composition, and the two organic factors showed considerable temporal variation compared to inorganics. The volume fraction of HOA increased slightly at rush hour (07:00–09:00 LT) and decreased gradually after midday until 18:00 LT. Conversely, the volume fraction of OOA decreased in the morning and increased in the afternoon when the photochemical reaction is active. It is consistent with the diurnal variation in κ, showing the relatively low values in the night hours and high values in the late afternoon. On the other hand, for 150 nm (Fig. 7b) the chemical compositions showed little variation. Therefore, it can be said that the effect of chemical composition on the diurnal variation in κ is more sensitive for small particles than for large particles. Such results demonstrate that, without proper specification of organic factors, it is difficult to explain the diurnal variation in κ. Also noted is that κ variation for small particles is mostly affected by the volume fraction of organics rather than that of inorganics.
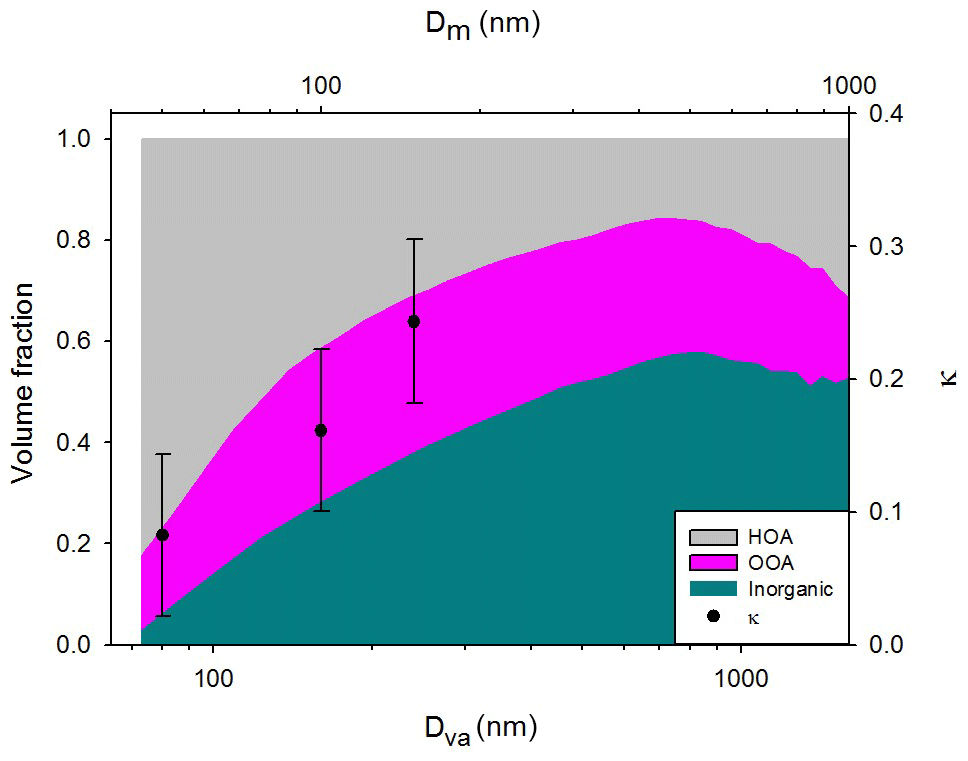
Figure 6Campaign-averaged size-resolved volume fraction of chemical species with κ values (κHTDMA) for 50, 100, and 150 nm (mobility diameter, Dm, for κ values is converted to aerodynamic diameter, Dva, for comparison).
As mentioned above, oxidation parameters such as f44 and O∕C ratio are appropriate to use for indicating organic hygroscopicity, and thereby several estimation methods using them have been proposed (e.g., Chang et al., 2010; Cerully et al., 2015; Kim et al., 2017; Mei et al., 2013; Hong et al., 2018). Notably, the estimation method using f44 (bulk data) produces a good correlation between measured and estimated κ as shown in Fig. 3. The increase in f44 value is known to be the result of photochemical oxidation. The size-dependent κ is also reflected in the degree of oxidation, as can be seen from the increase in size-resolved f44 with increasing particle diameter (Fig. 8a). The positive relationship between size-resolved f44 and κ values for 50 nm particles (Fig. 8b) also shows that the oxidation of organics affects the hygroscopic properties of particles. It is noted that data for which the volume fraction of organics is larger than 0.7 were only used to exclude the effect of inorganics. Figure 9 presents scatterplots between κorg (30, 50, and 150 nm) and volume fraction of HOA and OOA among organics. The κorg value is calculated by subtracting the inorganic part from κHTDMA. As expected, the volume fraction of HOA was negatively correlated with κ values, whereas that of OOA was positively correlated with κ values for all sizes of particles. These results demonstrate that the specification of the size-resolved organic factor is an indispensable part in describing the relationship between size-resolved hygroscopicity and the chemical composition of aerosols. It is noted that κorg in Fig. 9 is an estimated value with a simple assumption (see figure caption) to show the relationship between size-resolved organic factors and hygroscopicity. Negative κorg appears when κinorg is high even if the volume fraction of inorganics is low (i.e., low εinorg).
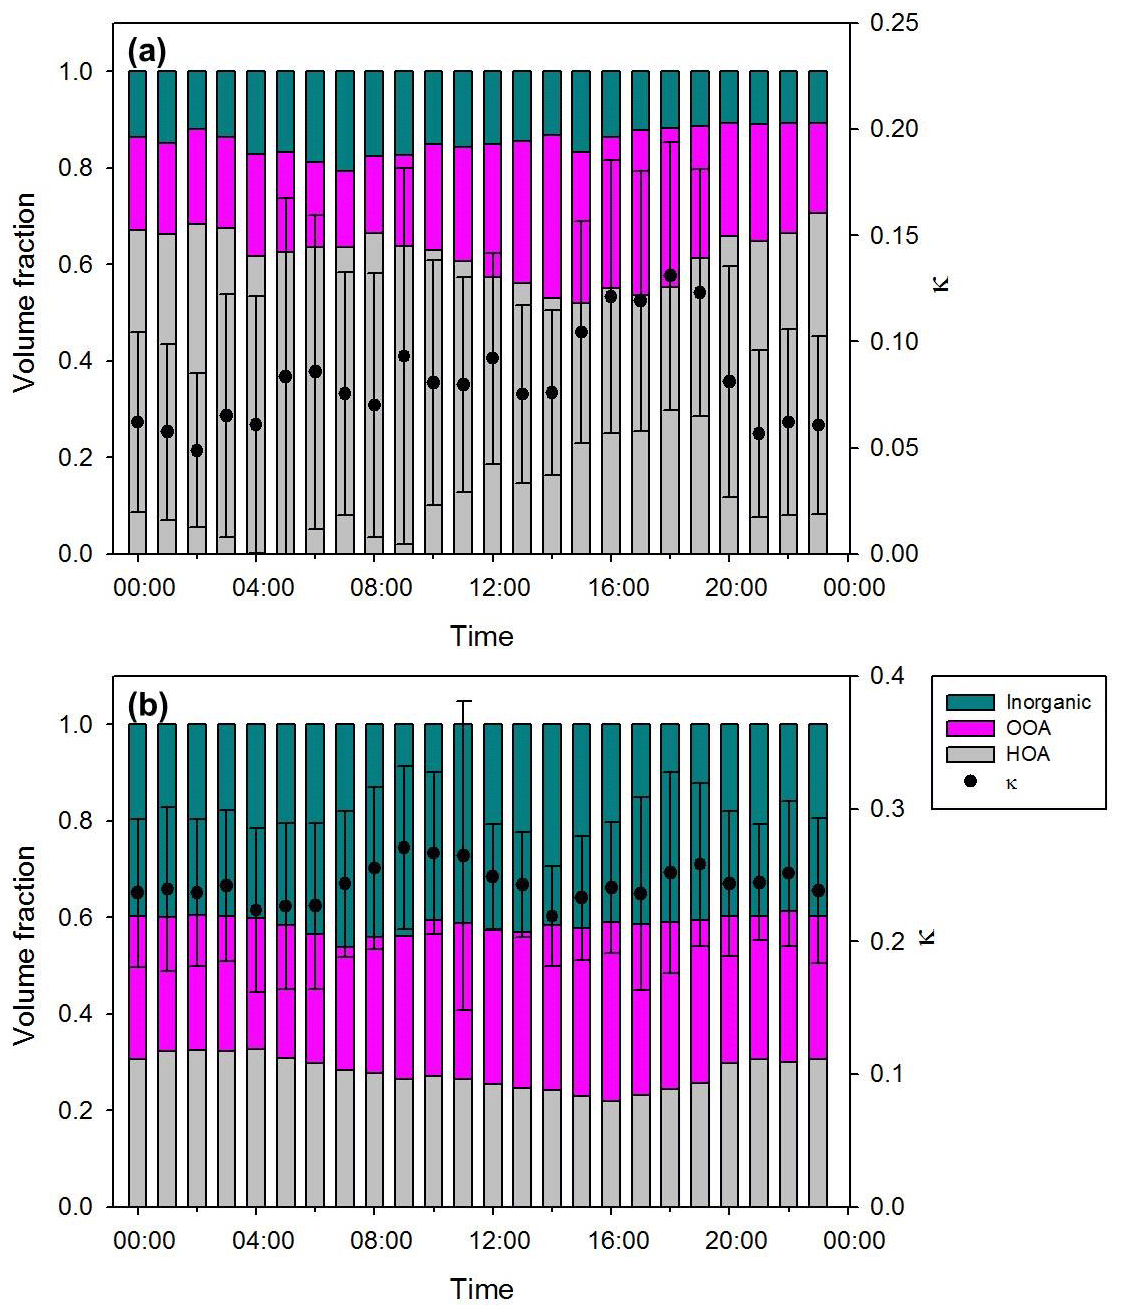
Figure 7Diurnal variation in κ values (κHTDMA) and chemical composition of (a) 50 nm and (b) 150 nm particles.
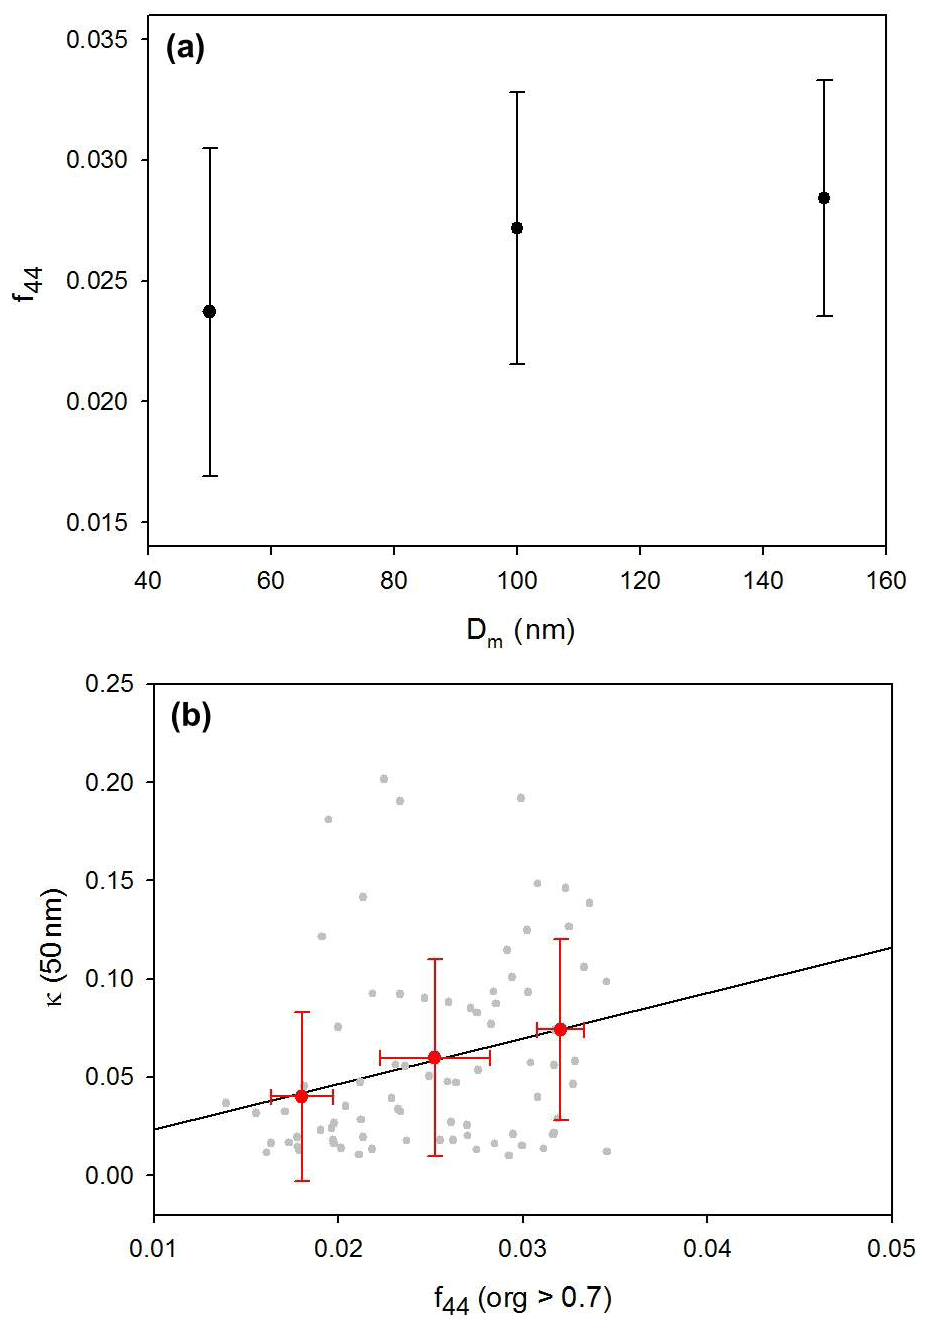
Figure 8(a) Size-resolved f44 and (b) relationship between f44 and κ values (κHTDMA) for 50 nm particles (the f44 values are only used when the organic volume fraction is higher than 0.7). Red dots and bars indicate average and standard deviations for each of the 0.01 interval bins.
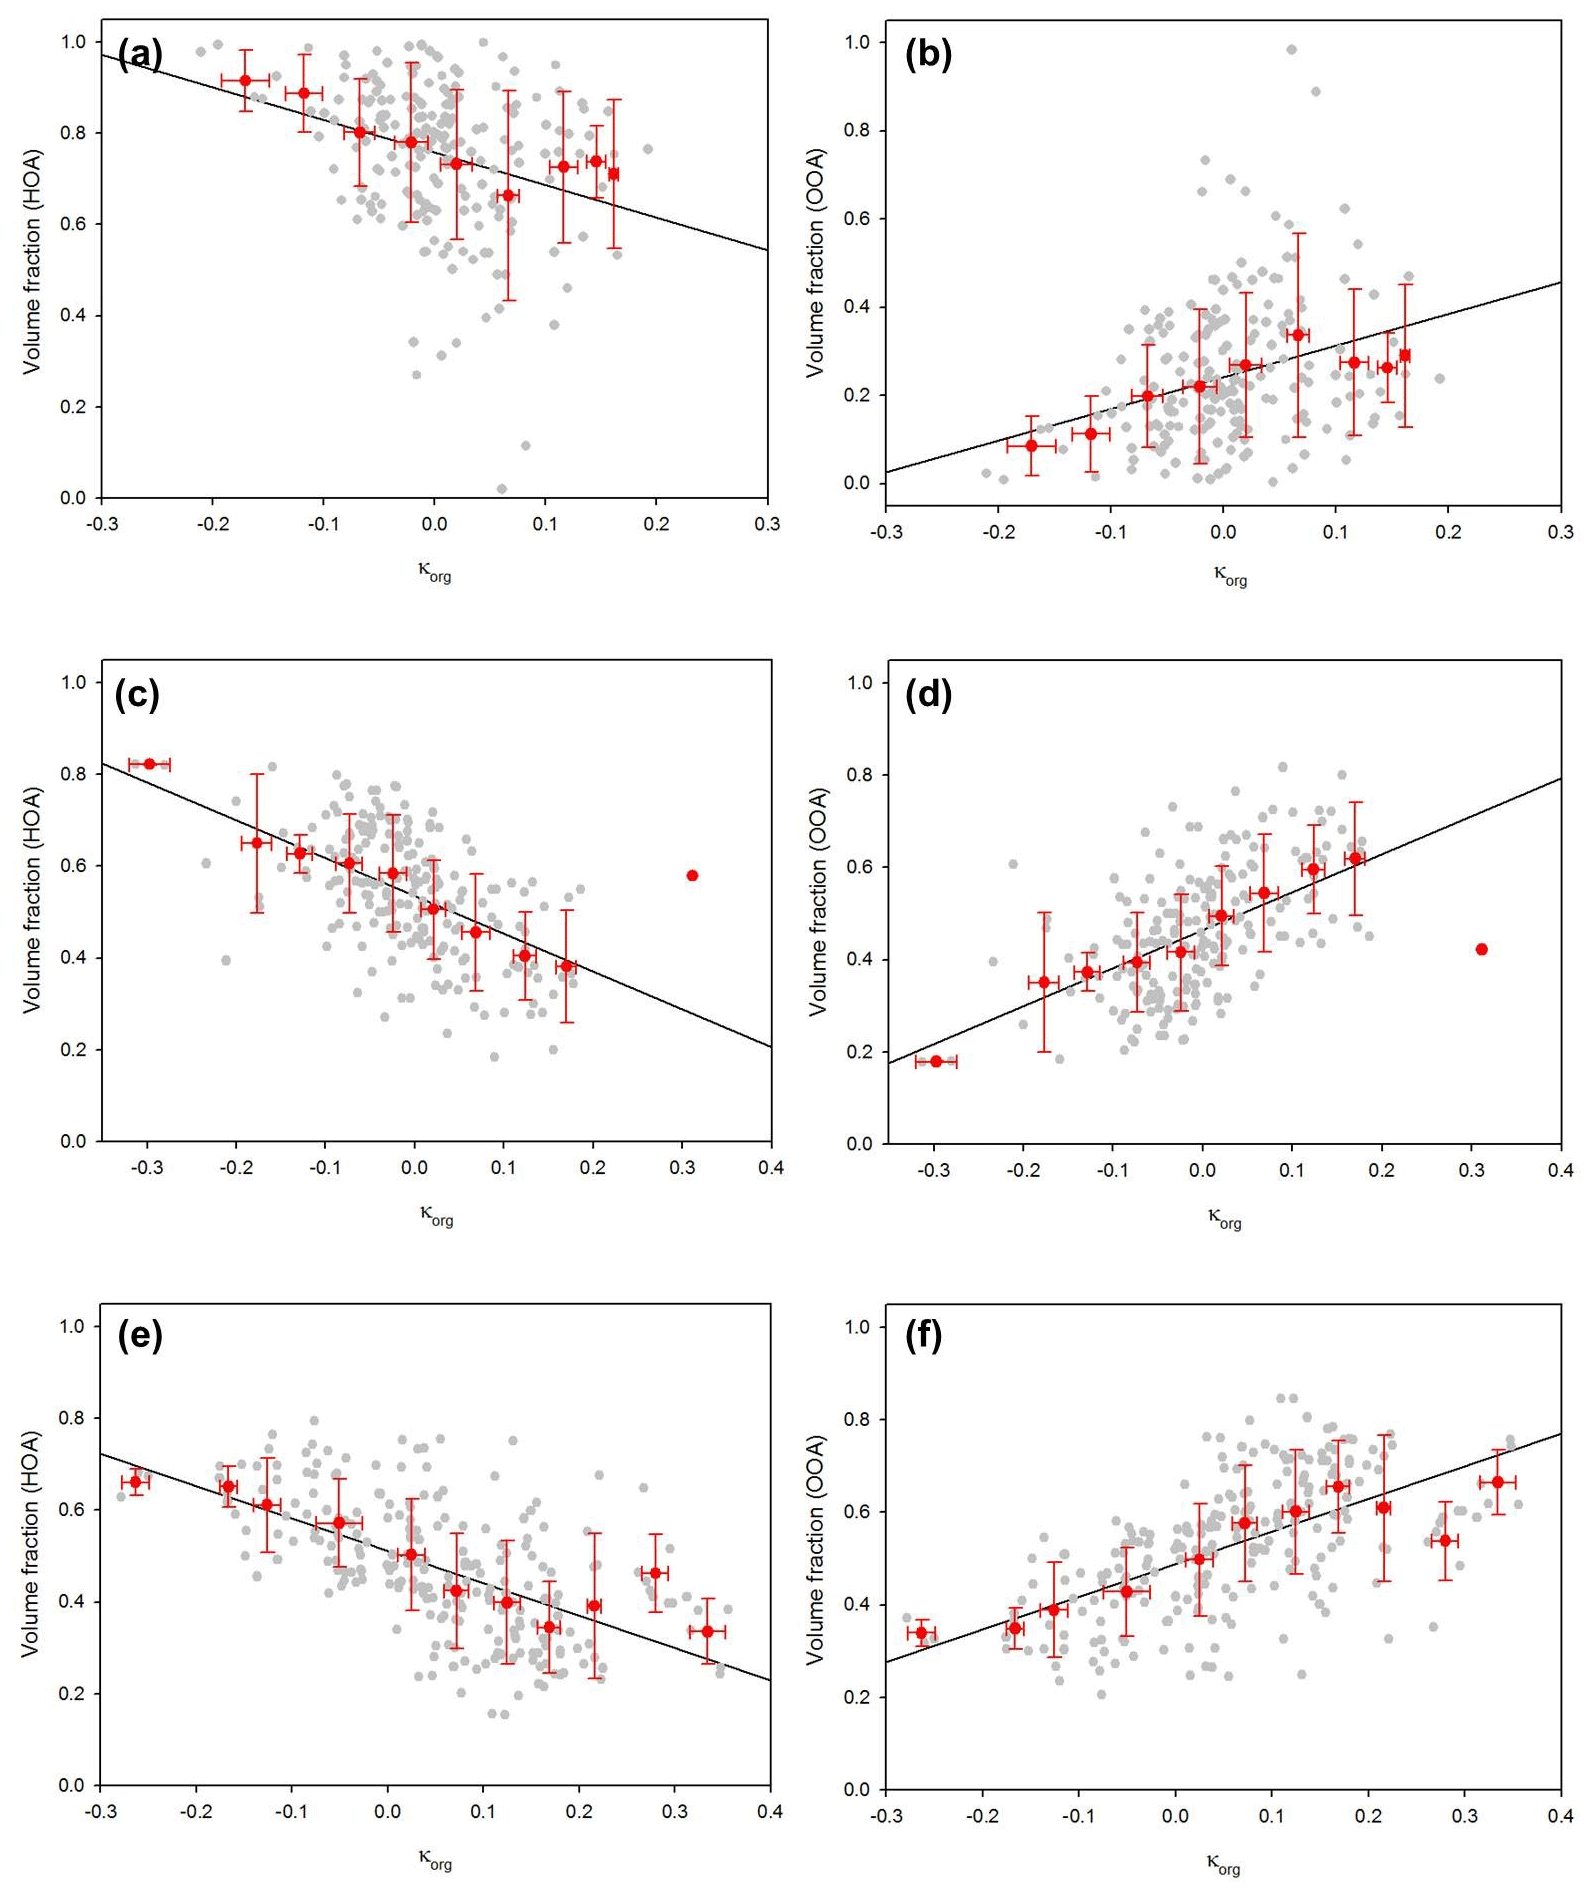
Figure 9Scatterplot of κorg vs. volume fraction of HOA (a, c, e) and OOA (b, d, f) among organics for 50 nm (a, b), 100 nm (c, d), and 150 nm (e, f) dry diameters. κorg is calculated as follows: , where ε indicates the volume fraction of each component.
4.4 Relevance to mixing state
HTDMA measurement data can provide information on the mixing state of atmospheric particles, i.e., external or internal mixing. We can also infer the extent of the chemical mixing of particles from this information (Swietlicki et al., 2008). External mixing was prevalently observed in Seoul during the MAPS-Seoul (2015) and the KORUS-AQ (2016) campaigns (N. Kim et al., 2017, 2018) like in other urban regions (Enroth et al., 2018; Wang et al., 2010; Hong et al., 2018). Kim et al. (2017) suggested an aerosol type classification based on the GF values and the mixing state information taken from the HTDMA GF distribution data (dN∕dlog (GF)): Type 1 is externally mixed aerosols, and fewer and more hygroscopic particles are externally mixed; Type 2 is internally mixed aerosols with GF greater than 1.1, and all particles are more hygroscopic; and Type 3 is internally mixed aerosols with GF less than 1.1, and all particles are less hygroscopic. Figure 10 presents the schematic plot of three aerosol types. To determine the mixing state, the position, height, and width of each peak for HTDMA data are computed with the peakfit function for MATLAB®, which performs a least-square curve fit of a Gaussian function to the top part of the peak (O'Haver, 2016).
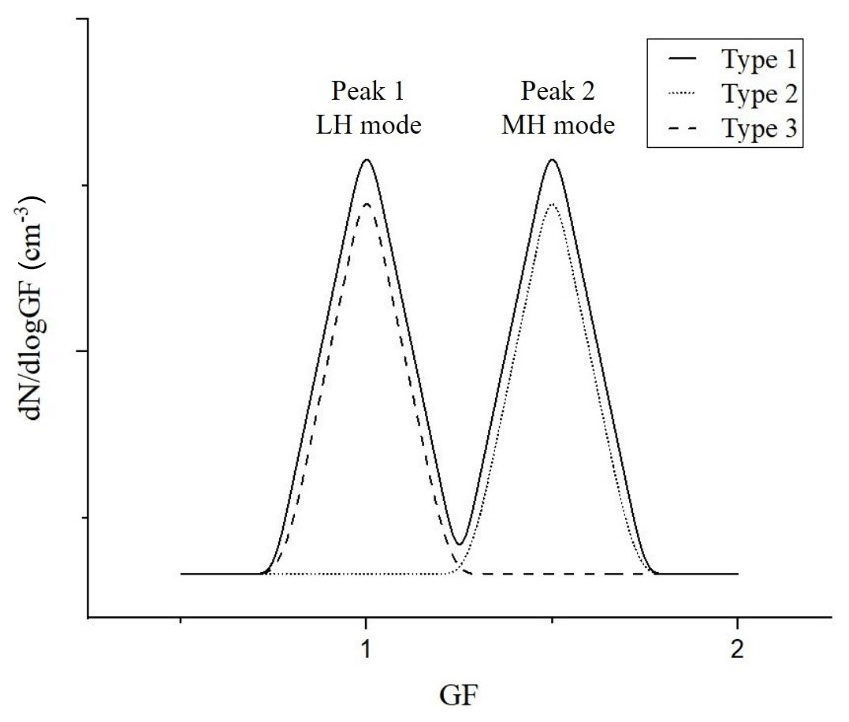
Figure 10Schematic plot of three aerosol types: Type 1 (externally mixed aerosol; solid line), Type 2 (internally mixed aerosols with GF >1.1; dotted line), and Type 3 (internally mixed with GF <1.1; dashed line).
For externally mixed particles (Type 1), the GF distributions were mostly bimodal, and trimodal or higher modal distributions were only occasionally observed (less than 3 % of total measurement cases). So, it is safe to assume that externally mixed particles are bimodal. Then the first peak (denoted as Peak 1) in the GF distribution is defined as the less hygroscopic (LH) mode that usually has GF values lower than 1.1, and the second peak (denoted as Peak 2) is defined as the more hygroscopic (MH) mode that has GF values larger than 1.1. During the measurement period, Type 1 (externally mixed) aerosols were predominantly observed (higher than 70 %) in large particles (100 and 150 nm), whereas Type 3 (internally mixed with the LH mode) aerosols occupied more than 50 % of all aerosols in small particles (30 and 50 nm) (Table S2). We also found that mixing state had a distinct diurnal pattern, as depicted in Fig. S6. Briefly, for small particles, Type 3 aerosols prevailed all day except in the afternoon (12:00–18:00 LT) when a significant portion of the aerosols turned into Type 2. For large particles, externally mixed aerosols (Type 1) dominated, especially during rush hour (07:00–09:00 LT) when hydrophobic particles emitted from traffic mix with preexisting large and aged particles. In the afternoon, a mixing state change occurred in both small and large particles due to the photochemical processes. At night, however, no such change occurred as there was no photochemical process.
Table 1The area ratio, GF value, and κ value for the less hygroscopic (LH) mode and more hygroscopic (MH) mode for four dry diameters for all three types of aerosols.
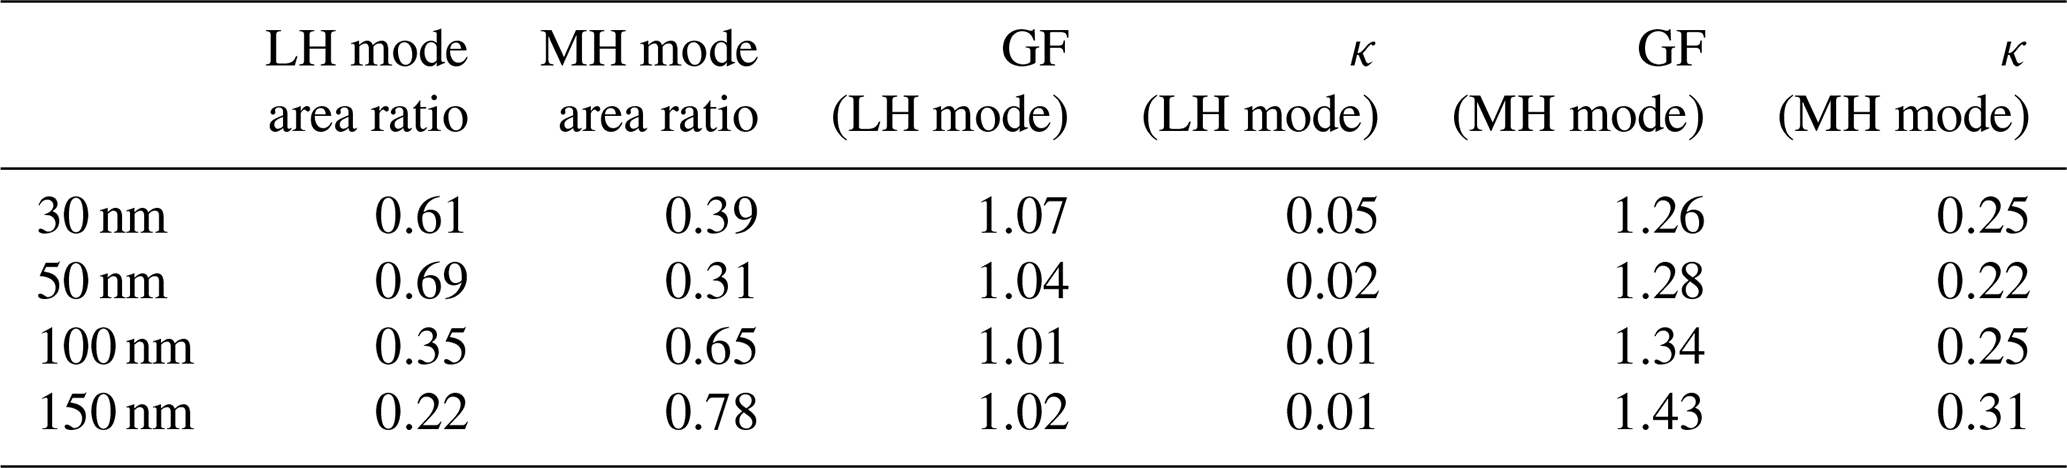
Table 2The area ratio, GF value, and κ value for the less hygroscopic (LH) mode and more hygroscopic (MH) mode for four dry diameters for only Type 1 (externally mixed) aerosol.
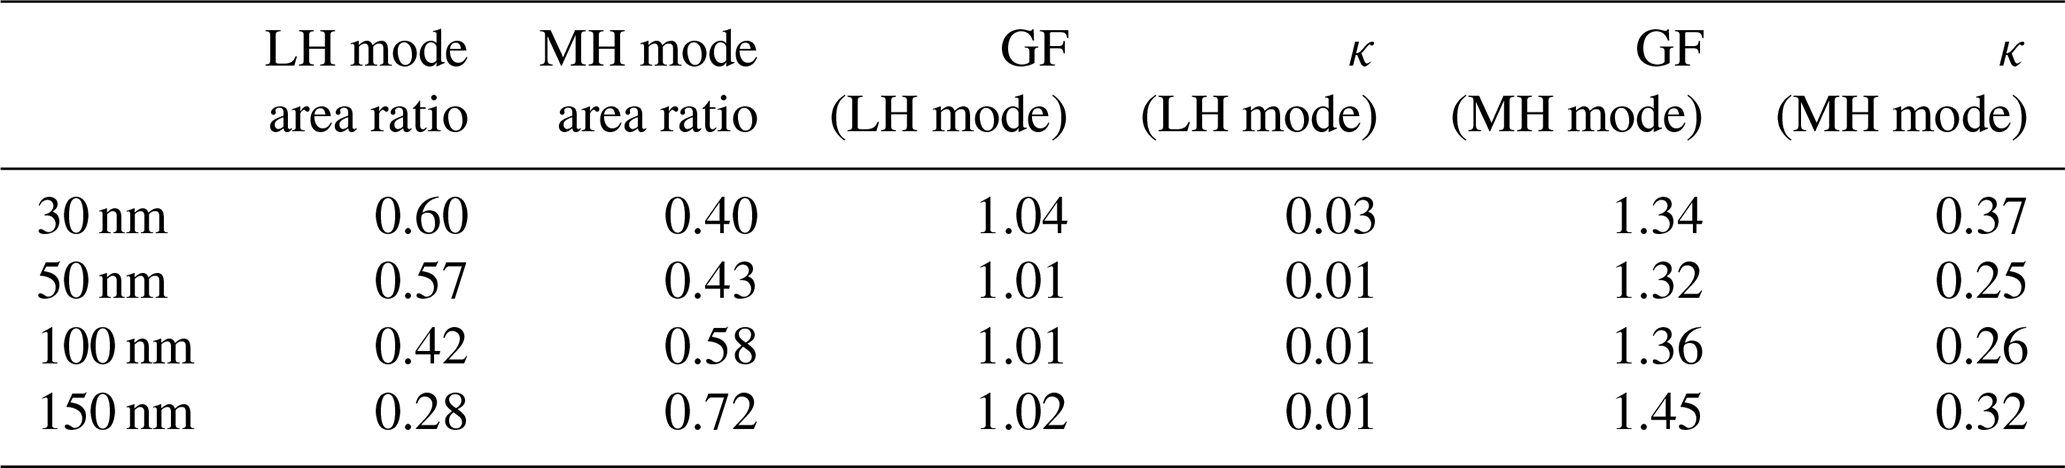
Table 1 presents the area ratio, GF, and κ value of LH and MH modes for the four different dry diameters. The area ratio of each mode is directly related to the number fraction of each mode as the area is calculated by integrating the GF distribution, dN∕dlog (GF), for each mode. The results in Table 1 contain all three types of aerosols. The LH mode includes Peak 1 of Type 1 (externally mixed) aerosols and all Type 3 (internally mixed and non-growth) aerosols. The MH mode includes Peak 2 of Type 1 aerosols and all Type 2 (internally mixed and growth) aerosols. The area ratio of the LH mode is substantially high for small particles compared to MH mode, and the area ratio of MH mode becomes larger as particle size increases. It is directly connected to the size-dependency of κ. The GF value of the MH mode increases as particle size increases. Table 2 shows only the Type 1 (externally mixed) aerosols for comparison. An increasing trend of MH mode area ratio and GF value with increasing diameter is similar to the results in Table 1. However, GF values of MH mode particles are slightly higher than those in Table 1, especially for smaller diameters (30, 50 nm). It can be explained by the fact that Type 2 (internally mixed and growth) aerosols usually had lower GF values than the MH mode aerosol of Type 1 (externally mixed) aerosols. During the campaign, the number fraction of Type 2 aerosols was the highest in the afternoon, whereas that of Type 3 aerosols was the lowest at that time for all diameters (N. Kim et al., 2018). Moreover, a bimodal GF distribution, implying Type 1, in the morning mostly changed to unimodal in the afternoon (Fig. S6). It can be inferred that less hygroscopic particles gained hygroscopicity due to the quick coating by secondary hygroscopic species and that the LH mode disappeared as the day went on. H. Kim et al. (2018) suggested from the strong correlation between OOA and Ox that the photochemical reaction occurred actively in the afternoon during the campaign period. Although the GF value of hydrophobic particles increased by coating and GF distribution changed from bimodal to unimodal, the GF values of coated particles (Type 2) were still slightly lower than those of the existing hygroscopic particles, the MH mode of Type 1 aerosols.
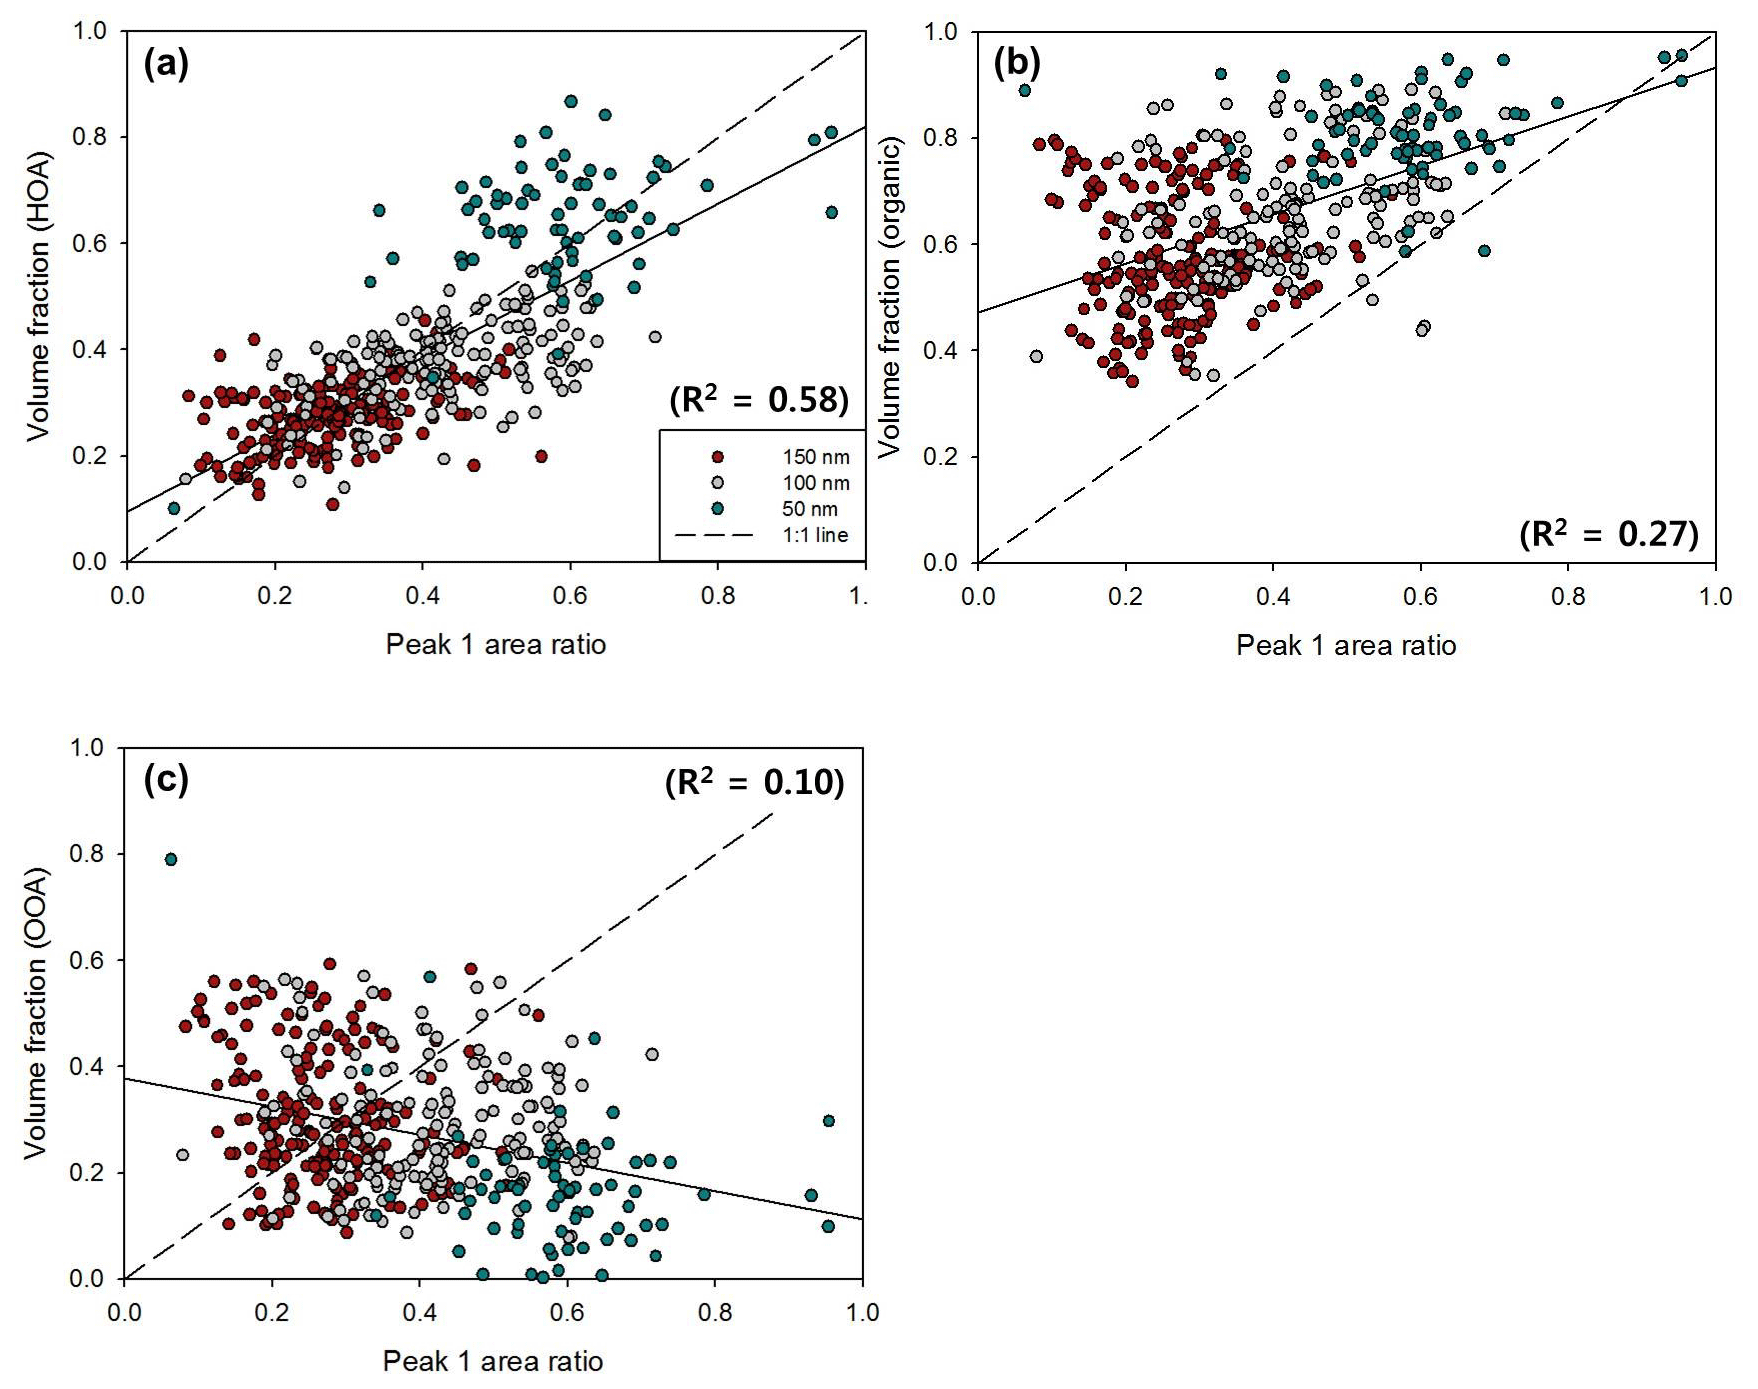
Figure 11Scatterplots between Peak 1 (LH mode) area ratio and volume fraction of (a) HOA, (b) organics (HOA + OOA), and (c) OOA for 50 nm (turquoise), 100 nm (gray), and 150 nm (red) particles. The dashed line and solid line represent the 1 : 1 line and linear regression line, respectively. The coefficient of determination (R2) of each scatterplot is indicated.
For NCCN prediction, several studies have considered the mixing state of aerosols with chemical species data (e.g., Bhattu and Tripathi, 2015; Ervens et al., 2010; Ren et al., 2018; Wang et al., 2010). For externally mixed aerosols, chemical species can be divided into two modes, LH and MH mode, based on their hygroscopic properties. In general, BC and organics (or only HOA) are classified in the LH mode, whereas inorganics and OOA are classified in the MH mode in externally mixed aerosols. In this study, we identify and quantify chemical species of each mode for externally mixed aerosols with GF distribution data and size-resolved chemical data to understand the relationship between the mixing state and chemical composition of atmospheric aerosols. Figure 11 shows the scatterplot of the Peak 1 (LH mode) area ratio vs. the volume fraction of each chemical species for different diameters. As mentioned above, the area ratio of each mode in the GF distribution (dN∕dlog (GF)) corresponds to the number fraction of particles in each mode and thereby can be compared directly with the volume fraction of each chemical species for a diameter. Note that only the observed externally mixed aerosols (Type 1) are used for comparison. The volume fraction of HOA is positively correlated with the Peak 1 area ratio (Fig. 10a) when all sizes are combined but not for each diameter. The slope between them and the coefficient of determination (R2) were 0.73 and 0.58, respectively. In other words, the HOA volume fraction can explain about 58 % of the variation in the number fraction for the LH mode in externally mixed aerosols. We can infer that the unexplained part can be complemented by BC, which is known to be hydrophobic. Unfortunately, size-resolved BC is not available in this study. The results in Fig. 10b (LH mode vs. volume fraction of organics) and Fig. 10c (LH mode vs. volume fraction of OOA) also support this speculation. The volume fraction of all organics, including both HOA and OOA (Fig. 10b), is much higher than the number fraction of the LH mode. Furthermore, a negative and even weak correlation was shown between the volume fraction of the OOA and the Peak 1 area ratio (Fig. 10c).
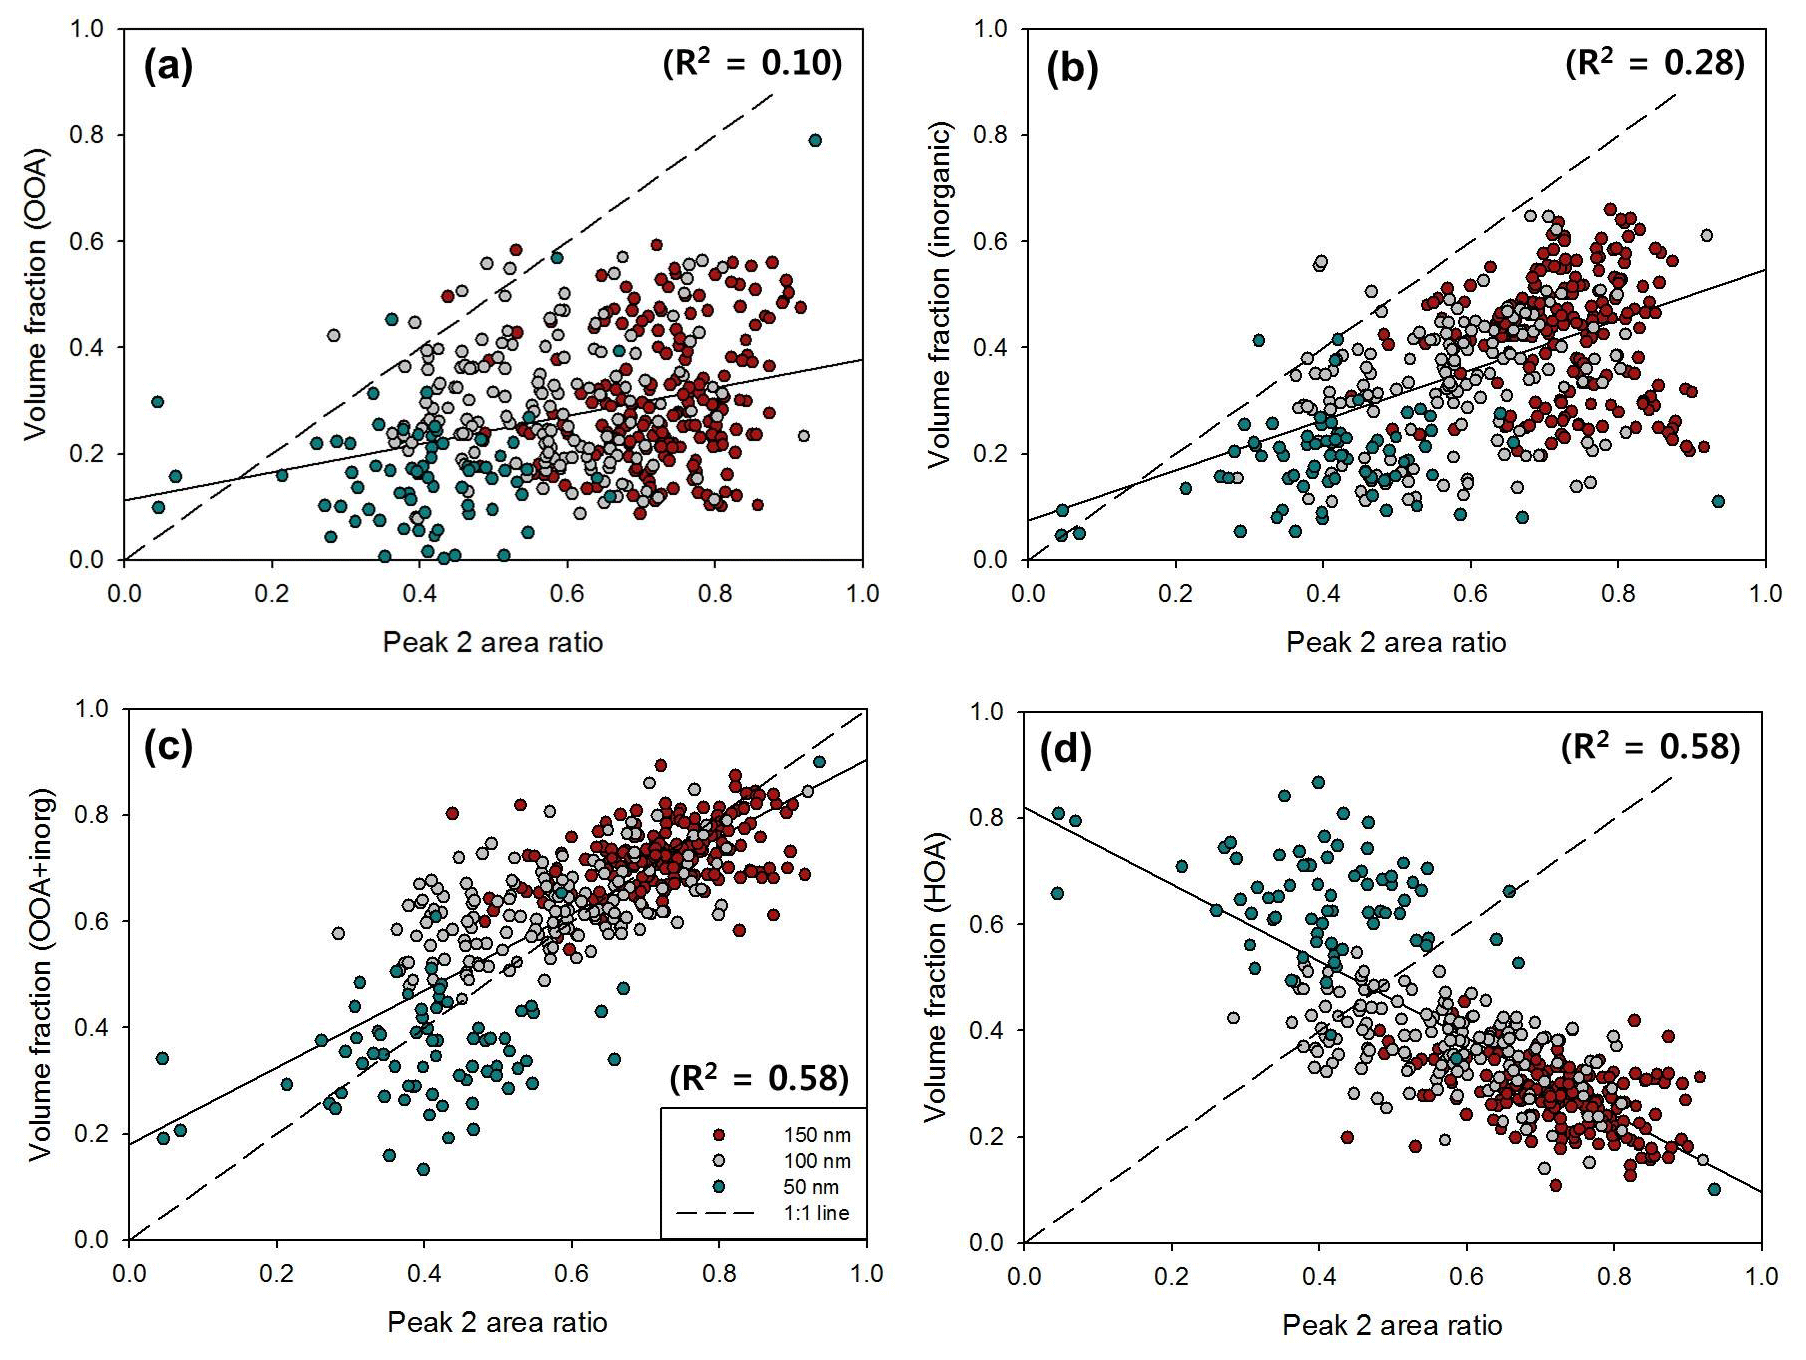
Figure 12Scatterplots between Peak 2 (MH mode) area ratio and volume fraction of (a) OOA, (b) inorganics, (c) OOA plus inorganics, and (d) HOA for 50 nm (turquoise), 100 nm (gray), and 150 nm (red) particles. The dashed line and solid line represent the 1 : 1 line and linear regression line, respectively. The coefficient of determination (R2) of each scatterplot is indicated.
For Peak 2 (MH mode), OOA (Fig. 12a) and inorganics (Fig. 12b) did show a positive correlation with the Peak 2 area ratio, but it was not strong enough to explain a significant portion of the MH mode. The sum of OOA and inorganic volume fraction (Fig. 12c) can explain a significant portion of MH mode variation in externally mixed aerosols, whereas a negative correlation is clearly shown between the volume fraction of HOA and the Peak 2 area ratio (Fig. 12d). For individual diameters, correlations tended to be stronger for larger (100 and 150 nm) rather than smaller (50 nm) diameters. It is related to the fact that there are high uncertainties in size-resolved chemical composition data for small diameters. Nevertheless, by implication these results demonstrate that the HTDMA and HR-ToF-AMS dataset could successfully explain connections between aerosol composition and hygroscopic mode (i.e., mixing state) and their relative contributions. Specifically, the volume fraction of HOA (and BC) can explain a major portion of the number fraction of LH mode particles. For the MH mode, the volume fraction of the sum of OOA and inorganics can explain the number fraction of MH mode particles. During the campaign, externally mixed aerosols (Type 1) were observed during about 50 % of the total period, meaning that LH mode particles (i.e., HOA) and MH mode particles (i.e., inorganics and OOA) were externally mixed in the atmosphere half of the time during the campaign.
This study investigated the chemical effects on size-resolved hygroscopicity of urban aerosols based on the KORUS-AQ field campaign data. Mainly, information on size-resolved hygroscopicity and the mixing state of aerosols for four dry diameters (30, 50, 100, and 150 nm) was obtained by HTDMA. During the campaign period, the averaged mass concentration of PM1 aerosols was 19.1 µg m−3, and observed anions were fully neutralized by . On average, organics occupied more than 40 % of the mass concentration for non-refractory aerosols. Among three organic factors (HOA, SV-OOA, and LV-OOA) analyzed by PMF analysis, OOA accounted for 66.4 %. Substantial differences in aerosol chemical composition were shown in the two specific periods, the organic-dominant period (Period A), and the inorganic-dominant period (Period B), and these differences affected the aerosol hygroscopicity of each period. The averaged κ values ranged from 0.11 to 0.24, and, as in other urban regions, κ clearly showed size-dependency. Estimated κ values calculated with bulk chemical composition data and oxidation parameters, f44 and O∕C (κchem), showed good correspondence with measured κ values (κHTDMA) for 150 nm particles. It implies that chemical composition is closely associated with aerosol hygroscopicity, and such oxidation parameters are suitable for representing the hygroscopicity of organic aerosols. However, for small particles, such a good relationship was not shown between κHTDMA and κchem due to the fact that bulk chemistry might have been determined mainly by larger particles that might not have the same chemical composition of small particles.
These results emphasize the importance of size-resolved chemical composition data for examining the relationship between chemical composition and aerosol hygroscopicity, especially for small particles. Furthermore, the size-resolved organic factor information is essential as organic particles are mostly small. The m∕z tracer method is applied in this study to obtain size-resolved organic factors. The tracers m∕z 57 and m∕z 44 are used as AMS spectral markers for HOA and OOA, respectively. According to the campaign-averaged size-resolved volume fraction, the volume fraction of inorganics, which are known to be hygroscopic, increases as particle size increases. For organics, a decrease in HOA and an increase in OOA are shown as particle size increases, which supports the size dependency of aerosol hygroscopicity. Particularly, the size-resolved organic factor can give a detailed explanation of the diurnal variation in κ for small particles. Low κ in the morning is associated with the large volume fraction of HOA, whereas high κ in the afternoon is related to the large volume fraction of OOA. Scatterplots of the volume fraction of organic factors vs. κ values clearly illustrate that chemical composition is closely associated with the hygroscopic properties of aerosols not only for large particles but also for small particles.
Lastly, the characteristics of the mixing state of aerosols were investigated in association with size-resolved chemical composition data. Externally mixed aerosols were observed about 50 % of the time during the campaign period, especially for large particles. Importantly, the number fraction and GF value of the MH mode increased as particle size increased. The relationship between the number fraction of each hygroscopicity mode and volume fraction of different chemical composition is analyzed. For example, the HOA volume fraction comprised about 60 % of the variation in the LH mode number fraction for externally mixed aerosols. It can be inferred that the volume fraction of BC can explain the rest. On the other hand, the chemical composition of the MH mode can be explained by the sum of inorganics and OOA rather than the volume fractions of OOA and inorganics. Unlike previous studies that used the hygroscopicity of ensemble particles without mixing state information, such a relationship between the chemical composition, mixing state, and hygroscopicity of atmospheric particles can be of crucial use in accurate NCCN prediction.
It can be concluded that size-resolved chemical composition data did provide more detailed and essential information than bulk data, which are greatly needed when examining the relationship between chemical composition and hygroscopic properties of aerosols, as well as the mixing state. Specified organic factors were found to be critically important mainly in estimating the hygroscopicity of small particles as organics occupied a significant portion of these particles. Although the two OA factors, HOA and OOA, can represent the total organic mass concentration and can also explain the variability of κ reasonably well, a more detailed analysis can be made when more spectral tracers are added to derive subdivided organic factors. Of note is that organic aerosols do not always behave ideally and show an apparent discrepancy in hygroscopic growth between subsaturated and supersaturated conditions (Petters et al., 2009; Wex et al., 2009). If hygroscopic growth were measured under supersaturated conditions, the estimated hygroscopicity parameter would be significantly higher than those estimated in this study under subsaturated conditions due to the contribution of the enhanced hygroscopic growth of organic components of aerosols. This would surely affect the CCN prediction results, but it is uncertain how much that would be at this point. Perhaps, however, the overestimating tendency of κchem shown in Fig. 4 may be reduced as the measured κ would become higher. The results presented here were obtained during the spring and summer season. It would be very informative to make the observations during other seasons to find seasonal variability, especially during the winter season when aerosol properties and meteorological conditions would be so much different from spring and summer. Our future work includes such an endeavor.
KORUS-AQ data are available via https://espo.nasa.gov/korus-aq/content/KORUS-AQ (last access: August 2019), KORUS-AQ project team members, 2020; https://doi.org/10.5067/Suborbital/KORUSAQ/DATA01 (Aknan and Chen, 2019).
The supplement related to this article is available online at: https://doi.org/10.5194/acp-20-11245-2020-supplement.
NK carried out the observation, analyzed the data, and wrote the paper. SSY acquired funding for the study, contributed to the analysis of the data, and edited the paper. MP contributed in carrying out the observations and analyzing the data. JSP, HJS, and JYA provided HR-ToF-AMS data. All authors discussed the results and read and commented on the paper.
The authors declare that they have no conflict of interest.
The authors would like to thank all the KORUS-AQ science team members and also to thank the editor and the two reviewers for their constructive comments.
This research has been supported by a National Research Foundation of Korea (NRF) grant funded by the Korean government (MSIT) (grant no. NRF-2018R1A2B2006965).
This paper was edited by Daniel Knopf and reviewed by James Hudson and one anonymous referee.
Aknan, A. and Chen, G.: KORUS-AQ DC-8 Aircraft Dataset, KORUS-AQ, https://doi.org/10.5067/Suborbital/KORUSAQ/DATA01, 2019.
Alfarra, M. R., Coe, H., Allan, J. D., Bower, K. N., Boudries, H., Canagaratna, M. R., Jimenez, J. L., Jayne, J. T., Garforth, A., Li, S.-M., and Worsnop, D. R.: Characterization of urban and regional organic aerosols in the lower Fraser Valley using two Aerodyne AerosolMassSpectrometers, Atmos. Environ., 38, 5745–5758, 2004.
Allan, J. D., Jimenez, J. L., Williams, P. I., Alfarra, M. R., Bower, K. N., Jayne, J. T., Coe, H., and Worsnop, D. R.: Quantitative sampling using an Aerodyne aerosol mass spectrometer, 1, Techniques of data interpretation and error analysis, J. Geophys. Res., 108, 4090, https://doi.org/10.1029/2002JD002358, 2003.
Allan, J. D., Bower, K. N., Coe, H., Boudries, H., Jayne, J. T., Canagaratna, M. R., Millet, D. B., Goldstein, A. H., Quinn, P. K., Weber, R. J., and Worsnop, D. R.: Submicron aerosol composition at Trinidad Head, California, during ITCT 2K2: Its relationship with gas phase volatile organic carbon and assessment of instrument performance, J. Geophys. Res., 109, D23S24, https://doi.org/10.1029/2003JD004208, 2004.
Andreae, M. O. and Rosenfeld, D.: Aerosol-cloud-precipitation interactions. Part 1. The nature and sources of cloud-active aerosol, Earth-Sci. Rev., 89, 13e41, https://doi.org/10.1016/j.earscirev.2008.03.001, 2008.
Baltensperger, U., Streit, N., Weingartner, E., Nyeki, S., Prévôt, A. S. H., Van Dingenen, R., Virkkula, A., Putaud, J. P., Even, A., Ten Brink, H., Blatter, A., Neftel, A., and Gäggeler, H. W.: Urban and rural aerosol characterization of summer smog events during the PIPAPO field campaign in Milan, Italy, J. Geophys. Res.-Atmos., 107, D22, https://doi.org/10.1029/2001JD001292, 2002.
Berg, O. H., Swietlicki, E., and Krejci, R.: Hygroscopic growth of aerosol particles in the marine boundary layer over the Pacific and Southern Oceans during the First Aerosol Characterization Experiment (ACE 1), J. Geophys. Res., 103, 16535–16545, https://doi.org/10.1029/97JD02851, 1998.
Bhattu, D. and Tripathi, S. N.: CCNclosure study: Effects of aerosol chem-ical composition and mixing state, J. Geophys. Res.-Atmos., 120, 766–783, https://doi.org/10.1002/2014JD021978, 2015.
Bhattu, D., Tripathi, S. N., and Chakraborty, A.: Deriving aerosol hygroscopic mixing state from size-resolved CCN activity and HR-ToF-AMS measurements, Atmos Environ., 142, 57-70, https://doi.org/10.1016/j.atmosenv.2016.07.032, 2016.
Canagaratna, M. R., Jayne, J. T., Ghertner, D. A., Herndon, S., Shi, Q., Jimenez, J. L., Silva, P. J., Williams, P., Lanni, T., Drewnick, F., Demerjian, K. L., Kolb, C. E., and Worsnop, D. R.: Chase studies of particulate emissions from in-use New York city vehicles, Aerosol Sci. Tech., 38, 555–573, https://doi.org/10.1080/02786820490465504, 2004.
Cerully, K. M., Bougiatioti, A., Hite Jr., J. R., Guo, H., Xu, L., Ng, N. L., Weber, R., and Nenes, A.: On the link between hygroscopicity, volatility, and oxidation state of ambient and water-soluble aerosols in the southeastern United States, Atmos. Chem. Phys., 15, 8679–8694, https://doi.org/10.5194/acp-15-8679-2015, 2015.
Chang, R. Y.-W., Slowik, J. G., Shantz, N. C., Vlasenko, A., Liggio, J., Sjostedt, S. J., Leaitch, W. R., and Abbatt, J. P. D.: The hygroscopicity parameter (κ) of ambient organic aerosol at a field site subject to biogenic and anthropogenic influences: relationship to degree of aerosol oxidation, Atmos. Chem. Phys., 10, 5047–5064, https://doi.org/10.5194/acp-10-5047-2010, 2010.
Cheng, Y. F., Wiedensohler, A., Eichler, H., Heintzenberg, J., Tesche, M., Ansmann, A., Wendisch, M., Su, H., Althausen, D., and Herrmann, H.: Relative humidity dependence of aerosol optical properties and direct radiative forcing in the surface boundary layer at Xinken in Pearl River Delta of China: An observation based numerical study, Atmos. Environ., 42, 6373–6397, https://doi.org/10.1016/j.atmosenv.2008.04.009, 2008
Cocker, D. R., Whitlock, N. E., Flagan, R. C., and Seinfeld, J. H.: Hygroscopic properties of pasadena, california aerosol, Aerosol Sci. Tech., 35, 637–647, https://doi.org/10.1080/02786820120653, 2001.
Cross, E. S., Slowik, J. G., Davidovits, P., Allan, J. D., Worsnop, D. R., Jayne, J. T., Lewis, D. K., Canagaratna, M., and Onasch, T. B.: Laboratory and ambient particle density determinations using light scattering in conjunction with aerosol mass spectrometry, Aerosol Sci. Tech., 41, 343–359, 2007.
DeCarlo, P. F., Slowik, J. G., Worsnop, D. R., Davidovits, P., and Jimenez, J. L.: Particle Morphology and Density Characterization by Combined Mobility and Aerodynamic Diameter Measurements. Part 1: Theory, Aerosol Sci. Tech., 38, 1185–1205, https://doi.org/10.1080/027868290903907, 2004.
Deng, Y., Yai, H., Fujinari, H., Kawana, K., Nakayama, T., and Mochida, M.: Diurnal variation and size dependence of the hygroscopicity of organic aerosol at a forest site in Wakayama, Japan: their relationship to CCN concentrations, Atmos. Chem. Phys., 19, 5889–5903, https://doi.org/10.5194/acp-19-5889-2019, 2019.
Enroth, J., Mikkilä, J., Németh, Z., Kulmala, M., and Salma, I.: Wintertime hygroscopicity and volatility of ambient urban aerosol particles, Atmos. Chem. Phys., 18, 4533–4548, https://doi.org/10.5194/acp-18-4533-2018, 2018.
Ervens, B., Cubison, M. J., Andrews, E., Feingold, G., Ogren, J. A., Jimenez, J. L., Quinn, P. K., Bates, T. S., Wang, J., Zhang, Q., Coe, H., Flynn, M., and Allan, J. D.: CCN predictions using simplified assumptions of organic aerosol composition and mixing state: a synthesis from six different locations, Atmos. Chem. Phys., 10, 4795–4807, https://doi.org/10.5194/acp-10-4795-2010, 2010.
Florou, K., Papanastasiou, D. K., Pikridas, M., Kaltsonoudis, C., Louvaris, E., Gkatzelis, G. I., Patoulias, D., Mihalopoulos, N., and Pandis, S. N.: The contribution of wood burning and other pollution sources to wintertime organic aerosol levels in two Greek cities, Atmos. Chem. Phys., 17, 3145–3163, https://doi.org/10.5194/acp-17-3145-2017, 2017.
Gunthe, S. S., King, S. M., Rose, D., Chen, Q., Roldin, P., Farmer, D. K., Jimenez, J. L., Artaxo, P., Andreae, M. O., Martin, S. T., and Pöschl, U.: Cloud condensation nuclei in pristine tropical rainforest air of Amazonia: size-resolved measurements and modeling of atmospheric aerosol composition and CCN activity, Atmos. Chem. Phys., 9, 7551–7575, https://doi.org/10.5194/acp-9-7551-2009, 2009.
Gysel, M., Crosier, J., Topping, D. O., Whitehead, J. D., Bower, K. N., Cubison, M. J., Williams, P. I., Flynn, M. J., McFiggans, G. B., and Coe, H.: Closure study between chemical composition and hygroscopic growth of aerosol particles during TORCH2, Atmos. Chem. Phys., 7, 6131–6144, https://doi.org/10.5194/acp-7-6131-2007, 2007.
Heo, J.-B., Hopke, P. K., and Yi, S.-M.: Source apportionment of PM2.5 in Seoul, Korea, Atmos. Chem. Phys., 9, 4957–4971, https://doi.org/10.5194/acp-9-4957-2009, 2009.
Hong, J., Kim, J., Nieminen, T., Duplissy, J., Ehn, M., Äijälä, M., Hao, L. Q., Nie, W., Sarnela, N., Prisle, N. L., Kulmala, M., Virtanen, A., Petäjä, T., and Kerminen, V.-M.: Relating the hygroscopic properties of submicron aerosol to both gas- and particle-phase chemical composition in a boreal forest environment, Atmos. Chem. Phys., 15, 11999–12009, https://doi.org/10.5194/acp-15-11999-2015, 2015.
Hong, J., Xu, H., Tan, H., Yin, C., Hao, L., Li, F., Cai, M., Deng, X., Wang, N., Su, H., Cheng, Y., Wang, L., Petäjä, T., and Kerminen, V.-M.: Mixing state and particle hygroscopicity of organic-dominated aerosols over the Pearl River Delta region in China, Atmos. Chem. Phys., 18, 14079–14094, https://doi.org/10.5194/acp-18-14079-2018, 2018.
IPCC: Climate Change: the physical science basis, Working Group I Contribution to the Fifth Assessment Report of the Intergovernmental Panel on Climate Change, Cambridge University Press, Cambridge, UK, New York, NY, USA, 2013.
Jiang, R. X., Tan, H. B., Tang, L. L., Cai, M. F., Yin, Y., Li, F., Liu, L., Xu, H. B., Chan, P. W., Deng, X. J., and Wu, D.: Comparison of aerosol hygroscopicity and mixing state between winter and summer seasons in Pearl River Delta region, China, Atmos. Res., 169, 160–170, 2016.
Jurányi, Z., Tritscher, T., Gysel, M., Laborde, M., Gomes, L., Roberts, G., Baltensperger, U., and Weingartner, E.: Hygroscopic mixing state of urban aerosol derived from size-resolved cloud condensation nuclei measurements during the MEGAPOLI campaign in Paris, Atmos. Chem. Phys., 13, 6431–6446, https://doi.org/10.5194/acp-13-6431-2013, 2013.
Kim, H., Zhang, Q., and Heo, J.: Influence of intense secondary aerosol formation and long-range transport on aerosol chemistry and properties in the Seoul Metropolitan Area during spring time: results from KORUS-AQ, Atmos. Chem. Phys., 18, 7149–7168, https://doi.org/10.5194/acp-18-7149-2018, 2018.
Kim, J. H., Yum, S. S., Shim, S., Yoon, S.-C., Hudson, J. G., Park, J., and Lee, S.-J.: On aerosol hygroscopicity, cloud condensation nuclei (CCN) spectra and critical supersaturation measured at two remote islands of Korea between 2006 and 2009, Atmos. Chem. Phys., 11, 12627–12645, https://doi.org/10.5194/acp-11-12627-2011, 2011.
Kim, N., Park, M., Yum, S. S., Park, J. S., Song, I. H., Shin, H. J., Ahn, J. Y., Kwak, K.-H., Kim, H., Bae, G.-N., and Lee, G.: Hygroscopic properties of urban aerosols and their cloud condensation nuclei activities measured in Seoul during the MAPS-Seoul campaign, Atmos. Environ., 153, 217–232, https://doi.org/10.1016/j.atmosenv.2017.01.034, 2017.
Kim, N., Park, M., Yum, S. S., Park, J. S., Shin, H. J., and Ahn, J. Y.: Impact of urban aerosol properties on cloud condensation nuclei (CCN) activity during the KORUS-AQ field campaign, Atmos Environ., 185, 221–236, https://doi.org/10.1016/j.atmosenv.2018.05.019, 2018.
Kim, S.-W., Choi, I.-J., and Yoon, S.-C.: A multi-year analysis of clear-sky aerosol optical properties and direct radiative forcing at Gosan, Korea (2001–2008), Atmos. Res., 95, 279–287, 2010.
KORUS-AQ project team members: KORUS-AQ data, NASA, https://doi.org/10.5067/Suborbital/KORUSAQ/DATA01, 2020.
Larkin, A., van Donkelaar, A., Geddes, J. A., Martin, R. V., and Hystad, P.: Relationships between changes in urban characteristics and air quality in East Asia from 2000 to 2010, Environ. Sci. Technol., 50, 9142–9149, https://doi.org/10.1021/acs.est.6b02549, 2016.
Levin, E. J. T., Prenni, A. J., Petters, M. D., Kreidenweis, S. M., Sullivan, R. C., Atwood, S. A., Ortega, J., DeMott, P. J., and Smith, J. N.: An annual cycle of size-resolved aerosol hygroscopicity at a forested site in Colorado, J. Geophys. Res., 117, D06201, https://doi.org/10.1029/2011JD016854, 2012.
Levin, E. J. T., Prenni, A. J., Palm, B. B., Day, D. A., Campuzano-Jost, P., Winkler, P. M., Kreidenweis, S. M., DeMott, P. J., Jimenez, J. L., and Smith, J. N.: Size-resolved aerosol composition and its link to hygroscopicity at a forested site in Colorado, Atmos. Chem. Phys., 14, 2657–2667, https://doi.org/10.5194/acp-14-2657-2014, 2014.
Liu, B. Y. H., Pui, D. Y. H., Whitby, K. T., Kittelson, D. B., and Kousaka, Y., and McKenzie, R. L.: The aerosol mobility chromatograph: A new detector for sulfuric acid aerosols, Atmos. Environ., 12, 99–104, https://doi.org/10.1016/0004-6981(78)90192-0, 1978.
Liu, X., Gu, J., Li, Y., Cheng, Y., Qu, Y., Han, T., Wang, J., Tian, H., Chen, J., and Zhang, Y.: Increase of aerosol scattering by hygroscopic growth: Observation, modeling, and implications on visibility, Atmos. Res., 132–133, 91–101, https://doi.org/10.1016/j.atmosres.2013.04.007, 2013.
Maßling, A., Wiedensohler, A., Busch, B., Neusüß, C., Quinn, P., Bates, T., and Covert, D.: Hygroscopic properties of different aerosol types over the Atlantic and Indian Oceans, Atmos. Chem. Phys., 3, 1377–1397, https://doi.org/10.5194/acp-3-1377-2003, 2003.
Massling, A., Stock, M., and Wiedensohler, A.: Diurnal, weekly, and seasonal variation of hygroscopic properties of submicrometer urban aerosol particles, Atmos. Environ., 39, 3911–3922, https://doi.org/10.1016/j.atmosenv.2005.03.020, 2005.
Massling, A., Leinert, S., Wiedensohler, A., and Covert, D.: Hygroscopic growth of sub-micrometer and one-micrometer aerosol particles measured during ACE-Asia, Atmos. Chem. Phys., 7, 3249–3259, https://doi.org/10.5194/acp-7-3249-2007, 2007.
McFiggans, G., Artaxo, P., Baltensperger, U., Coe, H., Facchini, M. C., Feingold, G., Fuzzi, S., Gysel, M., Laaksonen, A., Lohmann, U., Mentel, T. F., Murphy, D. M., O'Dowd, C. D., Snider, J. R., and Weingartner, E.: The effect of physical and chemical aerosol properties on warm cloud droplet activation, Atmos. Chem. Phys., 6, 2593–2649, https://doi.org/10.5194/acp-6-2593-2006, 2006.
Meng, J. W., Yeung, M. C., Li, Y. J., Lee, B. Y. L., and Chan, C. K.: Size-resolved cloud condensation nuclei (CCN) activity and closure analysis at the HKUST Supersite in Hong Kong, Atmos. Chem. Phys., 14, 10267–10282, https://doi.org/10.5194/acp-14-10267-2014, 2014.
Mei, F., Setyan, A., Zhang, Q., and Wang, J.: CCN activity of organic aerosols observed downwind of urban emissions during CARES, Atmos. Chem. Phys., 13, 12155–12169, https://doi.org/10.5194/acp-13-12155-2013, 2013.
Moore, R. H., Nenes, A., and Medina, J.: Scanning mobility CCN analysis-A method for fast measurements of size-resolved CCN distributions and activation kinetics, Aerosol Sci. Tech., 44, 861–871, https://doi.org/10.1080/02786826.2010.498715, 2010.
O'Haver, T. C.: Pragmatic introduction to signal processing 2016: Applications in scientific measurement, Independently published, http://terpconnect.umd.edu/~toh/spectrum/InteractivePeakFitter.htm, last access: September, 2016.
Paatero, P. and Hopke, P. K.: Discarding or downweighting high-noise variables in factor analytic models, Anal. Chim. Acta, 490, 277–289, 2003.
Paramonov, M., Aalto, P. P., Asmi, A., Prisle, N., Kerminen, V.-M., Kulmala, M., and Petäjä, T.: The analysis of size-segregated cloud condensation nuclei counter (CCNC) data and its implications for cloud droplet activation, Atmos. Chem. Phys., 13, 10285–10301, https://doi.org/10.5194/acp-13-10285-2013, 2013.
Petters, M. D. and Kreidenweis, S. M.: A single parameter representation of hygroscopic growth and cloud condensation nucleus activity, Atmos. Chem. Phys., 7, 1961–1971, https://doi.org/10.5194/acp-7-1961-2007, 2007.
Petters, M. D., Wex, H., Carrico, C. M., Hallbauer, E., Massling, A., McMeeking, G. R., Poulain, L., Wu, Z., Kreidenweis, S. M., and Stratmann, F.: Towards closing the gap between hygroscopic growth and activation for secondary organic aerosol – Part 2: Theoretical approaches, Atmos. Chem. Phys., 9, 3999–4009, https://doi.org/10.5194/acp-9-3999-2009, 2009.
Reilly, P. J. and Wood, R. H.: Prediction of Properties of Mixed Electrolytes from Measurements on Common Ion Mixtures, J. Phys. Chem., 73, 4292–4297, 1969.
Ren, J., Zhang, F., Wang, Y., Collins, D., Fan, X., Jin, X., Xu, W., Sun, Y., Cribb, M., and Li, Z.: Using different assumptions of aerosol mixing state and chemical composition to predict CCN concentrations based on field measurements in urban Beijing, Atmos. Chem. Phys., 18, 6907–6921, https://doi.org/10.5194/acp-18-6907-2018, 2018.
Rissler, J., Swietlicki, E., Zhou, J., Roberts, G., Andreae, M. O., Gatti, L. V., and Artaxo, P.: Physical properties of the sub-micrometer aerosol over the Amazon rain forest during the wet-to-dry season transition – comparison of modeled and measured CCN concentrations, Atmos. Chem. Phys., 4, 2119–2143, https://doi.org/10.5194/acp-4-2119-2004, 2004.
Rogers, R. R. and Yau, M. K.: A short course in cloud physics, vol. 113, International Series in Natural Philosophy, 3rd edn., Butterworth-Heinemann, New York, 1989.
Rosenfeld, D., Sherwood, S., Wood, R., and Donner, L.: Climate effects of aerosol-cloud interactions, Science, 343, 379–380, https://doi.org/10.1126/science.1247490, 2014.
Stokes, R. H. and Robinson, R. A.: Interactions in aqueous nonelectrolyte solutions. I. Solute-solvent equilibria, J. Phys. Chem., 70, 2126–2130, 1966.
Su, H., Rose, D., Cheng, Y. F., Gunthe, S. S., Massling, A., Stock, M., Wiedensohler, A., Andreae, M. O., and Pöschl, U.: Hygroscopicity distribution concept for measurement data analysis and modeling of aerosol particle mixing state with regard to hygroscopic growth and CCN activation, Atmos. Chem. Phys., 10, 7489–7503, https://doi.org/10.5194/acp-10-7489-2010, 2010.
Swietlicki, E., Zhou, J., Covert, D. S., Hameri, K., Busch, B., Vakevä, M., Dusek, U., Berg, O. H., Wiedensohler, A., Aalto, P., Makelä, J., Martinsson, B. G., Papaspiropoulos, G., Mentes, B., Frank, G., and Stratmann, F.: Hygroscopic properties of aerosol particles in the northeastern Atlantic during ACE-2, Tellus, 52B, 201–227, 2000.
Swietlicki, E., Hansson, H. C., Hämeri, K., Svenningsson, B., Massling, A., Mcfiggans, G., Mcmurry, P. H., Petäjä, T., Tunved, P., Gysel, M., Topping, D., Weingartner, E., Baltensperger, U., Rissler, J., Wiedensohler, A., and Kulmala, M.: Hygroscopic properties of submicrometer atmospheric aerosol particles measured with H-TDMA instruments in various environments – A review, Tellus B, 60 B, 432–469, https://doi.org/10.1111/j.1600-0889.2008.00350.x, 2008.
Tang, I. N.: Chemical and size effects of hygroscopic aerosols on light scattering coefficients, J. Geophys. Res.-Atmos., 101, 19245–19250, https://doi.org/10.1029/96JD03003, 1996.
Thalman, R., de Sá, S. S., Palm, B. B., Barbosa, H. M. J., Pöhlker, M. L., Alexander, M. L., Brito, J., Carbone, S., Castillo, P., Day, D. A., Kuang, C., Manzi, A., Ng, N. L., Sedlacek III, A. J., Souza, R., Springston, S., Watson, T., Pöhlker, C., Pöschl, U., Andreae, M. O., Artaxo, P., Jimenez, J. L., Martin, S. T., and Wang, J.: CCN activity and organic hygroscopicity of aerosols downwind of an urban region in central Amazonia: seasonal and diel variations and impact of anthropogenic emissions, Atmos. Chem. Phys., 17, 11779–11801, https://doi.org/10.5194/acp-17-11779-2017, 2017.
Tomlinson, J. M., Li, R. J., and Collins, D. R.: Physical and chemical properties of the aerosol within the southeastern Pa- cific marine boundary layer. J. Geophys. Res.-Atmos. 112, D12211, https://doi.org/10.1029/2006JD007771, 2007.
Topping, D. O., McFiggans, G. B., and Coe, H.: A curved multi-component aerosol hygroscopicity model framework: Part 2 – Including organic compounds, Atmos. Chem. Phys., 5, 1223–1242, https://doi.org/10.5194/acp-5-1223-2005, 2005.
Ulbrich, I. M., Canagaratna, M. R., Zhang, Q., Worsnop, D. R., and Jimenez, J. L.: Interpretation of organic components from Positive Matrix Factorization of aerosol mass spectrometric data, Atmos. Chem. Phys., 9, 2891–2918, https://doi.org/10.5194/acp-9-2891-2009, 2009.
Wang, J., Cubison, M. J., Aiken, A. C., Jimenez, J. L., and Collins, D. R.: The importance of aerosol mixing state and size-resolved composition on CCN concentration and the variation of the importance with atmospheric aging of aerosols, Atmos. Chem. Phys., 10, 7267–7283, https://doi.org/10.5194/acp-10-7267-2010, 2010.
Wang, Y., Zhang, F., Li, Z., Tan, H., Xu, H., Ren, J., Zhao, J., Du, W., and Sun, Y.: Enhanced hydrophobicity and volatility of submicron aerosols under severe emission control conditions in Beijing, Atmos. Chem. Phys., 17, 5239–5251, https://doi.org/10.5194/acp-17-5239-2017, 2017.
Wang, Y., Wu, Z., Ma, N., Wu, Y., Zeng, L., Zhao, C., and Wiedensohler, A.: Statistical analysis and parameterization of the hygroscopic growth of the sub-micrometer urban background aerosol in Beijing, Atmos. Environ., 175, 184–191, 2018.
Wex, H., Petters, M. D., Carrico, C. M., Hallbauer, E., Massling, A., McMeeking, G. R., Poulain, L., Wu, Z., Kreidenweis, S. M., and Stratmann, F.: Towards closing the gap between hygroscopic growth and activation for secondary organic aerosol: Part 1 – Evidence from measurements, Atmos. Chem. Phys., 9, 3987–3997, https://doi.org/10.5194/acp-9-3987-2009, 2009.
Wu, Z. J., Poulain, L., Henning, S., Dieckmann, K., Birmili, W., Merkel, M., van Pinxteren, D., Spindler, G., Müller, K., Stratmann, F., Herrmann, H., and Wiedensohler, A.: Relating particle hygroscopicity and CCN activity to chemical composition during the HCCT-2010 field campaign, Atmos. Chem. Phys., 13, 7983–7996, https://doi.org/10.5194/acp-13-7983-2013, 2013.
Wu, Z. J., Zheng, J., Shang, D. J., Du, Z. F., Wu, Y. S., Zeng, L. M., Wiedensohler, A., and Hu, M.: Particle hygroscopicity and its link to chemical composition in the urban atmosphere of Beijing, China, during summertime, Atmos. Chem. Phys., 16, 1123–1138, https://doi.org/10.5194/acp-16-1123-2016, 2016.
Ye, X., Tang, C., Yin, Z., Chen, J., Ma, Z., Kong, L., Yang, X., Wei, G., and Geng, F.: Hygroscopic growth of urban aerosol particles during the 2009 Mirage-Shanghai Campaign, Atmos. Envion., 64, 263–269, 2013.
Zdanovskii, A.: New methods for calculating solubilities of electrolytes in multicomponent systems, Zhur. Fiz. Khim., 22, 1475–1485, 1948.
Zhang, Q., Alfarra, M. R., Worsnop, D. R., Allan, J. D., Coe, H., Canagaratna, M. R., and Jimenez, J. L.: Deconvolution and quantification of hydrocarbon-like and oxygenated organic aerosols based on aerosol mass spectrometry, Environ. Sci. Technol., 39, 4938–4952, 2005.
Zhang, Q., Jimenez, J. L., Canagaratna, M. R., Allan, J. D., Coe, H., Ulbrich, I., Alfarra, M. R., Takami, A., Middlebrook, A. M., Sun, Y. L., Dzepina, K., Dunlea, E., Docherty, K., DeCarlo, P. F., Salcedo, D., Onasch, T., Jayne, J. T., Miyoshi, T., Shimono, A., Hatakeyama, S., Takegawa, N., Kondo, Y., Schneider, J., Drewnick, F., Borrmann, S., Weimer, S., Demerjian, K., Williams, P., Bower, K., Bahreini, R., Cottrell, L., Griffin, R. J., Rautiainen, J., Sun, J. Y., Zhang, Y. M., and Worsnop, D. R.: Ubiquity and dominance of oxygenated species in organic aerosols in anthropogenically-influenced Northern Hemisphere midlatitudes, Geophys. Res. Lett., 34, L13801, https://doi.org/10.1029/2007GL029979, 2007.
Zhang, R., Khalizov, A. F., Pagels, J., Zhang, D., Xue, H., and McMurry, P. H.: Variability in morphology, hygroscopicity, and optical properties of soot aerosols during atmospheric processing, P. Natl. Acad. Sci. USA, 105, 10291–10296, https://doi.org/10.1073/pnas.0804860105, 2008.
Zheng, G. J., Duan, F. K., Su, H., Ma, Y. L., Cheng, Y., Zheng, B., Zhang, Q., Huang, T., Kimoto, T., Chang, D., Pöschl, U., Cheng, Y. F., and He, K. B.: Exploring the severe winter haze in Beijing: the impact of synoptic weather, regional transport and heterogeneous reactions, Atmos. Chem. Phys., 15, 2969–2983, https://doi.org/10.5194/acp-15-2969-2015, 2015.
Zhou, J., Swietlicki, E., Berg, O. H., Aalto, P. P., Hämeri, K., Nilsson, E. D., and Leck, C.: Hygroscopic properties of aerosol particles over the central Arctic Ocean during summer, J. Geophys. Res.-Atmos., 106, 32111–32123, https://doi.org/10.1029/2000JD900426, 2001.
Zhou, J., Swietlicki, E., Hansson, H. C., and Artaxo, P.: Submicrometer aerosol particle size distribution and hygroscopic growth measured in the Amazon rain forest during the wet season, J. Geophys. Res.-Atmos., 107, 8055–8064, 2002.
- Abstract
- Introduction
- Experimental description
- Overview of hygroscopic and chemical properties of aerosols
- Size-resolved chemical composition and its link to hygroscopicity and mixing state
- Summary and Conclusions
- Data availability
- Author contributions
- Competing interests
- Acknowledgements
- Financial support
- Review statement
- References
- Supplement