the Creative Commons Attribution 4.0 License.
the Creative Commons Attribution 4.0 License.
 | 24 Sep 2020
Assessing contributions of natural surface and anthropogenic emissions to atmospheric mercury in a fast-developing region of eastern China from 2015 to 2018
Xiaofei Qin
Leiming Zhang
Guochen Wang
Xiaohao Wang
Qingyan Fu
Hao Li
Jia Chen
Qianbiao Zhao
Yanfen Lin
Juntao Huo
Fengwen Wang
Kan Huang
Congrui Deng
Mercury (Hg) is a global toxic pollutant that can be released into the atmosphere through anthropogenic and natural sources. The uncertainties in the estimated emission amounts are much larger from natural than anthropogenic sources. A method was developed in the present study to quantify the contributions of natural surface mercury emissions to ambient gaseous elemental mercury (GEM) concentrations through application of positive matrix factorization (PMF) analysis with temperature and NH3 as indicators of GEM emissions from natural surfaces. GEM concentrations were continuously monitored at a 2-hourly resolution at a regional background site in the Yangtze River Delta in eastern China during 2015–2018. Annual average GEM concentrations were in the range of 2.03–3.01 ng m−3, with a strong decreasing trend at a rate of ng m−3 yr−1 from 2015 to 2018, which was mostly caused by reduced anthropogenic emissions since 2013. The estimated contributions from natural surface emissions of mercury to the ambient GEM concentrations were in the range of 1.00–1.13 ng m−3 on annual average, with insignificant interannual changes, but the relative contribution increased significantly from 41 % in 2015 to 57 % in 2018, gradually surpassing those from anthropogenic sources.
- Article
(5570 KB) - Full-text XML
-
Supplement
(4739 KB) - BibTeX
- EndNote


Mercury has long been recognized as a toxic pollutant due to its bioaccumulation and health effects (Driscoll et al., 2013; Clarkson and Magos, 2006; Schroeder and Munthe, 1998; Horowitz et al., 2017; Fu et al., 2012; Wright et al., 2018). Mercury in the atmosphere can be transported globally, mostly in the form of gaseous elemental mercury (GEM) due to its long lifetime in air (Driscoll et al., 2013). Clarifying sources and quantifying emissions from the major sources of atmospheric mercury are critical for understanding the biogeochemical cycle of mercury and developing mercury reduction strategies. Mercury in the atmosphere is released from both natural and anthropogenic sources. Natural sources include volcanoes. geological weathering, forest fires, re-emissions of pre-deposited mercury from natural surfaces, etc. (Gustin et al., 2008; Mason and Sheu, 2002). Among these sources, emissions from natural surfaces are the major ones, and a number of studies have been devoted to understanding the processes of natural surface emissions (Xu et al., 1999; Lindberg et al., 2002; Kocman et al., 2013). Anthropogenic sources mainly include coal-fired power plants, nonferrous metal smelters, and waste incineration (Friedli et al., 2009). Globally, natural sources released about 5200 t of mercury into the atmosphere on an annual basis, which contributed to up to two-thirds of the global atmospheric mercury budget, while that from anthropogenic sources was estimated to be around 2300 t (Pirrone et al., 2010). In China, the total mercury emissions released from natural and anthropogenic sources were estimated to be 574.5 and 571 t yr−1, respectively (Wang et al., 2016; Zhang et al., 2015).
During the past decades, anthropogenic emissions of mercury in Europe and North America have been reduced significantly through phasing out mercury from many commercial products as well as have benefited from SO2 and NOx emission reduction from coal-fired utilities, resulting in considerable decrease in atmospheric mercury concentrations in these regions (e.g., approximately 1 % yr−1 to 2 % yr−1 decrease from 1990 to 2013) (Streets et al., 2011; Zhang et al., 2016). In China, anthropogenic mercury emissions decreased from 571 t in 2013 to 444 t in 2017 due to the co-benefits of aggressive air pollutant control measures implemented in this period (Liu et al., 2019). GEM concentrations measured at a rural site north of Shanghai showed a substantially decreasing trend from 2014 to 2016 (Tang et al., 2018).
With the decrease in anthropogenic mercury emissions in many parts of the world (Zhang et al., 2016), the contributions of natural emissions to total mercury budget are expected to be more important. However, the trends of natural emissions are still unclear due to the difficulties in directly measuring GEM emissions from natural surfaces (Zhu et al., 2015). Existing estimates of GEM emission from natural sources have large uncertainties (e.g., from 1500 to 5207 Mg yr−1 on a global scale), limiting our understanding of the role of natural emissions in the global mercury cycle (Song et al., 2015; X. Wang et al., 2014). For example, a study at rural Beijing showed that modeled GEM concentrations were underestimated by about 40 % compared to measurements from April to September 2009 due to the absence of natural emission inventories (L. Wang et al., 2014). Hence, it is meaningful to develop a method to quantify the contributions of natural surface emissions to total mercury budget in the atmosphere, especially in China where anthropogenic emissions have been decreasing fast in recent years.
The purpose of the present study is to differentiate the contributions of natural surface emissions and anthropogenic emissions to the measured ambient GEM concentrations collected during a 4-year period at a regional background site in the Yangtze River Delta (YRD) of eastern China. This was done by conducting positive matrix factorization (PMF) analysis with identified variables as tracers of natural surface mercury emissions. Results presented in this study provide an approach that can be potentially used for improving mercury emission databases for natural sources.
2.1 Site description
Shanghai, situated in the YRD region, is one of the most developed cities in China. Like in many other cities in China, severe air pollution events have occurred frequently in this city in the past decades. A supersite has been set up next to the Dianshan Lake in Qingpu District of rural Shanghai (Fig. 1) as part of the framework of the State Environmental Protection Scientific Observation and Research Station. This supersite is designed to represent the regional-scale air pollution characteristics in the YRD region based on the following two considerations: (1) it is located in the conjunction area of Shanghai, Jiangsu, and Zhejiang provinces, and (2) there are no large point sources such as coal-fired power plants, nonferrous metal smelting, and cement production within a 20 km distance surrounding the site. This site was established in 2013, and its capacity has been gradually built by measuring a set of atmospheric parameters, including meteorological factors, trace gases, aerosol physical and chemical parameters, vertical profiles of ozone and particles, etc. More detailed descriptions of the site can be found elsewhere (Qin et al., 2019; Duan et al., 2017).
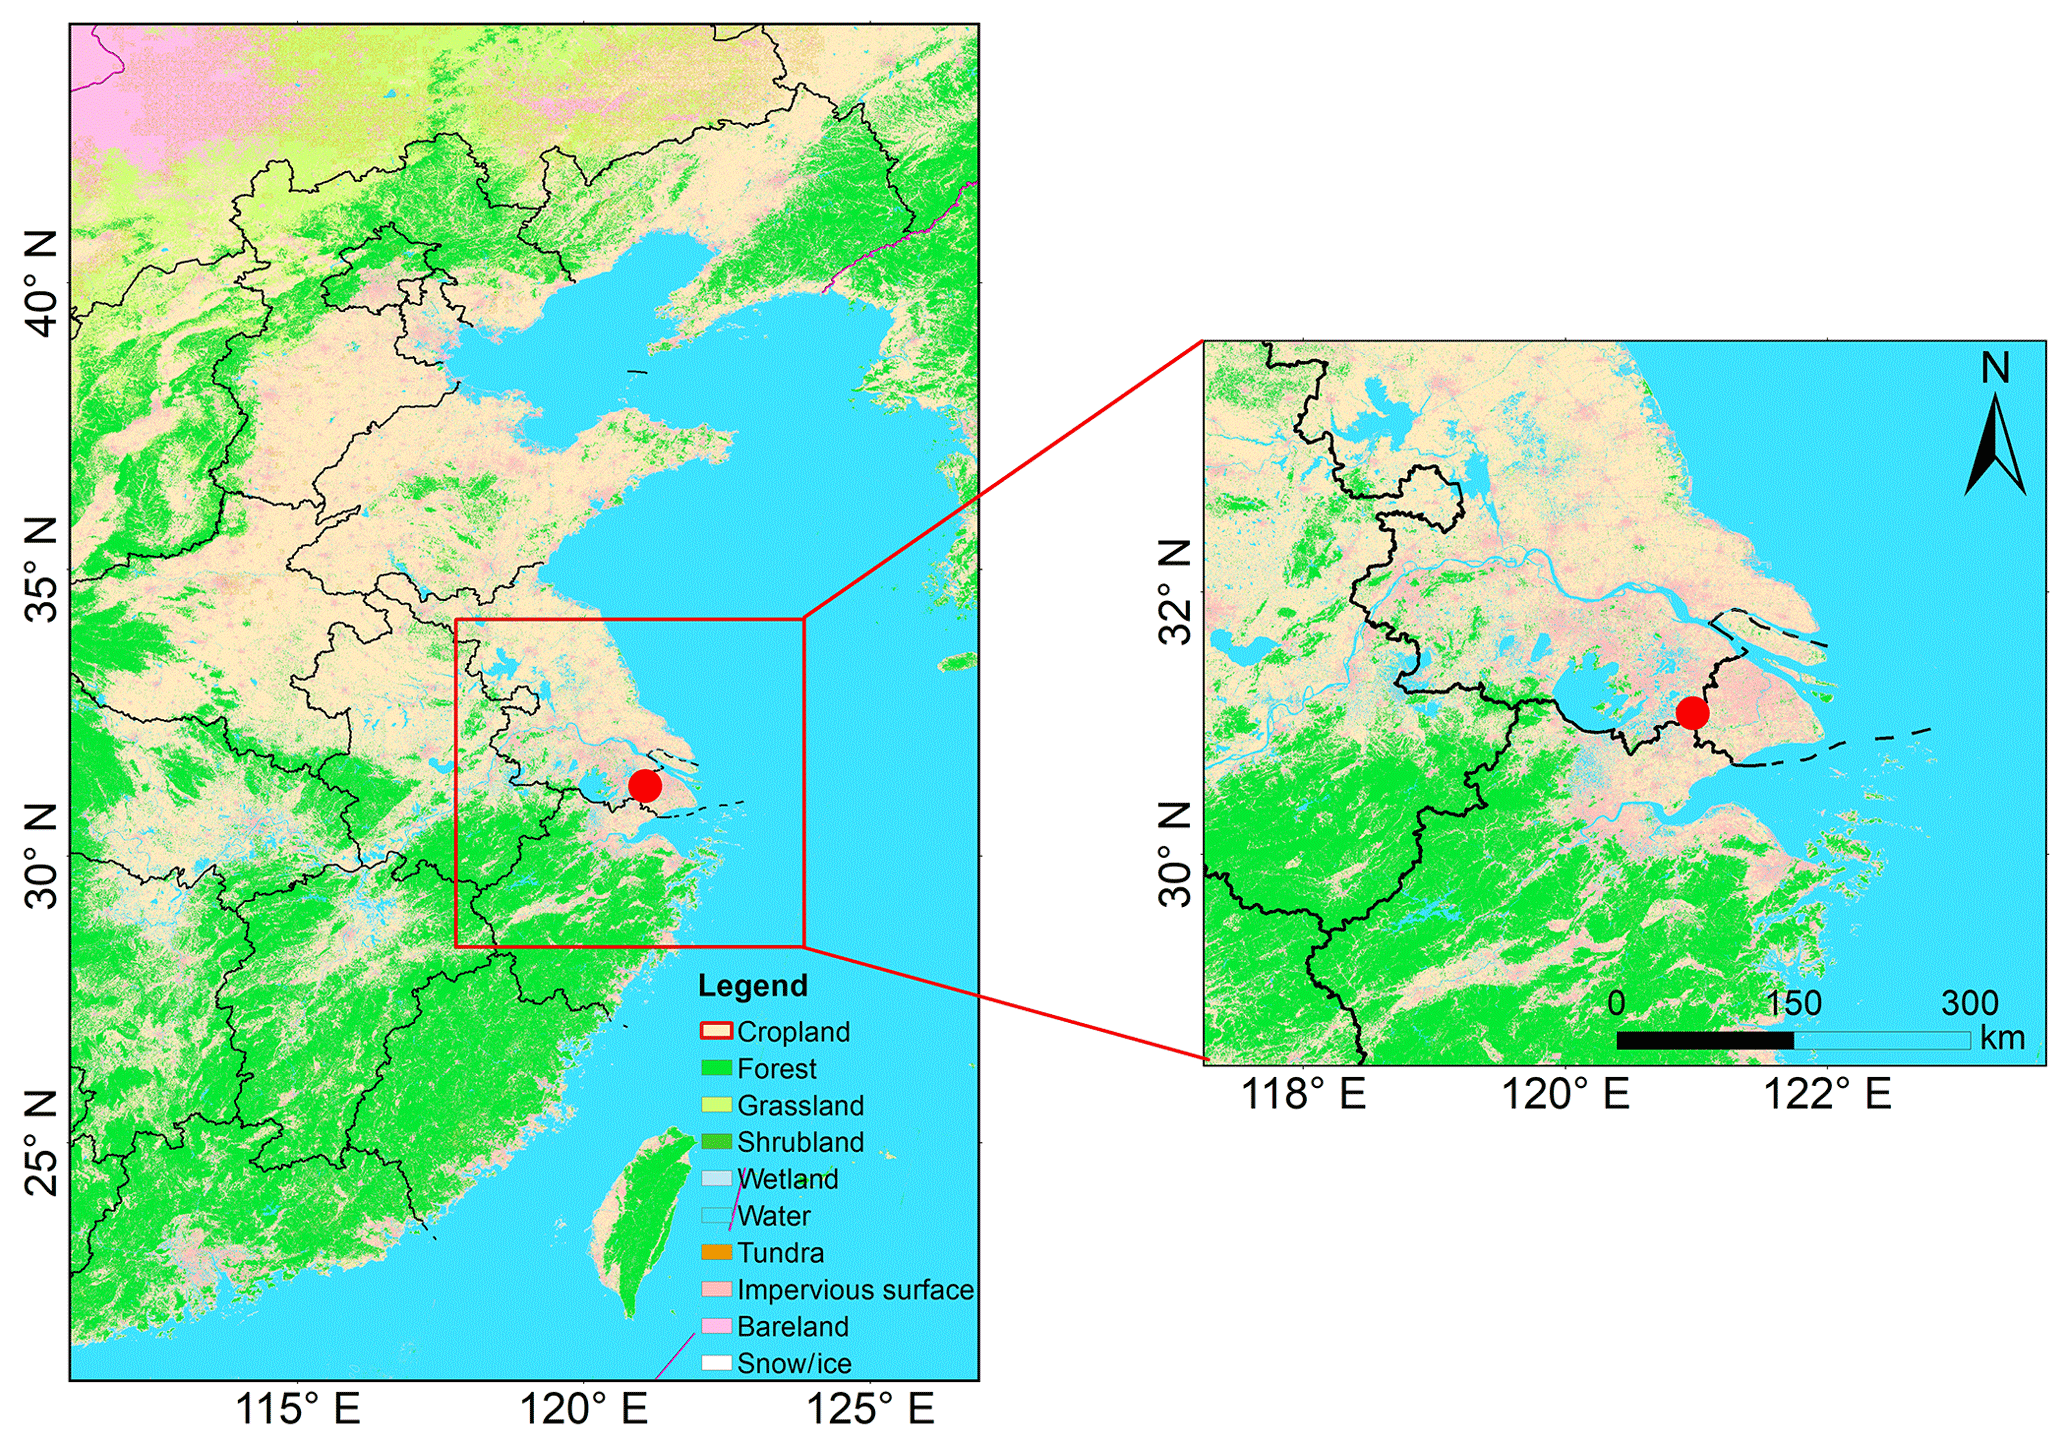
Figure 1The location of the Dianshan Lake (DSL) site in Shanghai, China. Different colors in the map represent different land cover types.
2.2 Measurements of gaseous elemental mercury
An automated mercury vapor analyzer Tekran 2537B-1130-1135 has been installed on the third floor of a building for real-time continuous GEM measurements since January 2015. GEM was measured based on the principle of cold vapor atomic fluorescence spectroscopy (CVAFS) (Landis and Keeler, 2002). Briefly, ambient GEM was collected on gold traps and then thermally decomposed to GEM before detection. The sampling interval of GEM was 5 min with a flow rate of 1 L min−1. More details of this instrument can be found elsewhere (Mao et al., 2008).
Strict quality control procedures were followed during the sampling process. Denuders and quartz filters were prepared and cleaned according to the instructions in Tekran technical notes before sampling. Routine calibration with internal permeation source was performed every 47 h, and manual injections of standard saturated mercury vapor were conducted to ensure the accuracy of these automated calibrations. The KCl-coated denuder, Teflon-coated glass inlet, and impactor plate were replaced weekly, and quartz filters were replaced monthly. Individual extremely high GEM concentrations that occasionally happened were regarded as outliers and were excluded from the data analysis. In this study, the number of valid GEM data was 16 266.
2.3 Measurements of other air pollutants and meteorological parameters
Water-soluble ions in PM2.5 and soluble gases were continuously measured by Monitor for AeRosols and Gases in ambient Air (MARGA) operated at a flow rate of 16.7 L min−1 with a time resolution of 1 h, as detailed in Chang et al. (2016). Briefly, water-soluble gases in the airflow were removed by an absorbing liquid, and then the particles were induced by a supersaturation of water vapor to grow into droplets before they were collected and transported into the analytical chamber.
Trace metals in PM2.5 were continuously measured by using the Xact 625 ambient metals monitor (Cooper Environmental Services, Beaverton, OR, USA) operated at a flow rate of 16.7 L min−1 with hourly resolution, as detailed in Yu et al. (2019). Briefly, the particles in the airflow were deposited onto a Teflon filter tape and then transported into the spectrometer where the particles were analyzed with an X-ray fluorescence. Black carbon in PM2.5 was measured by a multiwavelength Aethalometer (AE-33, Magee Scientific). Ambient particles were collected on a paper tape at a flow rate of 5 L min−1. Aerosol light absorptions of BC were measured at seven wavelengths of 370, 470, 520, 590, 660, 880, and 950 nm.
Sulfur dioxide, carbon monoxide, and PM2.5 were measured by a Thermo Fisher 43i, Thermo Fisher 48i-TLE, and Thermo Fisher 1405-F, respectively. Meteorological parameters including ambient temperature, wind speed, and wind direction were obtained at the sampling site by using the automatic weather station (AWS). Bivariate polar plots (BPP) were applied in this study to explore how GEM concentrations change with different wind direction and wind speed, which has proven to be a reliable method for identifying different source regions (Carslaw et al., 2006; Carslaw and Ropkins, 2012; Chang et al., 2017). Here, the open-source software “openair” in R was used to create BPPs (Carslaw and Ropkins, 2012).
2.4 Positive matrix factorization (PMF)
The PMF model has been proven to be a useful tool to provide quantitative source profiles and source contributions (Xu et al., 2017; Gibson et al., 2015). The basic principle of PMF is that concentrations of the samples are determined by the source profiles with different contributions, which can be described as follows:
where Xij represents the concentration of the jth species in the ith sample, gik is the contribution of the kth factor in the ith sample, fkj provides the information about the mass fraction of the jth species in the kth factor, eij is the residual for specific measurement, and P represents the number of factors.
The objective function expressed in Eq. (2) below, which is the sum of the square of the difference between the measured and modeled concentrations weighted by the concentration uncertainties, needs to be minimized before the PMF model determines the optimal nonnegative factor profiles and contributions (Cheng et al., 2015)
where Xij represents the concentration of the jth contamination in the ith sample, m is the total number of pollutants, and n is the total number of samples. Aik represents the contribution of the kth factor on the ith sample, and Fkj represents the mass fraction of the jth pollutant in the kth factor. Sij is the uncertainty in the jth pollutant on the ith factor, and P is the number of factors. In this study, we explored the number of factors being from three to eight, with the optimal solutions determined by the slope of the Q value versus the number of factors. For each run, the stability and reliability of the outputs were assessed by referring to the Q value, residual analysis, and correlation coefficients between observed and predicted concentrations. Finally, we found that a six-factor solution showed the most stable results and gave the most reasonable interpretation. A dataset containing uncertainty values for each species was created and digested into the model, with the error fraction being assumed to be 15 % for GEM concentration and 10 % for other compounds (Xu et al., 2017; Polissar et al., 1998).
It should be noted that the Fpeak model run at the strength of 0.5 was done by using the rotation tools in PMF, and the results are summarized in Table S1 in the Supplement. For all seasons, the increase in the Q value due to the Fpeak rotation with a dQ was less than 1 % of the base run Q (robust) value. According to the user guide of PMF5.0, it was acceptable when the percent for dQ was less than 5 %. The profiles and contributions of each source were examined, and there were no significant differences between the factor contributions of base run and rotation results. Hence, the base run results were used in this study.
2.5 Annual changes of anthropogenic mercury emission in China and YRD
It was reported that the annual anthropogenic atmospheric mercury emission in China significantly increased from 147 t in 1978 to 549 t in 2010 (Wu et al., 2016). In more recent years, in order to cope with the severe air pollution situation, the Chinese government has taken many rigorous and ambitious measures such as introduction of ultralow emissions standards on power plants and phasing out of small factories with high emissions (Zheng et al., 2018). As a result, mercury emissions from anthropogenic sources have since been declining in China. For the 5-year period of 2013–2017, annual total anthropogenic mercury emissions in China were estimated to be 571, 547, 528, 486, and 444 t, respectively, or a total decline of 127 t. During the same period, the reduction of anthropogenic mercury emissions reached 60 t in eastern China (Liu et al., 2019).
3.1 The measured gaseous elemental mercury
3.1.1 Decreasing trend of gaseous elemental mercury
The measured annual mean GEM concentrations were 3.01±1.03, 2.58±0.84, 2.52±0.84, and 2.03±0.69 ng m−3 from 2015 to 2018. By using the Theil–Sen function, monthly GEM exhibited a significantly decreasing trend from 2015 to 2018 (p<0.05) with a rate of ng m−3 yr−1 (Fig. 2a). This decreasing trend was consistent with the trends of mass concentrations of PM2.5 and SO2 (Fig. 2b, c), which were attributed to the implementation of the Clean Air Action starting in 2013 in China (Zheng et al., 2018). As mentioned earlier (Sect. 2.5), the nationwide reduction of anthropogenic mercury emissions should be largely responsible for the significant decrease in GEM concentration observed at the YRD regional background site.
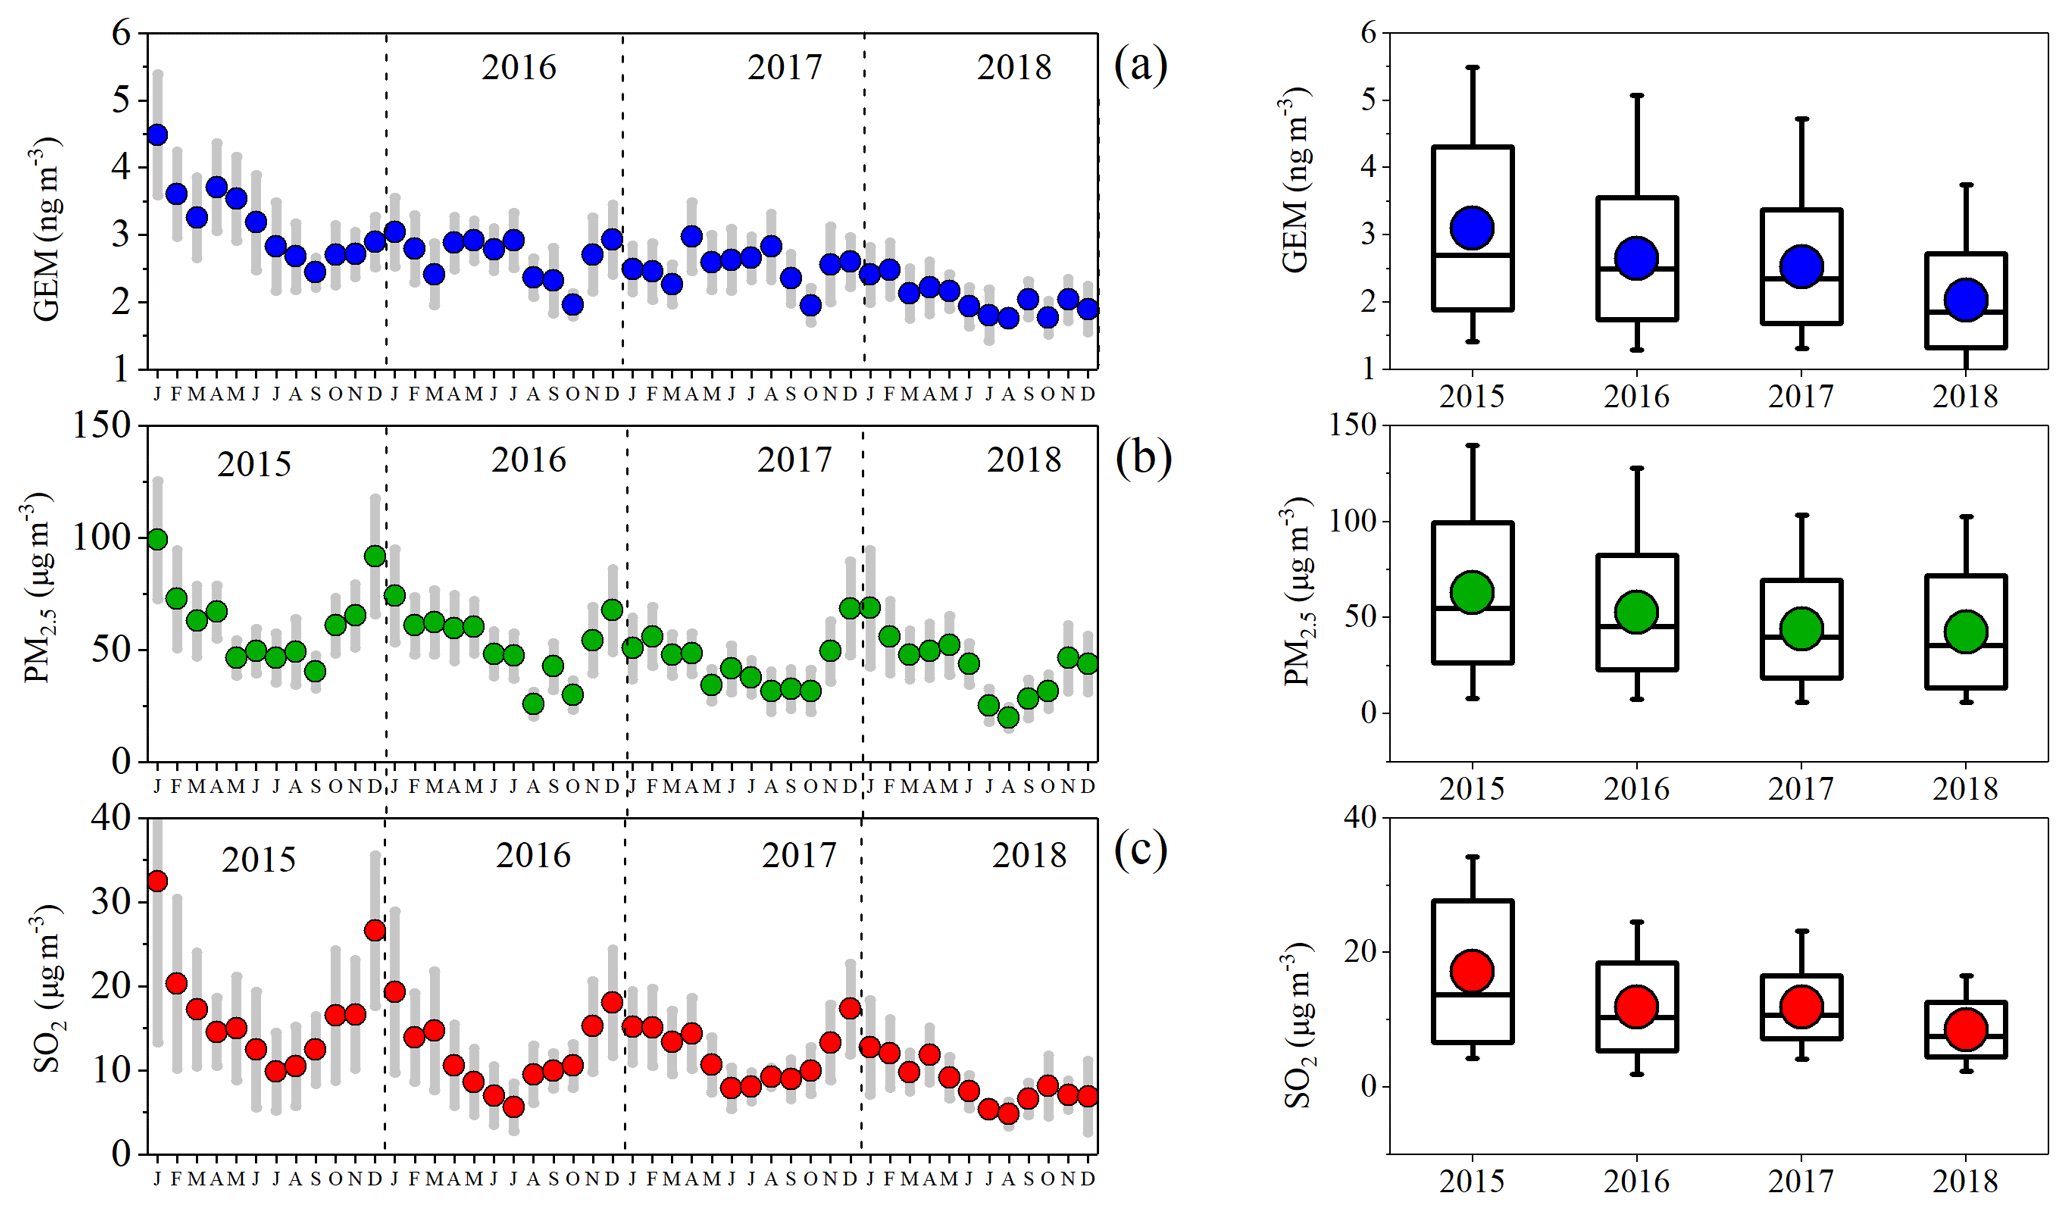
Figure 2Monthly and annual variations in (a) GEM, (b) PM2.5, and (c) SO2 concentrations from 2015 to 2018.
Seasonal average GEM concentrations decreased from 3.62 to 2.17 ng m−3 with a rate of −0.37 ng m−3 yr−1 in spring, from 2.89 to 1.98 ng m−3 with a rate of −0.26 ng m−3 yr−1 in summer, from 2.62 to 1.94 ng m−3 with a rate of −0.22 ng m−3 yr−1 in autumn, and from 2.91 to 1.82 ng m−3 with a rate of −0.35 ng m−3 yr−1 in winter (Fig. 3). The decreasing rates of GEM were ∼30 % lower in the warm seasons than the cold seasons. Considering that seasonal variations in anthropogenic emission were less temperature dependent, the different seasonal decreasing rates of GEM between the warm and cold seasons should be mostly caused by the seasonal-dependent emission amounts from natural sources, knowing that natural surface emissions are controlled by solar radiation and temperature, among other factors (Howard and Edwards, 2018; Pannu et al., 2014; Mason, 2009).
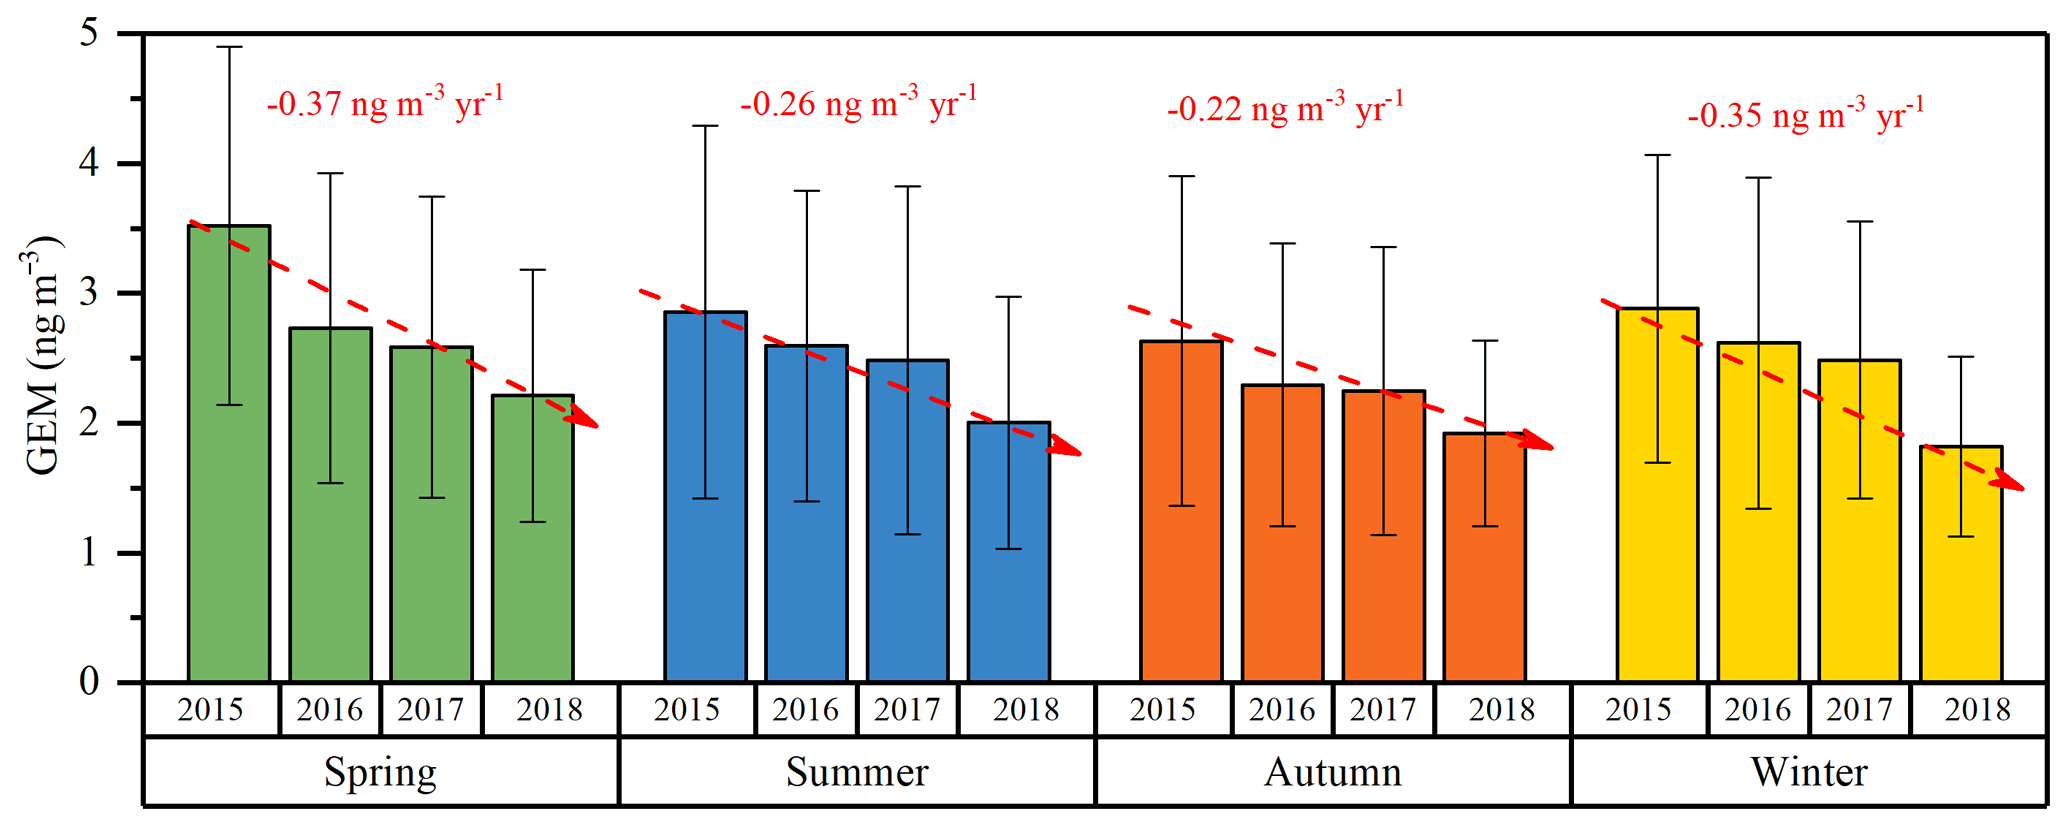
Figure 3Seasonal variations in GEM concentrations from 2015 to 2018. The variation rates of GEM for each season are also shown in the figure.
3.1.2 Impact of temperature on ambient gaseous elemental mercury
In a previous study we showed that GEM concentrations tended to rise with increasing temperature in the YRD region, which was considered to be the effect of temperature-dependent emission amounts from natural surfaces (Qin et al., 2019). Here, to qualitatively investigate the role of natural surface emissions on ambient GEM concentration, diurnal profiles of the bi-hourly GEM concentration and temperature are exhibited in Fig. 4. If looking at the whole year of data together, moderate to high correlations were seen between the diurnal variations in GEM and temperature in 2016, 2017, and 2018, with R2 being 0.30 to 0.86 (p<0.05), except in 2015 with little correlation, with R2 being only 0.03 (p<0.05) (Fig. 4a–d). The maximum GEM concentrations generally appeared around 10:00–14:00 UTC+8, mostly coinciding with daily peak temperature. These findings provided strong evidence of temperature-dependent GEM sources.
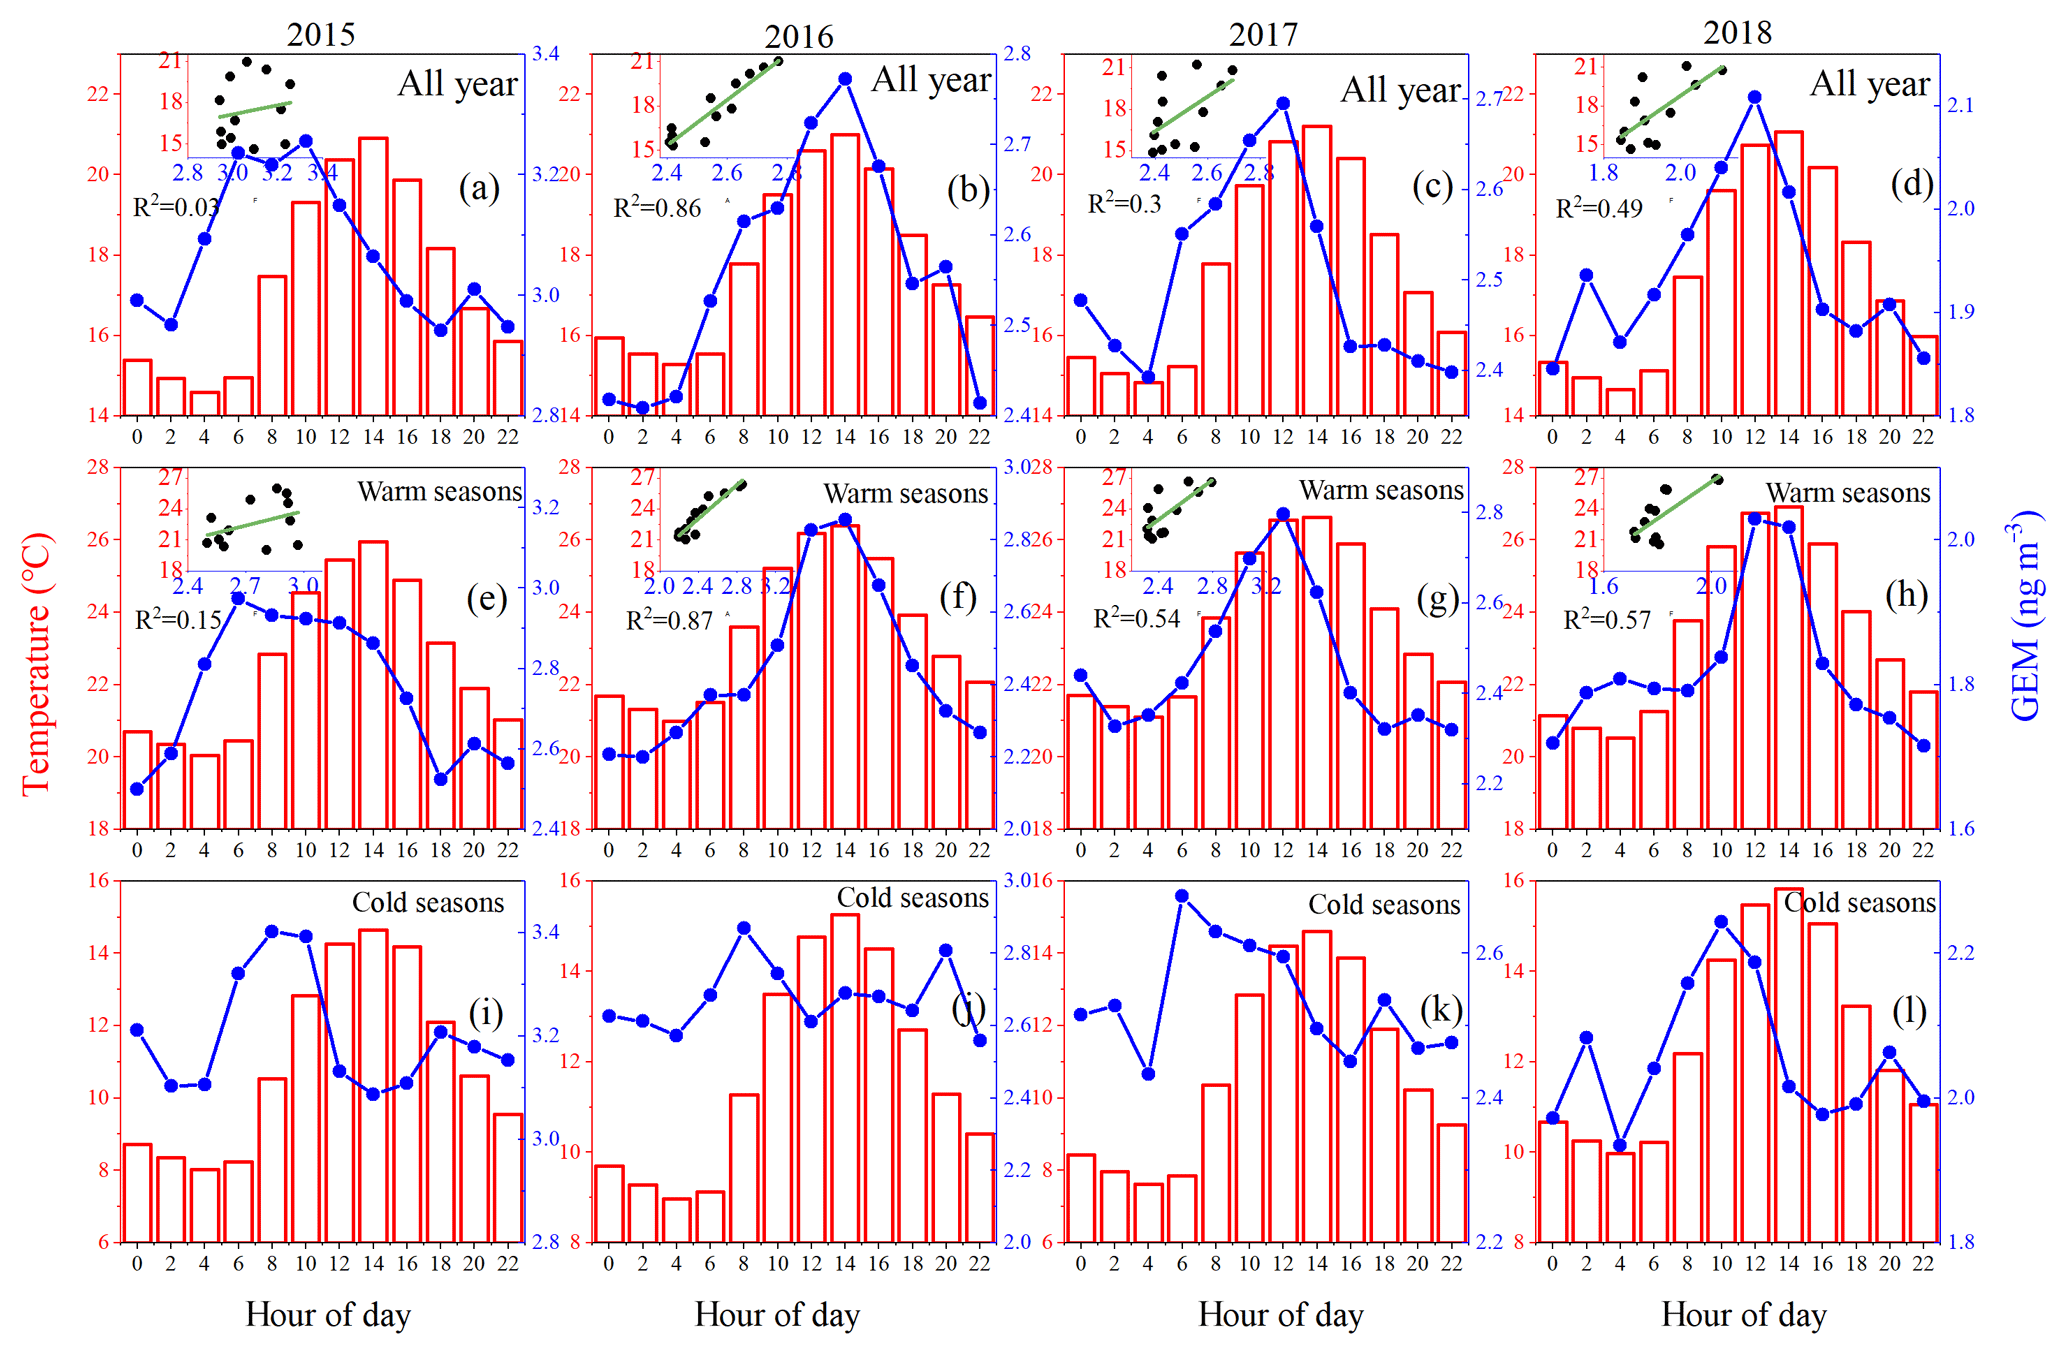
Figure 4Diurnal patterns of bi-hourly GEM concentrations and temperature for the (a–d) whole year, (e–h) warm seasons, and (i–l) cold seasons during 2015–2018. The linear correlations between GEM and temperature are inserted as insets.
Due to the large differences in ambient temperature between warm (from June to November) and cold (from December to May) seasons in the YRD region, the effects of temperature-dependent GEM sources on the ambient GEM concentrations should be different in different seasons. As expected, high correlations between GEM concentrations and temperature were found in the warm seasons, with R2 being in the range of 0.15 to 0.87 (Fig. 4e–h), while nearly no correlations were found in the cold seasons (Fig. 4i–l). Thus, the influence of natural surface emissions on ambient GEM concentration was important in the warm seasons but may not be the case in the cold seasons. The seasonal bivariate polar plots of GEM showed that high GEM concentrations were associated frequently with airflows from the south and southwest and occasionally with those from the north, particularly in summer (Fig. S1 in the Supplement). This was consistent with the findings in previous studies which showed stronger natural surface emissions in southern and southwestern China than northern China (Wang et al., 2016, 2006; Feng et al., 2005; Sommar et al., 2016). Hence, in the context of significant reduction of anthropogenic mercury emission in China, especially in northern China (Liu et al., 2019), natural surface emissions significantly impacted the ambient GEM concentrations at this sampling site.
3.2 Quantify the contributions from natural surface emissions to ambient gaseous elemental mercury
3.2.1 Development of the approach
A method is developed below for quantifying the contributions of GEM emissions from natural surfaces to ambient GEM concentrations through application of the PMF model by introducing specific variables related to natural surface emissions as traces. The first step is to identify what variables are directly or indirectly related to the natural surface emissions of GEM. Temperature is certainly a dominant one, as has been demonstrated in existing soil–air fluxes studies of mercury (X. Wang et al., 2014; Zhu et al., 2016; Poissant and Casimir, 1998). The formation pathways of Hg0 in soil are all related to temperature – an empirical rule suggests that a 10 ∘C temperature increase doubles the rates for chemical reaction near room temperature, which has been proven to be applicable to HgII reduction in boreal soil (Moore and Carpi, 2005; Quinones and Anthony, 2011; Wang et al., 2016; Pannu et al., 2014). Discussions in Sect. 3.1.2 also suggested temperature as a potentially useful tracer for predicting natural surface emissions of GEM. A second candidate of tracers could be ambient NH3 concentration because soil emissions of GEM and NH3, both of which are temperature dependent, are treated in a similar way in air-quality modeling studies (Wright and Zhang, 2015; Zhang et al., 2010). As shown in Fig. S2, the mean diurnal variations in GEM concentrations are highly correlated with ambient temperature as well as NH3. From this perspective, NH3 can be regarded as an indirect proxy for the natural surface emissions of GEM. In a previous study, we have applied principal component analysis for source apportionment of mercury in this area, and the source factor with high loadings for temperature and NH3 was interpreted as natural surface emissions of GEM (Qin et al., 2019).
Hence, in this study, we included the data of temperature and NH3 in the PMF model to apportion the sources of GEM. As shown in Figs. S3–S18, the source apportionment results for all the seasons of 2015–2018 all resolved a similar factor with high loadings of temperature and moderate loadings of NH3 and GEM. This factor was thought to be the natural surface emission sources of mercury. As for the other resolved factors, the factor with high loadings of V and Ni evidently represented shipping emissions, because Ni and V have been considered as typical tracers of heavy-oil combustion, which has been commonly used in marine vessels (Viana et al., 2009). The factor with a high loading of Ca was assigned to cement production as the raw materials used in cement production contain a large amount of calcium compounds. Moderate loadings of multiple species including Cr, Mn, and Fe were found in one factor which was identified as iron and steel production. The factor with a high loading of NO was identified as vehicle emissions, as the major source of NOx in the YRD region is mobile oil combustion (Tang et al., 2018). And the last factor was identified as coal combustion due to the high loadings of As and Se and due to moderate contributions from Pb and . As, Se, and Pb were all typical tracers of coal combustion, and the precursor of (i.e. SO2) also mainly derived from coal combustion.
In order to verify the PMF modeling results, we first examined the PMF model performance. Table S2 shows the coefficient of determination (R2) for GEM according to the observation–prediction scatter plots (Figs. S20–S23). The R2 values ranged from 0.37 to 0.89, suggesting acceptable model performance. Figures S24–S27 display the time series of observed and predicted GEM concentrations from 2015 to 2018, which revealed that, except for a few extremely high observation values, the model can reproduce the observed GEM concentration relatively well on an hourly basis.
To further verify the reliability of the resolved factors, the correlations between the mass contributions of all factors to GEM and temperature were examined on the basis of diurnal profiles. As shown in Fig. S19, positive correlation was only found between the natural surface emissions factor and temperature, while the other resolved factors (i.e. vehicle emission, coal combustion, shipping activities, cement production, and iron and steel production) did not show this relationship. In addition, the relationship between particulate black carbon (BC) and GEM concentration was investigated. On the one hand, BC mainly derived from various combustion processes, which were also the main anthropogenic sources of atmospheric mercury. On the other hand, BC was never introduced into the PMF modeling. As shown in Fig. 5, the observed total GEM and BC concentrations only showed weak correlations. This was mainly due to the fact that besides anthropogenic sources, natural sources also contributed significantly to GEM. As a comparison, anthropogenic GEM concentrations (extracted from PMF results) showed much better correlations with BC from 2015 to 2018. In addition, the time series of anthropogenic GEM concentrations generally varied consistently with CO, which was also a tracer of fuel combustion (Fig. S28). All the evidence above corroborated that by using temperature and NH3 as tracers for PMF modeling, the separation of anthropogenic and natural GEM can be successfully achieved.
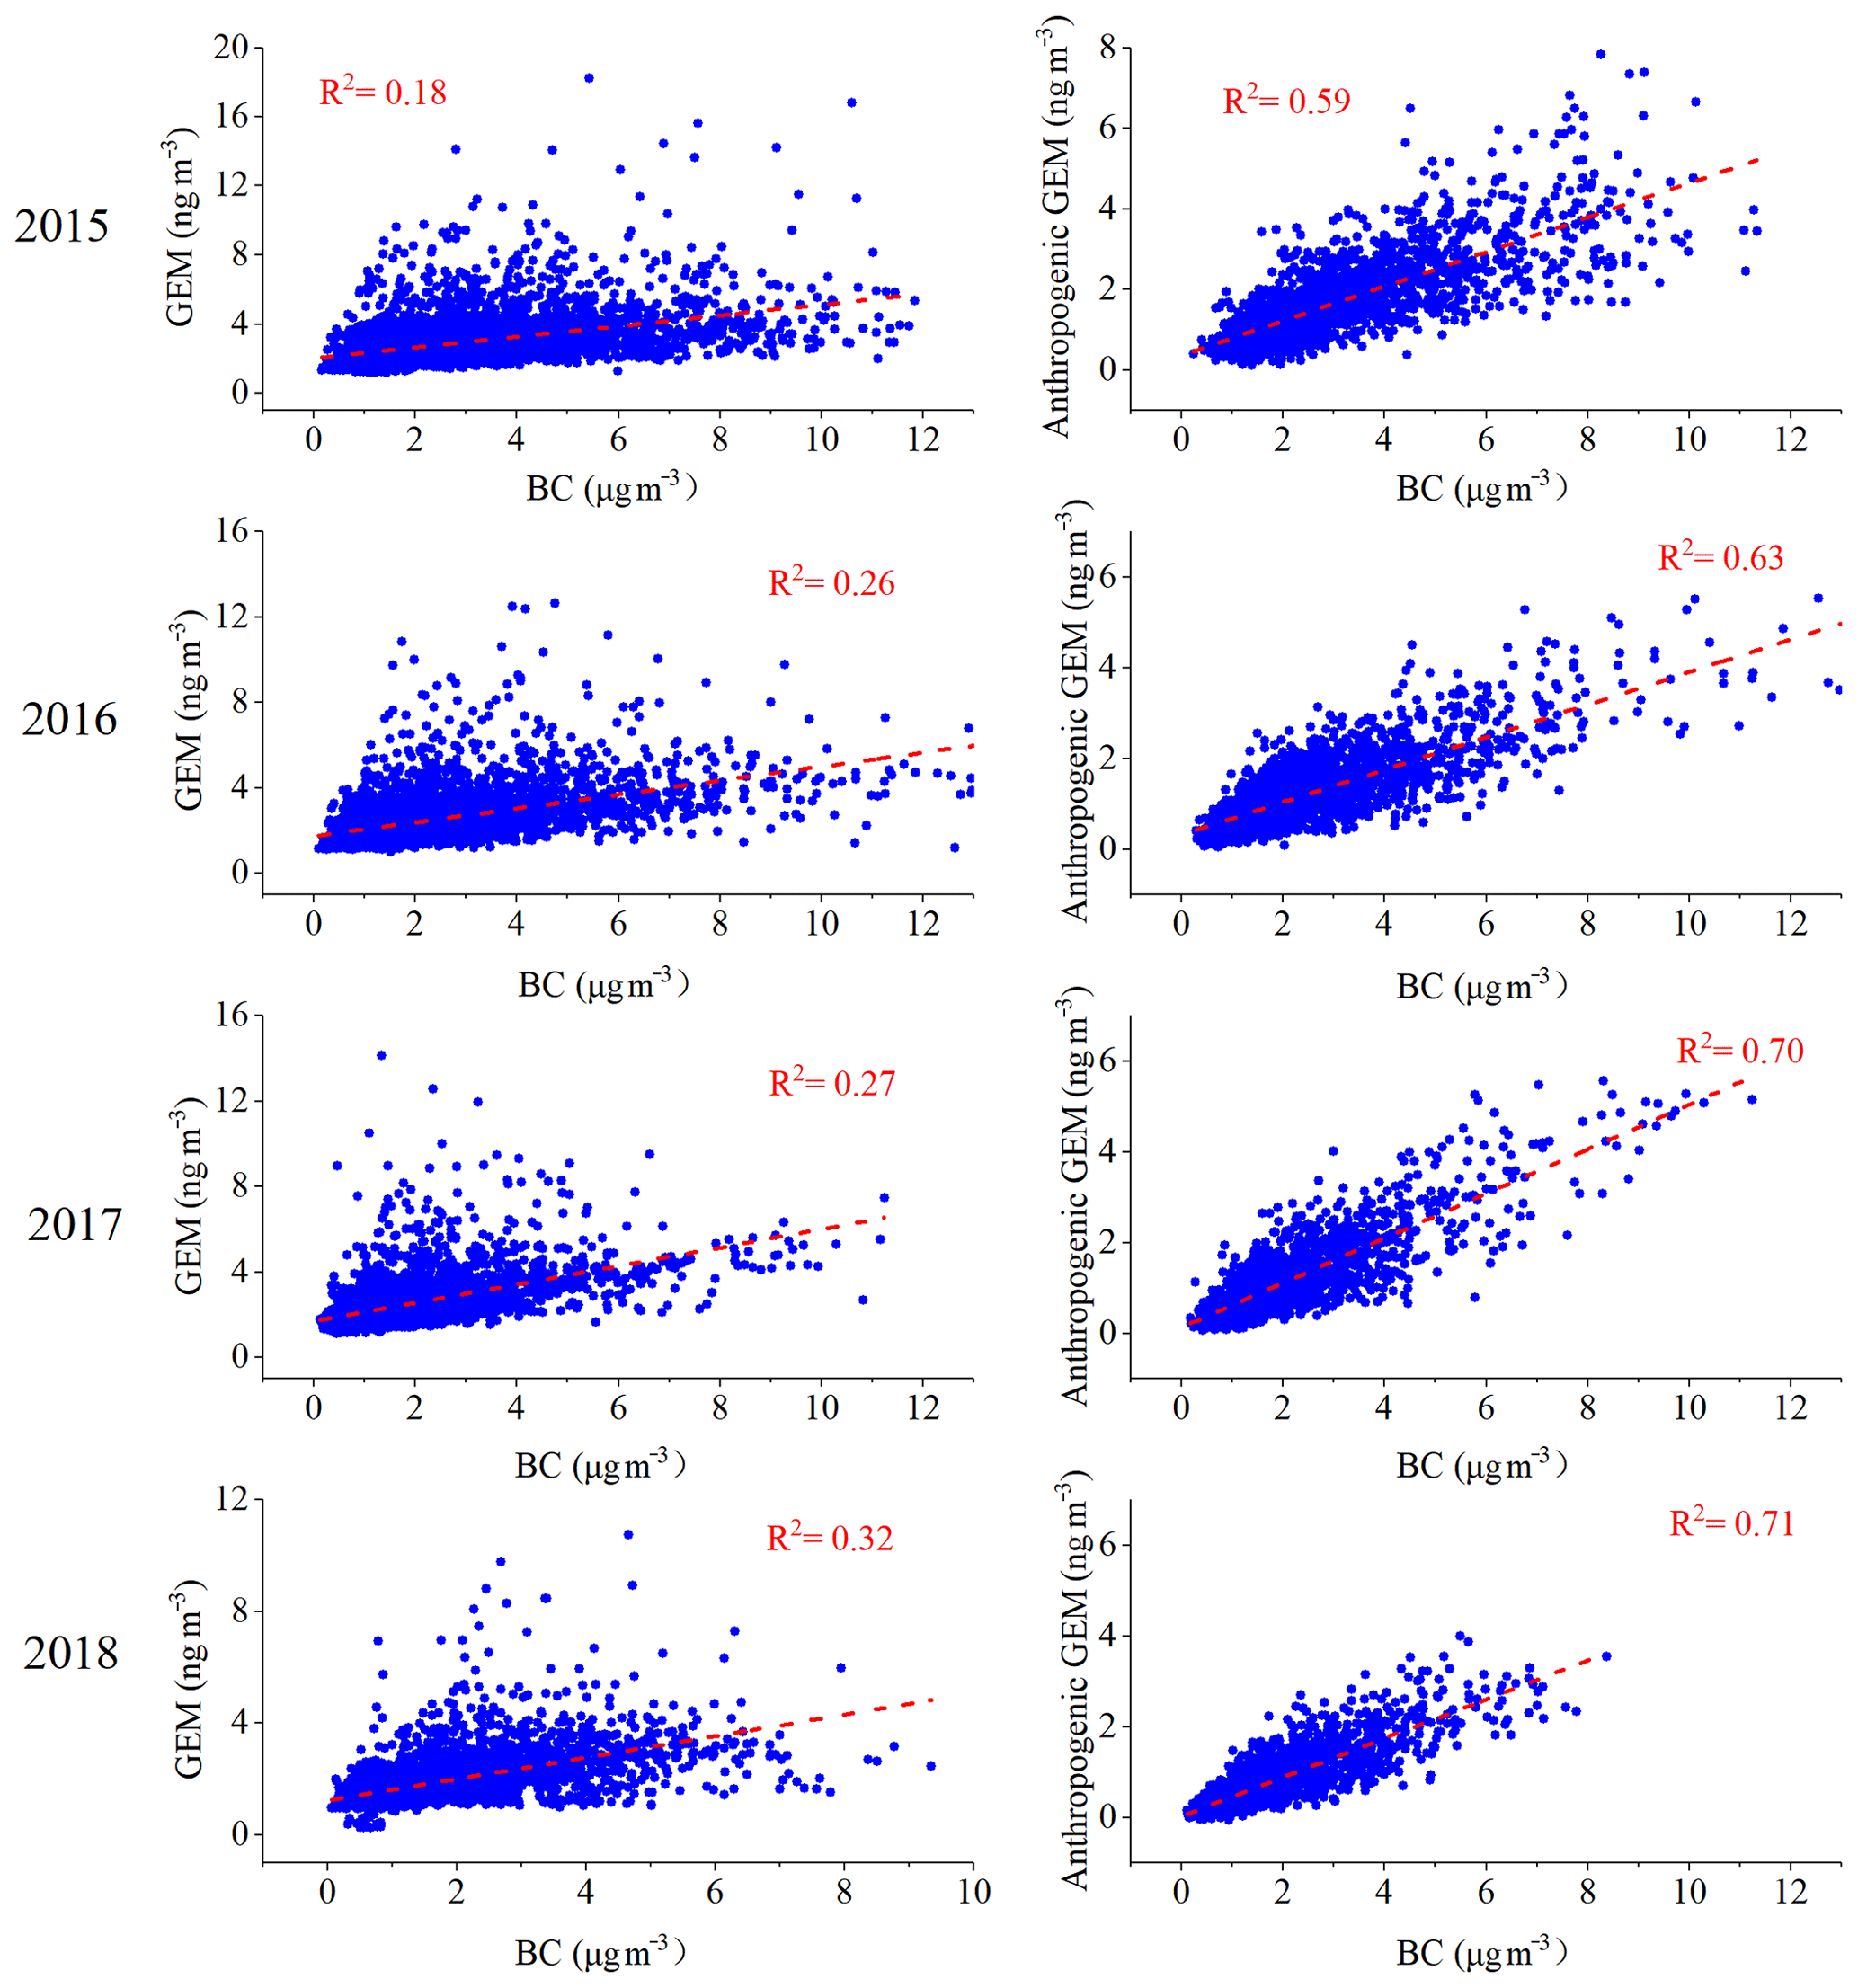
Figure 5The relationship between observed GEM and BC and anthropogenic GEM (extracted from PMF results) and BC during 2015–2018.
As for the specific anthropogenic mercury sources extracted from PMF results, Fig. S29 shows that the time series of coal combustion GEM also varied consistently with SO2, indicating that the coal combustion factor resolved by PMF was credible. As shown in Fig. S30, the potential source regions of shipping GEM were found mainly over coastal and oceanic areas, indicating the shipping factor resolved in this study was also valid. Figures S31 and S32 show that the potential source contribution function (PSCF) signals of cement production GEM were relatively weak in the YRD region, while there were substantial high-PSCF signals for iron and steel production GEM in eastern China. All the results above collectively confirmed that the PMF results were robust.
3.2.2 Increasing contributions from natural surface emissions to ambient gaseous elemental mercury
Figure 6 summarizes the contributions of natural surface emissions and anthropogenic emissions to GEM on seasonal basis from 2015 to 2018. The contributions of natural surface emissions to GEM were ∼40 % higher in summer (1.15±0.60 ng m−3) than winter (0.82±0.57 ng m−3). Besides, the contributions of natural surface emissions to GEM exhibited an upward trend, e.g., increased from 33 % to 53 % in spring, 47 % to 62 % in summer, 49 % to 60 % in autumn, and 34 % to 52 % in winter, from 2015 to 2018 (Fig. 6). In contrast, the contributions from anthropogenic sources to GEM showed a downward trend, of which the decreased contribution from coal combustion accounted the most. Coal combustion has been widely regarded as the dominant anthropogenic source of mercury emissions at the global scale, and China is known as the largest coal producer and consumer in the world (Zhang et al., 2012; Wu et al., 2006). Since 2013, a series of key air pollution control measures have been applied in China to reduce the emission of air pollutants (Zheng et al., 2018). YRD regions also took actions by regulating on the amount of coal consumption, promoting renewable energy development and so on (Zheng et al., 2016). Hence, the decreased contribution of coal combustion was attributed to the implementation of aggressive air pollutant control measures in China in recent years, which subsequently led to an increase in the relative contribution of natural surface emissions to GEM.
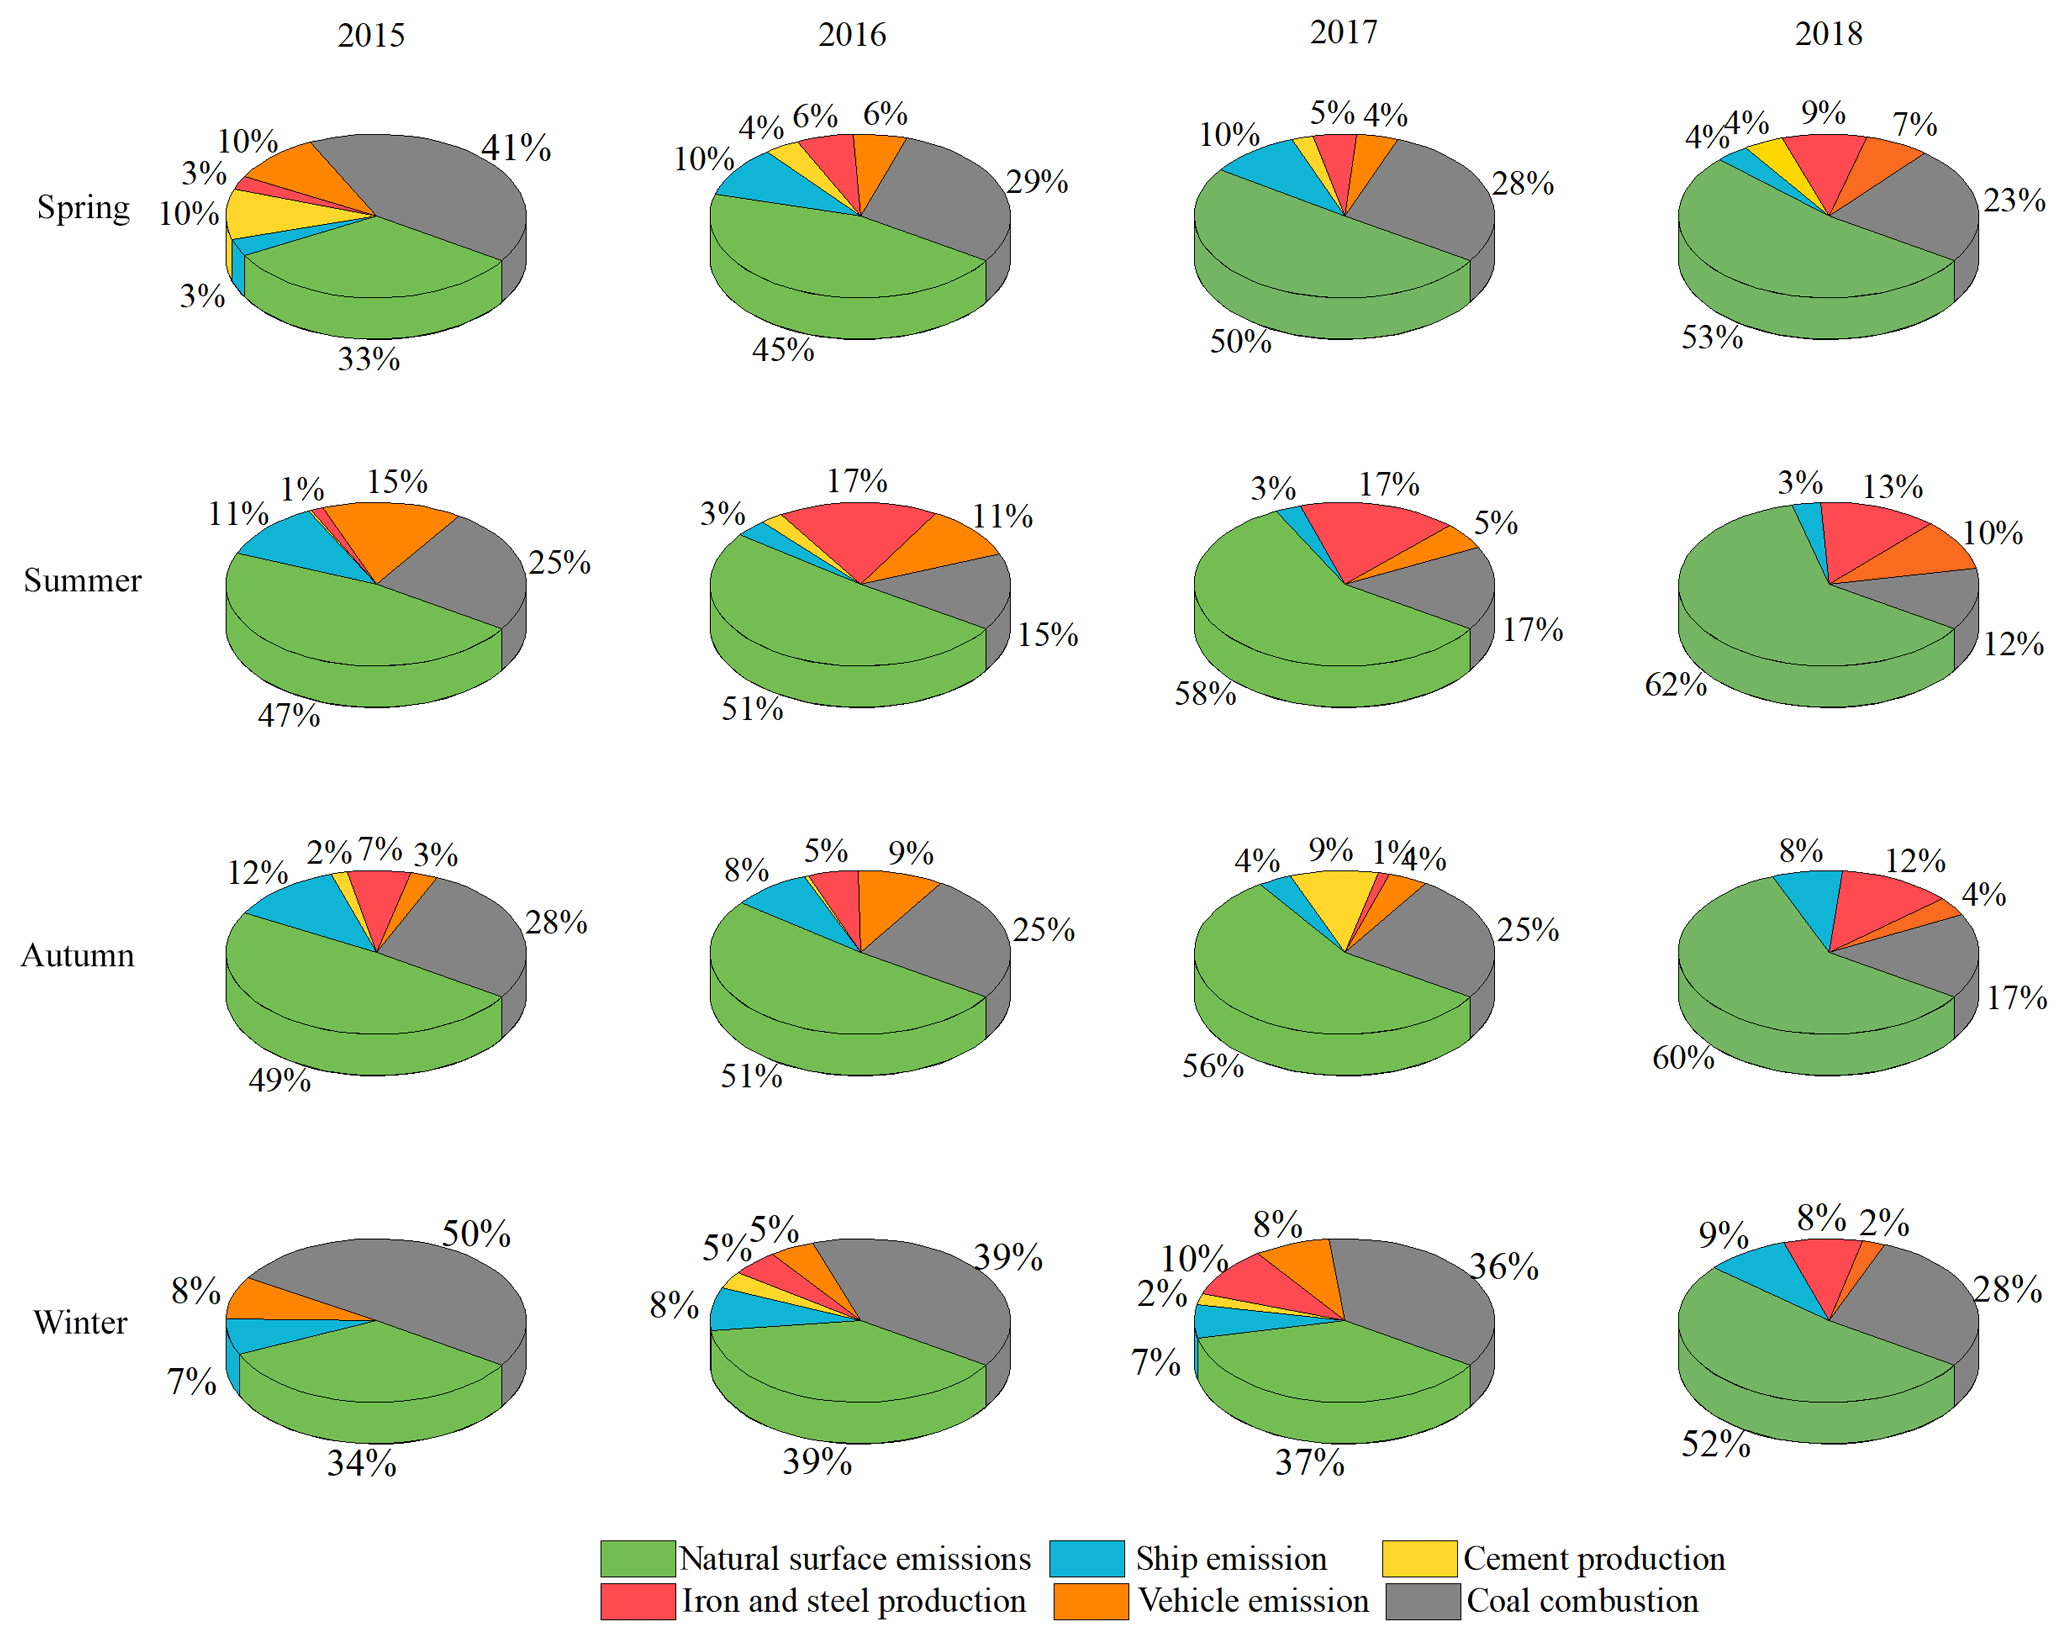
Figure 6Contributions of natural surface emissions and anthropogenic sources to atmospheric GEM in the four seasons during 2015–2018.
The absolute GEM concentrations contributed by both natural surface emissions and anthropogenic emissions can be extracted from the PMF modeling results. Figure 7 exhibits the monthly and yearly profiles from 2015 to 2018. Strong seasonal cycles of GEM contributed by natural surface emissions were seen, corresponding to the seasonal pattern of ambient temperature (Fig. 7g) and the simulated monthly Hg fluxes from natural surface emissions in China (Wang et al., 2016). The annual GEM concentration contributed by natural surface emissions was estimated to be 1.04±0.55, 1.10±0.56, 1.13±0.56, and 1.00±0.45 ng m−3 from 2015 to 2018, respectively (Fig. 7a, b), which almost remained unchanged. This could be mainly explained by the little variation in annual temperature (Fig. 7h) and wind pattern from 2015 to 2018 (Fig. S33). On the contrary, the annual GEM concentration contributed by anthropogenic emissions was estimated to be 1.53±1.04, 1.26±0.78, 1.23±0.95 and 0.82±0.58 ng m−3 from 2015 to 2018, respectively, showing an obvious decreasing trend (Fig. 7c, d). It was noted that the GEM concentration contributed by anthropogenic emissions dropped the most from 2017 to 2018 with a rate of around 40 %. In referring to Table S3, it can be seen that SO2 and CO concentrations also decreased significantly by about 35 % and 18 % during the same period, respectively. As SO2 and CO were the main primary gaseous pollutants emitted from fuel combustions, their sharp decreases indicated the significant reduction of anthropogenic emissions, which was probably responsible for large drop of GEM from 2017 to 2018. Overall, the relative contribution of natural surface emissions to ambient GEM was on the rise, e.g., from 41 % in 2015 to 57 % in 2018 on annual average (Fig. 7e, f).

Figure 7The monthly and annual GEM concentrations contributed by (a, b) natural surface emissions and (c, d) anthropogenic emissions from 2015 to 2018. (e, f) The monthly and annual contribution of natural surface emissions to GEM concentrations from 2015 to 2018. (g, h) The corresponding ambient temperature from 2015 to 2018.
Through a 4-year continuous measurement of GEM in the suburbs of Shanghai, a clear decreasing trend was observed with the rate of ng m−3 yr−1, which was mainly due to the reduction of anthropogenic mercury emissions. The lower decreasing rate in warm seasons than in cold seasons and the high correlation between GEM concentrations and temperature suggested that natural surface emissions significantly impacted the GEM concentrations. By demonstrating that temperature and NH3 can serve well as tracers of natural surface mercury emissions, distinguishing natural vs. anthropogenic contributions to GEM was doable by introducing these tracers into the PMF model. The results indicated that the contribution from anthropogenic mercury emissions was declining, especially from coal combustion. The annual absolute contributions of natural surface emissions were in the range of 1.00–1.13 ng m−3, and the relative contribution of natural surface emissions to GEM increased from 41 % in 2015 to 57 % in 2018. Measurements of GEM and other pollutants in a regional background area in eastern China demonstrated the effectiveness of emission control policies in this and surrounding regions in China in recent years. The decreasing contributions from anthropogenic sources and the relatively stable contributions from natural surface emissions to the ambient GEM have resulted in the relative contributions of natural surface emissions surpassing those of anthropogenic emissions in more recent years. This trend will likely continue for some years considering the current pollution levels in China, which needs further pollution abatement. This implies that even though the anthropogenic emissions of mercury would continue to decrease, the legacy mercury in the natural surfaces will continue to emit steadily for a long period of time. In addition, the natural release of mercury could be enhanced under a climate warming scenario. Hence, the atmospheric mercury concentration in YRD or other parts of China will remain at relatively high levels in the near future, which brings big challenges to China's policies on mercury emission reduction. The methodology developed in the present study could also shed some light on source apportionment of atmospheric mercury in the other regions of the world and has potential for improving emission databases from natural surfaces where ambient GEM and auxiliary data are available.
It has to be noted that according to our results, ship emission was identified to be an important source of mercury, which has not been included in previous emission inventory studies. Mercury emission factors from shipping are lacking, and field measurements will be needed to verify it. Moreover, we realize that the application of PMF in the source apportionment of atmospheric mercury sources has certain limitations. Source-specific indicators are preferred; however, most indicators used for source identification have multiple sources, which have added uncertainties to our results. We suggest that in future research, the application of the PMF model is limited to the separation of the natural and total anthropogenic sources of GEM, which has been proven to be credible.
All data used in this study can be requested from Kan Huang (huangkan@fudan.edu.cn).
The supplement related to this article is available online at: https://doi.org/10.5194/acp-20-10985-2020-supplement.
XQ and KH designed this study. XQ performed measurements and data analysis. XW, QF, QZ, YL, and JH performed data collection. XQ, LZ, KH, and CD wrote the paper. All have commented on and reviewed the paper.
The authors declare that they have no conflict of interest.
This article is part of the special issue “Research results from the 14th International Conference on Mercury as a Global Pollutant (ICMGP 2019), MercOx project, and iGOSP and iCUPE projects of ERA-PLANET in support of the Minamata Convention on Mercury (ACP/AMT inter-journal SI)”. It is not associated with a conference.
We sincerely thank SEMC for maintaining the Dianshan Lake supersite. We also thank the handling editor and two reviewers for providing the insightful comments and suggestions. Kan Huang also acknowledges Jiangsu Shuangchuang Program through Jiangsu Fuyu Environmental Technology Co., Ltd.
This research has been supported by the National Key R&D Program of China (grant no. 2018YFC0213105), the National Natural Science Foundation of China (grant nos. 91644105 and 21777029), and the Natural Science Foundation of Shanghai (grant nos. 18230722600 and 19ZR1421100).
This paper was edited by Qiang Zhang and reviewed by two anonymous referees.
Carslaw, D. C. and Ropkins, K.: openair – An R package for air quality data analysis, Environ. Modell. Softw., 27–28, 52–61, https://doi.org/10.1016/j.envsoft.2011.09.008, 2012.
Carslaw, D. C., Beevers, S., Ropkins, K., and Bell, M.: Detecting and quantifying aircraft and other on-airport contributions to ambient nitrogen oxides in the vicinity of a large international airport, Atmos. Environ., 40, 5424–5434, https://doi.org/10.1016/j.atmosenv.2006.04.062, 2006.
Chang, Y., Zou, Z., Deng, C., Huang, K., Collett, J. L., Lin, J., and Zhuang, G.: The importance of vehicle emissions as a source of atmospheric ammonia in the megacity of Shanghai, Atmos. Chem. Phys., 16, 3577–3594, https://doi.org/10.5194/acp-16-3577-2016, 2016.
Chang, Y., Deng, C., Cao, F., Cao, C., Zou, Z., Liu, S., Lee, X., Li, J., Zhang, G., and Zhang, Y.: Assessment of carbonaceous aerosols in Shanghai, China – Part 1: long-term evolution, seasonal variations, and meteorological effects, Atmos. Chem. Phys., 17, 9945–9964, https://doi.org/10.5194/acp-17-9945-2017, 2017.
Cheng, I., Xu, X., and Zhang, L.: Overview of receptor-based source apportionment studies for speciated atmospheric mercury, Atmos. Chem. Phys., 15, 7877–7895, https://doi.org/10.5194/acp-15-7877-2015, 2015.
Clarkson, T. W. and Magos, L.: The toxicology of mercury and its chemical compounds, Crit. Rev. Toxicol., 36, 609–662, https://doi.org/10.1080/10408440600845619, 2006.
Driscoll, C. T., Mason, R. P., Chan, H. M., Jacob, D. J., and Pirrone, N.: Mercury as a global pollutant: sources, pathways, and effects, Environ. Sci. Technol., 47, 4967–4983, https://doi.org/10.1021/es305071v, 2013.
Duan, L., Wang, X., Wang, D., Duan, Y., Cheng, N., and Xiu, G.: Atmospheric mercury speciation in Shanghai, China, Sci. Total Environ., 578, 460–468, https://doi.org/10.1016/j.scitotenv.2016.10.209, 2017.
Feng, X. B., Wang, S. F., Qiu, G. A., Hou, Y. M., and Tang, S. L.: Total gaseous mercury emissions from soil in Guiyang, Guizhou, China, J. Geophys. Res.-Atmos., 110, D14306, https://doi.org/10.1029/2004JD005643, 2005.
Friedli, H. R., Arellano, A. F., Cinnirella, S., and Pirrone, N.: Initial Estimates of Mercury Emissions to the Atmosphere from Global Biomass Burning, Environ. Sci. Technol., 43, 3507–3513, https://doi.org/10.1021/es802703g, 2009.
Fu, X. W., Feng, X. B., Sommar, J., and Wang, S. F.: A review of studies on atmospheric mercury in China, Sci. Total Environ., 421, 73–81, https://doi.org/10.1016/j.scitotenv.2011.09.089, 2012.
Gibson, M. D., Haelssig, J., Pierce, J. R., Parrington, M., Franklin, J. E., Hopper, J. T., Li, Z., and Ward, T. J.: A comparison of four receptor models used to quantify the boreal wildfire smoke contribution to surface PM2.5 in Halifax, Nova Scotia during the BORTAS-B experiment, Atmos. Chem. Phys., 15, 815–827, https://doi.org/10.5194/acp-15-815-2015, 2015.
Gustin, M. S., Lindberg, S. E., and Weisberg, P. J.: An update on the natural sources and sinks of atmospheric mercury, Appl. Geochem., 23, 482–493, https://doi.org/10.1016/j.apgeochem.2007.12.010, 2008.
Horowitz, H. M., Jacob, D. J., Zhang, Y., Dibble, T. S., Slemr, F., Amos, H. M., Schmidt, J. A., Corbitt, E. S., Marais, E. A., and Sunderland, E. M.: A new mechanism for atmospheric mercury redox chemistry: implications for the global mercury budget, Atmos. Chem. Phys., 17, 6353–6371, https://doi.org/10.5194/acp-17-6353-2017, 2017.
Howard, D. and Edwards, G. C.: Mercury fluxes over an Australian alpine grassland and observation of nocturnal atmospheric mercury depletion events, Atmos. Chem. Phys., 18, 129–142, https://doi.org/10.5194/acp-18-129-2018, 2018.
Kocman, D., Horvat, M., Pirrone, N., and Cinnirella, S.: Contribution of contaminated sites to the global mercury budget, Environ. Res., 125, 160–170, https://doi.org/10.1016/j.envres.2012.12.011, 2013.
Landis, M. S. and Keeler, G. J.: Atmospheric mercury deposition to Lake Michigan during the Lake Michigan Mass Balance Study, Environ. Sci. Technol., 36, 4518–4524, https://doi.org/10.1021/es011217b, 2002.
Lindberg, S. E., Zhang, H., Vette, A. F., Gustin, M. S., Barnett, M. O., and Kuiken, T.: Dynamic flux chamber measurement of gaseous mercury emission fluxes over soils: Part 2 – effect of flushing flow rate and verification of a two-resistance exchange interface simulation model, Atmos. Environ., 36, 847–859, https://doi.org/10.1016/s1352-2310(01)00502-7, 2002.
Liu, K., Wu, Q., Wang, L., Wang, S., Liu, T., Ding, D., Tang, Y., Li, G., Tian, H., Duan, L., Wang, X., Fu, X., Feng, X., and Hao, J.: Measure-Specific Effectiveness of Air Pollution Control on China's Atmospheric Mercury Concentration and Deposition during 2013–2017, Environ. Sci. Technol., 53, 8938–8946, https://doi.org/10.1021/acs.est.9b02428, 2019.
Mao, H., Talbot, R. W., Sigler, J. M., Sive, B. C., and Hegarty, J. D.: Seasonal and diurnal variations of Hg° over New England, Atmos. Chem. Phys., 8, 1403–1421, https://doi.org/10.5194/acp-8-1403-2008, 2008.
Mason, R. P.: Mercury emissions from natural processes and their importance in the global mercury cycle, in: Mercury Fate and Transport in the Global Atmosphere: Emissions, Measurements and Models, edited by: Mason, R. and Pirrone, N., Springer US, Boston, MA, 173–191, 2009.
Mason, R. P., and Sheu, G. R.: Role of the ocean in the global mercury cycle, Global Biogeochem. Cy., 16, 1093, https://doi.org/10.1029/2001gb001440, 2002.
Moore, C. and Carpi, A.: Mechanisms of the emission of mercury from soil: Role of UV radiation, J. Geophys. Res.-Atmos., 110, D24302, https://doi.org/10.1029/2004jd005567, 2005.
Pannu, R., Siciliano, S. D., and O'Driscoll, N. J.: Quantifying the effects of soil temperature, moisture and sterilization on elemental mercury formation in boreal soils, Environ. Pollut., 193, 138–146, https://doi.org/10.1016/j.envpol.2014.06.023, 2014.
Pirrone, N., Cinnirella, S., Feng, X., Finkelman, R. B., Friedli, H. R., Leaner, J., Mason, R., Mukherjee, A. B., Stracher, G. B., Streets, D. G., and Telmer, K.: Global mercury emissions to the atmosphere from anthropogenic and natural sources, Atmos. Chem. Phys., 10, 5951–5964, https://doi.org/10.5194/acp-10-5951-2010, 2010.
Poissant, L. and Casimir, A.: Water-air and soil-air exchange rate of total gaseous mercury measured at background sites, Atmos. Environ., 32, 883–893, https://doi.org/10.1016/s1352-2310(97)00132-5, 1998.
Polissar, A. V., Hopke, P. K., and Paatero, P.: Atmospheric aerosol over Alaska – 2. Elemental composition and sources, J. Geophys. Res.-Atmos., 103, 19045–19057, https://doi.org/10.1029/98jd01212, 1998.
Qin, X., Wang, X., Shi, Y., Yu, G., Zhao, N., Lin, Y., Fu, Q., Wang, D., Xie, Z., Deng, C., and Huang, K.: Characteristics of atmospheric mercury in a suburban area of east China: sources, formation mechanisms, and regional transport, Atmos. Chem. Phys., 19, 5923–5940, https://doi.org/10.5194/acp-19-5923-2019, 2019.
Quinones, J. L. and Carpi, A.: An Investigation of the Kinetic Processes Influencing Mercury Emissions from Sand and Soil Samples of Varying Thickness, J. Environ. Qual., 40, 647–652, https://doi.org/10.2134/jeq2010.0327, 2011.
Schroeder, W. H. and Munthe, J.: Atmospheric mercury – An overview, Atmos. Environ., 32, 809–822, https://doi.org/10.1016/s1352-2310(97)00293-8, 1998.
Sommar, J., Zhu, W., Shang, L., Lin, C.-J., and Feng, X.: Seasonal variations in metallic mercury (Hg0) vapor exchange over biannual wheat–corn rotation cropland in the North China Plain, Biogeosciences, 13, 2029–2049, https://doi.org/10.5194/bg-13-2029-2016, 2016.
Song, S., Selin, N. E., Soerensen, A. L., Angot, H., Artz, R., Brooks, S., Brunke, E.-G., Conley, G., Dommergue, A., Ebinghaus, R., Holsen, T. M., Jaffe, D. A., Kang, S., Kelley, P., Luke, W. T., Magand, O., Marumoto, K., Pfaffhuber, K. A., Ren, X., Sheu, G.-R., Slemr, F., Warneke, T., Weigelt, A., Weiss-Penzias, P., Wip, D. C., and Zhang, Q.: Top-down constraints on atmospheric mercury emissions and implications for global biogeochemical cycling, Atmos. Chem. Phys., 15, 7103–7125, https://doi.org/10.5194/acp-15-7103-2015, 2015.
Streets, D. G., Devane, M. K., Lu, Z. F., Bond, T. C., Sunderland, E. M., and Jacob, D. J.: All-Time Releases of Mercury to the Atmosphere from Human Activities, Environ. Sci. Technol., 45, 10485–10491, https://doi.org/10.1021/es202765m, 2011.
Tang, Y., Wang, S., Wu, Q., Liu, K., Wang, L., Li, S., Gao, W., Zhang, L., Zheng, H., Li, Z., and Hao, J.: Recent decrease trend of atmospheric mercury concentrations in East China: the influence of anthropogenic emissions, Atmos. Chem. Phys., 18, 8279–8291, https://doi.org/10.5194/acp-18-8279-2018, 2018.
Viana, M., Amato, F., Alastuey, A., Querol, X., Moreno, T., García Dos Santos, S., Herce, M. D., and Fernández-Patier, R.: Chemical Tracers of Particulate Emissions from Commercial Shipping, Environ. Sci. Technol., 43, 7472–7477, https://doi.org/10.1021/es901558t, 2009.
Wang, D. Y., He, L., Shi, X. J., Wei, S. Q., and Feng, X. B.: Release flux of mercury from different environmental surfaces in Chongqing, China, Chemosphere, 64, 1845–1854, https://doi.org/10.1016/j.chemosphere.2006.01.054, 2006.
Wang, L., Wang, S. X., Zhang, L., Wang, Y. X., Zhang, Y. X., Nielsen, C., McElroy, M. B., and Hao, J. M.: Source apportionment of atmospheric mercury pollution in China using the GEOS-Chem model, Environ. Pollut., 190, 166–175, https://doi.org/10.1016/j.envpol.2014.03.011, 2014.
Wang, X., Lin, C. J., and Feng, X.: Sensitivity analysis of an updated bidirectional air–surface exchange model for elemental mercury vapor, Atmos. Chem. Phys., 14, 6273–6287, https://doi.org/10.5194/acp-14-6273-2014, 2014.
Wang, X., Lin, C.-J., Yuan, W., Sommar, J., Zhu, W., and Feng, X.: Emission-dominated gas exchange of elemental mercury vapor over natural surfaces in China, Atmos. Chem. Phys., 16, 11125–11143, https://doi.org/10.5194/acp-16-11125-2016, 2016.
Wright, L. P. and Zhang, L. M.: An approach estimating bidirectional air-surface exchange for gaseous elemental mercury at AMNet sites, J. Adv. Model. Earth Sy., 7, 35–49, https://doi.org/10.1002/2014ms000367, 2015.
Wright, L. P., Zhang, L., Cheng, I., Aherne, J., and Wentworth, G. R.: Impacts and Effects Indicators of Atmospheric Deposition of Major Pollutants to Various Ecosystems – A Review, Aerosol Air Qual. Res., 18, 1953–1992, https://doi.org/10.4209/aaqr.2018.03.0107, 2018.
Wu, Q. R., Wang, S. X., Li, G. L., Liang, S., Lin, C. J., Wang, Y. F., Cai, S. Y., Liu, K. Y., and Hao, J. M.: Temporal Trend and Spatial Distribution of Speciated Atmospheric Mercury Emissions in China During 1978–2014, Environ. Sci. Technol., 50, 13428–13435, https://doi.org/10.1021/acs.est.6b04308, 2016.
Wu, Y., Wang, S. X., Streets, D. G., Hao, J. M., Chan, M., and Jiang, J. K.: Trends in anthropogenic mercury emissions in China from 1995 to 2003, Environ. Sci. Technol., 40, 5312–5318, https://doi.org/10.1021/es060406x, 2006.
Xu, X., Liao, Y., Cheng, I., and Zhang, L.: Potential sources and processes affecting speciated atmospheric mercury at Kejimkujik National Park, Canada: comparison of receptor models and data treatment methods, Atmos. Chem. Phys., 17, 1381–1400, https://doi.org/10.5194/acp-17-1381-2017, 2017.
Xu, X. H., Yang, X. S., Miller, D. R., Helble, J. J., and Carley, R. J.: Formulation of bi-directional atmosphere-surface exchanges of elemental mercury, Atmos. Environ., 33, 4345–4355, https://doi.org/10.1016/s1352-2310(99)00245-9, 1999.
Yu, Y., He, S., Wu, X., Zhang, C., Yao, Y., Liao, H., Wang, Q., and Xie, M.: PM2.5 elements at an urban site in Yangtze River Delta, China: High time-resolved measurement and the application in source apportionment, Environ. Pollut., 253, 1089–1099, https://doi.org/10.1016/j.envpol.2019.07.096, 2019.
Zhang, L., Wright, L. P., and Asman, W. A. H.: Bi-directional air-surface exchange of atmospheric ammonia: A review of measurements and a development of a big-leaf model for applications in regional-scale air-quality models, J. Geophys. Res.-Atmos., 115, D20310, https://doi.org/10.1029/2009jd013589, 2010.
Zhang, L., Wang, S. X., Meng, Y., and Hao, J. M.: Influence of Mercury and Chlorine Content of Coal on Mercury Emissions from Coal-Fired Power Plants in China, Environ. Sci. Technol., 46, 6385–6392, https://doi.org/10.1021/es300286n, 2012.
Zhang, L., Wang, S., Wang, L., Wu, Y., Duan, L., Wu, Q., Wang, F., Yang, M., Yang, H., Hao, J., and Liu, X.: Updated emission inventories for speciated atmospheric mercury from anthropogenic sources in China, Environ. Sci. Technol., 49, 3185–3194, https://doi.org/10.1021/es504840m, 2015.
Zhang, Y., Jacob, D. J., Horowitz, H. M., Chen, L., Amos, H. M., Krabbenhoft, D. P., Slemr, F., St Louis, V. L., and Sunderland, E. M.: Observed decrease in atmospheric mercury explained by global decline in anthropogenic emissions, P. Natl. Acad. Sci. USA, 113, 526–531, https://doi.org/10.1073/pnas.1516312113, 2016.
Zheng, B., Tong, D., Li, M., Liu, F., Hong, C., Geng, G., Li, H., Li, X., Peng, L., Qi, J., Yan, L., Zhang, Y., Zhao, H., Zheng, Y., He, K., and Zhang, Q.: Trends in China's anthropogenic emissions since 2010 as the consequence of clean air actions, Atmos. Chem. Phys., 18, 14095–14111, https://doi.org/10.5194/acp-18-14095-2018, 2018.
Zheng, J., Jiang, P., Qiao, W., Zhu, Y., and Kennedy, E.: Analysis of air pollution reduction and climate change mitigation in the industry sector of Yangtze River Delta in China, Journal of Cleaner Production, 114, 314–322, https://doi.org/10.1016/j.jclepro.2015.07.011, 2016.
Zhu, W., Sommar, J., Lin, C.-J., and Feng, X.: Mercury vapor air–surface exchange measured by collocated micrometeorological and enclosure methods – Part II: Bias and uncertainty analysis, Atmos. Chem. Phys., 15, 5359–5376, https://doi.org/10.5194/acp-15-5359-2015, 2015.
Zhu, W., Lin, C.-J., Wang, X., Sommar, J., Fu, X., and Feng, X.: Global observations and modeling of atmosphere–surface exchange of elemental mercury: a critical review, Atmos. Chem. Phys., 16, 4451–4480, https://doi.org/10.5194/acp-16-4451-2016, 2016.