the Creative Commons Attribution 4.0 License.
the Creative Commons Attribution 4.0 License.
Examining the atmospheric radiative and snow-darkening effects of black carbon and dust across the Rocky Mountains of the United States using WRF-Chem
Stefan Rahimi
Xiaohong Liu
Chun Zhao
Zheng Lu
Zachary J. Lebo
The Weather Research and Forecasting model coupled with Chemistry (WRF-Chem) is run to quantify the in-snow and atmospheric radiative effects of black carbon (BC) and dust on a convective-allowing (4 km) grid for water year 2009 across a large area of the Rocky Mountains. The snow-darkening effect (SDE) due to the deposition of these light-absorbing particles (LAPs) on surface snow enhances snowmelt by 3 to 12 mm during late spring and early summer, effectuating surface runoff increases (decreases) prior to (after) June. Meanwhile, aerosol–radiation interactions (ARIs) associated with LAPs generally dim the surface from incoming solar energy, introducing an energy deficit at the surface and leading to snowpack preservation by 1 to 5 mm. Surface runoff alterations brought forth by LAP ARI are of opposite phase to those associated with LAP SDEs, and the BC SDE drives a majority of the surface energy and hydrological perturbations. More generally, changes in snow water equivalent (SWE) brought forth by LAP effects are more a result of perturbations to the surface energy budget rather than changes in precipitation amount or type. It is also found that perturbations to the surface energy budget by dust ARI can differ in sign from those of BC ARI, with the former being positive, enhancing snow melting, and changing runoff.
- Article
(22605 KB) - Full-text XML
-
Supplement
(4357 KB) - BibTeX
- EndNote
The arid Rocky Mountains of the western United States (WUS) receive most of their precipitation in the form of snowfall from October through March. The resulting snowpack forms a network of natural mesoscale storage reservoirs that provide approximately 80 % of the surface water across the region during the warm season (Serreze et al., 1999; Hamlet et al., 2007). All life in the region fundamentally depends on the timed release of runoff from snowpack; humans rely on these resources for agriculture and power generation. In recent decades, however, there have been observed changes in the hydrology across the WUS associated with external climate forcings (e.g., anthropogenic climate change) that may be acting to compromise the security of water resources across the region and beyond (Hamlet et al., 2007; Kapnick and Hall, 2012; Fyfe et al., 2017; Mote et al., 2018).
Numerous studies have shown that annual maximum snow water equivalent (SWE) values have decreased since 1950 (Das et al., 2009; Mote 2006; Pierce et al., 2008), increasing (decreasing) runoff discharge in the winter and spring (summer) (Rajagopalan et al., 2009; Qian et al., 2009). Externally forced warming associated with greenhouse gases and light-absorbing particles (LAPs; Pierce et al., 2008) and LAP deposition on snowpack (Flanner et al., 2007; Qian et al., 2009, C. Wu et al., 2018; Sarangi et al., 2019), rather than natural climate variability, are believed to be the major contributors to this decrease.
LAPs such as black carbon (BC) and dust can affect the hydrology across the WUS as they interact with sunlight, altering the vertical thermodynamic structure of the atmosphere. These aerosol–radiation interactions (ARIs) may lead to changes in clouds and precipitation amount and type (Pederson et al., 2011). LAPs may also deposit on snowpack, increasing the surface absorptivity and enhancing melting in a process referred to as the snow-darkening effect (SDE; Wiscombe and Warren, 1980; Painter et al., 2007). Surface warming is generally brought about by the SDE, while the surface can either cool or warm from ARI. Both effects have been shown to be important across the region, however, especially since the surface radiative budget is sensitive to small perturbations in albedo (Painter et al., 2007; Qian et al., 2009; Pepin et al., 2015).
LAPs find their way into the WUS from both near-field and far-field sources. BC, produced via the incomplete combustion of fossil fuels and biomass burning, is primarily emitted in WUS cities and by wildfires (Bond et al., 2013). Meanwhile, dust is primarily emitted from southwestern US deserts via wind erosion (Tegen et al., 2004; Painter et al., 2007). Following emission, both aerosols are transported downstream by prevailing westerlies toward the Rocky Mountain region. Additionally, a sizable component of atmospheric dust across the WUS originates from Asian sources (Fischer et al., 2009).
LAP SDE and ARI across the WUS have been studied using global climate models (GCMs) (Flanner et al., 2007; Qian et al., 2009; C. Wu et al., 2018) and regional climate models (RCMs) (L. Wu et al., 2018; Sarangi et al., 2019), each with their own advantages and drawbacks. Heterogeneous mesoscale meteorology features (i.e., precipitation, temperature, and snow characteristics) can be simulated better with RCMs than GCMs, as higher grid resolutions are typically used. Wet removal by precipitation rather than dry removal is a more effective pathway for cleansing the atmosphere of LAPs (Zhao et al., 2014). Therefore, high-resolution (cloud-resolving) simulations, through their more physically based and pixelated treatment of orographically forced precipitation, should better simulate these aerosols' life cycle (e.g., Sarangi et al., 2019). Additionally, RCMs such as the Weather Research and Forecasting model coupled with Chemistry (WRF-Chem; Grell et al., 2005) have chemical and aerosol options that are generally more sophisticated than typical GCMs.
While WRF-Chem has been used to study the impacts of LAP SDE and ARI across California on convective-permitting scales (L. Wu et al., 2018), the application of this model to the American Rocky Mountains as a whole has not been made. Smaller inner-continental cities and municipalities across this zone may be highly sensitive to changes in hydrology brought about by LAP effects, hence providing motivation for this study.
Using WRF-Chem, we seek to quantify perturbations to WUS meteorology and hydrology induced by LAPs for water year 2009. Sensitivity experiments are run on convective-allowing scales (4 km grid spacing) to isolate the effects of LAP SDE and ARI on temperature, precipitation, snow, and runoff.
This study begins with an introduction of the model, methodology, and data in Sect. 2. Section 3 provides a meteorological and chemical evaluation of WRF-Chem. The radiative effects of LAPs associated with SDEs and ARI are explored in Sect. 4, and their effects on WUS weather are examined in Sect. 5. Section 6 briefly evaluates the implications of undersimulated dust emissions. Conclusions are presented in Sect. 7.
2.1 WRF-Chem
In this study, WRF-Chem 3.5.1 updated by the University of Science and Technology of China (USTC) is used. This USTC version of WRF-Chem includes capabilities not available in publicly released WRF-Chem versions, such as the diagnosis of radiative effects of aerosol species, land surface coupled biogenic volatile organic compound (VOC) emissions, and aerosol–snow interactions (Zhao et al., 2013a, b, 2014, 2016; Hu et al., 2016). The model is run on a 4 km grid with 50 vertical levels across a large portion of the WUS (Fig. 1). The SNow, ICe, and Aerosol Radiative (SNICAR) model (Flanner et al., 2007), which uses LAP deposition flux from the atmosphere to treat the SDE and treats ice and snowpack aging, was coupled into the Community Land Model version 4.0 (CLM4; Oleson et al., 2010) by Zhao et al. (2014). SNICAR uses snow water (both ice and liquid) and aerosol loading information to compute the snowpack's radiative properties within multiple snow layers based on the theories by Wiscombe and Warren (1980) and Toon et al. (1989). The utility of SNICAR in simulating the albedo reductions in snow has been tested in laboratory experiments (Hadley and Kirchstetter, 2012). More information on SNICAR can be found in Appendix A1.
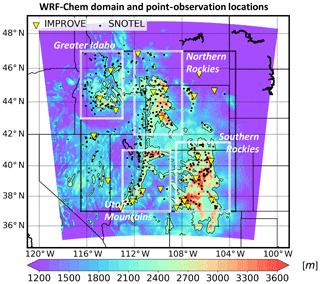
Figure 1WRF-Chem domain with analysis subregions (white transparent boxes). The color fill represents the surface elevation (m), and the thin black line denotes the low-pass-filtered 2200 m isopleth. The thick black line bounds our analysis region. Black circles represent the 418 analysis snow telemetry (SNOTEL) sites, while the yellow inverted triangles represent the 23 analysis IMPROVE sites.
The Model for Simulating Aerosol Interactions and Chemistry (MOSAIC; Zaveri et al., 2008) and the Carbon Bond Mechanism version Z (CBM-Z; Zaveri and Peters, 1999) photochemical model are used to treat aerosol and atmospheric chemistry. MOSAIC uses a four-bin sectional approach to simulate the aerosol size distributions of BC, dust, sulfate, ammonium, nitrate, organic matter, and sea salt for radii of 0.039–10 µm. Additionally, MOSAIC treats the processes of aerosol nucleation, coagulation, condensation, water uptake, and aqueous chemistry. Aerosol dry deposition is handled via the method in Binkowski and Shankar (1995), which includes Brownian and turbulent diffusion as well as gravitational settling. Wet deposition of aerosols and gases by in-cloud and below-cloud scavenging is treated following Easter et al. (2004). Similar to Zhao et al. (2013a) and L. Wu et al. (2017, 2018), aerosols are assumed to be internally mixed within each size bin. Aerosol optical properties such as extinction, single-scatter albedo (SSA), and asymmetry parameter are computed as a function of wavelength at each grid point based on the bin- and volume-averaged refractive index for each aerosol species (Fast et al., 2006). ARIs are treated in the radiation code via the methodologies in Zhao et al. (2011), in which the direct radiative effect is computed diagnostically using the method in Ghan et al. (2012) (briefly described later). Aerosol radiative feedbacks are enabled, and aerosol–cloud interactions are enabled within the cloud microphysics scheme (Morrison et al., 2009) following Gustafson et al. (2007).
2.2 Emission data
Anthropogenic emissions from the Environmental Protection Agency's (EPA) 2011 National Emissions Inventory (EPA NEI-11; https://www.epa.gov/air-emissions-inventories/2011-national-emissions-inventory-nei-data, last access: September 2019) are used. These emissions contain location-specific point and area source emissions and are interpolated to a 4 km grid using the open-source software emiss_v04.F (ftp://aftp.fsl.noaa.gov, last access: September 2019); anthropogenic emissions from EPA NEI-11 are not simultaneous with our experimental time period. Simultaneous biomass burning emissions, available on a ∼1 km grid from the Fire INventory from the National Center for Atmospheric Research (NCAR) (FINN; Wiedinmyer et al., 2011), are used; FINN makes use of satellite and land coverage observations to estimate emissions from wildfires. Both EPA NEI-11 and FINN data are updated hourly to account for the diurnal cycle of their respective emissions. Biogenic emissions of isoprene and monoterpenes are calculated online following Guenther et al. (1993). In-domain dust emissions are also calculated online following Zhao et al. (2010, 2013b) using the Goddard Global Ozone Chemistry Aerosol Radiation and Transport (GOCART) dust scheme (Ginoux et al., 2001). Short test simulations showed that surface dust concentrations were underpredicted. Therefore, the dust-tuning factor was increased from 1.0 to 1.2 in the six WRF-Chem experiments.
2.3 Chemistry boundary and initial data
Most far-field cross-boundary and initial chemistry conditions for WRF-Chem are handled using the open-source software mozbc (NCAR, https://www.acom.ucar.edu/wrf-chem/download.shtml, last access: 2018). This software uses simulated chemical output from the Goddard Earth Observing System version 5 (GEOS-5) model, coupled to MOZART-4 (Model for OZone And Related chemical Tracers version 4), to generate the chemical initialization and lateral boundary condition for WRF-Chem simulations. Chemical boundary tendencies are updated every 6 h beginning on 1 February 2009. MOZART-4 chemical input into WRF-Chem is date and time specific, but we note that in-domain anthropogenic emissions are averaged for the year 2011. Relevant to this study, mozbc is used to provide the lateral boundary and initial chemistry conditions for chemical constituents and aerosols, with the exception of dust. To avoid the issue of different dust bin cutoff sizes between MOZART-4 and MOSAIC, we ran a quasi-global (QG) WRF-Chem simulation to provide initial and cross-boundary dust in our simulations. See Appendix A2 for more information.
2.4 Experimental setup
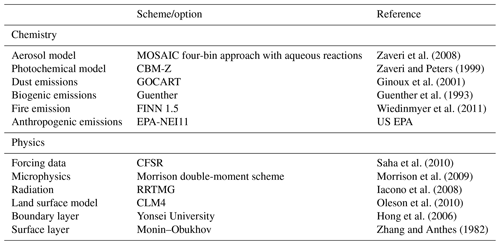
Meteorological forcing at initialization and at the lateral boundaries of the convective-permitting experiments is provided from the Climate Forecast System Reanalysis (CFSR; Saha et al., 2010). “Convective permitting” means that convection is not parameterized in the 4 km experiments. A detailed list of the physical parameterizations and physics packages used in the 4 km experiments is given in Table 1.
Table 1Listing of WRF-Chem specifications. NOCHEM is identical to CNT except without the chemistry options.
The original control experiment was initialized on 26 September 2008 at 00:00 UTC and run through 1 August 2009. However, this experiment was found to underpredict snow water equivalent (SWE) by several hundred millimeters due to underpredicted precipitation across the Rocky Mountains (not shown). A companion WRF simulation run without chemistry (NOCHEM) was found to significantly outperform WRF-Chem in simulating Rocky Mountain snowpack when compared to ground-based measurements; hence, a new set of WRF-Chem experiments was designed.
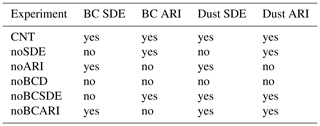
We restart our WRF-Chem simulations on 1 February 2009 at 00:00 UTC using surface energy and hydrological fields from the NOCHEM restart file and in-snow LAP fields from the original WRF-Chem restart file. Six new branch WRF-Chem simulations are launched from the new restart file to quantify the impacts of LAP across the Rocky Mountains (see Table 2). These experiments, to be run through 1 August 2009, consist of the following:
-
CNT. The control experiment simulates both the SDE and ARI associated with LAPs. CNT also includes the indirect effects associated with various aerosols, as the number concentration of activated aerosols is calculated based on the local aerosol characteristics in each grid cell.
-
noSDE. This simulation is identical to CNT except that the deposition fluxes of LAPs and snow LAP loading are set to zero in CLM4/SNICAR. The deposition fluxes in the atmospheric component of WRF-Chem remain unchanged, effectively allowing LAPs to vanish as they are removed from the atmosphere. The ARIs associated with LAPs remain in this perturbation experiment.
-
noARI. This simulation is identical to CNT except that the contribution of LAPs to the total aerosol optical properties is set to zero in the radiation code. Specifically, the contributions of BC, dust, and calcium to the atmospheric radiative effects are removed.
-
noBCD. This simulation is identical to CNT except that the SDE and ARI due to LAPs are removed.
-
noBCSDE. This simulation is identical to noSDE except that only the BC SDE is removed.
-
noBCARI. This simulation is identical to noARI except that only BC ARIs are removed.
By examining the differences between the results of the six simulations, species-specific SDEs and ARIs associated with LAPs can be quantified across four subregions of the Rocky Mountains shown in Fig. 1. These subregions include (i) Greater Idaho, (ii) the Northern Rockies, (iii) the Utah Mountains, and (iv) the Southern Rockies; we consider elevations equal to or greater than 2200, 2400, 2200, and 2600 m, respectively, in the calculations of all subregional averages. These regions were chosen because the water resources of these four areas depend heavily on the timing of local snow cover melt and orographic precipitation event characteristics. While BC SDEs and BC ARIs are explicitly quantified by the difference between CNT and noBCSDE (noBCARI), it must be borne in mind that dust SDEs (ARI) are taken to be the linear difference between noSDE and noBCSDE (noARI and noBCARI).
2.5 Observational data
The performance of CNT and NOCHEM in simulating several important meteorological variables is first evaluated in this study. Daily point-source measurements of minimum (Tmin), maximum (Tmax), and average (Tav) 2 m temperature, as well as precipitation and SWE from 418 snow telemetry (SNOTEL; Serreze et al., 1999) sites across the WUS, are used to evaluate the model performance (see black dots in Fig. 1). The spatial distributions of simulated monthly Tmin, Tmax, Tav, and precipitation are evaluated using the Parameter-elevation Regressions on Independent Slopes Model (PRISM; Daly et al., 1994). PRISM fields are available on a ∼4 km mesh. The spatial variability of monthly SWE is also evaluated in this study against data from the University of Arizona (UA). These data are generated with the methodology used to generate PRISM and are mapped to a ∼4 km grid (Broxton et al., 2016). The model-simulated snow cover fraction (SCF) is evaluated against the high-resolution (0.05∘) measurements from the Moderate Resolution Imaging Spectroradiometer (MODIS) Aqua (Hall and Riggs, 2016).
Simulated LAPs are compared to measurements from 23 Interagency Monitoring of Protected Visual Environments (IMPROVE; Malm et al., 1994) network sites (see yellow triangles in Fig. 1). These sites are at relatively high elevations (mean elevation 2221 m), with the lowest station located at 1195 m and the highest at 3413 m. Simulated BC is approximated to be fine-mode elemental carbon (EC) from IMPROVE. Although EC can be quite different from BC, this type of comparison has been made in other studies (e.g., C. Liu et al., 2012; Wu et al., 2018). Simulated dust concentrations are compared to the IMPROVE dust observations, which are derived using the method in Kavouras et al. (2007 by adding observed fine-mode soil to the difference between observed particulate matter (PM) having a dry-size diameter of less than 10 µm (PM10) and observed PM having a dry-size diameter of less than 2.5 µm (PM2.5). This method was found to be reliable at nine inland rural IMPROVE sites in Malm et al. (2007), in which the dust contribution to the coarse-mode aerosol mass was 74 %–90 %.
While NOCHEM's meteorology was evaluated from 1 October 2008 to 1 August 2009 (see Appendix A3), we restrict our focus here to CNT's performance and detail some of the large differences between CNT and NOCHEM in Appendix A4.
3.1 Meteorological variables
Evaluation of CNT is performed from 1 February 2009 onwards. CNT and NOCHEM simulate lower Tav values than the 418-SNOTEL-site average, i.e., by −1.67 and by −1.84 ∘C, respectively (Fig. 2a), in the February-through-July mean. CNT is warmer than NOCHEM, although both simulations have r values of +0.98 compared to SNOTEL. CNT and NOCHEM are characterized by a wet bias of 0.71 and 1.18 mm d−1, respectively (Fig. 2b), and both simulations have r values of +0.81. Despite having r values of +0.98, CNT and NOCHEM overpredict SWE by 5.6 and 16.6 mm, respectively (Fig. 2c). The reduced precipitation bias in CNT may be related to the prognostic number concentration of activated aerosols, but this result is not verified in this study. Figure 2c also shows that CNT and NOCHEM misrepresent the meltout (i.e., the date on which SWE =0 mm) date; both simulations melt out snow too slowly compared to SNOTEL. This is true regardless of subregion, with the largest meltout discrepancy being simulated across the Utah Mountains and the smallest being simulated across Greater Idaho (Fig. S1 in the Supplement). However, simulations are skillful in reproducing the timing of maximized SWE during mid-April. CNT's overall performance in simulating meltout should be considered when presented with simulated changes in meltout dates due to LAP effects (Sect. 5.4).
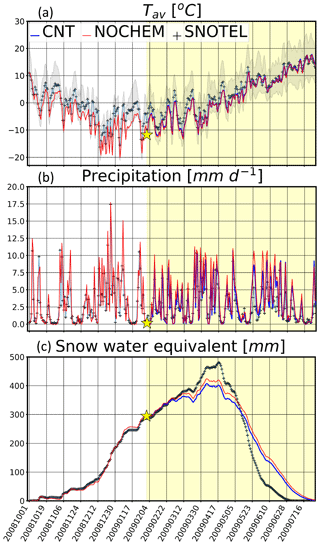
Figure 2Time series of CNT, NOCHEM, and SNOTEL daily (a) Tav, (b) precipitation rate, and (c) SWE. The gray color fill in (a) spans the range of SNOTEL-observed Tmin and Tmax. The yellow star denotes the launch point of all CHEM simulations (1 February 2009 at 00:00 UTC), and the soft yellow shading highlights our period of interest (1 February 2009 through 1 August 2009).
The spatial distributions of February-through-July-averaged Tav, Tmin, and Tmax for CNT and PRISM are shown in Fig. 3, where large terrain-induced heterogeneity in temperature can be seen. For validation purposes, we exclude simulation results near CNT's lateral boundaries in an attempt to remove grid points whose solutions are relaxed to coarse-resolution CFSR. All subsequent statistics make use of CNT data only within the black box shown in Fig. 3 (37 to 47∘ N; −116.5 to −103.5∘ E). The 2 m temperature pattern is similar between CNT and PRISM as indicated by r values of +0.94, +0.85, and +0.96 for Tav, Tmin, and Tmax, respectively. However, a warm bias in Tav (0.69 ∘C), driven primarily by a warm bias in Tmin (2.00 ∘C), is simulated by CNT. Meanwhile, cold biases in Tav and Tmin are simulated at high elevations. The overall temperature bias is negatively correlated with elevation; the bias becomes more negative with increasing elevation (third column of Fig. 3). Negative r values between simulated bias and grid cell elevation (rZB) in excess of 0.68 are computed for Tav, Tmin, and Tmax. Local cold (warm) biases across mountain chains (basins) may be related to CNT's overprediction (underprediction) of SWE and SCF within these zones (Fig. 4).
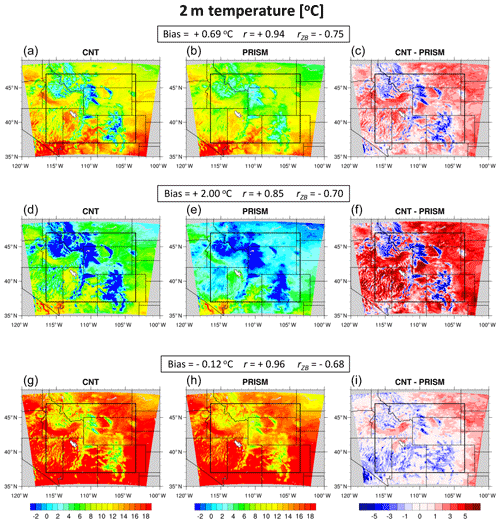
Figure 3Tav (a, b, c), Tmin (d, e, f), and Tmax (g, h, i) averaged from February through July. CNT results are shown in column 1, PRISM results are shown in column 2, and CNT minus PRISM (bias) results are shown in column 3. The black box denotes the region of the domain in which biases and other statistics are computed. Mean bias, r value, and rZB value are given for each variable.
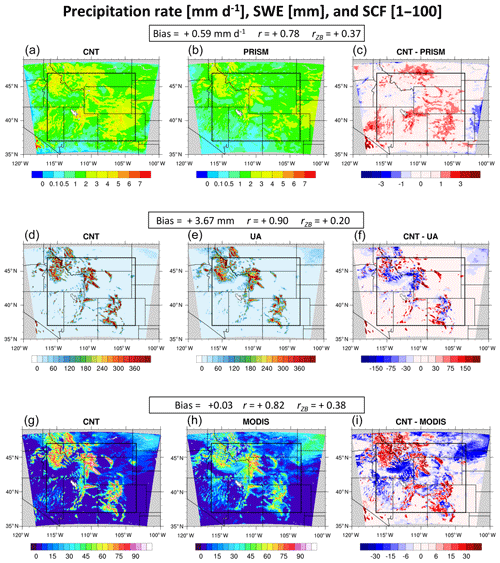
Figure 4As in Fig. 3, but precipitation rate is compared to PRISM (a, b, c), SWE is compared to UA (d, e, f), and SCF is compared to MODIS (g, h, i).
The spatial distributions of February-through-July-averaged precipitation rate, SWE, and SCF are shown in Fig. 4. These hydrological fields do not correlate as well with observations as in the case of 2 m temperature, with r values for CNT/PRISM precipitation rate, CNT/UA SWE, and CNT/MODIS SCF of +0.78, +0.90, and +0.82, respectively. Domain-averaged precipitation rate is overpredicted in CNT by 0.59 mm d−1, with biases larger than 1 mm d−1 simulated locally at higher elevations. This wet bias is also evident in SWE and SCF comparisons, where CNT overpredicts SWE by more than 75 mm and SCF by 30 % in several mountain chains. CNT simulates a mean wet bias that increases with increasing elevation; rZB values of +0.37, +0.20, and +0.38 are recorded for precipitation rate, SWE, and SCF, respectively.
3.2 BC and dust
Time series of BC and dust surface concentrations ([BC] and [dust], respectively) from CNT and IMPROVE are shown in Fig. 5a and b, respectively. CNT slightly oversimulates [BC] from February through April, and undersimulates [BC] from June through July, but otherwise compares well with the site-averaged [BC] from IMPROVE. CNT and IMPROVE agree on site-averaged [BC] between 0.05 and 0.11 µg m−3, with CNT slightly underpredicting [BC] by ∼0.01 µg m−3. Despite this agreement between CNT and IMPROVE, CNT simulates a modest temporally averaged [BC] spatial correlation (r value) of +0.37 (Fig. 5c).
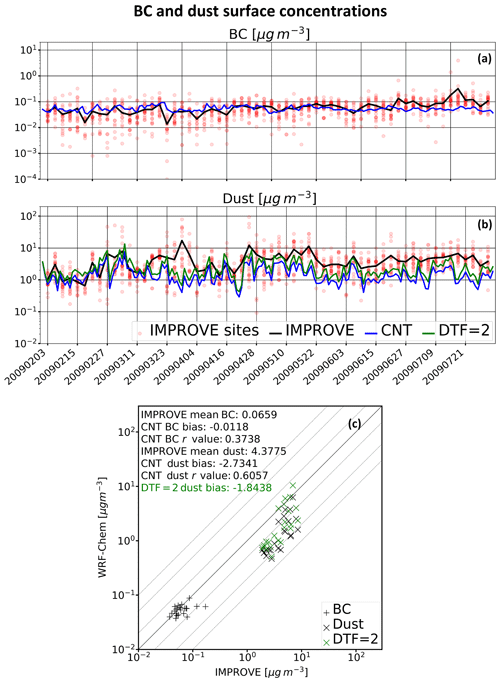
Figure 5Time series of BC (a) and dust (b) from CNT and IMPROVE. Red transparent circles denote individual IMPROVE measurements. The lower panel (c) shows the same data as in the top and middle panels, except the data are temporally averaged from February through July instead of spatially averaged.
Dust is undersimulated by CNT throughout the period of simulation (Fig. 5b and c). CNT has a February-through-July bias of −2.73 µg m−3 with the IMPROVE mean of 4.38 µg m−3. CNT [dust] correlates better spatially with IMPROVE than does [BC], with an r value of +0.61. In light of the simulated low bias in CNT, the dust-tuning factor (DTF) was increased to 2.0 in a seventh experiment, DTF =21(green line in Fig. 5b). However, despite a 60 % increase in dust emissions (), DTF =2 still simulates a February-through-July low bias in [dust] of −1.84 µg m−3 (∼43 % lower than IMPROVE). The differences between the DTF =2 experiment and CNT will be discussed later.
The undersimulation of [dust] within our domain may be due to many factors. In the QG WRF-Chem experiment, dust aerosol optical depth (AOD) was chosen as the primary reference metric for tuning purposes (see Rahimi et al., 2019), not [dust] or dust burden. Specifically, the QG WRF-Chem simulation integrated a quasi-globally (65∘ S–65∘ N) February-through-July-averaged AOD of 0.025, compared to 0.035 from the Community Earth System Model (CESM). The smaller dust AOD in the QG experiment relative to the reasonable GCM value may be tied directly to underpredicted [dust] across the WRF-Chem domain, as cross-boundary dust transport was probably undersimulated. Biases in [dust] may also be attributed to regional underestimations in dust emissions from cropland, pastureland, and other land use activities within our domain. The vertical distribution of dust may have been misrepresented in our simulations as well. Perhaps most importantly, the Ginoux et al. (2001) dust emission scheme does not capture major dust sources across the southwestern United States.
Radiative effects (REs) of LAPs are diagnostically computed following Ghan et al. (2012). A short description of RE calculations is given in Appendix A5. In-snow REs are calculated by SNICAR following a similar procedure.
4.1 In-snow radiative effect
The geographic distribution of the LAP in-snow radiative effect (ISRE) is tied to the mean normalized LAP burdens in the top snow layer (Fig. 6). March-through-June-averaged normalized in-snow burdens of BC are generally largest across western upslope regions of our subregions (Fig. 6a) because 1) aerosol deposition fluxes are maximized (not shown) and 2) snow burdens are relatively smaller than those further uphill (see Fig. 4, middle row), leading to maximized in-snow aerosol mass mixing ratios. Here, we defined the western upslope areas of our subregions to be the western portion of our most highly elevated terrain, where the terrain height increases with eastward extent. Different from in-snow BC burdens, in-snow dust burdens generally decrease with northward extent across our domain (Fig. 6b). This is due to the fact that southern mountain ranges sit directly downstream of dust emission sources, while northern mountain chains do not.
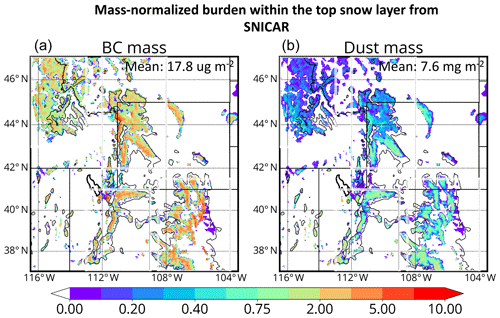
Figure 6Top layer in-snow burdens for (a) BC and (b) dust normalized by their respective means (unitless). Means are computed for grid cells that have SWE values greater than 2 mm in the March-through-June average.
Figure 7a and b show that the ISRE pattern follows the in-snow impurity pattern in the February-through-July mean (Fig. 6). BC dominates perturbations to the surface energy budget compared to dust over snow-covered areas with ISRE values in excess of 2 W m−2 integrated over mountainous terrain. Dust-induced ISRE values increase with southward extent, maximized locally over the Utah Mountains and Southern Rockies. The ISRE values and patterns simulated here are consistent with those of C. Wu et al. (2018), who used a variable-resolution version of CESM to compare the SDEs of LAPs. It is remarkable that BC ISREs dominate over dust, considering that top snow layer burdens of dust are ∼2.5 orders of magnitude larger than those of BC (7.6 mg m−2 for dust compared to 0.0178 mg m−2 for BC).
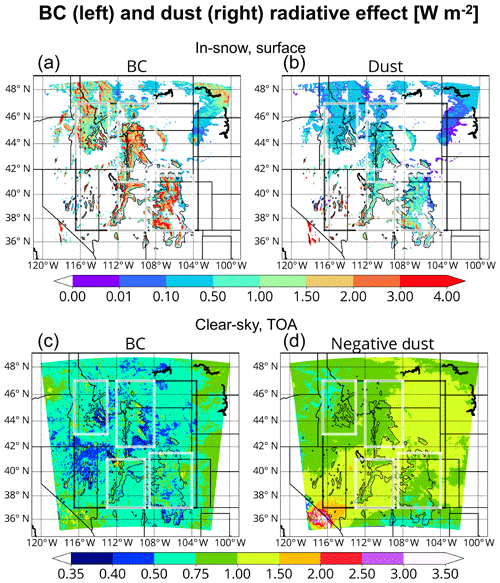
Figure 7Surface in-snow (a, b) and top-of-the-atmosphere (TOA) clear-sky (c, d) radiative effect for (a, c) BC and (d, b) dust averaged from March through June (W m−2). The in-snow radiative effect panels (a, b) make use of the 18:00 UTC output files only, while the TOA radiative effect panels (c, d) make use of the 00:00, 06:00, 12:00, and 18:00 UTC output files.
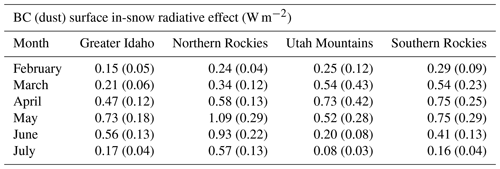
Table 3 reinforces the finding that BC contributes to a stronger ISRE than dust across our four subregions in CNT. This result is unsurprising considering WRF-Chem experiments underpredict [dust] and reinforces the finding by C. Wu et al. (2018), who simulated a significantly larger BC ISRE compared to that of dust across the region. The BC ISRE is maximized in May across Greater Idaho and the Northern Rockies, with values of +0.73 and +1.09 W m−2, respectively. Dust ISRE values across these regions are about a quarter of the magnitude comparatively, even in the DTF =2 experiments (dust-induced ISREs are larger compared to CNT). Across the Utah Mountains and the Southern Rockies, the LAP ISRE peaks in April and May, respectively. The peak in ISRE during April across the Utah Mountains, occurring 1 month earlier than the other subregions, is due to maximized upstream dust emissions during April (not shown), which drives a fractionally larger dust-induced ISRE across this region.
4.2 In-atmosphere radiative effect
Figure 7c and d shows that BC and dust have opposite clear-sky TOA radiative effects across the CNT domain. March-through-June domain-averaged radiative effects of +0.55 and −0.98 W m−2 (−1.09 W m−2 in DTF =2) are simulated for BC and dust, respectively. The largest positive BC RE at the TOA occurs over BC emission source regions (cities and power plants; Fig. 7c), while the most negative dust-induced RE at the TOA occurs over deserts (Fig. 7d). Note that Fig. 7d depicts the negative of the dust TOA RE. The spatial distribution of the LAP-induced REs correlates with the spatial distribution of these aerosols' respective burdens (Fig. S2, Sect. S1 in the Supplement). The LAP-induced TOA RE magnitudes tend to be smaller across pristine mountainous areas. Of the four subregions, the Utah Mountains are characterized by the most positive TOA RE of +0.59 W m−2 by BC (Fig. 7c) and the most negative TOA RE of −0.94 W m−2 by dust (Fig. 7d; −1.06 W m−2 in DTF =2).
Table 4 breaks up the LAP TOA REs by month. The BC TOA RE is positive across all subregions; the effect is largest across the Utah Mountains (+0.81 W m−2) in April, as these mountains sit directly east of Salt Lake City and adjacent anthropogenic BC emission sources. For dust, the TOA RE is largest across the Utah Mountains compared to the other subregions. Here, the TOA RE reaches a base in May of −1.11 W m−2 across the Utah Mountains. It is noteworthy that the Southern Rockies have a May TOA RE of −1.05 W m−2, but this region's TOA RE is comparable to other subregions during other months. The more negative TOA RE due to dust across the Utah Mountains is due to the fact that this area sits immediately downstream of simulated dust source regions.
5.1 SDE
5.1.1 Spatial patterns of SDE anomalies
From March through June, LAP SDE brings forth relatively small 2 m temperature increases of 0.05 to 0.5 ∘C across portions of Greater Idaho, the Northern Rockies, the Utah Mountains, and the Southern Rockies (Fig. 8a) compared to C. Wu et al. (2018). This warming is comparable, however, to SDE-induced warming reported in Qian et al. (2009). Similar to C. Wu et al. (2018) and Qian et al. (2009), the strongest simulated warming does not generally occur across the highest terrain. In fact, the largest SDE-induced warming occurs across the western upslope regions of the Northern Rockies, the Utah Mountains, and the Southern Rockies. BC contributes to most of the SDE-induced warming across the northern subregions (Fig. 8b) compared to that of dust (Fig. 8c), while BC- and dust-induced warming of the air temperature are more similar across the southern subregions. This aerosol-warming pattern is generally correlated with the LAP ISRE pattern in Fig. 7, where BC ISREs far outweigh those of dust across the northern subregions but are more comparable across the southern subregions.
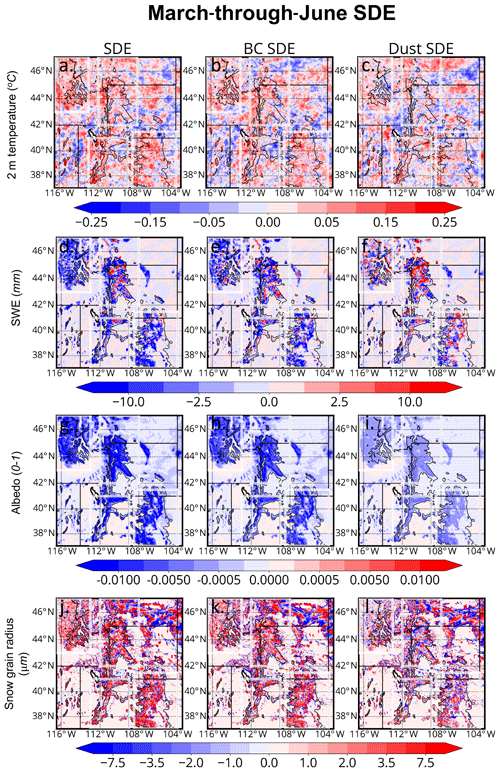
Figure 8March-through-June-averaged SDE-induced anomalies in (top row) 2 m temperature, (second row) SWE, (third row) albedo, and (bottom row) snow grain effective radius in the top snow level for (first column) BC+dust, (second column) BC, and (third column) dust. The thin black contours denote the 2200 m elevation contour.
While the areas of maximum surface warming tend to be located within moderately elevated upslope zones, the largest SDE-induced reductions in SWE occur at higher elevations downwind, where SWE is largest (Fig. 8d), in correlation with ISRE. Driven primarily by in-snow BC (Fig. 8e), SWE reductions of between 2.5 and 10 mm are simulated. Across the Utah Mountains and Southern Rockies, our simulated SWE reduction pattern is consistent with C. Wu et al. (2018), while our anomaly magnitudes are smaller; C. Wu et al. (2018) simulated SWE reductions between 10 and 50 mm across these mountains during springtime (March through May). We present the March-through-June average; hence, our simulated anomalies are different from C. Wu et al. (2018) comparatively. Another factor potentially contributing to SWE anomaly differences is that C. Wu et al. (2018) used a GCM that explicitly treated large-scale feedbacks, whereas our study does not. These large-scale feedbacks led to positive SWE anomalies across Greater Idaho and the Northern Rockies in C. Wu et al. (2018), a feature not captured in this study. It should be noted that the LAP effects on WUS meteorology and hydrology considered here are purely local; they are not due to LAP SDE and ARI beyond the domain boundaries. More generally, Greater Idaho, the Northern Rockies, and the Utah Mountains see simulated SWE reductions across most elevated surfaces above 2200 m. Across the Southern Rockies, meanwhile, reductions in SWE are mostly confined to the western portion of the mountainous terrain.
We note that there are areas where LAP SDE leads to increased SWE amounts across a small fraction of grid cells (Fig. 8d). We believe this to be the result of internal model variability rather than a physical manifestation (Bassett et al., 2020). Examination of several grid points where the March-through-June mean SWE anomalies were positive revealed that fine-scale storm location and intensity differences between, for instance, CNT and noBCSDE led to positive SWE anomalies (not shown). We expect these positive SDE-induced SWE anomalies to be more uncommon if averaged over climate-relevant timescales as in C. Wu et al. (2018). As will be shown in the next section, SDE SWE anomalies are negative when averaged regionally.
Snow impurities reduce snowpack albedo by as much as 0.02 across many elevated areas (Fig. 8g). These albedo reductions are mainly driven by BC (Fig. 8h). Overall, the snowpack absorbs more sunlight with the deposition of LAPs (see Fig. 6 showing in-snow burdens). The additional energy in the snowpack (Figs. 7a, b, and S3) for a given time increases melting rates, leading to ice crystal growth of the underlying snow at the expense of liquid; larger ice crystals have a lower albedo than smaller ice crystals (Hadley and Kirchstetter, 2012). Increased heat content at the surface can warm the interfacing air via conduction, and this warming in turn melts more top snow, completing this feedback. Figure 8j shows that mean snow grain radii are mostly enhanced by several microns across snow-covered regions from March through June. This enhancement in the snow-albedo feedback is explored in detail in Flanner et al. (2007) and Painter et al. (2007).
Our simulated SWE results differ from those of C. Wu et al. (2018), who found that the maximum reductions in SWE occurred across many basins of the WUS, especially across the northern subregions, although our results agree with those of Qian et al. (2009). It should be noted that the WRF-Chem experiments undersimulate SWE and SCF across low- and moderate-elevation regions, such as the Snake River Basin (southern Idaho) and the Green River Basin (southwestern Wyoming; Fig. 4). Simulated snow coverage may therefore have been too low for SDE-induced perturbations across these areas, leading to the discrepancies between this study and C. Wu et al. (2018).
5.1.2 Timing of SDE
From Fig. 9a it can be seen that LAP SDEs induce regionally averaged warming by no greater than 0.2 ∘C across our four subregions. The largest simulated warming occurs across the Utah Mountains in late April and Greater Idaho in mid-June (0.15 ∘C). BC almost universally warms the surface air (crosses, Fig. 9a), but we do note several instances where the dust SDE cools the surface air (hollow circles, Fig. 9a). This is most likely the result of internal model variability or the assumption of linearity made in quantifying dust SDE as the difference between noBCSDE and noSDE (Sect. 2.4).
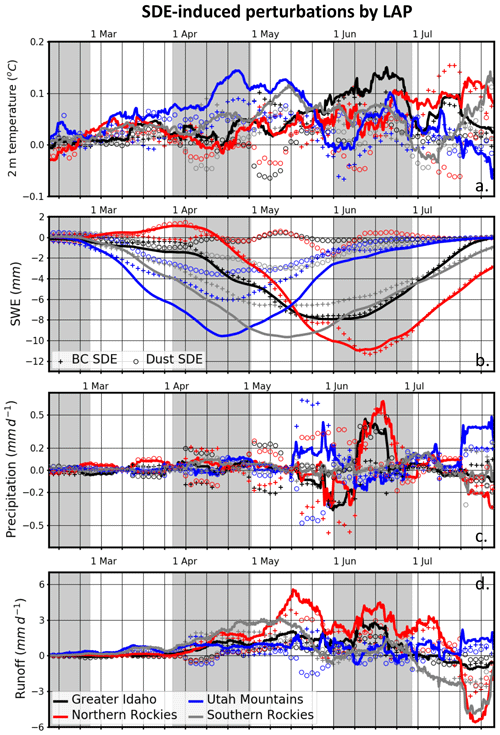
Figure 9Presented by region are low-pass-filtered time series of perturbations in (a) 2 m temperature, (b) SWE, (c) precipitation, and (d) runoff incited by LAP SDE. Solid lines show perturbations due to total (BC+dust) SDEs, while crosses (hollow circles) show perturbations due to BC (dust) only.
Peak SWE reductions are relatively well correlated with peak 2 m temperature increases and maximal ISRE values across the southern subregions. Peak SWE reductions of between 8 and 10 mm occur in mid-April and mid-May across the Utah Mountains and Southern Rockies (between 4 % and 5 %), respectively. These reduction maxima, driven mainly by BC SDEs, occur concurrently with seasonally maximized ISRE values of +4 to +5 W m−2 (Fig. S3). SWE reductions across these southern subregions have a larger dust SDE-induced component than simulated across northern subregions. As a percentage, negative SDE-induced SWE anomalies increase as the warm season progresses, with simulated SWE reductions of ∼65 %, ∼10 %, ∼7 %, and ∼50 % across Greater Idaho, the Northern Rockies, the Utah Mountains, and the Southern Rockies, respectively, by mid-July. The progressive increase in SWE reduction percentages throughout the warm season is the result of decreased overall snowpack concurrent with increasing in-snow LAP mixing ratios as the snowpack ages, which increases the efficacy of LAP SDEs.
Northern subregions are not characterized by the same seasonal correlation between SWE, 2 m temperature, and ISRE. Maximized SWE reductions of 8 mm (4 %) occur around 1 June across Greater Idaho, which occurs about a week after the ISRE maximum of +2.9 W m−2 and ∼3 weeks before the 2 m temperature maximum of +0.15 ∘C. This peculiarity is due to reduced snowmelt (Fig. 2c) through increased cloudiness (not shown) and precipitation frequency (Fig. 2b). Increased snowfall during this period leads to dilution of the snowpack and a depressed ISRE.
The largest overall SWE reductions of 11 mm (5 %) occur across the Northern Rockies during mid-June. This period is characterized by a local minimum in 2 m temperature anomalies and local ISRE values brought forth by increased cloud coverage (not shown). The offsets in absolute SWE reductions with absolute maxima in 2 m temperature and ISRE across the northern subregions are the result of modulations in synoptic-scale weather variability that potentially mask these variables' correlation on timescales shorter than weeks.
SDE-induced anomalies in SWE (Fig. 9b) and precipitation (Fig. 9c) change runoff by fractions of millimeters per day across the four subregions. Here, runoff is defined as the sum of surface and underground runoff from the model output; runoff from glaciers and lakes is neglected. Driven primarily by BC SDEs, runoff is mostly increased through late June across all four subregions. Maximum simulated precipitation anomalies are generally less than 0.1 mm d−1 (Fig. 9c), while runoff anomalies are typically an order of magnitude larger (Fig. 9d). The largest increase in runoff occurs across the Northern Rockies (5.5 mm d−1, a 90 % change from CNT), which is characterized by the largest reductions in SWE. During July, negative anomalies in runoff manifest, with the peak reductions simulated across the Northern Rockies (5.5 mm d−1, July mean: ∼1 %) and the Southern Rockies (4.5 mm d−1, July mean: ∼2 %). Smaller runoff reductions of ∼1 mm d−1 (2 %) are simulated across Greater Idaho, while runoff increases of 1 to 2 mm d−1 (<5 %) are simulated across the Utah Mountains in phase with precipitation increases across this subregion (Fig. 9c). Although Qian et al. (2009) and C. Wu et al. (2018) emphasized results across basins, the dipole signature of runoff increases followed by runoff decreases is consistent with our results, despite primarily examining SDEs at higher elevations in this study.
SDE-induced precipitation perturbations of greater than 0.1 mm d−1 are not simulated until mid-May, but runoff increases due to SDE are simulated beginning around 1 April. In the absence of a coherent trend in SDE-induced snowfall (not shown) or overall precipitation (Fig. 9c), we surmise that, at least initially, SDE-induced runoff anomalies are mainly driven by the enhanced melting of SWE and not SDE-induced precipitation changes. By mid-May, runoff increases across the Northern Rockies are relatively maximized, even as near-zero or slightly negative precipitation anomalies due to SDEs are simulated. There are however some correlations between the runoff time series and precipitation anomalies. For example, a local minimum in the runoff anomaly time series (Fig. 9d) is simulated around 1 June, which correlates with negative precipitation anomalies of 0.3 mm d−1 across the Northern Rockies. This negative precipitation anomaly is decreasing the enhanced runoff induced by SDE-induced snowmelt. During mid-June, precipitation increases in excess of 0.4 mm d−1 correlate with the increased positive runoff anomaly (Fig. 9d) across Greater Idaho and the Northern Rockies.
SDE-induced perturbations to the weather and hydrological cycle generally stem from perturbations to the surface energy budget, affecting variables from the bottom up. LAP ARI on the other hand seems to affect downwelled irradiance, atmospheric stability, and clouds in a way that affects the underlying snow coverage at the surface, effectively altering variables from the top down. Changes in clouds and low-level stability were minimal (less than 1 % and 0.02 ∘C km−1, respectively) and are not discussed.
5.2 ARI
5.2.1 Spatial patterns of ARI anomalies
From March through June, LAP ARI-induced 2 m temperature anomalies are minimal (less than 0.1 ∘C in magnitude) across the WUS (Fig. 10a). However, BC and dust seem to impart anomalies of differing sign across the mountains, with cooling (warming) simulated across the higher elevations due to BC (dust). This general spatial pattern is correlated with SWE increases due to BC (Fig. 10e) and SWE decreases due to dust (Fig. 10f). The cooling and warming patterns associated with BC and dust, respectively, can be tied to deficits and surpluses in the surface energy budget imparted by these aerosols' radiative effects (discussed shortly and in Sect. 5.5).
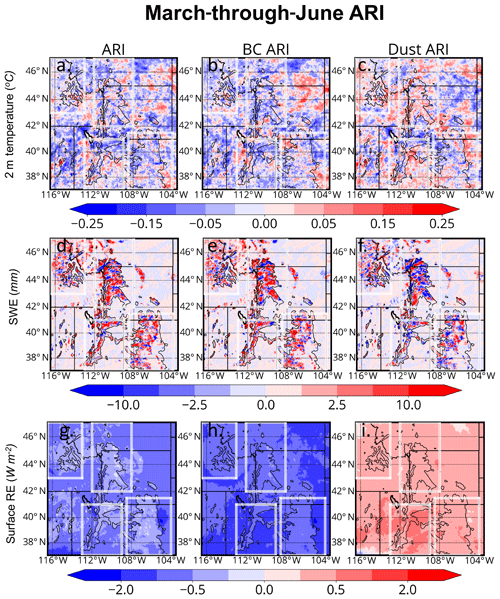
Figure 10Same as in Fig. 8 but for (a, b, c) 2 m temperature, (d, e, f) SWE, and (g, h, i) surface radiative effect (RE) due to (g) BC+dust, (h) BC only, and (i) dust only. RE values are computed diagnostically following Ghan et al. (2012).
Figure 10d show that BC ARI-induced SWE increases tend to exceed reductions in SWE associated with dust ARI. These overall ARI-induced increases in SWE compete against, but do not exceed, LAP SDE-induced reductions in SWE (Fig. 8d). Total simulated precipitation (rain+snow) anomalies due to LAP ARI are generally less than 0.2 mm d−1, while those due solely to snow are less than 0.1 mm d−1 (not shown). Additionally, no precipitation variable shows any discernable weekly, monthly, or seasonal trend. This finding lends further credence to the idea that simulated ARI-induced changes to SWE manifest from changes to the surface energy budget through LAP ARI. As with SDEs, internal model variability may be responsible for unintuitive SWE anomalies, but this issue was not examined in this study due to limited computational resources.
Figure 10g shows that LAP ARI imparts a negative surface RE. BC and dust have surface REs that are opposite in sign (Fig. 10h and i). The opposing sign is attributable to the differing microphysical properties of BC and dust aerosols. Specifically, the key difference between BC and dust is that dust aerosols can absorb and re-emit several watts per square meter (W m−2) of longwave energy. Depending on the dust size and number concentration, this downwelled longwave energy can dominate over the solar dimming, yielding positive surface RE values (Fig. 10i; Tegen and Lacis, 2012). BC meanwhile is not an effective attenuator of terrestrial energy because of its relatively small size. BC is however a very effective scatterer/absorber of incoming solar energy. Thus, BC dims the surface (Fig. 10h), yielding a very different surface RE compared to dust (Fig. 10i). BC-induced shortwave dimming exceeds the dust-induced longwave RE, yielding a negative surface RE across the domain (Fig. 10g).
5.2.2 Timing of ARI
Figure 11a shows the seasonality of competing 2 m temperature anomalies with BC (dust) ARI inducing surface cooling (warming). Maximum LAP ARI-induced temperature perturbations tend to occur from late May into early June. Interestingly, the strongest dust ARI-induced warming (+0.1 ∘C in late May) tends to occur across the Northern Rockies, even though this region lies further away from dust emission sources. As will be discussed, this region tends to have relatively lower burdens of supermicron dust particles compared to the other subregions. As smaller (larger) dust particles tend to scatter (absorb) incoming and upwelling sunlight, this region tends to see more downward-scattered insolation due to the larger fraction of submicron dust particles, which results in less surface dimming. BC on the other hand absorbs in the atmosphere, leading to surface dimming and weak surface cooling. Otherwise, the strongest combined (BC+dust) surface cooling is generally simulated to occur across the southern subregions prior to mid-May, but all subregions tend to see LAP ARI-induced cooling throughout the simulation period.
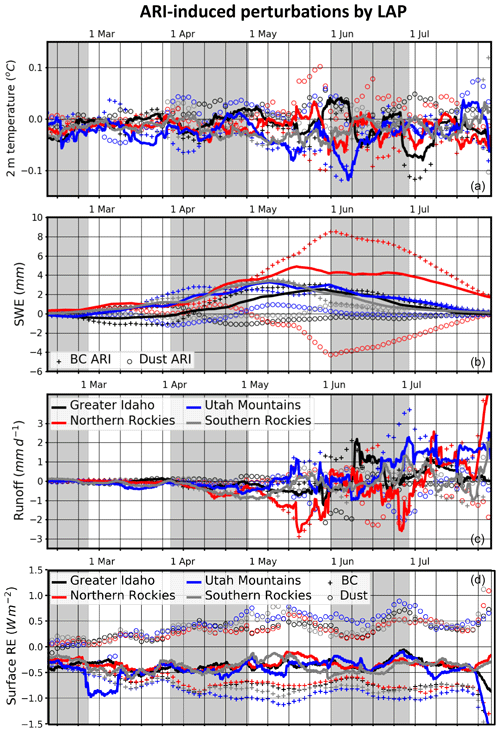
Figure 11Same as in Fig. 9 but for ARI-induced perturbations. Additionally, panels (c) and (d) show ARI-induced perturbations in runoff and the surface energy budget. Crosses in panel (c) show BC-induced perturbations to the surface energy budget, while hollow circles show dust-induced perturbations.
Overall cooling by LAP ARI is accompanied by increased SWE amounts across the four subregions (Fig. 11b). Driven by BC ARI, SWE increases of 5 mm (2 %) are simulated across the Northern Rockies during mid-May. By percentage, however, the largest SWE increases of ∼3 mm (∼4 %) are simulated during the first week of May across the Utah Mountains. Across the southern subregions, the ARI-induced increases in SWE occur earlier in the spring relative to the northern subregions. Meanwhile, the percentage increases in SWE across all four subregions generally increase with time well into the summer, with increases in excess of 10 % across the Utah Mountains, the Southern Rockies, and the Northern Rockies by late July (not shown).
Overall, the increase in SWE through ARI is predominately due to BC; however, dust ARI does contribute to SWE increases on the order of 1 mm during mid-May and early June across the Utah Mountains and the Southern Rockies, respectively. Interestingly, the Northern Rockies see competition between BC and dust ARI in modulating SWE anomalies. Specifically, BC (dust) increases (decreases) SWE by 8 mm (4 mm). Differences in these aerosols' optical properties lead to differences in how these aerosols perturb the surface energy budget while they reside in the atmosphere.
SWE (runoff) increases (decreases) from April onward due to LAP ARI across all four subregions prior to mid-May. These ARI-induced runoff changes occur in the presence of near-zero and nearly trendless precipitation (Fig. S4) and snowfall (not shown) anomalies. The simulation of these features suggests that the main driver of runoff changes, at least from April through mid-May, is reduced snowmelt from LAP ARI surface dimming. ARI-induced precipitation changes do impact runoff, however. For example, decreased precipitation from mid-May through 1 June (Fig. S4) correlates with decreased runoff during the same time period across Greater Idaho and the Northern Rockies (Fig. 11c). Following 1 June, runoff anomalies become less negative and even positive across the four subregions, a pattern opposite to that of LAP SDE (Fig. 9d). BC ARI tends to drive a majority of the runoff decreases prior to 1 June and promotes increased runoff deep into the summer. Dust ARI on the other hand has the opposite effect on runoff to that of BC ARI, increasing runoff through mid-May and decreasing runoff after 1 June across the Northern Rockies.
Comparatively, although SDE- and ARI-induced precipitation anomalies are of similar magnitude across the four subregions, the relative contribution of LAP ARI-induced precipitation changes to runoff anomalies is larger than that of LAP SDE because the overall SWE changes associated with LAP SDE are larger. Larger snow (and subsequent runoff) changes occur due to LAP SDE, making the relative contribution of LAP SDE-induced precipitation changes to the total runoff changes smaller. Snowmelt and precipitation-specific runoff contributions were not output and thus cannot be explored further in this study.
5.3 Combined effects of LAPs
Figure 12 shows time series of the total radiative (SDEs+ARI) impacts of LAP in the four subregions. These aerosols combine to increase the surface temperature by up to 0.15 ∘C, with the largest warming across the Utah Mountains in mid-spring and across the Northern Rockies during early summer (Fig. 12a). The largest LAP SDE-induced SWE reductions occur across the Southern Rockies (10 mm) and Northern Rockies (12 mm) during mid-May and mid-June, respectively (Fig. 12b). As mentioned earlier, changes in SWE are predominately driven by SDEs, although dust ARI can cause SWE reductions, especially across the Northern Rockies.
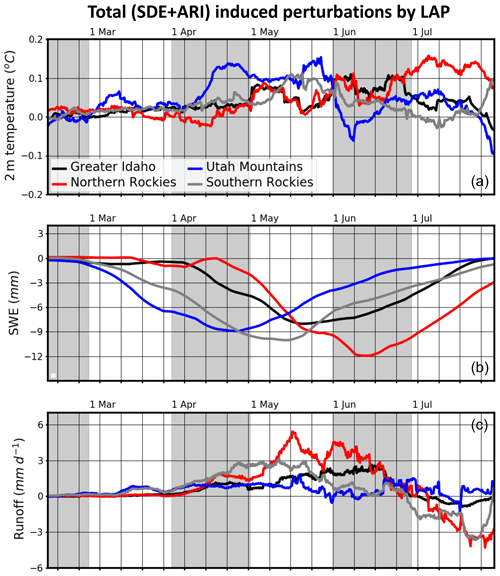
Figure 12Total (SDE+ARI) region-specific perturbations to (a) 2 m temperature, (b) SWE, and (c) runoff induced by LAP.
With the exception of the Utah Mountains, LAP-induced perturbations in SWE modulate runoff increases in the late spring and early summer, decreasing runoff later in the summer (Fig. 12c). Maximum runoff changes are simulated across the Northern Rockies, with increases (decreases) of 5 mm d−1 (5 mm d−1) occurring in mid-May (late July). Despite the Utah Mountains being located closest to BC and dust emission sources, their SWE and runoff changes are not as large as those across the Southern Rockies and Northern Rockies. This may be due to the close positioning of the Utah Mountains relative to the southwestern deserts. Larger, more absorbing dust aerosols dim sunlight, effectuating a negative surface RE. Combined with BC ARI dimming, the dust ARI offsets snow-darkening reductions in SWE, resulting in relatively smaller net perturbations to the surface water budget.
5.4 Changes in meltout timing
Since LAP effects yield SWE changes, we investigate changes in meltout timing for explicitly quantified effects across the four subregions. Only in Greater Idaho is CNT able to explicitly melt out snow; the other subregions simulate vanishing SWE sometime in August; hence our simulation window does not capture meltout across the other subregions. Across subregions where meltout is not simulated, we estimate it by using the minimum and maximum SWE values at 18:00 UTC on 31 July between the CNT and perturbation experiments (e.g., noSDE). The maximum value is used as a threshold, and we count the number of days from the minimum until the threshold is reached. This number of days is a proxy for the shift in meltout date, assuming that melt rates are the same between the simulations
Table 5 shows that, for explicitly simulated effects, BC SDE drives an earlier shift in meltout, while ARI generally drives a later meltout. Earlier SDE-induced meltout shifts are more prominent than later shifts induced by ARI, and we note that AIR and SDE-induced anomalies in meltout do not add linearly. For example, meltout is shifted earlier (later) by 4 (3) d across the Northern Rockies due to SDE (ARI), but the combined effects still (ARI+SDE) move forward the meltout date by 4 d. This difference may be due to internal model variability, as well as uncertainties associated with our proxy for meltout shifts. Painter et al. (2007) simulated a dust SDE that accelerated snowpack meltout by more than 20 d compared to a simulation without dust–snow–albedo effects, a result of much larger magnitude than ours. The authors, however, did not use a coupled atmospheric chemistry in tandem with a land surface model capable of physically simulating the SDE.
5.5 Dust ARI-induced warming and attendant SWE reduction
ARIs due to LAPs tend to dim the surface from insolation, leading to snowpack preservation. However, a notable instance in which dust ARI brings forth SWE reductions of 4 mm around 1 June across the Northern Rockies (Fig. 11b) can be explained by considering the properties of dust particles across the subregion. Regional averages of dust- and BC-induced anomalies were computed over areas characterized by relatively high albedos. Smaller dust particles are generally scattering in nature compared to larger dust particles in shortwave bands (Tegen and Lacis, 2012). In a single-layer radiative transfer model of the atmosphere, the downward shortwave solar flux S↓ at the Earth's surface can be expressed as follows:
where S0 is the solar constant at a particular time of day at a latitude characterizing the Northern Rockies and subject to molecular scattering, fs is the fraction of S0 scattered by aerosols in the atmosphere, and fa is the fraction of S0 absorbed by aerosols in the atmosphere. The upwelled solar flux immediately above the Earth's surface S↑ can thus be found by multiplying Eq. (1) by the surface albedo α:
This upwelled radiation will be scattered back and forth between the scattering aerosol layer and the surface in an iterative process proportional to fs and α:
Here, n is the number of times the incident beam is scattered between the surface and the aerosol scattering layer. is negative. By Eq. (3), it is clear that when fa is negligible, becomes less negative as α approaches unity. For atmospheric dust (and BC) particles residing over the high-albedo surface of the Northern Rockies, this means that there will be a higher chance of shortwave absorption by the surface through a larger . Together with dust longwave warming (Figs. 10i and 11d), dust ARIs contribute to snowpack reductions across the Northern Rockies. SWE reductions are most prominent across the Northern Rockies subregion where smaller, more scattering dust particles are present. The physical process described here is similar to that noted in Stone et al. (2008), who examined the atmospheric REs of wildfire smoke across northern Alaska's high-albedo surface.
The mean [dust] was undersimulated in all WRF-Chem experiments by 63 % compared to IMPROVE (Sect. 3.2). Even in the DTF =2 experiment, [dust] is still underpredicted by 43 %. Figure 13 shows the consequences of increasing dust emissions by 60 % from March through June. ISRE is increased by 0.2 W m−2 in many areas, especially across the southern subregions (Fig. 13a). Additionally, the northern subregions see ISRE increases of 0.05 to 0.1 W m−2. Across Greater Idaho and the Northern Rockies, this represents a doubling of the ISRE in the DTF =2 experiment compared to CNT.
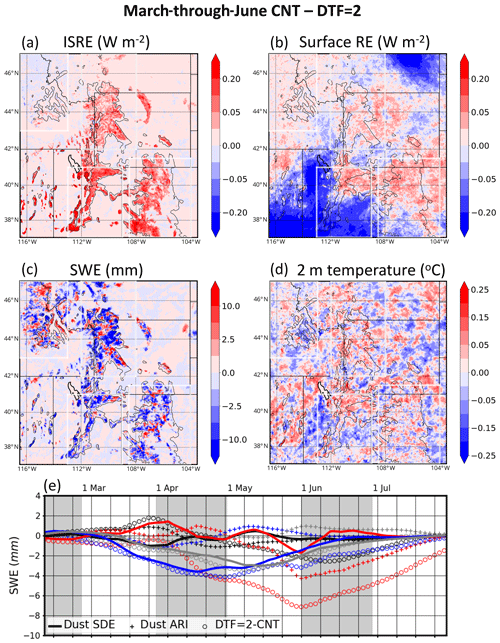
Figure 13DTF =2 – CNT March-through-June-averaged (a) ISRE, (b) surface RE, (c) SWE, and (d) 2 m temperature. Panel (e) shows low-pass-filtered time series of dust SDE from CNT (solid lines), dust ARI from CNT (crosses), and perturbations to SWE brought forth by increasing the DTF to 2 (DTF =2 – CNT; hollow circles). Colors indicate the subregions, as in previous figures: Greater Idaho (black), Northern Rockies (red), Utah Mountains (blue), and Southern Rockies (gray).
As discussed in the previous section, in-atmosphere dust can warm the surface through shortwave and longwave ARI over high-albedo surfaces. Figure 13b shows the difference in the net surface RE between the DTF =2 experiment and CNT. A positive difference of between 0.01 and 0.05 W m−2 is prevalent across the four subregions, especially across the Northern Rockies and Southern Rockies. Immediately downstream of major dust emissions sources, such as the Mojave Desert and those of central Montana, we see enhanced surface dimming in excess of 0.2 W m−2 in DTF =2, as larger (more absorbing) dust aerosols reduce insolation at the surface.
Enhanced warming of the surface, both through dust ARI and dust SDEs, leads to widespread SWE reductions in DTF =2 compared to CNT (Fig. 13c). These reductions exceed 5 mm in many areas and are generally accompanied by small temperature increases (Fig. 13d) of less than 0.05 ∘C. The seasonality of SWE differences between DTF =2 and CNT is shown in Fig. 13e. It is clear that increasing dust emissions has consequences for snowmelt across the four subregions, especially across the Northern Rockies. Through enlargements in the dust SDE and dust ARI, SWE reduction enhancements of 7.5 mm are simulated in DTF =2 compared to CNT across the Northern Rockies. These melting enhancements by themselves are ∼70 % as large as the reductions in snowpack simulated due to the BC SDE. BC-SDE-induced SWE reductions across the Northern Rockies are the largest of any subregion and larger than any other effect across any of the four subregions. Therefore, it is possible that the dust SDE and dust ARI are actually comparable to those induced by BC SDE.
While it can be seen that increased dust emissions have consequences on simulated meteorology, it cannot be determined whether a majority of changes in meteorological variables are due to enhancements in dust SDE or dust ARI without conducting further experiments. We did identify small increases in cloud amounts (by less than 2 %; not shown). In-snow dust burdens, as a percentage, were increased the most across the northern subregions, although ISRE perturbations in DTF =2 in the northern subregions were smaller compared to the southern subregions (Fig. 13a). Perturbations to the surface RE were generally positive across high-elevation areas of the northern subregions, especially in the Northern Rockies (Fig. 13b). Evaluating enhancements in dust SDE in the DTF =2 experiment is also complicated by the nonlinear relationship between snow impurity amount and radiation absorption (Flanner et al., 2007, 2012; Painter et al., 2007; Hadley and Kirchstetter, 2012; Wiscombe and Warren, 1980). DTF =2 enhancements of dust effects over CNT comprise linear and nonlinear ARI and SDE, whereas earlier computations of dust ARI and SDE were subject to a linearity assumption, further complicating the comparison of DTF =2 − CNT anomalies with previously computed dust anomalies (Sect. 5.1, 5.2). We emphasize the limitations of our assumptions in quantifying dust effects and call for further studies of dust SDE and ARI across this region.
Using seven branch WRF-Chem experiments with a horizontal resolution of 4 km, the SDEs of LAPs were quantified across four subregions of the WUS for water year 2009. These aerosols' ARIs were also examined and quantified. It was found that BC surface concentrations in the WRF-Chem control experiment (CNT) were well simulated compared to observations from IMPROVE, while dust surface concentrations ([dust]) were undersimulated by 63 %. An additional simulation was run with domain-resolved dust emissions increased by 60 % (DTF =2), but this simulation still underpredicted [dust] by a factor of 43 % compared to IMPROVE. It was found that CNT generally overpredicted precipitation compared to PRISM, snow cover compared to MODIS, and SWE compared to UA at many elevations; the wet bias increased with increasing elevation. Meanwhile, CNT simulated a warm (cold) bias at lower (higher) elevations. The biases/elevation Pearson values exceeded +0.3 for hydrologic reference variables and fell below −0.65 for the temperature variables.
It was found that LAP SDEs generally reduced springtime and summertime SWE, while ARI generally increased SWE during this same time period. However, SWE reductions due to the SDE, typically on the order of 2 % to 5 %, far exceeded the increases induced by ARI. SWE changes by these LAP effects led to changes in runoff. Specifically, SDEs brought forth runoff increases of 1–5 mm d−1 before July and runoff reductions of a similar magnitude during July. Runoff increases and decreases were largest across the Northern Rockies, with runoff increases of 95 % during springtime and early summer preceding gradual decreases of 5 % through the first half of July. BC ARI on the other hand reduced incoming solar radiation by 0.5–1.0 W m−2, depressing snowmelt in the late spring. The resulting ARI-induced perturbation to runoff was generally opposite to that associated with SDE. Meltout is accelerated by 3–5 d due primarily to SDEs, although previous studies have found that meltout can be accelerated by several weeks (Flanner et al., 2007; Painter et al., 2007).
It was found that BC ARI resulted in a dimming of the surface and a negative surface RE. Depending on the subregion, however, dust ARI could incite a positive or a negative surface RE. We believe this to be the result of differing optical properties associated with dust aerosols of differing size. Across subregions in relatively close proximity to dust emissions sources, larger, more absorbing dust particles dim the surface, preserving snowpack through a negative surface RE. Across regions further away from dust emission zones, namely the Northern Rockies, dust particles tend to be smaller and more scattering. Across this high-albedo surface, downwelled solar radiation is reflected upward and subsequently backscattered to the surface by the scattering dust layer in an iterative process. Suppressed dimming of incoming solar energy, in tandem with a positive longwave RE due to dust ARI, can thus warm the surface and reduce SWE. Overall, ARIs associated with LAPs tend to decelerate meltout by a few days. We conclude by noting that there were non-negligible changes in simulated meteorology in the instance in which dust emissions were increased. Specifically, SWE reduction enhancements of several millimeters were simulated across mountainous areas. While our results were consistent with C. Wu et al. (2018), we note that observed [dust] was estimated following Kevouras et al. (2007), and this estimation is subject to uncertainties therein. There remains a possibility that dust effects may be quite comparable to those of BC, although further simulations are required to answer this question. More generally, LAP SDEs and ARI can impart significant perturbations of WUS weather and hydrology and corroborate the results of coarser-resolution GCMs. Future studies should focus on increasing the domain size to quantify larger synoptic-scale circulation changes associated with LAP effects; this coupling has been noted in previous GCM experiments (e.g., Rahimi et al., 2019), but the domain size used in this study was too small to resolve these potentially significant larger-scale responses. Internal model variability may also have influenced our results; hence we propose that these effects be examined in an ensemble approach. Additionally, because convection was not parameterized, an opportunity exists to quantify how orographically forced precipitation events are impacted by LAP SDE. Specifically, this output data can be used to quantify how updraft speeds, convective updraft area, and storm energetics change as a function of LAP effects, which will be topics of future study.
A1 SNICAR
Simulated snow modification by the SNICAR model begins with LAP deposition flux (wet and dry) information calculated by the atmospheric chemistry module. As described in Flanner et al. (2012) and Zhao et al. (2014), dust (BC) mixes externally (internally and externally) with falling hydrometeors and is deposited on the snowpack.
Upon deposition, LAP is uniformly and immediately mixed throughout the layer. For BC, offline-calculated Mie parameters (i.e., asymmetry parameter, SSA, extinction) valid for effective radii of 0.1 µm are used from Chang and Charalampopoulos (1990). These values were used to derive snow absorption enhancement factors for a broad range of snow grain sizes. The mass absorption cross sections of BC are scaled by these factors, which are found in a lookup table. For dust, optical properties in snowpack are derived from a combination of the Maxwell Garnett mixing approximation and Mie theory. An assumed dust composition is used, and its size distribution is defined lognormally with a number median radius of 0.414 µm and a standard deviation of 2. Snow grains are treated by SNICAR as a collection of ice spheres with effective median number radii between 30 and 1500 µm. Mie parameters for snow are computed in one visible and four near-infrared bands offline.
For the final radiative transfer calculations, BC, dust, and snow grains are treated as an external mixture by summing the extinction optical depths for each element, weighting the individual SSAs by the optical depths, and weighting the asymmetry parameters by the product of optical depths and the SSAs (Zhao et al., 2014). More information on the methods used in SNICAR can be found in Flanner et al. (2012).
As the snowpack melts, meltwater scavenging of LAP is accounted for in SNICAR. Each layer in CLM4 has a threshold liquid capacity. Once this capacity is exceeded in a layer, the excess liquid is added to the liquid content of the layer beneath. The amount of scavenged LAP in this meltwater is proportional to this excess, the mass mixing ratio of LAP, and a scavenging factor (see Eq. 1; Zhao et al., 2014).
A2 The quasi-global WRF-Chem experiment
In this study, to avoid the issue of different dust bin cutoff sizes between MOZART-4 and MOSAIC, we ran a quasi-global (QG) WRF-Chem simulation to provide initial and cross-boundary dust in our simulations. The QG WRF-Chem was run at 1∘ horizontal grid spacing with the identical options to the convective-permitting experiments, except that convection was parameterized following Kain (2004). The QG experiment was ran on a 360×130 grid (180∘ W–180∘ E, 60∘ S–70∘ N) following the methodology of Zhao et al. (2013b) and Hu et al. (2016). The QG experiment was initialized on 2 December 2008 at 00:00 UTC and integrated until 1 August 2009 at 00:00 UTC. Horizontal winds and temperature were nudged in the QG experiment to meteorological fields from the Climate Forecast System Reanalysis (CFSR; Saha et al., 2010) with a relaxation coefficient of 0.003. Sea surface temperatures in the QG experiment and atmospheric tendencies in the QG experiments are updated every 6 h. A dust-tuning factor of 0.6 was needed in the QG experiment to appropriately simulate spatially averaged dust optical depth values. Dust from the QG experiment was interpolated to grid cell locations at the lateral boundaries of the convective-permitting experiments via a third-order least squares regression method. More details about the QG WRF-Chem simulation can be found in Zhao et al. (2013b) and Hu et al. (2016).
A3 Evaluation of NOCHEM from 1 October onwards
Because all WRF-Chem experiments are initialized to NOCHEM's 1 February meteorological state, we briefly examine NOCHEM's overall performance alone. Time series of simulated and SNOTEL 2 m temperature, precipitation, and SWE from 1 October 2008 and onward are shown in Fig. 2. NOCHEM exhibits a Tav cold bias of 2.41 ∘C compared to the 418-SNOTEL-site average of 1.60 ∘C (Fig. 2a). Precipitation (Fig. 2b) and SWE (Fig. 2c) are overestimated by NOCHEM, which simulates a bias of +0.97 mm d−1 and +9.61 mm, respectively. Despite these biases, NOCHEM-simulated Tav, precipitation, and SWE are highly correlated with SNOTEL, with Pearson r values of +0.97, +0.83, and +0.97, respectively. For SWE, NOCHEM's wet bias is skewed by slower-than-observed meltout (as much as 30 d across Greater Idaho; Fig. S1). However, from mid-March through mid-May, NOCHEM overpredicts SWE by tens of millimeters (Figs. 2c and S1).
A4 Differences between CNT and NOCHEM
The goal of this study is to quantify the impacts of LAP SDE and ARI on WUS weather and hydrology. This aim does not align with examining root causes of differences between CNT and NOCHEM, and its scope does not necessarily focus on WRF's overall deficiencies in simulating seasonal snow dynamics. Nonetheless, we do note that significant technical differences exist between NOCHEM and CNT, which lead to their different results.
First, upon grid-cell saturation, NOCHEM's number concentration of activated aerosols is prescribed in the microphysics scheme to be 250 cm−3, while CNT's is calculated online accounting for the local aerosol characteristics. This difference most certainly leads to differences in the simulated snow yields through changes in the precipitation efficiency of clouds (not examined), with CNT simulating a smaller wet precipitation bias than NOCHEM compared to SNOTEL observations. An additional notable difference between CNT and NOCHEM is the coupling of chemical species' optical properties to the radiation code in CNT; this process is entirely neglected in NOCHEM and most certainly contributes to differences in results between the two simulations.
More generally, WRF without chemistry (NOCHEM) has traditionally been developed to emulate the observed planet as closely as possible even though the model itself is free of explicitly simulated and physically based chemical processes, both in its atmospheric component and its land surface model. This study is an example of an instance where the inclusion of chemistry into the model (CNT) does not necessarily improve model performance. In fact, it appears that the presence of chemistry in CNT actually worsens our results compared to NOCHEM, as NOCHEM simulates SWE values closer to SNOTEL (Fig. 2c) than CNT. Additionally, WRF (and other models) has traditionally showcased difficulties in simulating the evolution and timing of seasonal snow dynamics (Caldwell et al., 2009; C. Wu et al., 2017), and our study does not attempt to explore why these deficiencies exist. Here, both simulations simulate a meltout date ∼20 d later than is observed by SNOTEL. The differences between CNT and NOCHEM, as well as their deficiencies, should be kept in mind when interpreting the results of the study, and an evaluation of their differences is beyond the scope of this study.
A5 Calculation of LAP radiative effects
For computation of the atmospheric radiative effects at the TOA and the surface, the radiation scheme is run interactively with all aerosol species factored into the calculation of beam transmittance (e.g., upwelled shortwave flux at the TOA and downwelled longwave flux at the surface). The radiation scheme is then called iteratively in a methodology that sees, for example, BC excluded from the calculation of beam transmittance variables. By subtracting the transmittance variables in the case where BC is excluded from the case including all aerosol species, the radiative effect of BC can be quantified.
Data used in this study are permanently stored (for 5 years) on the NCAR Campaign file storage system. Upon request, these data can be moved from Campaign Storage on the NCAR public data storage repository for community access. The data will be purged from the repository after 45 d. Users who wish to access the data may email s.rahimi@ucla.edu along with cislhelp@ucar.edu to gain access to the repository. CISL will create an account for users needing access to the repository, and Stefan Rahimi will copy the data onto the temporary repository from Campaign Storage. To begin, see initial setup at https://www2.cisl.ucar.edu/resources/storage-and-file-systems/using-the-ncar-data-sharing-service (last access: September 2020).
The supplement related to this article is available online at: https://doi.org/10.5194/acp-20-10911-2020-supplement.
SR conducted the WRF-Chem experiments and performed analyses. XL provided guidance in the scientific conceptualization. ZL, ZJL, and CZ assisted in certain technical aspects of WRF-Chem.
We acknowledge the overseers of IMPROVE, a collaborative association of state, tribal, and federal agencies, as well as international partners. The US Environmental Protection Agency is the primary funding source, with contracting and research support from the National Park Service. The air quality group at the University of California, Davis is the central analytical laboratory, with ion analysis provided by the Research Triangle Institute and carbon analysis provided by the Desert Research Institute. We also thank Stu McKeen for his help with the use of his emissions generation software. We also acknowledge the TORNERDO consortium.
This paper was edited by Federico Fierli and reviewed by Hans-Werner Jacobi and Chandan Sarangi.
Bassett, R., Young, P. J., Blair, G. S., Samreen, F., and Simm, W.: A Large Ensemble Approach to Quantifying Internal Model Variability Within the WRF Numerical Model, J. Geophys. Res.-Atmos., 125, e2019JD031286, https://doi.org/10.1029/2019JD031286, 2020.
Binkowski, F. S. and Shankar, U.: The Regional Particulate Matter Model: 1. Model description and preliminary results, J. Geophys. Res., 100, 26191–26209, https://doi.org/10.1029/95JD02093, 1995.
Bond, T. C., Doherty, S. J., Fahey, D. W., Forster, P. M., Berntsen, T., DeAngelo, B. J., Flanner, M. G., Ghan, S., Kärcher, B., Koch, D., Kinne, S., Kondo, Y., Quinn, P. K., Sarofim, M. C., Schultz, M. G., Schulz, M., Venkataraman, C., Zhang, H., Zhang, S., Bellouin, N., Guttikunda, S. K., Hopke, P. K., Jacobson, M. Z., Kaiser, J. W., Klimont, Z., Lohmann, U., Schwarz, J. P., Shindell, D., Storelvmo, T., Warren, S. G., and Zender, C. S.: Bounding the role of black carbon in the climate system: A scientific assessment, J. Geophys. Res.-Atmos., 118, 5380–5552, https://doi.org/10.1002/jgrd.50171, 2013.
Broxton, P. D., Dawson, N., and Zeng, X.: Linking snowfall and snow accumulation to generate spatial maps of SWE and snow depth, Earth Space Sci., 3, 246–256, 2016.
Caldwell, P., Chin, H.-N. S., Bader, D. C., and Bala, G.: Evaluation of a WRF dynamical downscaling simulation over California, Climatic Change, 95, 499–521, https://doi.org/10.1007/s10584-009-9583-5, 2009.
Chang, H. and Charalampopoulos, T. T.: Determination of the wavelength dependence of refractive indices of flame soot, P. Roy. Soc. Lond. A Mat., 430, 577–591, 1990.
Daly, C., Neilson, R. P., and Phillips, D. L.: A statistical topographic model for mapping climatological precipitation over mountainous terrain, J. Appl. Meteorol. Clim., 33, 140–158, 1994.
Das, T., Hidalgo, H. G., Pierce, D. W., and Barnett, T. P.: Structure and detectability of trends in hydrological measures over the western United States, J. Hydrometeorol., 10, 871–892, 2009.
Easter, R. C., Ghan, S. J., Zhang, Y., Saylor, R. D., Chapman, E. G., Laulainen, N. S., Abdul-Razzak, H., Leung, L. R., Bian, X., and Zaveri, R. A.: MIRAGE: Model description and evaluation of aerosols and trace gases, J. Geophys. Res., 109, D20210, https://doi.org/10.1029/2004JD004571, 2004.
Fast, J. D., Gustafson Jr., W. I., Easter, R. C., Zaveri, R. A., Barnard, J. C., Chapman, E. G., Grell, G. A., and Peckham, S. E.: Evolution of ozone, particulates, and aerosol direct radiative forcing in the vicinity of Houston using a fully coupled meteorology-chemistry-aerosol model, J. Geophys. Res., 111, D21305, https://doi.org/10.1029/2005JD006721, 2006.
Fischer, E. V., Hsu, N. C., Jaffe, D. A., Jeong, M.-J., and Gong, S. L.: A decade of dust: Asian dust and springtime aerosol load in the U.S. Pacific Northwest, J. Geosphys. Res. Lett., 36, L038221, https://doi.org/10.1029/2008GL036467, 2009.
Flanner, M. G., Zender, C. S., Randerson, J. T., and Rasch, P. J.: Present-day climate forcing and response from black carbon in snow, J. Geophys. Res., 112, D11202, https://doi.org/10.1029/2006JD008003, 2007.
Flanner, M. G., Liu, X., Zhou, C., Penner, J. E., and Jiao, C.: Enhanced solar energy absorption by internally-mixed black carbon in snow grains, Atmos. Chem. Phys., 12, 4699–4721, https://doi.org/10.5194/acp-12-4699-2012, 2012.
Fyfe, J. C., Derksen, C., Mudryk, L., Flato, G. M., Santer, B. D., Swart, N. C., Molotch, N. P., Zhang, X., Wan, H., Arora, V. K., Scinocca, J., and Jiao, Y.: Large near-term projected snowpack loss over the western United States, Nat. Commun., 8, 14996, https://doi.org/10.1038/ncomms14996, 2017.
Ghan, S. J., Liu, X., Easter, R. C., Zaveri, R., Rasch, P. J., Yoon, J.-H., and Eaton, B.: Toward a Minimal Representation of Aerosols in Climate Models: Comparative Decomposition of Aerosol Direct, Semidirect, and Indirect Radiative Forcing, J. Climate, 25, 6461–6476, https://doi.org/10.1175/JCLI-D-11-00650.1, 2012.
Ginoux, P., Chin, M., Tegen, I., Prospero, J. M., Holben, B., Dubovik, O., and Lin, S.: Sources and distributions of dust aerosols simulated with the GOCART model, J. Geophys. Res., 106, 20225–20273, 2001.
Grell, G. A., Peckham, S. E., Schmitz, R., McKeen, S. A., Frost, G., Skamarock, W. C., and Eder, B.: Fully coupled “online” chemistry within the WRF model, Atmos. Environ., 39, 6957–6975, 2005.
Guenther, A., Zimmerman, P. R., Harley, P. C., Morrison, R. K., and Fall, R.: Isoprene and monoturpene emission rate variability: Model evaluations and sensitivity analyses, J. Geophys. Res.-Atmos., 90, 12609–12617, 1993.
Gustafson, W. I., Chapman, E. G., Ghan, S. J., Easter, R. C., and Fast, J. D.: Impact on modeled cloud characteristics due to simplified treatment of uniform cloud condensation nuclei during NEAQS 2004, Geophys. Res. Lett., 34, L19809, https://doi.org/10.1029/2007GL030021, 2007.
Hadley, O. L. and Kirchstetter, T. W.: Black carbon reduction of snow albedo, Nat. Clim. Change, 2, 437–440, https://doi.org/10.1038/nclimate1433, 2012.
Hall, D. K. and Riggs, G. A.: MODIS/Aqua Snow Cover Monthly L3 Global 0.05Deg CMG, Version 6. MYD10CM. Boulder, Colorado USA, NASA National Snow and Ice Data Center Distributed Active Archive Center, https://doi.org/10.5067/MODIS/MYD10CM.006, 2016.
Hamlet, A. F., Mote, P. W., Clark, P. M., and Lettenmaier, D. P.: Twentieth-Century trends in runoff, evapotranspiration, and soil moisture in the western United States, J. Climate, 20, 1468–1486, 2007.
Hong, S.-Y., Noh, Y., and Dudhia, J.: A New Vertical Diffusion Package with an Explicit Treatment of Entrainment Processes, Mon. Weather Rev., 134, 2318–2341, https://doi.org/10.1175/MWR3199.1, 2006.
Hu, Z., Zhao, C., Huang, J., Leung, L. R., Qian, Y., Yu, H., Huang, L., and Kalashnikova, O. V.: Trans-Pacific transport and evolution of aerosols: evaluation of quasi-global WRF-Chem simulation with multiple observations, Geosci. Model Dev., 9, 1725–1746, https://doi.org/10.5194/gmd-9-1725-2016, 2016.
Iacono, M. J., Delamere, J. S., Mlawer, E. J., Shephard, M. W., Clough, S. A., and Collins, W. D.: Radiative forcing by long-lived greenhouse gases: Calculations with the AER radiative transfer models, J. Geohys. Res. Atmos., 113, 2–9, https://doi.org/10.1029/2008JD009944, 2008.
Kain, J. S.: The Kain–Fritsch convective parameterization: An update, J. Appl. Meteorol. Clim., 43, 170–181, https://doi.org/10.1175/1520-0450(2004)043< 0170:TKCPAU>2.0.CO;2, 2004.
Kapnick, S. and Hall, A.: Causes of recent changes in western North American snowpack, Clim. Dynam., 38, 1885–1899, https://doi.org/10.1007/s00382-011-1089-y, 2012.
Kavouras, I. G., Etyemezian, V., Xu, J., DuBois, D. W., Green, M., and Pitchford, M.: Assessment of the local windblown component of dust in the western United States, J. Geophys. Res.-Atmos., 112, D08211, https://doi.org/10.1029/2006JD007832, 2007.
Liu, X., Easter, R. C., Ghan, S. J., Zaveri, R., Rasch, P., Shi, X., Lamarque, J.-F., Gettelman, A., Morrison, H., Vitt, F., Conley, A., Park, S., Neale, R., Hannay, C., Ekman, A. M. L., Hess, P., Mahowald, N., Collins, W., Iacono, M. J., Bretherton, C. S., Flanner, M. G., and Mitchell, D.: Toward a minimal representation of aerosols in climate models: description and evaluation in the Community Atmosphere Model CAM5, Geosci. Model Dev., 5, 709–739, https://doi.org/10.5194/gmd-5-709-2012, 2012.
Malm, W. C., Sisler, J. F., Huffman, D., Eldred, R. A., and Cahill, T. A.: Spatial and seasonal trends in particle concentration and optical extinction in the United States, J. Geophys. Res.-Atmos., 99, 1347–1370, https://doi.org/10.1029/93JD02916, 1994.
Malm, W. C., Pitchford, M. L., McDade, C., and Ashbaugh, L. L.: Coarse particle speciation at selected locations in the rural continental United States, Atmos. Environ., 41, 2225–2239, https://doi.org/10.1016/j.atmosenv.2006.10.077, 2007.
Morrison, H., Thompson, G., and Tatarskii, V.: Impact of Cloud Microphysics on the Development of Trailing Stratiform Precipitation in a Simulated Squall Line: Comparison of One- and Two-Moment Schemes, Mon. Weather. Rev., 137, 991–1007, https://doi.org/10.1175/2008MWR2556.1, 2009.
Mote, P. W.: Climate-driven variability and trends in mountain snowpack in western North America, J. Climate, 19, 6209–6220, 2006.
Mote, P. W., Li, S., Lettenmaier, D. P., Xiao, M., and Engel, R.: Dramatic declines in snowpack in the western US, npj Clim. Atmos. Sci., 1, 2, https://doi.org/10.1038/s41612-018-0012-1, 2018.
Oleson, K. W., Lawrence, D. M., B, G., Flanner, M. G., Kluzek, E., P., J., Lewis, S., Swenson, C., Thomton, E., Feddema, J., Heald, C. L., Lamarque, J.-F., Niu, G.-Y. Qian, T., Running, S., Sakaguchi, K., Yang, L., Zeng, X., and Decker, M.: Technical description of version 4 of the Community Land Model (CLM), NCAR Tech. Note NCAR/TN–478+STR., 266 pp., 2010.
Painter, T. H., Barrett, A. P., Landry, C. C., Neff, J. C., Cassidy, M. P., Lawrence, C. R., McBride, K. E., and Farmer, G. L.: Impact of disturbed desert soils on duration of mountain snow cover, Geophys. Res. Lett., 34, L12502, https://doi.org/10.1029/2007GL030284, 2007.
Pederson, G. T., Gray, S. T., Ault, T., Marsh, W., Fagre, D. B., Bunn, A. G., Woodhouse, C. A., and Graumlich, L. J.: Climate controls on the snowmelt hydrology of the northern Rocky Mountains, J. Climate, 14, 1666-1687, 2011.
Pepin, N., Bradley, R. S., Diaz, H. F., Baraer, M., Caceres, E. B., Forsythe, N., H. Fowler, H., Greenwood, G., Hashmi, M. Z., Liu, X. D., Miller, J. R., Ning, L., Ohmura, A., Palazzi, E., Rangwala, I., Schöner, W., Severskiy, I., Shahgedanova, M., Wang, M. B., Williamson, S. N., and Yang, D. Q.: Elevation-dependent warming in mountain regions of the world, Nat. Clim. Change, 5, 424–430, https://doi.org/10.1038/nclimate2563, 2015.
Pierce, D. W., Barnett, T. P., Hidalgo, H. G., Das, T., Bonfils, C., Santer, B. D., Govindasamy, B. Dettinger, M. D., Cayan, D. R., Mirin, A., Wood, A. W., and Nozawa, T.: Attribution of declining western U.S. snowpack to human effects, J. Climate, 21, 6425–6444, 2008.
Qian, Y., Gustafson, W. L., Leung, R. L., and Ghan, S. J.: Effects of soot-induced albedo change on snowpack and hydrological cycle in western United States based on Weather Research and Forecasting chemistry and regional climate simulations, J. Geophys. Res.-Atmos., 114, D03108, https://doi.org/10.1029/2008JD011039, 2009.
Rahimi, S., Liu, X., Wu, C., Lau, W. K., Brown, H., Wu, M., and Qian, Y.: Quantifying snow darkening and atmospheric radiative effects of black carbon and dust on the South Asian monsoon and hydrological cycle: experiments using variable-resolution CESM, Atmos. Chem. Phys., 19, 12025–12049, https://doi.org/10.5194/acp-19-12025-2019, 2019.
Rajagopalan, B., Nowak, K., Prairie, J., Hoerling, M., Harding, B., Barsugli, J., Ray, A., and Udall, B.: Water supply risk on the Colorado River: Can management mitigate? Water Resour. Res., 45, W08201, https://doi.org/10.1029/2008WR007652, 2009.
Saha, S., Moorthi, S., Pan, H.-L., Wu, X., Wang, J., Nadiga, S., Tripp, P., Kistler, R., Woollen, J., Behringer, D., Liu, H., Stokes, D., Grumbine, R., Gayno, G., Wang, J., Hou, Y.-T., Chuang, H., Juang, H.-M. H., Sela, J., Iredell, M., Treadon, R., Kleist, D., Van Delst, P., Keyser, D., Derber, J., Ek, M., Meng, J., Wei, H., Yang, R., Lord, S., van den Dool, H., Kumar, A., Wang, W., Long, C., Chelliah, M., Xue, Y., Huang, B., Schemm, J.-K., Ebisuzaki, W., Lin, R., Xie, P., Chen, M., Zhou, S., Higgins, W., Zou, C.-Z., Liu, Q., Chen, Y., Han, Y., Cucurull, L., Reynolds, R. W., Rutledge, G., and Goldberg, M.: The NCEP Climate Forecast System Reanalysis, B. Am. Meteorol. Soc., 91, 1015–1058, https://doi.org/10.1175/2010BAMS3001.1, 2010.
Sarangi, C., Qian, Y., Rittger, K., Bormann, K. J., Liu, Y., Wang, H., Wan, H., Lin, G., and Painter, T. H.: Impact of light-absorbing particles on snow albedo darkening and associated radiative forcing over high-mountain Asia: high-resolution WRF-Chem modeling and new satellite observations, Atmos. Chem. Phys., 19, 7105–7128, https://doi.org/10.5194/acp-19-7105-2019, 2019.
Serreze, M. C., Clark, M. P., Armstrong, R. L., McGinnis, D. A., and Pulwarty, R. S.: Characteristics of the western United States snowpack from snowpack telemetry (SNOTEL) data, Water Resour. Res., 35, 2145–2160, 1999.
Stone, R. S., Anderson, G. P., Shettle, E. P., Andrews, E., Loukachine, K., Dutton, E. G., Schaaf, C., and Roman III, M. O.: Radiative impact of boreal smoke in the Arctic: Observed and modeled, J. Geophys. Res., 113, D14S16, https://doi.org/10.1029/2007JD009657, 2008.
Tegen, I. and Lacis, A. A.: Modeling of particle size distribution and its influence on the radiative properties of mineral dust aerosol, J. Geophys. Res.-Atmos., 101, 19237–19244, 2012.
Tegen I., Werner M., Harrison, S. P., and Kohfeld, K. E.: Relative importance of climate and land use in determining present and future global soil dust emission, J. Geosphys. Res. Lett., 31, L05105, https://doi.org/10.1029/2003GL019216, 2004.
Toon, O. B., McKay, C. P., Ackerman, T. P., and Santhanam, K.: Rapid calculation of radiative heating rates and photodissociation rates in inhomogeneous multiple scattering atmospheres, J. Geophys. Res., 94, 16287–16301, https://doi.org/10.1029/JD094iD13p16287, 1989.
Wiedinmyer, C., Akagi, S. K., Yokelson, R. J., Emmons, L. K., Al-Saadi, J. A., Orlando, J. J., and Soja, A. J.: The Fire INventory from NCAR (FINN): a high resolution global model to estimate the emissions from open burning, Geosci. Model Dev., 4, 625–641, https://doi.org/10.5194/gmd-4-625-2011, 2011.
Wiscombe, W. J. and Warren, S. G.: A model for the spectral albedo of snow, I: Pure snow, J. Atmos. Sci., 37, 2712–2733, 1980.
Wu, C., Liu, X., Lin, Z., Rhoades, A. M., Ullrich, P. A., Zarzycki, C. M., Lu, Z., and Rahimi-Esfarjani, S. R.: Exploring a Variable-Resolution Approach for Simulating Regional Climate in the Rocky Mountain Region Using the VR-CESM, J. Geophys. Res., 122, 10939–10965, https://doi.org/10.1002/2017JD027008, 2017.
Wu, C., Liu, X., Lin, Z., Rahimi-Esfarjani, S. R., and Lu, Z.: Impacts of absorbing aerosol deposition on snowpack and hydrologic cycle in the Rocky Mountain region based on variable-resolution CESM (VR-CESM) simulations, Atmos. Chem. Phys., 18, 511–533, https://doi.org/10.5194/acp-18-511-2018, 2018.
Wu, L., Gu, Y., Jiang, J. H., Su, H., Yu, N., Zhao, C., Qian, Y., Zhao, B., Liou, K.-N., and Choi, Y.-S.: Impacts of aerosols on seasonal precipitation and snowpack in California based on convection-permitting WRF-Chem simulations, Atmos. Chem. Phys., 18, 5529–5547, https://doi.org/10.5194/acp-18-5529-2018, 2018.
Zaveri, R. A., Easter, R. C., Fast, J. D., and Peters, L. K.: Model for Simulating Aerosol Interactions and Chemistry (MOSAIC), J. Geophys. Res.-Atmos., 113, D13204, https://doi.org/10.1029/2007JD008782, 2008.
Zaveri, R. A. and Peters, L. K.: A new lumped structure photochemical mechanism for large-scale applications, J. Geophys. Res.-Atmos., 104, 30387–30415, https://doi.org/10.1029/1999JD900876, 1999.
Zhang, D. and Anthes, R. A.: A High-Resolution Model of the Planetary Boundary Layer–Sensitivity Tests and Comparisons with SESAME-79 Data, J. Appl. Meteorol. Clim., 21, 1594–1609, https://doi.org/10.1175/1520-0450(1982)021<1594:AHRMOT>2.0.CO;2, 1982.
Zhao, C., Liu, X., Leung, L. R., Johnson, B., McFarlane, S. A., Gustafson Jr., W. I., Fast, J. D., and Easter, R.: The spatial distribution of mineral dust and its shortwave radiative forcing over North Africa: modeling sensitivities to dust emissions and aerosol size treatments, Atmos. Chem. Phys., 10, 8821–8838, https://doi.org/10.5194/acp-10-8821-2010, 2010.
Zhao, C., Liu, X., Ruby Leung, L., and Hagos, S.: Radiative impact of mineral dust on monsoon precipitation variability over West Africa, Atmos. Chem. Phys., 11, 1879–1893, https://doi.org/10.5194/acp-11-1879-2011, 2011.
Zhao, C., Leung, L. R., Easter, R., Hand, J., and Avise, J.: Characterization of speciated aerosol direct radiative forcing over California, J. Geophys. Res., 118, 2372–2388, https://doi.org/10.1029/2012JD018364, 2013a.
Zhao, C., Chen, S., Leung, L. R., Qian, Y., Kok, J. F., Zaveri, R. A., and Huang, J.: Uncertainty in modeling dust mass balance and radiative forcing from size parameterization, Atmos. Chem. Phys., 13, 10733–10753, https://doi.org/10.5194/acp-13-10733-2013, 2013b.
Zhao, C., Hu, Z., Qian, Y., Ruby Leung, L., Huang, J., Huang, M., Jin, J., Flanner, M. G., Zhang, R., Wang, H., Yan, H., Lu, Z., and Streets, D. G.: Simulating black carbon and dust and their radiative forcing in seasonal snow: a case study over North China with field campaign measurements, Atmos. Chem. Phys., 14, 11475–11491, https://doi.org/10.5194/acp-14-11475-2014, 2014.
Zhao, C., Huang, M., Fast, J. D., Berg, L. K., Qian, Y., Guenther, A., Gu, D., Shrivastava, M., Liu, Y., Walters, S., Pfister, G., Jin, J., Shilling, J. E., and Warneke, C.: Sensitivity of biogenic volatile organic compounds to land surface parameterizations and vegetation distributions in California, Geosci. Model Dev., 9, 1959–1976, https://doi.org/10.5194/gmd-9-1959-2016, 2016.
The increase in the DTF was arbitrary. Due to the high computational demand of WRF-Chem experiments, further simulations with increased DTFs values were not conducted.
- Abstract
- Introduction
- Model, experiments, and data
- Evaluation of simulated meteorology, BC, and dust
- Radiative effects of BC and dust
- SDE and ARI impacts on WUS weather and hydrology
- Consequences of increased dust
- Conclusions
- Appendix A
- Data availability
- Author contributions
- Acknowledgements
- Review statement
- References
- Supplement


