the Creative Commons Attribution 4.0 License.
the Creative Commons Attribution 4.0 License.
 | 15 Sep 2020
What have we missed when studying the impact of aerosols on surface ozone via changing photolysis rates?
Jinhui Gao
Bin Zhu
Lili Wang
Fangwen Bao
Previous studies have emphasized that the decrease in photolysis rate at the surface induced by the light extinction of aerosols could weaken ozone photochemistry and then reduce surface ozone. However, quantitative studies have shown that weakened photochemistry leads to a much greater reduction in the net chemical production of ozone, which does not match the reduction in surface ozone. This suggests that in addition to photochemistry, some other physical processes related to the variation of ozone should also be considered. In this study, the Weather Research and Forecasting with Chemistry (WRF-Chem) model coupled with the ozone source apportionment method was applied to determine the mechanism of ozone reduction induced by aerosols over central East China (CEC). Our results showed that weakened ozone photochemistry led to a significant reduction in ozone net chemical production, which occurred not only at the surface but also within the lowest several hundred meters in the planetary boundary layer (PBL). Meanwhile, a larger ozone gradient was formed in the vertical direction, which led to the high concentrations of ozone aloft being entrained by turbulence from the top of the PBL to the surface and partly counteracting the reduction in surface ozone. In addition, contribution from dry deposition was weakened due to the decrease in surface ozone concentration. The reduction in the ozone's sink also slowed down the rate of the decrease in surface ozone. Ozone in the upper layer of the PBL was also reduced, which was induced by much ozone aloft being entrained downward. Therefore, by affecting the photolysis rate, the impact of aerosols was a reduction in ozone not only at the surface but also throughout the entire PBL during the daytime over CEC in this study. The ozone source apportionment results showed that 41.4 %–66.3 % of the reduction in surface ozone came from local and adjacent source regions, which suggested that the impact of aerosols on ozone from local and adjacent regions was more significant than that from long-distance regions. The results also suggested that while controlling the concentration of aerosols, simultaneously controlling ozone precursors from local and adjacent source regions is an effective way to suppress the increase in surface ozone over CEC at present.
- Article
(5554 KB) - Full-text XML
-
Supplement
(3595 KB) - BibTeX
- EndNote


Ozone in the troposphere, especially in the planetary boundary layer (PBL), is a well-known secondary air pollutant that is seriously harmful to human health and vegetation (Haagen-Smit and Fox, 1954). As an important source of tropospheric ozone, the photochemical production of ozone is significantly affected by ozone precursors (i.e., NOx and VOCs) and photolysis rates, and the latter is determined by the intensity of solar irradiance (Crutzen, 1973; Monks et al., 2015). Aerosols in the troposphere, which are another well-known air pollutant, can influence ozone levels through multiple pathways, for example, modulating temperature (Hansen et al., 1997), light extinction (Dickerson et al., 1997; J. Gao et al., 2018), scavenging hydroperoxy (HO2) radicals (Li et al., 2019a, b). The light extinction of aerosols can reduce ozone net production (the sum of ozone chemical production and loss) at the surface by reducing the photolysis rate (i.e., J(NO2) and J(); Dickerson et al., 1997), which we refer to as the “direct impact”. Alternatively, light extinction caused by absorbing aerosols (i.e., black carbon) can suppress the development of the PBL (Ding et al., 2016) and then influence the surface ozone during the daytime (J. Gao et al., 2018), which we refer to as the “indirect impact”. Studies on the direct impact have been conducted in many places around the world (Jacobson, 1998; Castro et al., 2001; Li et al., 2005; G. Li et al., 2011), especially in highly polluted regions such as the Beijing–Tianjin–Hebei region in China (Bian et al., 2007; Deng et al., 2012; Xing et al., 2017); however, the mechanism of the direct impact has still not been fully explained.
Quantitative studies have suggested that, because of the impact of aerosols via their affecting photolysis rates, 2 %–17 % of surface ozone has decreased (Jacobson, 1998; J. Li et al., 2011; Wang et al., 2016). However, these studies also showed that ozone net production decreased much more (Cai et al., 2013; Wang et al., 2019), which did not match the magnitude of the reduction in surface ozone. For example, a modeling study conducted by J. Li et al. (2011) showed that the average reduction in surface ozone over central East China (CEC) was −5.4 ppb, whereas the average reduction in ozone net production was −10.5 ppb. The difference between the two reductions indicates that, in addition to ozone photochemistry, there must be other ozone-related physical processes influenced by the reduction in photolysis rate induced by aerosols. However, pertinent studies are still lacking.
At present, air pollution in China is characterized by the “air pollution complex”, which shows both aerosols (especially fine particulate matter PM2.5) and ozone pollution issues in the atmosphere (Shao et al., 2006; Z. Q. Li et al., 2017). With a series of stringent air pollution control policies conducted, the concentrations of aerosols have decreased in the past few years (Wang et al., 2017); in contrast, the concentrations of ozone in China have increased, especially in CEC (reports on the state of the environment in China, http://english.mee.gov.cn/Resources/Reports/soe/, last access: 7 September 2020). Studies have suggested that the extensive reduction in aerosols may cause a potential risk of surface ozone enhancement (Anger et al., 2016; Wang et al., 2016). In this case, fully understanding and quantifying the impacts of aerosols on ozone is helpful for providing more reasonable advice for air quality protection policies in China.
In this study, the fully coupled “online” model system, the Weather Research and Forecasting with Chemistry (WRF-Chem) model, was applied to simulate air pollutants over CEC in October 2018. The impact of aerosols on ozone via influencing the photolysis rate was quantitatively studied by using process analysis, through a comparison between control and sensitivity simulations. In addition, with the application of the ozone source apportionment method (Gao et al., 2016, 2017) that we developed and coupled with the WRF-Chem model system, the ozone contributions and their changes induced by aerosols over typical cities in CEC were discussed quantitatively in this study. This paper is organized as follows. A description of the model setting, used data, and scenario design is presented in Sect. 2. The results and discussion of the subject are presented in Sect. 3. And finally, we end with the conclusions in Sect. 4.
2.1 Model configuration
The model system used in this study, the WRF-Chem model, is a fully coupled online 3-D Eulerian meteorological and chemical transport model that has been globally applied in air quality research (Tie et al., 2013; Zhang et al., 2014; M. Gao et al., 2018; Hu et al., 2019). The version of the WRF-Chem model we used in this study is 3.9.1.1, and detailed introductions of the meteorological parts and chemical parts can be found in Skamarock et al. (2008) and Grell et al. (2005), respectively.
Regarding the simulation settings, two nested domains (Fig. 1) were set up with grid sizes of 122×122 and 150×150 at horizontal resolutions of 36 and 12 km for the parent domain (D1) and nested domain (D2), respectively. D1 covered most parts of China and the surrounding areas and ocean, and D2 covered most parts of East China. The modeling results of D1 provided meteorological and chemical boundary conditions for the simulations of D2. For the vertical direction, 38 layers were set up from the surface up to a pressure limit at 50 hPa. It should be noted that 12 layers were located below the lowest 2 km, which is suitable for us to discuss the impacts of aerosols on ozone in the PBL. The Carbon Bond Mechanism Z (CBM-Z; Zaveri and Peters, 1999) was applied as the gas-phase chemical mechanism in this study. CBM-Z is the upgraded version of Carbon Bond IV (Gery et al., 1989), which includes 53 species with 133 reactions and extends the framework to function for larger spatial scales and longer time periods. Correspondingly, the Model for Simulating Aerosol Interactions and Chemistry with eight bins (MOSAIC-8bins; Zaveri et al., 2008) was chosen as the aerosol chemistry mechanism. Other parameterization settings are listed in Table 1.
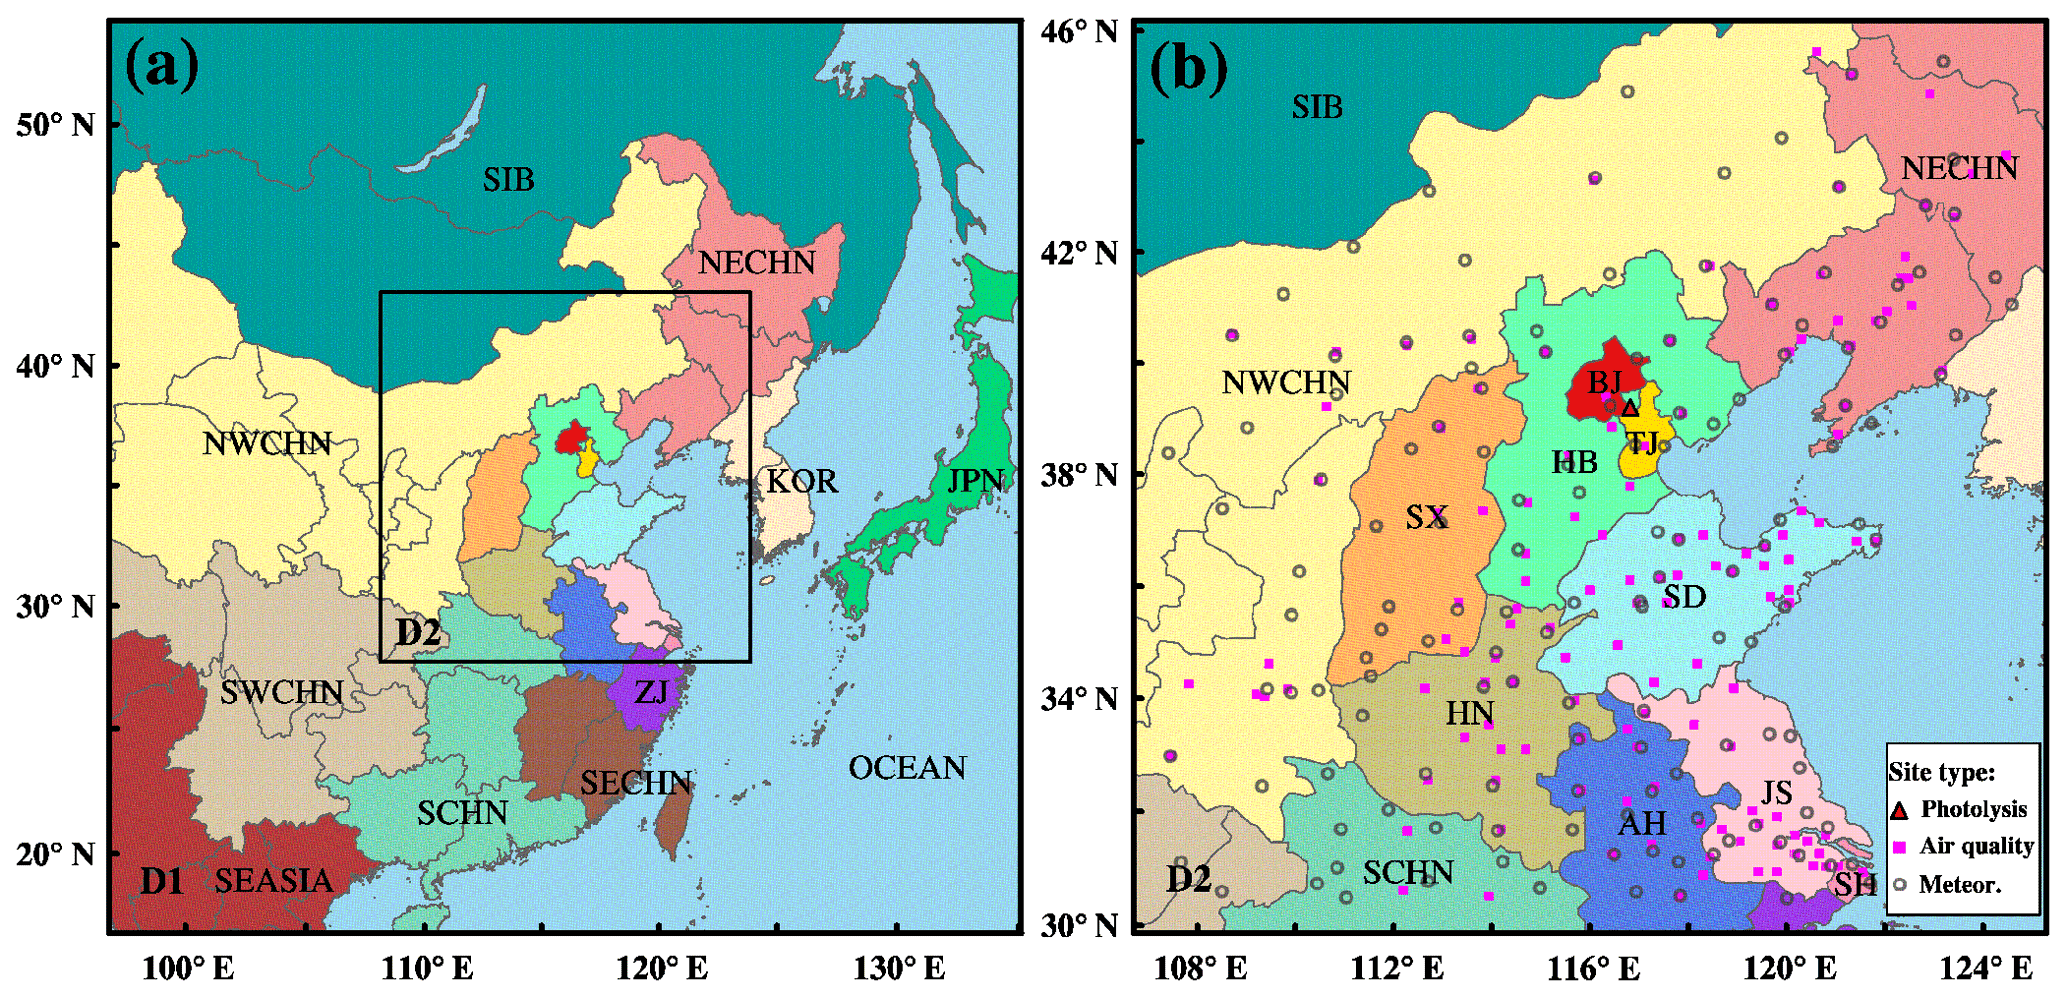
Figure 1Model domain. Hundreds of observations are used for model validation; locations and types of observation stations are shown in (b). The figure also shows the source regions denoted by different colors. Abbreviations are defined in Table S1 of the Supplement.
Table 1Major configuration options of WRF-Chem used for this study.

* RRTMG = Rapid Radiative Transfer Model for GCMs.
Since the light extinction of aerosols can impact ozone in two ways, it is necessary to distinguish the direct impact on ozone in this study. Thus, two parallel experiments were designed in this study: (1) photolysis rate calculation without the presence of aerosol optical properties (Exp1) and (2) photolysis rate calculation including considering the optical properties of all kinds of aerosols (Exp2). By comparing the results between Exp1 and Exp2, the impact of aerosols on ozone via influencing the photolysis rate can be determined. Both experiments started at 00:00 UTC on 29 September 2018 and ended at 00:00 UTC on 31 October 2018. The first 2 d were designated the spin-up period.
2.2 Description of used data
Many kinds of data were used in this study. The initial and boundary meteorological and chemical conditions were provided by the National Centers for Environmental Prediction (NECP) final (FNL) operational global analysis data and outputs of the Community Atmosphere Model with Chemistry (CAM-chem; Lamarque et al., 2012). Regarding the emissions used in this study, anthropogenic emissions were provided by the Multi-resolution Emission Inventory for China (MEIC; http://www.meicmodel.org/, last access: 7 September 2020). This inventory includes five anthropogenic sectors (industry, power plant, transportation, residential combustion and agricultural activity), and each section contains both gas and aerosol species (SO2, NOx, NH3, CO, VOCs, BC, OC, PM10 and PM2.5; M. Li et al., 2017). Biogenic emissions were generated by using the Model of Emissions of Gas and Aerosols from Nature (MEGAN; Guenther et al., 2006).
Meteorological observations (temperature, wind direction and wind speed) from 110 stations and air pollutants (ozone, NO2 and PM2.5) from 110 stations were collected to evaluate the model performance. The locations of the observation stations are presented in Fig. 1b. Hourly meteorological data were measured by the national surface observation network operated by the China Meteorological Administration (CMA). The hourly concentrations of air pollutants were measured and maintained by the China National Environmental Monitoring Center and published online (http://106.37.208.233:20035, last access: 7 September 2020). More information on the measurement of air pollutants can be seen in Y. G. Wang et al. (2014). In addition, relevant photolysis rates (J(NO2) and J()) were measured at a comprehensive observation station (39.75∘ N, 116.95∘ E; denoted with an upward-pointing triangle in Fig. 1b). The observation station, attached to the Institute of Atmospheric Physics (IAP) Chinese Academy of Sciences, is located in Xianghe, Hebei province, approximately 65 km away from Beijing. The photolysis rates were measured by a spectroradiometry technique (Hofzumahaus et al., 1999) with a measurement frequency of 10 s and in units of inverse seconds. More information about the measurement technique is available in Hofzumahaus et al. (1999) and Bohn et al. (2004).
2.3 Source region settings for ozone source apportionment
Due to secondary pollutant properties, tropospheric ozone is highly dependent on the photochemical reactions of its precursors (NOx and VOCs). In this study, an ozone source apportionment method was coupled into the WRF-Chem model. This approach, considering both NOx-limited and VOC-limited conditions, is a mass balance technique that identifies the contributions from all geographic source regions to ozone in each grid or region in the model domain within one simulation. This method is similar to the Ozone Source Apportionment Technology (OSAT; Yarwood et al., 1996) which is coupled with the Comprehensive Air quality Model with extensions (CAMx; ENVIRON, 2011), with some modifications to suit the requirements of the WRF-Chem model. More information on the ozone source apportionment method can be found in Gao et al. (2016, 2017).
In this study, 20 geographic source regions were set up in the model domain. The North China Plain and eastern China are two economic hubs in China and have suffered serious air pollution in recent years (L. T. Wang et al., 2014; Z. F. Wang, 2014; Ding et al., 2016; Kang et al., 2019). As shown in Fig. 1, the two areas are separated into 10 source regions based on administrative divisions. Other provinces belonging to China and areas outside of China in the model domain are far from CEC but may also influence the air quality of CEC under favorable synoptic conditions. Thus, these regions were combined and defined as several source regions. Other details of the source regions are listed in Table S1, which can be seen in the Supplement. In addition to the geographic source regions, chemical boundary conditions provided by MOZART-4 outputs, named O3-Inflow, was defined as an independent contribution, from which the air pollutants can flow into the model domain and impact ozone in CEC. The initial conditions of D1 (INIT1) and D2 (INIT2) were also settled as independent ozone contributions.
3.1 Model validation
Although the WRF-Chem model has been widely used in air quality research, the performance varies dramatically when dealing with different domains, episodes and parameterization settings. In this study, common model performance metrics (IOA, index of agreement; MB, mean bias; RMSE, root mean square error; MNB, mean normalized bias; MFB, mean fractional bias) were used to validate meteorological factors (T2, temperature at 2 m above the surface; WS, wind speed at 10 m above the surface; WD, wind direction at 10 m above the surface) and air pollutants (ozone, NO2 and PM2.5). In addition, the observed time series of J(NO2) from Xianghe station was collected and used to validate the model performance for the photolysis rate.
3.1.1 Model validation of meteorological and air quality simulations
For meteorological factors and air pollutants, observation data from more than 100 stations distributed in D2 (Fig. 1b) were collected. Considering the large dataset size, averaged model performance metrics are listed in Table 2. The benchmarks shown in brackets follow the recommended values suggested by Emery et al. (2001) and EPA (2005, 2007). In addition, the model performance of meteorological factors and air pollutants at each station is displayed by the Taylor diagram (Taylor, 2001; Gleckler et al., 2008) as shown in Figs. S1 and S2, which are available in the Supplement.
Table 2Mean model performance metrics for meteorological factors and air pollutants. The values that do not meet the benchmarks are denoted in bold.
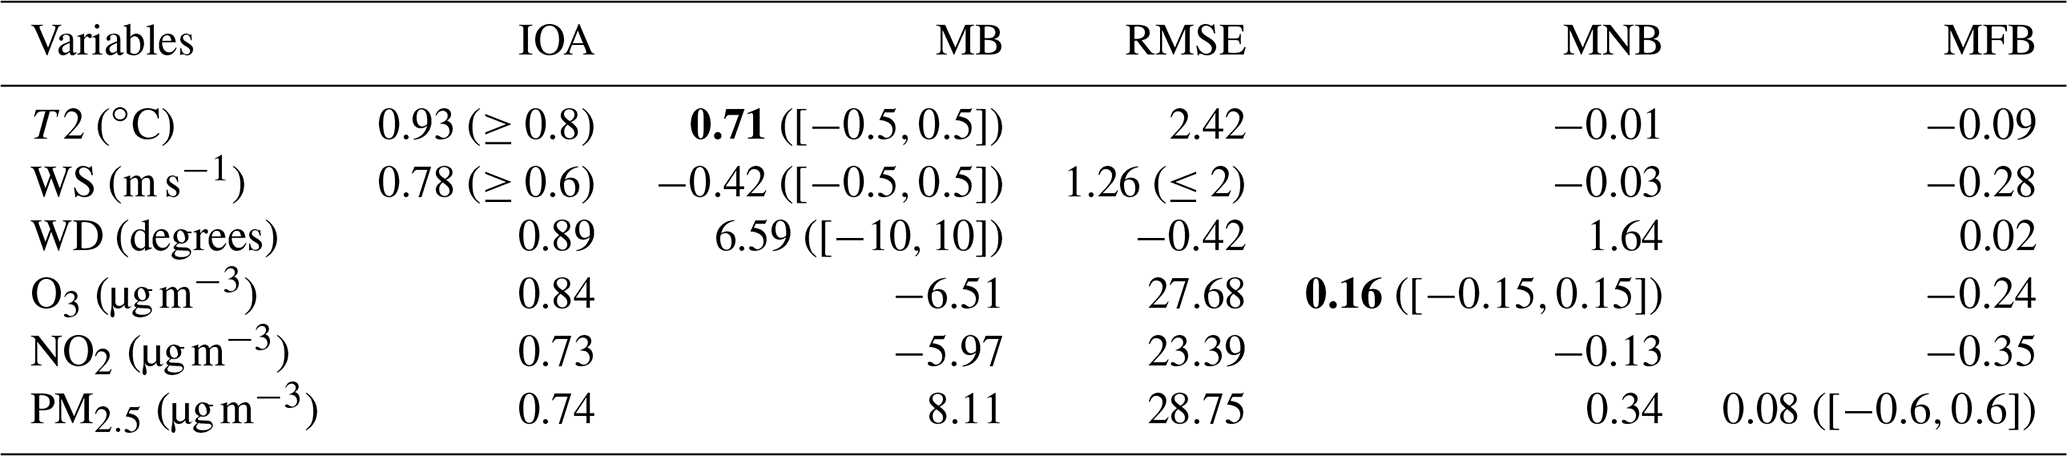
Regarding meteorological factors, T2 showed high values of the mean IOA, which was within the scope of its benchmark, indicating that the simulation agreed very well with the observations. The MB and RMSE of T2 were comparable with those in another modeling study (Hu et al., 2016) over the same region and during the same period. However, the MB was slightly beyond the scope of its benchmark, which suggested a slight overestimation of temperature. Simulations on wind speed showed satisfactory model performance since the values of the IOA, MB and RMSE all met the criteria. Because of the vector nature of wind direction, the IOA of WD followed the calculation recommended by Kwok et al. (2010). The IOA of WD reached 0.89, which suggests a good agreement between the simulation and observation on wind direction. In addition, the MB was also within the benchmark, which also indicated the satisfactory model performance for wind direction.
For air pollutants, good agreement was found between the simulations and observations since the IOAs of ozone, NO2 and PM2.5 were 0.84, 0.73 and 0.74, respectively. The MNB of ozone was 0.16, which was slightly higher than the benchmark, while the MFB of PM2.5 was within the scope of its benchmark. It should be noted that all of the model performance metrics of air pollutants were comparable with other modeling studies (Hu et al., 2016; J. Gao et al., 2018) over CEC, which also indicated that our model performance for air pollutants was acceptable.
3.1.2 Model validation of J(NO2) and J()
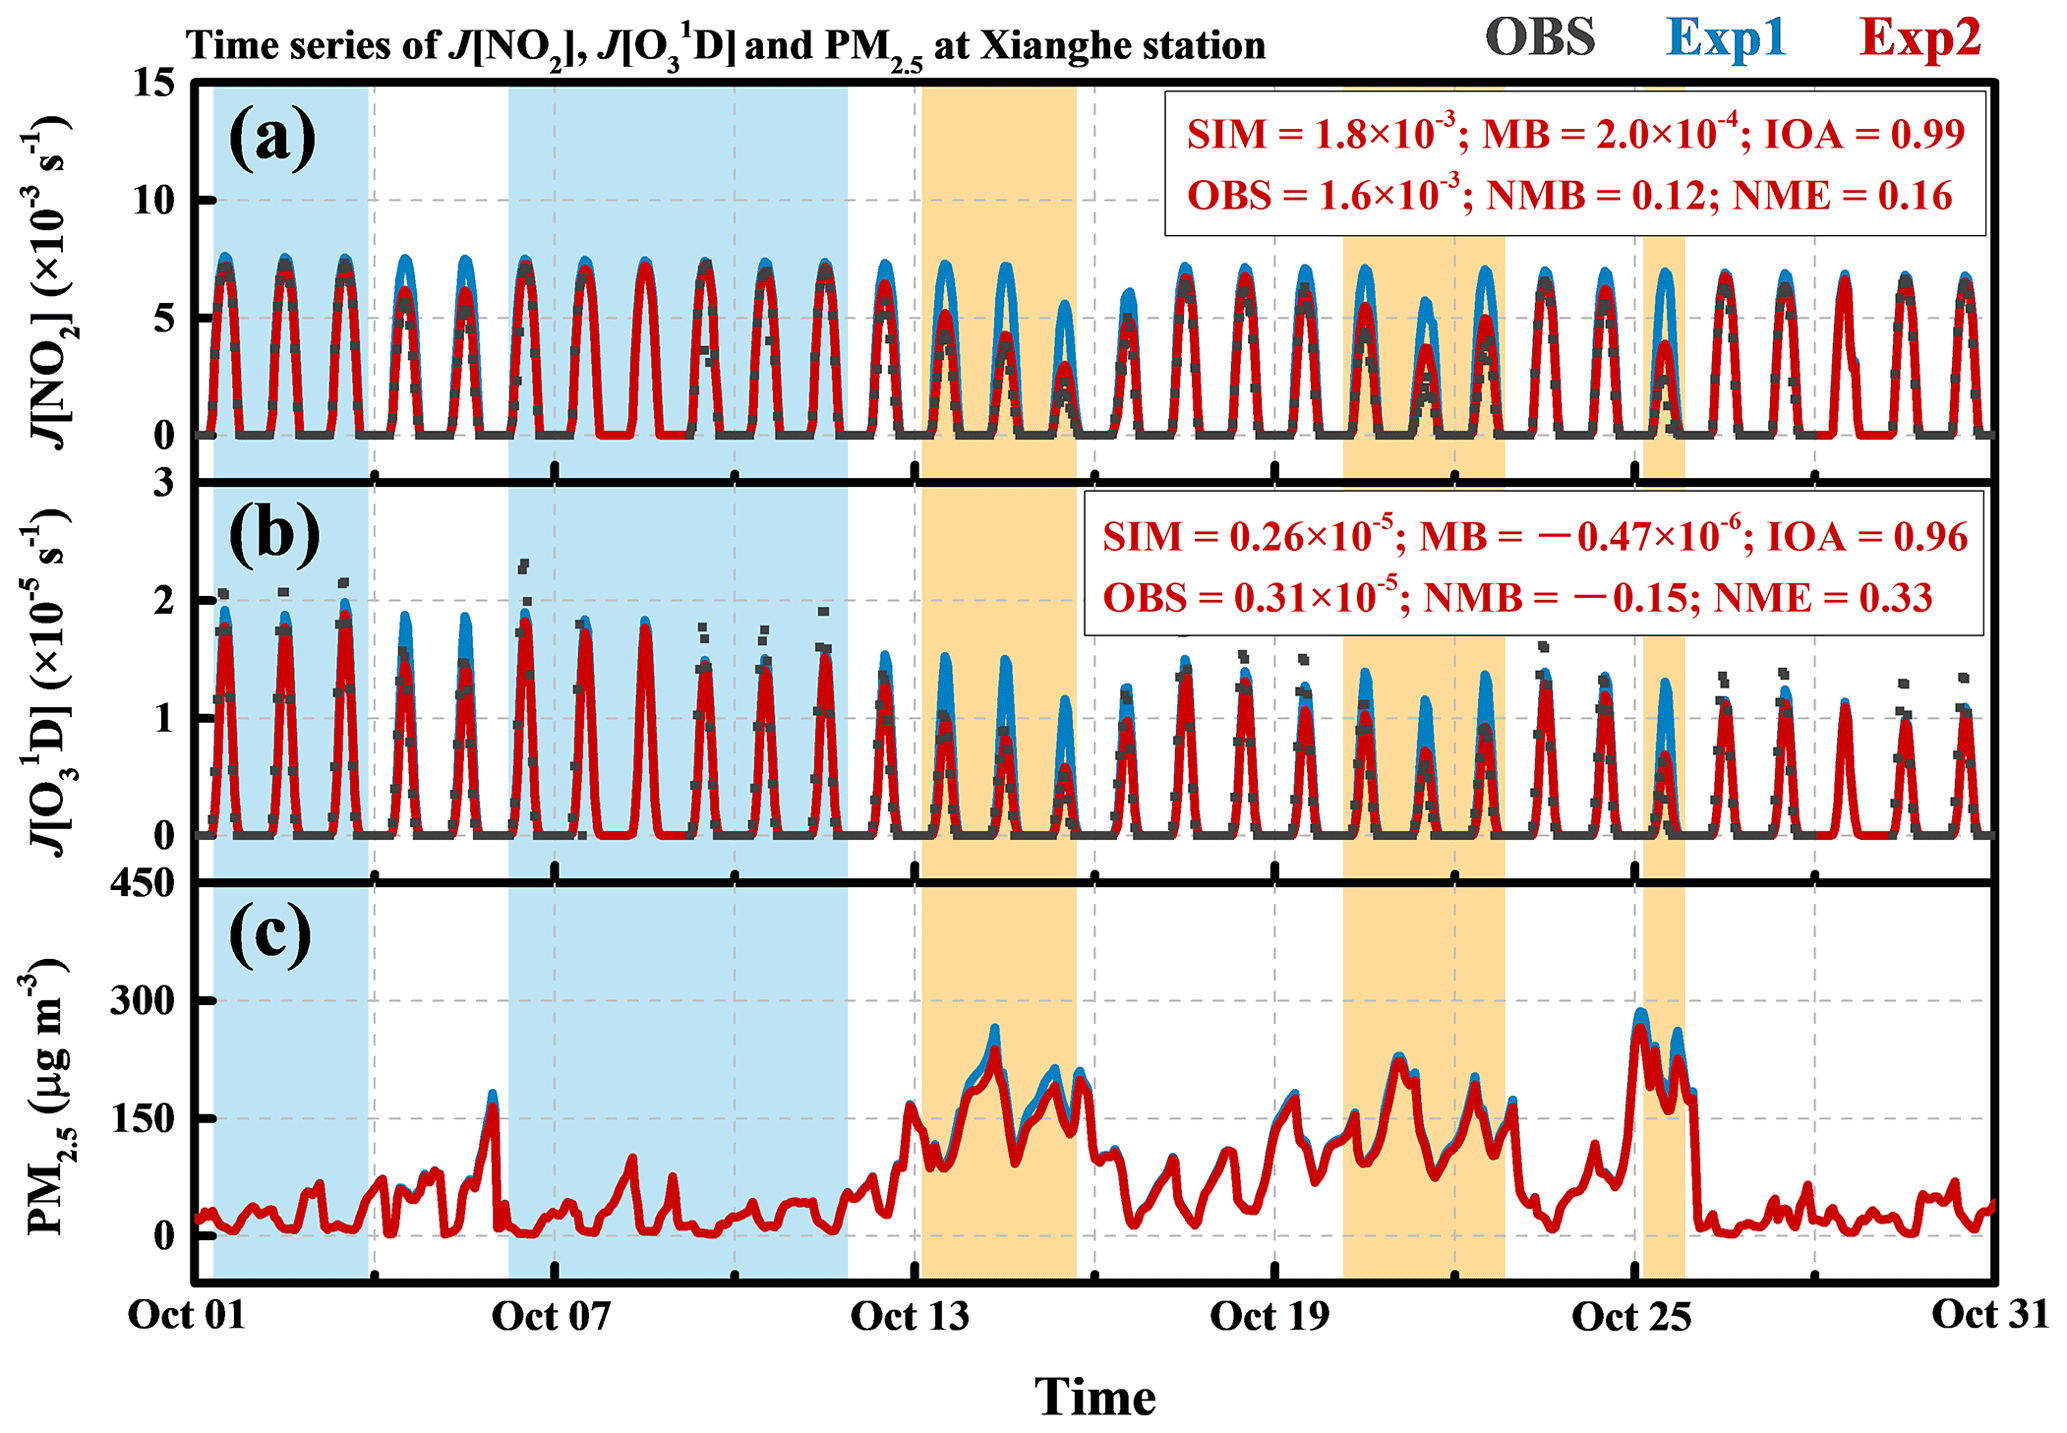
Figure 2a and b show the comparison of observed (dark gray dots) and predicted (red line, denotes results in Exp2) J(NO2) and J() at Xianghe station. J(NO2) showed significant diurnal variations due to the strong dependence of photolysis on solar irradiance. Based on the comparison, the predicted J(NO2) agreed very well with the observed J(NO2) and can capture the variation pattern during the whole of October 2018. Comparing the simulated J(NO2) in Exp1 (blue line in Fig. 2a), the simulated J(NO2) in Exp2 agreed better with the observations than that in Exp1 (especially on the “polluted” days with high concentrations of PM2.5), which showed the reasonability of the calculations of the photolysis rate in Exp2 by considering the optical properties of aerosols. Similarly to J(NO2), it also showed a good agreement between the observed J() and the predicted J(). Since considering the impacts of aerosols on photolysis rates, the simulated J() in Exp2 more reasonably captured the variations in J(). Especially during the polluted days, simulated J() in Exp2 decreased in the daytime which was very close to the observations; however, the simulated J() in Exp1 did not show this feature. The model performance metrics of Exp2 (presented in the top right corner of Fig. 2a and b) also demonstrate the satisfactory model performance for J(NO2) and J(). High values of IOAs (0.99 and 0.96) indicated excellent agreements of the time series patterns between observations and simulations. MBs ( and ) were nearly 1 order of magnitude smaller than the average J(NO2) and J() ( and ); in addition, the normalized mean biases (NMBs) and normalized mean errors (NMEs) also indicated the satisfactory agreements between observations and simulations.
3.2 Impact of aerosols on the photolysis rate
As shown in Fig. 2, when the concentrations of PM2.5 (Fig. 2c) were low, for example, during the 1st–3rd and 6th–11th periods (the shaded blue parts), the surface J(NO2) in the two experiments was almost the same. However, when examining the polluted days (the shaded yellow parts), the surface J(NO2) decreased significantly due to the attenuation of incident solar irradiance induced by the light extinction of aerosols. It should also be noted that the light extinction of aerosols is not the only factor that affects the photolysis rate. Clouds can also affect the incident solar irradiance and significantly decrease the photolysis rate (Wild et al., 2000). That is whyJ[NO2] in Exp1 decreased during the daytime on the 15 October. However, the difference between Exp1 and Exp2 also reflected the impact of aerosols.
The impact of aerosols on the photolysis rate occurs not only at the surface but also along the vertical direction. To investigate the aerosols' impact on the photolysis rate, the J(NO2) profiles under the low-level aerosol condition (clean) and high-level aerosol condition (polluted) at noon (12:00 LT) are compared in Fig. 3. The J(NO2) profiles with surface PM2.5 concentrations lower than 35 µg m−3 were averaged to represent the J(NO2) profile under clean conditions (Fig. 3a). The J(NO2) profiles with surface PM2.5 concentrations greater than 75 µg m−3 were averaged to represent the J(NO2) profile under polluted conditions (Fig. 3b). The referenced critical values of the surface PM2.5 concentration (35 and 75 µg m−3) were determined based on the national air quality standard (http://www.cnemc.cn/jcgf/dqhj/201706/W020181008687879597492.pdf, last access: 7 September 2020). It should be noted that all the selected data were under clear-sky conditions, which excludes the impacts of clouds on J(NO2).
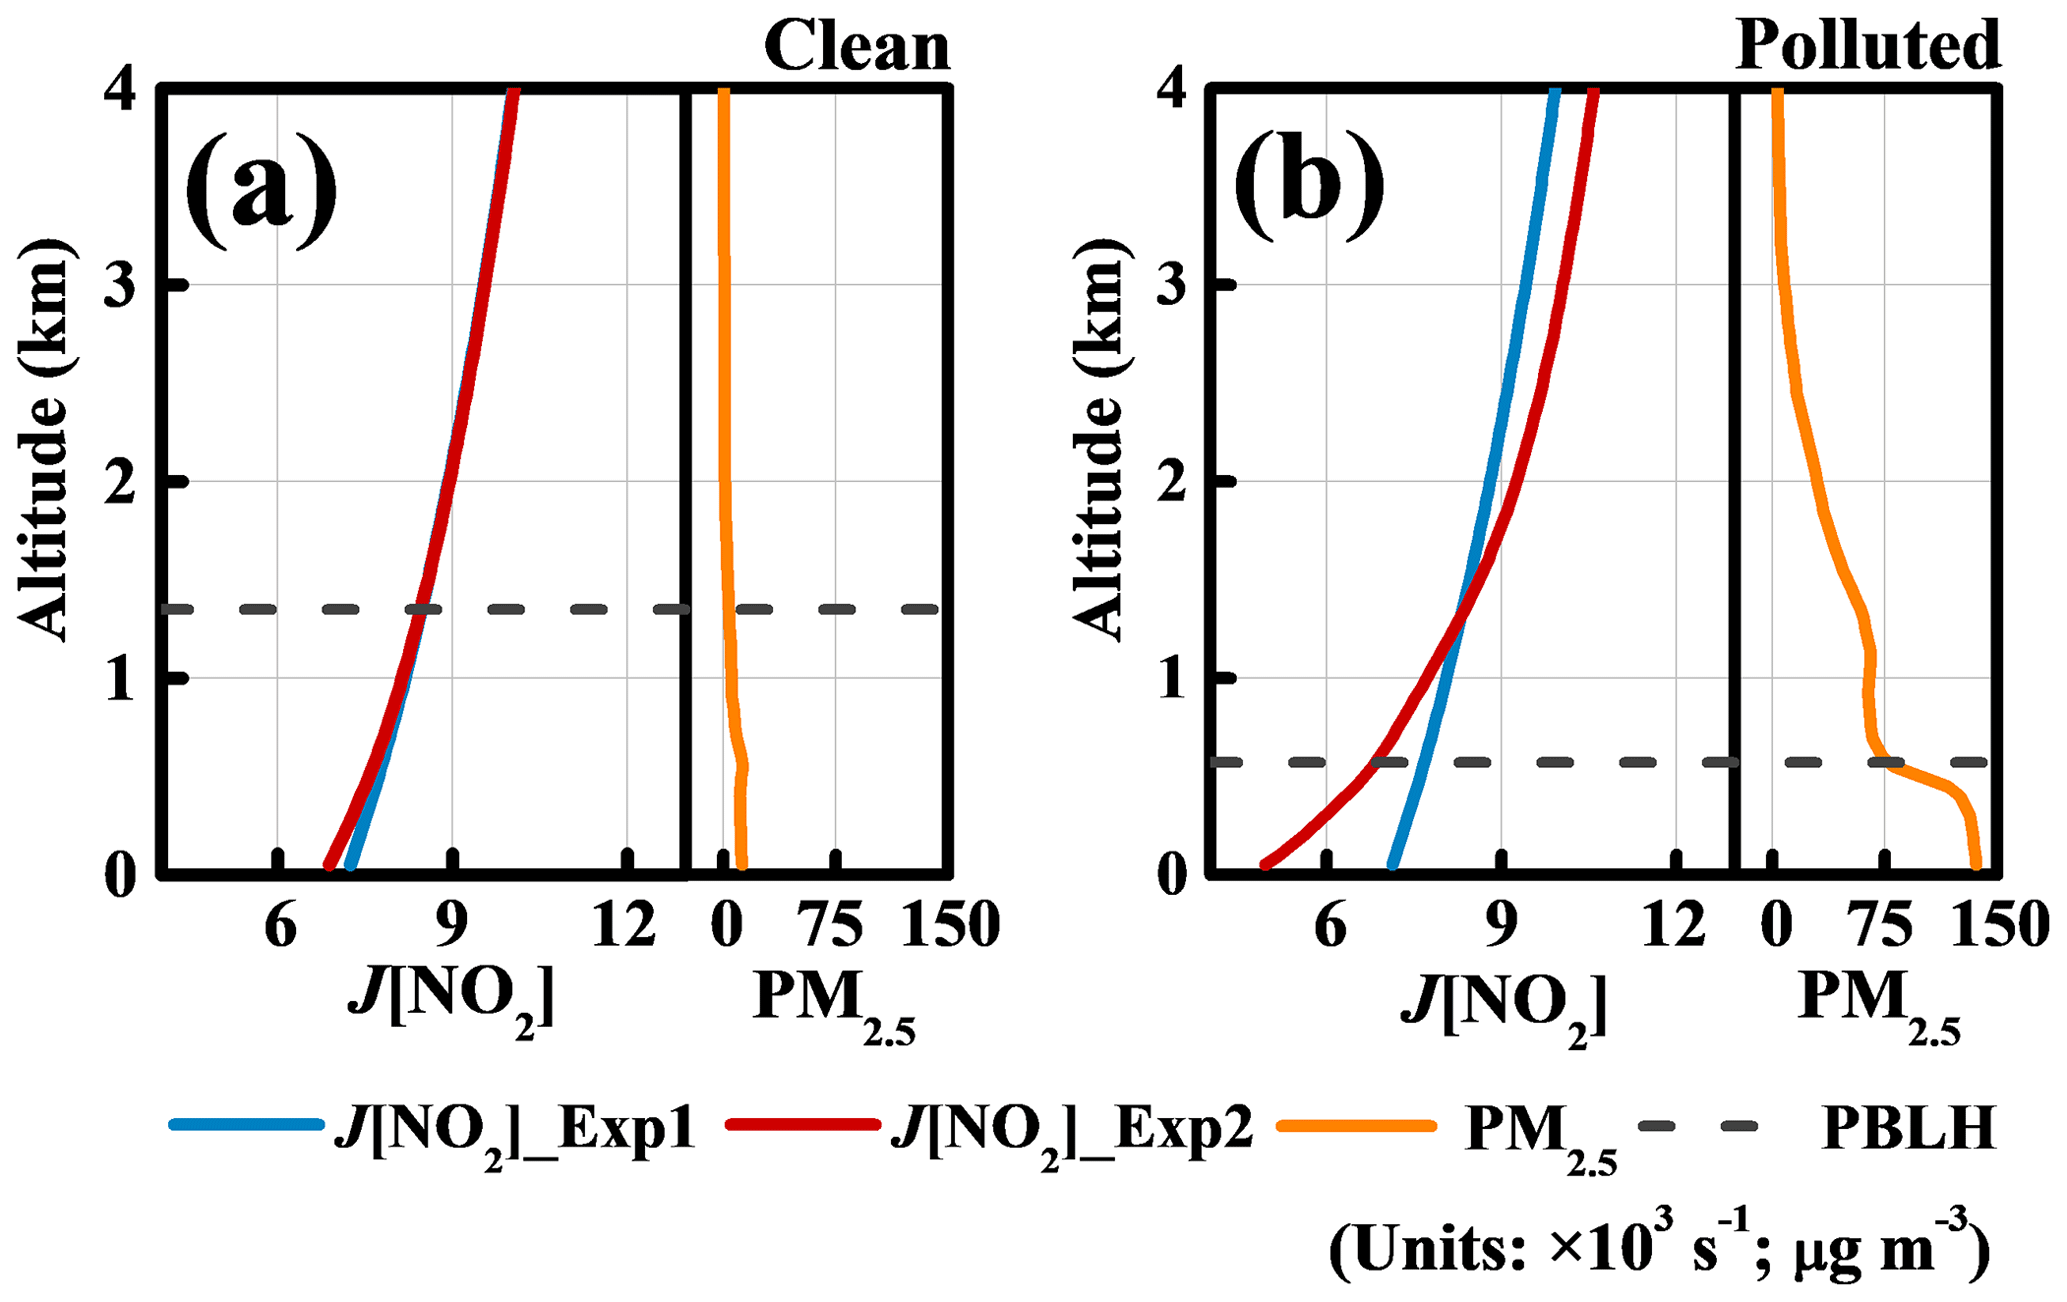
Figure 3Mean profiles of J(NO2) (red and blue lines) and PM2.5 (orange line) at 12:00 LT on clean days (a) and polluted days (b). Profiles of J(NO2) in Exp1 and Exp2 are denoted by red and blue, respectively. Mean PBL heights (PBLH; dashed black line) of the two kinds of days are also presented in (a) and (b), respectively.
Under clean conditions (Fig. 3a), PM2.5 concentrations along the vertical direction were low (with mean concentrations of 8.6 µg m−3 in the PBL and 1.0 µg m−3 above the PBL), which suggested that the impact of aerosols on the photolysis rate was small. Consequently, the two profiles did not show significant differences in the vertical direction. Under polluted conditions (Fig. 3b), the concentrations of PM2.5 were at a relatively high level in the lowest 1.3 km (with mean value of 90.0 µg m−3), especially in the PBL, where the mean concentration of PM2.5 reached 123.1 µg m−3. In this case, J(NO2) decreased with height in the lowest 1.3 km, which was due to the attenuation of incident solar irradiance induced by the light extinction of aerosols (Li et al., 2005; J. Li et al., 2011). However, at altitudes above 1.3 km with lower levels of PM2.5, J(NO2) was enhanced, which could be due to the enhancement of light caused by the light-scattering effect of aerosols (i.e., sulfate aerosols) at the lower height. Our results regarding the changes in the J(NO2) profile caused by aerosols were consistent with the study of Dickerson et al. (1997). In addition, impacts of different types of aerosols (light-absorbing and light-scattering) on the J(NO2) profile are also presented in the Supplement.
3.3 Impact of aerosols on ozone via decreasing the photolysis rate
3.3.1 Changes in surface ozone induced by the decrease in photolysis rate
At the surface, the mean distributions of daytime PM2.5 (from 08:00 to 17:00 local time – LT) under polluted conditions over CEC are presented in Fig. 4a. Correspondingly, the change and relative change in ozone between Exp2 and Exp1 are illustrated in Fig. 4b and c, respectively.
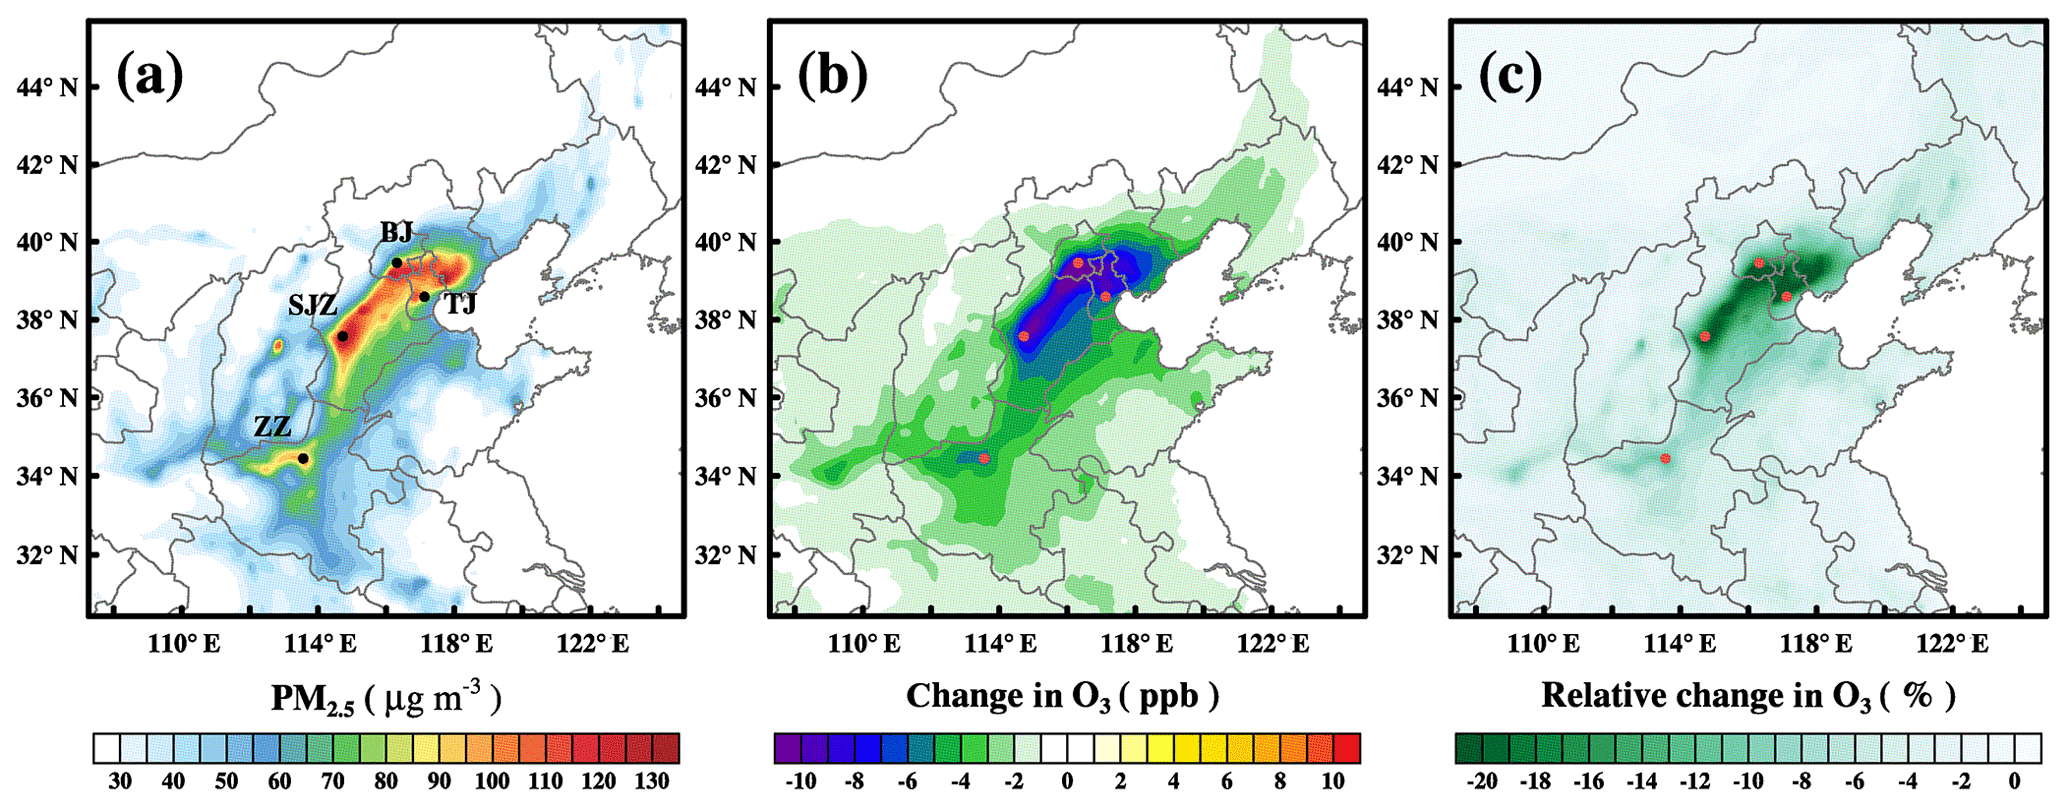
Figure 4Mean distributions of PM2.5 (a), change in O3 (b) and relative change in O3 (c) at the surface over CEC during high PM2.5 episodes. Dots denote the four typical cities in CEC; BJ = Beijing; TJ = Tianjin; SJZ = Shijiahuang; ZZ = Zhengzhou.
High concentrations of PM2.5 covered most of the Beijing–Tianjin–Hebei region and the northern Henan province. In particular, cities with a large population, and large numbers of vehicles and industries, such as Beijing (BJ), Tianjin (TJ), Shijiazhuang (SJZ) and Zhengzhou (ZZ), suffered from more severe particle pollution (mean concentrations were 97.6, 99.8, 113.0 and 79.5 µg m−3 in BJ, TJ, SJZ and ZZ, respectively). The distributions of surface ozone reduction (Fig. 4b and c) were similar to the distributions of PM2.5 at the surface. More specifically, in the representative cities with severe particle pollution (BJ, TJ, SJZ and TJ), the mean reductions in surface ozone reached 10.6, 8.6, 8.2 and 4.2 ppb, respectively, which accounted for 19.0 %, 19.4 %, 17.7 % and 7.9 % of the mean concentrations of surface ozone in these cities, respectively.
Chemical and physical process analysis (Zhu et al., 2015; Gao et al., 2016) was implemented to discuss the mechanism of the surface ozone reduction induced by aerosols via influencing the photolysis rate in the four representative cities. The following processes were considered: chemistry (CHEM, which is the sum of ozone chemical production and loss of ozone in atmosphere; this contribution is the same as the “ozone net production” which has been mentioned in other studies), advection (ADV, which is caused by the transport effects of wind fields) and vertical mixing (VMIX, which is caused by turbulence in the PBL and is closely dependent on turbulence intensity and the vertical gradients of ozone). In addition, for surface ozone, the contribution of dry deposition (DRY, which is an important sink of ozone and is highly related to concentration of surface ozone and dry-deposition velocity) should also be considered. More information on process analysis of the WRF-Chem system is available in Zhang et al. (2014), Gao et al. (2016) and the Supplement.
Figure 5 illustrates the mean surface ozone concentrations and process analysis results of the four cities during 07:00–18:00 (the results of each city are presented in Fig. S5 in the supplementary material). As shown in Fig. 5a, surface ozone began to be reduced by the impact of aerosols starting at 08:00. From then, ozone reduction accumulated until the afternoon, with a maximum value of 11.7 ppb at 14:00. Similar to the process analysis results of other studies (Kaser et al., 2017; Tang et al., 2017; Xing et al., 2017; Xu et al., 2018), the variation in surface ozone was mainly controlled by VMIX, DRY and CHEM during the daytime (Fig. 5b and c). The contribution of CHEM at the surface was generally below zero, which showed that the chemical consumption of ozone was equal to or stronger than the chemical production of ozone at the surface level. As an important removal of surface ozone, the contribution of DRY was always negative during the daytime. On the contrary, the contribution of VMIX was positive which was the key factor leading to the increase in surface ozone during the daytime.
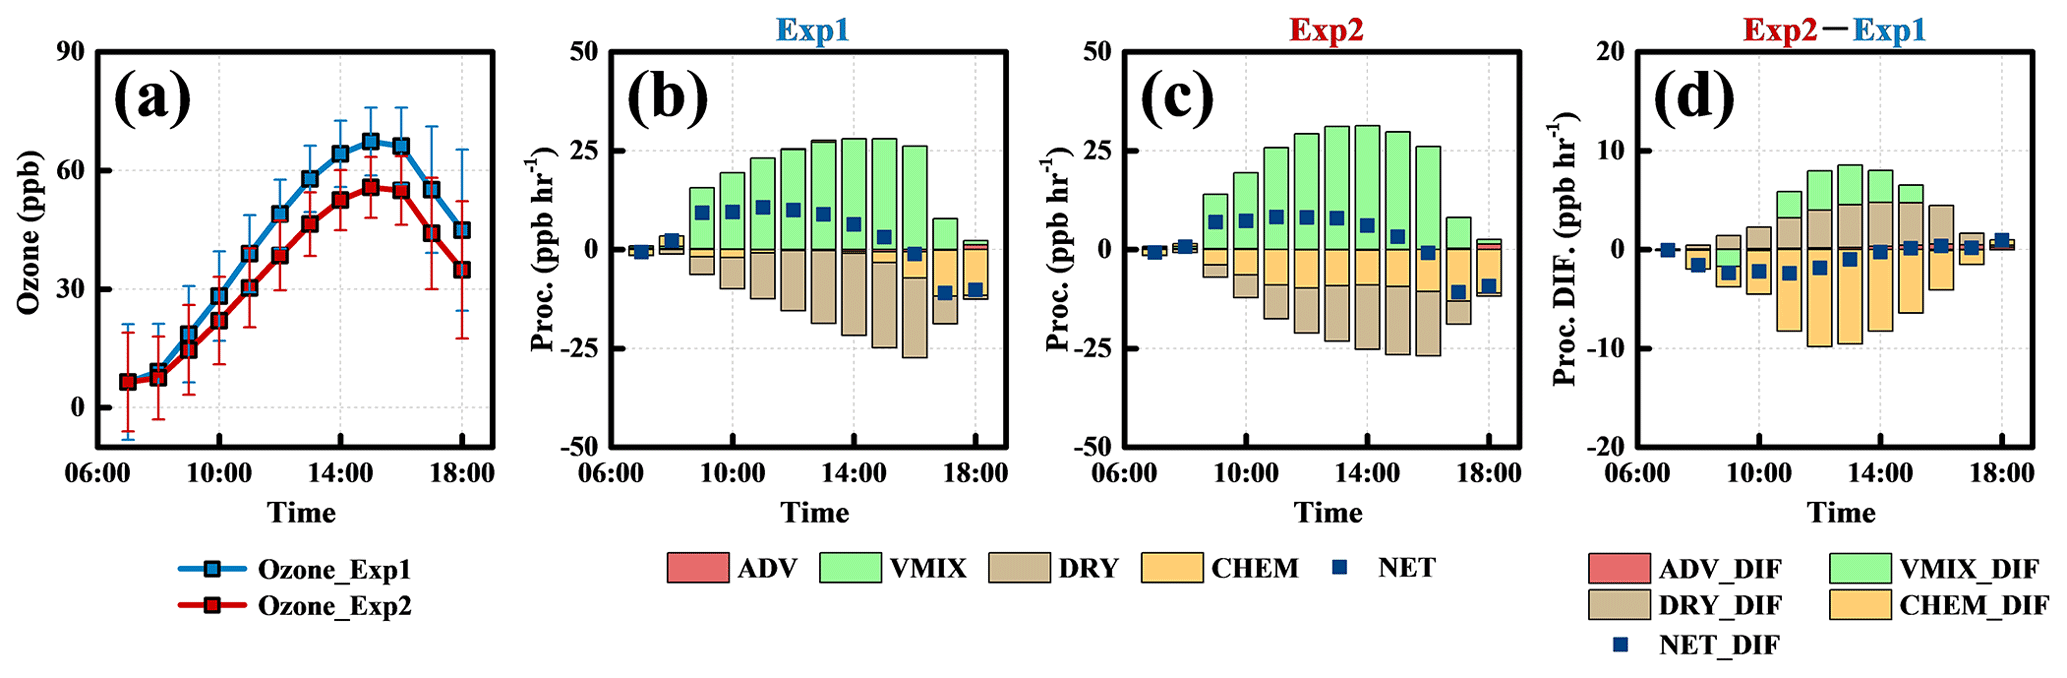
Figure 5Averaged surface ozone concentrations and process analysis results of the four cities in the daytime. Mean ozone concentrations from Exp1 and Exp2 are presented in (a); the corresponding hourly process contributions from Exp1 and Exp2 are presented in (b) and (c); the changes in each process induced by aerosol (Exp2–Exp1) are presented in (d). CHEM = chemistry; VMIX = vertical mixing; DRY = dry deposition; ADV = advection; NET = CHEM + VMIX + DRY + ADV. Changes in each process contribution and NET contribution are denoted by CHEM_DIF, VMIX + DRY_DIF, ADV_DIF and NET_DIF, respectively. Time is local time.
The reduction in surface ozone induced by aerosols can be decomposed into changes in process contributions (Exp2–Exp1), which are shown in Fig. 5d. The contributions of CHEM decreased significantly during the daytime, which was mainly due to the reduction in ozone chemical production caused by weakened ozone photochemistry. Distinct from the change in CHEM, the changes in DRY and VMIX were increased during daytime. From 08:00 to 14:00, the reduction in CHEM was more significant than the increases in VMIX and DRY, which made surface ozone continue to decrease during this period. After 14:00, the increases in VMIX and DRY almost counteracted the reduction in CHEM. Quantitative results (Table 3) showed the ozone reduction and the accumulated changes in each process contribution at 14:00. The reduction in CHEM (−44.3 ppb) was much larger than the reduction in surface ozone (−11.7 ppb). Changes in VMIX (12.0 ppb), DRY (19.6 ppb) and ADV (0.9 ppb) were positive during this period. The increase in ADV was relatively small, whereas the increases in VMIX and DRY were much larger, which partly offset the reduction in CHEM. Finally, because of considering all of these processes, the sum of these changes ( ppb) almost equaled the reduction in ozone, and the difference between and was probably caused by numerical error. In addition, Table 3 also clearly illustrates that the offset effect of VMIX and DRY led to the inequality between the reduction in CHEM and reduction in surface ozone reported in the study of J. Li et al. (2011).
Table 3The reduction in surface ozone at 14:00 LT and the corresponding accumulated changes in process contributions.

Because the contribution of DRY is usually negative to surface ozone, the increase in the change in DRY suggested that the strength of dry deposition was weakened during the daytime. Contribution from dry deposition is highly related to surface ozone concentration and dry-deposition velocity. In Exp1 and Exp2, factors impacting on dry-deposition velocity such as land use and vegetation were not changed which indicated that dry-deposition velocity did not change (Wesely, 1989). However, the concentration of surface ozone decreased due to the impact of aerosols which finally led to the weakening of dry deposition of ozone. By contrast, the increase in change in VMIX suggested the enhancement of the vertical mixing process. Since vertical mixing occurs in the entire PBL, the change in VMIX can impact not only surface ozone but also the ozone aloft, which suggests that the change in ozone may also occur in the entire PBL.

Figure 6Averaged vertical distributions of process contributions as a function of time from 06:00 to 18:00 LT. Data are spatially sampled. All the grids within the administrative regions of the four cities are collected and averaged which can represent the situation of the four cities. (a)–(d) Process contributions from Exp1; (e)–(h) process contributions from Exp2; (i)–(l) the changes in each process contribution due to aerosols (Exp2–Exp1). Dashed red lines denote PBLH.
3.3.2 Changes in ozone in the PBL induced by the decrease in photolysis rate
The averaged vertical changes in process contributions of the four representative cities are presented in Fig. 6 (the results of each individual city are quite similar and are presented in Figs. S6–S9 in the Supplement). CHEM showed positive contributions aloft in both Exp1 and Exp2 (Fig. 6a and e, respectively), which resulted from strong ozone photochemical production. At the surface, it showed negative or weak positive contributions which was attributed to the much stronger chemical loss at the surface caused by ozone-consuming species (i.e., NO). Figure 6i shows that the reduction in CHEM induced by aerosols occurred not only at the surface but also within the lowest 500 m during the daytime. VMIX (Fig. 6b and f) showed a negative contribution in the upper layer and a positive contribution in the lower layer, which indicated a high concentration of ozone aloft being entrained downward to the surface by turbulence during the daytime (Zhang and Rao, 1999; J. Gao et al., 2018). The impact of aerosols enhanced the contributions of VMIX; thus, the change in VMIX showed a positive value within the lowest 300 m and negative values in the upper layer in the PBL. ADV (Fig. 6c and g) showed small contributions, and there was no significant change in ADV caused by the impact of aerosols. NET_DIF reflects the sum of the changes in all of the process contributions, and its distributions showed that, by affecting photolysis rate, the impact of aerosols led to the reduction in ozone occurring not only at the surface but also in the whole PBL (Fig. 6l). In the lower layer of the PBL, the reduction in CHEM was primarily responsible for the reduction in ozone, while the increase in VMIX partly counteracted the reduction in ozone. In the upper layer of the PBL, the decrease in VMIX played an important role in decreasing ozone aloft.
The contribution of VMIX is closely related to ozone vertical gradients and turbulence exchange coefficients. Studying the changes in the two factors is helpful to investigate the enhancement of VMIX induced by aerosols. As shown in Fig. 7a and b, via influencing the photolysis rate, the impact of aerosols did not cause obvious changes in the exchange coefficients since the exchange coefficient profiles were almost the same as those from Exp1 and Exp2. However, the ozone gradient from Exp2 was larger than that from Exp1, which suggested that the enhancement of VMIX induced by aerosols was mainly associated with the increase in the ozone gradient. Because of the impact of aerosols, the chemical reduction in ozone was more significant in the lower layer than in upper layer in the PBL (Fig. 6i), which led to smaller concentrations of ozone in the lower layer and consequently formed a larger vertical gradient (Fig. 7c). Therefore, high concentrations of ozone aloft would be entrained from the top of the PBL to the surface, which led to the enhancement in VMIX. In addition, similar features also occurred in each representative city which can be seen in Fig. S10 in the Supplement.
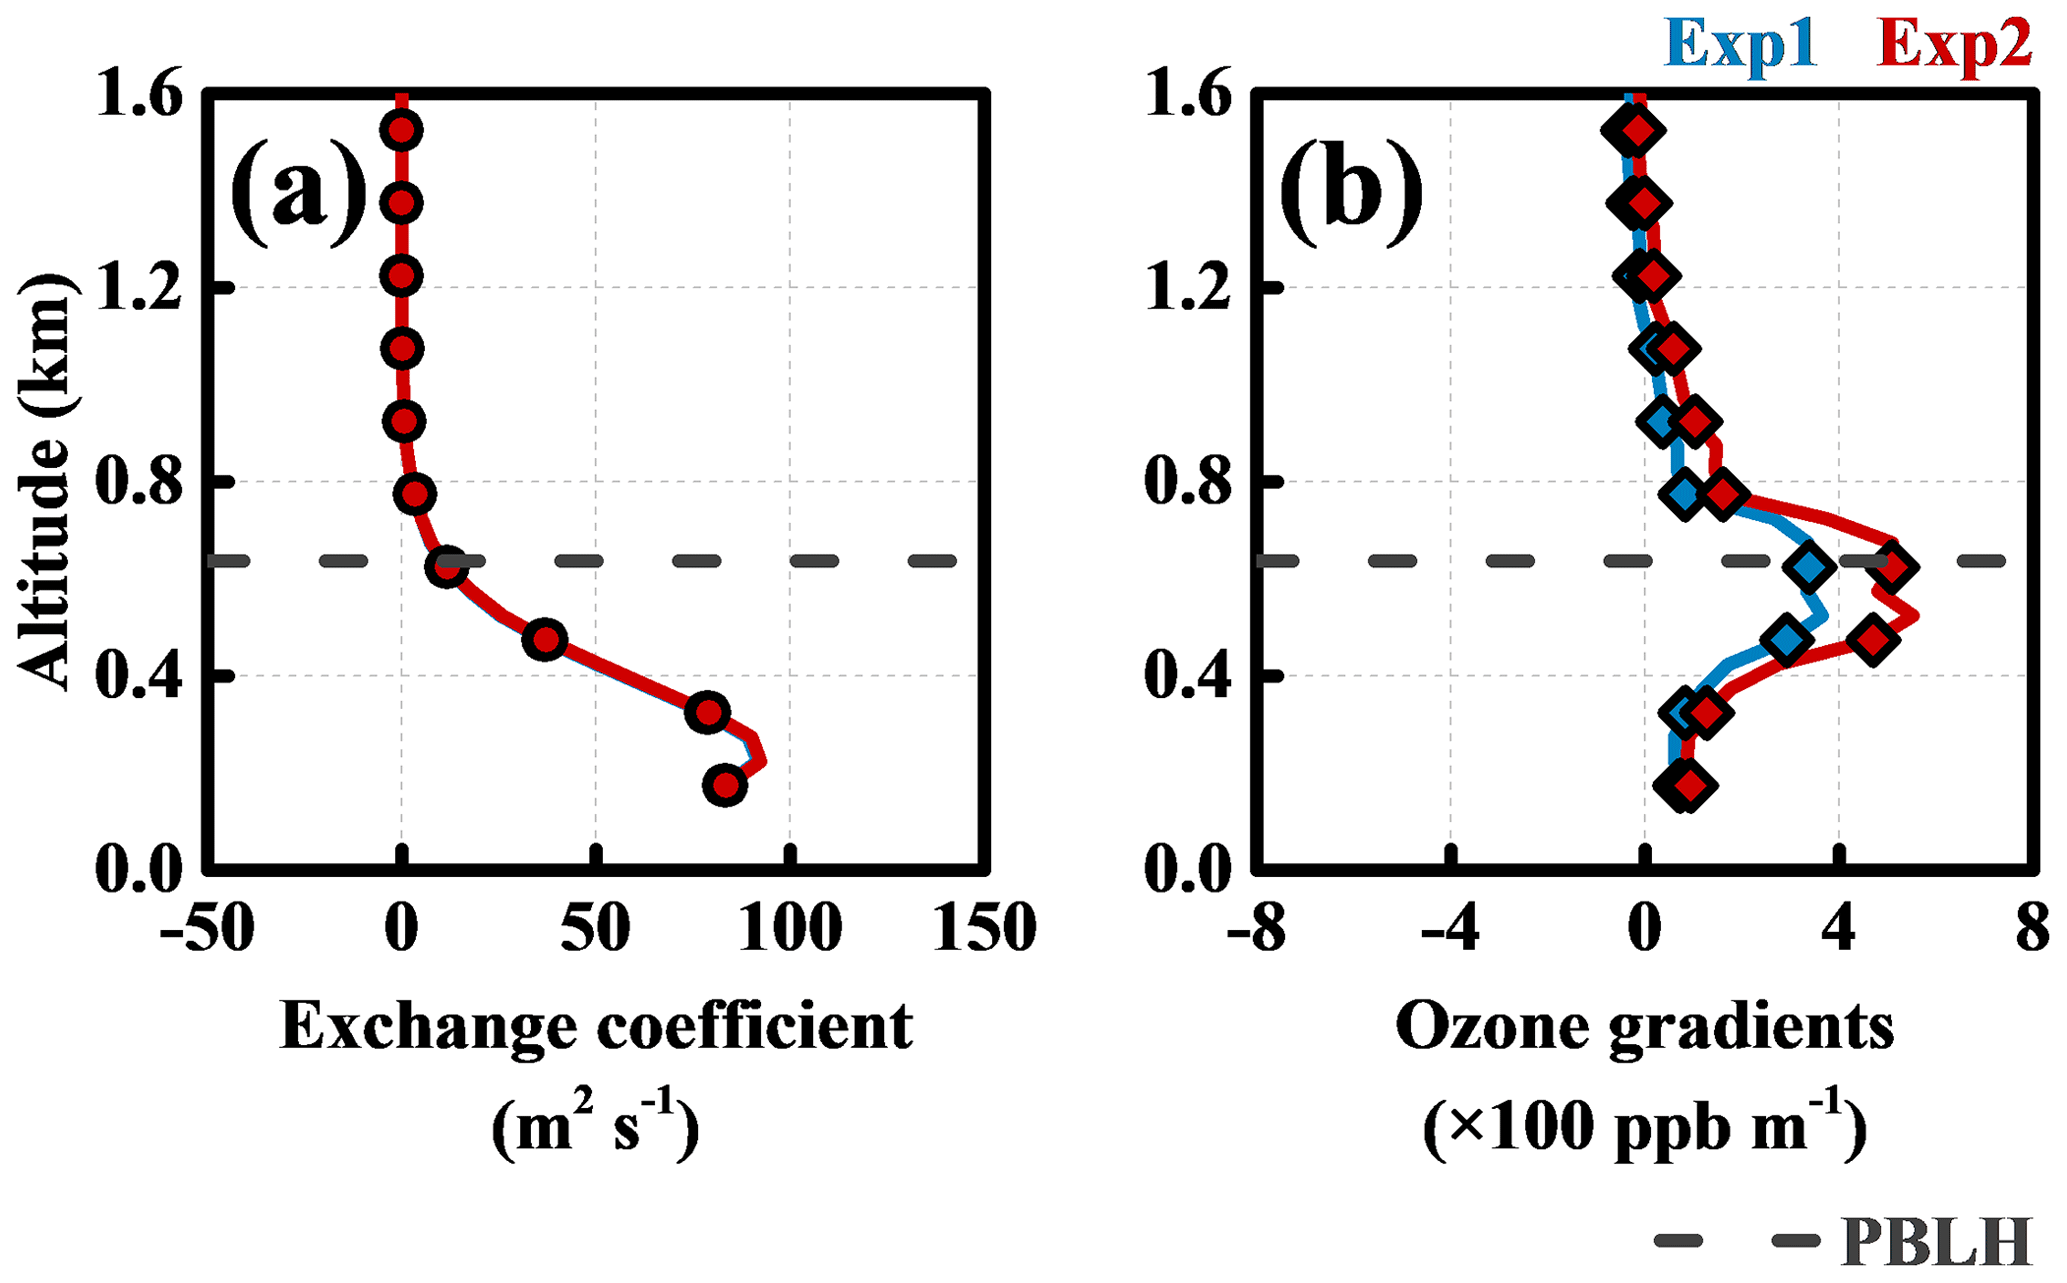
Figure 7Averaged vertical profiles of turbulence exchange coefficients (a) and vertical gradients of ozone (b) of the four cities at 12:00 LT. Dashed dark gray line denotes PBLH at this time.
3.4 The changes in ozone source contributions induced by aerosols via influencing the photolysis rate
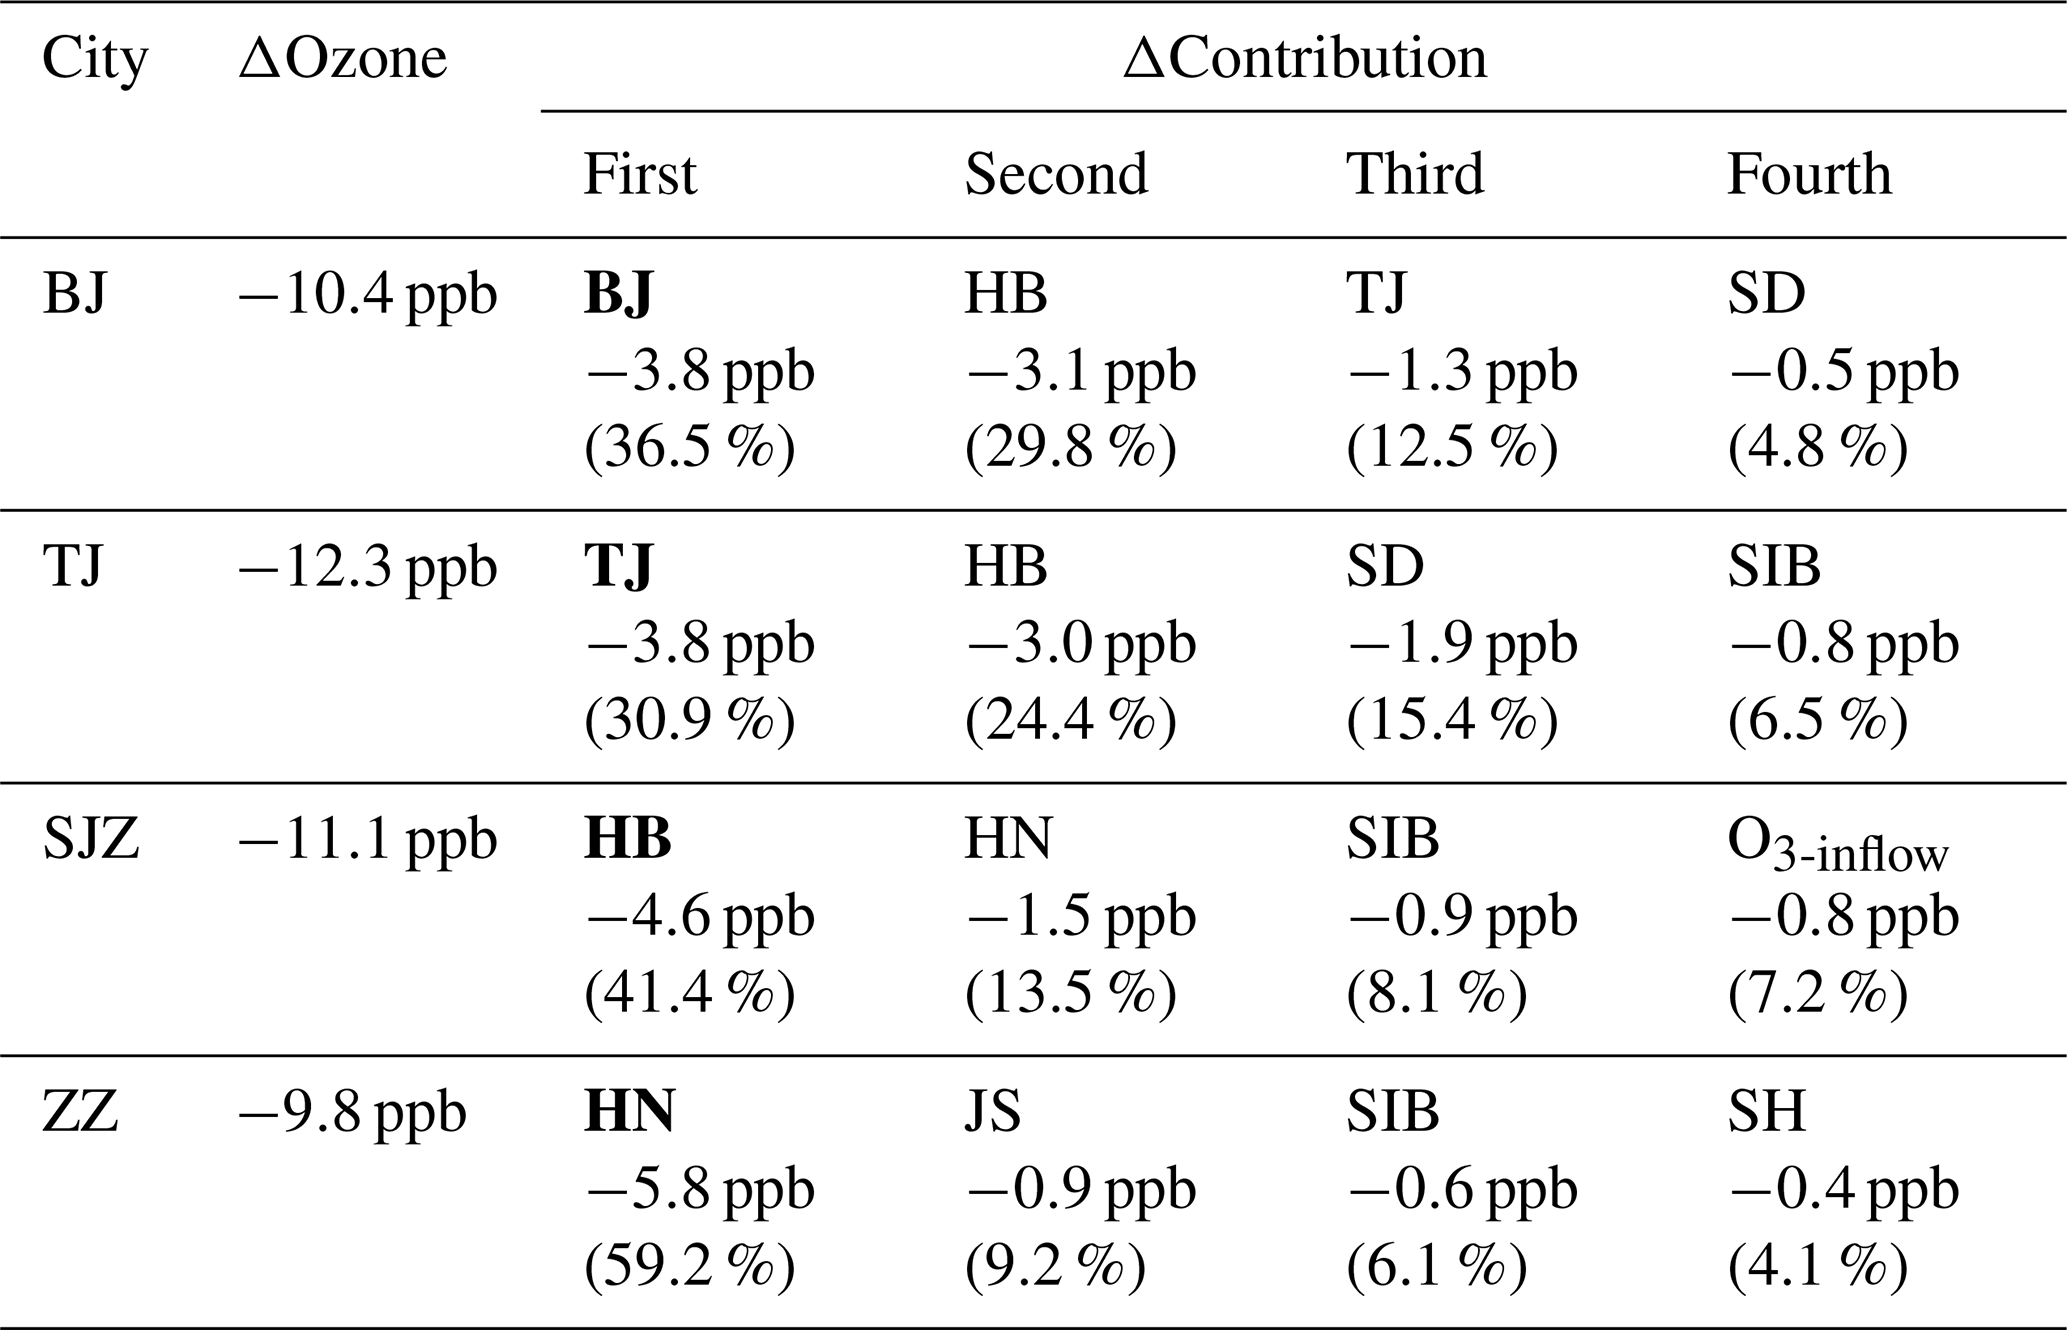
Figure 8 illustrates the average ozone contributions from geographic source regions to surface ozone in the four cities from Exp1 and Exp2, and the changes in each ozone contribution induced by aerosols are also presented. For the representative cities, surface ozone was mainly contributed by local contributions and the contributions from adjacent source regions (Fig. 8a, b, d, e, g, h, i and k). For example, surface ozone over BJ and TJ was mainly contributed by ozone from these cities themselves and Hebei province. For SJZ and ZZ, ozone from their respective provinces (HB and HN) contributed significantly more than ozone from other regions did. In addition, O3-Inflow, which can be approximately treated as background ozone (Gao et al., 2017), also showed an obvious contribution to surface ozone over each city.

Figure 8Averaged ozone contributions and changes induced by aerosols from geographical source regions to BJ (a–c), TJ (d–f), SJZ (g–i) and ZZ (j–l) from 07:00 to 18:00 LT.
With the impacts of aerosols, ozone from local and adjacent source regions decreased more significantly than ozone from further source regions did (right column in Fig. 8). For each city, the first four source regions whose ozone contribution changed the mean ozone concentration the most from 13:00 to 16:00 are listed in Table 4. For BJ and TJ, which are defined as independent source regions, ozone from local regions to BJ and TJ decreased by −3.8 and −3.8 ppb, respectively, which accounted for the greatest proportion. In addition, HB is adjacent to BJ and TJ, and ozone from HB to BJ and TJ decreased by 3.1 and 3.0 ppb, respectively, which was more than ozone from more distant source regions did. SJZ and ZZ are the provincial capitals of HB and HN; ozone from HB and HN to SJZ and ZZ decreased by 4.6 and 5.8 ppb, respectively. The reduction in ozone at the surface was mainly caused by the reduction in chemical production. For the ozone source apportionment method in this study, ozone chemical production can be traced to the source based on the ratio of ozone precursors from each source region. Due to the short lifetime of ozone precursors (i.e., NOx), there will be more ozone precursors from local and adjacent source regions than those from further source regions. Thus, surface ozone from local and adjacent source regions decreased more with the impact of aerosols. At present, surface ozone has increased annually since the reduction in aerosols. Our ozone source apportionment results suggest that controlling ozone precursors from local and adjacent regions will be a more effective way to suppress the increase in surface ozone over CEC.
Table 4The first four source regions from which ozone contribution changes the mean ozone concentration the most from 13:00 to 16:00 LT in each city. Local region and source region where the city is located are denoted as bold.
Currently, in China, the concentrations of surface ozone increase annually, which is considered closely related to the decrease in PM2.5. Previous studies have summarized that, by decreasing the photolysis rate at the surface, the light extinction of aerosols could weaken ozone photochemistry and then directly reduce surface ozone. However, quantitative studies have shown that the reduction in ozone net chemical production is much greater than the reduction in surface ozone, which suggests that some other physical processes related to the variation in surface ozone have not been discussed in previous studies.
To more clearly understand the impact of aerosols on ozone via affecting the photolysis rate, the WRF-Chem model was applied to simulate air pollutants over CEC in October 2018. Comprehensive model validations demonstrated the model performance in simulating air quality over CEC during this period. By comparing the results between the control and sensitive simulation, the mechanism of the impacts of aerosols on ozone was quantitatively studied. With the application of the ozone source apportionment method that we coupled into the WRF-Chem model, the impact of aerosol on the source–receptor relationship of ozone was also discussed.
Our results showed that, because of the light extinction of aerosols, the attenuation of incident solar irradiance caused the decrease in the photolysis rate below the PBL and then weakened ozone photochemistry. In this case, the net chemical production of ozone was significantly decreased within the lowest several hundred meters in the PBL. The decrease in surface ozone led to the weakening of dry deposition of ozone which slowed down the decrease in surface ozone to a certain extent. More importantly, the significant reduction in the net chemical production formed a larger ozone vertical gradient. And more air mass aloft with a high concentration of ozone was entrained downward from the top of the PBL to the surface, which also partly counteracted the reduction in ozone net chemical production. Changes in the three processes together led to the reduction in surface ozone. In addition, ozone in the upper layer of the PBL was also reduced, which was also induced by much ozone aloft being entrained downward. Therefore, by affecting the photolysis rate, the impact of aerosols reduced ozone not only at the surface but also in the entire PBL during the daytime over CEC in this study.
The ozone source apportionment results showed that, for the four representative cities in CEC (BJ, TJ, SJZ and ZZ), ozone from local and adjacent regions decreased by 6.9, 6.8, 4.6 and 5.8 ppb, respectively, which accounted for 41.4 %–66.3 % of the reduction in surface ozone in these cities. This suggested that the impact of aerosols on ozone from local and adjacent regions is more significant than that from more distant regions. In recent years, with the implementation of the toughest-ever clean air policy in China, aerosols have decreased, whereas ozone increases year by year. Our results suggest that while controlling the concentrations of aerosols, controlling ozone precursors from local and adjacent regions is an effective way to suppress the increase in surface ozone.
All the observations and model outputs mentioned in this study are publicly available. Observations on Ozone, NO2 and PM2.5 concentrations can be downloaded directly via web site (http://beijingair.sinaapp.com/#messy, last access: 7 September 2020). Other observations and the simulated results can be access by contacting Ying Li via liy66@sustech.edu.cn.
The supplement related to this article is available online at: https://doi.org/10.5194/acp-20-10831-2020-supplement.
JG, YL and BZ designed the research. BH and LW provided the observed data of J(NO2) and J(). JG and FB designed the experiments and modified the model source code. JG ran the model and analyzed data. JG wrote the paper. All authors polished the paper.
The authors declare that they have no conflict of interest.
We want to acknowledge the support from the SUSTC Presidential Postdoctoral Fellowship. The simulated results in this study were calculated using computational resources provided by the Southern University of Science and Technology. All the observations and model outputs mentioned in this study are available by contacting Ying Li via liy66@sustech.edu.cn. Finally, we hope people all over the world can be healthy and defeat COVID-19. Jinhui Gao hopes Hua Wang can overcome the difficulties that have occurred during this tough period and find her inner peace.
This research has been supported by the National Key Research and Development Program of China (grant no. 2016YFA0602003), Shenzhen Peacock Teams Plan (grant no. KQTD20180411143441009), National Natural Science Foundation of China (grant nos. 41905114, 41961160728 and 41575106), Science and Technology Planning Project of Guangdong Province of China (grant no. 2017A050506003), and China Postdoctoral Science Foundation (grant nos. 2019M662169 and 2019M662199).
This paper was edited by Kostas Tsigaridis and reviewed by two anonymous referees.
Anger, A., Dessens, O., Xi, F. M., Barker, T., and Wu, R.: China's air pollution reduction efforts may result in an increase in surface ozone levels in highly polluted areas, Ambio, 45, 254–265, https://doi.org/10.1007/s13280-015-0700-6, 2016.
Bian, H., Han, S. Q., Tie, X. X., Sun, M. L., and Liu, A. X.: Evidence of impact of aerosols on surface ozone concentration in Tianjin, China, Atmos. Environ., 41, 4672–4681, https://doi.org/10.1016/j.atmosenv.2007.03.041, 2007.
Bohn, B., Kraus, A., Muller, M., and Hofzumahaus, A.: Measurement of atmospheric O3→O(1D) photolysis frequencies using filterradiometry, J. Geophys. Res.-Atmos., 109, D10S90, https://doi.org/10.1029/2003JD004319, 2004.
Cai, Y. F., Wang, T. J., and Xie, M.: Impacts of atmospheric particles on surface ozone in Nanjing, Climatic Environment Research, 18, 251–260, 2013 (in Chinese).
Castro, T., Madronich, S., Rivale, S., Muhlia, A., and Mar, B.: The influence of aerosols on photochemical smog in Mexico City, Atmos. Environ., 35, 1765–1772, https://doi.org/10.1016/S1352-2310(00)00449-0, 2001.
Chen, F. and Dudhia, J.: Coupling an advanced land surface-hydrology model with the Penn State-NCAR MM5 modeling system. Part I: Model implementation and sensitivity, Mon. Weather Rev., 129, 569–585, 2001.
Crutzen, P.: A discussion of the chemistry of some minor constituents in the stratosphere and troposphere, Pure Appl. Geophys., 106, 1385–1399, https://doi.org/10.1007/bf00881092, 1973.
Deng, X. J., Zhou, X. J., Tie, X. X., Wu, D., Li, F., Tan, H. B., and Deng, T.: Attenuation of ultraviolet radiation reaching the surface due to atmospheric aerosols in Guangzhou, Chinese Sci. Bull., 57, 2759–2766, https://doi.org/10.1007/s11434-012-5172-5, 2012.
Dickerson, R. R., Kondragunta, S., Stenchikov, G., Civerolo, K. L., Doddridge, B. G., and Holben, B. N.: The impact of aerosols on solar ultraviolet radiation and photochemical smog, Science, 278, 827–830, https://doi.org/10.1126/science.278.5339.827, 1997.
Ding, A. J., Huang, X., Nie, W., Sun, J. N., Kerminen, V. M., Petaja, T., Su, H., Cheng, Y. F., Yang, X. Q., Wang, M. H., Chi, X. G., Wang, J. P., Virkkula, A., Guo, W. D., Yuan, J., Wang, S. Y., Zhang, R. J., Wu, Y. F., Song, Y., Zhu, T., Zilitinkevich, S., Kulmala, M., and Fu, C. B.: Enhanced haze pollution by black carbon in megacities in China, Geophys. Res. Lett., 43, 2873–2879, https://doi.org/10.1002/2016GL067745, 2016.
Emery, C., Tai, E., and Yarwood, G.: Enhanced meteorological modeling and performance evaluation for two Texas ozone episodes, in: Prepared for the Texas Natural Resource Conservation Commission, ENVIRON International Corporation, Novato, CA, USA, 2001
ENVIRON: CAMx 5.4 Manual, available at: http://www.camx.com/ (), 2011.
EPA, U.S.: Guidance on the Use of Models and Other Analyses in Attainment Demonstrations for the 8-hour Ozone NAAQS, EPA-454/R-05-002, 2005.
EPA, U.S.: Guidance on the Use of Models and Other Analyses for Demonstrating Attainment of Air Quality Goals for Ozone, PM2.5, and Regional Haze, EPA-454/B-07-002, 2007.
Gao, J., Zhu, B., Xiao, H., Kang, H., Pan, C., Wang, D., and Wang, H.: Effects of black carbon and boundary layer interaction on surface ozone in Nanjing, China, Atmos. Chem. Phys., 18, 7081–7094, https://doi.org/10.5194/acp-18-7081-2018, 2018.
Gao, J. H., Zhu, B., Xiao, H., Kang, H. Q., Hou, X. W., and Shao, P.: A case study of surface ozone source apportionment during a high concentration episode, under frequent shifting wind conditions over the Yangtze River Delta, China, Sci. Total Environ., 544, 853–863, https://doi.org/10.1016/j.scitotenv.2015.12.039, 2016.
Gao, J. H., Zhu, B., Xiao, H., Kang, H. Q., Hou, X. W., Yin, Y., Zhang, L., and Miao, Q.: Diurnal variations and source apportionment of ozone at the summit of Mount Huang, a rural site in Eastern China, Environ. Pollut., 222, 513–522, https://doi.org/10.1016/j.envpol.2016.11.031, 2017.
Gao, M., Han, Z., Liu, Z., Li, M., Xin, J., Tao, Z., Li, J., Kang, J.-E., Huang, K., Dong, X., Zhuang, B., Li, S., Ge, B., Wu, Q., Cheng, Y., Wang, Y., Lee, H.-J., Kim, C.-H., Fu, J. S., Wang, T., Chin, M., Woo, J.-H., Zhang, Q., Wang, Z., and Carmichael, G. R.: Air quality and climate change, Topic 3 of the Model Inter-Comparison Study for Asia Phase III (MICS-Asia III) – Part 1: Overview and model evaluation, Atmos. Chem. Phys., 18, 4859–4884, https://doi.org/10.5194/acp-18-4859-2018, 2018.
Gery, M. W., Whitten, G. Z., Killus, J. P., and Dodge, M. C.: A photochemical kinetics mechanism for urban and regional scale computer modeling, J. Geophys. Res.-Atmos., 94, 12925–12956, https://doi.org/10.1029/Jd094id10p12925, 1989.
Gleckler, P. J., Taylor, K. E., and Doutriaux, C.: Performance metrics for climate models, J. Geophys. Res.-Atmos., 113, D06104, https://doi.org/10.1029/2007jd008972, 2008.
Grell, G. A., Peckham, S. E., Schmitz, R., McKeen, S. A., Frost, G., Skamarock, W. C., and Eder, B.: Fully coupled “online” chemistry within the WRF model, Atmos. Environ., 39, 6957–6975, https://doi.org/10.1016/j.atmosenv.2005.04.027, 2005.
Guenther, A., Karl, T., Harley, P., Wiedinmyer, C., Palmer, P. I., and Geron, C.: Estimates of global terrestrial isoprene emissions using MEGAN (Model of Emissions of Gases and Aerosols from Nature), Atmos. Chem. Phys., 6, 3181–3210, https://doi.org/10.5194/acp-6-3181-2006, 2006.
Haagen-Smit, A. J. and Fox, M. M.: Photochemical ozone formation with hydrocarbons and automobile exhaust, Air Repair, 4, 105–136, https://doi.org/10.1080/00966665.1954.10467649, 1954.
Hansen, J., Sato, M., and Ruedy, R.: Radiative forcing and climate response, J. Geophys. Res.-Atmos., 102, 6831–6864, https://doi.org/10.1029/96jd03436, 1997.
Hofzumahaus, A., Kraus, A., and Muller, M.: Solar actinic flux spectroradiometry: a technique for measuring photolysis frequencies in the atmosphere, Appl. Optics, 38, 4443–4460, https://doi.org/10.1364/Ao.38.004443, 1999.
Hong, S. Y., Noh, Y., and Dudhia, J.: A new vertical diffusion package with an explicit treatment of entrainment processes, Mon. Weather Rev., 134, 2318–2341, https://doi.org/10.1175/Mwr3199.1, 2006.
Hu, J., Chen, J., Ying, Q., and Zhang, H.: One-year simulation of ozone and particulate matter in China using WRF/CMAQ modeling system, Atmos. Chem. Phys., 16, 10333–10350, https://doi.org/10.5194/acp-16-10333-2016, 2016.
Hu, X. M., Xue, M., Kong, F. Y., and Zhang, H. L.: Meteorological conditions during an ozone episode in Dallas-Fort Worth, Texas, and impact of their modeling uncertainties on air quality prediction, J. Geophys. Res.-Atmos., 124, 1941–1961, https://doi.org/10.1029/2018JD029791, 2019.
Iacono, M. J., Delamere, J. S., Mlawer, E. J., Shephard, M. W., Clough, S. A., and Collins, W. D.: Radiative forcing by long-lived greenhouse gases: Calculations with the AER radiative transfer models, J. Geophys. Res.-Atmos., 113, D13103, https://doi.org/10.1029/2008jd009944, 2008.
Jacobson, M. Z.: Studying the effects of aerosols on vertical photolysis rate coefficient and temperature profiles over an urban airshed, J. Geophys. Res.-Atmos., 103, 10593–10604, https://doi.org/10.1029/98jd00287, 1998.
Kang, H., Zhu, B., Gao, J., He, Y., Wang, H., Su, J., Pan, C., Zhu, T., and Yu, B.: Potential impacts of cold frontal passage on air quality over the Yangtze River Delta, China, Atmos. Chem. Phys., 19, 3673–3685, https://doi.org/10.5194/acp-19-3673-2019, 2019.
Kaser, L., Patton, E. G., Pfister, G. G., Weinheimer, A. J., Montzka, D. D., Flocke, F., Thompson, A. M., Stauffer, R. M., and Halliday, H. S.: The effect of entrainment through atmospheric boundary layer growth on observed and modeled surface ozone in the Colorado Front Range, J. Geophys. Res.-Atmos., 122, 6075–6093, https://doi.org/10.1002/2016JD026245, 2017.
Kwok, R. H. F., Fung, J. C. H., Lau, A. K. H., and Fu, J. S.: Numerical study on seasonal variations of gaseous pollutants and particulate matters in Hong Kong and Pearl River Delta Region, J. Geophys. Res.-Atmos., 115, D16308, https://doi.org/10.1029/2009jd012809, 2010.
Lamarque, J.-F., Emmons, L. K., Hess, P. G., Kinnison, D. E., Tilmes, S., Vitt, F., Heald, C. L., Holland, E. A., Lauritzen, P. H., Neu, J., Orlando, J. J., Rasch, P. J., and Tyndall, G. K.: CAM-chem: description and evaluation of interactive atmospheric chemistry in the Community Earth System Model, Geosci. Model Dev., 5, 369–411, https://doi.org/10.5194/gmd-5-369-2012, 2012.
Li, G., Bei, N., Tie, X., and Molina, L. T.: Aerosol effects on the photochemistry in Mexico City during MCMA-2006/MILAGRO campaign, Atmos. Chem. Phys., 11, 5169–5182, https://doi.org/10.5194/acp-11-5169-2011, 2011.
Li, G. H., Zhang, R. Y., Fan, J. W., and Tie, X. X.: Impacts of black carbon aerosol on photolysis and ozone, J. Geophys. Res.-Atmos., 110, D23206, https://doi.org/10.1029/2005jd005898, 2005.
Li, J., Wang, Z., Wang, X., Yamaji, K., Takigawa, M., Kanaya, Y., Pochanart, P., Liu, Y., Irie, H., Hu, B., Tanimoto, H., and Akimoto, H.: Impacts of aerosols on summertime tropospheric photolysis frequencies and photochemistry over Central Eastern China, Atmos. Environ., 45, 1817–1829, https://doi.org/10.1016/j.atmosenv.2011.01.016, 2011.
Li, K., Jacob, D. J., Liao, H., Shen, L., Zhang, Q., and Bates, K. H.: Anthropogenic drivers of 2013–2017 trends in summer surface ozone in China, P. Natl. Acad. Sci. USA, 116, 422–427, https://doi.org/10.1073/pnas.1812168116, 2019a.
Li, K., Jacob, D. J., Liao, H., Zhu, J., Shah, V., Shen, L., Bates, K. H., Zhang, Q., and Zhai, S. X.: A two-pollutant strategy for improving ozone and particulate air quality in China, Nat. Geosci., 12, 906–910, https://doi.org/10.1038/s41561-019-0464-x, 2019b.
Li, M., Zhang, Q., Kurokawa, J.-I., Woo, J.-H., He, K., Lu, Z., Ohara, T., Song, Y., Streets, D. G., Carmichael, G. R., Cheng, Y., Hong, C., Huo, H., Jiang, X., Kang, S., Liu, F., Su, H., and Zheng, B.: MIX: a mosaic Asian anthropogenic emission inventory under the international collaboration framework of the MICS-Asia and HTAP, Atmos. Chem. Phys., 17, 935–963, https://doi.org/10.5194/acp-17-935-2017, 2017.
Li, Z. Q., Guo, J. P., Ding, A. J., Liao, H., Liu, J. J., Sun, Y. L., Wang, T. J., Xue, H. W., Zhang, H. S., and Zhu, B.: Aerosol and boundary-layer interactions and impact on air quality, Natl. Sci. Rev., 4, 810–833, https://doi.org/10.1093/nsr/nwx117, 2017.
Lin, Y. L., Farley, R. D., and Orville, H. D.: Bulk parameterization of the snow field in a cloud model, J. Clim. Appl. Meteorol., 22, 1065–1092, https://doi.org/10.1175/1520-0450(1983)022<1065:BPOTSF>2.0.CO;2, 1983.
Monks, P. S., Archibald, A. T., Colette, A., Cooper, O., Coyle, M., Derwent, R., Fowler, D., Granier, C., Law, K. S., Mills, G. E., Stevenson, D. S., Tarasova, O., Thouret, V., von Schneidemesser, E., Sommariva, R., Wild, O., and Williams, M. L.: Tropospheric ozone and its precursors from the urban to the global scale from air quality to short-lived climate forcer, Atmos. Chem. Phys., 15, 8889–8973, https://doi.org/10.5194/acp-15-8889-2015, 2015.
Shao, M., Tang, X. Y., Zhang, Y. H., and Li, W. J.: City clusters in China: air and surface water pollution, Front. Ecol. Environ., 4, 353–361, https://doi.org/10.1890/1540-9295(2006)004[0353:CCICAA]2.0.CO;2, 2006.
Skamarock, W., Klemp, J. B., Dudhia, J., Gill, D. O., Barker, D. M., Duda, M., Huang, X. Y., Wang, W., and Powers, J. G.: A description of the advanced research WRF version 3, NCAR technical note NCAR/TN/u2013475, 2008.
Tang, G. Q., Zhu, X. W., Xin, J. Y., Hu, B., Song, T., Sun, Y., Zhang, J. Q., Wang, L. L., Cheng, M. T., Chao, N., Kong, L. B., Li, X., and Wang, Y. S.: Modelling study of boundary-layer ozone over northern China – Part I: Ozone budget in summer, Atmos. Res., 187, 128–137, https://doi.org/10.1016/j.atmosres.2016.10.017, 2017.
Taylor, K. E.: Summarizing multiple aspects of model performance in a single diagram, J. Geophys. Res.-Atmos., 106, 7183–7192, https://doi.org/10.1029/2000jd900719, 2001.
Tie, X., Geng, F., Guenther, A., Cao, J., Greenberg, J., Zhang, R., Apel, E., Li, G., Weinheimer, A., Chen, J., and Cai, C.: Megacity impacts on regional ozone formation: observations and WRF-Chem modeling for the MIRAGE-Shanghai field campaign, Atmos. Chem. Phys., 13, 5655–5669, https://doi.org/10.5194/acp-13-5655-2013, 2013.
Wang, J., Allen, D. J., Pickering, K. E., Li, Z. Q., and He, H.: Impact of aerosol direct effect on East Asian air quality during the EAST-AIRE campaign, J. Geophys. Res.-Atmos., 121, 6534–6554, https://doi.org/10.1002/2016JD025108, 2016.
Wang, J. D., Zhao, B., Wang, S. X., Yang, F. M., Xing, J., Morawska, L., Ding, A. J., Kulmala, M., Kerminen, V. M., Kujansuu, J., Wang, Z. F., Ding, D. A., Zhang, X. Y., Wang, H. B., Tian, M., Petaja, T., Jiang, J. K., and Hao, J. M.: Particulate matter pollution over China and the effects of control policies, Sci. Total Environ., 584, 426–447, https://doi.org/10.1016/j.scitotenv.2017.01.027, 2017.
Wang, L. T., Wei, Z., Yang, J., Zhang, Y., Zhang, F. F., Su, J., Meng, C. C., and Zhang, Q.: The 2013 severe haze over southern Hebei, China: model evaluation, source apportionment, and policy implications, Atmos. Chem. Phys., 14, 3151–3173, https://doi.org/10.5194/acp-14-3151-2014, 2014.
Wang, W., Li, X., Shao, M., Hu, M., Zeng, L., Wu, Y., and Tan, T.: The impact of aerosols on photolysis frequencies and ozone production in Beijing during the 4-year period 2012–2015, Atmos. Chem. Phys., 19, 9413–9429, https://doi.org/10.5194/acp-19-9413-2019, 2019.
Wang, Y. G., Ying, Q., Hu, J. L., and Zhang, H. L.: Spatial and temporal variations of six criteria air pollutants in 31 provincial capital cities in China during 2013–2014, Environ. Int., 73, 413–422, https://doi.org/10.1016/j.envint.2014.08.016, 2014.
Wang, Z. F., Li, J., Wang, Z., Yang, W. Y., Tang, X., Ge, B. Z., Yan, P. Z., Zhu, L. L., Chen, X. S., Chen, H. S., Wand, W., Li, J. J., Liu, B., Wang, X. Y., Wand, W., Zhao, Y. L., Lu, N., and Su, D. B.: Modeling study of regional severe hazes over mid-eastern China in January 2013 and its implications on pollution prevention and control, Sci. China Earth Sci., 57, 3–13, https://doi.org/10.1007/s11430-013-4793-0, 2014.
Wesely, M. L.: Parameterization of surface resistances to gaseous dry deposition in regional-scale numerical-models, Atmos. Environ., 23, 1293–1304, https://doi.org/10.1016/0004-6981(89)90153-4, 1989.
Wild, O., Zhu, X., and Prather, M. J.: Fast-J: Accurate simulation of in- and below-cloud photolysis in tropospheric chemical models, J. Atmos. Chem., 37, 245–282, https://doi.org/10.1023/A:1006415919030, 2000.
Xing, J., Wang, J., Mathur, R., Wang, S., Sarwar, G., Pleim, J., Hogrefe, C., Zhang, Y., Jiang, J., Wong, D. C., and Hao, J.: Impacts of aerosol direct effects on tropospheric ozone through changes in atmospheric dynamics and photolysis rates, Atmos. Chem. Phys., 17, 9869–9883, https://doi.org/10.5194/acp-17-9869-2017, 2017.
Xu, Z. N., Huang, X., Nie, W., Shen, Y. C., Zheng, L. F., Xie, Y. N., Wang, T. Y., Ding, K., Liu, L. X., Zhou, D. R., Qi, X. M., and Ding, A. J.: Impact of Biomass Burning and Vertical Mixing of Residual-Layer Aged Plumes on Ozone in the Yangtze River Delta, China: A Tethered-Balloon Measurement and Modeling Study of a Multiday Ozone Episode, J. Geophys. Res.-Atmos., 123, 11786–11803, https://doi.org/10.1029/2018JD028994, 2018.
Yarwood, G., Morris, R. E., Yocke, M. A., Hogo, H., and Chico, T.: Development of a methodology for source apportionment of ozone concentrations estimates from a photochemical grid model, Air and Waste management association, Pittsburgh USA, 15222, 1996.
Zaveri, R. A. and Peters, L. K.: A new lumped structure photochemical mechanism for large-scale applications, J. Geophys. Res.-Atmos., 104, 30387–30415, https://doi.org/10.1029/1999JD900876, 1999.
Zaveri, R. A., Easter, R. C., Fast, J. D., and Peters, L. K.: Model for simulating aerosol interactions and chemistry (MOSAIC), J. Geophys. Res.-Atmos., 113, D13204, https://doi.org/10.1029/2007jd008782, 2008.
Zhang, H., DeNero, S. P., Joe, D. K., Lee, H.-H., Chen, S.-H., Michalakes, J., and Kleeman, M. J.: Development of a source oriented version of the WRF/Chem model and its application to the California regional PM10∕PM2.5 air quality study, Atmos. Chem. Phys., 14, 485–503, https://doi.org/10.5194/acp-14-485-2014, 2014.
Zhang, J. and Rao, S. T.: The role of vertical mixing in the temporal evolution of ground-level ozone concentrations, J. Appl. Meteorol., 38, 1674–1691, https://doi.org/10.1175/1520-0450(1999)038<1674:trovmi>2.0.CO;2, 1999.
Zhu, B., Kang, H. Q., Zhu, T., Su, J. F., Hou, X. W., and Gao, J. H.: Impact of Shanghai urban land surface forcing on downstream city ozone chemistry, J. Geophys. Res.-Atmos., 120, 4340–4351, https://doi.org/10.1002/2014JD022859, 2015.