the Creative Commons Attribution 4.0 License.
the Creative Commons Attribution 4.0 License.
 | 11 Sep 2020
Trends in eastern China agricultural fire emissions derived from a combination of geostationary (Himawari) and polar (VIIRS) orbiter fire radiative power products
Mark C. de Jong
Martin J. Wooster
Weidong Xu
Lili Wang
Open burning of agricultural crop residues is widespread across eastern China, and during certain post-harvest periods this activity is believed to significantly influence air quality. However, the exact contribution of crop residue burning to major air quality exceedances and air quality episodes has proven difficult to quantify. Whilst highly successful in many regions, in areas dominated by agricultural burning, MODIS-based (MODIS: Moderate Resolution Imaging Spectroradiometer) fire emissions inventories such as the Global Fire Assimilation System (GFAS) and Global Fire Emissions Database (GFED) are suspected of significantly underestimating the magnitude of biomass burning emissions due to the typically very small, but highly numerous, fires involved that are quite easily missed by coarser-spatial-resolution remote sensing observations. To address this issue, we use twice-daily fire radiative power (FRP) observations from the “small-fire-optimised” VIIRS-IM FRP product and combine them with fire diurnal cycle information taken from the geostationary Himawari-8 satellite. Using this we generate a unique high-spatio-temporal-resolution agricultural burning inventory for eastern China for the years 2012–2015, designed to fully take into account small fires well below the MODIS burned area or active fire detection limit, focusing on dry matter burned (DMB) and emissions of CO2, CO, PM2.5, and black carbon. We calculate DMB totals 100 % to 400 % higher than reported by the GFAS and GFED4.1s, and we quantify interesting spatial and temporal patterns previously un-noted. Wheat residue burning, primarily occurring in May–June, is responsible for more than half of the annual crop residue burning emissions of all species, whilst a secondary peak in autumn (September–October) is associated with rice and corn residue burning. We further identify a new winter (November–December) burning season, hypothesised to be caused by delays in burning driven by the stronger implementation of residue burning bans during the autumn post-harvest season. Whilst our emissions estimates are far higher than those of other satellite-based emissions inventories for the region, they are lower than estimates made using traditional “crop-yield-based approaches” (CYBAs) by a factor of between 2 and 5. We believe that this is at least in part caused by outdated and overly high burning ratios being used in the CYBA, leading to the overestimation of DMB. Therefore, we conclude that satellite remote sensing approaches which adequately detect the presence of agricultural fires are a far better approach to agricultural fire emission estimation.
- Article
(3646 KB) - Full-text XML
-
Supplement
(1621 KB) - BibTeX
- EndNote


Eastern China (111–123∘ E, 27–40∘ N) is home to around one-third of the Chinese population and includes the area of the North China Plain and the Yangtze Plain – two of the largest agricultural zones in China (Fig. 1). Cropland covers over 1.7 million km2 of eastern China, and the region is responsible for an estimated 25 % of China's crop production, including around 51 % of the national rice yield (NBSC, 2012). Large amounts of crop residue (∼60 Tg yr−1 including stems, stalks, straw, etc.) result from this agricultural production (Chen et al., 2017; Huang et al., 2012; Zhang et al., 2015), and the burning of this waste in open fields is widespread across much of eastern China (Fig. 2).
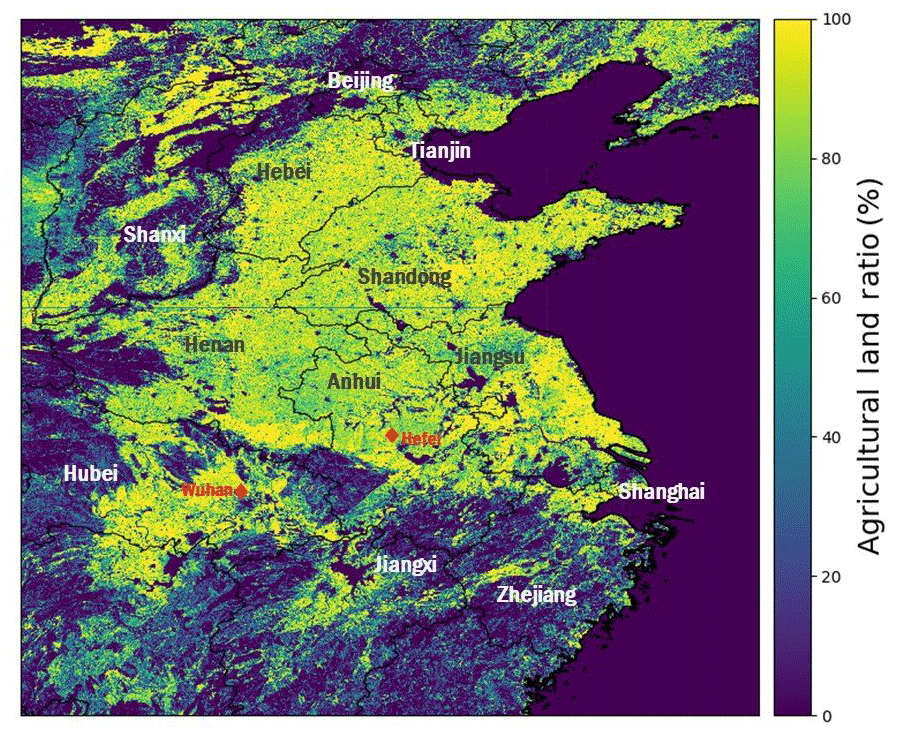
Figure 1The spatial extent of the study area (111–123∘ E, 27–40∘ N). The agricultural land ratio taken from the GlobeLand30 land cover product (Chen et al., 2015) was regridded to 0.01∘ spatial resolution and is overlain with the main provinces, megacities, and some important provincial capital cities in eastern China. The basic layer of country–province borders within this map was created using the Python Basemap library.
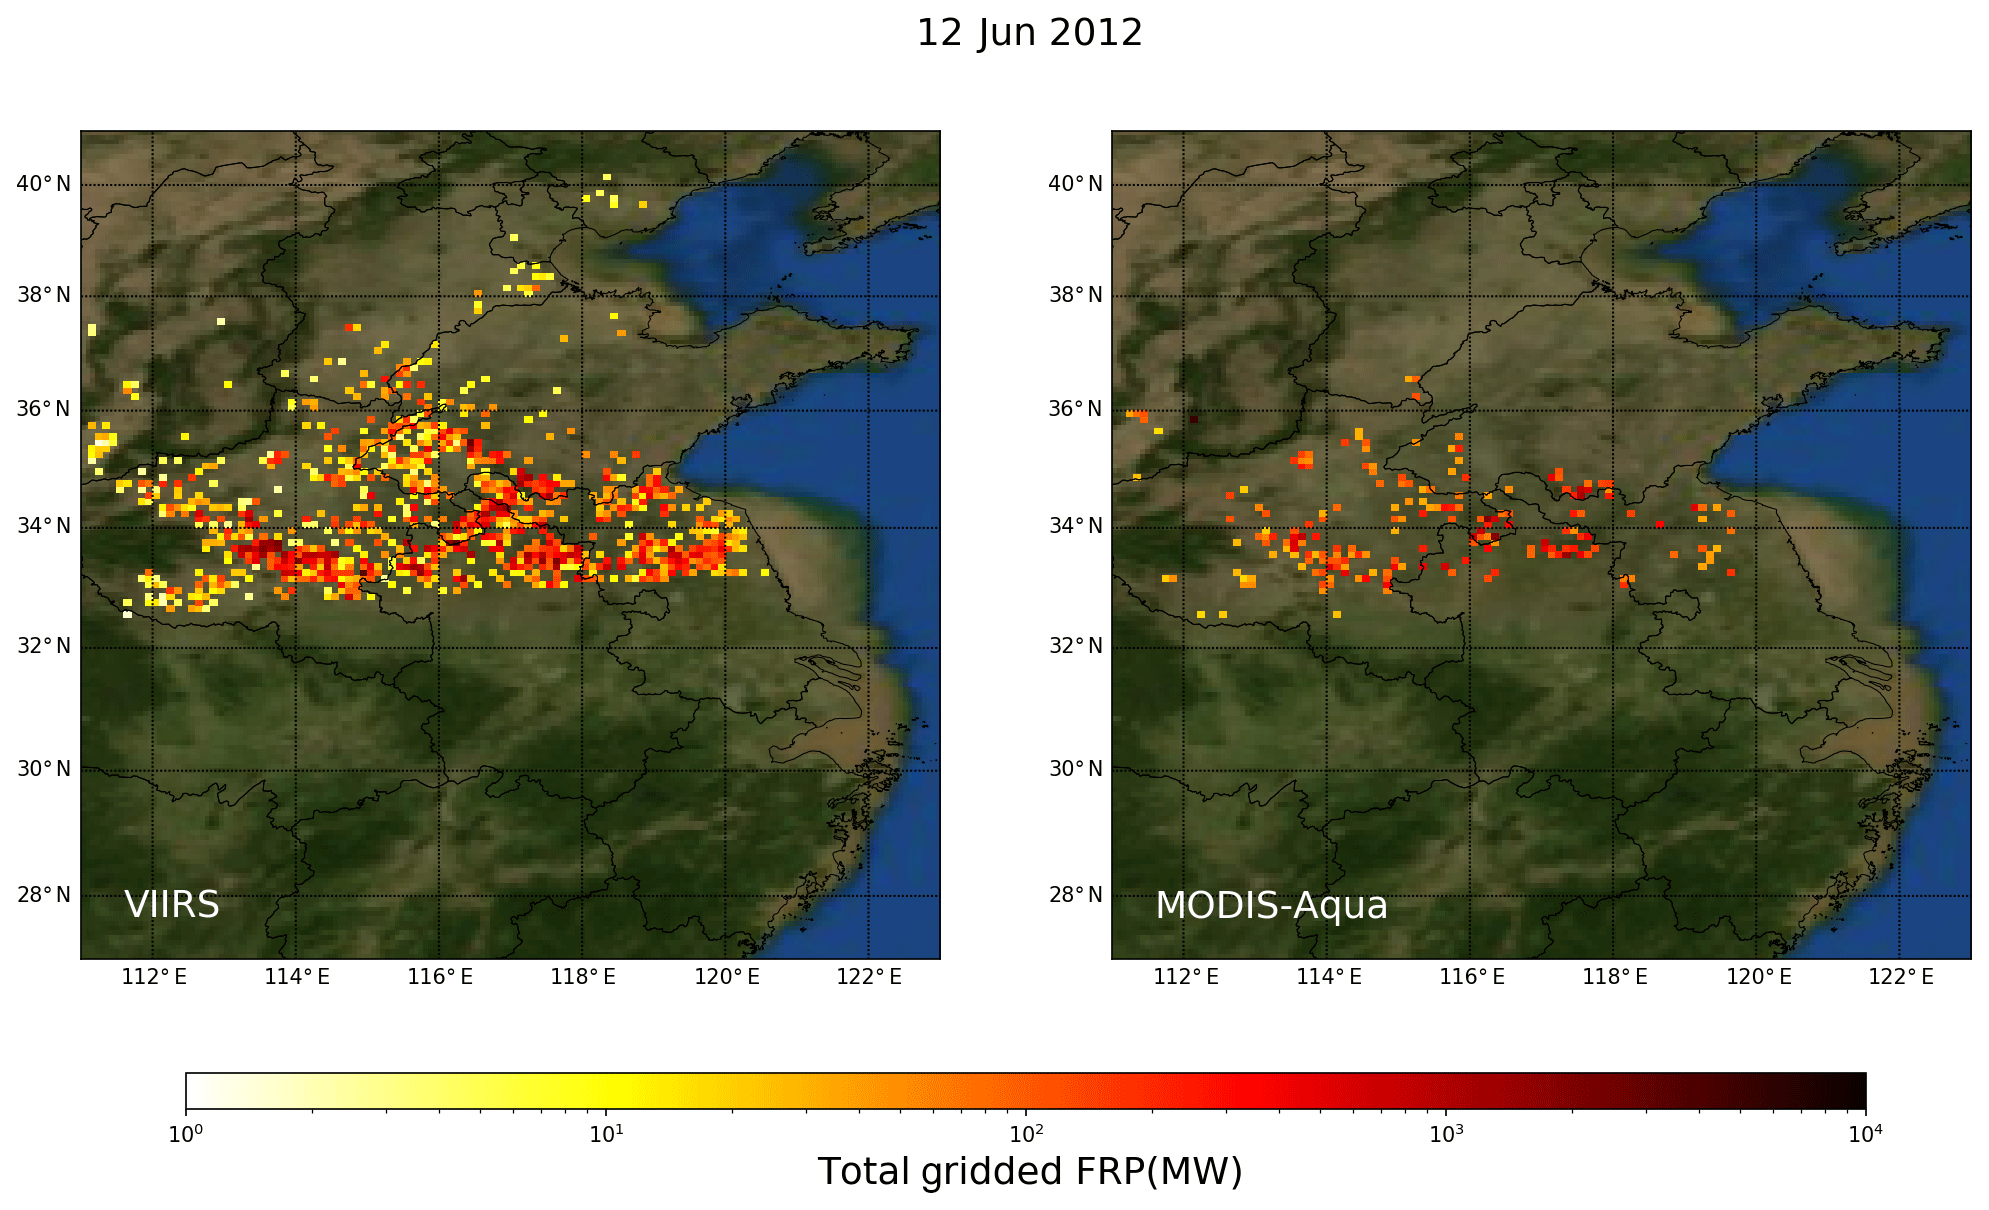
Figure 2Example of the spatial distribution of total gridded FRP (MW; calculated per 0.1∘ grid cell) calculated from near-simultaneous VIIRS-IM and MODIS Aqua data collected over the eastern China study area in Fig. 1 on 12 June 2012. The VIIRS-IM data product clearly quantifies a higher proportion of the FRP from fires burning in the region at the time of the satellite overpass than MODIS Aqua does. The basic layer of country–province borders within this map was created using the Python Basemap library.
This biomass burning has both local- and regional-scale air quality impacts, with emissions of particulate matter (PM) of particular concern (Bond et al., 2013). The East Asian monsoon system that influences much of mainland China results in prevailing north-westerly to south-easterly atmospheric transport during winter, which is reversed in the summer months. Under these influences, the smoke from agricultural residue fires in eastern China often affects “megacities” like Beijing and Shanghai (Chan and Yao, 2008; Cheng et al., 2013; Du et al., 2011; Li et al., 2010). Modelling studies show that these agricultural emissions can drive intense regional air pollution episodes; Huang et al. (2012) suggest that PM10 concentrations in some cities could reach 600 µg m−3 during such episodes, a level 6 times higher than the WHO 24 h mean PM10 air quality guideline for human health (WHO, 2006).
Agricultural burning in eastern China accounts for a significant part of China's total biomass burning emissions (Streets et al., 2003; Chen et al., 2017); however, the specific contribution of crop residue burning to air quality exceedances in China remains uncertain, partly because there is considerable doubt as to the amount of dry matter burned (DMB) in crop residue fires. For example, this leads to a ∼450 % range in total crop residue burning black carbon (BC) emissions in Asia between different emissions inventories (Streets et al., 2003), while emissions estimates of gaseous species are similarly varied.
A major source of this uncertainty stems from the hitherto relatively poor ability of Earth observation (EO) satellite instruments to adequately detect biomass burning activity in many agricultural areas due to the small size of the fires usually found in these areas. Many agricultural fields in eastern China are typically only around 700 m2 in area (NBSC, 2012); fires ignited to burn across the stubble left in place after harvest are therefore hard to detect with moderate-spatial-resolution burned area (BA) mapping from sensors such as MODIS (Moderate Resolution Imaging Spectroradiometer) and are made even more elusive by the common farming practice of piling up residues into an even smaller area before igniting them (Zhang et al., 2017, 2018). As most BA mapping methods require ∼>20 % of a pixel to be burned in order for it to be classified as “fire-affected” (Giglio et al., 2006, 2009), BA-based emissions inventories such as the GFED (Global Fire Emissions Database) tend to significantly underestimate fire activity in areas such as eastern China (Zhang et al., 2018).
Infrared active-fire-based (AF-based) detection techniques can discriminate fires covering only 0.01 %–0.1 % of a pixel area (Wooster et al., 2005; Schroeder et al., 2014) and as such should in theory be able to capture far more fire activity in agricultural areas than BA-based methods. Nevertheless, due to the extremely small size of agricultural fires in eastern China, a large proportion of fire activity remains undetected by AF detection algorithms applied to moderate-spatial-resolution imagery (from sensors such as MODIS). This limitation is a key source of uncertainty within the FRP approach and can indeed lead to biased (underestimated) FRP totals caused by the non-detection of the lower FRP component of a region's fire regime (e.g. Roberts et al., 2015). Higher-spatial-resolution polar-orbiting sensors such as VIIRS (Visible Infrared Imaging Radiometer Suite) can provide the ability to identify an increased number of AFs having lower FRP values, particularly when used with algorithms optimised for small fire detection (Zhang et al., 2017) (Fig. 2), but they still only capture fires burning in clear skies at the time of the satellite overpass (Giglio et al., 2003, 2006). This limitation is also a considerable source of uncertainty and a hinderance given the sometimes short duration of active burning (especially of agricultural fires) and the typical polar-orbiting imaging frequency of only a few times per day. To cope with this issue, FRP-based emissions inventories such as the Global Fire Assimilation System (GFAS) based upon AF methods are generally required to make assumptions or exploit additional data on the timing and relative diurnal variability of fire activity occurring between polar-orbiting overpasses in order to estimate, for example, total daily fire radiative energy (FRE) (Kaiser et al., 2012; Xu et al., 2017; Zhang et al., 2017). Here we provide this additional information by exploiting new fire diurnal cycle information taken from the geostationary satellite Himawari-8, combining it with twice-daily FRP information provided by the “small-fire-optimised” VIIRS-IM product of Zhang et al. (2017) to produce a unique high-spatio-temporal-resolution agricultural fire dataset (referred to hereafter as the VIIRS-IM/Him dataset) for eastern China based on FRE totals. This new inventory is designed to reduce bias and uncertainty caused by use of one FRP data type alone and to account for small fires burning even for short periods and often well below the MODIS AF and BA detection limit. The fuel for these fires is waste straw and other agricultural residues, and we use a crop rotation map to classify the type of agricultural residue being burned at each observed location and time. It is then used to select the most appropriate smoke emissions factor for calculating the final fire emissions totals from FRE-derived estimates of dry matter burned (DMB).
2.1 Polar-orbiting VIIRS-IM FRP product
The Visible Infrared Imaging Radiometer Suite (VIIRS) instrument is currently flown aboard the polar-orbiting Suomi NPP (since 2011) and NOAA-20 (since 2017) satellites and expands upon the capabilities of the AVHRR and MODIS instruments for environmental monitoring (Zhou et al., 2019). VIIRS has 22 channels spanning the visible to the longwave infrared, a 3000 km swath width, and nadir pixel resolution ranging between 375 and 750 m (Goldberg et al., 2013). Furthermore, a “pixel aggregation” scheme is applied to VIIRS, which limits pixel area increase with scan angle to a maximum of 4× compared to 10× in the case of MODIS (Wolfe et al., 2013).
With a necessary emphasis on the detection of small fires typical of agricultural regions, our work focuses on generating a gridded daily biomass burning fuel consumption product that estimates DMB and emissions from the VIIRS-IM AF detection and FRP product developed and optimised for eastern China by Zhang et al. (2017) using data from the instrument aboard the Suomi NPP satellite with a mean local daytime overpass time of 13:30 in the ascending node and a mean local night-time overpass time of 01:30 in the descending node (Wolfe et al., 2013). Figure 2 shows an example of the VIIRS-IM FRP product generated from the two observations per day provided by Suomi NPP VIIRS. This FRP product blends the advantages of the “small fire” sensitivity of the VIIRS 375 m I-band, with the ability to retrieve fire radiative power (FRP) over larger fires using the 750 m M-band observations. Due to the very small size of agricultural fires in China, and because the VIIRS I-band pixel area is 10 times smaller than the pixel area of MODIS, far more fires can be detected in eastern China using the VIIRS-IM AF product of Zhang et al. (2017) than can be identified in near-simultaneous MODIS data, and on average across eastern China it retrieves FRP totals around 4 times higher (Zhang et al., 2017).
2.2 Geostationary Himawari FRP product
To convert the twice-daily VIIRS-IM FRP product to daily integrated FRE, information on the fire diurnal cycle is required (Ellicott et al., 2009; Freeborn et al., 2008; Roberts et al., 2009). We obtained this from 10 min temporal resolution observations from the geostationary Himawari-8 satellite, whose data have recently been used to derive AF detections and FRP metrics across Asia by Xu et al. (2017). Himawari cannot be used in isolation to directly estimate daily FRE for each year in the 4 years of the study because (i) Himawari data are only available from early 2015 onwards, and (ii) Himawari's relatively coarse pixel size (2 km at the sub-satellite point) means that it omits even more of the agricultural fires than MODIS (as illustrated by Xu et al., 2017, and in Fig. 3). However, where agricultural fires are concentrated in sufficient density, observations by Himawari do enable their detection and these data can be used to map the changing FRP of these fires over the day for the derivation of the fire diurnal cycle.
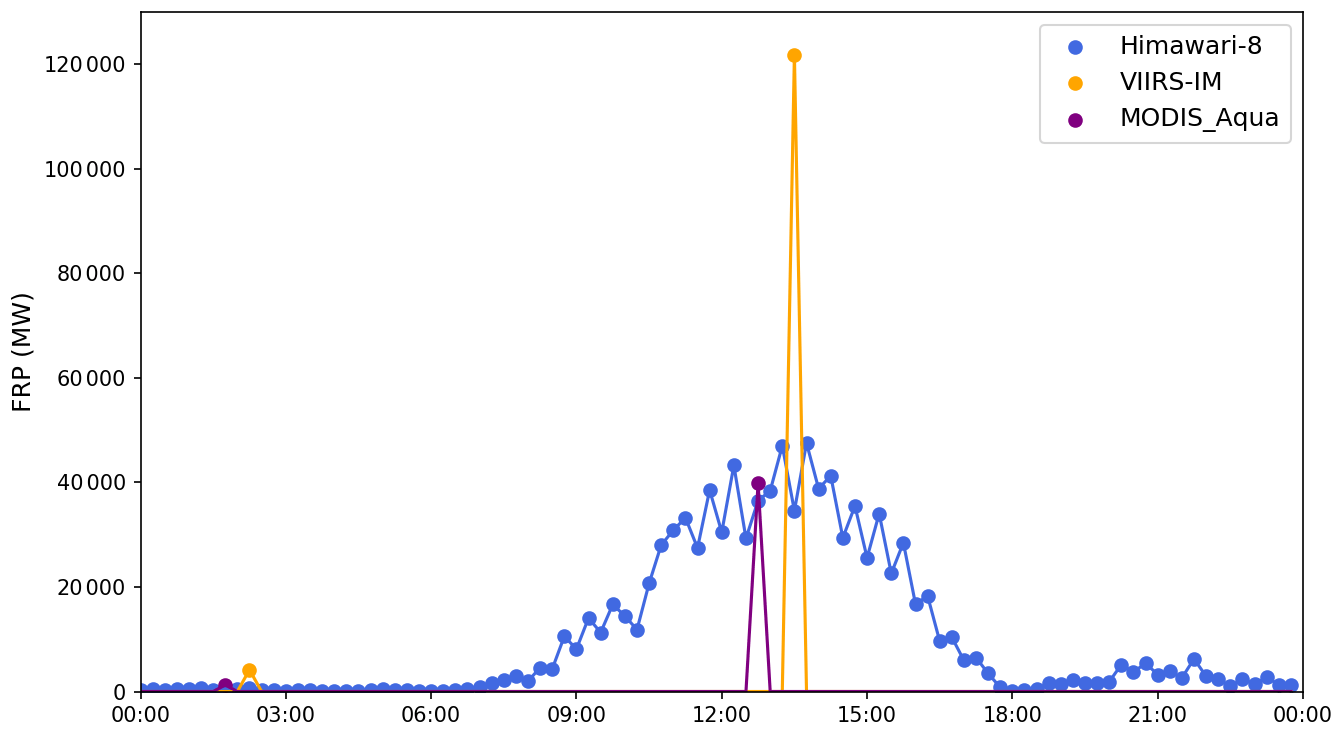
Figure 3Time series of spatially summed FRP for eastern China, as retrieved from geostationary Himawari, and polar-orbiting VIIRS-IM and MODIS observations made on 11 June 2015. VIIRS and MODIS Aqua typically provide two observations per day, sometimes three when swath overlaps from different orbits occur. Himawari provides 144 observations per day.
2.3 Crop rotation map
The predominant agricultural residues burned across eastern China are wheat, corn, and rice straw (Huang et al., 2012). To classify the likely residue type of each detected fire, a crop rotation map (Supplement Fig. S1) was generated from the MIRCA2000 0.08∘ global monthly crop area dataset (Portmann et al., 2010), which has a spatial resolution equivalent to 9.2 km ×9.2 km at the Equator. These data were used to assign fire activity to a particular crop residue type, which determined the appropriate agricultural biomass burning emission factors to apply (see Sect. 3.3).
2.4 Land cover data
We use the GlobeLand30 land cover product (Chen et al, 2015) to classify land cover and land use for our study area in eastern China. GlobeLand30 provides 30 m spatial resolution land cover data for a baseline year of 2010 derived primarily from Landsat (TM5 & ETM +) and China Environmental Disaster Alleviation Satellite (HJ-1) imagers. Figure 1 shows the spatial distribution of the agricultural land ratio (regridded to 0.01∘ spatial resolution) calculated using this dataset in eastern China.
2.5 GFED and GFAS emissions inventory data
The results from the combined VIIRS-IM and Himawari FRP-based emissions (VIIRS-IM/Him) dataset were compared to two state-of-the-art global fire emission databases, the Global Fire Emissions Database (GFED) and the Global Fire Assimilation System (GFAS). The GFED was built to combine remotely sensed data on BA with fuel loads from the Carnegie–Ames–Stanford Approach (CASA) biogeochemical model of vegetation growth, producing monthly, spatially explicit pyrogenic fuel consumption, carbon, greenhouse gas (GHG), and air pollution emission estimates at 0.25∘ grid cell resolution globally (van der Werf et al., 2010; Giglio et al., 2013). The most recent version (GFED4.1s) includes a “small fire boost” based on AF detections in an attempt to counteract the inability of the MODIS BA product to detect many agricultural fires (Randerson et al., 2012; van der Werf et al., 2017). Due to this boost, GFED4.1s shows higher values of dry matter burned (DMB) in most eastern China grid cells compared to the “unboosted” GFED4, and a more extensive fire distribution. However, Zhang et al. (2018) show that the boosting procedure can introduce significant anomalies into the GFED dataset at certain times of year, generated when the MODIS AF detection procedure incorrectly identifies urban features in eastern China as fires.
In contrast to the GFED, the GFAS fire emissions database is based on AF detections and is integrated into the Copernicus Atmosphere Monitoring Service (CAMS) system for near-real-time atmospheric composition monitoring and forecasting. Developed by Kaiser et al. (2012) and based on the FRP method, MODIS supplies the FRP data for the current GFAS v1.2 up to four times per day at most latitudes. From these observations, DMB is calculated via a regression against GFED DMB values (Kaiser et al., 2012), and daily emissions of 40 emitted species are then calculated at 0.1∘ spatial resolution.
2.6 Crop-yield-based approach emissions inventory data
The traditional method for the estimation of agricultural fire emissions is the so-called crop-yield-based approach (CYBA), and we compare data from such approaches to our new VIIRS-IM/Him methodology. CYBAs typically calculate the amount of crop residue burned in a region using a combination of crop production statistics and related additional parameters using following equation:
where i stands for each n different crop, DMB is total dry matter burned (kg) in the region, Pi is the regional production of crop i (kg) usually derived from annual agricultural statics reports, Ri is the dry matter production-to-residue ratio (unitless), which depends on the crop type i, Bi is the proportion of residue burned in the field for crop type i in the region under study (i.e. the “burning ratio”; 0–1, unitless), and C is crop combustion completeness (0–1, unitless; Huang et al., 2012). DMB is then multiplied by appropriate particulate and gaseous emission factors in order to estimate the total emissions from agricultural burning.
Certain parameters in Eq. (1) are not so easily determined. For example, the burning ratio (Bi) is often based on questionnaires or investigations on the use of crop residues conducted with farmers (Gao et al., 2002; Wang and Zhang, 2008). Because of strong variations in socio-economic development across the huge expanse of mainland China, large differences in the estimates of Bi exist (Jiang et al., 2012; Liu et al., 2008; Yamaji et al., 2010). Bi may also change considerably from year to year since it is strongly impacted by the level of local economic development, the availability of alternative uses for crop residues in the region, and the regional governance of fire prohibition (Chen et al., 2017). Moreover, considering the official prohibition of open-air burning, the reliability of data based on surveys that ask farmers how much residue they burn is questionable. Despite this, most studies that include an estimation of agricultural fire emissions in eastern China have relied on the CYBA (e.g. Cao et al., 2006; He et al., 2011; Huang et al., 2012; Li et al., 2009; Qin and Xie, 2011; Yan et al., 2006; Zhao et al., 2015).
3.1 Data gridding and cloud cover adjustment
The VIIRS-IM FRP product data (MW), originally derived at the pixel scale, were aggregated to 0.1∘ resolution for this analysis. Unlike the daily average MODIS FRP calculation of the GFAS, which individually weights contributing MODIS FRP observations by their view zenith angle to downgrade the importance of far off-nadir measurements (Kaiser et al., 2012), no such weighting was applied to the VIIRS-IM FRP data since they have already shown very limited view zenith angle dependence as a result of the VIIRS pixel-averaging procedure (Zhang et al., 2017). For each VIIRS overpass, the total observed FRP present in each 0.1∘ grid cell j (i.e. FRPj) was calculated from the cumulative FRP of all native-resolution AF pixels i within the grid cell:
Total observed agricultural area (A, excluding cloud-covered area) within each 0.1∘ grid cell was calculated similarly using the GlobeLand30 30 m land cover map:
The VIIRS-IM product is only affected to a limited degree by smoke because of the relative transparency of smoke plumes at mid-wave infrared (MWIR) wavelengths due to the dominant particle size being smaller than the wavelengths of the VIIRS MWIR channel (Zhang et al., 2017). However, the product cannot provide information in cloud-covered areas, so an adjustment is required to take into account actively burning fires hidden from view by clouds. Following Streets et al. (2003) we assume that for partially cloud-covered grid cells, the AF and FRP distribution under cloud is the same as under clear-sky areas, as is also assumed in the GFAS (Kaiser et al., 2012).
Subsequently, the gridded and cloud-adjusted FRP areal density (ρj, MW km−2) is calculated using
Cloud cover (CC) fractions in some grid cells occasionally reach 0.5 (50 %), but most are zero. After the cloud cover adjustment, the mean FRP areal density across the study area increased by 11.5 %, so the overall effect of the CC adjustment is relatively minor.
3.2 Diurnal cycle and daily FRE generation
Hourly averages of the 10 min FRP data from the Himawari-8 product of Xu et al. (2017) were gridded to the same 0.1∘ grid cell resolution as the VIIRS-IM dataset. For each grid cell and calendar day, hourly FRP data were normalised in order to minimise the impact of day-to-day variations in fire activity:
where is the normalised Himawari-8 FRP for hour h on day d for grid cell j; FRP is the averaged Himawari-8 FRP (MW) for hour h on day d for grid cell j; and max(FRPj,d) and min(FRPj,d) are respectively the maximum and minimum hourly Himawari-8 FRP (MW) observed on day d for grid cell j. Note that h is in local time (UTC) and the diurnal cycle runs from 00:00 to 23:00.
data for 2015 were used to produce two normalised “seasonal” diurnal fire cycles for the eastern China study area: a “summer” diurnal cycle constructed from May–June data and an “autumn” diurnal cycle constructed from September–October data. Both normalised seasonal diurnal cycles were calculated using a weighted mean so that days and grid cells with high fire activity had the greatest influence on the cycle:
where FRPh is the normalised FRP for hour h for the entire study area and fire season (summer or autumn). Figure 4 shows the resulting weighted-mean fire diurnal cycle for the summer season for eastern China. This diurnal cycle is bimodal: a primary peak occurs around 13:00 local time that extends from around 08:00 to 18:00 (daytime), and a second much smaller peak occurs around 21:00 local time (with a magnitude of only ∼20 % of the normalised FRP value of the first peak).

Figure 4Time series of hourly normalised fire radiative power derived from Himawari-8 FRP data generated using the algorithm of Xu et al. (2017) over eastern China at 0.1∘ for June 2015 (the “summer” diurnal fire cycle). The blue curve shows the best fit of the Gaussian distribution, with the orange error bar showing the standard deviation. Grey shading shows the two daily VIIRS overpass periods.
We blended information from the Himawari FRP diurnal cycle with the instantaneous twice-daily VIIRS-IM FRP areal density (ρj, MW km−2) data using an approach based on Andela et al. (2015) to create the VIIRS-IM/Him dataset. Here we represent the diurnal fire cycle as a Gaussian function parameterised using the Himawari FRP diurnal cycle superimposed on a fixed baseline. For a given grid cell j at instantaneous time t, VIIRS-IM/Him FRP areal density is calculated by
where is the instantaneous VIIRS-IM/Him FRP areal density (MW km−2) for grid cell j at time t; is the night-time (∼01:00 LST) VIIRS-IM FRP areal density value (MW km−2) for grid cellj; is the daytime (∼13:00 LST) VIIRS-IM FRP areal density value (MW km−2) for grid cell j; μ is an adjustment factor used to account for the difference between the VIIRS daytime overpass time and the peak time of the weighted-mean fire diurnal cycle (Eq. 8); tHimpeak is the hour of the day at which the seasonal Himawari FRP diurnal cycle peaks; and σ is the standard deviation of the main peak of the Himawari FRP diurnal cycle calculated by fitting a Gaussian function (using non-linear least squares) to the seasonal Himawari FRP diurnal cycles. The summer diurnal cycle σ value (2.39±0.053) was applied during the April–August period, and the autumn diurnal cycle σ value (1.63±0.041) was applied during the September–March period.
The adjustment factor μ is used to account for the fact that the VIIRS daytime overpass time is unlikely to coincide with the peak of the fire diurnal cycle:
where is the local time of the VIIRS-IM FRP observation for grid cell j.
Daily FRE was then estimated for each grid cell j and calendar day by integrating the instantaneous VIIRS-IM/Him FRP data calculated using Eq. (7).
3.3 Conversion to dry matter burned (DMB) and smoke emissions
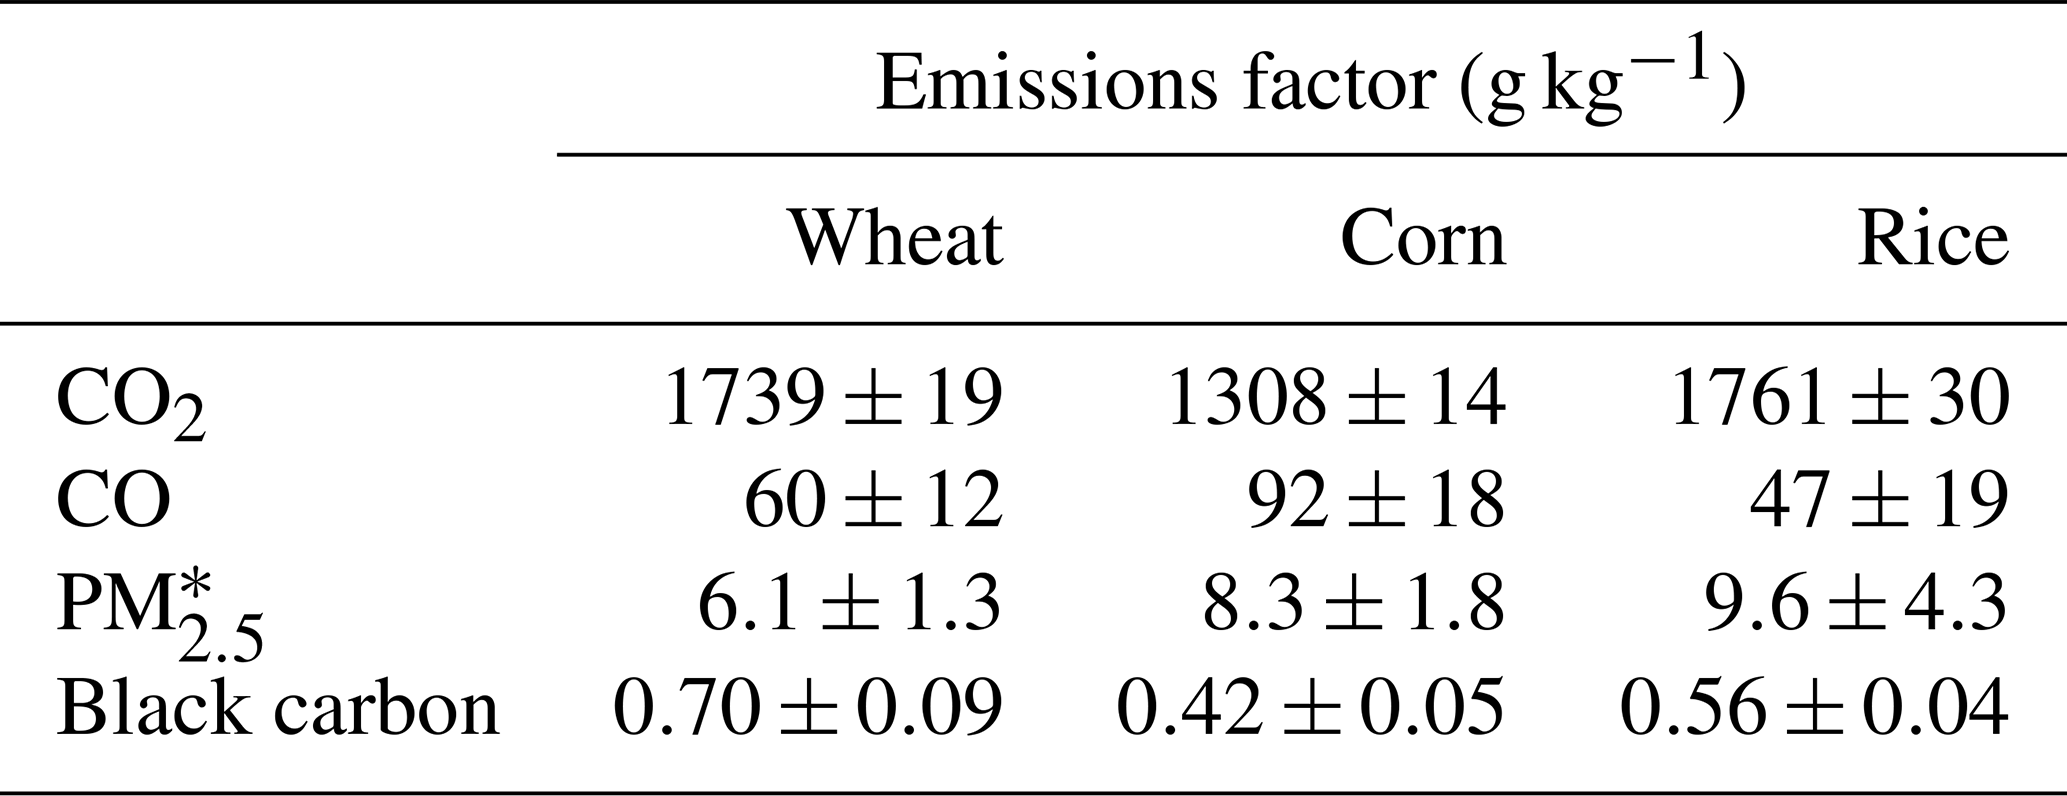
To convert the estimated FRE areal density to fuel consumption and DMB, we multiplied FRE by the 0.368 kg MJ−1 (±0.015 kg MJ−1) factor derived by Wooster et al. (2005) from a series of outdoor experimental straw fires that were very similar to the Chinese agricultural residue fires used herein (Zhang et al., 2015). To convert the resultant DMB into smoke emissions, we used the emission factors of wheat and rice derived from in situ measurements in agricultural areas by Zhang et al. (2015) (Table 1). Corn residue was not a fuel type measured during those experiments, so for this fuel type (which was only 16 %–22 % of the total agricultural fuel consumption) we used the emissions factors for agricultural corn fires from Andreae and Merlet (2001), as is used in the GFAS (Kaiser et al., 2012) (Table 1). Together with the crop rotation map (see Sect. 2.3 and Fig. S1) the emission factors from Table 1 enabled us to select the appropriate emissions factor for use at a particular location and time of year.
Table 1Emission factors for agricultural residue burning used in this study. Wheat and rice emission factors were derived from field measurements conducted in eastern China and reported by Zhang et al. (2015), while the corn emission factors are from Andreae and Merlet (2001), the same as those used in the GFAS (Kaiser et al., 2012). * PM2.5: particulate matter with diameter < 2.5 µm.
Furthermore, a winter burning season was discovered during November and December (see details in Sect. 5.1) when no cultivation crop is shown in the MIRCA2000 data in the study region. Analysis in this study shows that winter fires are likely to result from the combustion of stored residues from the autumn harvest season; therefore, all fire activity in winter was assigned to crop types (and therefore emission factors) using the crop rotation map from the previous closest month (October) (Fig. S1). This methodological change is accounted for in the data presented in Fig. 5.
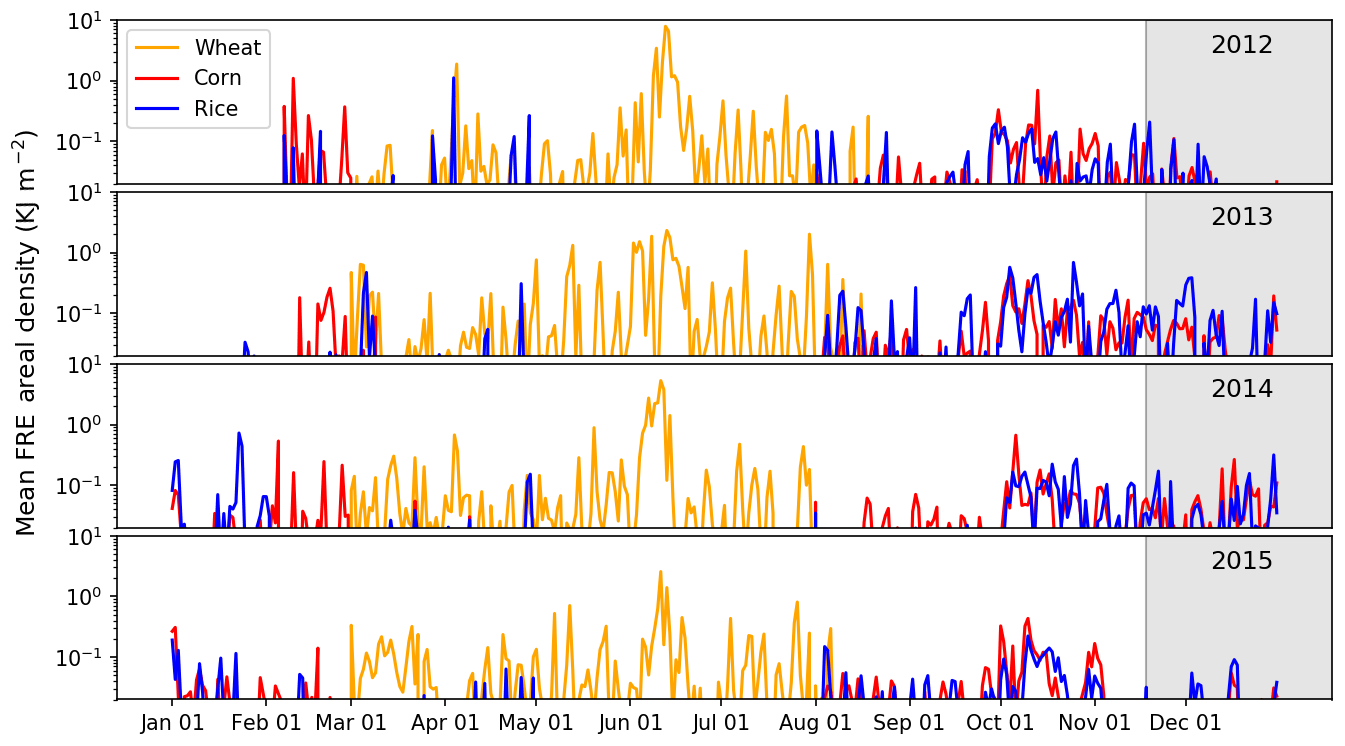
Figure 5Time series of mean daily FRE areal density (kJ m−2; calculated per 0.1∘ grid cell) from 2012 to 2015 for the entire study area disaggregated by crop residue type (wheat, corn, and rice) according to the method described in Sect. 2.3. Grey shaded areas highlight the newly discovered winter burning season from mid-November to December when no crop harvesting occurs but where fires are clearly occurring. This period of agricultural burning is discussed further in Sect. 5.2.
4.1 Temporal and spatial distribution of FRE in eastern China
Figure 5 shows the time series of daily mean FRE areal density in eastern China from February 2012 to December 2015 reported at 0.1∘ grid cell resolution and broken down into three main crop residue types. A strong seasonal variation is seen, with peak activity in summer (May–June) associated with wheat residue burning and a smaller secondary peak in activity occurring in autumn (September–October) associated with corn and rice residue burning. In fact, the secondary peak is a combination of several fluctuations lasting from October until December, further discussed in Sect. 5.1. Over the whole 4-year period, wheat crop residues contributed 65 % of the total FRE, rice residues 18 %, and corn residues 17 %.
A distinct spatial pattern showing two main burning seasons can also been seen when FRE areal density is mapped (Fig. 6). During the summer burning season (May–June), most fires are located between 32 and 36∘ N, extending from 112 to 120∘ E near the coast. In the autumn season (September–October), less fire activity occurs than in the summer fire season and it is more evenly distributed across the entire study area, though there is still a focus of fire activity between 32–34∘ N and 112–119∘ E. Moreover, in the south-west of the study area (29–32∘ N and 112–114∘ E) we see a region that only appears to undergo substantial burning in the autumn. This is located in the centre of Hubei Province, which contributes around 12 % of the total rice yield of the whole of China (NBSC, 2015). This area contributes to between 10 % and 18 % (year dependent) of the total autumn burning season FRE.
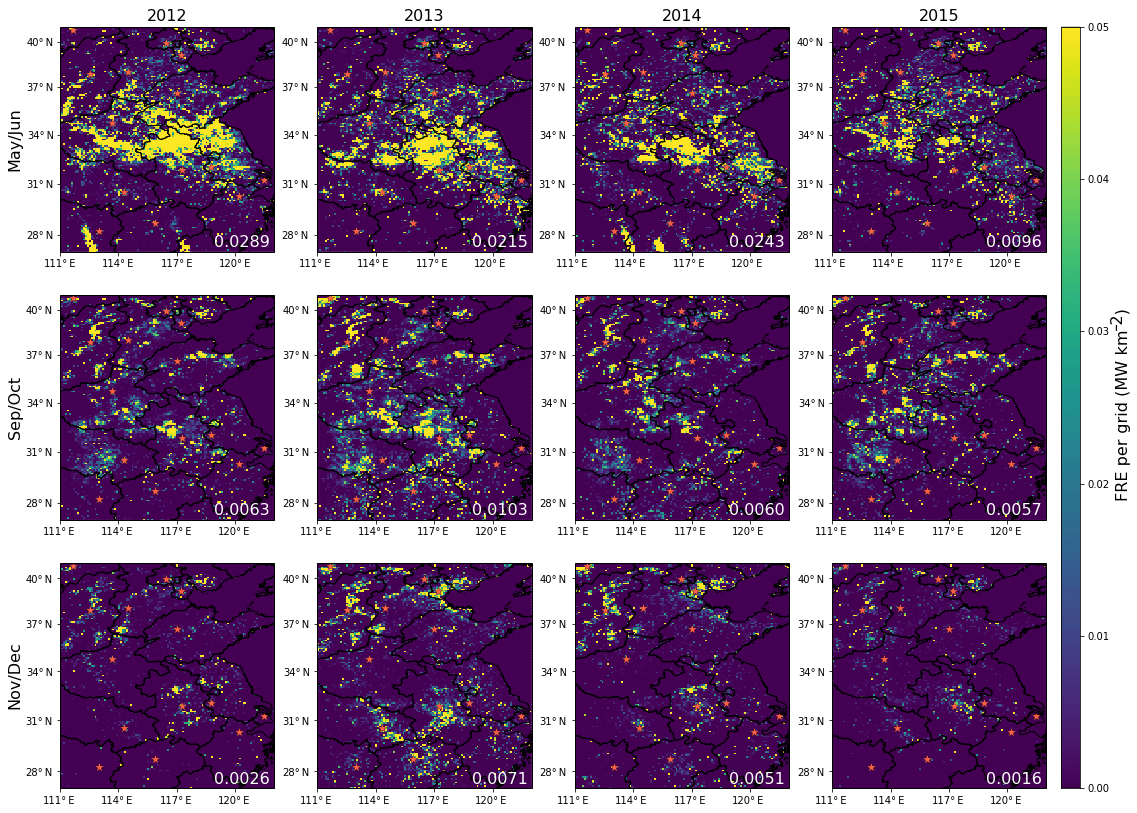
Figure 6Spatial distribution of FRE areal density (MJ m−2, 0.1∘ grid cells) for agricultural fires in eastern China from 2012 to 2015 (top to bottom rows) split by fire season: summer (May–June, top row), autumn (September–October, middle row), and winter (November–December, bottom row). Mean regional FRE for each season is indicated in white text, and the capital city location of each province is shown as an orange star on each map. The basic layer of country–province borders within this map was created using the Python Cartopy library.
4.2 DMB comparisons to the GFAS and GFED
The outputs generated by our combined VIIRS and Himawari processing chain were compared to those of the GFAS and GFED4.1s (Fig. 7). Dry matter burned (DMB) was used as the common comparison metric, as this removes differences arising from the use of different emissions factors within the inventories. Overall, the VIIRS-IM/Him DMB estimates are around 2 to 5 times higher than those reported for corresponding months by the GFAS and GFED 4.1s. As detailed in Zhang et al. (2017) and discussed in Sect. 2, VIIRS has the ability to detect far smaller (and lower FRP) fires than MODIS due to its far smaller pixel size and the fact that the I-band observations also retain their pixel area more effectively across the swath. Ultimately, this difference results in far higher DMB being obtained by the VIIRS-IM/Him inventory compared to the MODIS-based GFAS and GFED inventories.

Figure 7Monthly (2012–2015) time series of total dry matter burned (DMB) retrieved using the VIIRS-IM/Him FRP product developed in this study (with standard deviation shown as black error bars), along with comparable GFAS and GFED4.1s DMB totals. Grey shaded areas highlight the winter burning season from mid-November to December (Sect. 5.2).
During the summer months of May–June, all three inventories (GFAS, GFED, and VIIRS-IM/Himawari) show a clear peak in DMB, but the GFAS and VIIRS-IM/Him show a much sharper peak in June, while the GFED's summer burning season extends 1 month earlier (May) and later (July). This extended summer fire season reported by the GFED is likely the result false fire reporting, discussed at length in Zhang et al. (2018). VIIRS-IM/Him shows a June DMB peak ranging from 3.30 to 11.2 Tg, 2 times higher than GFED4.1s (1.89–5.34 Tg) and GFAS (2.00 to 4.30 Tg). It should be remembered that the conversion of daily average FRP to DMB in the GFAS is derived via a calibration to GFED4.1s (Kaiser et al., 2012), so these two emissions databases understandably report similar monthly DMB totals.
For the autumn (September–October) burning season, the peaks in the GFAS and GFED inventories are much less pronounced than the summer burning season peaks (Fig. 7). DMB in October ranges 0.57–1.74 Tg for the GFED, significantly higher than the 0.31–0.61 Tg reported by the GFAS but far lower than the 1.62–3.05 Tg of the VIIRS-IM/Him inventory. The VIIRS-IM/Him-derived DMB estimates for eastern China are thus 2 to 3 times higher than GFED4.1s and 5 times higher than the GFAS; these represent larger differences than those for the earlier summer burning season. This indicates that agricultural fires burning during the autumn fire season may be on average smaller and/or more isolated from other fires than they are in the summer burning season, and thus they are even more likely to be missed by the MODIS AF detection product (Giglio et al., 2006) and/or the MODIS BA product (Giglio et al., 2013) than they are during other more intense burning periods.
4.3 Agricultural fire emissions intercomparison
This section presents a comparison of the total annual agricultural fire emissions calculated using the VIIRS-IM/Him method with other inventories of Chinese agricultural fire emissions in the literature, as well as against emissions totals from other sectors, to gain a better understanding of the relative importance of agricultural fire emissions. To compare with other reported agricultural fire emission inventories for China, the DMB estimates produced herein were converted to fire emissions estimates using the emissions factors and methods described in Sect. 3.3; these results are summarised in Fig. 8 and Table 2.
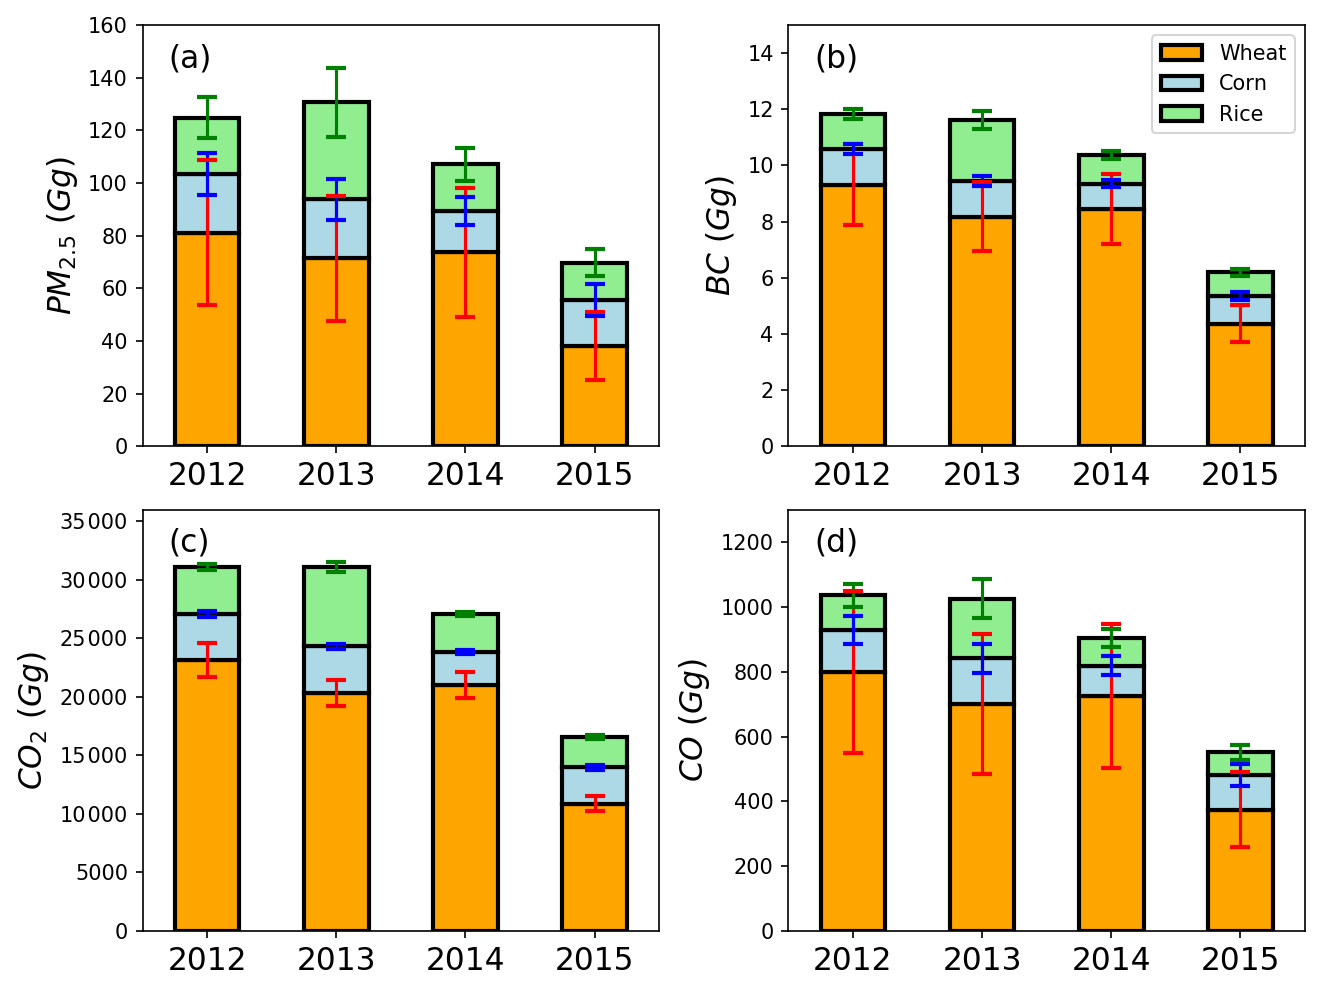
Figure 8Annual total PM2.5, BC, CO2, and CO emissions for eastern China for the three main crop residue burning types (wheat, corn, rice) calculated for 2012–2015 using the VIIRS-IM/Him-based emissions inventory developed herein. Coloured error bars indicate 1 standard deviation.
Table 2Total species-specific fire emissions calculated in this study for agricultural burning in eastern China and a comparison to those contained within other fire emissions inventories and calculated in previous studies.
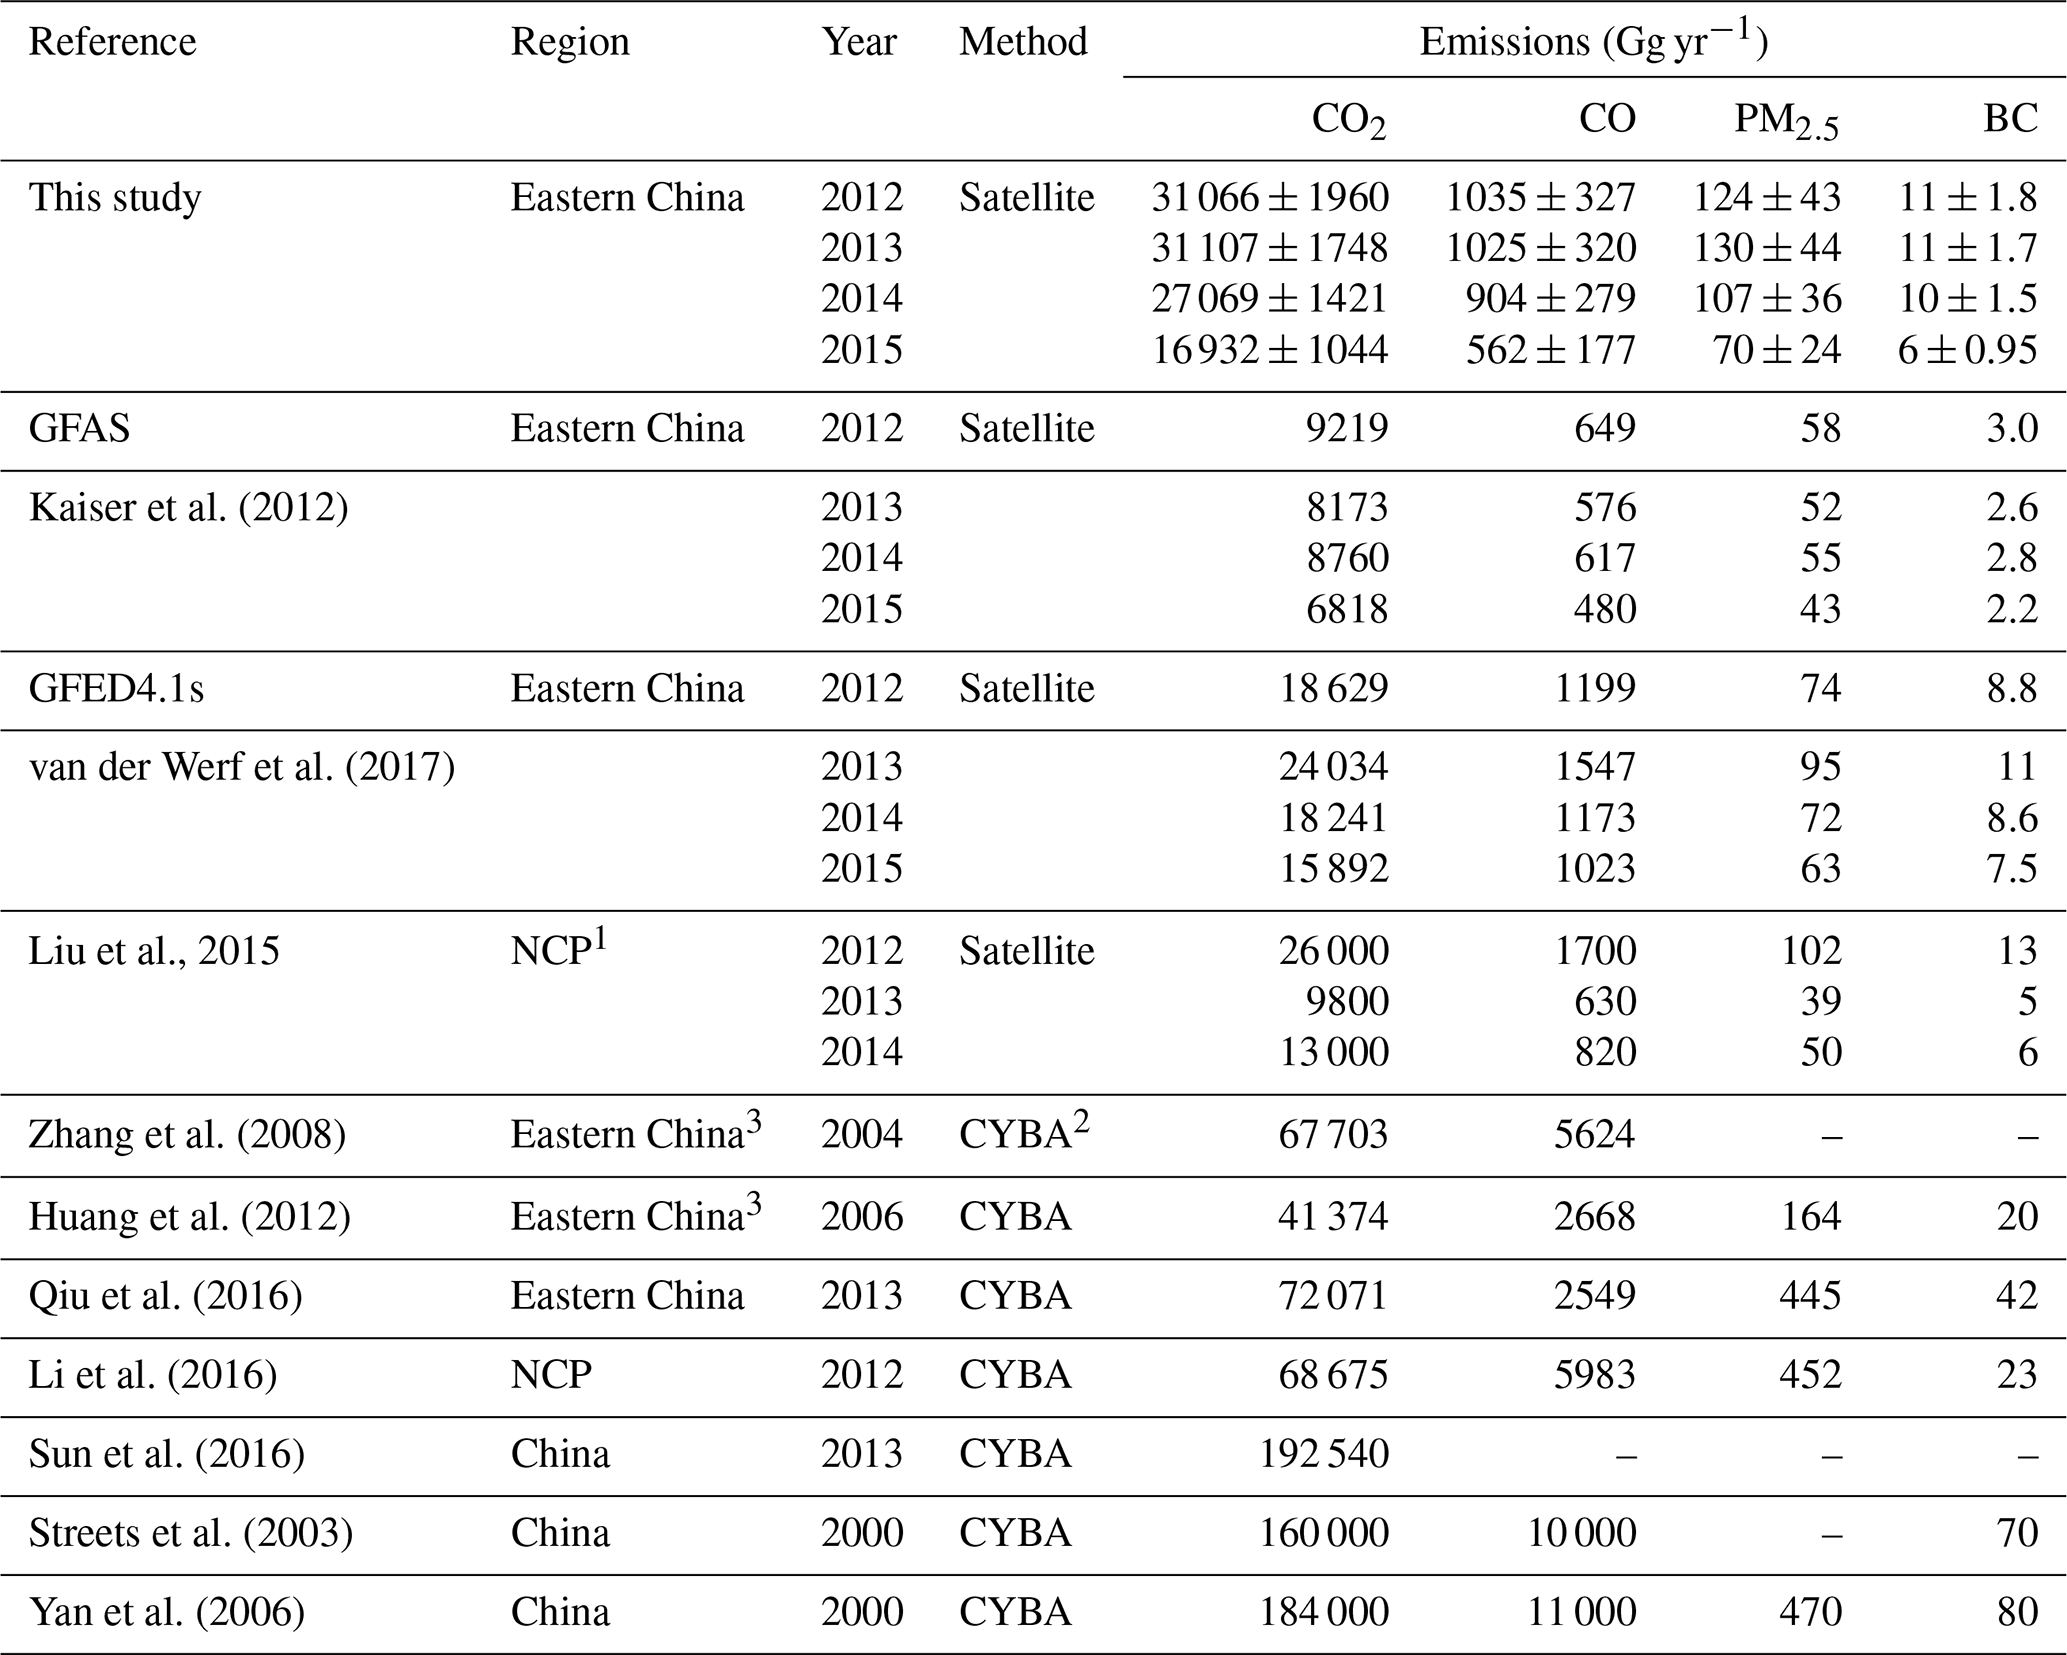
1 NCP refers to the North China Plain, which has a geographic extent similar to that of this study (32–41∘ N, 113–121∘ E). 2 CYBA refers to the crop-yield-based approach; see Sect. 2.6.1. 3 Sum of provinces and cities shown in Fig. 1 of this study.
From Fig. 8, it is clear that wheat residue burning is the primary agricultural emission source, accounting for over 50 % of the total emissions released each year (specifically 55 %–69 % of PM2.5, 71 %–81 % of BC, 66 %–77 % of CO2, and 69 %–80 % of CO). Figure 8 also indicates a considerable reduction in emissions in 2015 compared to previous years, largely attributable to a reduction in the amount of wheat residue burnt. For example, total PM2.5 emissions from agricultural residue burning in eastern China for 2012–2014 cover a relatively narrow range of 107–130 Gg (Fig. 8 and Table 2) but decrease to 67±24 Gg in 2015 due to an almost halving of DMB (Fig. 7); similar patterns are observed for BC, CO2, and CO (Fig.8).
From Table 2, it is apparent that emissions totals calculated using the VIIRS-IM/Him approach are consistently higher than those reported by the GFAS by factor of 1.2–4.2 (species and year dependent). Similarly, VIIRS-IM/Him emissions totals for CO2 and PM2.5 are greater than those reported by the GFED by a factor of 1.1–1.7. In both cases, this can be explained by the tendency of MODIS to miss activity from small fires compared to VIIRS. VIIRS-IM/Him emissions for CO and BC in 2015 are lower than those reported for the GFED, which can be attributed to differences in the emissions factors used between the approaches.
Emissions totals calculated using the VIIRS-IM/Him approach are smaller than those estimated by CYBA studies for the eastern China–North China Plain regions (Zhang et al., 2008; Huang et al., 2012; Qiu et al., 2016) by a factor of 2–5. It is possible that the much higher totals estimated from CYBA studies may be due to the use of very high residue burning ratios (Bi in Eq. 1) for corn and rice in particular. This finding is discussed further in Sect. 5.
Liu et al. (2015) estimated total emissions in the North China Plain region (a similar area to the study area used in this paper) using MODIS FRP-based calculations and assumed a modified Gaussian function for the diurnal cycle to generate daily FRE estimates from which emissions were then derived. These estimates are much closer in magnitude to the equivalent estimates calculated using the VIIRS-IM/Him method than those from the CYBA studies. However, 2013 and 2014 estimates by Liu et al. are consistently lower (by a factor of 0.3–0.9); again, we attribute this difference to the fact that MODIS-based methods capture less fire activity than our VIIRS-IM/Him approach. Interestingly, Liu et al. (2015) estimated far higher emission totals for 2012 compared to 2013 and 2014 and report greater total CO and BC emissions than we do. For example, annual CO2 emissions in 2012 (26 000 Gg) are >2 times their reported total emissions for 2013 (9800 Gg) and 2014 (13 000 Gg). However, the Liu et al. processing approach did not provide any adjustment for the impact of the MODIS “bow-tie” scan geometry effect, which leads to duplicated AF detections and FRP towards the edge of the MODIS swath; this was highlighted as a significant issue for FRP quantification by Freeborn et al. (2008) and Zhang et al. (2017). This is a particular problem in MODIS data from the year 2012, for which a large number of duplicated observations have been found towards edge of swath (Fig. S2). This problem has been addressed in the GFAS using a scan-angle-dependent weighing factor for the MODIS FRP data (Kaiser et al., 2012), as described in Sect. 2.5, and GFAS CO2 emissions from 2012 are only 24 % and 10 % higher than from 2013 and 2014, respectively, a much more modest increase compared to that reported in Liu et al. (2015).
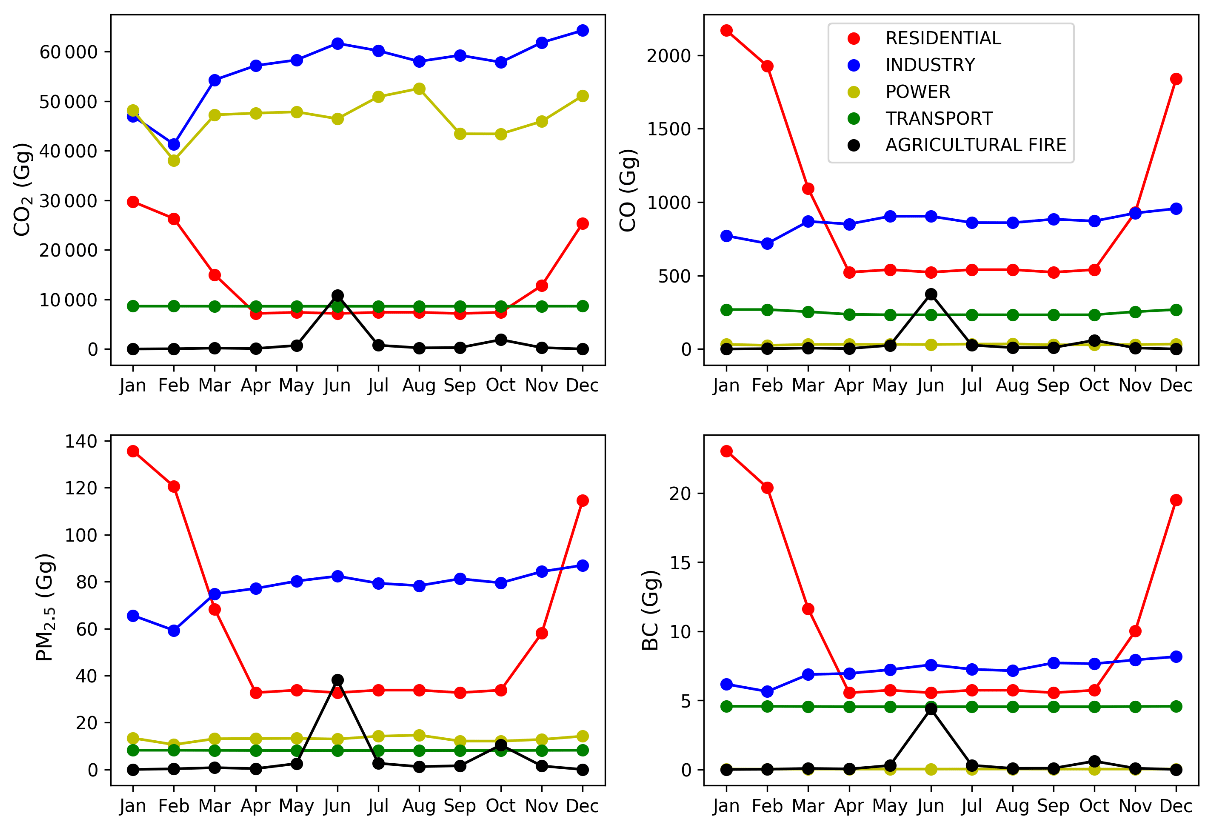
Figure 9Comparison of monthly CO2, CO, PM2.5, and BC emissions from agricultural fires with those from other emission sources (residential, industry, power, transport; data source: Li et al., 2015) in the intensive burning area (32–36∘ N, 112–122∘ E) of eastern China in the year 2013.
Figure 9 presents a comparison of agricultural emissions calculated using the VIIRS-IM/Him method with emissions from non-biomass-burning sources produced by Li et al. (2017) for a sub-area of eastern China (32–36∘ N, 112–122∘ E) for the year 2013. We note that crop burning emissions are of relatively little significance when considered on an annual basis; for all four species (CO2, CO, PM2.5, BC), contributions from agricultural residue burning range between 0.56 % and 2.0 % of total annual emissions, with the majority of emissions resulting from industry and residential sources. However, in June when agricultural burning and emissions are at a maximum, residue burning contributes 8.1 %, 18 %, 22 %, and 20 % of the total monthly emissions for CO2, CO, PM2.5, and BC, respectively, highlighting the strong seasonal impact agricultural burning can have on the emission of species that affect both climate and air quality.
5.1 Importance of wheat residue burning
Findings in Sect. 4 (Figs. 5 and 8) indicate that a larger proportion of wheat residue than corn or rice residue is burnt for several reasons. First, the yields of these three crop types in eastern China are relatively similar – in 2015, for example, wheat yield was 10 % lower than rice yield and only 20 % higher than corn (Table S1 in the Supplement; NBSC, 2015). Second, the dry matter production-to-residue ratio (Ri in Eq. 1) of wheat is not higher than that of rice or corn (Table S2; Wang and Zhang, 2008). Third, with the exception of black carbon, the emission factors for wheat residues are broadly similar to or smaller than the corresponding rice and corn emission factors. It is unknown why a greater fraction of wheat residue than corn and rice residue is burnt. However, it is possible that local management practices and/or stakeholder priorities differ depending upon the residue type and time of year at which crops are harvested, ultimately impacting the fate of these residues; e.g. residues from certain crops may be valuable as fertiliser (Huang et al., 2012), animal feed, or for domestic and/or local energy production (Chen et al., 2017; Liu et al., 2008).
5.2 Discovery of a winter burning season
As detailed in Sect. 4.1, small peaks in our dry matter burned (DMB) time series are apparent in November–December of each year (grey shaded area shown in Fig. 5). Since no mention of such a winter burning season was found in the literature (e.g. Chen et al., 2017; Huang et al., 2012; Zhang et al., 2008), these winter peaks were initially considered to be erroneous and likely caused by VIIRS AF false alarms that had failed to be excluded by the land cover and/or persistent thermal anomaly masking detailed in Zhang et al. (2017). Furthermore, according to the crop rotation map derived from the MIRCA2000 data (Fig. S1), there is no obvious harvesting of wheat, corn, or rice during the winter in eastern China. However, close examination of the original VIIRS data and the VIIRS-IM FRP product generated from them by Zhang et al. (2017) shows that most of the AF pixels detected in eastern China in winter are in fact located in or very close to areas classified as agricultural land (Fig. S3) and are not located close to industrial areas of the type known to cause false AF detections (Zhang et al., 2017). The AF detections also do not appear multiple times in the same month at the same location, as would be expected if they were false alarms generated by non-fire features. It therefore seems highly probable that these AF detections are actually a consequence of true agricultural burning (Figs. S3–S5).
The most reasonable explanation for the winter AFs appears to be that some of the crop residues from the September–October (autumn) harvest season were left idle for a few months and burned in the winter rather than immediately. Local newspapers, online media, and other information sources were consulted and were found to support the existence of winter residue burning episodes. One example is a report by the Jiangsu Province TV station on 5 December 2013, when a huge crop residue burning episode was reported in Hongze (Jiangsu Province) close to the location shown in Fig. S3. Stills from this TV report show flames, thick smoke, and extremely poor visibility resulting from the crop residue burning, described in Chinese language subtitles (Fig. S4). Reports of similar episodes were found on different websites and/or in newspapers from across much of eastern China (e.g. Wang and Zhang, 2016; Za, 2015; Zuo, 2015). Subsequent to this confirmation, an explanation as to why this activity may have occurred outside the normal burning season was sought. According to Yun Xia, a local governor of the Environmental Department in Hefei (interview conducted by Anhui News; Zuo, 2015), the prohibition on agricultural burning started at the beginning of September in that area and continued until 20 November. During this period, the local government strongly enforced its polices aiming to restrict agricultural residue burning and established almost continuous patrols to identify areas likely to host crop residue fires in order to prevent their ignition. However, without a widespread and cost-effective alternative way to dispose of their crop residues, local farmers may simply have stored the residue material and burned it soon after the end of the prohibition period when the intensive patrol period had ceased. The end of the prohibition period coincides almost exactly with the time of the new winter burning season identified by our VIIRS-IM/Him dataset (Figs. 5–7).
The winter season is important for biomass burning in this area of China, accounting for between 19 % and 36 % (year dependent) of the combined autumn and winter FRE total. Based on the crop rotation map (Fig. S1), this fire activity was attributed to the burning of both corn and rice residues, with the contribution of each residue to total FRE (and thus DMB) almost equal (49 % and 51 %; average over all years). This split by residue type is very similar to that observed in the autumn burning season (corn 54 %, rice 46 %; average over all years), despite the observed variation in the spatial distribution of fire between autumn and winter (Fig. 6). In general, winter burning appears to take place closer to provincial capitals than autumn burning does; the reason for this spatial shift in fire is discussed in Sect. 5.4.
5.3 Disagreement between satellite-derived emissions and crop-yield-based approaches
In Sect. 4.3, it was noted that annual emissions totals calculated using crop-yield-based approaches (CYBAs) are greater than those calculated using the VIIRS-IM/Him method by a factor of 2–3, depending on species. We believe that this discrepancy relates to the burning ratio (BR) used in CYBAs to produce emissions estimates. The burning ratio is the ratio of crop residue burned in the field to the total amount of residue produced by harvesting, and it is a key parameter in bottom-up CYBAs (see Eq. 1, and Chen et al., 2017; Gao et al., 2002; Huang et al., 2012; Li et al., 2016). Streets et al. (2003) used a uniform BR of 17 % derived from 1970s data; however, more recent studies often make use of regionally varying fractions. We identified three sources of regionally varying burning ratios that are widely used in the CYBA literature.
Wang and Zhang (2008) divided all provinces in China into six zones according to their geographical distribution. A questionnaire-based survey conducted amongst farmers within these regions was used to elucidate the level of burning activity, and using the responses it was determined that burning ratios for the different categories ranged from 11 % to 33 %. Outputs were applied and referenced in a series of fire emission studies (He et al., 2011; Qin and Xie, 2011; Zhang et al., 2016).
Gao et al. (2002) derived a set of province-dependent burning ratios adopted from a large-scale investigation of crop residue use across different Chinese provinces. These ratios have been used and referenced in Huang et al. (2012), Yan et al. (2006), and Zhang et al. (2008), and they are shown in Fig. 10.
A derived value is based on farmer income levels because Cao et al. (2006) found a positive linear correlation between the income of farmers and the burning ratio (r=0.81). This relationship has been applied within several fire emission studies (Sun et al., 2016, Zhao et al., 2015) and will be examined in Sect. 5.4.
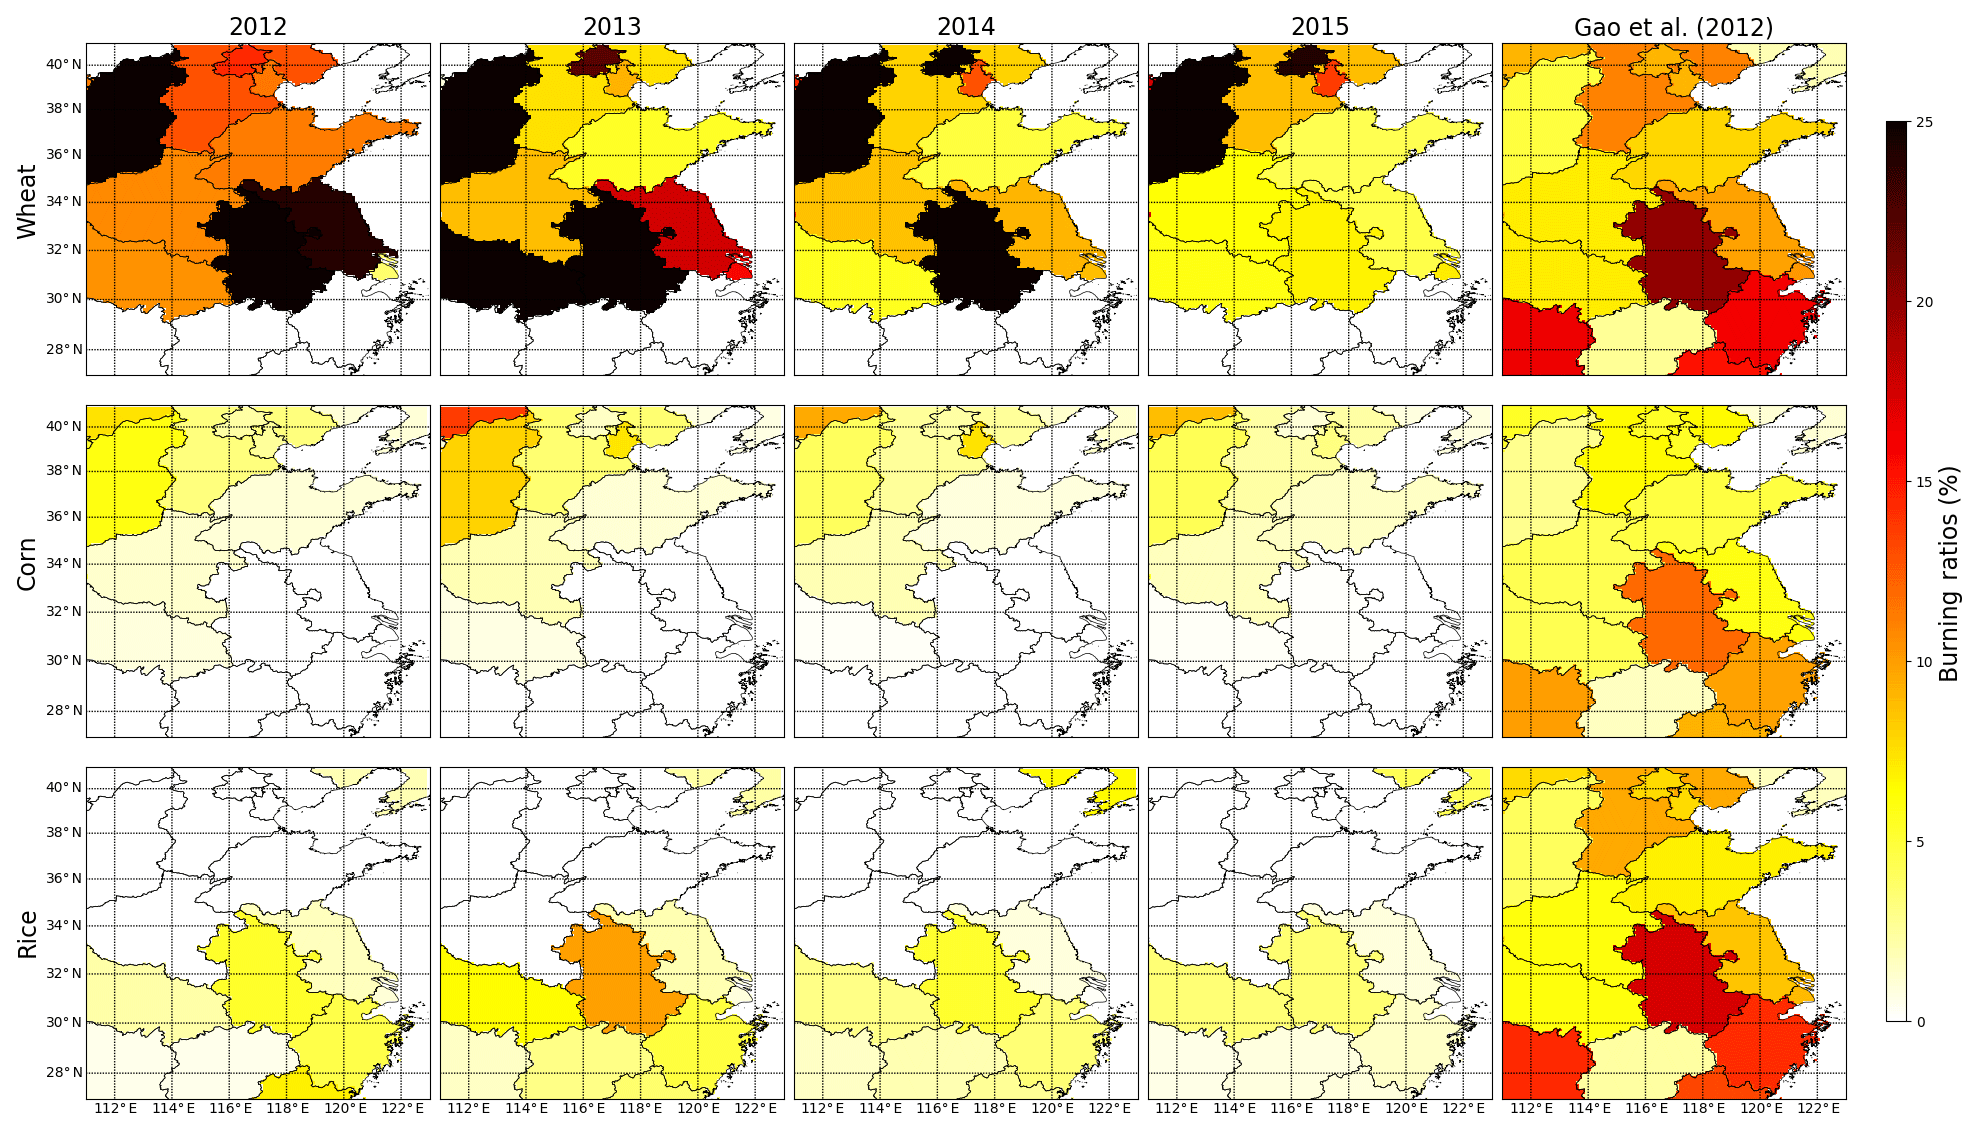
Figure 10Temporal and spatial variability of province-specific percentages of crop residues burned in fields (burning ratio metrics) in eastern China. Data are calculated using crop yield estimates from the National Bureau of Statistics of China and the dry matter burned totals derived herein using our VIIRS-IM/Him DMB datasets for 2012–2015, then compared to the temporally invariant estimates provided by Gao et al. (2002, final column). The basic layer of country–province borders within this map was created using the Python Basemap library.
Using crop yield information and the DMB data derived from the VIIRS-IM/Him processing performed herein, it is straightforward to reverse the CYBA methodology to calculate the burning ratio for each crop type. This procedure can help confirm whether the outputs derived herein are comparable with those in the existing literature, as well as enabling the advantages offered by the remote sensing time series to be fully exploited. The burning ratios (Bij) for each province i and crop type j are calculated from
where DMBij is the estimated VIIRS DMB (g m−2) for province j and crop i; Pij is the yield of crop i for province j (kg); Ri is the dry matter production-to-residue ratio for crop i (unitless); and C is crop combustion completeness (proportion, 0–1). The province-level crop yield Pij is derived from annually published statistical reports and presented in Table S1. Ri and C are from Huang et al. (2012) and are presented in Table S2.
The crop- and province-dependent burning ratios calculated from the VIIRS-IM/Him data are shown in Fig. 10, alongside the burning ratios from Gao et al. (2002). Figure 10 indicates that there is considerable variation in burning ratios between individual provinces and that VIIRS-IM/Him wheat burning ratios are clearly much higher than rice-to-corn burning ratios. When averaged over the entire eastern China study area, yearly mean burning ratios from our results for wheat are the highest (7.8 %–12 %), followed by corn (1.7 %–2.3 %), then rice (0.9 %–2.0 %). Equivalent mean burning ratios calculated using data from Gao et al. (2002) are 9.8 %, 5.9 %, and 8.5 %, respectively. While VIIRS-IM/Him wheat residue burning ratios are in reasonable agreement with those used in the various CYBA studies, our rice and corn burning ratios are much lower; this appears to explain why total annual emissions from the VIIRS-IM/Him approach are much lower than the total emissions obtained from the CYBA studies.
Figure 10 also indicates that burning ratios are not only influenced by crop type and province, but also vary considerably from year to year. For example, in 2012, satellite-derived wheat burning ratios for the important agricultural provinces of Anhui (30 %), Shandong (11 %), Jiangsu (24 %), and Henan (11 %) are not dissimilar to the corresponding ratios (20 %, 8 %, 10 %, and 7 %, respectively) from Gao et al., (2002). However, during 2015, values derived in this study are much lower (Anhui 6 %; Shandong %; Jiangsu %; Henan %). This interannual variation may be linked to changing local farming activity and prohibition policies (Chen et al., 2017; Li et al., 2016; Yang et al., 2008).
We believe that the disagreement between the burning ratios derived here and those used in CYBA studies indicates that emissions inventories derived using traditional CYBAs may be overestimating agricultural burning emissions for two main reasons: (1) there appears to be considerable uncertainty and subjectivity associated with the methods used to estimate burning ratios in CYBA studies, and (2) many burning ratios used in CYBA studies are taken from relatively old (> 5–10 years) sources of data. For example, Streets et al. (2003) use data from the 1970s, while most recent research uses burning ratios from Wang and Zhang (2008) and Gao et al. (2002) as listed above in this section.
As shown by this analysis, burning ratios appear to be subject to high spatial and interannual variability due to rapidly changing agricultural policies and decision-making that influence the fate of crop residues. As such, in order to ensure reliable emissions estimates, we suggest that future agricultural emission studies and inventories based upon CYBAs should endeavour to use burning ratios derived from data (1) with high granularity and (2) that were collected in the corresponding inventory year.
5.4 Influence of social factors on agricultural burning
As highlighted in Sect. 5.3, some studies assume a positive relationship between burning ratio and the mean local income of farmers (Cao et al., 2006; Qin and Xie, 2011). The explanation for this is that higher-income areas have better access to electricity and other energy sources, and thus there is less need to utilise crop residues for heating and cooking, leading to higher ratios of open burning at these locations. However, this is not what we observe from analyses carried out for this study. In Fig. 11a, minimal correlation was found between gross domestic product (GDP) and burning ratio, and there is some suggestion of an inverse relationship between these variables (, r2=0.13, p < 5). When directly comparing GDP with DMB, as Fig. 12 demonstrates, the provinces with the highest average annual DMB per square metre (Anhui and Henan; 46 and 27 g m−2 yr−1, respectively) have lower GDP values (USD 5580 and USD 5335 per capita) than provinces with lower annual DMB densities (e.g. Shandong and Jiangsu, with 15 and 21 g m−2 yr−1, respectively) but high GDP per capita (USD 9882 and USD 13 311, respectively). In fact, across the eastern China study area, our annual total DMB metric was found to be somewhat inversely correlated with GDP per capita (r2=0.33; Fig. 11b).

Figure 11Direct comparisons of mean GDP per capita with (a) the burning ratio for wheat from 2012 and (b) province-specific yearly dry matter burned (DMB). The best-fit linear relationships are shown, along with their equations, and the grey shaded area represents the 95 % confidence limit on the relationship.
We theorise that the observed inverse correlation between GDP and DMB results from the fact that alternative residue disposal methods to biomass burning have a relatively high cost and can only be afforded by wealthier farmers and/or provinces. For example, the local government of Jiangsu Province (a relatively wealthy province with USD 13 311 per capita and only moderate DMB of 21 g m−2 yr−1) released a regulation in 2009 stating that by the end of 2012, over 35 % of crop residues should be incorporated into the soil after mechanised harvesting. The regulation also indicated that the local government should include a budget for improving the efficiency of agricultural machinery and subsidise farmers who follow this regulation. Furthermore, alternative uses for crop residues are often expensive and are likely only a viable option in relatively wealthy areas. For example, research on residue burning for power generation shows the government needs to pay at least 20 % of the total cost of the operation to keep the power plants running, partly because of the high costs associated with residue collection and transportation from the fields (Li and Hu, 2009).
In addition to influencing the quantity of material burned and when it is burned, societal factors also appear to influence the spatial pattern of burning within provinces and at more granular levels such as at the 0.1∘ grid cell level. The work presented in Sect. 5.2 suggests that the winter burning season (November–December) is caused by delayed burning of residues left over from the autumn harvest season because of prohibition policies related to burning being more robustly enforced earlier in the season. Figure 6 also shows that the spatial distribution of FRE areal density during winter is different from the normal autumn burning season that occurs in September–October. Generally, the areas of strongest burning are further from the provincial capital cities (marked by the orange stars in Fig. 6) during autumn. For example, fires in Anhui Province are mainly distributed in the north during autumn, whilst fire locations change to the south (closer to the capital city of Hefei) during the delayed winter burns. A similar example can also be seen in Hubei Province, where fires shift from west to east from the autumn to winter burning seasons.
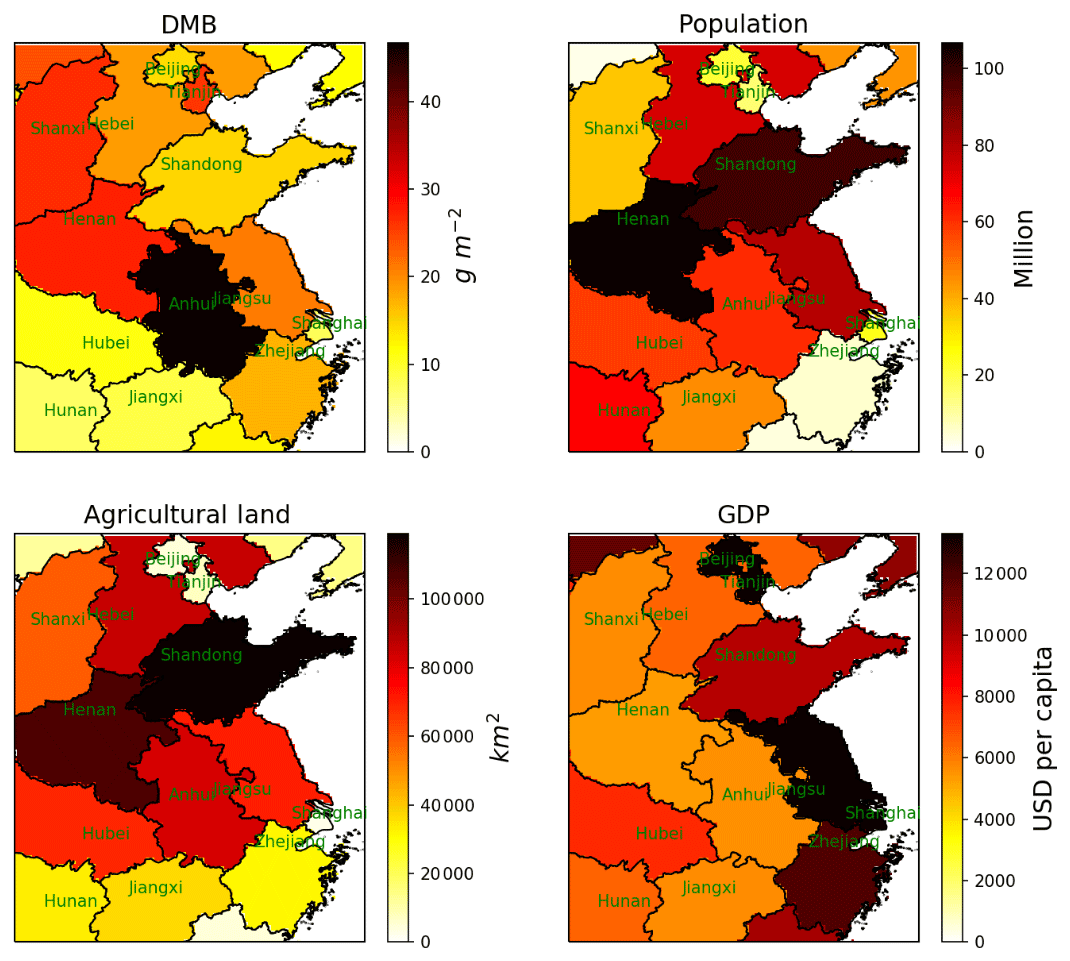
Figure 12Spatial distribution of province-specific (a) mean annual dry matter burned as calculated using the VIIRS-IM/Him approach developed herein, (b) population (data source: Fu et al., 2014a), (c) agricultural land area (data source: GlobeLand30, http://www.globallandcover.com/, last access: 4 August 2020), and (d) mean GDP per capita (data source: Fu et al., 2014b). The basic layer of country–province borders within this map was created using the Python Basemap library.

Figure 13Normalised frequency distribution of distance from the province capital for the top 10 % of high FRE VIIRS-IM/Him product 0.1∘ grid cells during the three burning seasons: summer – May to June (a, blue), autumn – September to October (b, green), and winter – November to December (c, orange). A clear shift towards the origin can be observed in the November–December period compared with September–October.
To examine this in a more quantitative manner, we calculated the distance from each grid cell shown in Fig. 6 to their provincial capitals. Figure 13 shows the normalised frequency distribution of the distance from the capital to the top 10 % of FRE-releasing grid cells in each province using data from the four burning seasons during the 2012–2015 period. The first and third distance quartiles during the autumn season are 109 and 214 km, respectively, but for the “lagged” winter burning season, the distribution shifts to far shorter distances (first and third quartiles of 70 and 153 km, respectively). Similarly, the mean distance from provincial capitals also decreased from 165 km in autumn to 124 km in winter. A Kolmogorov–Smirnov (K-S) test was performed to evaluate the difference between the distributions of distance data for the autumn and winter burning seasons, and the resulting high K-S statistic (0.30, p < 0.001) indicates that the distribution of distances during the winter months is substantially different to the autumn distance distribution. Similar results were found when we applied the K-S test to each calendar year of data separately (not shown). One possible explanation for this observed difference is that the geographical shift might also be linked to the policies aimed at prohibiting burning, since areas close to capital cities are likely to have more resources for enforcing the prohibition compared to areas more distant from the major urban populations.
We have developed a new state-of-the-art agricultural burning emissions inventory (VIIRS-IM/Him) for eastern China by combining fire radiative power (FRP) observations from the VIIRS and Himawari-8 sensors for the 2012–2015 period. While several other studies have also used satellite EO data to develop such inventories, they have all relied on MODIS fire products for their source observations. Such inventories include the global GFED and GFAS inventories, as well as several Chinese regional studies (e.g. Huang et al., 2012; Liu et al., 2015). MODIS fire products are known to show very high omission rates in environments dominated by small agricultural fires (Randerson et al., 2012; Zhang et al., 2017, 2018), but the “small-fire-optimised” VIIRS-IM product of Zhang et al. (2017) used in this study detects far more of the fire activity across eastern China and on average shows FRP totals around 4 times higher than those of the MODIS AF products. To convert the twice-daily VIIRS-IM FRP product information to daily time-integrated FRE, we have used new diurnal fire cycle data from Himawari-8, a geostationary satellite positioned over East Asia that can best capture the specific diurnal fire variability of the agricultural burning regions.
Our final VIIRS/Him agricultural fire emissions inventory reports dry matter burned (DMB) totals around 2–5 times higher than reported by the GFAS and GFED 4.1s in eastern China for corresponding time periods. The use of a crop rotation map allowed our VIIRS-IM/Him fire and emissions outputs to be disaggregated by individual crop types, and we found wheat residue burning to be the primary agricultural emission source, accounting for over 50 % of the total emissions each year for all investigated smoke constituents (CO2, CO, PM2.5, and black carbon). A strong seasonal variation in fire activity and emissions is seen, with annual peak activity occurring in summer (May–June) as a result of wheat residue burning and a smaller secondary activity peak occurring in autumn (September–October) as a result of corn and rice residue burning. Furthermore, we discovered a new winter (November–December) agricultural residue burning season. As no crop harvesting occurs during winter, we suspect that this fire activity results from farmers burning previously stored residues from the autumn harvest in winter, after autumn residue burning prohibitions have been lifted. This theory is supported by our observation of statistically distinct spatial burning patterns in the autumn and winter seasons; the majority of autumn burning occurs at a greater distance from provincial capitals than the winter burning does. This may reflect stronger enforcement of autumn residue burning prohibition measures in close proximity to major urban population centres than in rural locations. Farmers in areas with stronger prohibition enforcement (typically closer to urban areas) then burn their agricultural residue in winter.
Detailed comparison to existing inventories showed that our VIIRS-IM/Him annual emissions totals are 1.2–4.7 times greater than those reported by the GFAS and 0.5–1.7 times those reported by GFED4.1s, with some interspecies variability due to the use of different emissions factors between the inventories. By contrast, the VIIRS-IM/Him inventory shows emissions totals that are on average lower than those from emission inventories derived using crop-yield-based approaches (CYBAs) by a factor of 2–5. This discrepancy is believed to be primarily due to many CYBAs using outdated and/or inappropriate burning ratios that consequently lead to CYBAs overestimating the amount of crop residue DMB annually. Back-calculated burning ratios from the VIIRS-IM/Him data suggest that burning ratios for rice and corn are much lower than the CYBA literature suggests (approx. 0.9 %–2.3 % rather than 11 %–33 %). We also noted considerable interprovincial and interannual variation in these back-calculated burning ratios; for example, wheat burning ratios significantly decrease over our 4-year study period. This strongly suggests that high-spatial-resolution, up-to-date burning ratios should always be used in CYBAs for agricultural burning fire emission estimation. Furthermore, several CYBAs (e.g. Sun et al., 2016; Zhao et al., 2015) have derived burning ratios from provincial GDP data, assuming a positive relationship between these variables (Cao et al., 2006). However, we found evidence of an opposite (i.e. negative) relationship between provincial GDP and the amount of DMB in agricultural fires, hypothesised to be due to the higher cost of the disposal of crop residues by non-biomass-burning methods. This suggests that great care needs to be taken when deriving burning ratios for use in future agricultural emissions inventories based upon CYBA methods and that satellite remote sensing approaches based on EO datasets that adequately detect the presence of agricultural fires are a far better approach to fire emissions estimation in such environments.
Data from the Gridded Daily Agricultural Burning Emission Inventory of Eastern China are available from the Centre for Environmental Data Analysis (https://doi.org/10.5285/1d70803fab8f46ba983b730ede52421f; Zhang et al., 2020).
The supplement related to this article is available online at: https://doi.org/10.5194/acp-20-10687-2020-supplement.
TZ, MCdJ, and MJW designed the experiment. TZ conducted the experiment. WX provided Himawari-8 data and supported the data analysis. TZ and LW conducted the validation. TZ drafted the paper. MCdJ and MJW helped with editing and finalising the paper.
The authors declare that they have no conflict of interest.
The VIIRS SDR and MODIS data were retrieved from CLASS and Reverb, and they are courtesy of the NASA EOSDIS LP DAAC and USGS EROS Center, South Dakota. GFAS data were generated using Copernicus Atmosphere Monitoring Service Information, operated by the ECMWF. All data storage and processing were conducted using JASMIN, the UK's collaborative data analysis environment (Lawrence et al., 2013; http://jasmin.ac.uk, last access: 29 August 2020).
This work has been supported by the Natural Environment Research Council (NERC) National Centre for Earth Observation (grant no. NE/R000115/1), specifically by NERC grant no. NE/M017729/1. Support for this research came partly from NERC National Capability funding to the UK's National Centre for Earth Observation (grant no. NE/Ro16518/1) and to the Leverhulme Centre for Wildfires, Environment and Society through the Leverhulme Trust (grant no. RC-2018-023). Lili Wang’s work was supported by the National Natural Science Foundation of China (grant no. 41775162).
This paper was edited by Ilse Aben and reviewed by two anonymous referees.
Andela, N., Kaiser, J. W., van der Werf, G. R., and Wooster, M. J.: New fire diurnal cycle characterizations to improve fire radiative energy assessments made from MODIS observations, Atmos. Chem. Phys., 15, 8831–8846, https://doi.org/10.5194/acp-15-8831-2015, 2015.
Andreae, M. O. and Merlet, P.: Emission of trace gases and aerosols from biomass burning, Global Biogeochem. Cy., 15, 955–966, 2001.
Bond, T. C., Doherty, S. J., Fahey, D., Forster, P., Berntsen, T., DeAngelo, B., Flanner, M., Ghan, S., Kärcher, B., and Koch, D.: Bounding the role of black carbon in the climate system: A scientific assessment, J. Geophys. Res.-Atmos., 118, 5380–5552, 2013.
Cao, G., Zhang, X., and Zheng, F. : Inventory of black carbon and organic carbon emissions from China, Atmos. Environ., 40, 6516–6527, 2006.
Chan, C. K. and Yao, X.: Air pollution in mega cities in China, Atmos. Environ., 42, 1–42, 2008.
Cheng, Y., Engling, G., He, K.-B., Duan, F.-K., Ma, Y.-L., Du, Z.-Y., Liu, J.-M., Zheng, M., and Weber, R. J.: Biomass burning contribution to Beijing aerosol, Atmos. Chem. Phys., 13, 7765–7781, https://doi.org/10.5194/acp-13-7765-2013, 2013.
Chen, J., Chen, J., Liao, A., Cao, X., Chen, L., Chen, X., He, C., Han, G., Peng, S., Lu, M., Zhang, W., Tong, X., and Mills, J.: Global land cover mapping at 30m resolution: A POK-based operational approach, ISPRS J. Photogramm. Remote Sens., Global Land Cover Mapping and Monitoring, 103, 7–27, https://doi.org/10.1016/j.isprsjprs.2014.09.002, 2015.
Chen, J., Li, C., Ristovski, Z., Milic, A., Gu, Y., Islam, M. S., Wang, S., Hao, J., Zhang, H., He, C., and Guo, H.: A review of biomass burning: Emissions and impacts on air quality, health and climate in China, Sci. Total Environ., 579, 1000–1034, https://doi.org/10.1016/j.scitotenv.2016.11.025, 2017.
Du, H., Kong, L., Cheng, T., Chen, J., Du, J., Li, L., Xia, X., Leng, C., and Huang, G.: Insights into summertime haze pollution events over Shanghai based on online water-soluble ionic composition of aerosols, Atmos. Environ., 45, 5131–5137, 2011.
Ellicott, E., Vermote, E., Giglio, L., and Roberts, G.: Estimating biomass consumed from fire using MODIS FRE, Geophys. Res. Lett., 36, L13401, https://doi.org/10.1029/2009gl038581, 2009.
Freeborn, P. H., Wooster, M. J., Hao, W. M., Ryan, C. A., Nordgren, B. L., Baker, S. P., and Ichoku, C.: Relationships between energy release, fuel mass loss, and trace gas and aerosol emissions during laboratory biomass fires, J. Geophys. Res.-Atmos., 113, D01301, https://doi.org/10.1029/2007JD008679, 2008.
Fu, J. Y., Jiang, D., and Huang, Y. H.: 1-km grid population dataset of China, Global Change Research Data Publishing & Repository, https://doi.org/10.3974/geodb.2014.01.06.V1, 2014a.
Fu, J. Y., Jiang, D., and Huang, Y. H.: 1-km grid GDP dataset of China, Global Change Research Data Publishing & Repository, https://doi.org/10.3974/geodb.2014.01.07.V1, 2014b.
Gao, X., Ma, W., Ma, C., Zhang, F., and Wang, Y.: Analysis of the current status of utilization of crop straw in China, Journal of Huazhong Agricultural University 21, 242–247, https://doi.org/10.1016/j.jnoncrysol.2008.05.013, 2002 (in Chinese).
Giglio, L., Csiszar, I., and Justice, C: Global distribution and seasonality of active fires as observed with the Terra and Aqua Moderate Resolution Imaging Spectroradiometer (MODIS) sensors, J. Geophys. Res., 111, G02016, https://doi.org/10.1029/2005JG000142, 2006.
Giglio, L., Randerson, J. T., and Werf, G. R.: Analysis of daily, monthly, and annual burned area using the fourth-generation global fire emissions database (GFED4), J. Geophys. Res.-Biogeo., 118, 317–328, 2013.
Giglio, L., Descloitres, J., Justice, C. O., and Kaufman, Y. J.: An enhanced contextual fire detection algorithm for MODIS, Remote Sens. Environ., 87, pp. 273–282, https://doi.org/10.1016/S0034-4257(03)00184-6, 2003.
Giglio, L., Loboda, T., Roy, D. P., Quayle, B., and Justice, C. O.: An active-fire based burned area mapping algorithm for the MODIS sensor, Remote Sens. Environ., 113, pp. 408–420, https://doi.org/10.1016/j.rse.2008.10.006, 2009.
Goldberg, M. D., Kilcoyne, H., Cikanek, H., and Mehta, A.: Joint Polar Satellite System: The United States next generation civilian polar-orbiting environmental satellite system, J. Geophys. Res.-Atmos., 118, 13463–13475, https://doi.org/10.1002/2013JD020389, 2013.
He, M., Zheng, J., Yin, S., and Zhang, Y.: Trends, temporal and spatial characteristics, and uncertainties in biomass burning emissions in the Pearl River Delta, China, Atmos. Environ., 45, 4051–4059, 2011.
Huang, X., Li, M., Li, J., and Song, Y.: A high-resolution emission inventory of crop burning in fields in China based on MODIS Thermal Anomalies/Fire products, Atmos. Environ., 50, 9–15, 2012.
Jiang, D., Zhuang, D., Fu, J., Huang, Y., and Wen, K.: Bioenergy potential from crop residues in China: Availability and distribution, Renew. Sust. Energ. Rev., 16, 1377–1382, 2012.
Kaiser, J. W., Heil, A., Andreae, M. O., Benedetti, A., Chubarova, N., Jones, L., Morcrette, J.-J., Razinger, M., Schultz, M. G., Suttie, M., and van der Werf, G. R.: Biomass burning emissions estimated with a global fire assimilation system based on observed fire radiative power, Biogeosciences, 9, 527–554, https://doi.org/10.5194/bg-9-527-2012, 2012.
Li, W. J., Shao, L. Y., and Buseck, P. R.: Haze types in Beijing and the influence of agricultural biomass burning, Atmos. Chem. Phys., 10, 8119–8130, https://doi.org/10.5194/acp-10-8119-2010, 2010.
Li, J. F. and Hu, Y. S.: Analysis on investment and operation of straw-fired power plants in Jiangsu province, Electric Power Technologic Economics, 5, p. 005, 2009 (in Chinese).
Li, J., Li, Y., Bo, Y., and Xie, S.: High-resolution historical emission inventories of crop residue burning in fields in China for the period 1990–2013, Atmos. Environ., 138, 152–161, 2016.
Li, M., Zhang, Q., Kurokawa, J.-I., Woo, J.-H., He, K., Lu, Z., Ohara, T., Song, Y., Streets, D. G., Carmichael, G. R., Cheng, Y., Hong, C., Huo, H., Jiang, X., Kang, S., Liu, F., Su, H., and Zheng, B.: MIX: a mosaic Asian anthropogenic emission inventory under the international collaboration framework of the MICS-Asia and HTAP, Atmos. Chem. Phys., 17, 935–963, https://doi.org/10.5194/acp-17-935-2017, 2017.
Liu, M., Song, Y., Yao, H., Kang, Y., Li, M., Huang, X., and Hu, M.: Estimating emissions from agricultural fires in the North China Plain based on MODIS fire radiative power, Atmos. Environ., 112, 326–334, 2015.
Liu, H., Jiang, G. M., Zhuang, H. Y., and Wang, K. J.: Distribution, utilization structure and potential of biomass resources in rural China: With special references of crop residues, Renew. Sust. Energ. Rev., 12, 1402–1418, 2008.
NBSC (National Bureau of Statistic of China) China Statistical Yearbook, 480 2003–2015, China Statistics Press, Beijing (2004–2016), 2016 (in Chinese).
Portmann, F. T., Siebert, S., and Döll, P.: MIRCA2000 – Global monthly irrigated and rainfed crop areas around the year 2000: A new high-resolution data set for agricultural and hydrological modeling, Global Biogeochem. Cy., 24, https://doi.org/10.1029/2008gb003435, 2010.
Qin, Y. and Xie, S. D.: Historical estimation of carbonaceous aerosol emissions from biomass open burning in China for the period 1990–2005, Environ. Pollut., 159, 3316–3323, https://doi.org/10.1016/j.envpol.2011.08.042, 2011.
Qiu, X., Duan, L., Chai, F., Wang, S., Yu, Q., and Wang, S.: Deriving high-resolution emission inventory of OBB in China based on satellite observations, Environ. Sci. Technol., 50, 11779, https://doi.org/10.1021/acs.est.6b02705, 2016.
Randerson, J., Chen, Y., Werf, G., Rogers, B., and Morton, D.: Global burned area and biomass burning emissions from small fires, J. Geophys. Res.-Biogeo., 117, 2005–2012, 2012.
Roberts, G., Wooster, M. J., and Lagoudakis, E.: Annual and diurnal african biomass burning temporal dynamics, Biogeosciences, 6, 849–866, https://doi.org/10.5194/bg-6-849-2009, 2009.
Roberts, G., Wooster, M. J., Xu, W., Freeborn, P. H., Morcrette, J.-J., Jones, L., Benedetti, A., Jiangping, H., Fisher, D., and Kaiser, J. W.: LSA SAF Meteosat FRP products – Part 2: Evaluation and demonstration for use in the Copernicus Atmosphere Monitoring Service (CAMS), Atmos. Chem. Phys., 15, 13241–13267, https://doi.org/10.5194/acp-15-13241-2015, 2015.
Schroeder, W., Oliva, P., Giglio, L., and Csiszar, I. A.: The New VIIRS 375 m active fire detection data product: Algorithm description and initial assessment, Remote Sens. Environ., 143, 85–96, https://doi.org/10.1016/j.rse.2013.12.008, 2014.
Streets, D. G., Yarber, K. F., Woo, J. H., and Carmichael, G. R.: Biomass burning in Asia: Annual and seasonal estimates and atmospheric emissions, Global Biogeochem. Cy., 17, https://doi.org/10.1029/2003GB002040, 2003.
Sun, J., Peng, H., Chen, J., Wang, X., Wei, M., Li, W., Yang, L., Zhang, Q., Wang, W., and Mellouki, A.: An estimation of CO2 emission via agricultural crop residue open field burning in China from 1996 to 2013, J. Clean. Prod., 112, https://doi.org/10.1016/j.jclepro.2015.09.112, 2016.
van der Werf, G. R., Randerson, J. T., Giglio, L., Collatz, G. J., Mu, M., Kasibhatla, P. S., Morton, D. C., DeFries, R. S., Jin, Y., and van Leeuwen, T. T.: Global fire emissions and the contribution of deforestation, savanna, forest, agricultural, and peat fires (1997–2009), Atmos. Chem. Phys., 10, 11707–11735, https://doi.org/10.5194/acp-10-11707-2010, 2010.
van der Werf, G. R., Randerson, J. T., Giglio, L., van Leeuwen, T. T., Chen, Y., Rogers, B. M., Mu, M., van Marle, M. J. E., Morton, D. C., Collatz, G. J., Yokelson, R. J., and Kasibhatla, P. S.: Global fire emissions estimates during 1997–2016, Earth Syst. Sci. Data, 9, 697–720, https://doi.org/10.5194/essd-9-697-2017, 2017.
Wang, C. and Zhang, S.: A fine of up to 1000 RMB per incident of crop residue burning in Chengdu, available at: http://news.chengdu.cn/2016/1106/1829718.shtml (last access: 5 August 2020), Chengdu Business Daily, 2016.
Wang, S. and Zhang, C.: Spatial and temporal distribution of air pollutant emissions from open burning of crop residues in China, Sciencepaper online, 3, 329–333, 2008.
Wolfe, R. E., Lin, G., Nishihama, M., Tewari, K. P., Tilton, J. C., and Isaacman, A. R.: Suomi NPP VIIRS prelaunch and on-orbit geometric calibration and characterization, J. Geophys. Res.-Atmos., 118(20), 11–508, 2013.
Wooster, M. J., Roberts, G., Perry, G. L. W., and Kaufman, Y. J.: Retrieval of biomass combustion rates and totals from fire radiative power observations: FRP derivation and calibration relationships between biomass consumption and fire radiative energy release, J. Geophys. Res.-Atmos., 110, D24311, https://doi.org/10.1029/2005JD006318, 2005.
World Health Organization (WHO): Regional Office for Europe, Air quality guidelines global update 2005: particulate matter, ozone, nitrogen dioxide and sulfur dioxide, Copenhagen: WHO Regional Office for Europe, available at: https://apps.who.int/iris/handle/10665/107823 (last access: 5 August 2020), 2006.
Xu, W., Wooster, M. J., Kaneko, T., He, J., Zhang, T., and Fisher, D.: Major advances in geostationary fire radiative power (FRP) retrieval over Asia and Australia stemming from use of Himarawi-8 AHI, Remote Sens. Environ., 193, 138–149, 2017.
Yamaji, K., Li, J., Uno, I., Kanaya, Y., Irie, H., Takigawa, M., Komazaki, Y., Pochanart, P., Liu, Y., Tanimoto, H., Ohara, T., Yan, X., Wang, Z., and Akimoto, H.: Impact of open crop residual burning on air quality over Central Eastern China during the Mount Tai Experiment 2006 (MTX2006), Atmos. Chem. Phys., 10, 7353–7368, https://doi.org/10.5194/acp-10-7353-2010, 2010.
Yan, X., Ohara, T., and Akimoto, H.: Bottom-up estimate of biomass burning in mainland China, Atmos. Environ., 40, 5262–5273, 2006.
Yang, S., He, H., Lu, S., Chen, D., and Zhu, J.: Quantification of crop residue burning in the field and its influence on ambient air quality in Suqian, China, Atmos. Environ., 42, 1961–1969, 2008.
Za, Y.: Drone footage of huge smoke from crop residue burning in Hebei Province, available at: http://www.chinanews.com/sh/2015/11-04/7606112.shtml (last access: 5 August 2020), Legislative Evening Newspaper, 2015.
Zhang, H., Ye, X., Cheng, T., Chen, J., Yang, X., Wang, L., and Zhang, R.: A laboratory study of agricultural crop residue combustion in China: Emission factors and emission inventory, Atmos. Environ., 42, 8432–8441, 2008.
Zhang, L., Liu, Y., and Hao, L.: Contributions of open crop straw burning emissions to PM2.5 concentrations in China, Environ. Res. Lett., 11, 014014, https://doi.org/10.1088/1748-9326/11/1/014014, 2016.
Zhang, T., Wooster, M. J., Green, D. C., and Main, B.: New field-based agricultural biomass burning trace gas, PM2.5, and black carbon emission ratios and factors measured in situ at crop residue fires in Eastern China, Atmos. Environ., 121, 22–34, https://doi.org/10.1016/j.atmosenv.2015.05.010, 2015.
Zhang, T., Wooster, M. J., and Xu, W.: Approaches for synergistically exploiting VIIRS I-and M-Band data in regional active fire detection and FRP assessment: A demonstration with respect to agricultural residue burning in Eastern China, Remote Sens. Environ., 198, 407–424, 2017.
Zhang, T., Wooster, M., de Jong, M., and Xu, W.: How Well Does the “Small Fire Boost” Methodology Used within the GFED4. 1s Fire Emissions Database Represent the Timing, Location and Magnitude of Agricultural Burning?, Remote Sens., 10, p. 823, 2018.
Zhang, T., de Jong, M., Wooster, M., and Xu, W.: Gridded Daily Agricultural Burning Emission Inventory of Eastern China, 2012–2015, V0.0, Centre for Environmental Data Analysis, 26 August 2020, https://doi.org/10.5285/1d70803fab8f46ba983b730ede52421f, 2020.
Zhao, H., Tong, D. Q., Gao, C., and Wang, G.: Effect of dramatic land use change on gaseous pollutant emissions from biomass burning in North Eastern China, Atmos. Res., 153, 429–436, 2015.
Zhou, L., Divakarla, M., Liu, X., Layns, A., and Goldberg, M.: An Overview of the Science Performances and Calibration/Validation of Joint Polar Satellite System Operational Products, Remote Sens. 11, 698, https://doi.org/10.3390/rs11060698, 2019.
Zuo, S.: The most polluted day in Hefei this year: PM2.5 concentration raised 6 times in 5 hours, available at: http://www.chinanews.com/gn/2015/12-11/7666514.shtml (last access: 5 August 2020), Anhui News, 2015.