the Creative Commons Attribution 4.0 License.
the Creative Commons Attribution 4.0 License.
 | 10 Sep 2020
Model Inter-Comparison Study for Asia (MICS-Asia) phase III: multimodel comparison of reactive nitrogen deposition over China
Syuichi Itahashi
Keiichi Sato
Danhui Xu
Junhua Wang
Fan Fan
Qixin Tan
Joshua S. Fu
Xuemei Wang
Kazuyo Yamaji
Tatsuya Nagashima
Jie Li
Mizuo Kajino
Hong Liao
Meigen Zhang
Jung-Hun Woo
Junichi Kurokawa
Yuepeng Pan
Qizhong Wu
Xuejun Liu
Zifa Wang
Atmospheric nitrogen deposition in China has attracted public attention in recent years due to the increasing anthropogenic emission of reactive nitrogen (Nr) and its impacts on the terrestrial and aquatic ecosystems. However, limited long-term and multisite measurements have restrained the understanding of the mechanism of the Nr deposition and the chemical transport model (CTM) improvement. In this study, the performance of the simulated wet and dry deposition for different Nr species, i.e., particulate and , gaseous NOx, HNO3 and NH3 have been conducted using the framework of Model Inter-Comparison Study for Asia (MICS-Asia) phase III. A total of nine models, including five Weather Research and Forecasting models coupled with the Community Multiscale Air Quality (WRF-CMAQ) models, two self-developed regional models, a global model and a Regional Atmospheric Modeling System coupled with the Community Multiscale Air Quality (RAMS-CMAQ) model have been selected for the comparison. For wet deposition, observation data from 83 measurement sites from the East Asia Acid Deposition Monitoring Network (EANET), Chinese Ecosystem Research Network (CERN), China Agricultural University Deposition Network (CAUDN), National Acid Deposition Monitoring Network (NADMN) and Department of Ecological Environment (DEE) of China have been collected and normalized for comparison with model results. In general, most models show the consistent spatial and temporal variation of both oxidized N (Nox) and reduced N (Nrd) wet deposition in China, with the normalized mean error (NME) at around 50 %, which is lower than the value of 70 % based on EANET observation over Asia. Both the ratio of wet or dry deposition to the total inorganic N (TIN) deposition and the ratios of TIN to their emissions have shown consistent results with the Nationwide Nitrogen Deposition Monitoring Network (NNDMN) estimates. The performance of ensemble results (ENMs) was further assessed with satellite measurements. In different regions of China, the results show that the simulated Nox wet deposition was overestimated in northeastern China (NE) but underestimated in the south of China, namely southeastern (SE) and southwestern (SW) China, while the Nrd wet deposition was underestimated in all regions by all models. The deposition of Nox has larger uncertainties than the Nrd, especially in northern China (NC), indicating the chemical reaction process is one of the most important factors affecting the model performance. Compared to the critical load (CL) value, the Nr deposition in NC, SE and SW reached or exceeded reported CL values and resulted in serious ecological impacts. The control of Nrd in NC and SW and Nox in SE would be an effective mitigation measure for TIN deposition in these regions. The Nr deposition in the Tibetan Plateau (TP) with a high ratio of TIN ∕ emission (∼3.0), indicates a significant transmission from outside. Efforts to reduce these transmissions ought to be paramount due the climatic importance of the Tibetan region to the sensitive ecosystems throughout China.
- Article
(12374 KB) - Full-text XML
-
Supplement
(4578 KB) - BibTeX
- EndNote


Atmospheric nitrogen (N) deposition is defined as N-related gases, and particles are deposited with precipitation occurring (wet deposition) and without precipitation occurring (dry deposition; Clark and Kremer, 2005). These deposits on the Earth's surface are either close to the sources or in remote regions (e.g., chemical transformation and long-range transport of oxidized and reduced N; hereafter Nox and Nrd) located far from human activities and labeled as the N-limited areas (Phoenix et al., 2006; Holtgrieve et al., 2011). Evidence shows that the effects of reactive N () deposition on the environment are numerous, including decreased biological diversity, increased soil acidification and lake eutrophication (Clark and Tilman, 2008; Janssens et al., 2010; Holtgrieve et al., 2011; Phoenix et al., 2006; Galloway et al., 2004). Different human activities disturb the natural N cycle in serious ways (Galloway et al., 2004); for example, using artificial fertilizers to increase crop production (Erisman et al., 2008) or excessively relying on fossil fuels for industrial production. Nr production increased from approximately 15 Tg N yr−1 in 1860 to 187 Tg N yr−1 in 2005, and more than 50 % of that Nr has reportedly been deposited onto the ground (Nicolas and Galloway, 2008). In the past two decades, high rates of Nr deposition were widely documented in developed countries, such as the USA (Fenn et al., 1998) and Europe (Dise and Wright, 1995). Great efforts have been made to fight against these negative effects in the USA, and the Nox deposition was decreased dramatically in recent years (Li et al., 2016). However, the growing human demand for food and energy on a global scale has resulted in increased emissions of Nr into the environment (Galloway et al., 2008), particularly in large developing countries like China and India (Chen et al., 2019a; Liu et al., 2013).
A nationwide estimate of long-term N deposition in China, based on the bulk measurements and summaries from reported references in 270 sites by Liu et al. (2013), showed an increasing rate of 0.41 kg N ha−1 per year from 1980 to 2010. In contrast to the increasing importance of Nrd deposition, due to apparently decreasing Nox resulting from the air quality control policies in the USA in the past decades (Li et al., 2016), the ratio of Nrd ∕ Nox recorded from bulk and/or wet deposition decreased from 5:1 in 1980 to 2:1 in 2010. This suggests a more and more important role of Nox in China (Liu et al., 2013). The ratio in highly developed regions, such as the North China Plain, was even lower than 1:1 in recent years (Pan et al., 2012). However, very limited long-term observations in China challenge our capacity to understand and control the increase in Nr deposition. The published long-term N deposition monitoring network, which includes the East Asia Acid Deposition Monitoring Network (EANET; http://www.eanet.asia, last access: 6 September 2020), the Nationwide Nitrogen Deposition Monitoring Network (NNDMN), established in 2010 by the China Agriculture University (CAU; Xu et al., 2015), the Chinese Ecosystem Research Network (CERN) in the North China Plain, established by the Chinese Academy of Science (Pan et al., 2012), the Acid Rain Monitoring Network, run by the China Meteorological Administration (CMA-ARMN; Tang et al., 2007, 2010; Ge et al., 2011), and the National Acid Deposition Monitoring Network (NADMN; Li et al., 2019b) have been identified with many shortcomings. Monitoring sites are widely spread over a large geographical area, and therefore data records, due to the high cost of the measurement and unstable financial support, are incomplete. Chemical transport model (CTM) simulation is another option to offset these drawbacks and also to quantify the long-range transport of deposition in a global or regional map (Seinfeld and Pandis, 2006). It is important to know the accuracy of the CTM before it is employed for investigating the spatial and temporal variation of the depositions. Hayami et al. (2008) and Mann et al. (2014) explain that different parameters in CTMs can result in large variations and the inaccuracies. The multimodel ensemble mean (ENM) shows better performance than any single model (Carmichael et al., 2002; Hayami et al., 2008; Holloway et al., 2008; Wang et al., 2008). Additionally, to better localize the applications of CTM, comprehensive evaluations of the strengths and weaknesses of current CTMs for simulating the acid deposition and their precursors in a unified framework, with certain regulated rules and the same inputs to models, must be undertaken.
The Model Inter-Comparison Study for Asia (MICS-Asia) provides an opportunity to investigate the CTM application with different models in Asia. MICS-Asia was first employed in 1998, with the target of long-range transport and deposition in in the first stage (MICS-Asia phase I; Carmichael et al., 2002) and sulfur, nitrogen and ozone in the second stage (MICS-Asia phase II; Carmichael et al., 2008). The findings and methodologies developed in the previous intercomparison studies contributed to common understandings of the performance and uncertainties of CTM applications in East Asia (Hayami et al., 2008; Carmichael et al., 2008; Han et al., 2008; Wang et al., 2008). The comprehensive multimodel intercomparison study on acid deposition in China is becoming an urgent issue as the high emissions in China are causing acid deposition in neighboring countries (Lin et al., 2008; Kajino et al., 2011, 2013; Itahashi et al., 2018). In this study, 1 year of simulated Nr depositions, i.e., Nox and Nrd in both wet and dry depositions, using the framework of MICS-Asia phase III, have been compared with each other and validated by the observed wet deposition from EANET, NNDMN, CERN and by the Department of Ecological Environment (DEE; formerly known as the Environmental Protection Administration – EPA) over the whole of China. The ENM results were also compared to the vertical column density (VCD) from satellite and emission inventories. Finally, the uncertainties of the sources of Nr depositions and their ecological impacts have been quantified. The results from this study will not only provide an important reference for establishing a suitable N deposition model, but the localized application of CTMs in China will also be tested.
2.1 Description of the participant models
In phase III of MICS-Asia, 14 chemical transport models (CTM; M1–M14) were used to compare and evaluate current multiscale air quality models (called topic 1 in MICS-Asia III). The same number index was used to measure aerosols and ozone levels, which was reported by Chen et al. (2019b) and Li et al. (2019a). However, the fully coupled online Weather Research and Forecasting model with chemistry (WRF-Chem), which has been indexed as M7–M10, was not included in the deposition comparison part in the overview of model intercomparison and evaluation for acid deposition in Asia (Itahashi et al., 2020). Briefly, the Weather Research and Forecasting model coupled with the Community Multiscale Air Quality (WRF-CMAQ) has been numbered M1–M6, with a different version of version 5.0.2 for M1 and M2, version 5.0.1 for M3 and version 4.7.1 for M4–M6. M11 and M12 are the independent models developed in Japan and China, namely a nonhydrostatic model coupled with chemistry (NHM-Chem; Kajino et al., 2019) and the Nested Air Quality Prediction Model System (NAQPMS), respectively. A global 3D chemical transport model (namely the Goddard Earth Observing System global chemical transport (GEOS-Chem) version 9.1.3), M13, was also used as the long-range transport and future change prediction model in MICS-Asia III. The last, M14, was represented as the Regional Atmospheric Modeling System coupled with CMAQ (RAMS-CMAQ). It should be noted that the last two models, M13 and M14, were not driven by the “standard” meteorological fields from the WRF version 3.4.1 model. Basic information about the configuration of each model is summarized in Table 1. More detailed descriptions can also be found in previous studies (Itahashi et al., 2020; Chen et al., 2019b; Li et al., 2019a).
Table 1Mechanism and parameterization of deposition part of MICS-Asia III. Note: v – version.
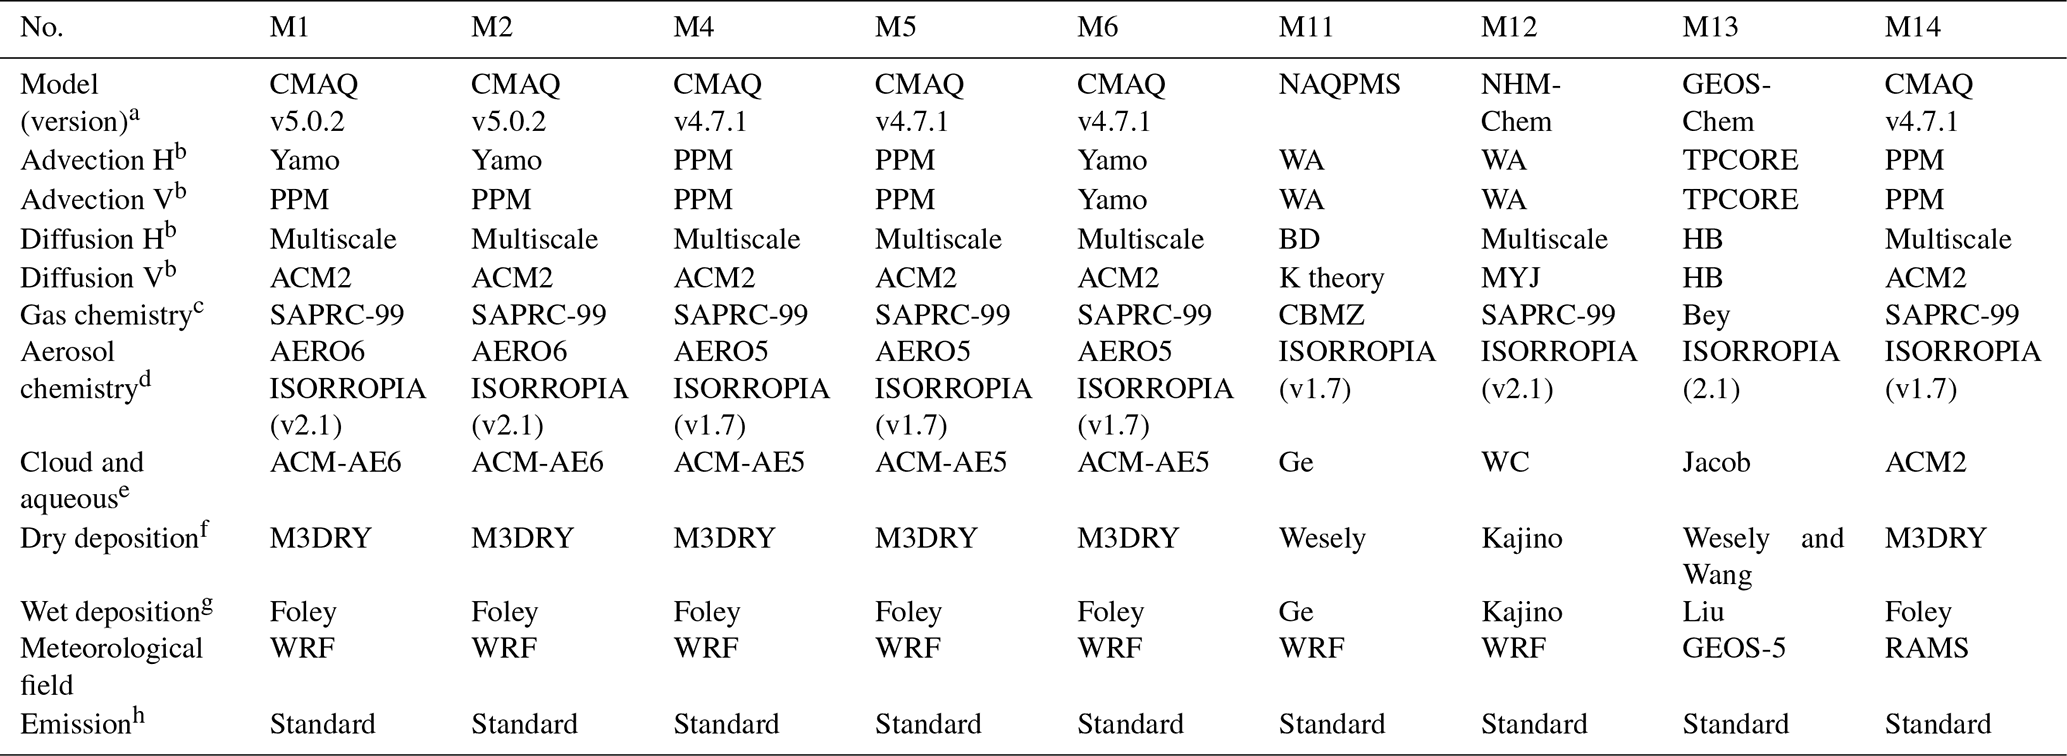
a References for the advection scheme are as follows: Yamo – Yamartino (1993); PPM – piecewise parabolic method (Colella and Woodward, 1984); WA – Walcek and Aleksic (1998); and TPCORE – Wang et al. (2004).
b References for the diffusion scheme are as follows: ACM2 – Asymmetric Convective Model version 2 (Pleim, 2007a,b); BD – Byun and Dennis (1995); HB – Holtslag and Boville (1993); Multiscale: Byun and Schere (2006); and MYJ – Janjic (1994).
c References for the gas-phase chemistry are as follows: Bey – Bey et al. (2001); CBMZ – Zaveri and Peters (1999); and SAPRC-99 – Carter (2000).
d References for the aerosol chemistry are as follows: ISORROPIA v2.1 – Fountoukis and Nenes (2007) and ISORROPIA v1.7 – Nenes et al. (1998).
e References for the cloud and aqueous are as follows: Ge – Ge et al. (2014); WC – Walcek (1986) and Carlton (2007); and Jacob – Jacob (2000). ACM-AE6 – Cloud-ACM-AE6 used in CMAQ v5.0.2, and ACM-AE5 – Cloud-ACM-AE5 used in CMAQ v4.7.1.
f References for the dry deposition scheme are as follows: M3DRY – Pleim et al. (2001); Kajino – Kajino et al. (2018); Wang – Wang et al. (2004); and Wesely – Wesely (1989).
g References for the wet deposition scheme are as follows: Foley – Foley et al. (2010); Ge – Ge et al. (2014); Kajino – Kajino et al. (2018); and Liu – Liu et al. (2001).
h The term “Standard” indicates the basic emission inventories in MICS-Asia phase III.
2.2 Model inputs and simulation domain
As mentioned by Chen et al. (2019b), the same (“standard”) meteorological fields, emission inventories and boundary conditions have been prepared for the CTM intercomparison in MICS-Asia III to reduce the uncertainties from model inputs. However, some models, such as M13 and M14, imported “nonstandard” inputs due to their specific characteristics. The “standard” meteorological inputs were simulated by WRF version 3.4.1, with the initial and lateral boundary conditions from the National Centers for Environmental Prediction (NCEP) Final Analysis (FNL) data. A 4D data assimilation (FDDA) nudging was adopted every 6 h to improve the accuracy of the meteorological parameters simulation. The assimilated meteorological fields from the Goddard Earth Observing System 5 (GEOS-5) of the US National Aeronautics and Space Administration (NASA; https://gmao.gsfc.nasa.gov, last access: 14 February 2020) were used to drive M13. The M14 model was driven by RAMS, with the same FNL data for nudging as the standard WRF simulation, which was developed by Pielke et al. (1992). For the emission inputs, all the participant models were using the same emission inventory, which included the MIX anthropogenic emissions over Asia developed for MICS-Asia phase III (Li et al., 2017), the biogenic emissions calculated by the Model of Emissions of Gases and Aerosols from Nature (MEGAN) version 2.04 (Guenther et al., 2006), and the biomass burning emissions from Global Fire Emission Database (GFED) version 3 (van der Werf et al., 2010). Additionally, SO2 emissions from volcanoes were collected from the Aerosol Comparisons between Observations and Models (AEROCOM) program (https://aerocom.met.no/DATA/download/emissions/AEROCOM_HC/volc, last access: 11 September 2019; Diehl et al., 2012; Stuefer et al., 2013). MICS-Asia phase III provided two sets of lateral boundary conditions derived from GEOS-Chem (Bey et al., 2001) and the CHASER chemical transport model (Sudo et al., 2002), respectively. The boundary conditions from GEOS-Chem were run with resolution and 47 vertical layers, while those from CHASER were run with and 32 vertical layers. M4, M5, M6, M11 and M12 used the output from CHASER as the boundary conditions, and M1, M13 and M14 were from GEOS-Chem. Only M2 used the default boundary condition field provided in CMAQ.
The standard simulation domain covers the region of East Asia (15.4∘ S–58.3∘ N, 48.5–160.2∘ E) with 180×170 grids at 45 km horizontal resolution. M1–M6, M11 and M12 followed standard simulation domains, while M13 and M14 employed different modeling domains with 0.5∘ latitude × 0.667∘ longitude and 64×64 km, respectively. In this study, the analyzed region was only focused in China, and all participant models covered it. Therefore, simulated reactive N deposition in each model can be analyzed and compared to show the performance of the participant models. All model outputs of N depositions have been classified as oxidized N (, including gaseous nitrate acid, NOx and particulate nitrate) and reduced N (, including gaseous ammonia and particulate ammonium) for comparison. Several previous studies have reported that the contributions of the other N species, e.g., PAN and isoprene nitrates to total N dry deposition, are less important than the inorganic N, e.g., HNO3 and NOx (Yuan et al., 2018; Wolfe et al., 2011). Thus, these organic N species were not included in this study.
2.3 Observation data
China has a large land mass – almost 5500 km from south to north (3.5–53.3∘ N) and 5200 km from west to east (75.5–135∘ E). It goes from coastal to inland and from a tropical climate to a frigid zone. Only eight sites located in Guangdong, Fujian, Sichuan and Shanxi in EANET were insufficient to show the real performance of CTMs in China. Besides the eight EANET sites, data from 83 sites recorded daily, weekly or yearly from the CERN (Pan et al., 2012), NNDMN (Xu et al., 2015; Liu et al., 2013) and DEE in Guangdong, Liaoning and Xinjiang province and Shanghai were employed in this study to compare the simulated wet deposition in MICS-Asia III in China. Figure 1 shows the location of the 83 measurement sites and the divided regions of the whole of China. There were 50 urban sites and 33 rural sites. More detailed information on each measurement site can also be found in Table S1 in the Supplement.

Figure 1Locations of the measurement sites and the distribution of the divided regions.
The daily wet deposition was measured by a wet-only sampler to collect precipitation samples during the rainfall events in EANET. Analysis methods for and were based on ion chromatography and checked by the ion balance and conductivity agreement. Detailed descriptions can be found in the source document (EANET, 2010). Daily rainwater samples at 10 sites located in the North China Plain were collected using a custom wet–dry automatic collector (APS-2B; Xianglan Scientific Instruments Co., Ltd., Changsha, China) in CERN. Inorganic N, including and , in the precipitation samples was measured using an ion chromatography system (model ICS-90; Dionex Corporation, Sunnyvale, CA, USA) and the standard laboratory procedure of the State Key Laboratory of Atmospheric Boundary Layer Physics and Atmospheric Chemistry (LAPC; Wang et al., 2012). The detection limit (DL) of N for this instrument was 5 µg L−1. A detailed description can be found in the research of Pan et al. (2012). The wet and/or bulk and deposition data from 25 sites of China Agricultural University Deposition Network (CAUDN), which was renamed as NNDMN in China in 2010, has been collected and reanalyzed as yearly data (Xu et al., 2015; Liu et al., 2013). At all monitoring sites, precipitation samples were collected using precipitation gauges (SDM6; Tianjin Weather Equipment Inc., China) located beside the DEnuder for Long-Term Atmospheric sampling (DELTA) systems (ca. 2m). After their collection, the samples were analyzed in CAU's laboratory, based on the standard laboratory procedure of CAU (Xu et al., 2015). Routine and wet depositions collected in each rainfall event at 40 sites were provided by the DEEs of Guangdong, Liaoning and Xinjiang provinces and Shanghai city. The analytical process was the same used in the laboratory procedure of the China National Environmental Monitoring Center (CNEMC).
The temporal resolutions of the wet deposition data are different from each other, i.e., daily in EANET and CERN, rainfall event collection in DEE and yearly in NNDMN. For the convenience of comparison, all data from daily or rainfall event collecting samples at each type of measurement site have been summarized and interpolated as monthly wet deposition data to compare with the monthly simulation in MICS-Asia III in this study, except for the yearly data provided by NNDMN. The VCD of NO2 from SCIAMACHY (http://www.temis.nl/airpollution, last access: 6 September 2020) and NH3 from the Infrared Atmospheric Sounding Interferometer (IASI; https://iasi.aeris-data.fr/nh3/, last access: 6 September 2020) have also been used for comparison with the total deposition and the emissions.
3.1 Validation of wet deposition
3.1.1 Yearly comparison and monthly variation of oxidized N
Yearly simulated wet deposition of Nox has been evaluated by observed nitrate wet deposition in 83 sites over China. Table 2 lists the statistical parameters of the simulated wet deposition of Nox compared with the observed data in rural and urban sites in China. For all sites, M1, M5 and M11 overestimated the yearly wet deposition of Nox with a normalized mean bias (NMB) of +30.3 %, +55.4 % and +67.2 %, respectively. M6, M12 and M13 simulated almost comparable results with a NMB of −6.8 %, +0.6 % and +0.1 %, respectively. M2, M4 and M14 underestimated the yearly wet deposition of Nox, with a NMB of −38.7 %, −10.7 % and −47.4 %, respectively. The NME was around 50 % with the highest being 82.2 % in M11, which is lower than that reported over East Asia with the value of 70 %, based on EANET observations by Itahashi et al. (2020). However, the correlation coefficient R was around 0.2−0.3 (n=83), which is lower than the East Asia comparison based on the EANET data (0.3−0.4, n=54; Itahashi et al., 2020). In order to eliminate influences from rainfall uncertainties (R=0.82), the volume weighted mean (VWM) concentration of Nox in precipitation has also been evaluated. In contrast to the low R value of the yearly wet deposition of Nox, the correlation R increased to almost 0.5 for the VWM concentrations. To judge the agreement between simulation and observation, the percentages within a factor of 2 (FAC2) have been calculated in this study. Approximately 50 % of model results corresponded within the percentages within FAC2. M1 and M13 showed better agreement with 60 % and 59 % within FAC2, while M2 and M14 showed only 36 % and 45 % agreement within FAC2. The ground surface measurement sites were divided into 49 urban sites and 34 rural sites, according to their location. Overall, all the models showed better performance with the R in 0.2−0.4 and FAC2 in 50 %−60 % in urban sites than that with R in 0.05−0.3 and FAC2 in 40 %−50 % in rural sites. This difference may not be due to the uncertainties in rainfall simulation, as the simulated VWM concentration of Nox in precipitation may eliminate the rainfall uncertainties and also shows better agreement in urban locations than that in rural sites (Table 2).
Table 2Statistical parameters of oxidized N deposition for urban, rural and whole China. Note: FAC2 – factor of 2.
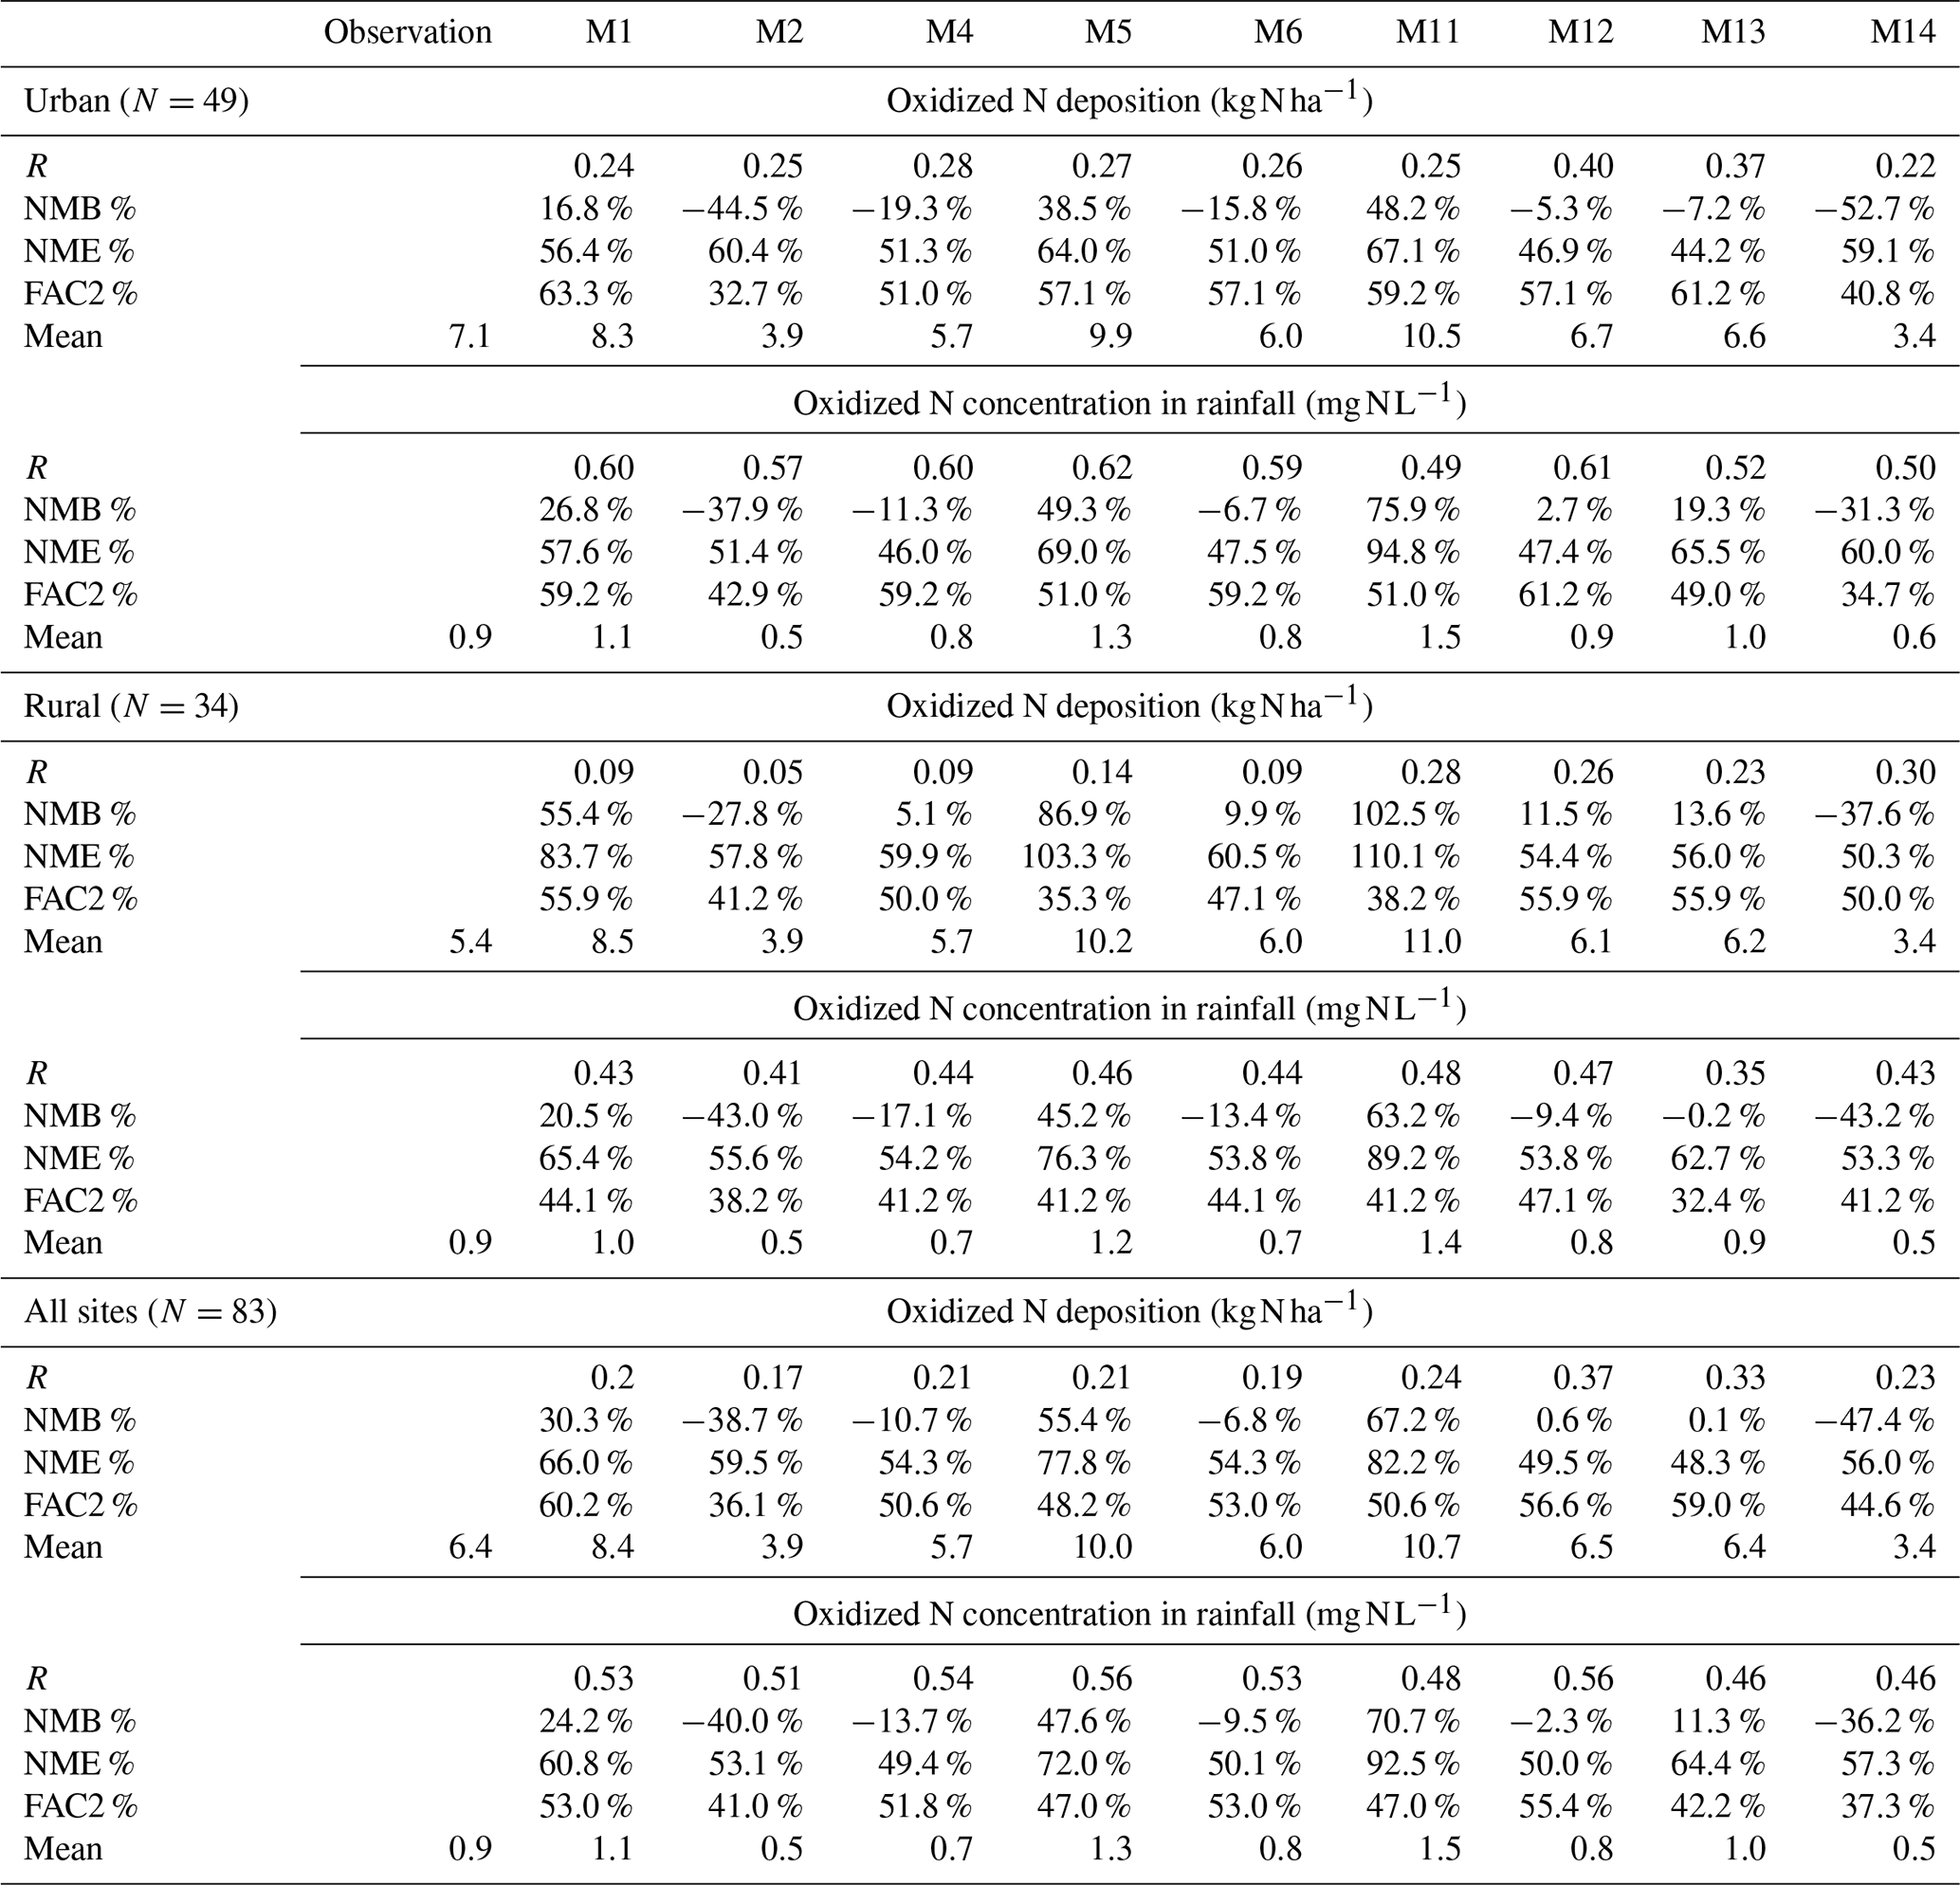
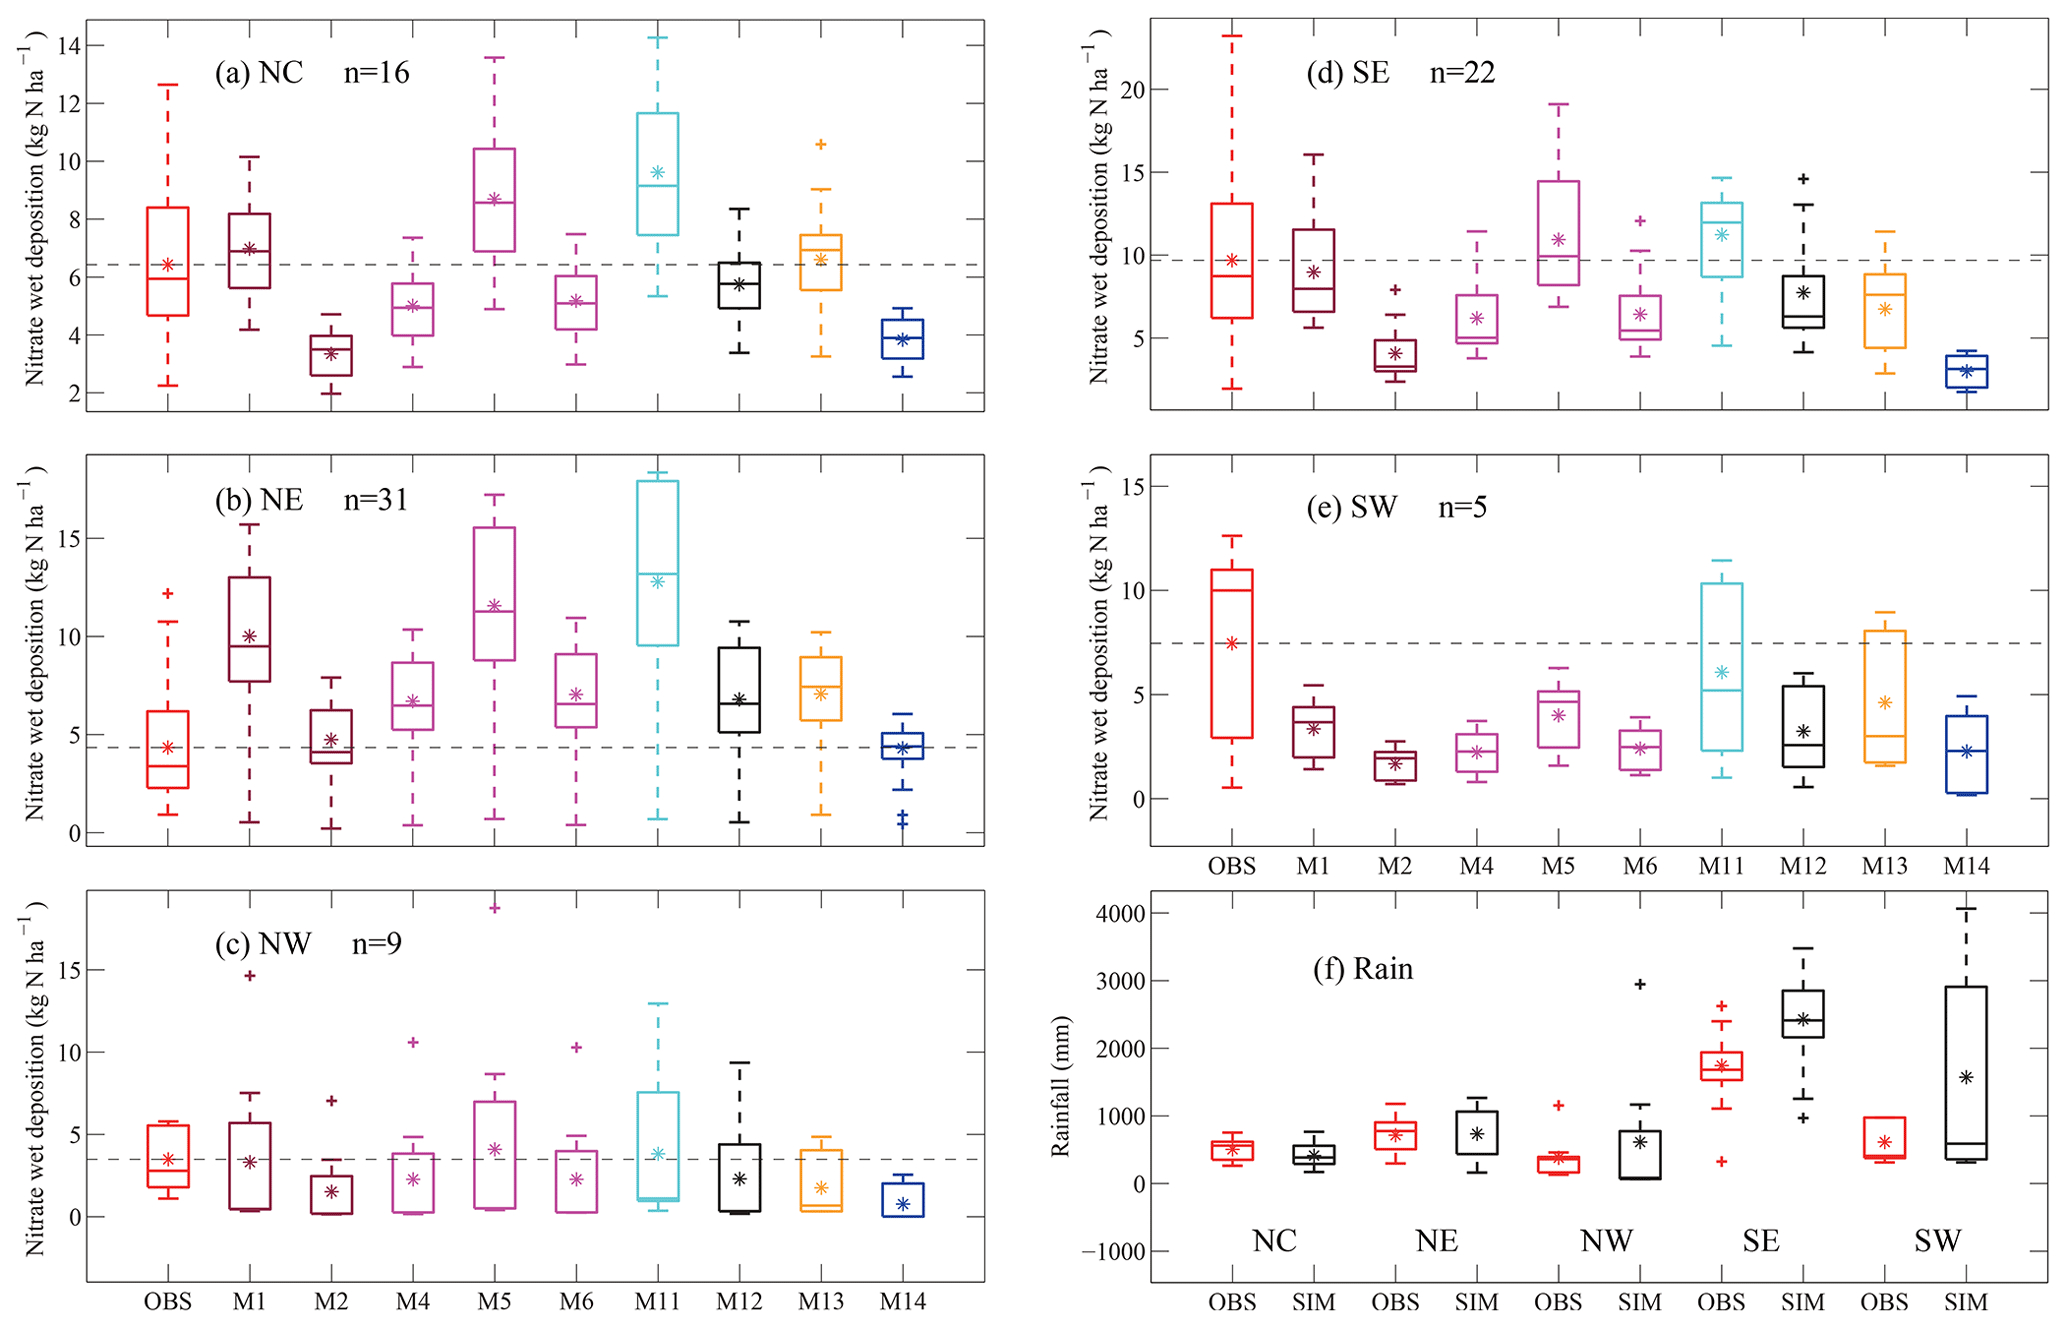
Figure 2Percentile boxplots of oxidized N wet deposition simulated in each model and compared with the observation and the rainfalls, with 99 % and 1 % represented by the high and low points, 90 % and 10 % represented by the top and bottom horizontal lines, 75 % and 25 % represented by the upper and lower edge of the box, and the asterisk and long horizontal line in the middle of the box representing the medium and mean value, respectively.
Figure 2 shows the percentile boxplot of the yearly wet deposition of Nox simulated by nine participant models in five regions of China (i.e., northern China – NC; northeastern China – NE; southeastern China – SE; northwestern China – NW; southwestern China – SW; and the Tibetan Plateau – TP). Site by site validation of both the yearly wet deposition and VWM concentration of Nox simulated by each model are also displayed in Fig. S1 in the Supplement. The model results show large intraregion or interregion uncertainties, especially in NC, NE and SE. The highest wet deposition of Nox simulated by M11 is almost 3–4 times the lowest result simulated by M14 in the above regions (Fig. 2). Specifically, two models simulate 30 %–50 % higher Nox wet deposition, while four models are 20 %–40 % lower compared to the averaged observations in NC, with the averaged value of 6.5 . For the wet deposition of Nox in SE and SW and TP, most of the participant models are more than 50 % underestimated, with the largest underestimation being 75 % from M14, even though the precipitation in this region is overestimated. Additionally, the divergence of observed Nox wet deposition between different sites in NC, SE and SW, which was shown as the length of the red box in Fig. 2a, d and e, is significantly larger than the multimodels' results. The scattered distribution of the measurement sites in these regions is responsible for the large divergence in observations. However, most of the participant models failed to capture the large difference, indicating that the coarse grid in MICS-Asia III (45 km) is not suitable for the performance of detailed characterization at a local scale. A global assessment of the ensemble simulated wet depositions in the Task Force on Hemispheric Transport of Atmospheric Pollutants (TF HTAP) by Vet et al. (2014) also indicated the underestimation of the models in a number of sites in North America, Europe, Central Africa and part of East Asia. The underprediction in Europe was found to be due to the large underpredictions of precipitation depth, while the reason for the error in East Asia is still unknown. However, most of the models overestimate the wet deposition of Nox in NE. Several models, including M1, M5 and M11, simulate more than 10 Nox wet deposition, almost double the observed value of 5 . Both the multimodels and the observations show very low values of 3–4 Nox wet deposition in NW, where the precipitation depth was very low compared to the other regions of China (Fig. S1 in the Supplement).
Regarding to the comparison over the whole of East Asia reported in the overview of acid deposition in MICS-Asia III (Itahashi et al., 2020), similar overestimations were found in M5 and M11, while there was underestimation in M2, M4 and M14. It should be noted that the EANET sites are mostly located around Japan, Korean Peninsula and southeastern Asia, and only eight sites are located in China. The similar performances between the validations in East Asia and China indicated that the general underestimation (overestimation) of M2, M4 and M14 (M5 and M11) were reliable in these models. For the rest of models, different results were found between China and East Asia, i.e., the simulated Nox wet deposition in M1 was significantly overestimated in China (Fig. 6 in Itahashi et al., 2020) but comparable with the observations over the rest of East Asia. Due to the absence of the observations for atmospheric NO2 ∕ , we cannot validate their model performances directly. Instead, another companion paper (Chen et al., 2019b) reported that most of the models overestimated concentrations based on 14 sites in China, with most sites located in NC (Fig. S5 in Chen et al., 2019b). In summary, the relationship between the atmospheric concentration of and the wet deposition in NC was not obvious, which is also same outcome as was found in East Asia (Itahashi, et al., 2020).
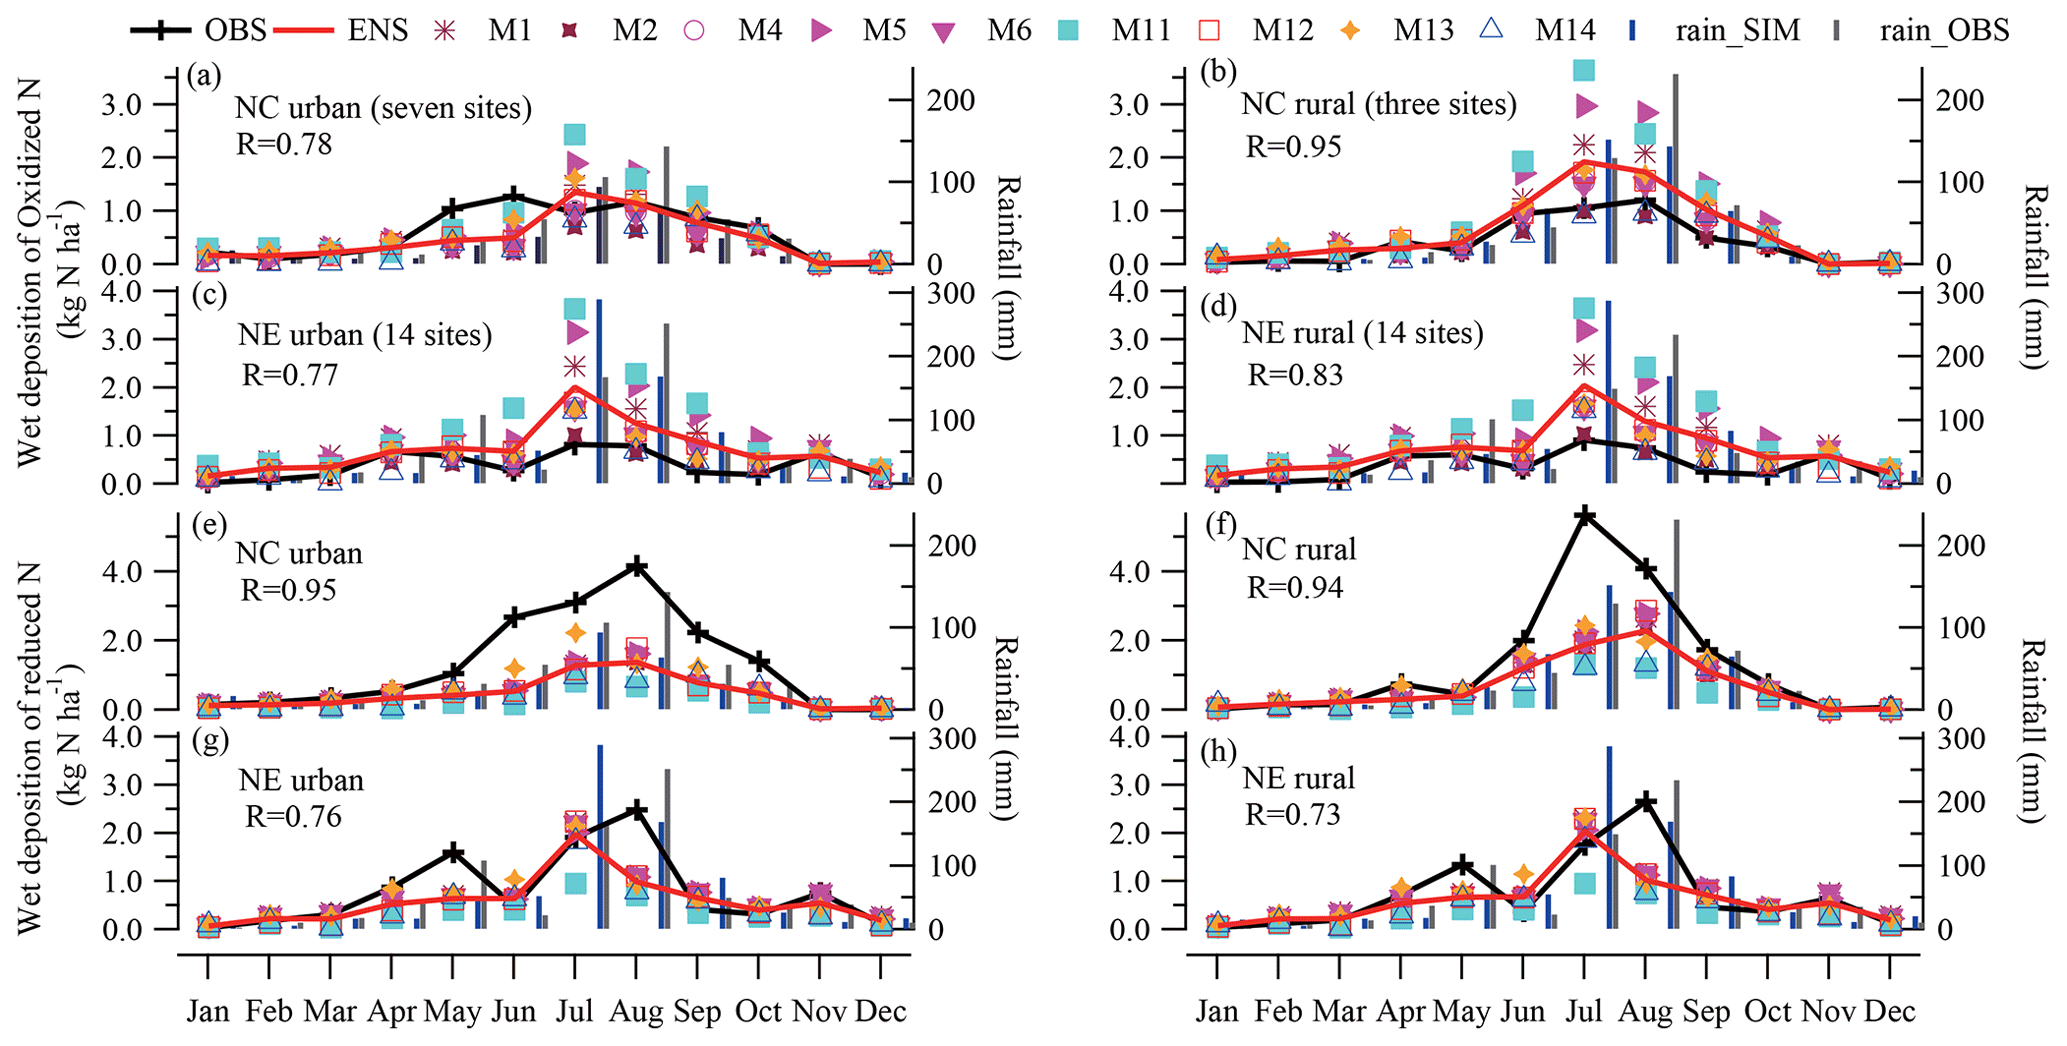
Figure 3Monthly variation of simulated wet deposition of oxidized N compared with the observations in urban sites (a) and rural sites (b) of northern China (NC) and urban sites (c) and rural sites (d) of northeastern China (NE). Monthly variation of reduced N in urban sites (e) and rural sites (f) of NC and reduced N in urban sites (g) and rural sites (h) of NE.
Further evaluations of the temporal variations in both the urban and rural sites of NC and NE are displayed in Fig. 3. Generally, all of the models and observations found high levels of depositions in spring and summer and low values in winter in the two regions. High depositions were due to large precipitation depths in the rainy season. However, this was not always true in some urban sites. For example, higher depositions of Nox were observed in May and June, with lower rainfall volume, than in July and August, with higher rainfall, in the urban sites of NC. Similar examples were found at urban sites in NE. Previous studies confirmed that there is a decreasing trend in the variations of chemical components in precipitation as rainfall varies (Aikawa and Hiraki, 2009; Aikawa et al., 2014; Xu et al., 2017). If the rainfall lasted long enough, or if the rainfall volume was large enough, the concentrations of chemical components in precipitation remained at low levels and were attributed to the effects of the in-cloud scavenging process. That is, the large rainfall in an event may not cause the high level of monthly wet depositions due to the low level of in-cloud deposition as compared to the wet depositions by several different precipitation events, especially in polluted regions in urban sites. Unfortunately, only the monthly data of wet depositions and precipitation have been compared in this MICS-Asia III. Detailed comparisons of rainfall events should be considered in the future.
3.1.2 Yearly comparison and monthly variation of reduced N
Simulated wet deposition of Nrd in MICS-Asia III has been evaluated using multisource observations from the same sites referred to in Nox. It is shown in Table 3 that all of the models underestimated the Nrd wet depositions, with the negative NMB in both urban and rural sites. Although little difference between rural and urban sites was found in M11 and M14, a better performance in rural areas was manifested by lower NMB and higher FAC2 in rural sites than the urban sites in most of models (−13.6 % to −23.2 % versus −37.3 % to −45.6 % for NMB and 55.9 %–70.6 % versus 42.9 %–55.1 % for FAC2, except M11 and M14). The underestimation of the simulated Nrd wet depositions was also found in the VWM concentration of Nrd in precipitation with similar NMB and FAC2. However, compared with the wet deposition, the correlation between the simulated and observed Nrd VWM concentration in precipitation was significant, with the R increasing from ∼0.3 to ∼0.8, which was similar to that shown in Nox. This indicates that the simulated VWM concentration of Nrd in precipitation by MICS-Asia III has a better performance in the spatial variation than the simulation of Nrd wet deposition over China.
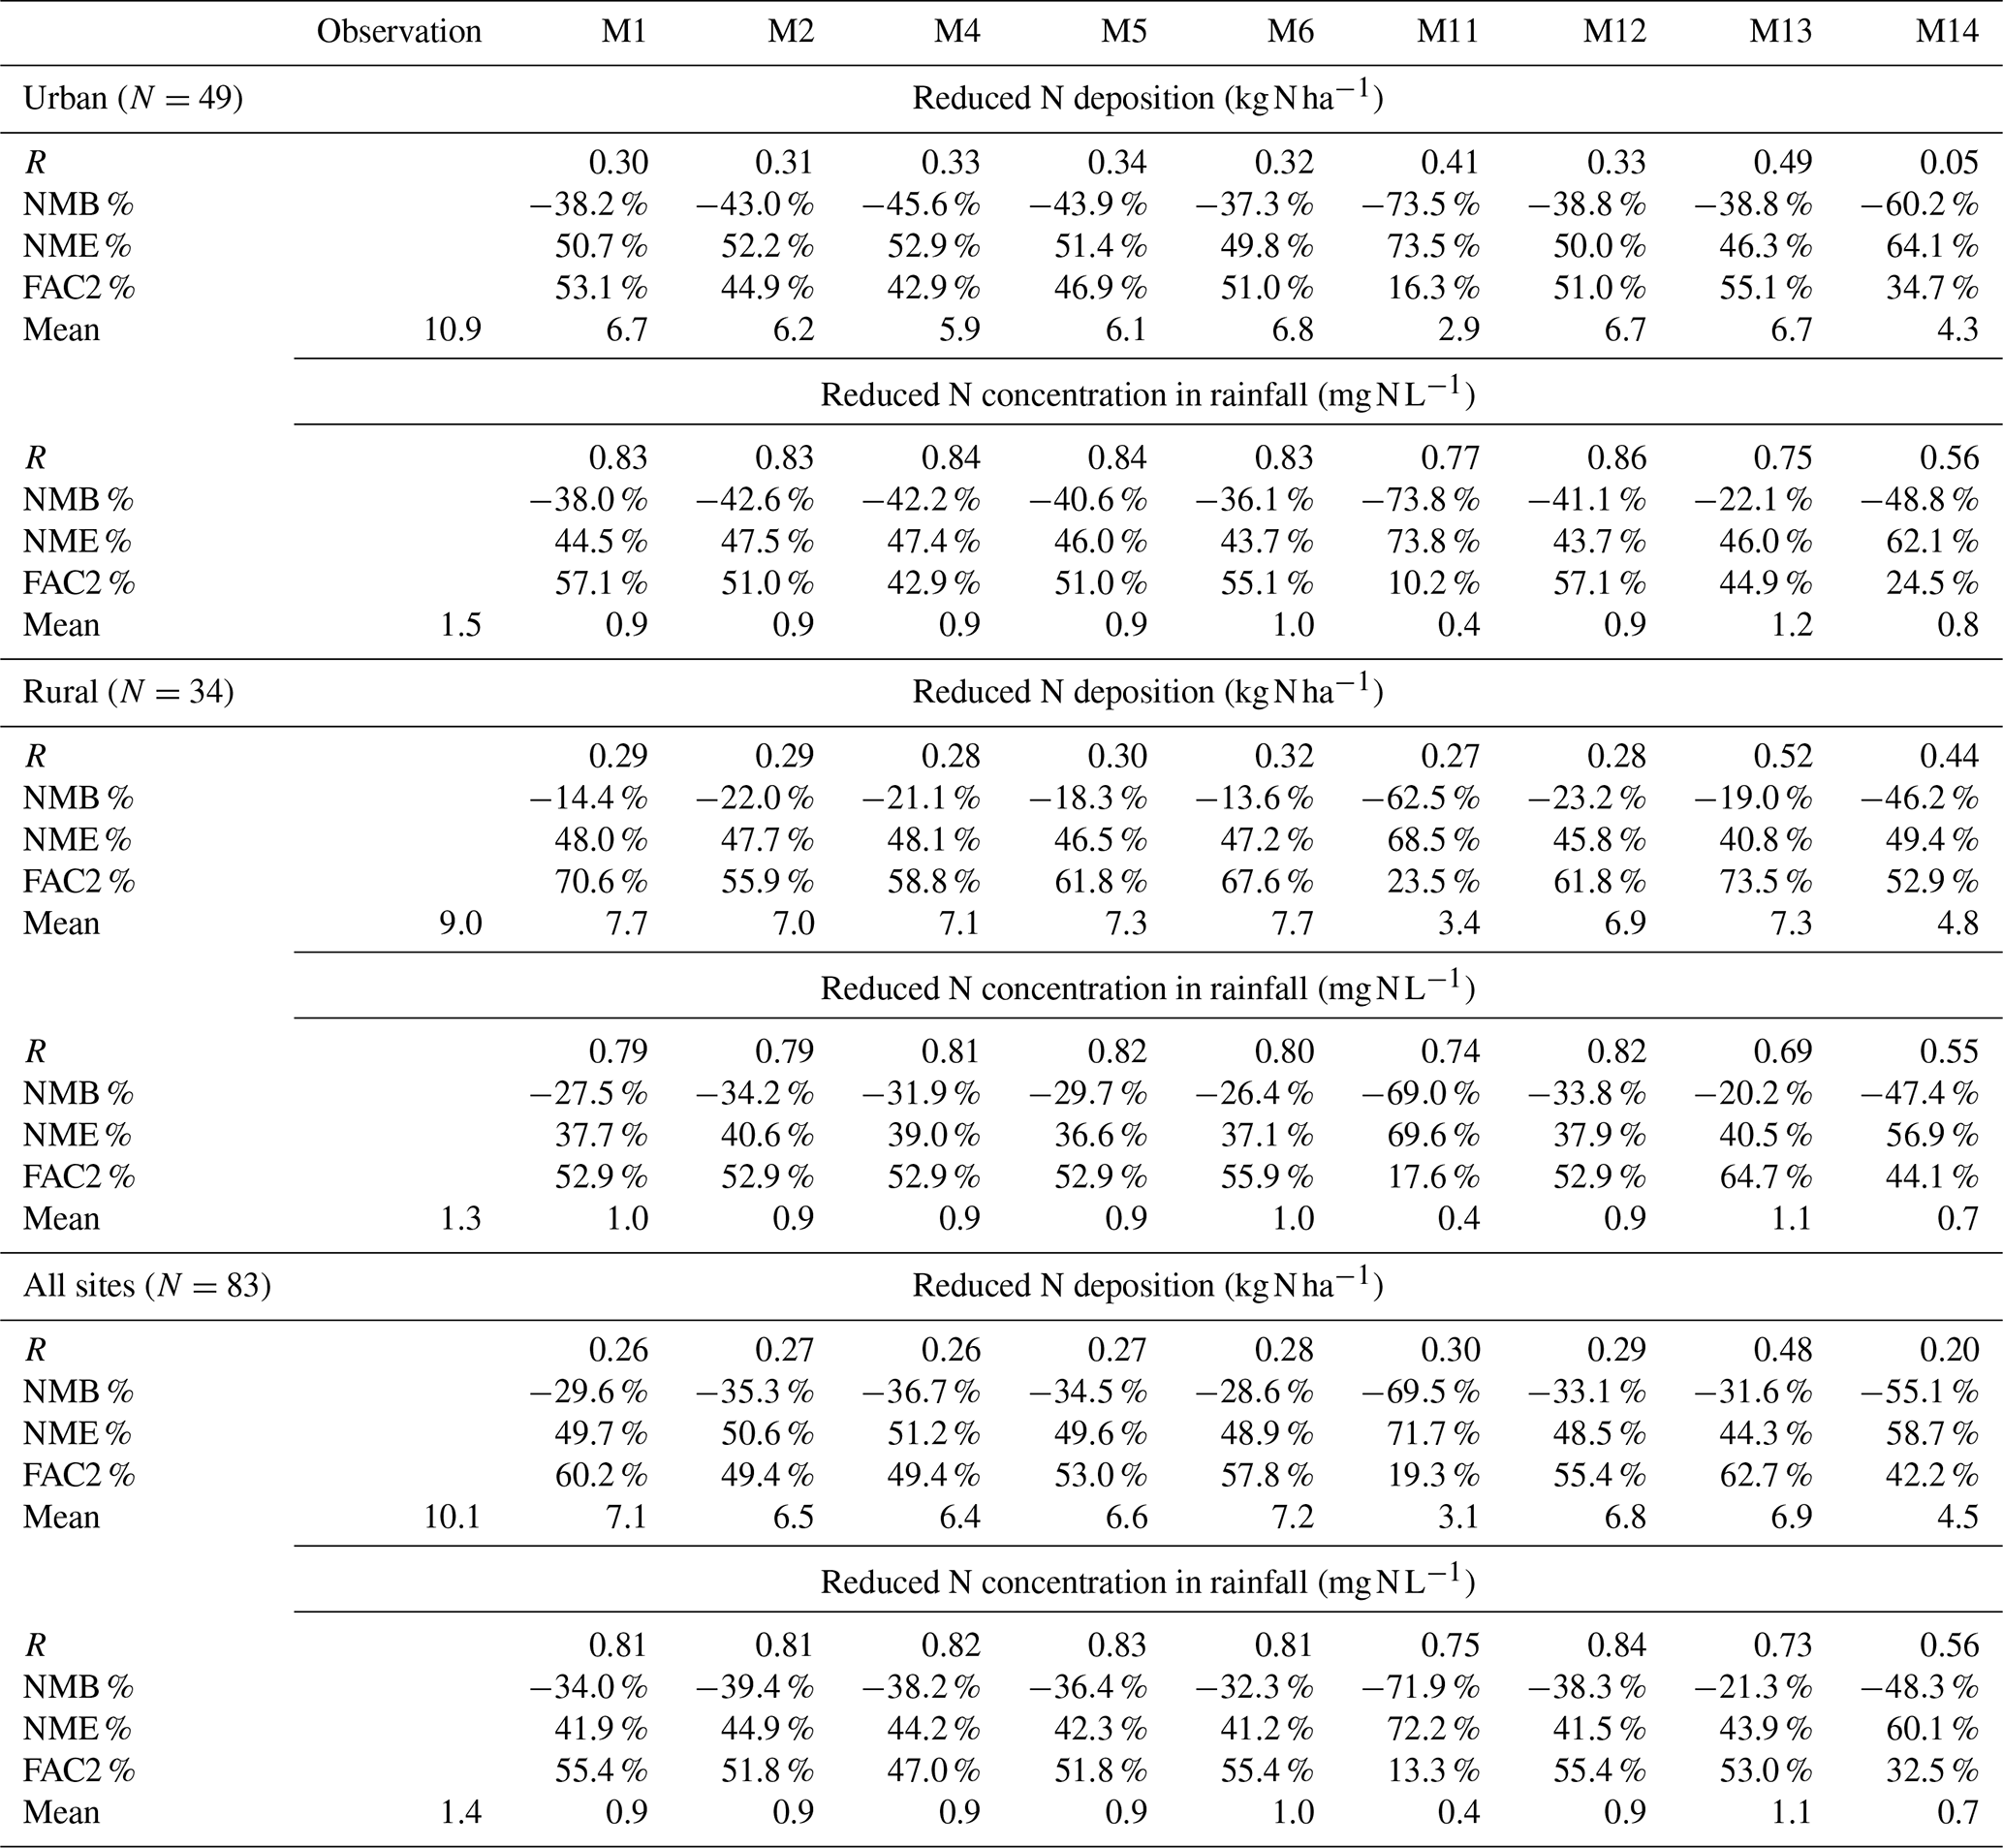
The underestimation of Nrd wet deposition was also found over the whole of East Asia and reported in the overview of acid deposition in MICS-Asia III (Itahashi et al., 2020). This implies that the current CTM models might underestimate the prediction of Nrd wet deposition not only in China but also in the whole of East Asia. The close correlations between the atmospheric concentration of and wet deposition of Nrd, with overestimation in the atmosphere but underestimation in precipitation, were found over all of East Asia (Itahashi et al., 2020). Consistent relationships in NC were also found between the results of Chen et al. (2019b; overestimated concentration) and this study (underestimated Nrd wet deposition). Bae et al. (2012) reported that the below-cloud scavenging process was important in the simulation of Nrd wet deposition, which was not explicitly separated into in-cloud and below-cloud scavenging but computes it as a whole in the CMAQ model. Note that the wet scavenging processes in most of the models (including M11 and M12) of MICS-Asia III were similar to those treated in CMAQ module, except for M13 (Table 1). It is too simple to accurately simulate wet deposition with the absence of an accurate below-cloud wet scavenging simulation. This would be one reason for the underestimation of Nrd wet deposition, especially considering the high concentration of gaseous ammonia in the surface layer of NC (Pan et al., 2018; Kong et al., 2019). Besides, the underestimation NH3 emissions in China would also lead to the underestimation of Nrd wet deposition. According to the improved inversion of NH3 emissions in China by Kong et al. (2019), the significant underestimation of NH3 emissions was found, especially in the North China Plain (NCP). For the whole of China, the prior emission and the inversion emission of NH3 are 10.3 and 13.1 Tg yr−1, respectively.
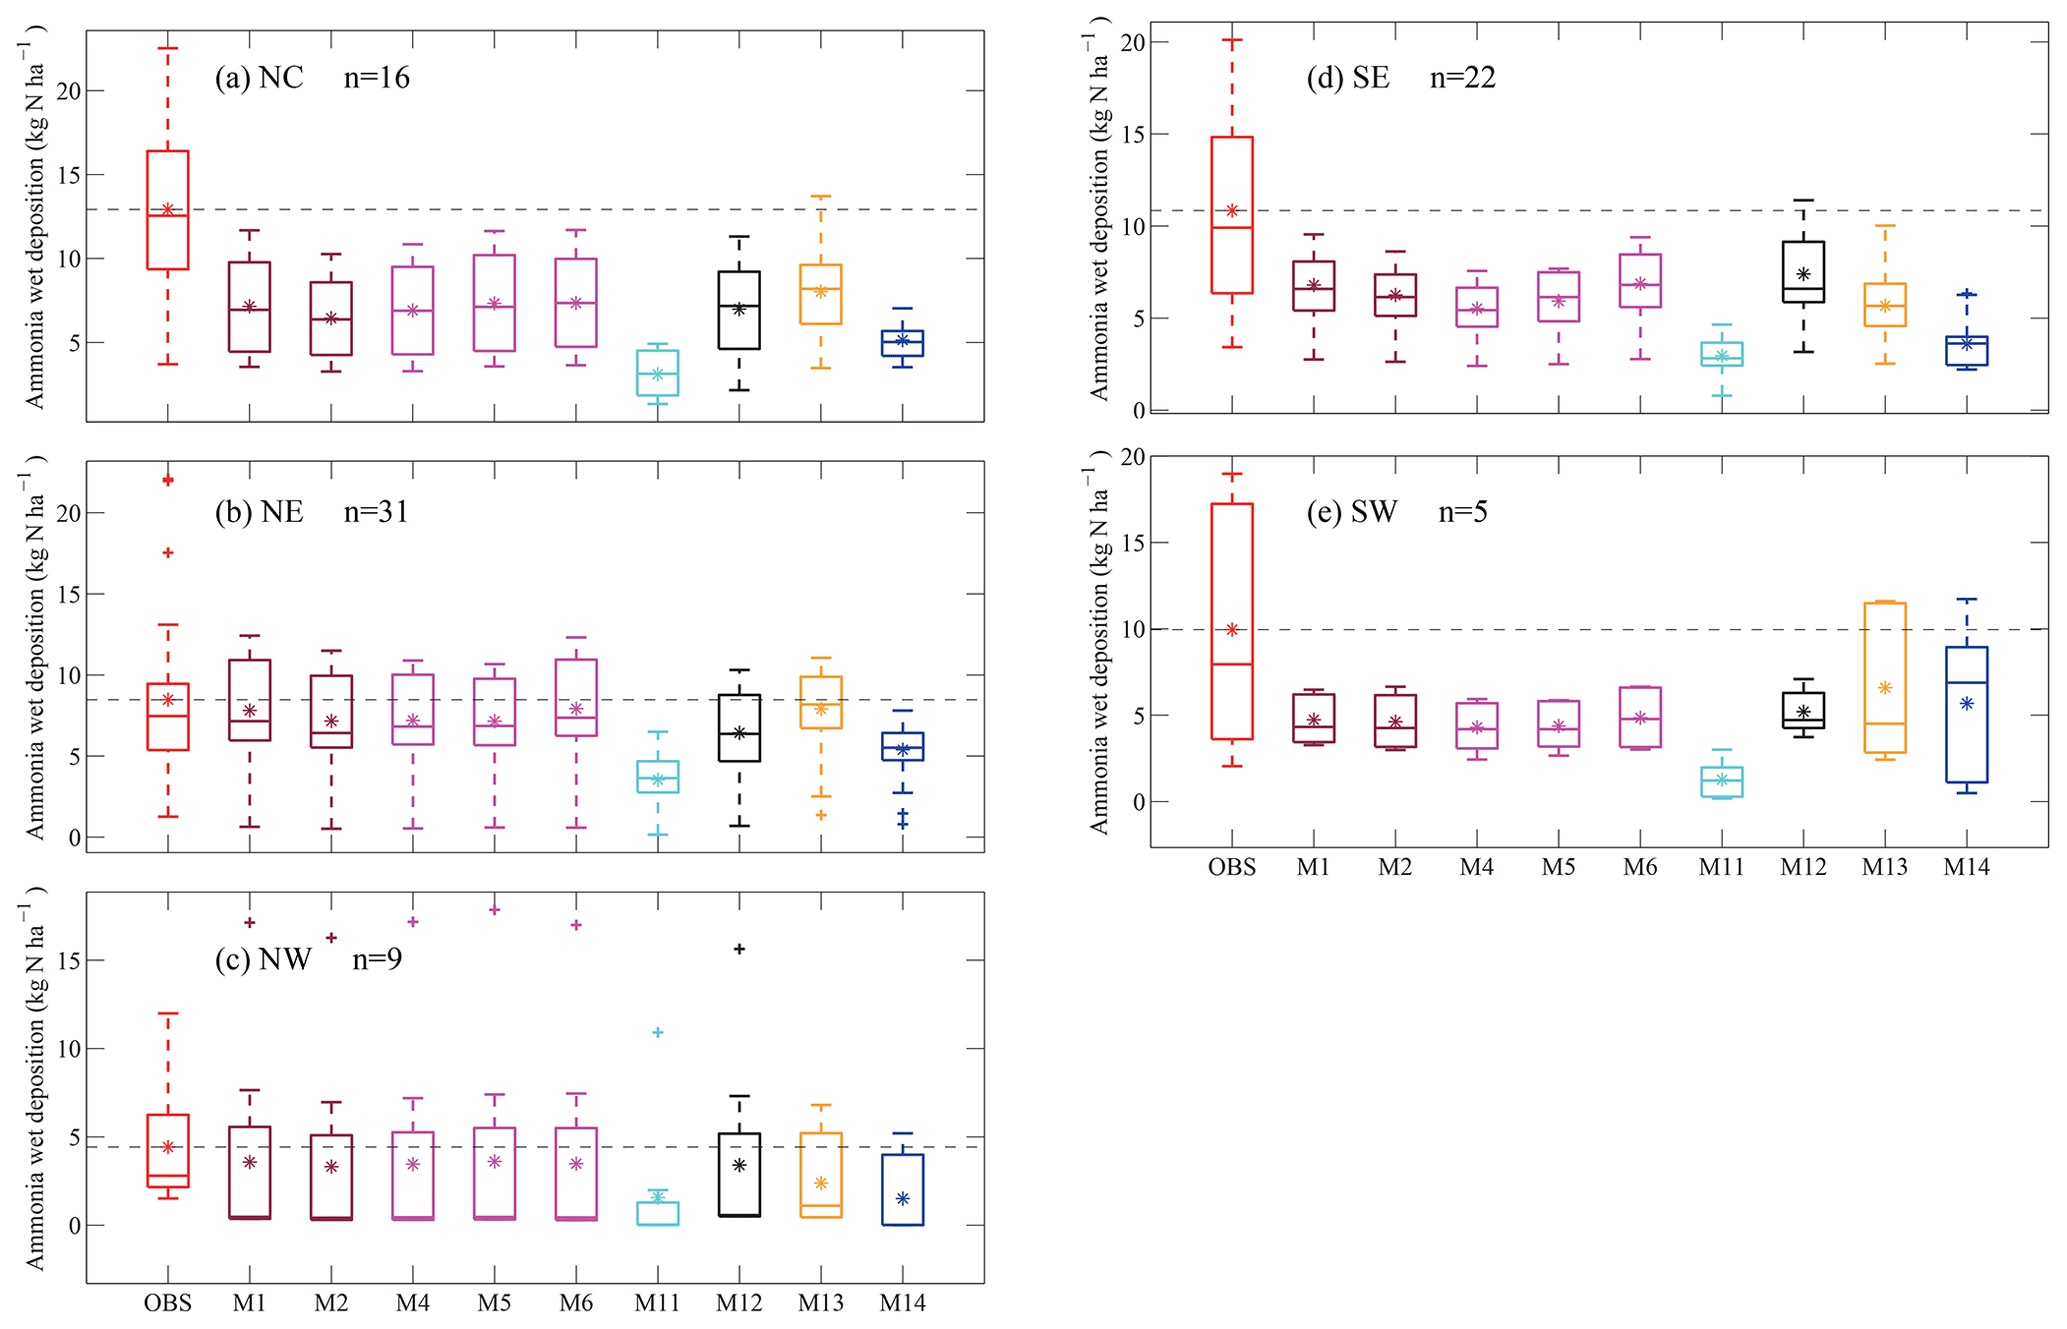
Specifically, the performance of Nrd wet deposition prediction in MICS-Asia III has also been validated in five regions through the percentile boxplot in Fig. 4. Site-by-site validation of both the yearly wet deposition and the VWM concentration of Nrd simulated by each model are displayed in Fig. S2 in the Supplement. While different from that found in Nox, almost similar behavior prediction has been found in some models, i.e., CMAQ models in M1–M6, except M12, which was driven by a different meteorological model. Other regional models and a global model show significantly different percentile distributions in all regions. Overall, both the medium and mean values of Nrd wet deposition were underestimated in NC, SE and SW and TP, while they are found to be similar in NE and NW. The underestimation in NC was largely due to the underprediction in summertime, not only in urban sites (Fig. 3e) but also in rural sites (Fig. 3f). Unfortunately, we cannot obtain convincing temporal variations in SE and SW due to the scarcity of monthly data in these two regions (there are only one or two sites in each region). In NE, most models predicted similar temporal variations of Nrd wet deposition, especially for the high depositions in the summer months.
3.2 Map of wet deposition among participant models
3.2.1 Wet deposition of oxidized N
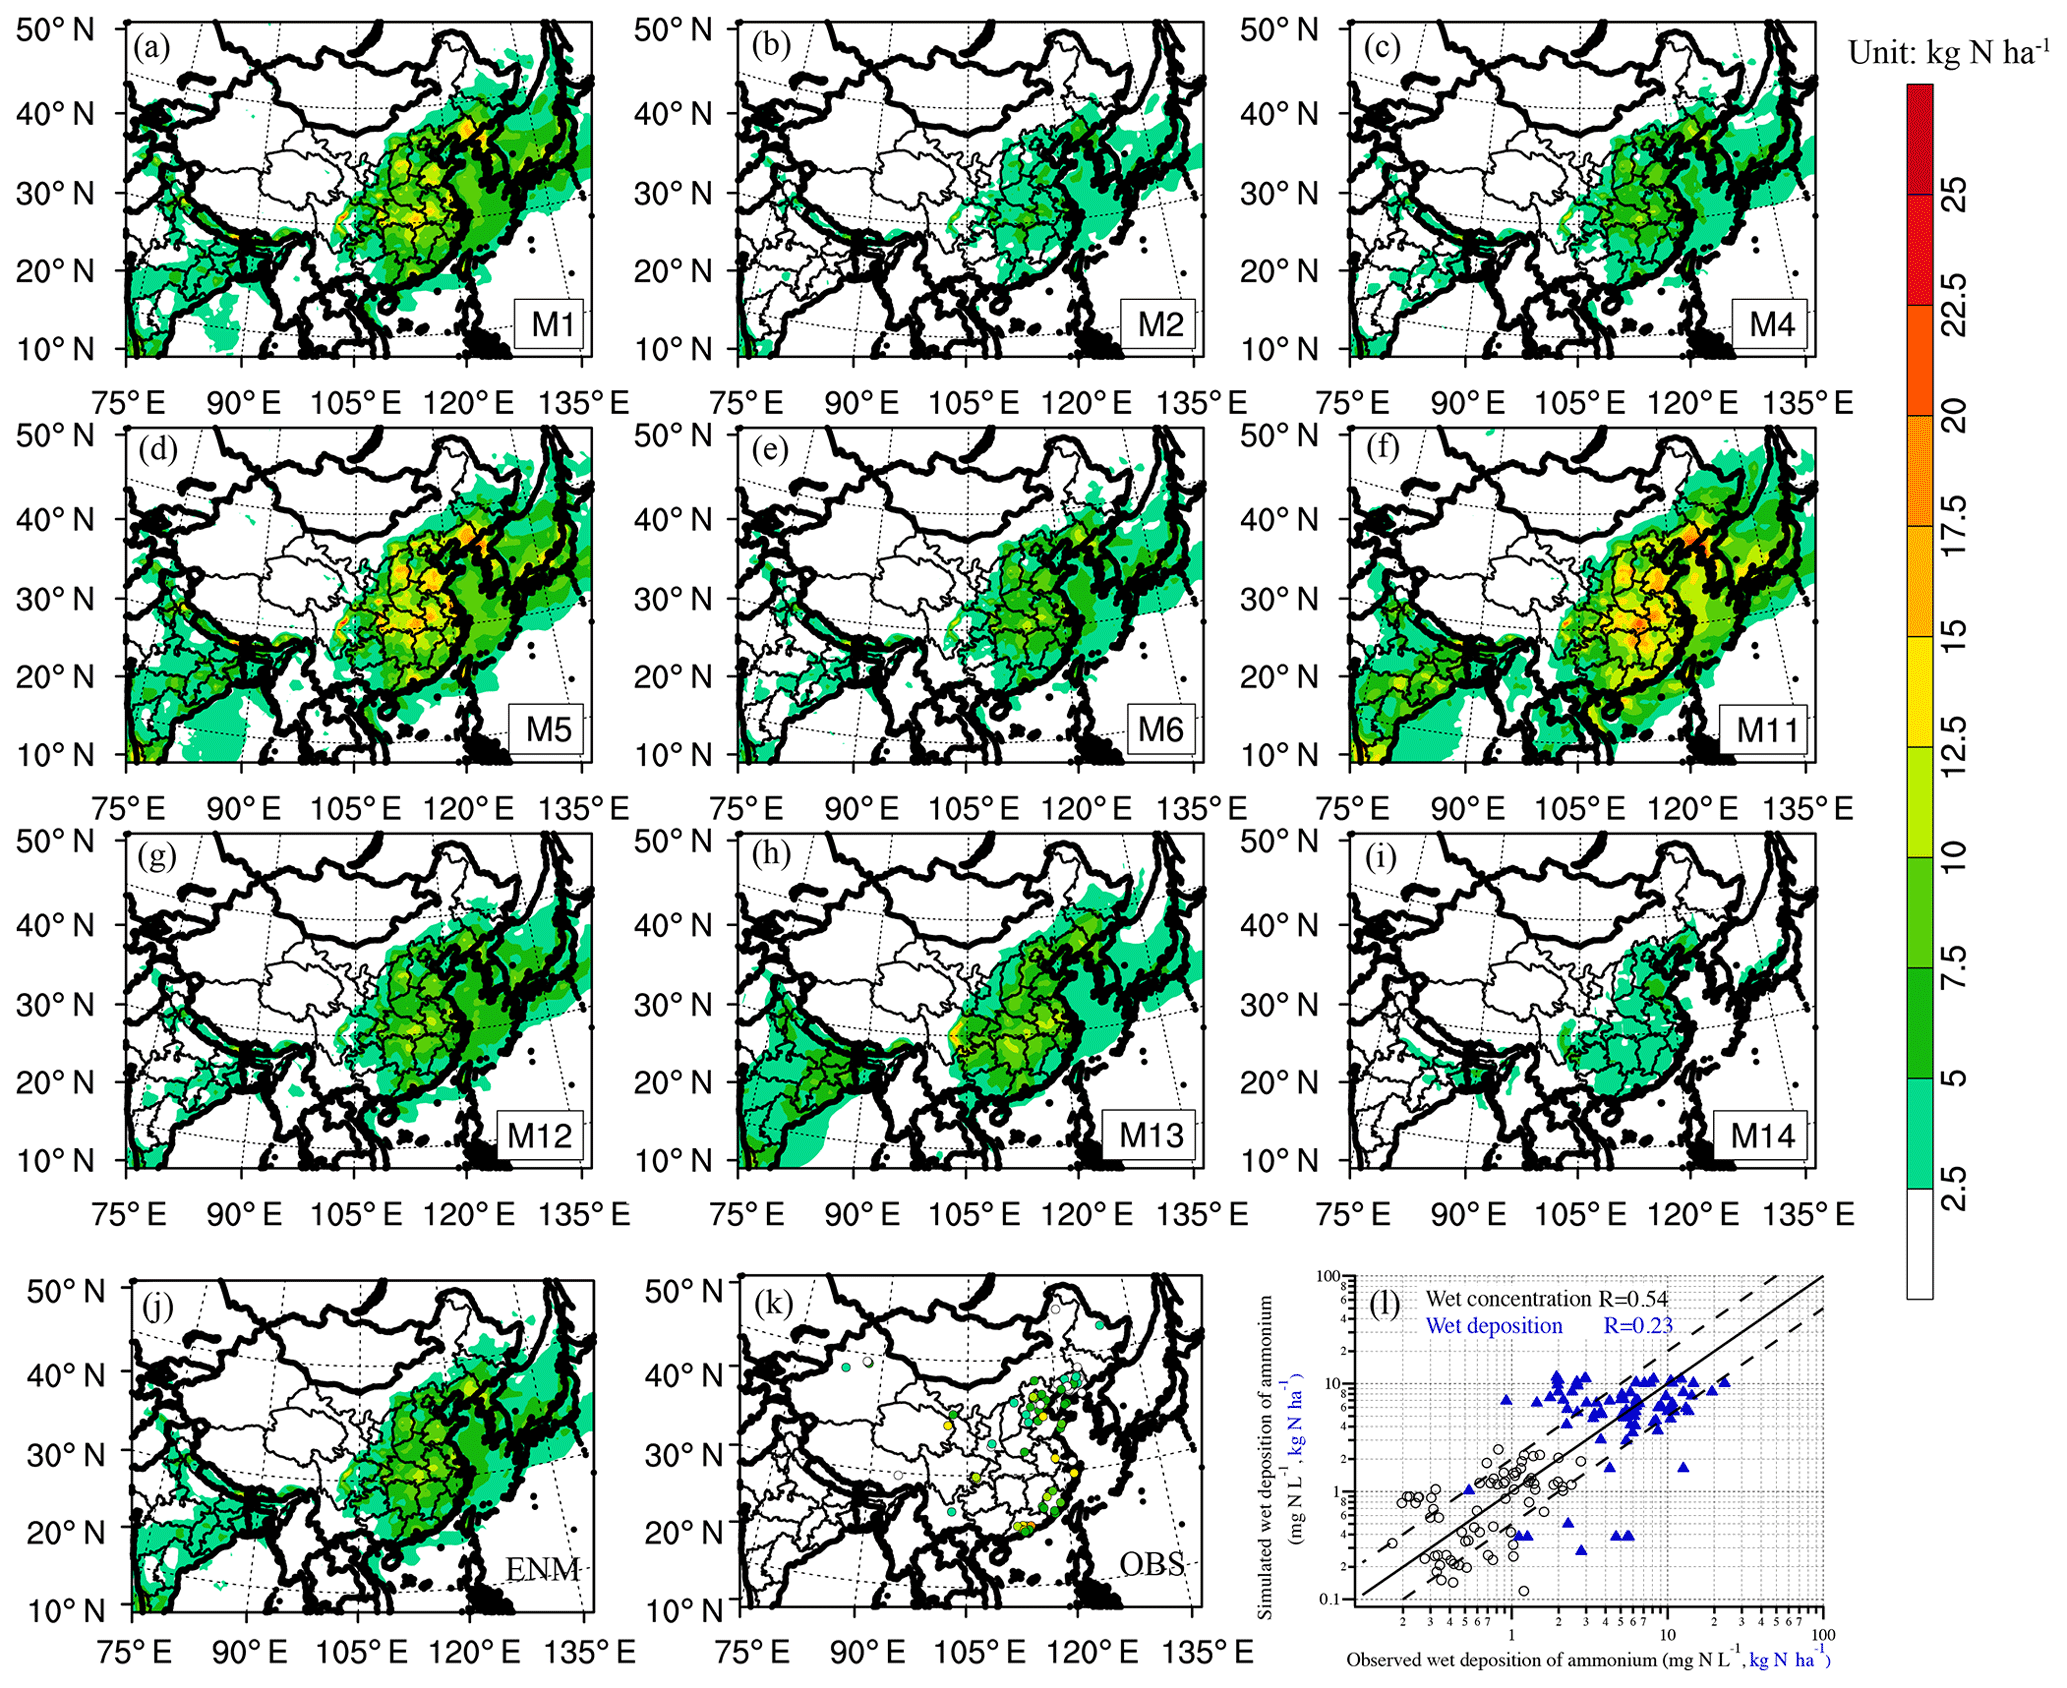
Figure 5Distributions of the wet depositions of Nox simulated by M1–M14 (a–i), ensemble means (ENMs) of the multimodels (j) of MICS-Asia III, observations from multisource measurements (k) and the comparison between ENMs and observations (l) (kg N ha−1).
Figure 5 shows the map of the distribution of yearly Nox wet deposition simulated by each participant model, the ENM results and the observed results over China. Most models show similar spatial patterns, with high levels of depositions in central to eastern China and low levels in western China. However, the threshold value in the hotspot areas (Fig. 5, from light yellow to orange and red) varies significantly among the models, and the average is much higher than the Nr deposition threshold value of 10 kg N ha−1 compared to the temperate ecosystems suggested by Bleeker et al. (2011). For example, M1, M5 and M11 simulated very high wet depositions of Nox (almost reaching at 20 kg N ha−1) in the middle Yangtze River and Yangtze River Delta (YRD), the basin of the Sichuan Province, the south of NC, and the Liaoning Province located in NE. In contrast, M2 and M14 fail to show the relative hotspot of Nwox in such areas, and M4, M6, M12 and M13 show an obscure hotspot with a small value of 10 kg N ha−1. The significant differences not only exist between different models but also in the same model (CMAQ), i.e., M1, M2, M4, M5 and M6. Since most models were driven by the meteoroidal field and standard emission input, except M13 (Geos-Chem) and M14 (RAMS-CMAQ), the differences in simulated Nox wet deposition should come from the CTMs themselves, e.g., the diffusion and convection process, the oxidation and chemical transformation, and the wet scavenging and deposition processes. The comparison of the long-lifetime species of CO (Kong et al., 2020) and weak chemical activity species of BC (Chen et al., 2019b) revealed that the model uncertainties are less than other factors, i.e., O3 (Li et al., 2019) and (Chen et al., 2019b), which have strong chemical activity and short lifetimes in the atmosphere. These results indicate that the chemical reaction process, rather than the diffusion and convection process, is one of the most important factors affecting the model uncertainties in MICS-Asia III.
3.2.2 Wet deposition of reduced N
Figure 6 shows the map distribution of the reduced N (Nrd) wet deposition over China. All of the models show a similar spatial pattern, with high values in central and eastern China but low levels of deposition in NW and northwestern NE. Compared with the Nox, few differences in the simulated Nrd wet deposition were found among the nine models, except M11 which predicted significantly lower values. Nox wet deposition of five agriculturally dominant provinces – namely Shandong, Henan, Hubei, Hunan and Anhui – is higher than the threshold value of 10 kg N ha−1, according to the simulated results by most models. Unfortunately, the small number of observations in these areas makes it harder to validate their findings. Evidence shows the high level of Nrd wet deposition over the threshold based on the observations in Hebei, YRD and the Pearl River Delta (PRD). Almost all of the models underpredicted the results in these areas. Liu et al. (2013) reported on the important contribution of Nrd to the total N deposition in China based on the long-term national scale of observed nitrogen deposition data. In the predominantly agricultural areas, ammonia emission is the main contributor to Nrd deposition (Liu et al., 2011; Kang et al., 2016).
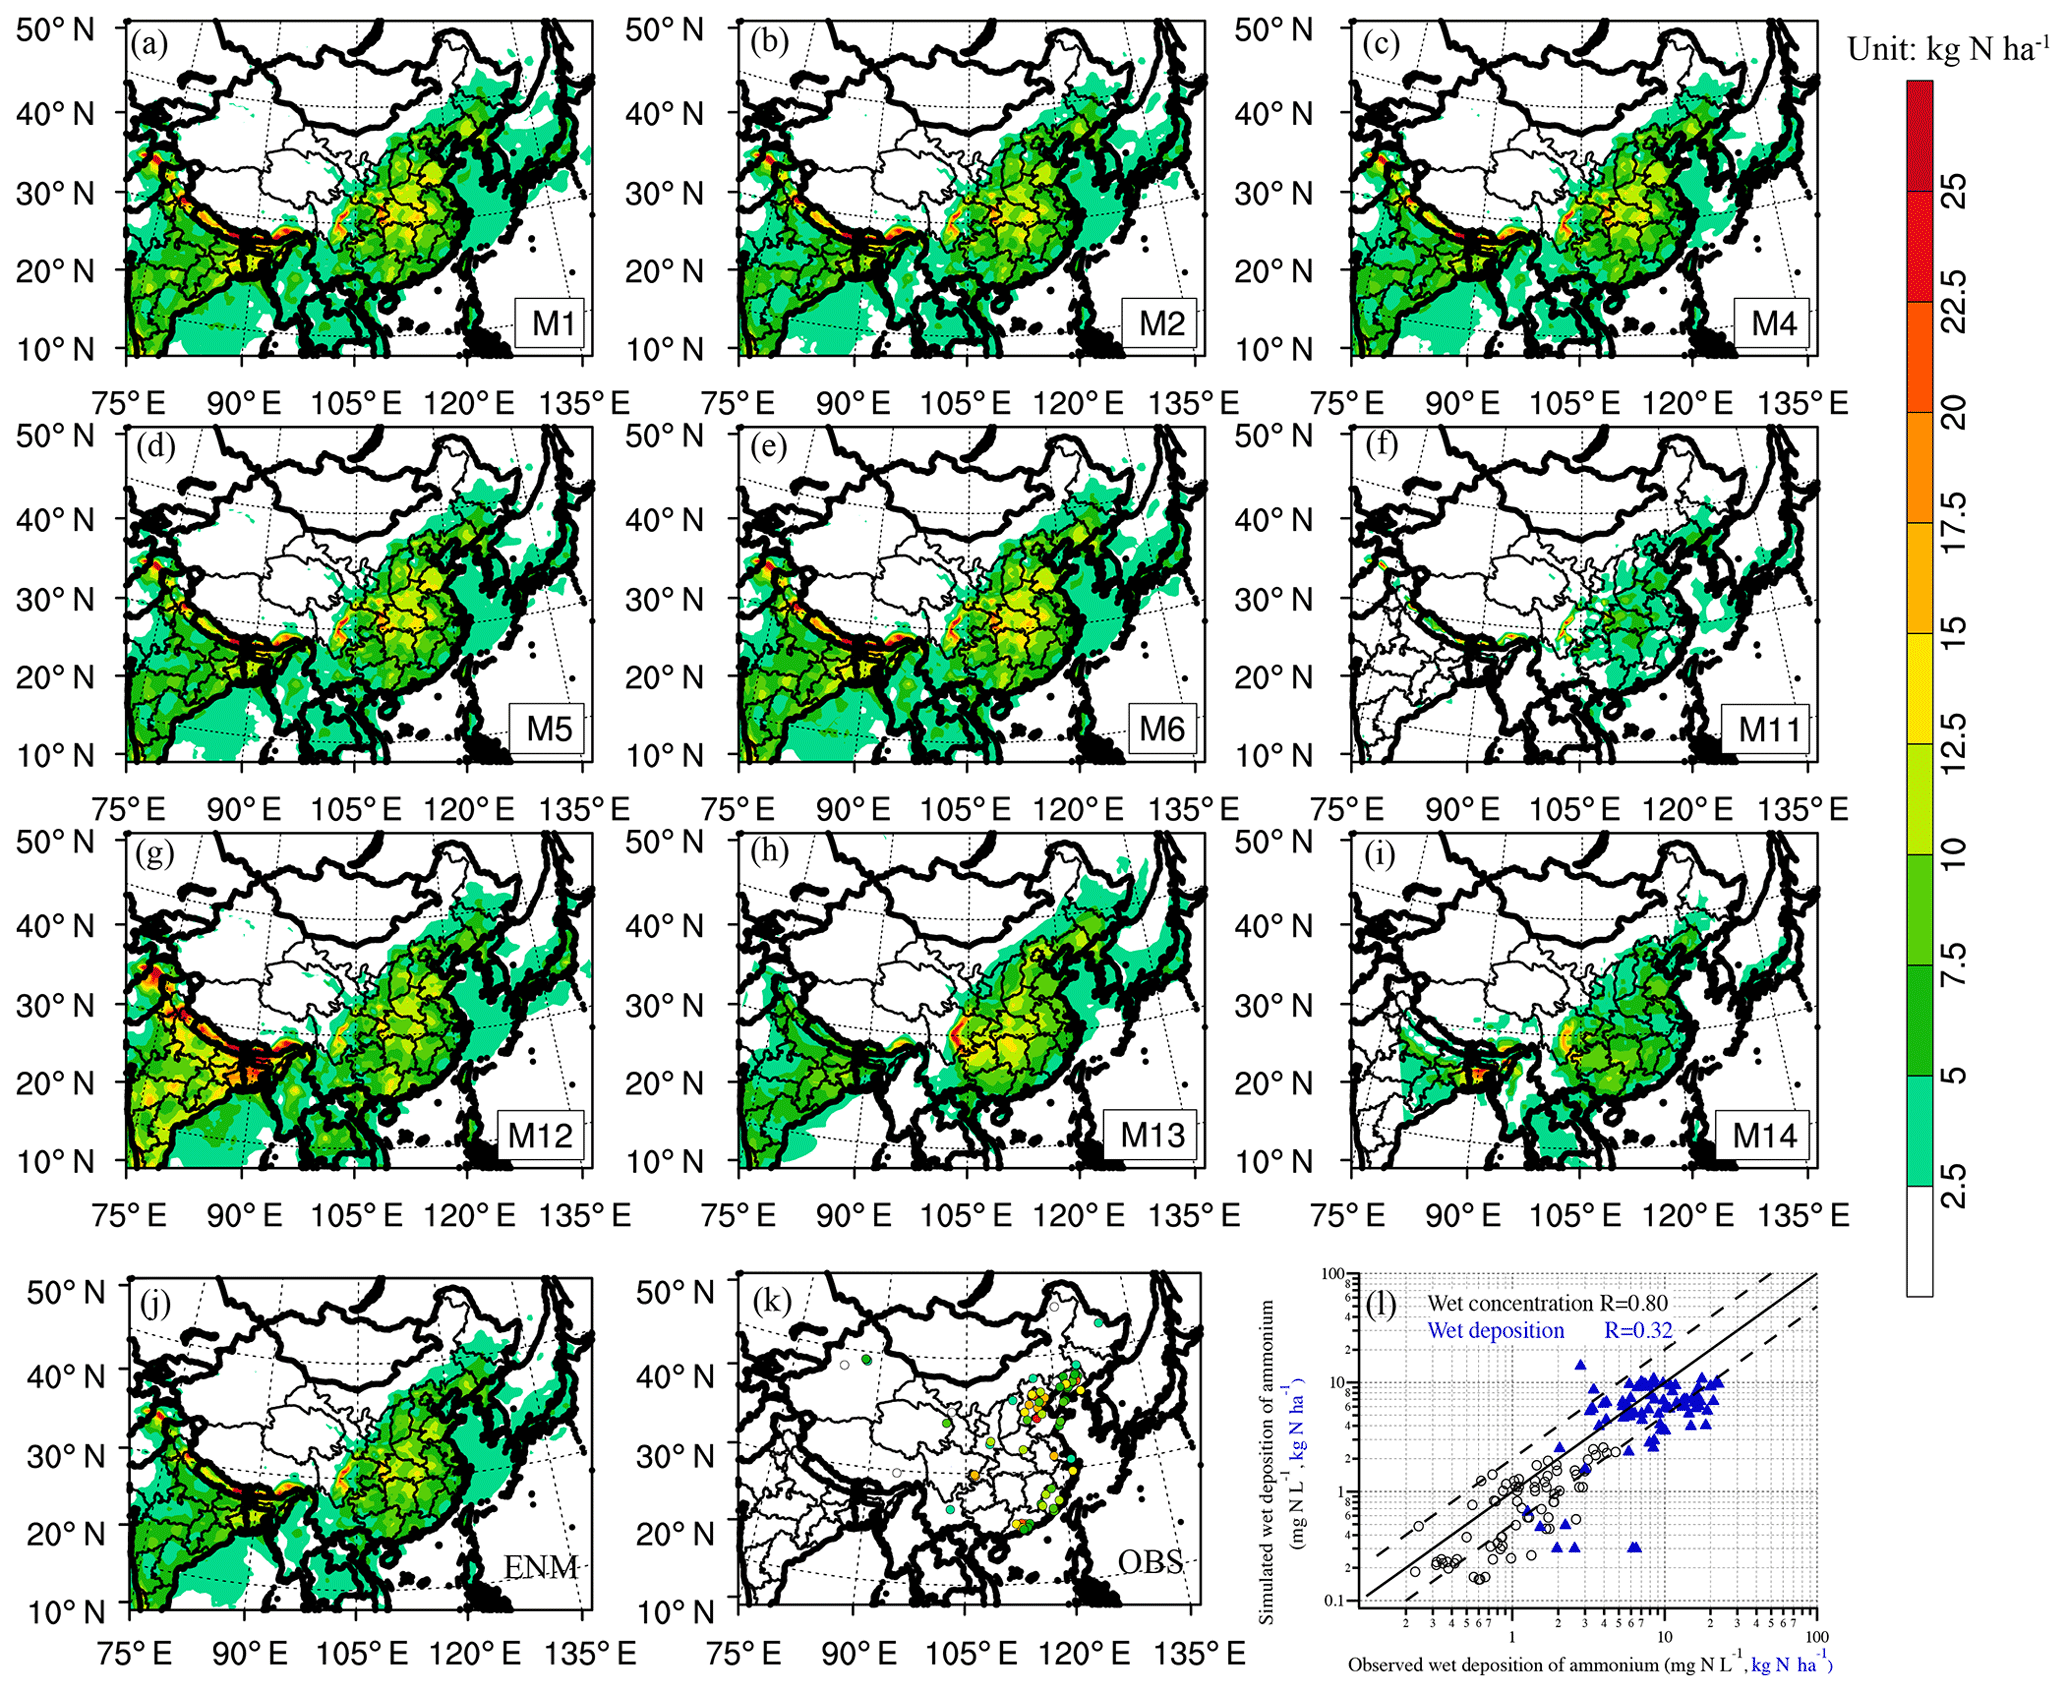
Figure 6Same as Fig. 5 but for Nrd.
3.3 Comparisons among participant models for reactive N depositions
3.3.1 Coefficient of variations for N depositions in MICS-Asia III
Besides the wet deposition of oxidized and reduced N, dry deposition was also an important process for the total deposition in China (Liu et al., 2013; Pan et al., 2012). The coefficient of variation (hereinafter CV), defined as the standard deviation divided by the mean value of all selected model results with a large value denoting lower consistency among the models, is applied for the model comparison of simulated reactive N depositions both for dry and wet deposition processes in MICS-Asia III. Figure 7 shows the distribution of CV for each type of simulated reactive N deposition. Since the low level of mean values of the deposition are more likely to be associated with a higher CV, the gridded CV was only calculated in the area with simulated depositions higher than 0.5 kg N ha−1 (hereafter analyzed value) in this study. As shown in Fig. 7, the spatial distribution of CV only covers eastern China, southern China and northeastern China, which indicates that the quarterly and yearly fluxes of reactive N deposition in these regions were higher than the analyzed value. For the annual case, the CV value of Nrd was lower when compared with Nox both for dry and wet depositions. This means that the multimodel simulations are more consistent in Nrd depositions than in Nox depositions. Specifically, the Nrd in wet depositions have the lowest CV values, followed by Nrd in dry depositions and then the Nox in wet and dry depositions. This suggests that the simulated wet depositions of Nrd have fewer uncertainties than other types of reactive N depositions.
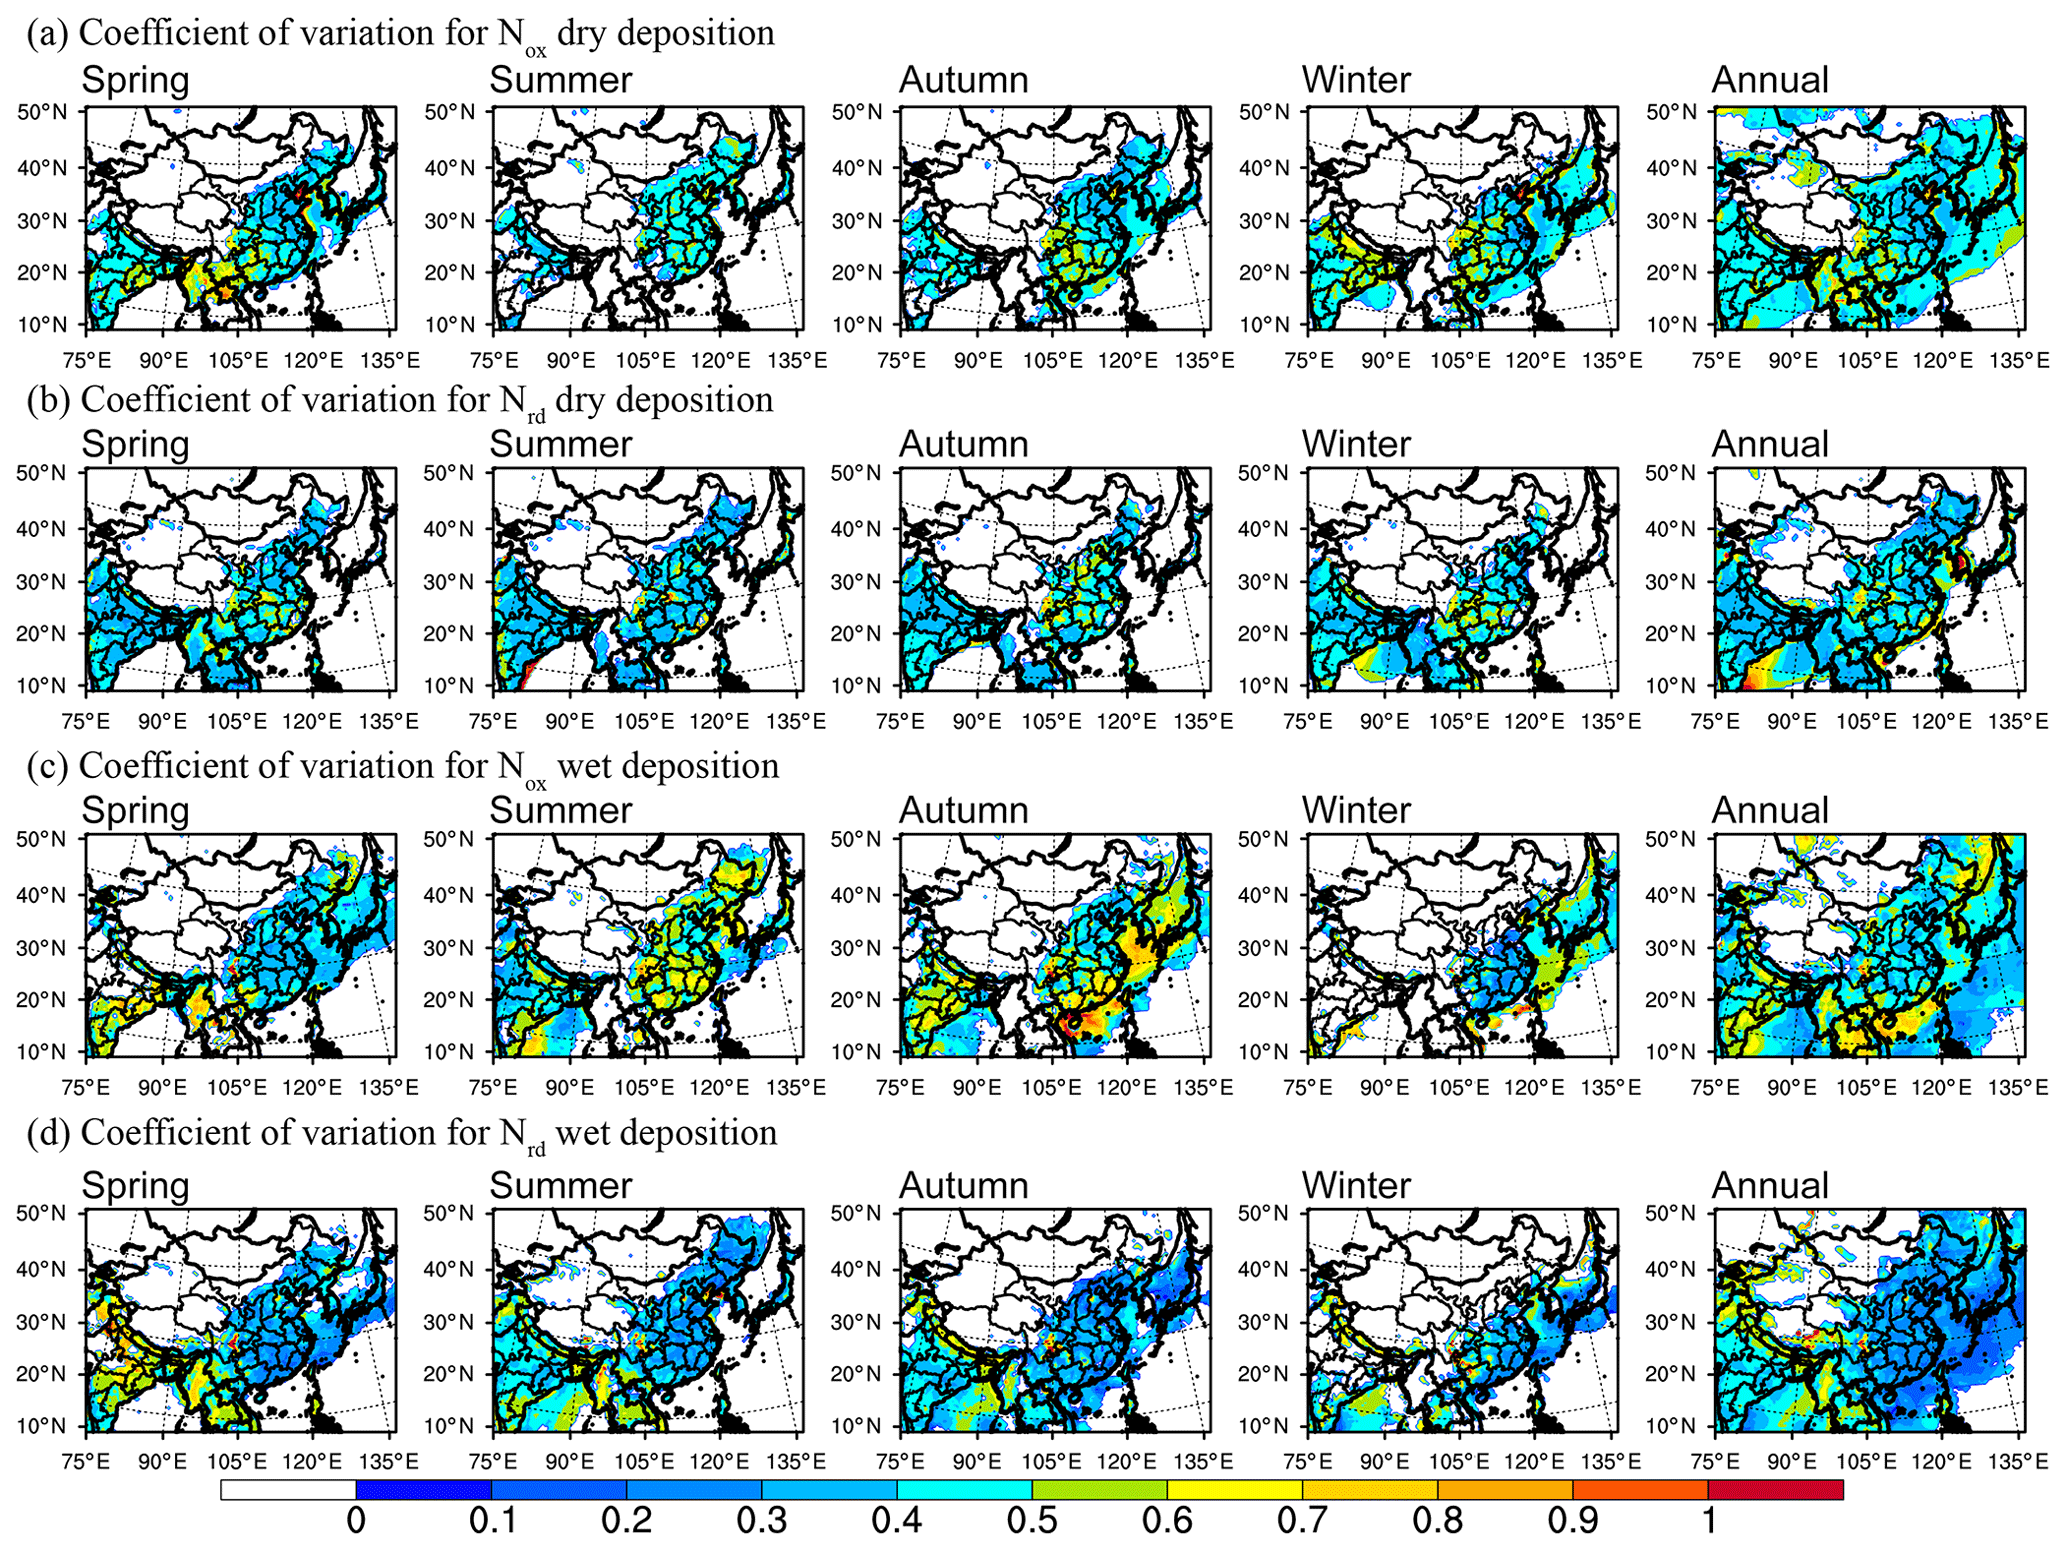
Figure 7Spatial distribution of the coefficient of variation (CV) of (a) Nox dry deposition, (b) Nrd dry deposition, (c) Nox wet deposition and (d) Nrd wet deposition in MICS-Asia III on the annual and seasonal basis.
More complicated patterns were shown in seasonal variations of each type of deposition. The simulated Nox for dry deposition in Fig. 7a showed larger uncertainties in southern China (south of 30∘ N, with the CV>0.4) than that in northern China (north of 30∘ N, with the CV<0.3) in all seasons except summer. Similar spatial and temporal patterns of the CV values were found in Nrd dry deposition. It is worth noting that the large CV values, with the range of 0.4–0.6, were exhibited in central China (i.e., Henan, Hebei and Shandong provinces) during summer and autumn in spite of the high flux of Nrd dry depositions in these regions (map distributions of Nox and Nrd dry depositions, simulated in nine participant models, are displayed in Figs. S3 and S4 in the Supplement). This suggests, importantly, that the uncertainties of the physical and chemical processes in the participant models – including gas-particle equilibrium (Ge et al., 2019), dry deposition parameter scheme (Zhang et al., 2003), transportation and the chemical reaction with other acidifying substances (Liu et al., 2019) – in the regions of high emissions originating from agricultural activities in growing seasons may lead to significant deviations of simulated Nrd dry depositions.
For wet deposition of Nox, large uncertainties were located in southern China in summer and autumn, with the CV values higher than 0.6 compared to the CV values lower than 0.4 in other regions (Fig. 7c). This high value of CV was not found in the summertime of simulated Nrd wet deposition (Fig. 7d). Due to the high portion of summertime flux in the total annual wet deposition, high CV values in Nox contributed the most important part of the significantly larger annual CV value than that shown in the Nrd case. Due to the same rainfall input for the wet deposition in the framework of MICS-Asia III, except for models 13 and 14, the different CV values for Nrd and Nox in same region (i.e., lower CV values of Nrd wet depositions in NC, SE and central China) can be attributed to their precursor concentrations in the air mass and the different wet scavenging processes (Seinfeld and Pandis, 2006). This will be discussed in the following section.
3.3.2 Comparison of precursors in the air mass
As is well known, the depositions from both the dry and wet parts of a certain substance were found to have originated from its precursor in the air mass. The uncertainties of the nitrogen-related species in the air mass simulated during MICS-Asia III were therefore an important index for estimating the performance of deposition simulations. It should be noted that only concentrations of most of the related species at the surface layer have been submitted to MICS-Asia III, except for NO2 vertical column density data (VCD). According to the comparison of CV between the NO2 concentration at the surface layer and VCD data (Fig. S5 in the Supplement), it was shown that there is a similar spatial pattern over the whole of China. This indicates that the simulated concentration on the surface layer can partly represent the difference of the whole column among the multimodels, especially for providing a broad overview in China. Thus, only concentration data at the surface layer have been used in this study.

Figure 8Distribution of CV of NOx (a), (b), NH3 (c) and (d) in the air mass on the seasonal and annual basis.
Figure 8 shows the distribution of CV for gaseous NOx, particulate , gaseous NH3 and particulate in the air mass simulated by the nine participant models during four seasons and the annual mean values. There were significant seasonal variations among the spatial patterns of the CV for each type of the N-related air pollutant. It is interesting to note that not only the seasonal variations but also the spatial patterns of the simulated precursors' CVs were reasonably consistent with those previously shown in the deposition part (Fig. 7). For example, high CV values were found in the simulation of particulate in southern China during summer, reaching or even exceeding 0.8 in SE China (Fig. 8b). The high CV values were also found in summertime Nox wet depositions (Fig. 7c). As the most important precursor of Nox wet deposition (Pan et al., 2012), the consistent distribution of CV between the precursor and the deposition is reasonable. Different to the particulate , very low CV values were shown in particulate during summer, leading to less deviation of simulated Nrd wet deposition than Nox. However, uncertainties in precursors cannot explain everything. For example, the high CV values of Nox wet deposition in south China correspond to the low CV values of in autumn. Some other factors, such as the scavenging process, might be responsible for the unknown uncertainties. Xu et al. (2017, 2019) first compared the below-cloud wet scavenging coefficients based on the different estimation methods and found a large difference, even at magnitude level, between each method. Thus, a more detailed comparison – such as in-cloud and below-cloud wet scavenging coefficients in each participant model – should be carried out in the next phase of MICS-Asia.
For Nox dry depositions, the anomalies of deposition and NOx concentration in the air are shown in Figs. S6 and S7 in the Supplement. It shows some variations among the models, i.e., of both higher deposition and concentration in M1, M5, M11 and M13 and lower deposition in M2, M4, M6, M12 and M14. This has also been proved in the distribution of CV values in NOx (Fig. 8a) and Nox dry depositions (Fig. 7a) during autumn and winter. As the most important precursor of Nrd dry deposition, gaseous NH3 also shows large CV values in central China during summertime (>0.6). There were also significantly high CV values in the south of the Yangtze River during the autumn and winter period (0.7–0.8 in the south of the Yangtze River versus 0.3–0.5 in the north of the Yangtze River). A similar pattern, but of uncertain significance, was found in the simulated Nrd dry deposition (0.3–0.4 versus 0.2–0.3 in Fig. 7b). The anomalies of Nrd dry deposition and the gaseous NH3 in the air simulated by each model are shown in Figs. S8 and S9 in the Supplement. Additionally, the dry deposition velocity (Vd) of Nrd – based on the ratio of the dry deposition fluxes and the surface concentration (the same as in Tan et al., 2020) – are also shown in Fig. S10 in the Supplement. The results show that the CMAQ models (M1–M6) predicted similar Vd of Nrd, and the Nrd dry deposition was consistent with the gaseous NH3 concentration in the air, i.e., overestimation in M1 and M2 but underestimation in M4 and M5. However, among the different models, high Vd of Nrd (low Vd of Nrd) corresponds with the overestimation (underestimation) of dry deposition in M11 and M14 (M12 and M13). From the distribution of CV, similar patterns were also displayed both in Vd (Fig. S11 in the Supplement) and dry deposition of Nrd, with a low CV value in NCP (0.1–0.4 for Nrd dry deposition; 0.1–0.3 for Vd) and high CV value in SE and SW (0.4–0.8 for Nrd dry deposition; higher than 0.5 for Vd).
4.1 Ensemble results of reactive N deposition and comparison with satellite data
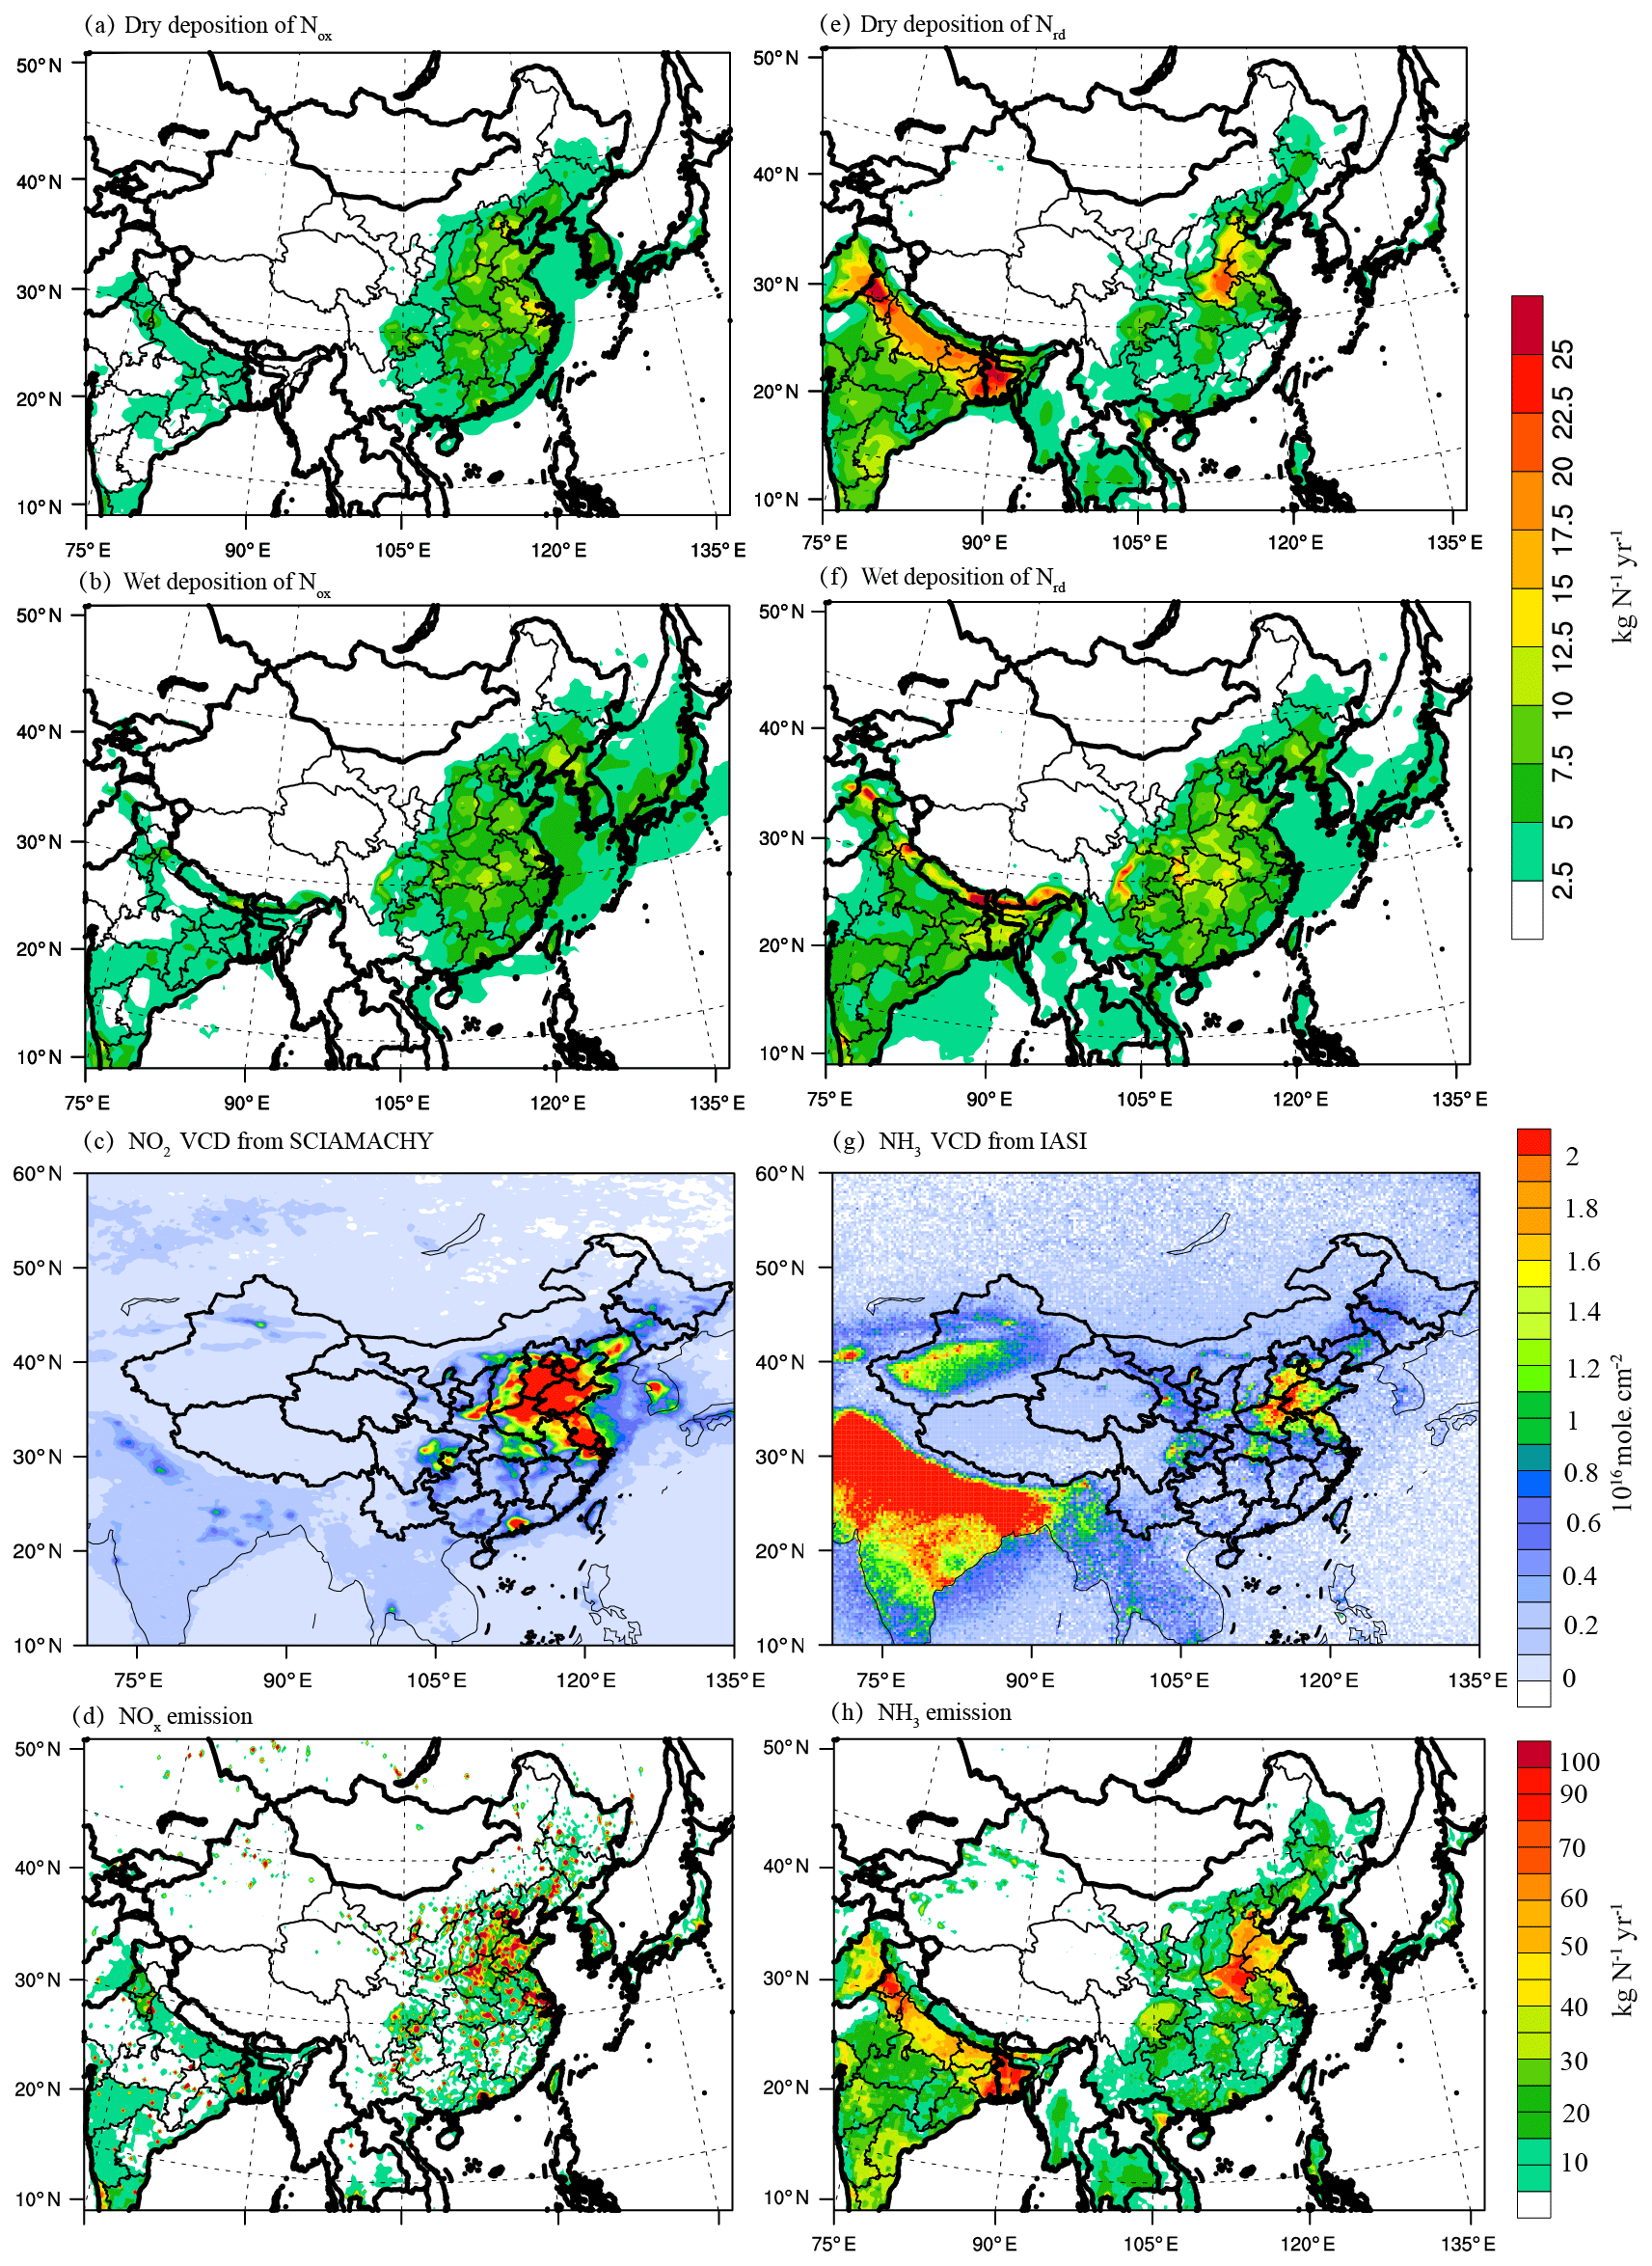
Figure 9ENM results for dry deposition (a) and wet deposition (b) of Nox, vertical column density (VCD) of NO2 from SCIAMACHY (c) and NOx emission from MICS-Asia (d); ENM results for dry deposition (e) and wet deposition (f) of Nrd, VCD of NH3 from IASI (g) and NH3 emission from MICS-Asia (h).
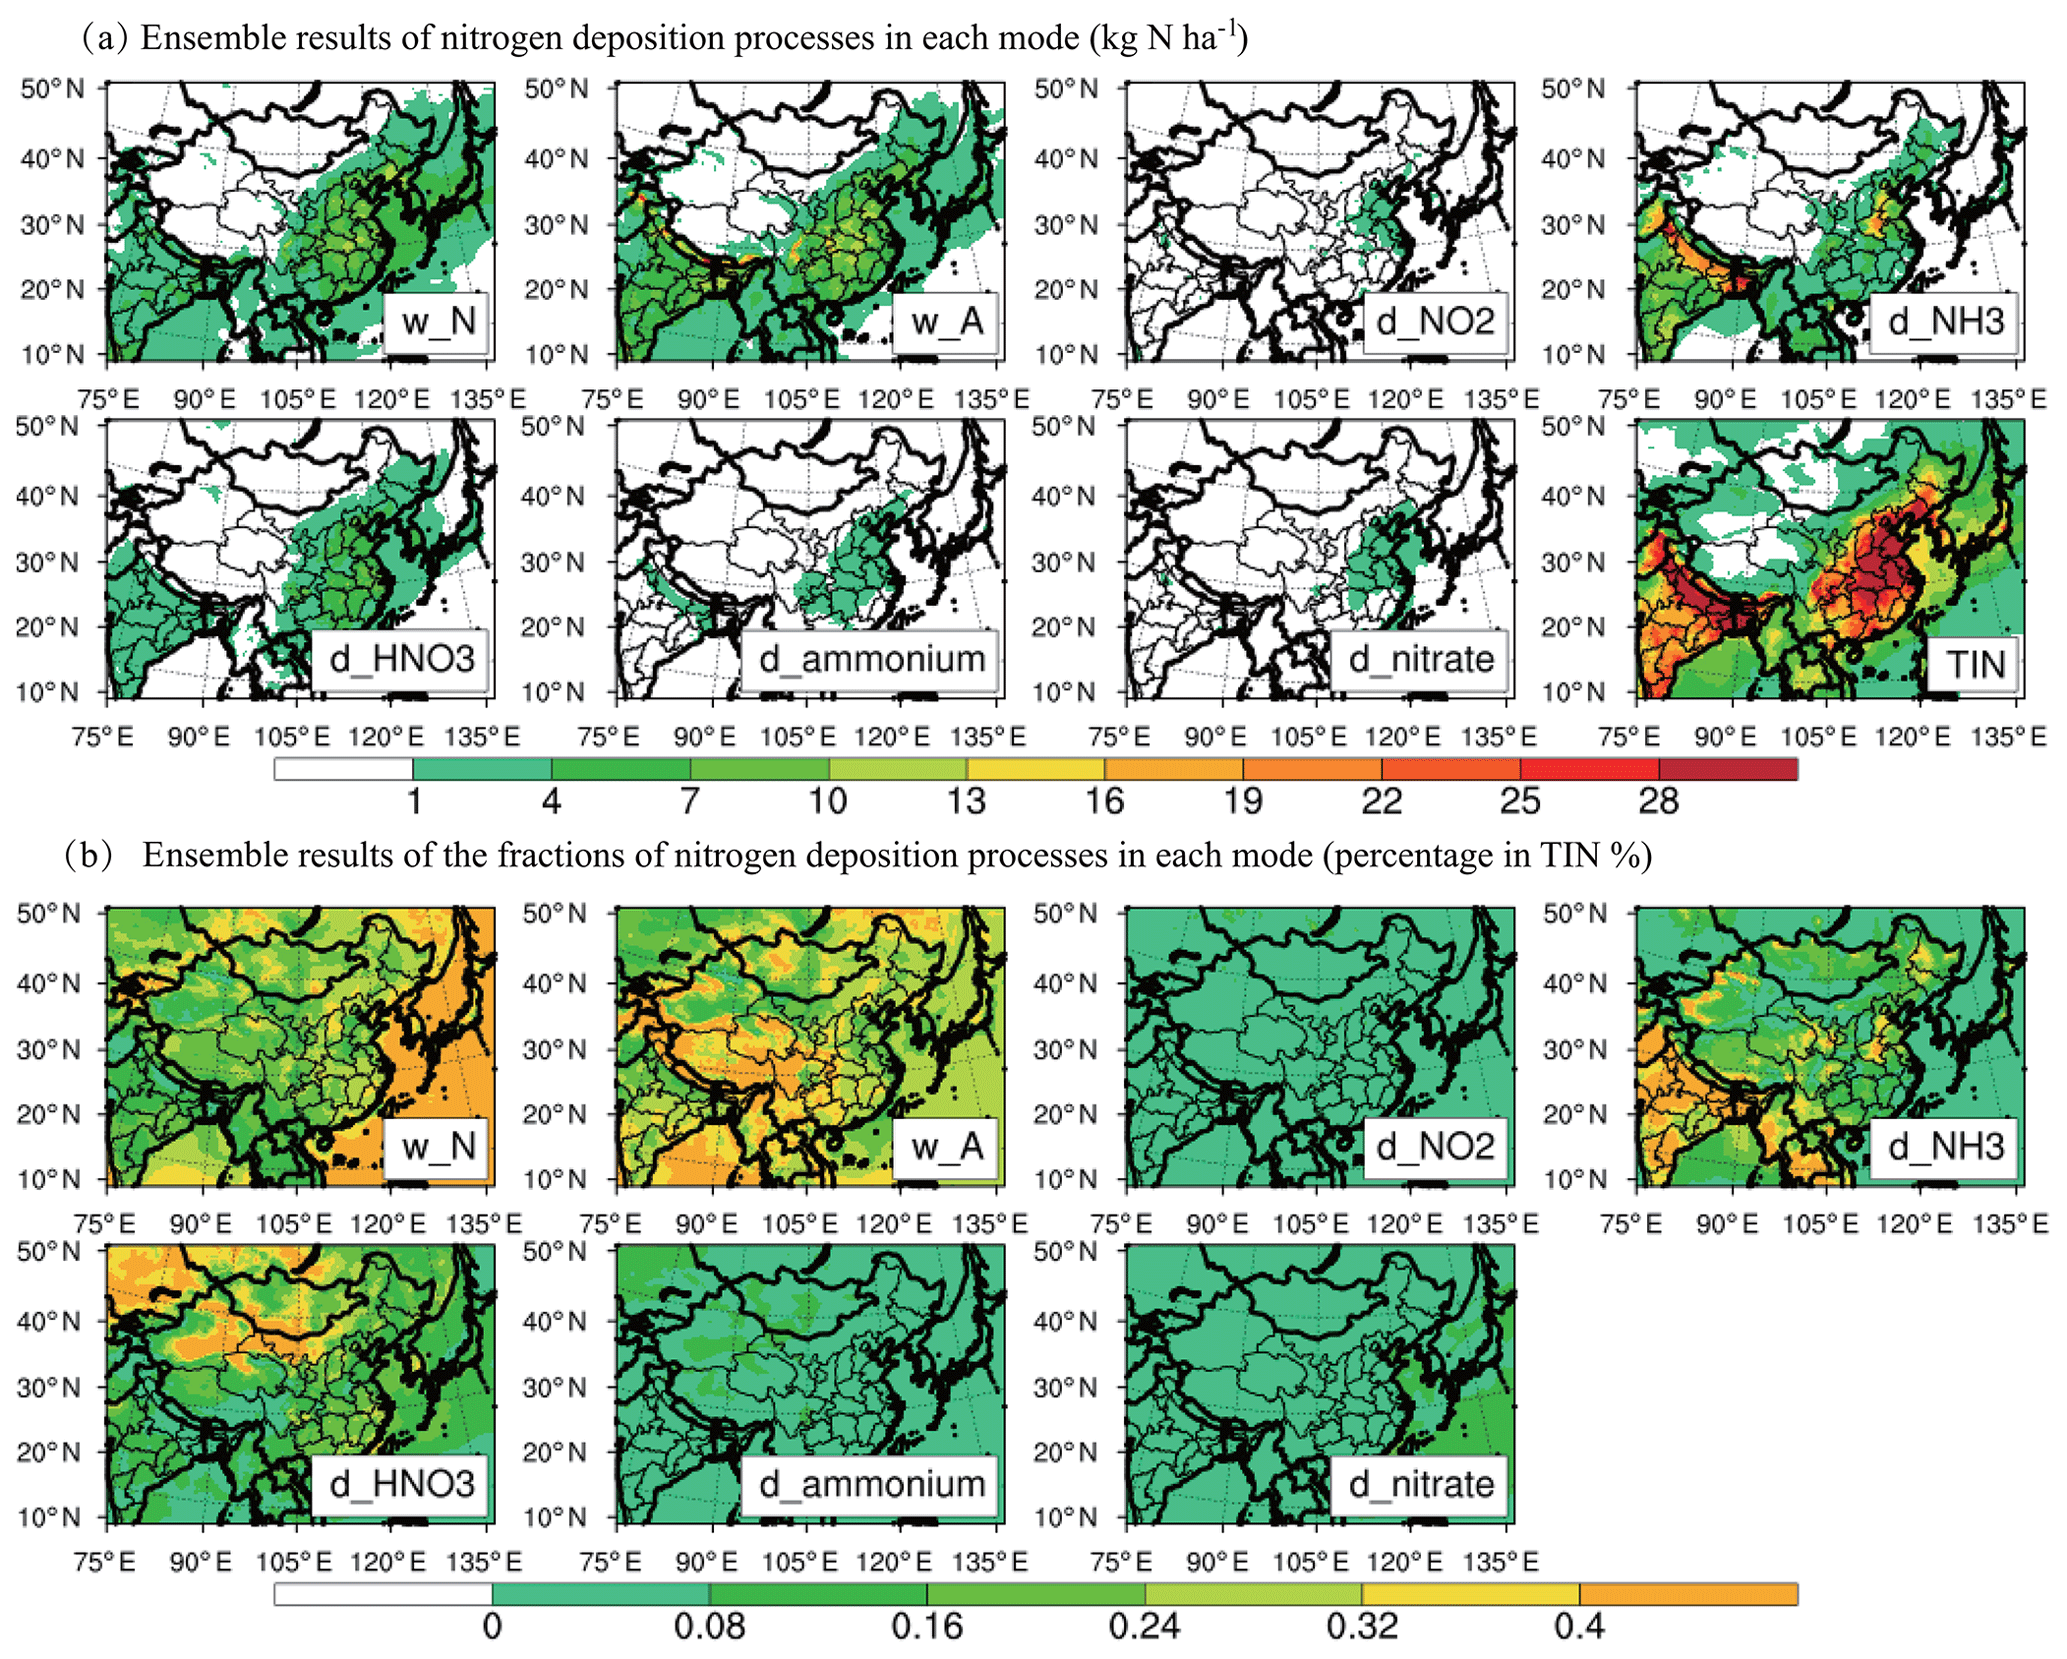
Figure 10ENM results of each process of (a) N deposition flux, and the fraction of (b) total inorganic N (TIN) in MICS-Asia III. The labels of w_N, w_A, d_NO2, d_NH3, d_HNO3, d_ammonium and d_nitrate represent the wet deposition of nitrate, wet deposition of ammonium, dry deposition of NH3, dry deposition of HNO3, dry deposition of ammonium and dry deposition of nitrate, respectively.
Wang et al. (2008) first presented the ENM depositions of acidified species over East Asia based on MICS-Asia II simulations and found that the ENM is better at simulating wet depositions than each single model. In phase III of MICS-Asia, the ENM value of wet depositions for both Nox and Nrd has also been validated by observations and is shown in Figs. 5l and 6l. The simulated Nox wet deposition and VWM concentration in rainfall exhibited larger dispersions around 1:1, in line with the correlation coefficients, R, of 0.23 and 0.54 in 83 sites over China, compared with those found in Nrd, which are concentrated around 1:2 line, with the correlation coefficients, R, of 0.32 and 0.8. This implies that the ensemble mean value of simulated Nox wet deposition has large uncertainties, while Nrd wet deposition was underpredicted by a factor of 2 in MICS-Asia III. Compared to each single model, the ensemble mean shows a higher R value than most single models. However, due to a lack of direct observations of dry deposition, validation for dry and total deposition of reactive N cannot be achieved. Instead, the column densities from satellites and emission spatial distribution were employed to address the reasonability of the ensemble mean of four types of reactive N depositions simulated in nine models. As displayed in Fig. 9, dry depositions of Nox and Nrd are concentrated in NC, the YRD and Henan province, which corresponds to the distribution of their emissions and VCDs, respectively. Meanwhile, wet depositions of Nox and Nrd are centered in central China provinces, such as Hubei and Hunan, and the Chengdu region. There were especially high wet depositions of Nrd in the southwest of the Hubei province and northeast of Chengdu city, where high values of emissions and the VCDs for NH3 were absent. The reasons that these regions were loaded with high wet depositions were mainly due to the high volume of rainfall (for more details, see Fig. S12 in the Supplement) and the long-range transport of acidic substances (Ge et al., 2011).
4.2 Contributions to the total inorganic N depositions and their potential effects
Total inorganic N (TIN) deposition, which includes the reduced and oxidized forms of inorganic N deposition from both wet and dry processes, has been calculated to estimate its ecosystem effects in this study as it was measured, in most cases, before (Pan et al., 2012; Liu et al., 2013). Figures 10 and 11 show the pathway of each type of N deposition to the TIN from a spatial distribution view and six regions' statistical results, respectively. The ENM dry depositions of gaseous HNO3 and NH3 were the two most important contributors to the TIN, both of which contributed to 18 % of the TIN over the whole country, while the wet deposition of and were another two main components, with percentages of 23 % and 28 % (Table 4), respectively. Consistent with that reported in the global assessment under HTAP (Vet et al., 2014) and in the Nationwide Nitrogen Deposition Monitoring Network (NNDMN) estimation (Xu et al., 2015), the Nrd in China dominated the TIN deposition with an average percentage of 52 % for the ensemble results, which is slightly lower when compared with 60 % and 58 % in the two previous works. The overall contribution of wet and dry deposition to TIN was almost half and half, which is consistent with that reported in NNDMN by Xu et al. (2015). Considering the total emissions, the depositions in all of China took about 67 %, 65 % and 66 % in the 2010 emissions of NH3, NOx and total N (NH3-N + NOx-N), respectively. It is interesting to show that the relationship between the gridded average Nrd deposition and the Nox deposition with their relevant emissions in six regions (shown in Fig. 12, with the slope – 0.56 and r2 – 0.97 for Nrd and the slope – 0.47 and r2 – 0.88 for Nox) were consistent with those reported by Xu et al. (2015; slope – 0.51 and r2 – 0.89 for Nrd and slope – 0.48 and r2 – 0.81 for Nox). Even the increasing order of the regions, from the lowest in the TP to the highest in NC, was the same as the previous measurement study. This implies that the spatial distribution and the relationships between deposition and emission are comparable with those measured in the NNDMN. Pan et al. (2013) also compared the correlations between the observed depositions and emissions and attributed the inconsistent distribution between them in the NCP to the uncertainties of the emission. However, the patterns of depositions were also influenced by the regional transport, in addition to the emissions. In this study, the significant positive correlations of the simulated Nox(Nrd) depositions with the corresponding NOx(NH3) emissions reflect the control role of the relative emissions to the spatial distribution of the depositions. Although most regions were located below a 1:1 ratio of deposition to emission (Fig. 12), a few regions, such as TP and NE, were close to or above the 1:1 ratio, thus implicating the impacts of transport on deposition among the regions.
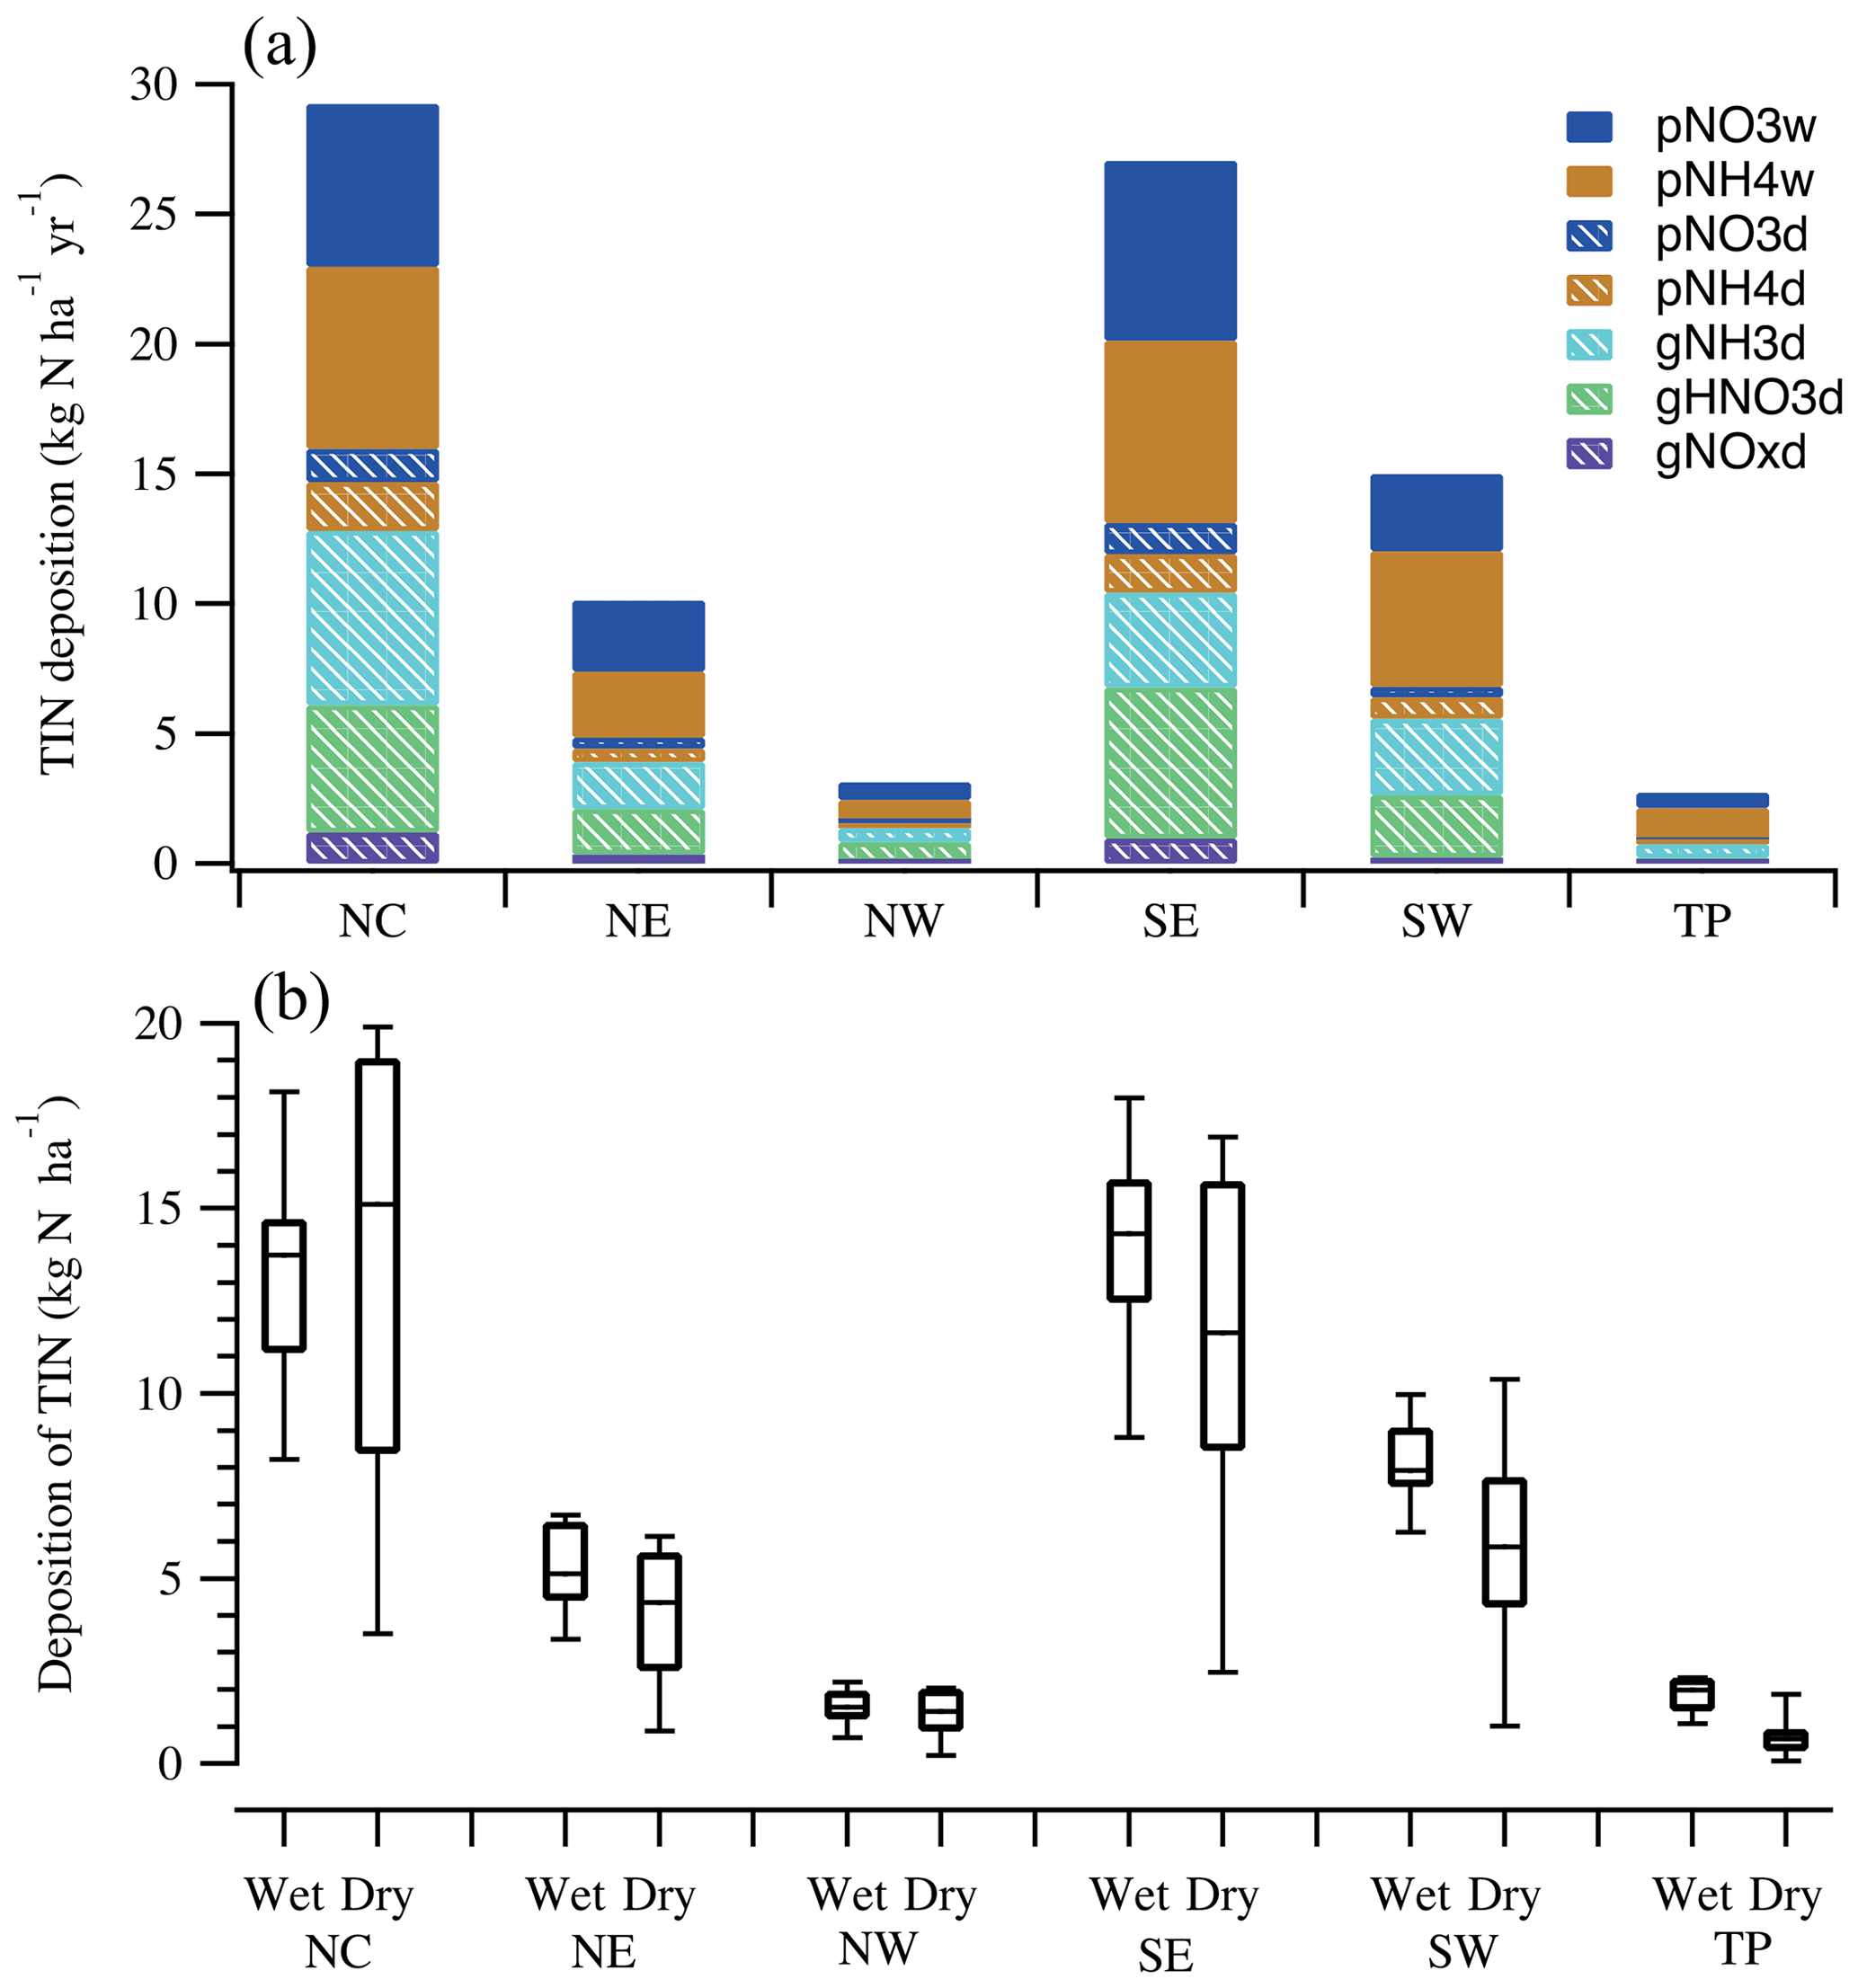
Figure 11Pathway of N species to TIN deposition in different regions from ENM results (a), and TIN depositions by wet or dry deposited manner (b) in the percentile boxplot, with 90 % and 10 % represented by the top and bottom horizontal line, 75 % and 25 % represented by the upper and lower edge of the box, and the asterisk in the middle of the box representing the medium value, respectively.
Table 4Types of depositions and their relevant contributions to TIN and the emissions of reduced and oxidized N in different regions (Note: unit – ).
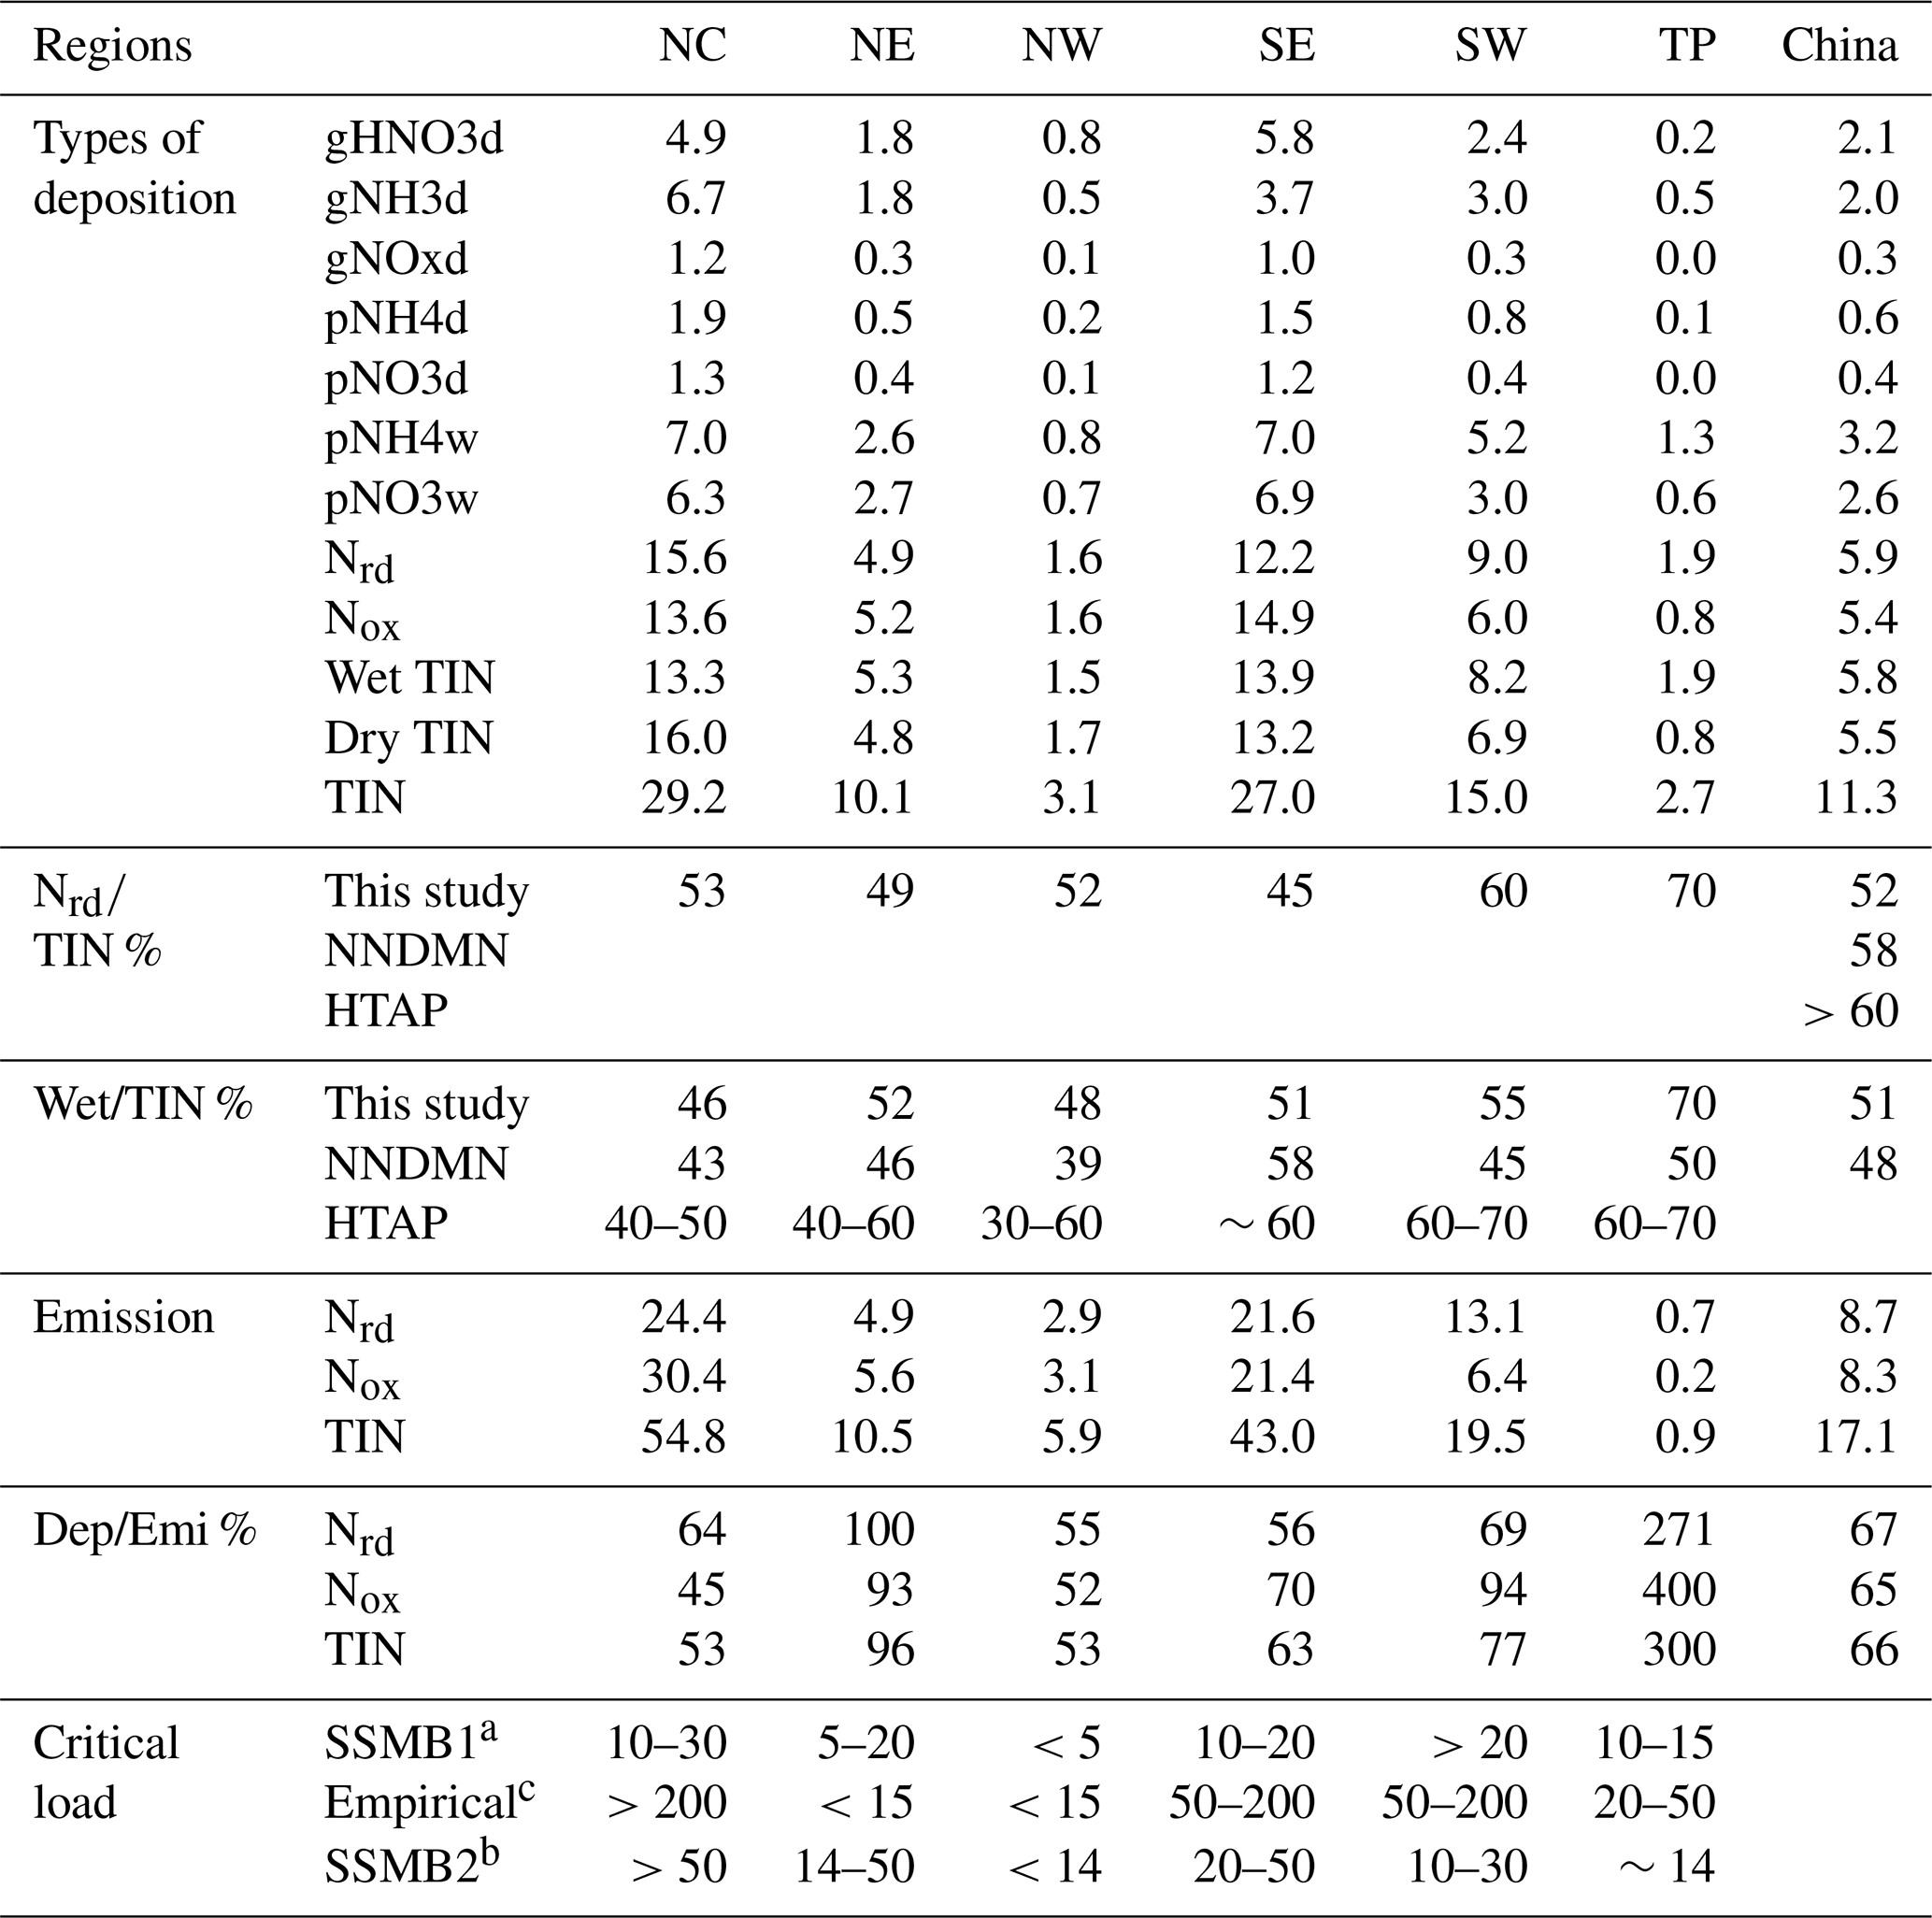
a Duan et al. (2011). b Zhao et al. (2009). c Liu et al. (2011).
For regions, the area-average deposition of TIN was as high as 29.2 kg N ha−1 and 27 kg N ha−1 in NC and SE, followed by 15 kg N ha−1 and 10.1 kg N ha−1 in SW and NE, respectively. The TIN in NW and TP was as low as 3.1 and 2.7 kg N ha−1. In the two highest regions of NC and SE, the deposition of TIN was similar, but the pathways to them were different. The Nrd deposition (53 %) and the dry deposition (54 %) contributed to more than half of the TIN in NC, while the Nox deposition (55 %) dominated the TIN in SE. Considering the lower ratio of NOx ∕ NH3 emissions in SE (21.4∕21.6, 0.99) than in NC (30.4∕24.4, 1.25), higher contribution of Nox to TIN in SE indicated a higher nitrogen oxidant ratio (i.e., the ratio of oxidation from NO2 to ) than in NC. Our companion paper (Tan et al., 2020) also revealed the higher nitrogen oxidation ratio in SE as 0.4–0.6, as compared with that in NC as 0.2–0.4. For more oxidant N species, i.e., HNO3 and , both dry and wet depositions were higher in SE than those shown in NC (5.8 versus 4.9 for dry deposition of gaseous HNO3 and 6.9 versus 6.3 for wet deposition of particulate ). While for less oxidant N and the reduced N, all types of depositions – such as the dry deposition of gaseous NOx, gaseous NH3 and the particulate – were less in SE than NC, except for the wet deposition of particulate , due to the much higher volume of rainfall in SE (Fig. S5 in the Supplement). Overall, the oxidant N made the emitted NOx easier to scavenge in SE, with the ratio of Nox deposition ∕ NOx emission reaching 70 %, while the reduced N is more likely to be scavenged from its emission with the ratio of 64 % in NC. The total ratio of TIN/emission in NC and SE was 53 % and 63 %, respectively. Compared to the critical load (CL; Duan et al., 2001; Zhao et al., 2009; Liu et al., 2011), which is a judgment of the deposited N effects on the ecosystem, the two regions almost reached and even exceeded to the CL value (Table 4) in some cases, indicating serious ecological impacts of the N deposition in NC and SE. More attention should be given to controlling N-related species, especially the Nrd in NC and Nox in SE.
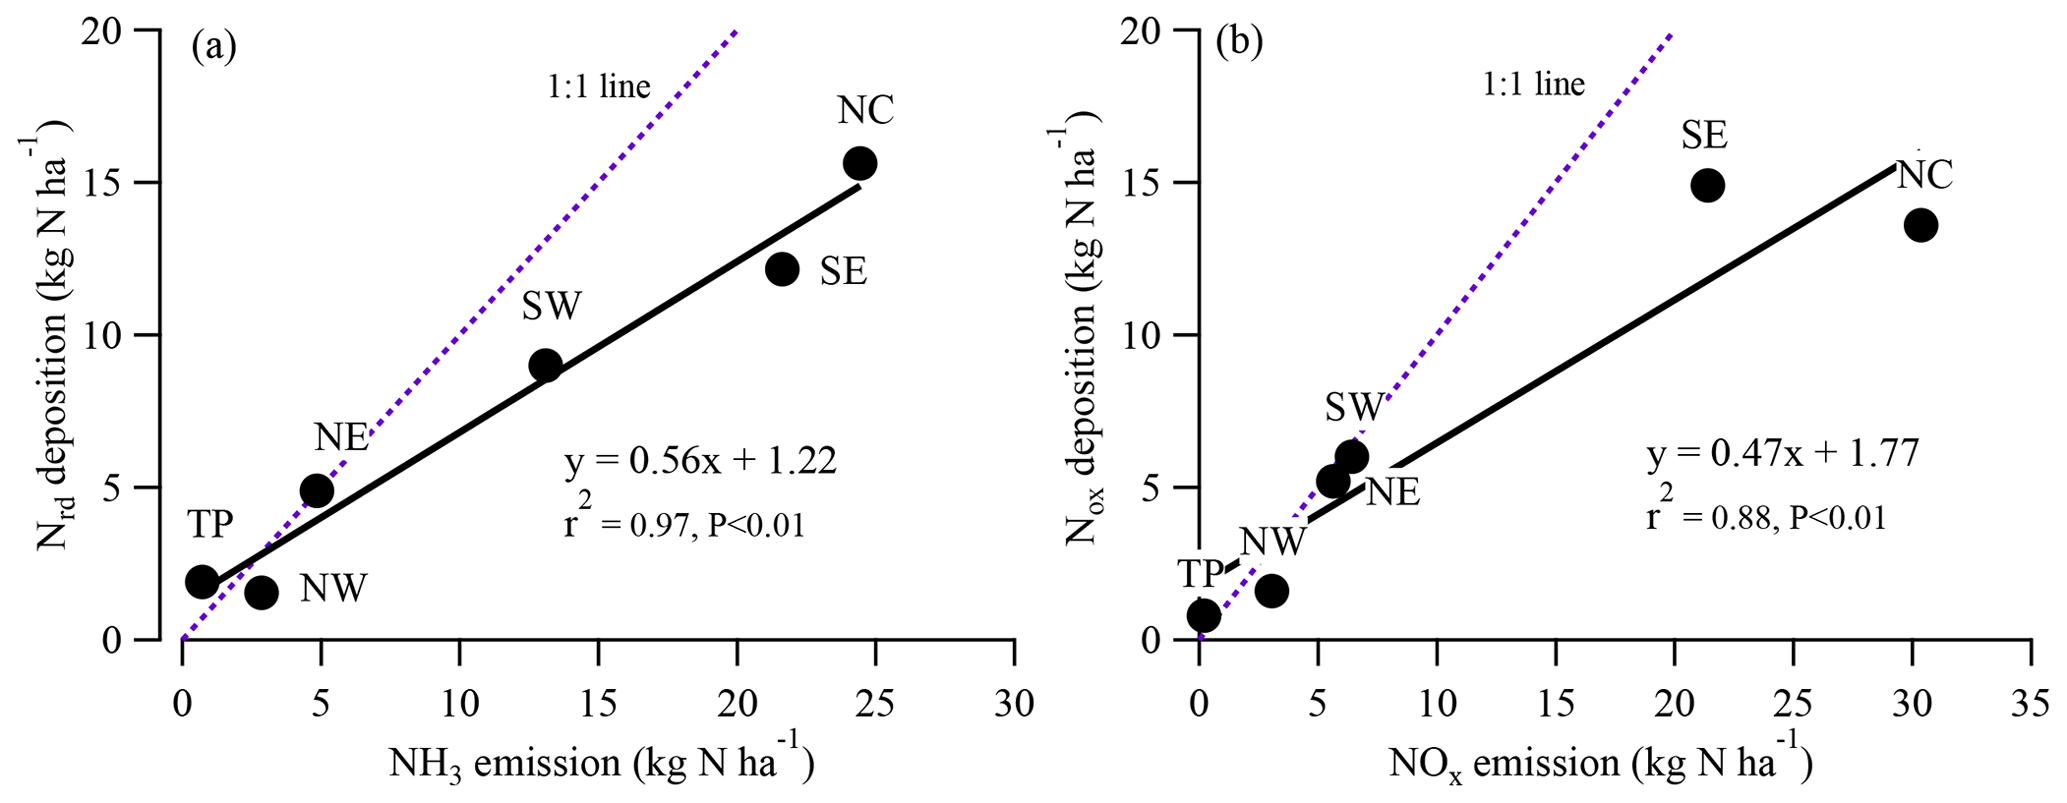
Figure 12The relationship of the Nrd deposition versus NH3 emission (a) and the relationship of Nox deposition versus NOx emission (b) in each region of China.
In the less developed economic and social area of SW, due to the high emission of NH3, 60 % of the TIN was contributed by Nrd deposition. The ratio of NOx ∕ NH3 emissions reached 0.49 as more NH3 was emitted from agricultural activity than NOx from fossil fuel consumption. The ratio of wet deposition/TIN was 55 %, which was lower than the HTAP comparison during 2000 (60 %–70 %; Vet et al., 2014) but higher than the results of NNDMN (45 %; Xu et al., 2015). Although socially undeveloped, the TIN deposition was almost as high as the CL value according to Zhao et al. (2009). Besides the high emission of NH3, the high ratio of Nox deposition ∕ NOx emission of up to 94 % reflects the importance of Nox from high emission areas, such as SE and NC, and should attract our attention in this region. Although the N deposition in TP was not as high as CL value – which was the lowest in all regions of China, with the value of 2.7 kg N ha−1 – the N ecological impacts cannot be neglected due to its sensitive ecosystem (Shen et al., 2019) and the important climatic influence it has on all of China. Considering the high ratio of TIN ∕ emissions, which were larger than 1:1 – with 3:1 for TIN, 2.71:1 for Nrd and 4:1 for Nox – the imports from outside the region were responsible for the N deposition in TP.
Reactive N depositions over China simulated in the framework of MICS-Asia III have been compared within each participant model. Wet deposition was also validated by multisource observations, i.e., recorded data from EANET, CAS, NNDMN and EPA in the Guangdong and Liaoning provinces. Most models show the consistent spatial and temporal variations of both Nox and Nrd wet deposition in China with the NME around 50 %, which is lower than the value of 70 % based on EANET observations over Asia. The coefficient of variation (CV) was applied for model comparison of dry deposition and the related precursor's concentration in the air mass. Consistency of both the spatial and temporal variation of CV in deposition and the concentration in air mass indicates that performance of the precursors' simulation was highly correlated with their deposition.
A large deposition of ensemble simulations of Nrd deposition in eastern China corresponds with a low level of VCD from satellite measurements, while the case of Nox was just the contrary. The total emissions of NOx and NH3 were similar, at 8 kg N ha−1, in China. This indicates that the allocation of both NOx and NH3 from the deposition to the ground and the amount staying in the atmosphere were conserved from their emissions into the air, which also suggests that there were reasonable simulations of deposition for Nox and Nrd in MICS-Asia III.
Wet deposition of nitrate and ammonium and the dry deposition of gaseous NH3 and HNO3 were the important pathways to TIN deposition, with the percentages of 18 %, 18 %, 23 % and 28 % for ensemble results, respectively. The gridded average Nrd in China dominated the TIN deposition, with the average percentage found to be 52 %, which is slightly lower than the reported 60 % and 58 % in HTAP and NNDMN measurements. The contribution of wet and dry deposition to TIN was almost half and half and consistent with that reported in NNDMN. Even the ratio of TIN/emissions was similar with the NNDMN, indicating that the spatial distribution and the relationships of deposition and emissions are comparable with those measured in the NNDMN.
For different regions of China, the simulated Nox wet deposition was overestimated in NE but underestimated in SE and SW, while large uncertainties were shown in NC. Two models simulated 30 %–50 % higher Nox wet deposition, and four models were 20 %–40 % lower compared to observations in NC. The large divergences not only exist between different models but also in the same (CMAQ) model, i.e., M1–M6. For the simulation of Nrd wet deposition, all the models underpredicted in all regions, with the largest underestimation in NC and SE. While different from Nox, an almost similar behavior prediction of the less oxidative species, such as the Nrd wet deposition, has been found in CMAQ models, indicating the chemical reaction process is one of the most important factors affecting the model uncertainties in MICS-Asia III. Compared to the CL value, the reactive N deposition in NC, SE and SW reached or exceeded the reported CL value and indicates serious ecological impacts. The control of Nrd in NC and SW and Nox in SE would be effective in mitigating the TIN deposition in these regions. For the lowest reactive N deposition in TP, however, the N ecological impacts cannot be neglected since it has a sensitive ecosystem, and it has an important climatic influence on all of China, especially considering the high ratio of TIN/emissions, which was mainly caused by outside sources. The joint prevention and control of air pollution in China should be carefully considered and implemented in the future.
The observed data are available, on request, for scientific research purposes from Baozhu Ge at the Institute of Atmospheric Physics, Chinese Academy of Sciences (gebz@mail.iap.ac.cn).
The supplement related to this article is available online at: https://doi.org/10.5194/acp-20-10587-2020-supplement.
BG designed the whole structure of this work, and prepared the manuscript with contributions from all coauthors. BG, SI and KS led the deposition analysis group in MICS-Asia III. DX, JW, FF and QT helped with the data processing. JSF, XW, KY, TN, JL, MK, HL and MZ performed the model simulations and contributed by submitting their simulated deposition results. ZW performed the meteorological model simulation and examined the model performance. ML, JW, JK and QW prepared the emission inventory data. YP and XL supported the observation data in China. ZW was involved in the scientific interpretation and discussion.
The authors declare that they have no conflict of interest.
This article is part of the special issue “Regional assessment of air pollution and climate change over East and Southeast Asia: results from MICS-Asia Phase III”. It is not associated with a conference.
We appreciate the Guangdong and Liaoning EPA for providing the observation data of the Guangdong and Liaoning provinces. We also appreciate the help we received from Rich Rifkin and Chuanhong Zhang to improve the language of this paper.
This work is supported by the National Natural Science Foundation of China (grant nos. 41620104008, 41877313, 41575123 and 91744206) and the National Key Research and Development Plan (grant no. 2017YFC0210100).
This paper was edited by Qiang Zhang and reviewed by two anonymous referees.
Aikawa, M. and Hiraki, T.: Washout/rainout contribution in wet deposition estimated by 0.5 mm precipitation sampling/analysis, Atmos. Environ., 43, 4935–4939, 2009.
Aikawa, M., Kajino, M., Hiraki, T., and Mukai, H.: The contribution of site to washout and rainout: Precipitation chemistry based on sample analysis from 0.5 mm precipitation increments and numerical simulation, Atmos. Environ., 95, 165–174, https://doi.org/10.1016/j.atmosenv.2014.06.015, 2014.
Bae, S. Y., Park, R. J., Yong, P. K., and Woo, J. H.: Effects of below-cloud scavenging on the regional aerosol budget in East Asia, Atmos. Environ., 58, 14–22, 2012.
Benitez, J. M. G., Cape, J. N., Heal, M. R., van Dijk, N., and Diez, A. V.: Atmospheric nitrogen deposition in south-east Scotland: Quantification of the organic nitrogen fraction in wet, dry and bulk deposition, Atmos. Environ., 43, 4087–4094, https://doi.org/10.1016/j.atmosenv.2009.04.061, 2009.
Bey, I., Jacob, D. J., Yantosca, R. M., Logan, J. A., Field, B. D., Fiore, A. M., Li, Q. B., Liu, H. Y., Mickley, L. J., and Schultz, M. G.: Global Modeling of Tropospheric Chemistry with Assimilated Meteorology: Model Description and Evaluation, J. Geophys. Res., 106, 23073–23095, 2001.
Bleeker, A., Hicks, W. K., Dentener, F., Galloway, J., and Erisman, J. W.: N deposition as a threat to the World's protected areas under the Convention on Biological Diversity, Environ. Pollut., 159, 2280–2288, 2011.
Byun, D., and Schere, K. L.: Review of the governing equations, computational algorithms, and other components of the models-3 Community Multiscale Air Quality (CMAQ) modeling system, Appl. Mech. Rev., 59, 51–77, https://doi.org/10.1115/1.2128636, 2006.
Carlton, A. G., Bhave, P. V., Napelenok, S. L., Edney, E. O., Sarwar, G., Pinder, R. W., Pouliot, G. A., and Houyoux, M.: 5 Model representation of secondary organic aerosol in CMAQv4.7, Environ. Sci. Technol., 44, 8553–8560, https://doi.org/10.1021/es100636q, 2010.
Carmichael, G. R., Calori, G., Hayami, H., Uno, I., Cho, S. Y., Engardt, M., Kim, S. B., Ichikawa, Y., Ikeda, Y., Woo, J. H., Ueda, H., and Amann, M.: The MICS-Asia study: model intercomparison of long-range transport and sulfur deposition in East Asia, Atmos. Environ., 36, 175–199, 2002.
Carmichael, G. R., Sakurai, T., Streets, D., Hozumi, Y., Ueda, H., Park, S. U., Fung, C., Han, Z., Kajino, M., Engardt, M., Bennet, C., Hayami, H., Sartelet, K., Holloway, T., Wang, Z., Kannari, A., Fu, J., Matsuda, K., Thongbooncho, N., and Amann, M.: MICS-Asia II: The model intercomparison study for Asia Phase II methodology and overview of findings, Atmos. Environ., 42, 3468–3490, 2008.
Carter, W. L.: Implementation of the SAPRC-99 chemical mechanism into the Models-3 framework, Report to the United States Environmental Protection Agency, available at: http://www.engr.ucr.edu/~carter/pubs/s99mod3.pdf (last access: 20 March 2019), 2000.
Chen, C., Park, T., Wang, X., Piao, S., Xu, B., Chaturvedi, R. K., Fuchs, R., Brovkin, V., Ciais, P., Fensholt, R., Tømmervik, H., Bala, G., Zhu, Z., Nemani, R. R., and Myneni, R. B.: China and India lead in greening of the world through land-use management, Nat. Sustain., 2, 122–129, https://doi.org/10.1038/s41893-019-0220-7, 2019a.
Chen, L., Gao, Y., Zhang, M., Fu, J. S., Zhu, J., Liao, H., Li, J., Huang, K., Ge, B., Wang, X., Lam, Y. F., Lin, C.-Y., Itahashi, S., Nagashima, T., Kajino, M., Yamaji, K., Wang, Z., and Kurokawa, J.: MICS-Asia III: multi-model comparison and evaluation of aerosol over East Asia, Atmos. Chem. Phys., 19, 11911–11937, https://doi.org/10.5194/acp-19-11911-2019, 2019b.
Clark, C. M. and Tilman, D.: Loss of plant species after chronic low-level nitrogen deposition to prairie grasslands, Nature, 451, 712–715, 2008.
Clark, H. and Kremer, J. N.: Estimating direct and episodic atmospheric nitrogen deposition to a coastal waterbody, Mar. Environ. Res., 59, 349–366, 2005.
Colella, P. and Woodward, P. R.: The piecewise parabolic method (PPM) for gas dynamical simulations, J. Comp. Phys., 54, 174–201, 1984.
Dise, N. B. and Wright, R. F.: Nitrogen leaching from European forests in relation to nitrogen deposition, Forest Ecol. Manage., 71, 153–161, 1995.
Duan, L., Xie, S. D., Zhou, Z. P., Ye, X. M., and Hao, J. M.: Calculation and mapping of critical loads for S, N and acidity in China, Water Air Soil Pollut., 130, 1199–1204, 2001.
Duce, R. A., LaRoche, J., Altieri, K., Arrigo, K. R., Baker, A. R., Capone, D. G., Cornell, S., Dentener, F., Galloway, J., Ganeshram, R. S., Geider, R. J., Jickells, T., Kuypers, M. M., Langlois, R., Liss, P. S., Liu, S. M., Middelburg, J. J., Moore, C. M., Nickovic, S., Oschlies, A., Pedersen, T., Prospero, J., Schlitzer, R., Seitzinger, S., Sorensen, L. L., Uematsu, M., Ulloa, O., Voss, M., Ward, B., and Zamora, L.: Impacts of atmospheric anthropogenic nitrogen on the open ocean, Science, 320, 893–897, https://doi.org/10.1126/science.1150369, 2008.
EANET: Technical Manual for Wet Deposition Monitoring in East Asia, available at: https://www.eanet.asia/wp-content/uploads/2019/04/techwet.pdf (last access: 6 September 2020), 2010.
Erisman, J. W., Sutton, M. A., Galloway, J., Klimont, Z., and Winiwarter, W.: How a century of ammonia synthesis changed the world, Nat. Geosci., 1, 636–639, 2008.
Fenn, M. E., Poth, M. A., Aber, J. D., Baron, J. S., Bormann, B. T., Johnson, D. W., Lemly, A. D., Mcnulty, S. G., Ryan, D. F., and Stottlemyer, R.: Nitrogen excess in North American ecosystems: predisposing factors, ecosystem responses, and management strategies, Ecol. Appl., 8, 706–733, 1998.
Fountoukis, C. and Nenes, A.: ISORROPIA II: a computationally efficient thermodynamic equilibrium model for K+–Ca2+–Mg2+––Na+–––Cl−–H2O aerosols, Atmos. Chem. Phys., 7, 4639–4659, https://doi.org/10.5194/acp-7-4639-2007, 2007.
Galloway, J. N., Dentener, F. J., Capone, D. G., Boyer, E. W., Howarth, R. W., Seitzinger, S. P., Asner, G. P., Cleveland, C. C., Green, P. A., Holland, E. A., Karl, D. M., Michaels, A. F., Porter, J. H., Townsend, A. R., and Vorosmarty, C. J.: Nitrogen cycles: past, present, and future, Biogeochemistry, 70, 153–226, 2004.
Galloway, J. N., Townsend, A. R., Erisman, J. W., Bekunda, M., Cai, Z. C., Freney, J. R., Martinelli, L. A., Seitzinger, S. P., and Sutton, M. A.: Transformation of the nitrogen cycle: Recent trends, questions, and potential solutions, Science, 320, 889–892, 2008.
Ge, B., Xu, X., Ma, Z., Pan, X., Wang, Z., Lin, W., Ouyang, B., Xu, D., Lee, J., Zheng, M., Ji, D., Sun, Y., Dong, H., Squires, F. A., Fu, P., and Wang, Z.: Role of ammonia on the feedback between AWC and inorganic aerosol formation during heavy pollution in the North China Plain, Earth Space Sci., 6, 1675–1693, https://doi.org/10.1029/2019ea000799, 2019.
Ge, B. Z., Wang, Z. F., Xu, X. B., Tang, J., He, Y. J., Uno, I., and Ohara, T.: Impact of the East Asian summer monsoon on long-term variations in the acidity of summer precipitation in Central China, Atmos. Chem. Phys., 11, 1671–1684, https://doi.org/10.5194/acp-11-1671-2011, 2011.
Guenther, A., Karl, T., Harley, P., Wiedinmyer, C., Palmer, P. I., and Geron, C.: Estimates of global terrestrial isoprene emissions using MEGAN (Model of Emissions of Gases and Aerosols from Nature), Atmos. Chem. Phys., 6, 3181–3210, https://doi.org/10.5194/acp-6-3181-2006, 2006.
Han, Z., Sakurai, T., Ueda, H., Carmichael, G. R., Streets, D., Hayami, H., Wang, Z., Holloway, T., Engardt, M., Hozumi, Y., Park, S. U., Kajino, M., Sartelet, K., Fung, C., Bennet, C., Thongboonchoo, N., Tang, Y., Chang, A., Matsuda, K., and Amann, M.: MICS-Asia II: Model intercomparison and evaluation of ozone and relevant species, Atmos. Environ., 42, 3491–3509, 2008.
Hayami, H., Sakurai, T., Han, Z., Ueda, H., Carmichael, G. R., Streets, D., Holloway, T., Wang, Z., Thongboonchoo, N., Engardt, M., Bennet, C., Fung, C., Chang, A., Park, S. U., Kajino, M., Sartelet, K., Matsuda, K., and Amann, M.: MICS-Asia II: Model intercomparison and evaluation of particulate sulfate, nitrate and ammonium, Atmos. Environ., 42, 3510–3527, 2008.
Holloway, T., Sakurai, T., Han, Z., Ehlers, S., Spak, S. N., Horowitz, L. W., Carmichael, G. R., Streets, D. G., Hozumi, Y., Ueda, H., Park, S. U., Fung, C., Kajino, M., Thongboonchoo, N., Engardt, M., Bennet, C., Hayami, H., Sartelet, K., Wang, Z., Matsuda, K., and Amann, M.: MICS-Asia II: Impact of global emissions on regional air quality in Asia, Atmos. Environ., 42, 3543–3561, 2008.
Holtgrieve, G. W., Schindler, D. E., Hobbs, W. O., Leavitt, P. R., Ward, E. J., Bunting, L., Chen, G. J., Finney, B. P., Gregory-Eaves, I., Holmgren, S., Lisac, M. J., Lisi, P. J., Nydick, K., Rogers, L. A., Saros, J. E., Selbie, D. T., Shapley, M. D., Walsh, P. B., and Wolfe, A. P.: A Coherent Signature of Anthropogenic Nitrogen Deposition to Remote Watersheds of the Northern Hemisphere, Science, 334, 1545–1548, 2011.
Holtslag, A. A. M. and Boville, B.: Local versus nonlocal boundary layer diffusion in a global climate model, J. Clim., 6, 1825–1842, 1993.
Itahashi, S., Yumimoto, K., Uno, I., Hayami, H., Fujita, S.-I., Pan, Y., and Wang, Y.: A 15-year record (2001–2015) of the ratio of nitrate to non-sea-salt sulfate in precipitation over East Asia, Atmos. Chem. Phys., 18, 2835–2852, https://doi.org/10.5194/acp-18-2835-2018, 2018.
Itahashi, S., Ge, B., Sato, K., Fu, J. S., Wang, X., Yamaji, K., Nagashima, T., Li, J., Kajino, M., Liao, H., Zhang, M., Wang, Z., Li, M., Kurokawa, J., Carmichael, G. R., and Wang, Z.: MICS-Asia III: overview of model intercomparison and evaluation of acid deposition over Asia, Atmos. Chem. Phys., 20, 2667–2693, https://doi.org/10.5194/acp-20-2667-2020, 2020.
Janjic, Z.: The step-mountain eta coordinate model: Further developments of the convection, viscous sublayer, and turbulence closure schemes, Mon. Weather Rev., 122, 927–945, 1994.
Janssens, I. A., Dieleman, W., Luyssaert, S., Subke, J. A., Reichstein, M., Ceulemans, R., Ciais, P., Dolman, A. J., Grace, J., Matteucci, G., Papale, D., Piao, S. L., Schulze, E. D., Tang, J., and Law, B. E.: Reduction of forest soil respiration in response to nitrogen deposition, Nat. Geosci., 3, 315–322, 2010.
Kajino, M., Ueda, H., Sato, K., and Sakurai, T.: Spatial distribution of the source-receptor relationship of sulfur in Northeast Asia, Atmos. Chem. Phys., 11, 6475–6491, https://doi.org/10.5194/acp-11-6475-2011, 2011.
Kajino, M., Sato, K., Inomata, Y., and Ueda, H.: Source–receptor relationships of nitrate in Northeast Asia and influence of sea salt on the long-range transport of nitrate, Atmos. Environ., 79, 67–78, https://doi.org/10.1016/j.atmosenv.2013.06.024, 2013.
Kajino, M., Deushi, M., Sekiyama, T. T., Oshima, N., Yumimoto, K., Tanaka, T. Y., Ching, J., Hashimoto, A., Yamamoto, T., Ikegami, M., Kamada, A., Miyashita, M., Inomata, Y., Shima, S., Adachi, K., Zaizen, Y., Igarashi, Y., Ueda, H., Maki, T., and Mikami, M.: NHM-Chem, the Japan MeteorologicalAgency's regional meteorology – chemistry model (v1.0): model description and aerosol representations, Geosci. Model Dev. Discuss., https://doi.org/10.5194/gmd-2018-128, 2018.
Kajino, M., Deushi, M., Sekiyama, T. T., Oshima, N., Yumimoto, K., Tanaka, T. Y., Ching, J., Hashimoto, A., Yamamoto,T., Ikegami, M., Kamada, A., Miyashita, M., Inomata, Y., Shima, S., Takami, A., Shimizu, A., Hatakeyama, S., Sadanaga, Y., Irie, H., Adachi, K., Zaizen, Y., Igarashi, Y., Ueda, H., Maki, T., and Mikami, M., NHM-Chem, the Japan Meteorological Agency's regional meteorology – chemistry model: model evaluations toward the consistent predictions of the chemical, physical, and optical properties of aerosols, J. Meteor. Soc. Japan, 97, 337–374, https://doi.org/10.2151/jmsj.2019-020, 2019.
Kong, L., Tang, X., Zhu, J., Wang, Z., Pan, Y., Wu, H., Wu, L., Wu, Q., He, Y., Tian, S., Xie, Y., Liu, Z., Sui, W., Han, L., and Carmichael, G.: Improved Inversion of Monthly Ammonia Emissions in China Based on the Chinese Ammonia Monitoring Network and Ensemble Kalman Filter, Environ. Sci. Technol., 53, 12529–12538, https://doi.org/10.1021/acs.est.9b02701, 2019.
Kong, L., Tang, X., Zhu, J., Wang, Z., Fu, J. S., Wang, X., Itahashi, S., Yamaji, K., Nagashima, T., Lee, H.-J., Kim, C.-H., Lin, C.-Y., Chen, L., Zhang, M., Tao, Z., Li, J., Kajino, M., Liao, H., Wang, Z., Sudo, K., Wang, Y., Pan, Y., Tang, G., Li, M., Wu, Q., Ge, B., and Carmichael, G. R.: Evaluation and uncertainty investigation of the NO2, CO and NH3 modeling over China under the framework of MICS-Asia III, Atmos. Chem. Phys., 20, 181–202, https://doi.org/10.5194/acp-20-181-2020, 2020.
Li, M., Zhang, Q., Kurokawa, J.-I., Woo, J.-H., He, K., Lu, Z., Ohara, T., Song, Y., Streets, D. G., Carmichael, G. R., Cheng, Y., Hong, C., Huo, H., Jiang, X., Kang, S., Liu, F., Su, H., and Zheng, B.: MIX: a mosaic Asian anthropogenic emission inventory under the international collaboration framework of the MICS-Asia and HTAP, Atmos. Chem. Phys., 17, 935–963, https://doi.org/10.5194/acp-17-935-2017, 2017.
Li, J., Nagashima, T., Kong, L., Ge, B., Yamaji, K., Fu, J. S., Wang, X., Fan, Q., Itahashi, S., Lee, H.-J., Kim, C.-H., Lin, C.-Y., Zhang, M., Tao, Z., Kajino, M., Liao, H., Li, M., Woo, J.-H., Kurokawa, J., Wang, Z., Wu, Q., Akimoto, H., Carmichael, G. R., and Wang, Z.: Model evaluation and intercomparison of surface-level ozone and relevant species in East Asia in the context of MICS-Asia Phase III – Part 1: Overview, Atmos. Chem. Phys., 19, 12993–13015, https://doi.org/10.5194/acp-19-12993-2019, 2019a.
Li, R., Cui, L., Zhao, Y., Zhang, Z., Sun, T., Li, J., Zhou, W., Meng, Y., Huang, K., and Fu, H.: Wet deposition of inorganic ions in 320 cities across China: spatio-temporal variation, source apportionment, and dominant factors, Atmos. Chem. Phys., 19, 11043–11070, https://doi.org/10.5194/acp-19-11043-2019, 2019b.
Li, Y., Schichtel, B. A., Walker, J. T., Schwede, D. B., Chen, X., Lehmann, C. M. B., Puchalski, M. A., Gay, D. A., and Collett Jr., J. L.: Increasing importance of deposition of reduced nitrogen in the United States, Proc. Natl. Acad. Sci. USA, 113, 5874–5879, https://doi.org/10.1073/pnas.1525736113, 2016.
Lin, M., Oki, T., Bengtsson, M., Kanae, S., Holloway, T., and Streets, D. G.: Long-range transport of acidifying substances in east Asia – Part II – Source-receptor relationships, Atmos. Environ., 42, 5956–5967, https://doi.org/10.1016/j.atmosenv.2008.03.039, 2008.
Liu, M., Huang, X., Song, Y., Tang, J., Cao, J., Zhang, X., Zhang, Q., Wang, S., Xu, T., Kang, L., Cai, X., Zhang, H., Yang, F., Wang, H., Yu, J. Z., Lau, A. K. H., He, L., Huang, X., Duan, L., Ding, A., Xue, L., Gao, J., Liu, B., and Zhu, T.: Ammonia emission control in China would mitigate haze pollution and nitrogen deposition, but worsen acid rain, Proc. Natl. Acad. Sci. USA, 116, 7760, https://doi.org/10.1073/pnas.1814880116, 2019.
Liu, X. J., Duan, L., Mo, J. M., Du, E. Z., Shen, J. L., Lu, X. K., Zhang, Y., Zhou, X. B., He, C. N., and Zhang, F. S.: Nitrogen deposition and its ecological impact in China: An overview, Environ. Pollut., 159, 2251–2264, 2011.
Liu, X. J., Zhang, Y., Han, W. X., Tang, A. H., Shen, J. L., Cui, Z. L., Vitousek, P., Erisman, J. W., Goulding, K., Christie, P., Fangmeier, A., and Zhang, F. S.: Enhanced nitrogen deposition over China, Nature, 494, 459–462, 2013.
Liu, H., Jacob, D. J., Bey, I., and Yantosca, R. M.: Constraints from 210Pb and 7Be on wet deposition and transport in a globalthree-dimensional chemical, J. Geophys. Res., 106, 12109–12128, 2001.
Mann, G. W., Carslaw, K. S., Reddington, C. L., Pringle, K. J., Schulz, M., Asmi, A., Spracklen, D. V., Ridley, D. A., Woodhouse, M. T., Lee, L. A., Zhang, K., Ghan, S. J., Easter, R. C., Liu, X., Stier, P., Lee, Y. H., Adams, P. J., Tost, H., Lelieveld, J., Bauer, S. E., Tsigaridis, K., van Noije, T. P. C., Strunk, A., Vignati, E., Bellouin, N., Dalvi, M., Johnson, C. E., Bergman, T., Kokkola, H., von Salzen, K., Yu, F., Luo, G., Petzold, A., Heintzenberg, J., Clarke, A., Ogren, J. A., Gras, J., Baltensperger, U., Kaminski, U., Jennings, S. G., O'Dowd, C. D., Harrison, R. M., Beddows, D. C. S., Kulmala, M., Viisanen, Y., Ulevicius, V., Mihalopoulos, N., Zdimal, V., Fiebig, M., Hansson, H.-C., Swietlicki, E., and Henzing, J. S.: Intercomparison and evaluation of global aerosol microphysical properties among AeroCom models of a range of complexity, Atmos. Chem. Phys., 14, 4679–4713, https://doi.org/10.5194/acp-14-4679-2014, 2014.
Nenes, A., Pandis, S. N., and Pilinis, C.: ISORROPIA: A new thermodynamic equilibrium model for multiphase multicomponent inorganic aerosols, Aquat. Geoch., 4, 123–152, 1998.
Nicolas, G. and Galloway, J. N.: An Earth-system perspective of the global nitrogen cycle, Nature, 451, 293–296, 2008.
Pan, Y. P., Wang, Y. S., Tang, G. Q., and Wu, D.: Wet and dry deposition of atmospheric nitrogen at ten sites in Northern China, Atmos. Chem. Phys., 12, 6515–6535, https://doi.org/10.5194/acp-12-6515-2012, 2012.
Pan, Y., Tian, S., Zhao, Y., Zhang, L., Zhu, X., Gao, J., Huang, W., Zhou, Y., Song, Y., and Zhang, Q.: Identifying ammonia hotspots in China using a national observation network, Environ. Sci. Technol., 52, 3926–3934, 2018.
Phoenix, G. K., Hicks, W. K., Cinderby, S., Kuylenstierna, J. C. I., Stock, W. D., Dentener, F. J., Giller, K. E., Austin, A. T., Lefroy, R. D. B., Gimeno, B. S., Ashmore, M. R., and Ineson, P.: Atmospheric nitrogen deposition in world biodiversity hotspots: the need for a greater global perspective in assessing N deposition impacts, Glob. Change Biol., 12, 470–476, 2006.
Pielke, R. A., Cotton, W. R., Walko, R. L., Tremback, C. J., Lyons, W. A., Grasso, L. D., Nicholls, M. E., Moran, M. D., Wesley, D. A., Lee, T. J., and Copeland, J. H.: A comprehensive meteorological modeling system – RAMS, Meteorol. Atmos. Phys., 49, 69–91, https://doi.org/10.1007/BF01025401, 1992.
Pleim, J. E., Xiu, A., Finkelstein, P. L., and Otte, T. L.: A coupled land-surface and dry deposition model and comparison to field measurements of surface heat, moisture, and ozone fluxes, Water Air Soil Pollut. Focus, 1, 243–252, https://doi.org/10.1023/A:1013123725860, 2001.
Pleim, J. E.: A combined local and nonlocal closure model for the atmospheric boundary layer, Part I: Model description and testing, J. Appl. Meteor. Climatol., 46, 1383–1395, 2007a.
Pleim, J. E.: A combined local and nonlocal closure model for the atmospheric boundary layer. Part II: Application and evaluation in a mesoscale meteorological model, J. Appl. Meteorol. Clim., 46, 1396–1409, 2007b.
Seinfeld, J. H. and Pandis, S. N.: Atmospheric chemistry and physics: from air pollution to climate change, Wiley, New York, 2006.
Shen, H., Dong, S., Li, S., Xiao, J., Han, Y., Yang, M., Zhang, J., Gao, X., Xu, Y., Li, Y., Zhi, Y., Liu, S., Dong, Q., Zhou, H., and Yeomans, J. C.: Effects of simulated N deposition on photosynthesis and productivity of key plants from different functional groups of alpine meadow on Qinghai-Tibetan plateau, Environ. Pollut., 251, 731–737, https://doi.org/10.1016/j.envpol.2019.05.045, 2019.
Sudo, K., Takahashi, M., Kurokawa, J. I., and Akimoto, H.: CHASER: A global chemical model of the troposphere 1. Model description, J. Geophys. Res., 107, 4339, https://doi.org/10.1029/2001JD001113, 2002.
Tan, J., Fu, J. S., Carmichael, G. R., Itahashi, S., Tao, Z., Huang, K., Dong, X., Yamaji, K., Nagashima, T., Wang, X., Liu, Y., Lee, H.-J., Lin, C.-Y., Ge, B., Kajino, M., Zhu, J., Zhang, M., Liao, H., and Wang, Z.: Why do models perform differently on particulate matter over East Asia? A multi-model intercomparison study for MICS-Asia III, Atmos. Chem. Phys., 20, 7393–7410, https://doi.org/10.5194/acp-20-7393-2020, 2020.
Tang, J., Chen, H. B., Yu, X. L., Wang, S., Yao, P., Lv, B., Xu, X. B., and Ding, G.: Evaluation of results of station inter-comparison with blind samples in Acid Rain Monitoring Network in China(in Chinese), Meteorol. Monthly, 33, 75–83, 2007.
Tang, J., Xu, X., Ba, J., and Wang, S.: Trends of the precipitation acidity over China during 1992–2006, Chinese Sci. Bull., 5, 1–9, 2010.
van der Werf, G. R., Randerson, J. T., Giglio, L., Collatz, G. J., Mu, M., Kasibhatla, P. S., Morton, D. C., DeFries, R. S., Jin, Y., and van Leeuwen, T. T.: Global fire emissions and the contribution of deforestation, savanna, forest, agricultural, and peat fires (1997–2009), Atmos. Chem. Phys., 10, 11707–11735, https://doi.org/10.5194/acp-10-11707-2010, 2010.
Vet, R., Artz, R. S., Carou, S., Shaw, M., Ro, C. U., Aas, W., Baker, A., Bowersox, V. C., Dentener, F., Galy-Lacaux, C., Hou, A., Pienaar, J. J., Gillett, R., Forti, M. C., Gromov, S., Hara, H., Khodzher, T., Mahowald, N. M., Nickovic, S., Rao, P. S. P., and Reid, N. W.: A global assessment of precipitation chemistry and deposition of sulfur, nitrogen, sea salt, base cations, organic acids, acidity and pH, and phosphorus, Atmos. Environ., 93, 3–100, 2014.
Walcek, C. J., and Aleksic, N. M.: A simple but accurate mass conservative peak-preserving, mixing ratio bounded advection algorithm with fortran code, Atmos. Environ., 32, 3863–3880, 1998.
Wang, Y., Yu, W., Pan, Y., and Wu, D.: Acid neutralization of precipitation in Northern China, J Air Waste Manag. Assoc., 62, 204–211, 2012.
Wang, Y. X., McElroy, M. B., Jacob, D. J., and Yantosca, R. M.: A nested grid formulation for chemical transport model over Asia: Applications to CO, J. Geophys. Res., 109, D22307, https://doi.org/10.1029/2004JD005237, 2004.
Wang, Z. F., Xie, F. Y., Sakurai, T., Ueda, H., Han, Z. W., Carmichael, G. R., Streets, D., Engardt, M., Holloway, T., Hayami, H., Kajino, M., Thongboonchoo, N., Bennet, C., Park, S. U., Fung, C., Chang, A., Sartelet, K., and Amann, M.: MICS-Asia II: Model inter-comparison and evaluation of acid deposition, Atmos. Environ., 42, 3528–3542, 2008.
Wesely, M. L.: Parameterization of surface resistance to gaseous dry deposition in regional numerical models, Atmos. Environ., 16, 1293–1304, 1989.
Wolfe, G. M., Thornton, J. A., Bouvier-Brown, N. C., Goldstein, A. H., Park, J.-H., McKay, M., Matross, D. M., Mao, J., Brune, W. H., LaFranchi, B. W., Browne, E. C., Min, K.-E., Wooldridge, P. J., Cohen, R. C., Crounse, J. D., Faloona, I. C., Gilman, J. B., Kuster, W. C., de Gouw, J. A., Huisman, A., and Keutsch, F. N.: The Chemistry of Atmosphere-Forest Exchange (CAFE) Model – Part 2: Application to BEARPEX-2007 observations, Atmos. Chem. Phys., 11, 1269–1294, https://doi.org/10.5194/acp-11-1269-2011, 2011.
Xu, D., Ge, B., Wang, Z., Sun, Y., Chen, Y., Ji, D., Yang, T., Ma, Z., Cheng, N., Hao, J., and Yao, X.: Below-cloud wet scavenging of soluble inorganic ions by rain in Beijing during the summer of 2014, Environ. Pollut., 230, 963–973, https://doi.org/10.1016/j.envpol.2017.07.033, 2017.
Xu, D., Ge, B., Chen, X., Sun, Y., Cheng, N., Li, M., Pan, X., Ma, Z., Pan, Y., and Wang, Z.: Multi-method determination of the below-cloud wet scavenging coefficients of aerosols in Beijing, China, Atmos. Chem. Phys., 19, 15569–15581, https://doi.org/10.5194/acp-19-15569-2019, 2019.
Xu, W., Luo, X. S., Pan, Y. P., Zhang, L., Tang, A. H., Shen, J. L., Zhang, Y., Li, K. H., Wu, Q. H., Yang, D. W., Zhang, Y. Y., Xue, J., Li, W. Q., Li, Q. Q., Tang, L., Lu, S. H., Liang, T., Tong, Y. A., Liu, P., Zhang, Q., Xiong, Z. Q., Shi, X. J., Wu, L. H., Shi, W. Q., Tian, K., Zhong, X. H., Shi, K., Tang, Q. Y., Zhang, L. J., Huang, J. L., He, C. E., Kuang, F. H., Zhu, B., Liu, H., Jin, X., Xin, Y. J., Shi, X. K., Du, E. Z., Dore, A. J., Tang, S., Collett Jr., J. L., Goulding, K., Sun, Y. X., Ren, J., Zhang, F. S., and Liu, X. J.: Quantifying atmospheric nitrogen deposition through a nationwide monitoring network across China, Atmos. Chem. Phys., 15, 12345–12360, https://doi.org/10.5194/acp-15-12345-2015, 2015.
Yamartino, R. J.: Nonnegative, conserved scalar transport using grid-cell-centered, spectrally constrained Blackman cubics for applications on a variable-thickness mesh, Mon. Weather Rev., 121, 753–763, 1993.
Yuan, J., Ling, Z., Wang, Z., Lu, X., Fan, S., He, Z., Guo, H., Wang, X., and Wang, N.: PAN-Precursor Relationship and Process Analysis of PAN Variations in the Pearl River Delta Region, Atmosphere-Basel, 9, 372, https://doi.org/10.3390/atmos9100372, 2018.
Zaveri, R. A. and Peters, L. K.: A new lumped structure photochemical mechanism for large-scale applications, J. Geophys. Res., 104, 30387–30415, 1999.
Zhang, L., Brook, J. R., and Vet, R.: A revised parameterization for gaseous dry deposition in air-quality models, Atmos. Chem. Phys., 3, 2067–2082, https://doi.org/10.5194/acp-3-2067-2003, 2003.
Zhao, Y., Duan, L., Xing, J., Larssen, T., Nielsen, C. P., and Hao, J. M.: Soil Acidification in China: Is Controlling SO2 Emissions Enough?, Environ. Sci. Technol., 43, 8021–8026, 2009.