the Creative Commons Attribution 4.0 License.
the Creative Commons Attribution 4.0 License.
 | 10 Sep 2020
The impact of traffic on air quality in Ireland: insights from the simultaneous kerbside and suburban monitoring of submicron aerosols
Chunshui Lin
Darius Ceburnis
Eimear Heffernan
Stig Hellebust
John Gallagher
Ru-Jin Huang
Colin O'Dowd
Jurgita Ovadnevaite
To evaluate the impact of traffic on urban air quality, the chemical composition of submicron aerosols (PM1) and sources of organic aerosol (OA) were simultaneously investigated at a kerbside site in the Dublin city center and a residential site in suburban Dublin (∼ 5 km apart) from 4 September to 9 November in 2018. Through the detailed comparison of a 1-week nonheating period from 10 to 17 September and a 1-week heating period from 27 October to 4 November, black carbon (BC) was found to be the most dominant component (38 %–55 % or 5.6–7.1 µg m−3) of PM1 at the kerbside, while OA was the most important (46 %–64 % of PM1 or 1.0–8.1 µg m−3) at the residential site. The daily and weekly cycle of BC at the kerbside during the nonheating period pointed to the major source of vehicular emissions, consistent with that for nitrogen oxides (NOx). However, traffic emissions were found to have a minor impact on air quality at the residential site, due to its distance from traffic sources and the effects of wind speed and wind direction. As a result of vehicular emissions and the street canyon effect, the kerbside increment (from the urban background) ratio of up to 25 : 1 was found for BC during the nonheating period but reduced to 10 : 1 during the heating period due to the additional sources of solid fuel burning impacting the air quality at both sites simultaneously. OA source analysis shows only 16 %–28 % (0.9–1.0 µg m−3; upper limit for traffic due to the additional heating source of hydrocarbon-like OA – HOA) of OA at the kerbside associated with vehicular emissions, with higher contributions from cooking (18 %–36 % or 1.2 µg m−3), solid fuel burning (38 % or 2.4 µg m−3; resolved only during the heating period), and oxygenated OA (29 %–37 % or 1.2–1.9 µg m−3). At the residential site, solid fuel burning contributed to 60 % (4.9 µg m−3) of OA during the heating period, while oxygenated OA (OOA) accounted for almost 65 % (0.6 µg m−3) of OA during the nonheating period. Based on simultaneous investigations of PM1 at different urban settings (i.e., residential versus kerbside), this study highlights the temporal and spatial variability of sources within the Dublin city center and the need for additional aerosol characterization studies to improve targeted mitigation solutions for greater impact on urban air quality. Moreover, traffic and residential heating may hold different implications for health and climate, as indicated by the significant increment of BC at the kerbside and the large geographic impact of OA from residential heating at both the kerbside and residential sites.
- Article
(2810 KB) - Full-text XML
-
Supplement
(897 KB) - BibTeX
- EndNote


Aerosol particles adversely affect human health, causing morbidity and premature mortality (Pope III et al., 2002; Cohen et al., 2017; Burnett et al., 2018). In particular, urban areas are usually more polluted than rural areas due to the proximity to pollution sources including traffic, cooking, and various other activities such as residential heating. To make things worse, the street canyon effect in urban areas results in poor dispersion conditions, trapping the pollutants in downtown areas where the streets are flanked by buildings on both sides and creating a canyon-like environment (Fuzzi et al., 2015). The term “urban increment” is defined as the increase in air pollution parameters in the urban background above the rural surroundings, while “kerbside increment” is defined as the increase in concentrations at a kerbside or street site relative to the urban background (Lenschow et al., 2001; Mues et al., 2013; Fuzzi et al., 2015). Models often underestimate the urban increment, let alone the kerbside increment, due to the poor grid resolution and not taking into account the urban microenvironment such as the urban canyon and urban heat island effects (Mues et al., 2013). Therefore, field campaigns, especially those simultaneously measuring at different settings (e.g., residential site versus kerbside) in the urban area, are required to study the spatial variation of aerosols and their sources and to provide constraints for the models.
Aerosol can be broadly categorized into two classes, namely primary and secondary (Fuzzi et al., 2015). Primary aerosols are directly emitted from their emission sources such as traffic, cooking, and biomass burning, while secondary aerosols are formed from their corresponding precursor gases (An et al., 2019). Primary aerosols often show enhanced concentrations when close to their sources (e.g., at the kerbside), while secondary aerosols are more homogeneously distributed (Hallquist et al., 2009; Zhang et al., 2015; Gentner et al., 2017). Mohr et al. (2011) showed a kerbside increment of up to 11 µg m−3 for black carbon (BC) and 2.5 µg m−3 for hydrocarbon-like organic aerosol (HOA) at a roadside in Zurich with the mobile measurements using an aerosol mass spectrometer (AMS). While mobile or on-road measurements can provide a detailed characterization of the spatial variation of the chemical components and sources (e.g., traffic) of aerosols, mobile measurements can also be strongly influenced by the emissions from a specific source, e.g., from an old-type truck (or high emitters) that does not represent the average fleet (Fuzzi et al., 2015). Moreover, mobile measurements are usually conducted at a specific time of the day, failing to capture the temporal variation of aerosols over longer periods (e.g., days to months; Mohr et al., 2011; Fuzzi et al., 2015). Fixed installation of instruments at multiple sites simultaneously can, therefore, provide more detailed information about both the temporal and spatial variation of aerosols. Crippa et al. (2013) investigated the temporal evolution of the submicron aerosol at three sites (one urban center and two urban background sites) in Paris during wintertime. In contrast to the finding by Mohr et al. (2011), Crippa et al. (2013) concluded that the submicron aerosol in Paris was dominated by regional transport and that the emissions from Paris itself had an insignificant impact on the urban backgrounds. The discrepancies between the individual studies may be related to the specific geographic environment and the periods of the measurement (Fuzzi et al., 2015).
Dublin, the capital city of the Republic of Ireland in western Europe, is home to ∼ 1 million people. A previous study conducted at a suburban site in the residential area of Dublin has shown that air quality was strongly influenced by residential heating sources in winter (Lin et al., 2018). However, the impact of traffic emissions on this residential site was shown to be minor, probably due to the distance (∼ 500 m) from the nearest roads and the strict emission standards (Lin et al., 2018). The minor influence of traffic at the residential site was also shown in a west coast city of Galway in Ireland during both summer (Lin et al., 2019a) and winter conditions (Lin et al., 2017). In particular, the diurnal pattern of HOA shows largely enhanced concentration in the evening when compared to that during the morning rush hours, suggesting residential heating is the major source of HOA in suburban Dublin, as shown in our previous studies (Lin et al., 2018, 2019b). The heating source of HOA is also reported at the urban background site in Paris, in addition to traffic (Petit et al., 2014; Zhang et al., 2019). However, the relative importance of traffic and heating to HOA in different urban settings (e.g., kerbside and residential) and different seasons (e.g., heating and nonheating periods) remains poorly understood.
In this study, the chemical composition of submicron aerosol (PM1) at both kerbside and residential sites was simultaneously measured from 4 September to 9 November 2018 using an Aerodyne aerosol chemical speciation monitor (ACSM) and an Aethalometer. The chemical composition of PM1 and sources of OA at these two sites were explicitly characterized and compared during both the nonheating period and the heating period. Finally, the spatial variation and kerbside increment of PM1 and the implications for pollution mitigation strategies in Ireland were discussed.
2.1 Sampling sites
Chemical compositions of PM1 were simultaneously measured at a kerbside site in the Dublin city center and a residential site in suburban Dublin at a distance of ∼ 5 km from the kerbside site (see the map in Fig. S1), while PM2.5 was sampled at Rathmines (https://www.epa.ie/air/quality/data/rm/, last access: 1 November 2019), another residential site at a distance of ∼ 3 km from the kerbside and residential sites. The kerbside site is adjacent to a heavily trafficked street (i.e., Pearse Street) with a traffic flow of ∼ 46 000 vehicles per day, 76 % of which consist of private cars, 13 % of light goods vehicles, 7 % of heavy goods vehicles, 2 % of buses, and 2 % of motorcycles (Fu et al., 2017). Pearse Street is characterized as an almost symmetrical street canyon, i.e., rows of buildings on both sides of the road that are of equal height to the width of the street, and this affects the local dispersion of air pollutants (Gallagher et al., 2013; Gallagher, 2016). It is worth noting that a bus stop was positioned ∼ 20 m south from the sampling inlet. Measurements of submicron aerosol at the kerbside took place at ∼ 3 m from the busy street. The residential site is located on the campus of University College Dublin (UCD) in south Dublin. The nearest road is ∼ 500 m away from the sampling site at UCD. Measurements at the site were conducted on the roof of the O'Brien Centre for Science building (∼ 30 m above the ground) at UCD from 4 September to 9 November 2018.
2.2 Instrumentation
A quadrupole aerosol chemical speciation monitor (Q-ACSM; Aerodyne Research Inc.) and an Aethalometer (AE33; Magee Scientific) were deployed at the kerbside site to measure the nonrefractory PM1 (NR-PM1) component (i.e., OA, sulfate, nitrate, ammonium, and chloride) and BC, respectively. At the residential site, another Q-ACSM and Aethalometer (AE16) were deployed to measure the PM1 (NR-PM1 and BC) composition simultaneously. At each site, ACSM, AE33, and/or AE16 were sampling from the same PM2.5 inlet line with isokinetic flow splitting. A detailed description of the ACSM and its operation is given by Ng et al. (2011b) and in our previous study (Lin et al., 2018). Briefly, an ACSM consists of a particle sampling inlet, three vacuum chambers and a quadrupole mass spectrometer. During sampling, the ambient air was drawn into the cyclone with a size cut-off of 2.5 µm at a flow rate of 3 L min−1 to remove coarse particles. A Nafion dryer was used to dry the ambient air before reaching the ACSM inlet. In the ACSM particle sampling inlet, the dried aerosol particles were focused into a narrow aerosol beam through the aerodynamic lens system. The beam was directed onto a hot tungsten oven (∼ 600 ∘C) where the particles were vaporized. The vaporized molecules were ionized by electron impact (70 eV), and the resulting ions were analyzed by a quadrupole mass spectrometer. Both ACSMs were calibrated with ammonium nitrate and ammonium sulfate following the procedure described by Ng et al. (2011b). Briefly, monodispersed 300 nm ammonium nitrate and/or ammonium sulfate particles were generated by an atomizer (model 9302; TSI Incorporated) and size selected by a differential mobility analyzer (DMA; model 3080; TSI Incorporated) and subsequently introduced into the Q-ACSMs to determine the response factor (RF) and the relative ionization efficiencies (RIEs) of ammonium and sulfate.
The time resolution of ACSM at the kerbside was set at 5 min to capture the faster changing variation of particulate matter (PM) composition adjacent to the busy road, while a 1 h interval was used at the residential site to reduce uncertainty in the measurement due to the relatively low concentrations for most of the time. The ACSM standard data analysis software (version 1.6.1.0) in Igor Pro 6.37 (WaveMetrics, Inc.) was used to process the mass concentrations of NR-PM1 components. To account for the aerosol losses during sampling (Middlebrook et al., 2012), a composition-dependent collection efficiency (CDCE) was applied. The CDCE-corrected (averaged at ∼ 0.5) NR-PM1 shows a good agreement with the PM2.5 measurement at another residential site in suburban Dublin (i.e., Rathmines; Fig. S1) where a tapered element oscillating microbalance (Thermo Fisher Scientific) was deployed with 1 h resolution.
The AE33 was deployed to measure black carbon (BC) at the kerbside with a time resolution of 1 min, while AE16 at the residential site had a time resolution of 5 min. AE33 measures light absorption at seven wavelengths (370, 470, 520, 590, 660, 880, and 950 nm; Drinovec et al., 2015) while AE16 measures light absorption solely at 880 nm. BC mass concentration was calculated from the change in optical attenuation at 880 nm in the selected time interval, using the mass absorption cross section 7.77 m2 g−1 (Drinovec et al., 2015).
A carbon monoxide analyzer (Thermo Fisher Scientific; model 48i) was employed to measure the CO mixing ratios with a time resolution of 1 min at the kerbside. A analyzer (Thermo Fisher Scientific; model 42i) was employed to sample NOx with a time resolution of 1 min at the kerbside and residential site simultaneously. Meteorological variables (temperature, relative humidity, wind speed, and wind direction) with a time resolution of 1 h were recorded at the meteorological stations (Irish Meteorological Service) of Dublin Airport (∼ 5 km north of the kerbside sampling site).
2.3 OA source apportionment
Positive matrix factorization (PMF) was utilized for OA source apportionment on the interface of SoFi 6.A1 (Canonaco et al., 2013). First, unconstrained (or free) PMF was applied to examine the OA factors based on their mass spectral profiles, diurnal patterns, and correlations with external measurements (e.g., NOx and BC). However, the free PMF solution could potentially lead to solutions with mixed factors or inaccurate factor attributions when some factors have similar temporal variation and/or factor profiles (e.g., COA and HOA; Canonaco et al., 2013). This is especially true for the heating-related OA factors during the heating season in Ireland during which oil, peat, wood, and coal were commonly used as domestic heating fuels according to the Central Statistics Office (CSO, 2016) and Sustainable Energy Authority of Ireland (SEAI, 2018). Moreover, previous offline (i.e., filter-based) and online (i.e., ACSM and/or AMS) studies in Ireland in winter have identified ambient OA as being associated with the residential burning of oil, peat, coal, and wood (Kourtchev et al., 2011; Dall'Osto et al., 2013; Lin et al., 2018). In this study, free PMF resulted in highly mixed OA factors (see the Supplement for the free PMF solutions). Thus, based on this a priori information on emission sources, PMF with the multilinear engine (ME-2) was applied to reach more environmentally meaningful solutions by constraining the reference profiles with an a-value approach (Canonaco et al., 2013; Lin et al., 2017).
The reference profiles of peat, coal, and wood were taken from a previous study in which the mass spectral signatures of peat, coal, and wood-burning OA were characterized by simulating their burning in a typical Irish stove with an ACSM (Lin et al., 2017). HOA and COA were obtained from a study in Paris by Crippa et al. (2013). A sensitivity analysis was undertaken by varying the a values (0–0.5 or 0 %–50 % variation) to evaluate the OA factor contribution at different levels of constraint on the reference factor. Moreover, a bootstrap-based resampling strategy with a total of 500 runs was applied to examine the statistical uncertainty (https://datalystica.com/sofi, last access: 1 November 2019). The following criteria are used for the selection from these ME-2 runs to reach the most optimized solution:
-
The correlation between the time series of HOA and NOx or BC in the morning hours (07:00–10:00 local time – LT; note that all times hereinafter are given in LT) during weekdays. HOA and NOx ( have a common source from traffic emissions in these morning hours.
-
The diurnal cycle of COA. The COA concentrations during mealtimes should be higher. In this study, the ratio of COA at 13:00 to the average COA at 10:00 and 11:00 was monitored.
-
The multilinear regression between BC and heating-related factors (i.e., HOA, or oil burning, peat, wood, and coal burning) in the evening (19:00–23:00), assuming only the heating-related factors contributed to BC in the evening.
-
The fraction of m∕z 60 (i.e., f60) for peat and wood-burning OA factors should be higher than 0.006 (Cubison et al., 2011; Lin et al., 2017).
-
The fraction of m∕z 44 (i.e., f44) for the unconstrained factor (i.e., OOA). OOA should have higher f44 than primary factors.
By inspecting the defined criteria, the ME-2 runs that meet these criteria were selected and averaged as the most optimized solution.

Figure 1Time series of hourly averaged submicron organic aerosol (OA), sulfate (), nitrate (), ammonium (), chloride (Chl−), and black carbon (BC) at the kerbside (a), residential site (b), and Environmental Protection Agency (EPA) Rathmines station (c) from 4 September to 9 November 2018. Inset pie charts are the chemical composition of PM1 averaged over the entire period, while the numbers (± 1 standard deviation – SD) above are the average PM1 concentration. The nonheating period, from 10 September to 17 September 2018, and the heating period, from 27 October to 4 November 2018, are marked for further analysis. The ACSM data gaps at the kerbside (e.g., from 7 to 23 October 2018) were due to ACSM malfunction.
3.1 Overview of aerosol measurement
Figure 1 shows the time series of submicron organic aerosol (OA), sulfate, nitrate, ammonium, chloride, and black carbon (BC) at both the kerbside and the residential site, as well as the time series of PM2.5 at Rathmines from 4 September to 9 November 2018. The air quality during the early stage of the sampling period (before 30 September 2018) showed limited influence from residential heating emissions, as observed by few pollution spikes in the evening when compared to a later period with prominent evening spikes observed at all three sites (from 1 October to 9 November 2018; Fig. 1). The three sampling sites (i.e., kerbside, residential, and Rathmines) are within a 5 km radius in Dublin, and the time series of PM1 and PM2.5 were well correlated, with linear correlation coefficients determination (R2) in the range of 0.56–0.83 and slopes of 0.72–0.88 (Fig. S1). The good time series correlation between the three sites was mainly driven by the pollution events during the heating period, while the slopes of 0.72–0.88 suggested PM1 explained, on average, 72 %–88 % of PM2.5 mass. The poorer correlation (R2 of 0.56; Fig. S1) between the kerbside PM1 and Rathmines PM2.5 than between the residential PM1 and Rathmines PM2.5 (R2 of 0.83) was due to traffic emissions, which had a greater impact on the kerbside than at the residential site and Rathmines.
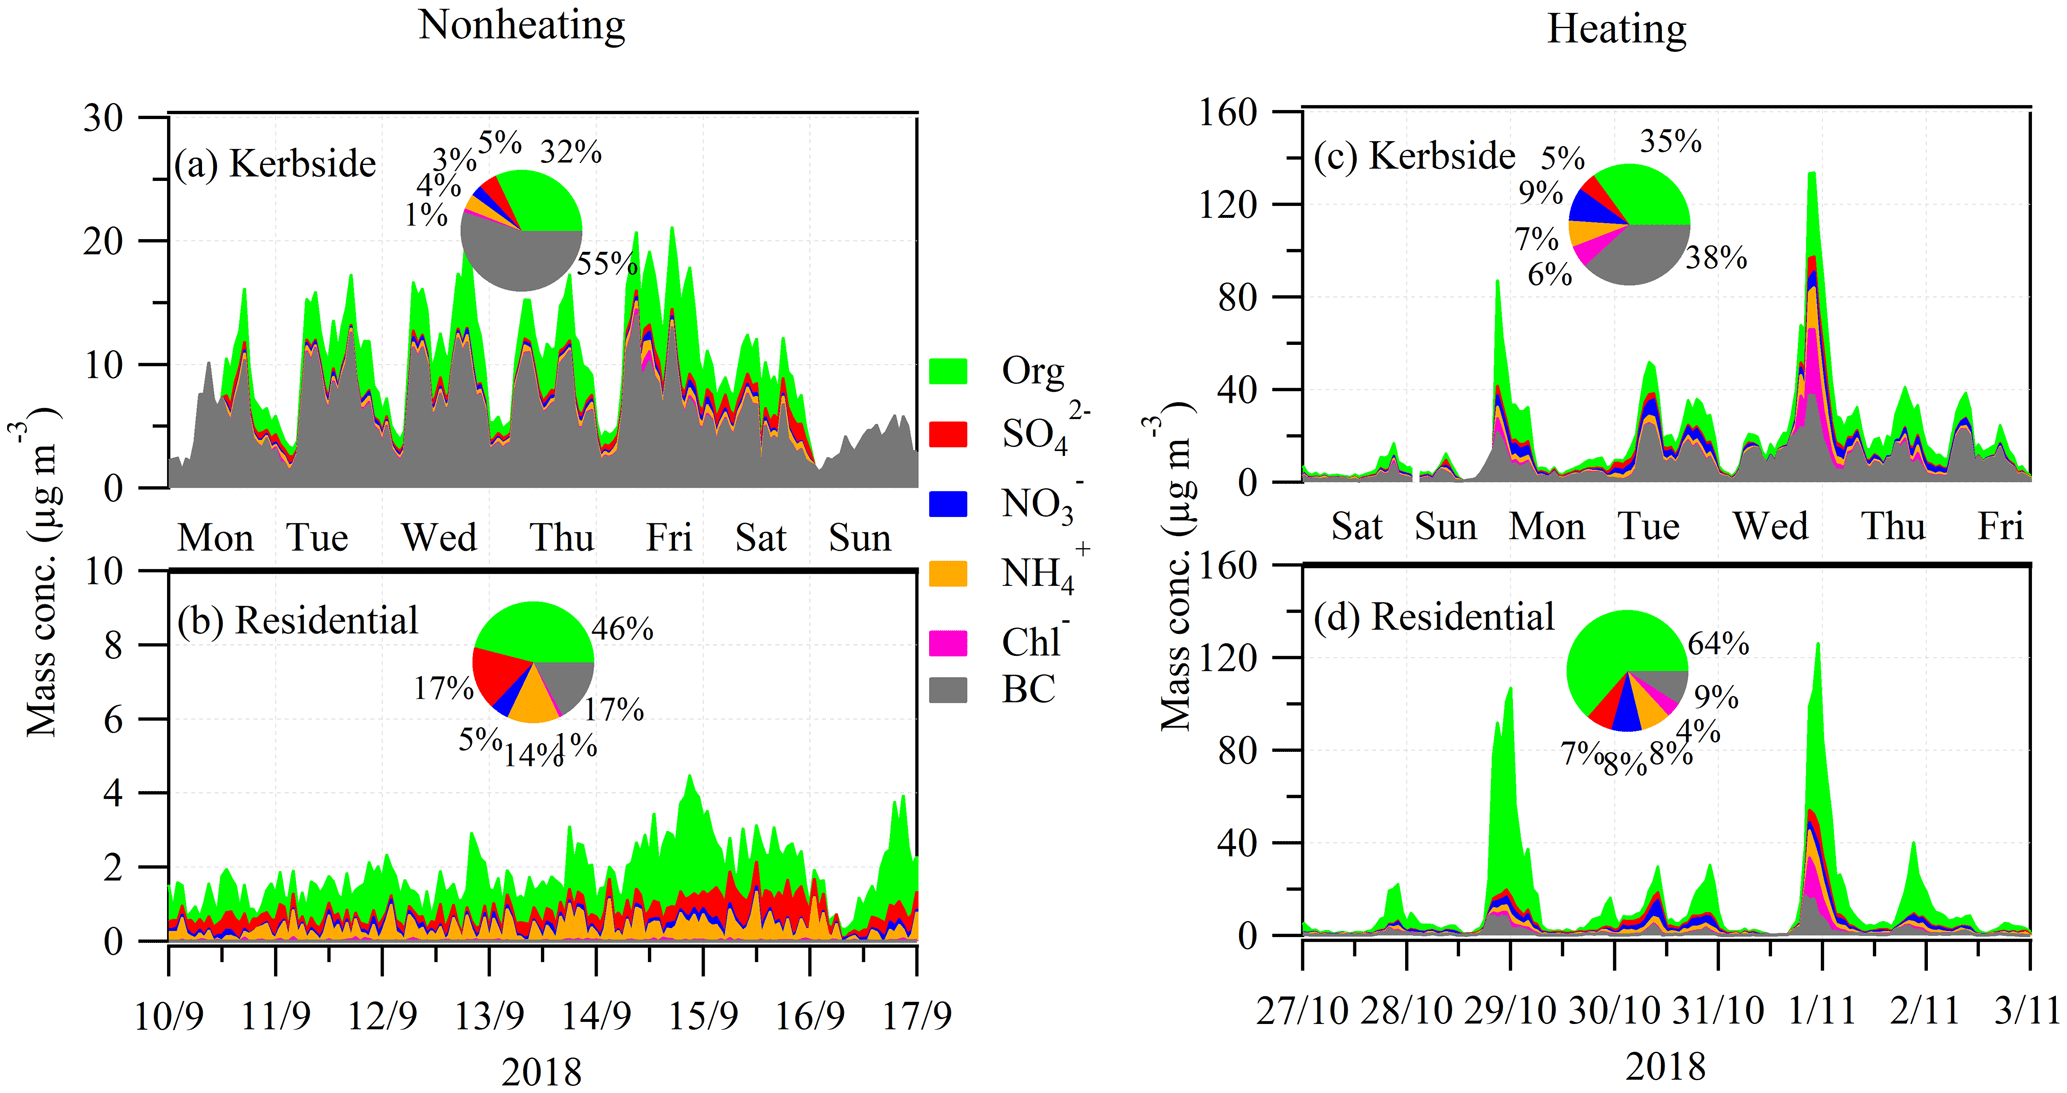
Figure 2Time series of hourly averaged submicron organic aerosol (OA), sulfate (SO4), nitrate (NO3), ammonium (NH4), chloride (Chl−), and black carbon (BC) during the nonheating (a, b) and heating periods (c, d) at the kerbside (a, c) and residential site (b, d). Inset pie charts are the relative fraction of the measured PM1 components. Also shown are the day of the week, including Monday (Mon), Tuesday (Tue), Wednesday (Wed), Thursday (Thu), Friday (Fri), Saturday (Sat), and Sunday (Sun). At the kerbside, the ACSM data gaps (e.g., on 16 September 2018) were due to ACSM malfunction. At the residential site, BC was not available during the nonheating period. As a reference, the average concentration from the week after was included for the calculation of the relative contribution to PM1.
Over the entire period, the mean mass concentration of PM1 was 11.7±9.7 (1 standard deviation – SD) µg m−3 at the kerbside, with black carbon accounting for 50 % of the total PM1 mass (Fig. 1a), followed by OA (31 %), nitrate (6 %), sulfate (5 %), ammonium (5 %), and chloride (2 %). At the residential site, the mean PM1 concentration (6.6±3.1 µg m−3) was roughly half of that at the kerbside (Fig. 1b). However, the chemical compositions of PM1 at the residential site were dominated by OA (59 % of PM1) followed by BC (13 %). The total inorganic aerosols (sum of sulfate, nitrate, ammonium, and chloride) accounted for 28 % of PM1 at the residential site, slightly higher than at the kerbside (18 %), though the concentrations were comparable (1.8 versus 2.1 µg m−3) between the two sites, suggesting regional sources and/or formations rather than traffic emissions. In contrast, the greater abundance of BC at the kerbside suggests that traffic emissions comprised a high fraction of BC which, however, had a limited impact on the residential site. In particular, BC at the kerbside showed two rush hour peaks, confirming traffic was its major source (Fig. S2). However, the BC was up to 25 times (7 times on average) lower at the residential site during the rush hours (Fig. S2), suggesting a minor impact from traffic on the air quality at the residential site due to the effects of the wind direction and the distance from the road. In addition to the rush hour peaks of BC, an additional BC peak in the evening was also observed at both sites due to the emissions from domestic heating activities (discussed later).
To better understand the evolution of chemical composition and concentration of PM1, two periods, with 1 week from the nonheating period, from 10 to 17 September 2018 and 1 week from the heating period, from 27 October to 4 November 2018, were selected for a more detailed comparison (Fig. 2). During the nonheating period, BC showed the largest kerbside increment, with an increment ratio of 15 (median value; Fig. 3). During the heating period, the BC increment ratio was slightly lower (10), primarily due to the additional emission sources of solid fuel burning affecting both sites simultaneously. The kerbside increment of BC was primarily due to vehicular emissions, and this was corroborated by the gas pollutant of NOx, which showed an increment ratio of 7–11 (Fig. 3). Note that our measurement represents the average fleet in Dublin, and thus, the high kerbside increment for BC in Dublin has significant implications for the potentially higher exposure risk at the kerbside. Compared to BC, the kerbside increment of OA was less significant because traffic was not a major source of OA (discussed in Sect. 3.4). However, a higher OA increment ratio (3; median value) was also seen during the nonheating period than during the heating period (∼ 2).
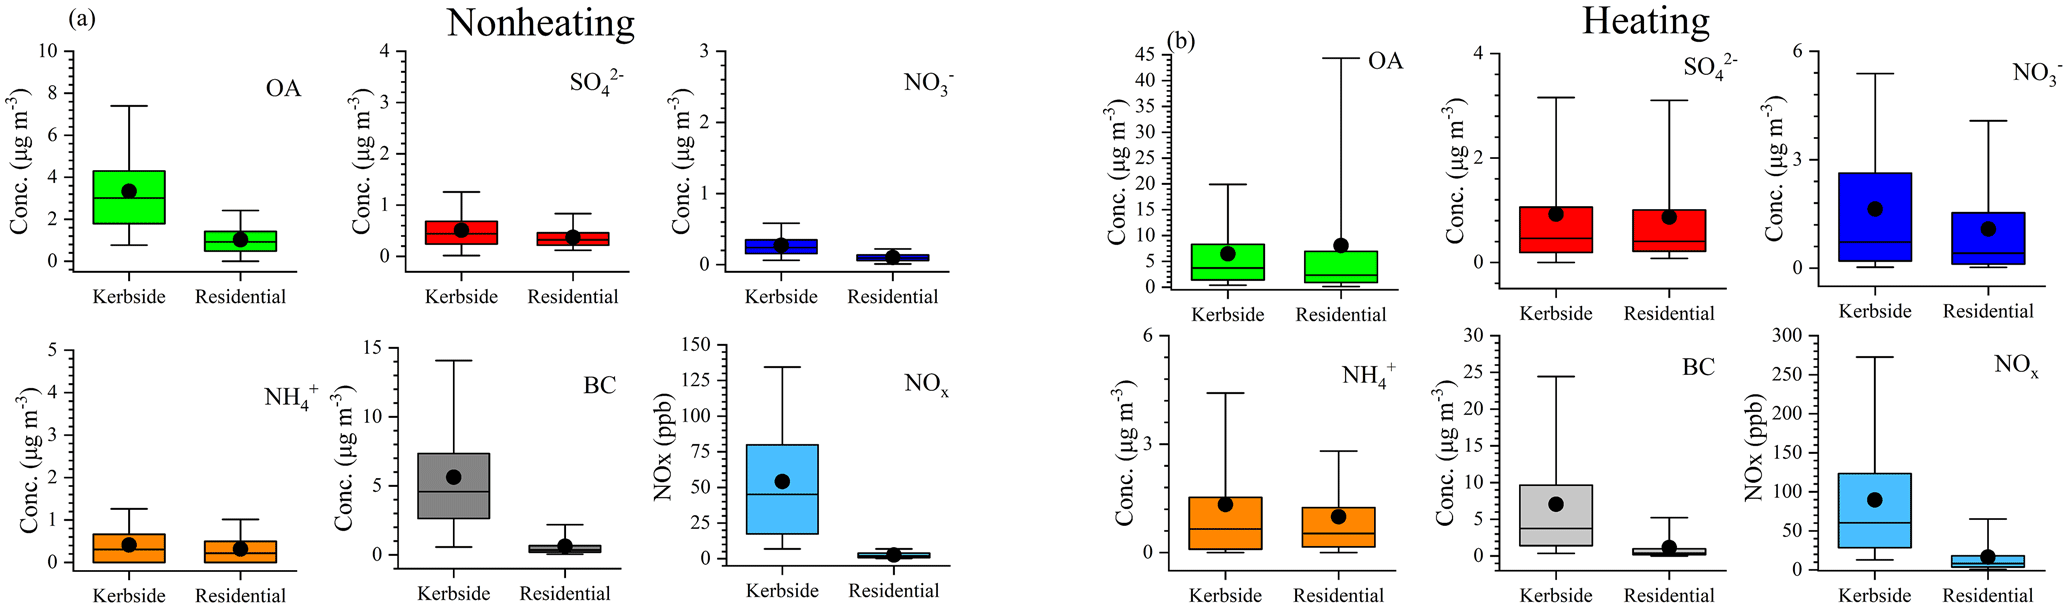
Figure 3Boxplots of the submicron organic aerosol (OA), sulfate (), nitrate (), ammonium (), black carbon (BC), and NOx during the nonheating (a) and heating periods (b) at the kerbside and residential site. The median, the 25th and 75th percentiles, are represented by the middle, lower, and upper vertical bars, respectively. The 5th and the 95th percentiles are the bottom and top whiskers, respectively.
The meteorological parameters including wind speed, wind direction, relative humidity (RH), and temperature during the nonheating and heating periods are shown in Fig. S3. Specifically, during the nonheating period, southwesterly winds were prevailing, with an average wind speed of 4.5 m s−1, ranging from 1.5 to 9.0 m s−1, while during the heating period the wind speeds were slightly lower, with an average of 3.7 m s−1 (range of 0.5–8.5 m s−1). The low wind speeds were accompanied by the northerly and easterly winds during the heating period. The temperature during the nonheating period averaged 13.1 ∘C, ranging from 8.6 to 18.2 ∘C, while it was lower during the heating period with an average of 4.5 ∘C (range of −3.9–11.6 ∘C). However, the RH during the nonheating and heating periods were similar, with an average RH of 78.7 % (range of 57 %–96 %) for the nonheating period and 78.9 % (range of 44 %–98 %) for the heating period.
Table 1Mean, standard deviation (SD), first quartile (Q1), median, third quartile (Q3), and maximum (Max) concentration of the hourly averaged organic aerosol (OA), sulfate (SO4), nitrate (NO3), ammonium (NH4), chloride (Chl−), and black carbon (BC) at the kerbside and residential site during the nonheating (10–17 September 2018) and heating periods (27 October–3 November 2018). Aerosol species are in µg m−3, and NOx is in parts per billion (ppb).
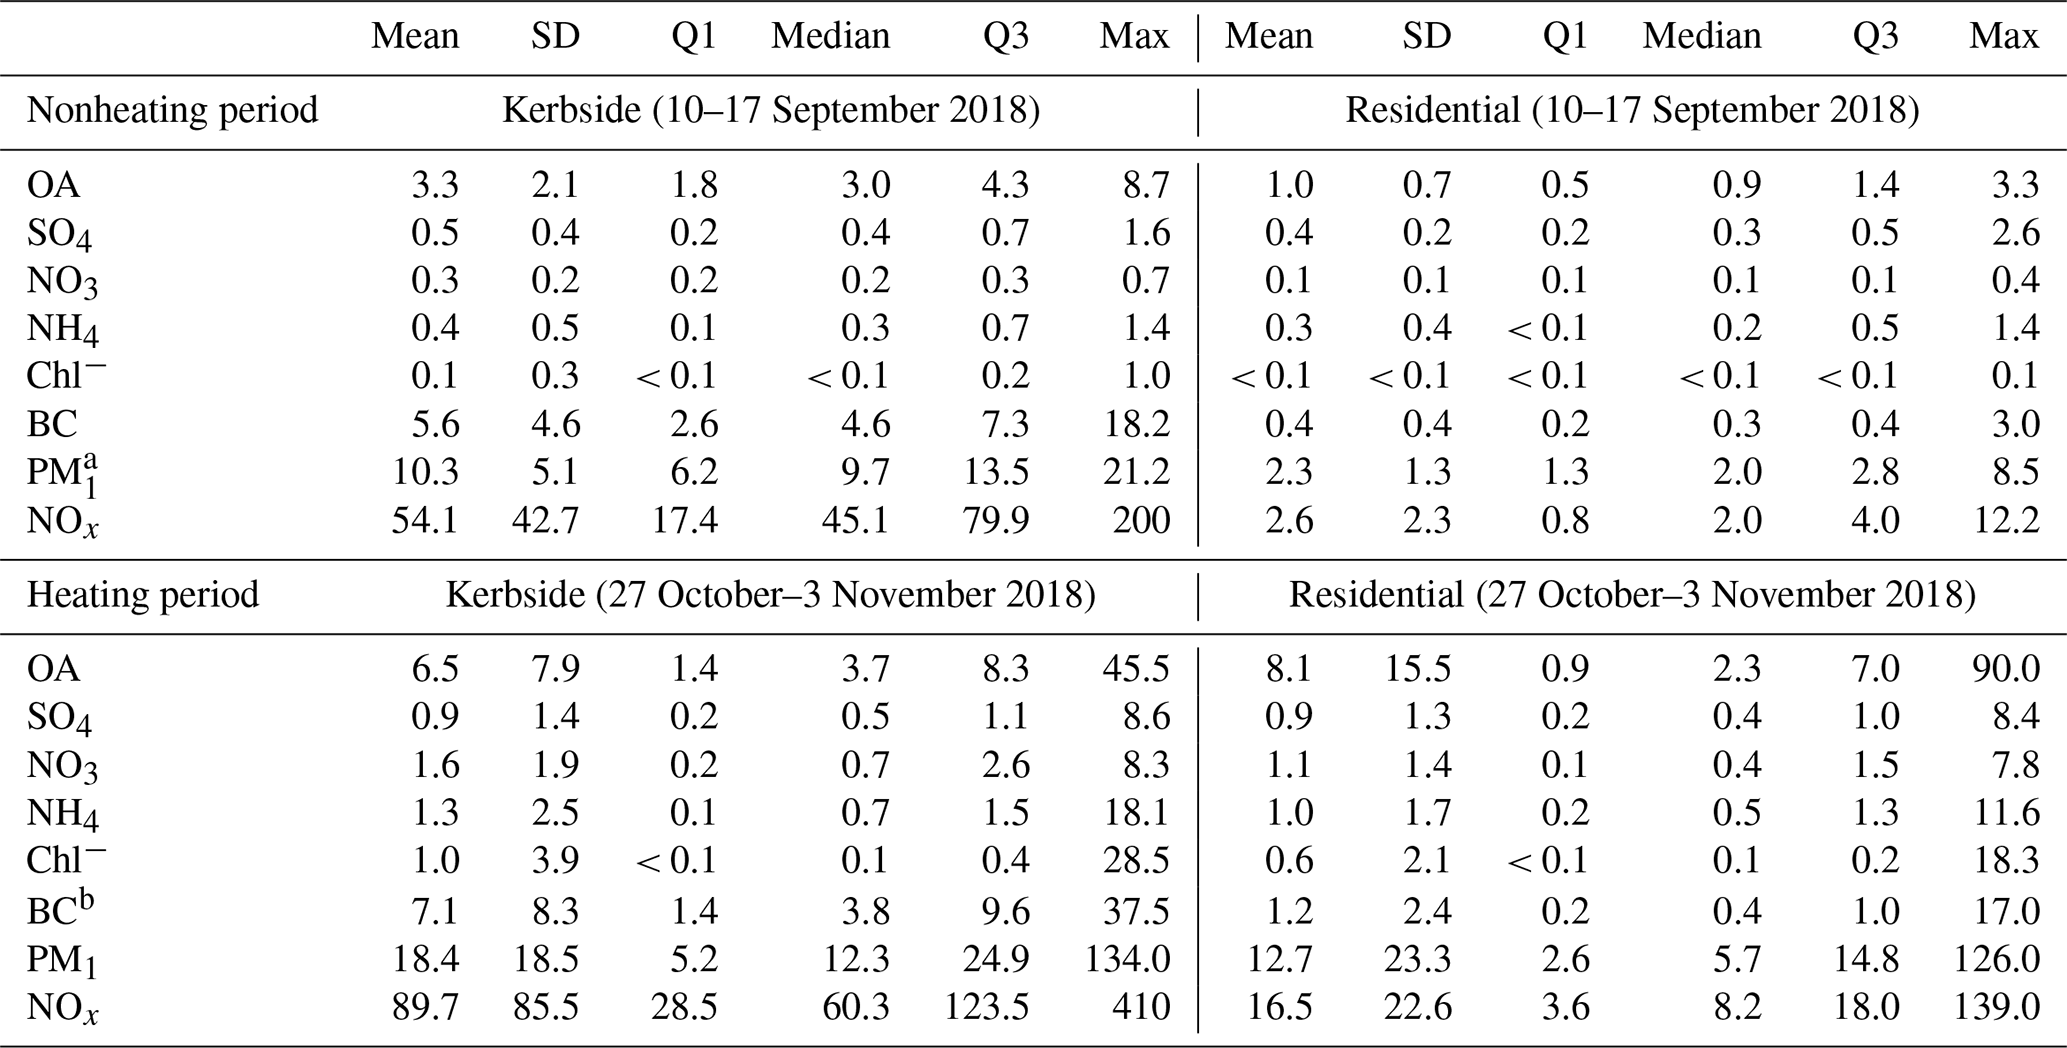
aPM1 sum of OA, SO4, NO3, NH4, Chl−, and BC. b BC at the residential site was not available during the nonheating period, and the week after (from 24 to 30 September 2018) was shown as a reference.
3.2 Mass concentration and chemical composition of PM1 during the nonheating period
3.2.1 PM1 at the kerbside during the nonheating period
Figure 2a shows the time series (enlarged) for the nonheating and heating periods and their relative fractions of the PM1 component (i.e., OA, sulfate, nitrate, ammonium, chloride, and BC). BC was the most dominant PM1 component (Table 1), on average accounting for over half (55 % or 5.6 µg m−3) of PM1, followed by OA (32 % or 3.3 µg m−3), sulfate (5 % or 0.5 µg m−3), ammonium (4 % or 0.4 µg m−3), nitrate (3 % or 0.3 µg m−3), and chloride (1 % or 0.1 µg m−3). In particular, BC spikes (> 15 µg m−3; top 5 percentiles) affected the local air quality substantially during the daytime (06:00–21:00; Fig. 4a) and showed higher intensity during rush hours on weekdays. As a result, the averaged BC diurnal profile showed both morning (09:00) and afternoon (17:00) rush hour peaks (> 10 µg m−3; Fig. 4a). Similar patterns were also observed for NOx (Fig. S4) and CO (Fig. S5) at the kerbside, confirming common traffic sources. Specifically, both NOx and CO showed rush hour peaks during weekdays, while such rush hour peaks during weekends were not as prominent as during weekends, consistent with the traffic pattern in Dublin (Fu et al., 2017). The average mixing ratios for NOx and CO were 54.1 parts per billion (ppb; in the range of 5.4–200.0 ppb) and 0.2 parts per million (ppm; in the range of 0.05–0.8 ppm), respectively.
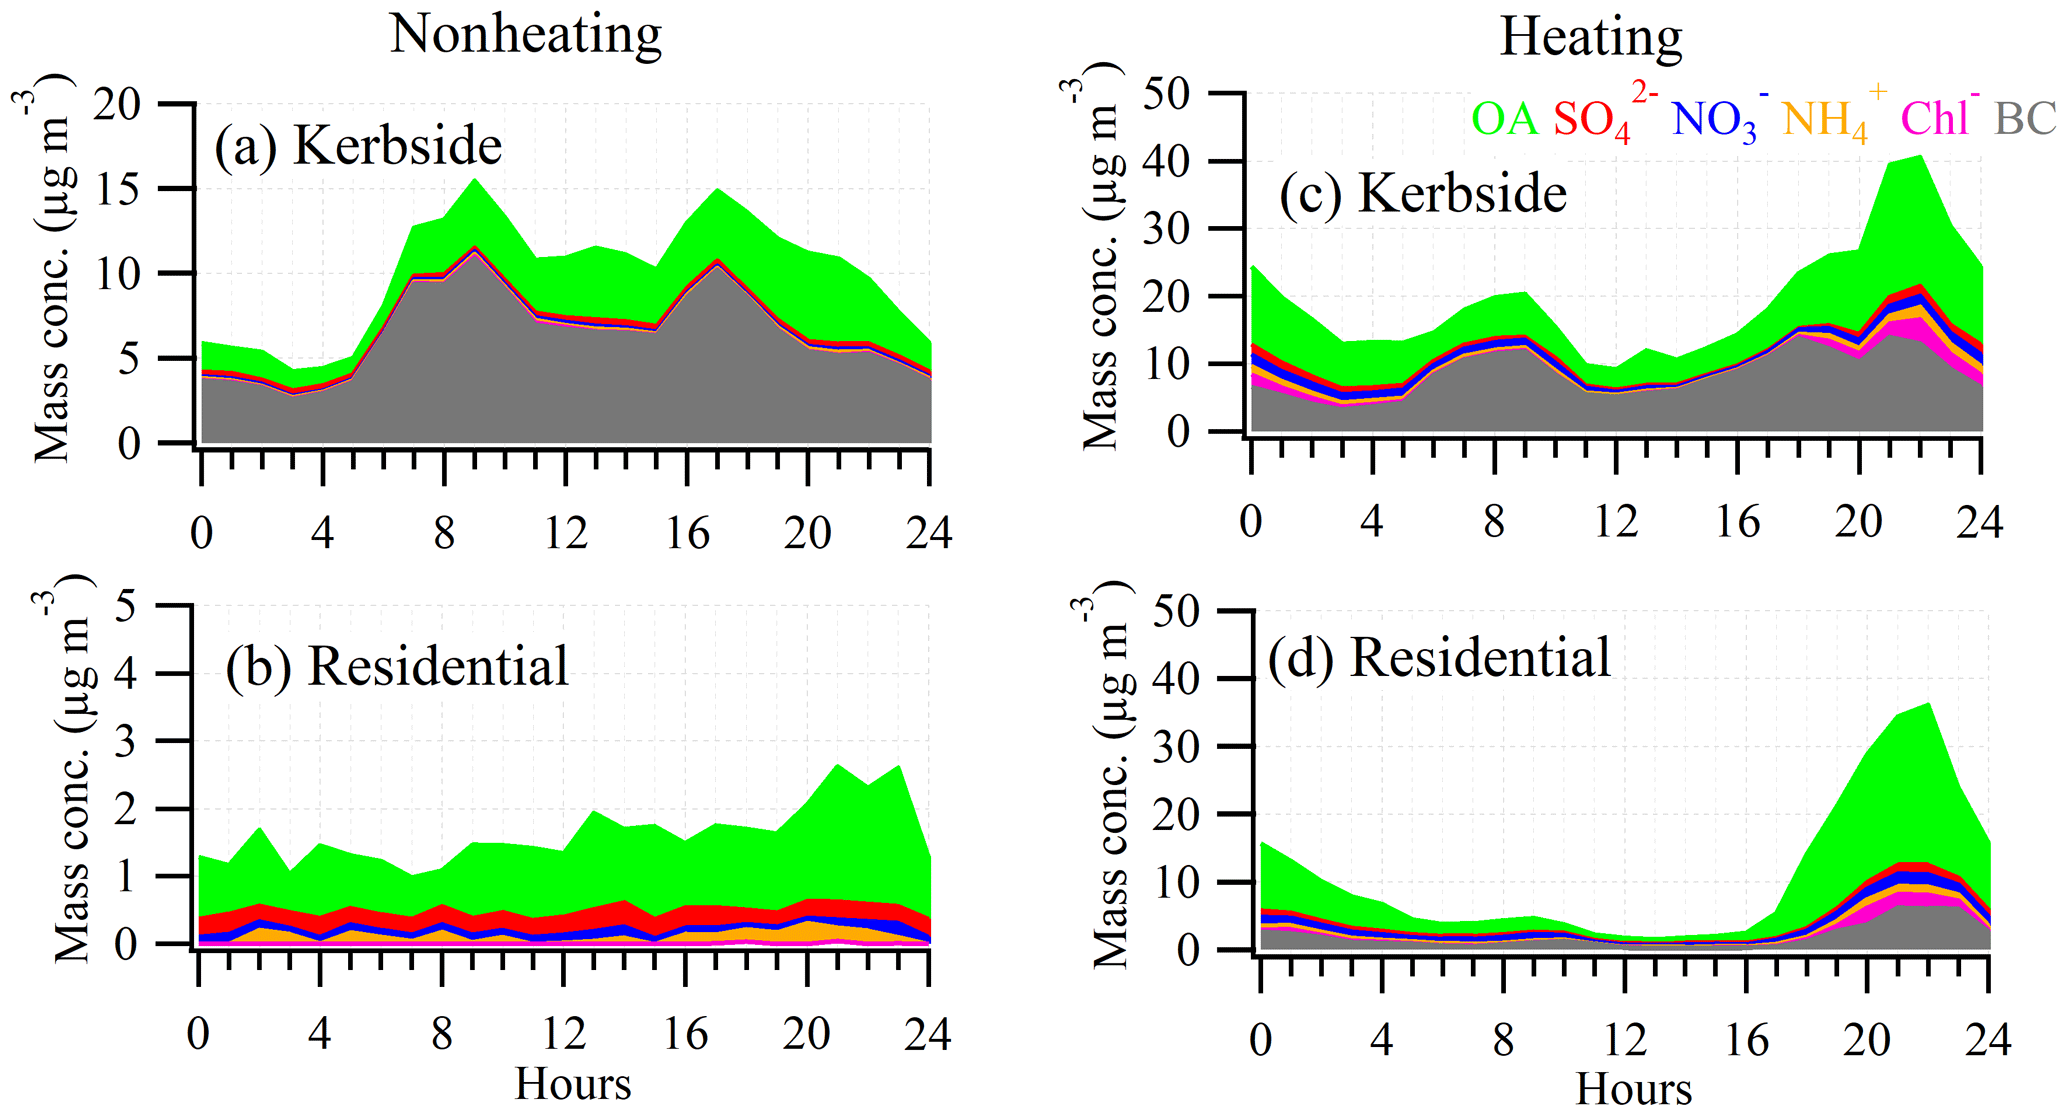
Figure 4The diurnal cycle of submicron organic aerosol (OA), sulfate (), nitrate (), ammonium (), chloride (Chl−), and black carbon (BC) during the nonheating (a, b) and heating periods (c, d) at the kerbside (a, c) and residential site (b, d).
BC spikes were on the timescale of minutes, indicating certain types of vehicles were the major cause of such pollution plumes. The diesel-powered public buses were firstly suspected as being the major emitters of BC because a bus stop was nearby, about ∼ 20 m away from the sampling site. Note that the bus services usually start at ∼ 05:30 and end at ∼ 23:00 in downtown Dublin. However, BC spikes were also observed during other times, e.g., from 23:00 to 05:30, when public bus services were not available. Moreover, higher intensity and frequency of BC spikes were observed during the morning and evening rush hour peaks. Thus, in addition to the buses, other types of vehicles (e.g., private cars) were also potential contributors to air pollution. Specifically, ∼ 50 vehicles (manual count) were jammed along the nearby street during rush hours, and higher emissions might be associated with the cold starts and idling speeds during such traffic jams. Additionally, the street canyon effect, making the pollutants hard to disperse, was also an important factor in driving the high BC concentrations at the kerbside. In particular, the street canyon effect was evidenced by the high background BC concentration (3.0 µg m−3) during the night (from 23:00 to 05:00) when traffic flow was at the lowest (Fig. 4a). As a comparison, the average BC was only 0.4 µg m−3 at the residential site during the nonheating period (Table 1).
Similar to BC at the kerbside, OA also shows spikes, with concentrations of > 5 µg m−3 (top 5 percentiles) from 06:00 to 21:00 (Fig. 4a). However, in addition to traffic, cooking and secondary formation were also contributing to the OA mass at the kerbside (discussed in Sect. 3.4). In contrast to BC and OA, the time series of the measured inorganic aerosols were relatively smooth (Fig. 2a) and did not exhibit any obvious influence from traffic. This is not surprising because vehicles are not direct emitters of these inorganic species, and the introduction of the threshold of 10 ppm (by mass) sulfur for gas and/or diesel oil led to very low sulfur emissions in Dublin (Statutory instruments, 2008). On average, the sum of the inorganic aerosols accounted for a relatively small fraction (13 %) of the total PM1 (Fig. 2a).
3.3 PM1 at the residential site during the nonheating period
The time series of OA, sulfate, nitrate, ammonium, and chloride at the residential site during the nonheating period are shown in Fig. 2b. Over this period, the average concentration of PM1 was 2.3 µg m−3 at the residential site, around 5 times lower than at the kerbside (Table 1). OA was the most dominant species at the residential site, accounting for 46 % (1.0 µg m−3) of PM1 (Fig. 2b), followed by BC (17 % or 0.4 µg m−3), sulfate (17 % or 0.4 µg m−3), ammonium (14 % or 0.3 µg m−3), nitrate (5 % or 0.1 µg m−3), and chloride (1 % or < 0.1 µg m−3). Although the measurements at the residential site and kerbside were conducted simultaneously, all of the PM1 components showed no obvious trend that could be associated with vehicular emissions at the residential site (Fig. 4b), indicating that the impact of traffic emissions from the kerbside had a minor impact on the residential site. Consistently, NOx concentrations were very low, with an average mixing ratio of NOx of 2.6 ppb (median was 2.0 ppb; Table 1). As discussed above, the low impact of vehicular emissions on air quality at the residential site was associated with the distance from the emission sources and the effects of wind speed and wind direction. Specifically, the distance between the residential site and the nearest road is ∼ 500 m and ∼ 5 km away from the Dublin city center. The southwesterly wind was dominant during the nonheating period, with an average wind speed of 4.5 m s−1, ranging from 1.5 to 9.0 m s−1 (Fig. S3).
3.4 Mass concentration and chemical composition of PM1 during the heating period
3.4.1 PM1 at the kerbside during the heating period
During the heating period, large pollution spikes were observed in the evening (20:00–23:00), with a simultaneous increase in all NR-PM1 components and BC (Figs. 2c and 4c). Specifically, in the evening on 31 October 2018, the peak PM1 concentration was 134.0 µg m−3 (Fig. 2c), which was more than double that of the rush hour peak on the same day. Moreover, the evening pollution expanded over the entire evening and went on into the night (Fig. 4c), demonstrating the extensive impact of residential heating activities. On the same day, BC concentration increased up to 37.5 µg m−3 in the evening, over 5 times higher than the average (7.1 µg m−3). The simultaneous increase in all NR-PM1 components, along with BC, suggests common heating sources in the evening. Note that the shallower boundary layer in the evening was also partly contributing to the elevated concentrations of the PM1 components.
Over the entire heating period, the average PM1 concentration was 18.4 µg m−3, approximately 2 times higher than during the nonheating period (Table 1). While the average BC concentration increased from 5.6 µg m−3 during the nonheating period to 7.1 µg m−3 during the heating period, the corresponding BC fraction decreased from 55 % to 38 %. This is due to the relatively high emissions of other PM1 components (e.g., OA) which are associated with heating sources. Specifically, the average OA concentration doubled during the heating period (6.5 µg m−3) compared to during the nonheating period (3.3 µg m−3), with the corresponding fraction increasing from 32 % to 35 %. Moreover, the average concentration and fraction of sulfate, nitrate, ammonium, and chloride also increased. On average, the fraction of inorganic components increased from 13 % (1.3 µg m−3) during the nonheating period to 27 % (6.1 µg m−3) during the heating period. In particular, nitrate saw a large increase from 3 % (0.3 µg m−3) during the nonheating period to 9 % (1.6 µg m−3) during the heating period, partly due to the cold temperature (Fig. S4) which favored the gas-to-particle partitioning of semivolatile NH4NO3. Moreover, the maximum chloride concentration (28.5 µg m−3; Fig. 2c) was observed in the evening of 31 October 2018, along with other species, suggesting emission sources from solid fuel burning (Lin et al., 2017). While the diurnal pattern of PM1 during the heating period still showed two rush hour peaks as found during the nonheating period (Fig. 4c), the higher PM1 peak in the evening again highlighted the importance of the heating emissions.
3.4.2 PM1 at the residential site during the heating period
The time series of the measured PM1 components at the residential site during the heating period are shown in Fig. 2d. During this period, pollution spikes with a simultaneous increase in the concentrations of NR-PM1 and BC were observed almost every evening. This was in great contrast to that during the nonheating period when no clear pattern in NR-PM1 species was observed (Fig. 4b and d). As discussed above, the pollution spikes of NR-PM1 at the residential site showed a simultaneous increase with that at the kerbside (Fig. 2c) and the PM2.5 at the Rathmines station (Fig. 1c), indicating that the three sites were affected by similar residential burning sources and air masses. In particular, the maximum concentration of chloride (18.3 µg m−3), observed in the evening of 31 October 2018 at the residential site, suggested emissions from solid fuel burning, as found at the kerbside.
Over the entire heating period, the average PM1 concentration was 12.7 µg m−3, which was 6 times higher than during the nonheating period. On average, OA accounted for 63 % (8.1 µg m−3) of PM1, making it the most dominant component (Fig. 2d), followed by BC (9 % or 2.4 µg m−3), nitrate (8 % or 1.1 µg m−3), ammonium (8 % or 1.0 µg m−3), sulfate (7 % or 0.9 µg m−3), and chloride (4 % or 0.6 µg m−3). Similar to during the nonheating period, the averaged diurnal profile of the PM1 components during the heating period showed a weak impact from traffic emissions during the day (Fig. 4d). In contrast, the large increase in PM1 components in the evening and night indicated a substantial contribution from the heating sources.
3.5 Sources of OA
3.5.1 OA factors at the kerbside during the nonheating period
To resolve the OA sources, free PMF was firstly conducted on the OA matrix. The solution that best represented the data was the three-factor solution because the solutions with more factors provided no meaningful results but showed splitting from the already-resolved factors (see Fig. S6 and more details in the Supplement). The three-factor solution identified a hydrocarbon-like OA (HOA) factor from traffic, cooking-like OA (COA) factor from cooking sources, and an oxygenated OA (OOA) factor corresponding to the secondary processes. However, free PMF provided only a suboptimal solution as the profile of COA contained no m∕z 43, which either underestimated its contribution or overestimated the contributions from other factors (Fig. S6). Therefore, ME-2 (Canonaco et al., 2013) was utilized to constrain the reference profiles of HOA and COA (Crippa et al., 2013) with 0 %–50 % constraints (i.e., a value of 0–0.5; see Sect. 2.3) to better evaluate their contributions.

Figure 5(a) Mass spectral profiles of hydrocarbon-like OA (HOA), cooking-like OA (COA), and oxygenated OA (OOA) during the nonheating period at the kerbside. (b) Diurnal cycle of the OA factors and (c) relative contribution of OA factors to the total OA over the entire nonheating period. (d) Over the morning rush hours (07:00–10:00 local time – LT; note that all times given hereinafter are in LT) and (e) over the evening hours from 19:00 to 22:00. Error bars in (a) and (b) represent 1 standard deviation.
Figure 5 shows the mass spectra, diurnal pattern, and relative contribution of HOA, COA, and OOA of the optimal ME-2 solution during the nonheating period at the kerbside. The HOA profile was dominated by peaks at m∕z of 27, 29, 41, 43, 55, and 57, characteristic of the hydrocarbon ion series of [CnH2n+1]+ and [CnH2n−1]+. The diurnal cycle of HOA featured two rush hour peaks which were consistent with that of BC (Fig. 4a), confirming its traffic source. During the early morning (from 00:00 to 05:00), the HOA concentration was very low (0.1 µg m−3), indicating a low background HOA level. From 06:00, HOA started to increase with a peak HOA value of 1.5 µg m−3 at 08:00. After the morning rush hour peak, the HOA concentration was constantly high (1 µg m−3) and reached 1.3 µg m−3 at the afternoon rush hour peak (17:00). The HOA returned to the background level at around 23:00, corresponding to the reduced traffic flow during the night (Fu et al., 2017). Despite being adjacent to the busy road in the Dublin city center, on average, HOA accounted for 27.8 % (0.9 µg m−3) of the total OA (Fig. 5c), with the rest being attributed to COA (35.7 % or 1.2 µg m−3) and OOA (36.6 % or 1.2 µg m−3). During the morning rush hours from 07:00 to 10:00, HOA increased its shares to 49.1 % of the total OA (Fig. 5d), suggesting a more important role of HOA during rush hours.
The COA profile is characterized with a f55 to f57 ratio of 2.6 (where f55 and f57 are the fraction of m∕z 55 and 57 to the total organic mass, respectively), which is higher than that for HOA (0.9) but is in the range of 2.2–2.8 that is typically found for COA (Mohr et al., 2012). The identification of COA was associated with the location of the sampling site in the Dublin city center with some restaurants around. The diurnal pattern of COA showed a lunchtime peak at 13:00 and a dinnertime peak at 20:00, corresponding to the mealtimes. A higher dinnertime COA peak (2.7 µg m−3) was observed than a lunchtime peak (1.6 µg m−3), likely due to higher emissions during the evening coupled with relatively low evening temperatures (Fig. S3) and shallower boundary layer. Similar diurnal patterns for COA were also observed in Barcelona (Mohr et al., 2012), Paris (Crippa et al., 2013), London, and Manchester (Allan et al., 2010). On average, COA accounted for 35.7 % of OA but, over the evening hours from 19:00 to 22:00, COA increased its fraction to 51.4 % of OA.
The OOA profile (Fig. 5) resembles the low-volatility OOA (LV-OOA; R2 of 0.94 between the OOA and the reference LV-OOA profile; Ng et al., 2011a) which typically represents well-aged SOA and correlates better with nonvolatile secondary species such as sulfate (Jimenez et al., 2009). As a comparison, the OOA profile is poorly correlated with semivolatile OOA (SV-OOA; R2 of 0.34 between the OOA and the reference SV-OOA profile; Ng et al., 2011b). However, the diurnal pattern of OOA in Dublin showed a clear pattern that was strongly influenced by local sources and was most likely from fresh SOA instead of well-aged SOA. Moreover, the morning peak of OOA came about 1 h later than that for HOA, probably indicating fast SOA-formation processes by the atmospheric oxidation of SOA precursor gases and/or the condensation of semivolatile volatile organic compounds (SVOCs) emitted by the nearby traffic. Besides, the contribution from cooking sources to OOA was also important (Liu et al., 2018), as evidenced by the concurrent peaks of OOA with COA from their diurnal patterns. The diurnal trend of OOA suggests that the OOA had a background concentration of 0.5 µg m−3 which was higher than HOA (0.1 µg m−3) and COA (0.1 µg m−3), indicating that part of OOA was also associated with regional transport. It is estimated that approximately 38 % of the total OOA was regionally transported, i.e., the value of background OOA concentration of 0.5 µg m−3 if compared to the total OOA concentration of 1.3 µg m−3.
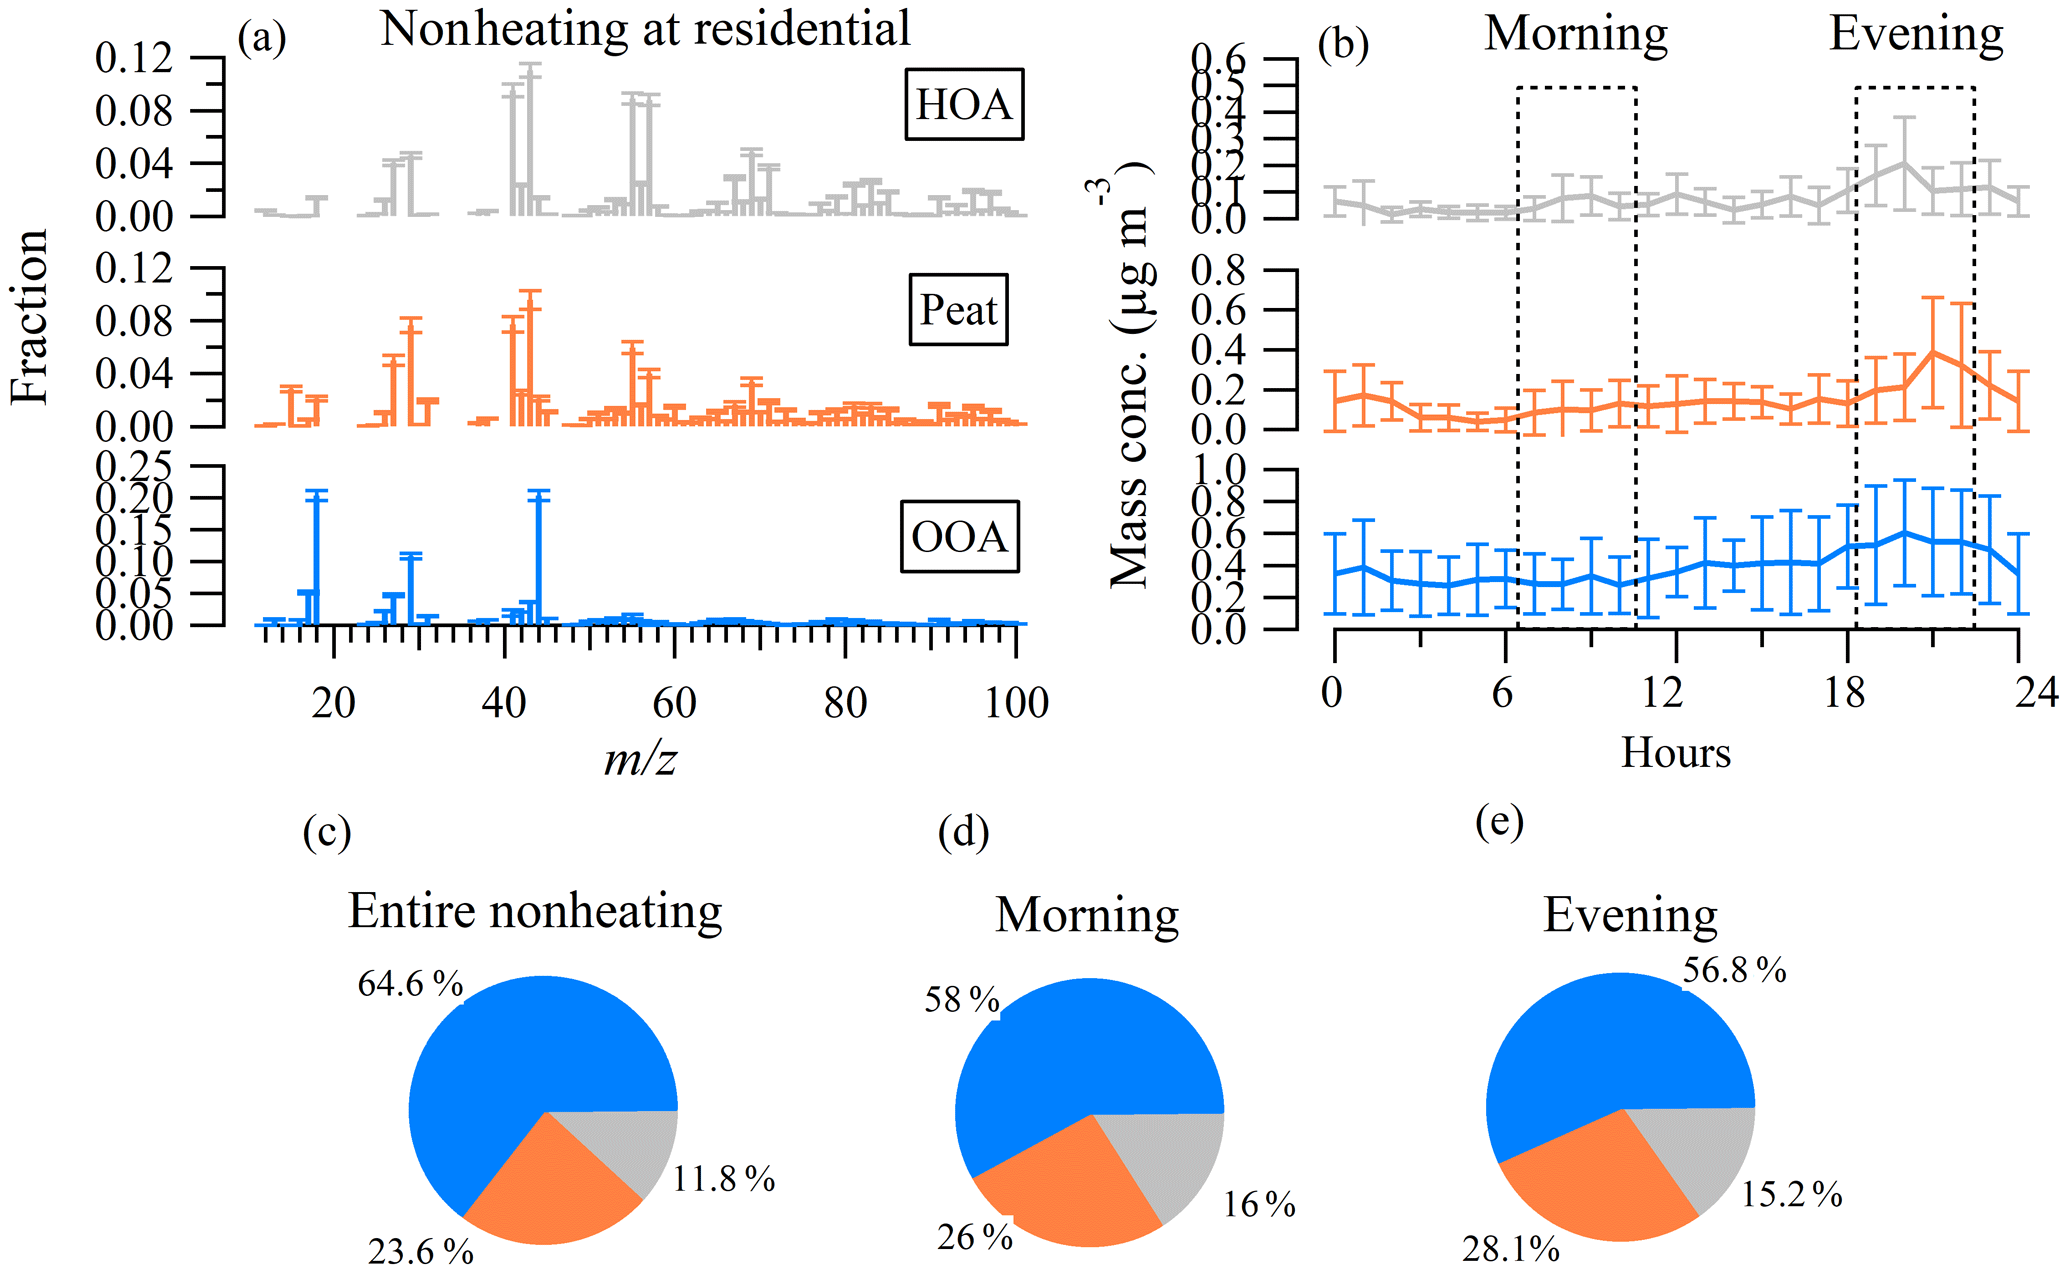
Figure 6(a) Mass spectral profiles of hydrocarbon-like OA (HOA), peat, and oxygenated OA (OOA) during the nonheating period at the residential site. (b) Diurnal cycle of the OA factors and (c) relative contribution of OA factors to the total OA over the entire nonheating period. (d) Over the morning rush hours (07:00–10:00) and (e) over the evening hours from 19:00 to 22:00. Error bars in (a) and (b) represent 1 standard deviation.
3.5.2 OA factors at the residential site during the nonheating period
Free PMF suggested a two-factor solution with one mixed primary OA factor and one OOA (Fig. S7), as a further increase in the number of factors led to the splitting of factors. The diurnal pattern of the primary factor showed a slight increase in the morning but with a larger increase in the evening and night, suggesting potential mixing between HOA and the heating-related factor. Note that the temperature was below 15 ∘C in the evening during this period (Fig. S3), and thus sporadic domestic solid fuel burning activities were likely to occur. Our previous study has shown that peat burning occurred on cold summer nights in the west coast city of Galway in Ireland (Lin et al., 2019a). Moreover, the elevated levels of m∕z 60 in the evening (at 22:00) suggested emissions from biomass burning (Fig. S7). The profile of the unconstrained primary OA factor is better correlated with the reference profile of peat-burning OA (R2=0.58) than that of wood-burning OA (R2=0.20), from our previous study (Lin et al., 2017), and the averaged profile of the biomass burning OA (BBOA; R2=0.44) factor, from the Ng et al. (2011a) study. Note that COA was not considered to be a potential OA factor at this location since the sampling site was representative of the residential area with few restaurants around. Moreover, no clear increase in the concentration of POA during lunchtime was observed during this nonheating and heating period, as discussed later. Therefore, only the reference profile of HOA and peat-burning OA factors were constrained during the nonheating period at the residential site.
The mass spectra and diurnal patterns and the relative contribution of HOA, peat, and OOA at the residential site during the nonheating period are shown in Fig. 6. While the profile of HOA is similar between the residential site and the kerbside, its concentration levels at the residential site were significantly lower than at the kerbside. Specifically, in the morning rush hours, the HOA peak concentration was 0.1 µg m−3 at the residential site while it was 1.5 µg m−3 at the kerbside, with a 15 times difference between the two sites. On average, HOA accounted for 11.8 % of OA at the residential site. During the morning rush hours, its fraction increased to 16.0 %, which was still a minor factor when compared to OOA (58 %–68 % of OA). The low contribution of HOA is consistent with the low mixing ratio of NOx at the residential site (median – 2.0 ppb), which was 20 times lower than that at the kerbside (Table 1).
The peat profile featured peaks at m∕z of 27, 29, 41, 43, 55, and 57, which was similar to HOA. However, the differences in f60 between the peat factor and HOA suggested different sources. The f60 in the peat profile was 0.014, which was higher than that for HOA (< 0.003), confirming its biomass nature (Cubison et al., 2011). The diurnal pattern of peat showed increased concentrations at 20:00–22:00, corresponding to its emission time. On average, peat accounted for 23.6 % of OA, and its fraction increased to 28.1 % in the evening. The OOA mass spectral at the residential site featured high contributions at m∕z 44 (i.e., f44), which was similar to the OOA (R2=0.95 between the two OOA total mass spectral profile) at the kerbside. Compared to that at the kerbside, the diurnal cycle of OOA at the residential site showed only a slightly elevated concentration in the evening (Fig. 6b). Therefore, most of the OOA at the residential site was likely due to regional transport.
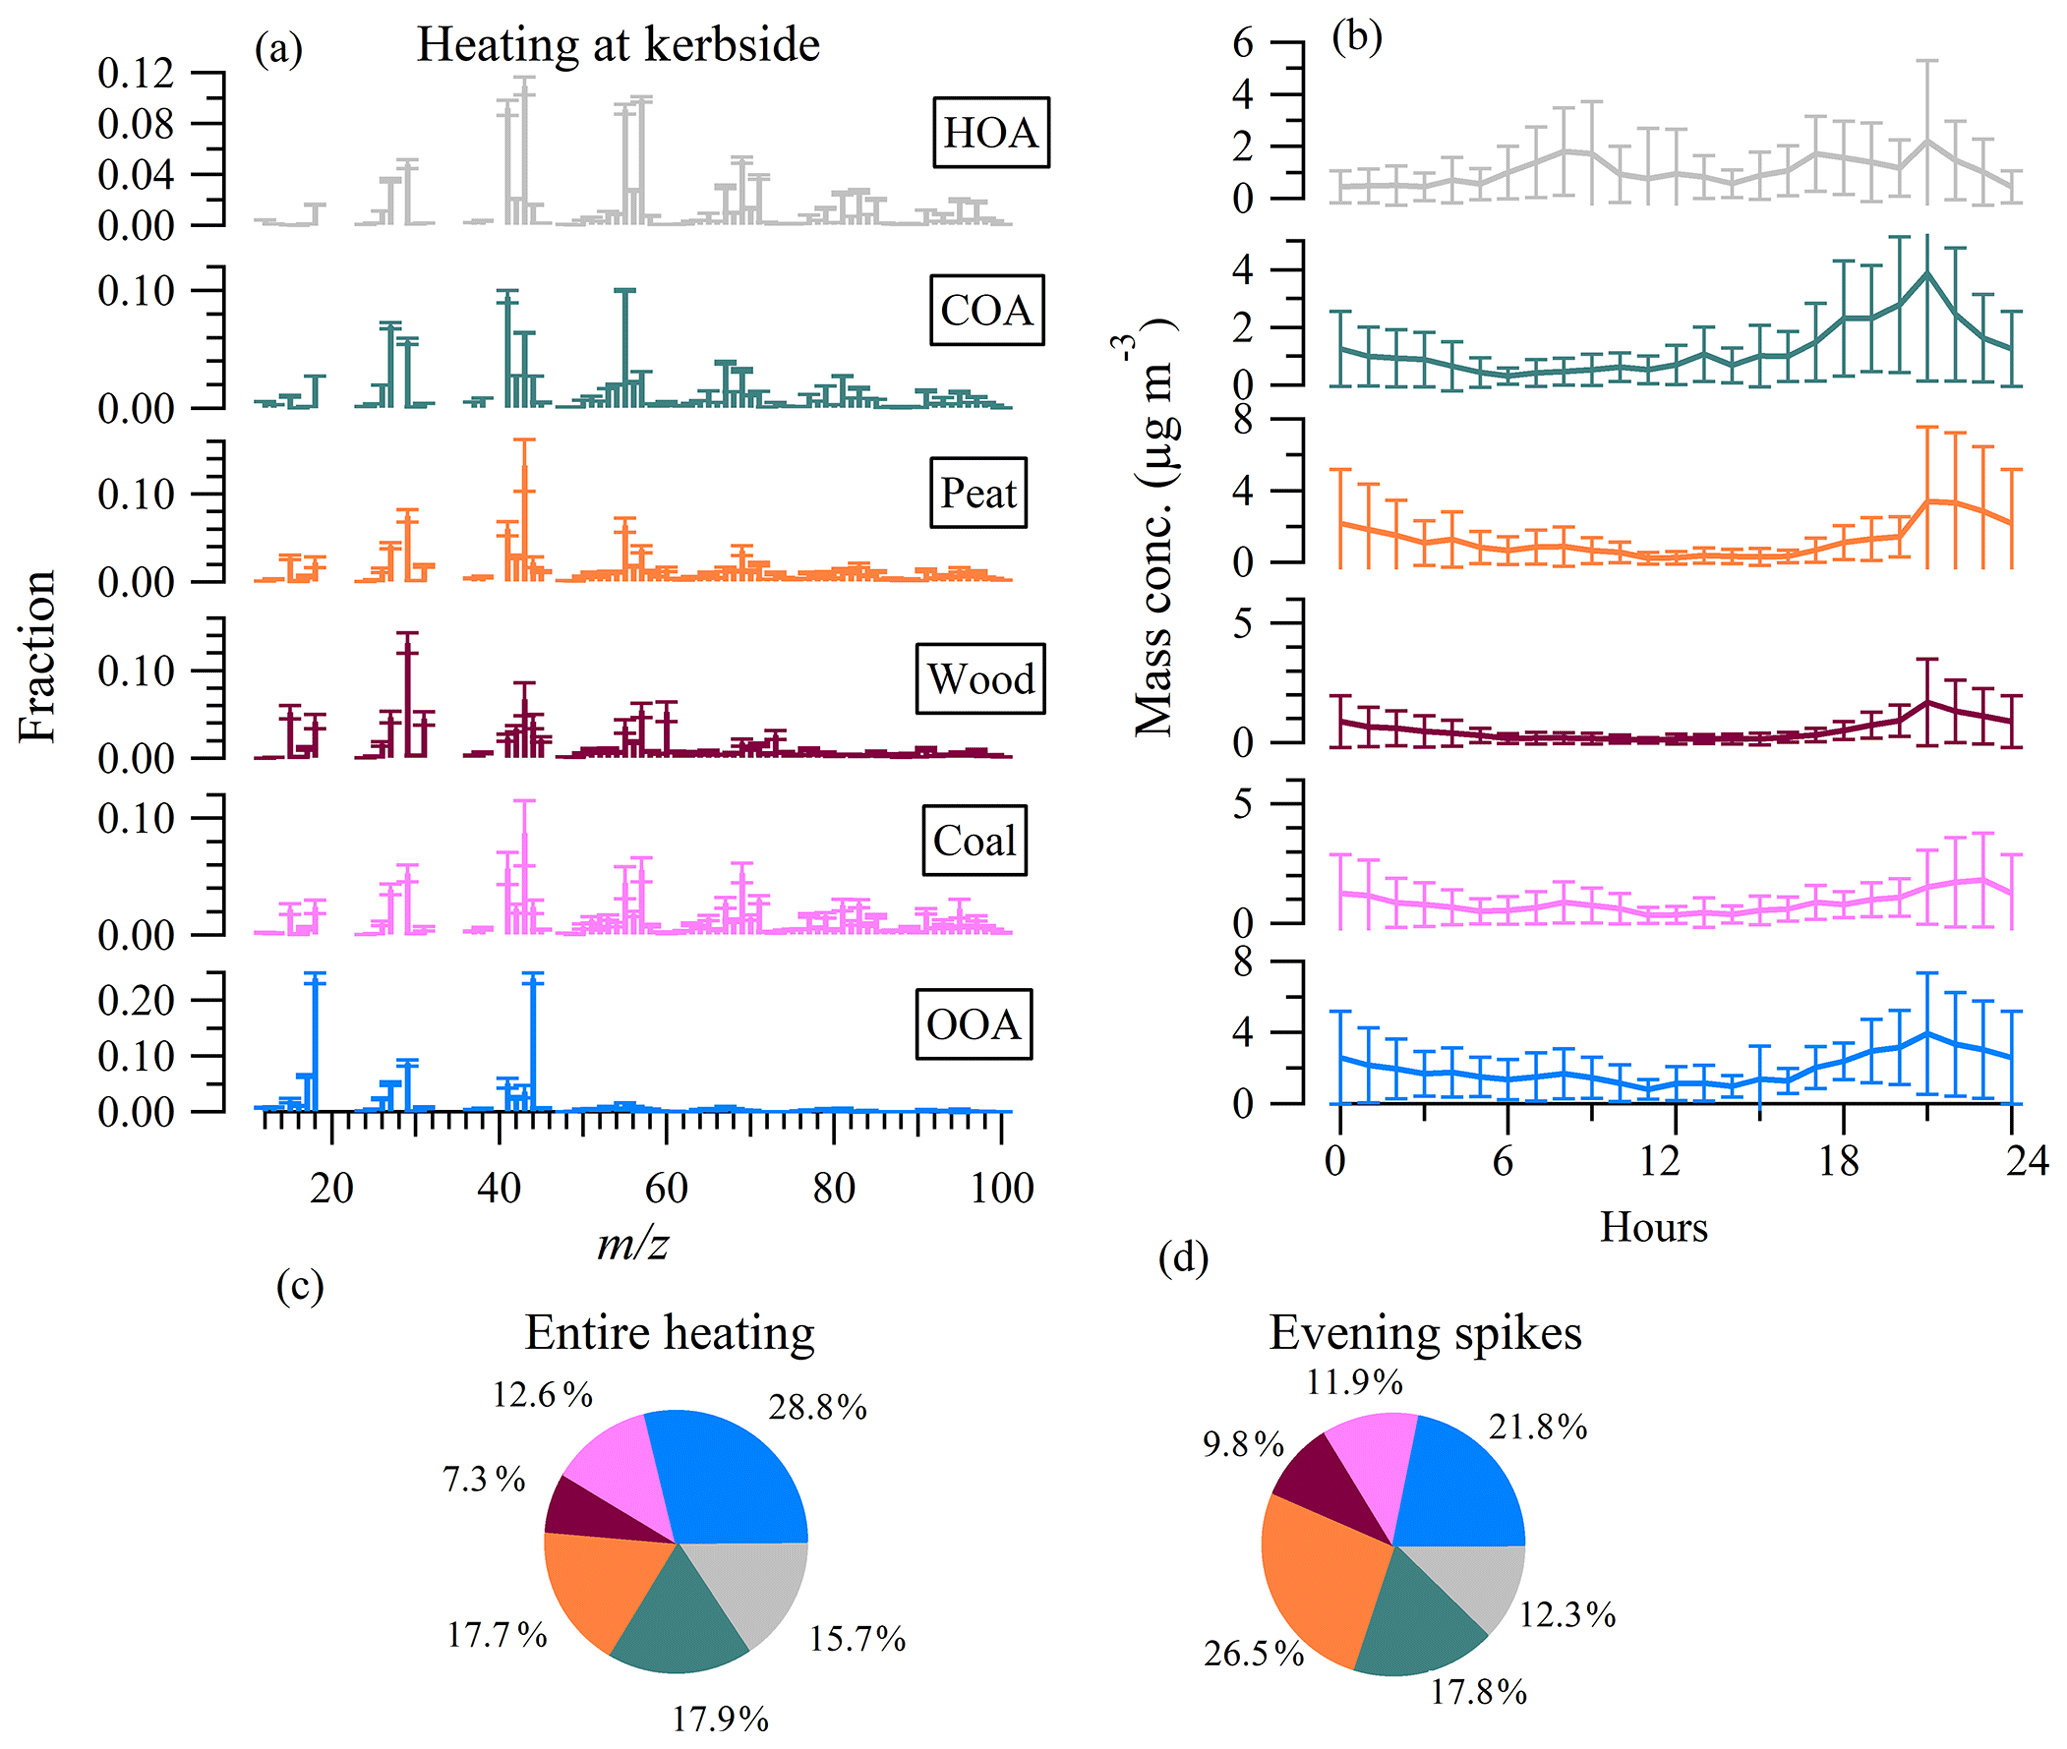
Figure 7(a) Mass spectral profiles of hydrocarbon-like OA (HOA), cooking-like OA (COA), peat, wood, coal, and oxygenated OA (OOA) factors during the heating period at the kerbside. (b) Diurnal cycle of the OA factors and (c) relative contribution of OA factors to the total OA over the entire heating period and (d) over evening spikes on 28 and 31 October 2018. Error bars in (a) and (b) represent 1 standard deviation.
3.5.3 OA factors at the kerbside during the heating period
Free PMF solutions found that the concentration of the heating-related OA factor increased substantially in the evening (Fig. S8). The increase in OA concentration during the evening was likely due to the emissions from the use of oil, peat, coal, and wood in the domestic sector, according to Central Statistics Office (CSO, 2016) and Sustainable Energy Authority of Ireland (SEAI, 2018). Previous studies have identified these heating-related aerosols in urban areas in Ireland (Kourtchev et al., 2011; Dall'Osto et al., 2013; Lin et al., 2018). However, due to the temporal covariation of the heating-related OA factors, free PMF led to highly mixed factors, which were insufficient for evaluating their respective contributions. ME-2 was, thus, used to constrain the reference profiles of peat, coal, and wood, from Lin et al. (2017), along with HOA and COA (Crippa et al., 2013).
Figure 7 shows the mass spectral profiles, diurnal patterns, and relative contributions of the resolved OA factors at the kerbside during the heating period. Consistent with that during the nonheating period, the HOA factor also showed rush hour peaks in the morning (08:00) and afternoon (17:00), with similar concentrations (1.8 µg m−3) during the heating period to those during the nonheating period. However, a third HOA peak (2.2 µg m−3) was also seen at ∼ 22:00 (Fig. 7b), likely from the emission of oil burning (CSO, 2016; Lin et al., 2017, 2018). Over the entire heating period, HOA accounted for 15.7 % (1.2 µg m−3) of OA (Fig. 7c). The relatively small fraction of HOA indicates that traffic was not the dominant OA source for the heating period despite the measurements being adjacent to a busy road in downtown Dublin. Note that HOA during the heating period could only be taken as an upper limit of the primary OA emissions from traffic because of the additional contribution from the oil burning (discussed in Sect. 3.5). COA showed a similar diurnal pattern to that during the nonheating period, but with slightly higher concentrations during the heating period, which could be associated with colder temperatures and a shallower boundary layer. On average, COA accounted for 17.9 % (1.2 µg m−3) of OA (Fig. 7c).

Figure 8(a) Mass spectral profiles of hydrocarbon-like OA (HOA), peat, wood, coal, and oxygenated OA (OOA) factors during the heating period at the residential site. (b) Diurnal cycle of the OA factors and (c) relative contribution of OA factors to the total OA over the entire heating period and (d) over evening spikes on 28 and 31 October 2018. Error bars in (a) and (b) represent 1 standard deviation.
Peat is an accumulation of partially decayed plant material, which is an important domestic fuel source in Ireland (Tuohy et al., 2009). The incomplete decay of vegetation resulted in an increase of f60 when burned (Lin et al., 2017). However, f60 in the peat profile (0.014) was lower than that of wood (0.053), probably because wood contained a higher fraction of m∕z 60-related material, e.g., levoglucosan (Fig. 7a). Over the entire heating period, peat burning accounted for 17.7 % (1.2 µg m−3) of OA (Fig. 7c). However, during the pollution spikes, as seen on 28 and 31 October 2018 (Fig. 7d), peat burning increased its fraction to 26.5 % (9.2 µg m−3), suggesting that peat burning was an important OA emission source. Similarly, wood burning increased its contribution to 9.8 % (3.3 µg m−3) during pollution spikes, from an average of 7.3 % (0.5 µg m−3). The important role of peat and wood burning in driving the pollution events is consistent with our previous study in suburban Dublin (Lin et al., 2018).
The profile of coal-burning OA featured very low f60 (< 0.003), consistent with its nonbiomass signature as coal is formed from the complete vegetation decay. On average, the coal factor accounted for 12.6 % (0.8 µg m−3) of OA. Though the fraction of coal burning decreased during pollution events (11.9 %; Fig. 7d), its absolute concentration increased (4.3 µg m−3). Note that chloride also showed a significant increase during the pollution events (Fig. 2c), which was associated with coal burning as our previous coal-combustion experiment showed that chloride emissions comprised a high fraction (2 %–52.8 %) of the submicron aerosol from coal-burning emissions (Lin et al., 2017).
The OOA profile had an f44 of 0.24 during the heating period, which was similar to that (0.22) during the nonheating period, indicating similar oxidation levels between the two periods. However, compared to the daytime OOA peak concentrations (1.8 µg m−3), higher OOA concentrations (3.9 µg m−3) were observed in the evening, indicating a more important contribution from the condensation of SVOCs emitted from heating sources and/or their dark-aging processes (Tiitta et al., 2016). On average, OOA accounted for a large fraction (29 % or 1.9 µg m−3) of OA. During pollution events, OOA still accounted for a significant fraction of OA (22 % or 7.8 µg m−3), demonstrating its importance in secondary OA processing.
3.5.4 OA factors at the residential site during the heating period
Heating-related OA factors were identified since they all showed elevated concentrations in the evening, as indicated by the free PMF solutions (Fig. S9). However, similar to the case at the kerbside, the OA factors were mixed because of the coemissions from all the domestic heating activities. To better evaluate the contributions of potential sources, the reference profiles of HOA (Crippa et al., 2013), peat, wood, and coal were constrained (Lin et al., 2017) using ME-2. Note that COA was not constrained since no lunchtime peaks were identified during this period, as discussed above.
In the morning rush hours, HOA showed a peak concentration of 0.4 µg m−3 due to traffic emissions, which was, again, largely reduced when compared to the HOA morning peaks (1.8 µg m−3) at the kerbside. However, higher concentrations of HOA (2.0 µg m−3) were observed in the evening due to the emissions of oil burning. Therefore, the majority (estimated at over 90 %) of HOA at the residential site was due to oil burning instead of traffic emissions. On average, HOA accounted for 11.8 % of the total OA over the entire heating period, and its fraction increased slightly to 12.9 % during pollution events.
Similar to the kerbside, solid fuel burning, especially peat burning, was a very important OA factor, contributing up to 45.5 % (34.9 % on average) of the OA during the pollution events (Fig. 8c and d). Coal (17.8 %–19.2 %) and wood (7.1 %–7.5 %) burning also contributed substantially over the entire period and during pollution events. The importance of solid fuel burning at the residential site echoed our previous studies at the same sites (Lin et al., 2018, 2019b). OOA, on average, accounted for 27.9 % (1.4 µg m−3) of OA, and the higher OOA concentration during the evening, concurrent to an increase in primary factor concentrations, again suggested that its major source was from the condensation of SVOCs emitted from solid fuel burning and/or their dark-aging processes (Tiitta et al., 2016).
3.6 Implications for emission control
The HOA ∕ BC ratio was ∼ 0.17, as retrieved from the slope of the linear regression between HOA and BC, with a coefficient of determination (R2) being 0.61 for the nonheating period at the kerbside (Fig. S10). This points to, on average, a 6 times higher traffic contribution to BC compared to HOA. Note that HOA represented only the primary fraction of the organic aerosol emitted from the traffic. The secondary formation from the oxidation of precursor gaseous emissions from traffic was also important, as indicated by the elevated OOA concentration in the morning rush hours at the kerbside (Fig. 5b). This is consistent with the smog chamber studies by Gordon et al. (2014), which showed a substantial amount of secondary OA formation from the precursor gases emitted by diesel vehicles with no aftertreatment techniques. In this study, the morning OOA peaks at the kerbside were mostly coinciding with the increase in HOA, pointing to a fast formation of secondary OA (i.e., from minutes to hours). However, the latter requires further investigation (e.g., real-time measurement of its precursor gases, oxidants, etc.) to better understand the formation pathways in a real urban environment.
Regarding the HOA ∕ BC ratio for the vehicular emissions, only the period of nonheating at the kerbside was considered. This is because HOA and BC were exclusively from traffic during this period. Note that the contribution from cooking to the ambient BC was considered negligible as there was a lack of BC peaks during lunchtime at the kerbside (Fig. 4a). The negligible BC emissions from cooking were consistent with previous studies, e.g., by Lee et al. (2015) and He et al. (2019). In contrast, during the heating period, HOA and BC had other sources (i.e., heating) in addition to traffic. For example, while both HOA and BC showed typical two rush hour peaks, an additional peak in the evening was observed during the heating period. Such evening peaks of HOA during the heating period could not be associated with vehicular emissions since, during the nonheating period, HOA showed only morning and afternoon rush hour peaks. Also, the traffic pattern (i.e., with no increase in traffic in the evening) was not expected to change from the nonheating to the heating period. Instead, as discussed in Sect. 3.4, the evening peaks of HOA were associated with the use of oil for heating. Since the average diurnal profile of HOA during the heating period showed two rush hour peaks compared to during the nonheating period and one additional evening heating peak, 67 % of HOA was apportioned to be from vehicular emissions and 33 % from oil heating. As a comparison, at the residential site during the heating period, HOA was nearly exclusively (95 %) from heating because it showed a substantially higher evening peak than the morning rush hour peak.
The HOA ∕ BC ratio in Dublin was lower than the HOA ∕ BC ratios reported for the gasoline-vehicle-dominated environment (0.9–1.7) but was within the range for the diesel environment (0.03–0.61; DeWitt et al., 2015), indicating that most of the traffic emissions were from diesel vehicles. The large increment of HOA and BC at the kerbside in the Dublin city center holds an important implication for its adverse health impacts since the International Agency for Research on Cancer (IARC) associated exposure to diesel engine exhausts with an increased rate of lung cancer. In Ireland, diesel fuel accounted for 73 % of the on-road transport energy in 2017 (Fig. S11a). Figure S11a also shows an increasing trend in diesel fuel usage, indicating worse air quality in the predictable future at the kerbside if diesel vehicular emissions are not controlled.
This study also shows that vehicular emissions appear to impact the air quality adjacent to the roads while, in contrast, solid fuel burning has a large geographic impact, affecting the overall air quality at the kerbside and residential site examined in this investigation. Such a large geographic impact suggests significant climate effects from residential emissions (Butt et al., 2016), which contain a higher fraction of OA than those from traffic. However, surprisingly, the census data show only a few households (< 5 %) consuming these solid fuels, with the majority of households (∼ 95 %) using natural gas and electricity as the primary heating sources in 2016 (Fig. 11b). Therefore, if the emissions from this small fraction of households are controlled, good overall air quality and lower climate forcing can be expected.
The chemical composition and sources of submicron aerosol (PM1) were simultaneously investigated at a kerbside location in downtown Dublin and at a residential site in south Dublin (∼ 5 km apart), using an ACSM and AE33, and/or AE16 at both sites during both the nonheating (i.e., early September) and heating periods (i.e., late October) of 2018. Traffic emissions were found to have a minor impact on air quality at the residential site due to the distance from nearby roadways and other affecting parameters such as wind speed and wind direction. In contrast, the kerbside was found to be highly affected by diesel vehicular emissions. BC was the most dominant component (38 %–55 %) of PM1 at the kerbside location, while OA was the most important species (46 %–64 % of PM1) at the residential site. During the nonheating period, an increment ratio of up to 25 was found for the BC at the kerbside when compared to the level of BC at the residential site, primarily due to vehicular emissions. During the heating period, the BC increment ratio was lower (∼ 10), due to the additional sources of solid fuel burning which contributed to the BC concentrations at both sites. Moreover, solid fuel burning was shown to increase PM1 concentrations substantially with episodic concentrations of > 100 µg m−3 being recorded at both sites simultaneously. Source apportionment of OA, using ME-2, showed that only 16 %–28 % (upper limit due to the additional heating source of HOA) of OA could be directly associated with vehicular emissions (i.e., HOA) at the kerbside, with the larger contribution of OA being attributed to cooking, solid fuel burning, and OOA. HOA contributed to 11 %–12 % of OA at the residential site, with a large contribution from oil burning instead of traffic because HOA did not show elevated rush hour peaks as found at the kerbside. During the heating period, solid fuel burning contributed to over 50 % of OA at the residential site, while oxygenated OA accounted for almost 65 % of OA during the nonheating period. This study highlights the significant increment of BC due to the traffic emissions at the kerbside and the large geographic impact of OA from residential heating at both the kerbside and residential sites. Therefore, traffic and residential heating might have different health and climate implications, as suggested by the temporal and spatial variability of sources within the Dublin city center.
All data needed to evaluate the conclusions in the paper are present in the paper and/or the Supplement. Also, all data used in the study are available from the corresponding author upon request.
The supplement related to this article is available online at: https://doi.org/10.5194/acp-20-10513-2020-supplement.
JO, DC, SH, and CO'D conceived and designed the experiments. CL, JO, and DC performed the experiments. CL, JO, WX, EH, JG, and CO'D analyzed the data. CL prepared the manuscript, with input from all coauthors.
The authors declare that they have no conflict of interest.
This article is part of the special issue “Air Quality Research at Street-Level (ACP/GMD inter-journal SI)”. It is not associated with a conference.
The authors would also like to acknowledge the contribution of the COST Action CA16109 (COLOSSAL) and the Science Foundation Ireland Research Centre for Energy, Climate and Marine (MaREI).
This research has been supported by the EPA Ireland (grant nos. 2016-CCRP-MS-31 and 2013-EH-MS-15), the National Natural Science Foundation of China (grant nos. 41925015, 91644219, and 41877408), the Irish Research Council (grant no. GOIPG/2015/3051), the Chinese Academy of Sciences (grant nos. ZDBS-LYDQC001 and XDB40030202), the Cross Innovative Team fund from the State Key Laboratory of Loess and Quaternary Geology (SKLLQG; grant no. SKLLQGTD1801), the National Key Research and Development Program of China (grant no. 2017YFC0212701), COST Action CA16109 (COLOSSAL), the Department of Communications, Climate Action, and Environment (DCCAE), and MaREI, the SFI Research Centre for Energy, Climate, and Marine.
This paper was edited by Andreas Hofzumahaus and reviewed by two anonymous referees.
Allan, J. D., Williams, P. I., Morgan, W. T., Martin, C. L., Flynn, M. J., Lee, J., Nemitz, E., Phillips, G. J., Gallagher, M. W., and Coe, H.: Contributions from transport, solid fuel burning and cooking to primary organic aerosols in two UK cities, Atmos. Chem. Phys., 10, 647–668, https://doi.org/10.5194/acp-10-647-2010, 2010.
An, Z., Huang, R.-J., Zhang, R., Tie, X., Li, G., Cao, J., Zhou, W., Shi, Z., Han, Y., Gu, Z., and Ji, Y.: Severe haze in northern China: A synergy of anthropogenic emissions and atmospheric processes, P. Natl. Acad. Sci. USA, 116, 8657–8666, https://doi.org/10.1073/pnas.1900125116, 2019.
Burnett, R., Chen, H., Szyszkowicz, M., Fann, N., Hubbell, B., Pope, C. A., Apte, J. S., Brauer, M., Cohen, A., Weichenthal, S., Coggins, J., Di, Q., Brunekreef, B., Frostad, J., Lim, S. S., Kan, H., Walker, K. D., Thurston, G. D., Hayes, R. B., Lim, C. C., Turner, M. C., Jerrett, M., Krewski, D., Gapstur, S. M., Diver, W. R., Ostro, B., Goldberg, D., Crouse, D. L., Martin, R. V., Peters, P., Pinault, L., Tjepkema, M., van Donkelaar, A., Villeneuve, P. J., Miller, A. B., Yin, P., Zhou, M., Wang, L., Janssen, N. A. H., Marra, M., Atkinson, R. W., Tsang, H., Quoc Thach, T., Cannon, J. B., Allen, R. T., Hart, J. E., Laden, F., Cesaroni, G., Forastiere, F., Weinmayr, G., Jaensch, A., Nagel, G., Concin, H., and Spadaro, J. V.: Global estimates of mortality associated with long-term exposure to outdoor fine particulate matter, P. Natl. Acad. Sci. USA, 115, 9592–9597, https://doi.org/10.1073/pnas.1803222115, 2018.
Butt, E. W., Rap, A., Schmidt, A., Scott, C. E., Pringle, K. J., Reddington, C. L., Richards, N. A. D., Woodhouse, M. T., Ramirez-Villegas, J., Yang, H., Vakkari, V., Stone, E. A., Rupakheti, M., S. Praveen, P., G. van Zyl, P., P. Beukes, J., Josipovic, M., Mitchell, E. J. S., Sallu, S. M., Forster, P. M., and Spracklen, D. V.: The impact of residential combustion emissions on atmospheric aerosol, human health, and climate, Atmos. Chem. Phys., 16, 873–905, https://doi.org/10.5194/acp-16-873-2016, 2016.
Canonaco, F., Crippa, M., Slowik, J. G., Baltensperger, U., and Prévôt, A. S. H.: SoFi, an IGOR-based interface for the efficient use of the generalized multilinear engine (ME-2) for the source apportionment: ME-2 application to aerosol mass spectrometer data, Atmos. Meas. Tech., 6, 3649–3661, https://doi.org/10.5194/amt-6-3649-2013, 2013.
Cohen, A. J., Brauer, M., Burnett, R., Anderson, H. R., Frostad, J., Estep, K., Balakrishnan, K., Brunekreef, B., Dandona, L., Dandona, R., Feigin, V., Freedman, G., Hubbell, B., Jobling, A., Kan, H., Knibbs, L., Liu, Y., Martin, R., Morawska, L., Pope, C. A., Shin, H., Straif, K., Shaddick, G., Thomas, M., van Dingenen, R., van Donkelaar, A., Vos, T., Murray, C. J. L., and Forouzanfar, M. H.: Estimates and 25-year trends of the global burden of disease attributable to ambient air pollution: an analysis of data from the Global Burden of Diseases Study 2015, The Lancet, 389, 1907–1918, https://doi.org/10.1016/S0140-6736(17)30505-6, 2017.
Crippa, M., DeCarlo, P. F., Slowik, J. G., Mohr, C., Heringa, M. F., Chirico, R., Poulain, L., Freutel, F., Sciare, J., Cozic, J., Di Marco, C. F., Elsasser, M., Nicolas, J. B., Marchand, N., Abidi, E., Wiedensohler, A., Drewnick, F., Schneider, J., Borrmann, S., Nemitz, E., Zimmermann, R., Jaffrezo, J.-L., Prévôt, A. S. H., and Baltensperger, U.: Wintertime aerosol chemical composition and source apportionment of the organic fraction in the metropolitan area of Paris, Atmos. Chem. Phys., 13, 961–981, https://doi.org/10.5194/acp-13-961-2013, 2013.
CSO: (Central Statistics Office), Private Households in Permanent Housing Units, available at: https://www.cso.ie/px/pxeirestat/Statire/SelectVarVal/Define.asp?maintable=E4015&PLanguage=0 (last access: 1 May 2020), 2016.
Cubison, M. J., Ortega, A. M., Hayes, P. L., Farmer, D. K., Day, D., Lechner, M. J., Brune, W. H., Apel, E., Diskin, G. S., Fisher, J. A., Fuelberg, H. E., Hecobian, A., Knapp, D. J., Mikoviny, T., Riemer, D., Sachse, G. W., Sessions, W., Weber, R. J., Weinheimer, A. J., Wisthaler, A., and Jimenez, J. L.: Effects of aging on organic aerosol from open biomass burning smoke in aircraft and laboratory studies, Atmos. Chem. Phys., 11, 12049–12064, https://doi.org/10.5194/acp-11-12049-2011, 2011.
Dall'Osto, M., Ovadnevaite, J., Ceburnis, D., Martin, D., Healy, R. M., O'Connor, I. P., Kourtchev, I., Sodeau, J. R., Wenger, J. C., and O'Dowd, C.: Characterization of urban aerosol in Cork city (Ireland) using aerosol mass spectrometry, Atmos. Chem. Phys., 13, 4997–5015, https://doi.org/10.5194/acp-13-4997-2013, 2013.
DeWitt, H. L., Hellebust, S., Temime-Roussel, B., Ravier, S., Polo, L., Jacob, V., Buisson, C., Charron, A., André, M., Pasquier, A., Besombes, J. L., Jaffrezo, J. L., Wortham, H., and Marchand, N.: Near-highway aerosol and gas-phase measurements in a high-diesel environment, Atmos. Chem. Phys., 15, 4373–4387, https://doi.org/10.5194/acp-15-4373-2015, 2015.
Drinovec, L., Močnik, G., Zotter, P., Prévôt, A. S. H., Ruckstuhl, C., Coz, E., Rupakheti, M., Sciare, J., Müller, T., Wiedensohler, A., and Hansen, A. D. A.: The ”dual-spot” Aethalometer: an improved measurement of aerosol black carbon with real-time loading compensation, Atmos. Meas. Tech., 8, 1965–1979, https://doi.org/10.5194/amt-8-1965-2015, 2015.
Fu, M., Kelly, J. A., and Clinch, J. P.: Estimating annual average daily traffic and transport emissions for a national road network: A bottom-up methodology for both nationally-aggregated and spatially-disaggregated results, J. Transp. Geogr., 58, 186–195, https://doi.org/10.1016/j.jtrangeo.2016.12.002, 2017.
Fuzzi, S., Baltensperger, U., Carslaw, K., Decesari, S., Denier van der Gon, H., Facchini, M. C., Fowler, D., Koren, I., Langford, B., Lohmann, U., Nemitz, E., Pandis, S., Riipinen, I., Rudich, Y., Schaap, M., Slowik, J. G., Spracklen, D. V., Vignati, E., Wild, M., Williams, M., and Gilardoni, S.: Particulate matter, air quality and climate: lessons learned and future needs, Atmos. Chem. Phys., 15, 8217–8299, https://doi.org/10.5194/acp-15-8217-2015, 2015.
Gallagher, J., Gill, L. W., and McNabola, A.: The passive control of air pollution exposure in Dublin, Ireland: A combined measurement and modelling case study, Sci. Total Environ., 458–460, 331–343, https://doi.org/10.1016/j.scitotenv.2013.03.079, 2013.
Gallagher, J.: A modelling exercise to examine variations of NOx concentrations on adjacent footpaths in a street canyon: The importance of accounting for wind conditions and fleet composition, Sci. Total Environ., 550, 1065–1074, https://doi.org/10.1016/j.scitotenv.2016.01.096, 2016.
Gentner, D. R., Jathar, S. H., Gordon, T. D., Bahreini, R., Day, D. A., El Haddad, I., Hayes, P. L., Pieber, S. M., Platt, S. M., de Gouw, J., Goldstein, A. H., Harley, R. A., Jimenez, J. L., Prévôt, A. S. H., and Robinson, A. L.: Review of Urban Secondary Organic Aerosol Formation from Gasoline and Diesel Motor Vehicle Emissions, Environ. Sci. Technol., 51, 1074–1093, https://doi.org/10.1021/acs.est.6b04509, 2017.
Gordon, T. D., Presto, A. A., Nguyen, N. T., Robertson, W. H., Na, K., Sahay, K. N., Zhang, M., Maddox, C., Rieger, P., Chattopadhyay, S., Maldonado, H., Maricq, M. M., and Robinson, A. L.: Secondary organic aerosol production from diesel vehicle exhaust: impact of aftertreatment, fuel chemistry and driving cycle, Atmos. Chem. Phys., 14, 4643–4659, https://doi.org/10.5194/acp-14-4643-2014, 2014.
Hallquist, M., Wenger, J. C., Baltensperger, U., Rudich, Y., Simpson, D., Claeys, M., Dommen, J., Donahue, N. M., George, C., Goldstein, A. H., Hamilton, J. F., Herrmann, H., Hoffmann, T., Iinuma, Y., Jang, M., Jenkin, M. E., Jimenez, J. L., Kiendler-Scharr, A., Maenhaut, W., McFiggans, G., Mentel, Th. F., Monod, A., Prévôt, A. S. H., Seinfeld, J. H., Surratt, J. D., Szmigielski, R., and Wildt, J.: The formation, properties and impact of secondary organic aerosol: current and emerging issues, Atmos. Chem. Phys., 9, 5155–5236, https://doi.org/10.5194/acp-9-5155-2009, 2009.
He, Y., Sun, Y., Wang, Q., Zhou, W., Xu, W., Zhang, Y., Xie, C., Zhao, J., Du, W., Qiu, Y., Lei, L., Fu, P., Wang, Z., and Worsnop, D. R.: A Black Carbon-Tracer Method for Estimating Cooking Organic Aerosol from Aerosol Mass Spectrometer Measurements, Geophys. Res. Lett., 46, 8474–8483, https://doi.org/10.1029/2019gl084092, 2019.
Jimenez, J. L., Canagaratna, M. R., Donahue, N. M., Prevot, A. S. H., Zhang, Q., Kroll, J. H., DeCarlo, P. F., Allan, J. D., Coe, H., Ng, N. L., Aiken, A. C., Docherty, K. S., Ulbrich, I. M., Grieshop, A. P., Robinson, A. L., Duplissy, J., Smith, J. D., Wilson, K. R., Lanz, V. A., Hueglin, C., Sun, Y. L., Tian, J., Laaksonen, A., Raatikainen, T., Rautiainen, J., Vaattovaara, P., Ehn, M., Kulmala, M., Tomlinson, J. M., Collins, D. R., Cubison, M. J., E., Dunlea, J., Huffman, J. A., Onasch, T. B., Alfarra, M. R., Williams, P. I., Bower, K., Kondo, Y., Schneider, J., Drewnick, F., Borrmann, S., Weimer, S., Demerjian, K., Salcedo, D., Cottrell, L., Griffin, R., Takami, A., Miyoshi, T., Hatakeyama, S., Shimono, A., Sun, J. Y., Zhang, Y. M., Dzepina, K., Kimmel, J. R., Sueper, D., Jayne, J. T., Herndon, S. C., Trimborn, A. M., Williams, L. R., Wood, E. C., Middlebrook, A. M., Kolb, C. E., Baltensperger, U., and Worsnop, D. R.: Evolution of Organic Aerosols in the Atmosphere, Science, 326, 1525–1529, 2009.
Kourtchev, I., Hellebust, S., Bell, J. M., O'Connor, I. P., Healy, R. M., Allanic, A., Healy, D., Wenger, J. C., and Sodeau, J. R.: The use of polar organic compounds to estimate the contribution of domestic solid fuel combustion and biogenic sources to ambient levels of organic carbon and PM2.5 in Cork Harbour, Ireland, Sci. Total Environ., 409, 2143–2155, https://doi.org/10.1016/j.scitotenv.2011.02.027, 2011.
Lee, A. K. Y., Willis, M. D., Healy, R. M., Onasch, T. B., and Abbatt, J. P. D.: Mixing state of carbonaceous aerosol in an urban environment: single particle characterization using the soot particle aerosol mass spectrometer (SP-AMS), Atmos. Chem. Phys., 15, 1823–1841, https://doi.org/10.5194/acp-15-1823-2015, 2015.
Lenschow, P., Abraham, H. J., Kutzner, K., Lutz, M., Preuß, J. D., and Reichenbächer, W.: Some ideas about the sources of PM10, Atmos. Environ., 35, S23–S33, https://doi.org/10.1016/S1352-2310(01)00122-4, 2001.
Lin, C., Ceburnis, D., Hellebust, S., Buckley, P., Wenger, J., Canonaco, F., Prévôt, A. S. H., Huang, R.-J., O'Dowd, C., and Ovadnevaite, J.: Characterization of primary organic aerosol from domestic wood, peat, and coal burning in Ireland, Environ. Sci. Technol., 51, 10624–10632, 2017.
Lin, C., Huang, R.-J., Ceburnis, D., Buckley, P., Preissler, J., Wenger, J., Rinaldi, M., Facchini, M. C., O'Dowd, C., and Ovadnevaite, J.: Extreme air pollution from residential solid fuel burning, Nat. Sustain., 1, 512–517, 2018.
Lin, C., Ceburnis, D., Huang, R.-J., Canonaco, F., Prévôt, A. S. H., O'Dowd, C., and Ovadnevaite, J.: Summertime Aerosol over the West of Ireland Dominated by Secondary Aerosol during Long-Range Transport, Atmosphere, 10, 59–70, https://doi.org/10.3390/atmos10020059, 2019a.
Lin, C., Ceburnis, D., Huang, R.-J., Xu, W., Spohn, T., Martin, D., Buckley, P., Wenger, J., Hellebust, S., Rinaldi, M., Facchini, M. C., O'Dowd, C., and Ovadnevaite, J.: Wintertime aerosol dominated by solid-fuel-burning emissions across Ireland: insight into the spatial and chemical variation in submicron aerosol, Atmos. Chem. Phys., 19, 14091–14106, https://doi.org/10.5194/acp-19-14091-2019, 2019b.
Liu, T., Wang, Z., Huang, D. D., Wang, X., and Chan, C. K.: Significant Production of Secondary Organic Aerosol from Emissions of Heated Cooking Oils, Environ. Sci. Technol. Lett., 5, 32–37, https://doi.org/10.1021/acs.estlett.7b00530, 2018.
Middlebrook, A. M., Bahreini, R., Jimenez, J. L., and Canagaratna, M. R.: Evaluation of Composition-Dependent Collection Efficiencies for the Aerodyne Aerosol Mass Spectrometer using Field Data, Aerosol Sci. Tech., 46, 258–271, https://doi.org/10.1080/02786826.2011.620041, 2012.
Mohr, C., Richter, R., DeCarlo, P. F., Prévôt, A. S. H., and Baltensperger, U.: Spatial variation of chemical composition and sources of submicron aerosol in Zurich during wintertime using mobile aerosol mass spectrometer data, Atmos. Chem. Phys., 11, 7465–7482, https://doi.org/10.5194/acp-11-7465-2011, 2011.
Mohr, C., DeCarlo, P. F., Heringa, M. F., Chirico, R., Slowik, J. G., Richter, R., Reche, C., Alastuey, A., Querol, X., Seco, R., Peñuelas, J., Jiménez, J. L., Crippa, M., Zimmermann, R., Baltensperger, U., and Prévôt, A. S. H.: Identification and quantification of organic aerosol from cooking and other sources in Barcelona using aerosol mass spectrometer data, Atmos. Chem. Phys., 12, 1649–1665, https://doi.org/10.5194/acp-12-1649-2012, 2012.
Mues, A., Manders, A., Schaap, M., van Ulft, L. H., van Meijgaard, E., and Builtjes, P.: Differences in particulate matter concentrations between urban and rural regions under current and changing climate conditions, Atmos. Environ., 80, 232–247, https://doi.org/10.1016/j.atmosenv.2013.07.049, 2013.
Ng, N. L., Canagaratna, M. R., Jimenez, J. L., Zhang, Q., Ulbrich, I. M., and Worsnop, D. R.: Real-time methods for estimating organic component mass concentrations from aerosol mass spectrometer data, Environ. Sci. Technol., 45, 910–916, 2011a.
Ng, N. L., Herndon, S. C., Trimborn, A., Canagaratna, M. R., Croteau, P. L., Onasch, T. B., Sueper, D., Worsnop, D. R., Zhang, Q., Sun, Y. L., and Jayne, J. T.: An Aerosol Chemical Speciation Monitor (ACSM) for routine monitoring of the composition and mass concentrations of ambient aerosol, Aerosol Sci. Technol., 45, 780–794, 2011b.
Petit, J.-E., Favez, O., Sciare, J., Canonaco, F., Croteau, P., Močnik, G., Jayne, J., Worsnop, D., and Leoz-Garziandia, E.: Submicron aerosol source apportionment of wintertime pollution in Paris, France by double positive matrix factorization (PMF2) using an aerosol chemical speciation monitor (ACSM) and a multi-wavelength Aethalometer, Atmos. Chem. Phys., 14, 13773–13787, https://doi.org/10.5194/acp-14-13773-2014, 2014.
Pope III, C. A., Burnett, R. T., Thun, M. J., Calle, E. E., Krewski, D., Ito, K., and Thurston, G. D.: Lung cancer, cardiopulmonary mortality, and long-term exposure to fine particulate air pollution, Jama, 287, 1132–1141, 2002.
Statutory instruments: Sulphur Content of Heavy Fuel Oil, Gas Oil, and Marine Fuels Regulations, 2008.
SEAI: (Sustainable Energy Authority of Ireland), Energy Statistics in Ireland, available at: https://www.seai.ie/resources/seai-statistics/key-statistics (last access: 1 May 2020), 2018.
Tiitta, P., Leskinen, A., Hao, L., Yli-Pirilä, P., Kortelainen, M., Grigonyte, J., Tissari, J., Lamberg, H., Hartikainen, A., Kuuspalo, K., Kortelainen, A.-M., Virtanen, A., Lehtinen, K. E. J., Komppula, M., Pieber, S., Prévôt, A. S. H., Onasch, T. B., Worsnop, D. R., Czech, H., Zimmermann, R., Jokiniemi, J., and Sippula, O.: Transformation of logwood combustion emissions in a smog chamber: formation of secondary organic aerosol and changes in the primary organic aerosol upon daytime and nighttime aging, Atmos. Chem. Phys., 16, 13251–13269, https://doi.org/10.5194/acp-16-13251-2016, 2016.
Tuohy, A., Bazilian, M., Doherty, R., Gallachóir, B. Ó., and O'Malley, M.: Burning peat in Ireland: An electricity market dispatch perspective, Energy Policy, 37, 3035–3042, 2009.
Zhang, R., Wang, G., Guo, S., Zamora, M. L., Ying, Q., Lin, Y., Wang, W., Hu, M., and Wang, Y.: Formation of Urban Fine Particulate Matter, Chem. Rev., 115, 3803–3855, https://doi.org/10.1021/acs.chemrev.5b00067, 2015.
Zhang, Y., Favez, O., Petit, J.-E., Canonaco, F., Truong, F., Bonnaire, N., Crenn, V., Amodeo, T., Prévôt, A. S. H., Sciare, J., Gros, V., and Albinet, A.: Six-year source apportionment of submicron organic aerosols from near-continuous highly time-resolved measurements at SIRTA (Paris area, France), Atmos. Chem. Phys., 19, 14755–14776, https://doi.org/10.5194/acp-19-14755-2019, 2019.