the Creative Commons Attribution 4.0 License.
the Creative Commons Attribution 4.0 License.
 | 08 Sep 2020
Evolution of NO3 reactivity during the oxidation of isoprene
Patrick Dewald
Jonathan M. Liebmann
Nils Friedrich
Justin Shenolikar
Jan Schuladen
Franz Rohrer
David Reimer
Ralf Tillmann
Anna Novelli
Changmin Cho
Kangming Xu
Rupert Holzinger
François Bernard
Li Zhou
Wahid Mellouki
Steven S. Brown
Hendrik Fuchs
Jos Lelieveld
In a series of experiments in an atmospheric simulation chamber (SAPHIR,1 Forschungszentrum Jülich, Germany), NO3 reactivity () resulting from the reaction of NO3 with isoprene and stable trace gases formed as products was measured directly using a flow tube reactor coupled to a cavity ring-down spectrometer (FT-CRDS). The experiments were carried out in both dry and humid air with variation of the initial mixing ratios of ozone (50–100 ppbv), isoprene (3–22 ppbv) and NO2 (5–30 ppbv). was in excellent agreement with values calculated from the isoprene mixing ratio and the rate coefficient for the reaction of NO3 with isoprene. This result serves to confirm that the FT-CRDS returns accurate values of even at elevated NO2 concentrations and to show that reactions of NO3 with stable reaction products like non-radical organic nitrates do not contribute significantly to NO3 reactivity during the oxidation of isoprene. A comparison of with NO3 reactivities calculated from NO3 mixing ratios and NO3 production rates suggests that organic peroxy radicals and HO2 account for ∼50 % of NO3 losses. This contradicts predictions based on numerical simulations using the Master Chemical Mechanism (MCM version 3.3.1) unless the rate coefficient for reaction between NO3 and isoprene-derived RO2 is roughly doubled to cm3 molecule−1 s−1.
- Article
(5558 KB) - Full-text XML
-
Supplement
(1017 KB) - BibTeX
- EndNote


The atmospheric oxidation of volatile organic compounds (VOCs) of both biogenic and anthropogenic origin has a great impact on tropospheric chemistry and global climate (Lelieveld et al., 2008). Isoprene is one of the major organic (non-methane) compounds that is released in the environment by vegetation and contributes ∼ 50 % to the overall emission of VOCs into the atmosphere (Guenther et al., 2012). The most important initiators of oxidation for biogenic VOCs in the atmosphere are hydroxyl radicals (OH), ozone (O3) and nitrate radicals (NO3) (Geyer et al., 2001; Atkinson and Arey, 2003; Lelieveld et al., 2016; Wennberg et al., 2018). Our focus in this study is on NO3, which is formed via the sequential oxidation of NO by ozone (Reactions R1 and R2). During the daytime, NO3 mixing ratios are very low, owing to its efficient reaction with NO (Reaction R6) and its rapid photolysis (Reactions R7 and R8). Generally, NO3 is present in mixing ratios greater than a few parts per trillion by volume (pptv) only at night-time, when it can become the major oxidizing agent for VOCs including isoprene (Reaction R5). In forested regions, reactions with biogenic trace gases, however, can contribute significantly to the daytime reactivity of NO3 (Liebmann et al., 2018a, b).
Moreover, NO2, NO3 and N2O5 exist in thermal equilibrium (Reactions R3 and R4) so that the heterogeneous loss of N2O5 (and NO3) at surfaces (Reactions R9 and R10) impacts on the lifetime of NO3 in the atmosphere (Martinez et al., 2000; Brown et al., 2003, 2006, 2009b; Crowley et al., 2010).
Although isoprene is mainly emitted by vegetation at daytime (Sharkey and Yeh, 2001; Guenther et al., 2012), during which its main sink reaction is with the OH radical (Paulot et al., 2012), it accumulates in the nocturnal boundary layer (Warneke et al., 2004; Brown et al., 2009a) where reactions of NO3 and O3 determine its lifetime (Wayne et al., 1991; Brown and Stutz, 2012; Wennberg et al., 2018). The rate constant (at 298 K) for the reaction between isoprene and NO3 is cm3 molecule−1 s−1, which is several orders of magnitude larger than for the reaction with O3 ( cm3 molecule−1 s−1) (Atkinson et al., 2006; IUPAC, 2020) and thus compensating for the difference in mixing ratios of NO3 (typically 1–100 pptv) and O3 (typically 20–80 ppbv) (Edwards et al., 2017). NO3 is often the most important nocturnal oxidant of biogenic VOCs (Mogensen et al., 2015), especially in remote, forested environments where it reacts almost exclusively with biogenic isoprene and terpenes (Ng et al., 2017; Liebmann et al., 2018a, b). The reaction between isoprene and NO3 leads initially to the formation of nitro isoprene peroxy radicals (NISOPOO, e.g. O2NOCH2C(CH3)=CHCH2OO) that can either react with NO3, forming mostly a nitro isoprene aldehyde (NC4CHO, e.g. O2NOCH2C(CH3)=CHCHO) and methyl vinyl ketone (MVK) or react further with other organic peroxy (RO2), or hydroperoxy (HO2) radicals, forming nitrated carbonyls, peroxides and alcohols (Schwantes et al., 2015).
The organic nitrates formed (RONO2) can deposit on particles (Reaction R11); therefore, the NO3 + isoprene system contributes to the formation of secondary organic aerosol (SOA) (Rollins et al., 2009; Fry et al., 2018). Together with heterogeneous uptake of N2O5 or NO3 on particle surfaces (Reactions R9 and R10), the build-up of SOA from isoprene oxidation products forms a significant pathway for removal of reactive nitrogen species (NOx) from the gas phase; a detailed understanding of the reaction between isoprene and NO3 is therefore crucial for assessing its impact on SOA formation and NOx lifetimes.
In this study, the NO3-induced oxidation of isoprene was examined in an environmental chamber equipped with a large suite of instruments, including a cavity ring-down spectrometer coupled to a flow tube reactor (FT-CRDS) for direct NO3 reactivity measurement (Liebmann et al., 2017). The NO3 lifetime in steady state (the inverse of its overall reactivity) has often been derived from NO3 mixing ratios and production rates, with the latter depending on the mixing ratios of NO2 and O3 (Heintz et al., 1996; Geyer and Platt, 2002; Brown et al., 2004; Sobanski et al., 2016b). The steady-state approach works only if NO3 is present at sufficiently high mixing ratios to be measured (generally not the case during daytime), breaks down to a varying extent if a steady state is not achieved (Brown et al., 2003; Sobanski et al., 2016b), and may be influenced by heterogeneous losses of NO3 or N2O5 (Crowley et al., 2011; Phillips et al., 2016), which are difficult to constrain. Comparing the steady-state calculations with the FT-CRDS approach (which derives the NO3 reactivity attributable exclusively to VOCs) can provide insight into the main contributions to NO3 reactivity and its evolution as the reaction progresses. In the following, we present the results of direct NO3 reactivity measurements in the SAPHIR (Simulation of Atmospheric PHotochemistry In a large Reaction) environmental chamber under controlled conditions and explore the contributions of isoprene, peroxy radicals and stable oxidation products to NO3 reactivity over a period of several hours as the chemical system resulting from NO3-induced oxidation of isoprene evolves.
An intensive study of the NO3 + isoprene system (NO3ISOP campaign) took place at the SAPHIR chamber of the Forschungszentrum Jülich over a 3-week period in August 2018. The aim of NO3ISOP was to improve our understanding of product formation in the reaction between NO3 and isoprene as well as its impact on the formation of SOA. Depending on the conditions (high or low HO2∕RO2, temperature, humidity, and daytime or night-time), a large variety of oxidation products, formed via different reaction paths, exist (Wennberg et al., 2018). During NO3ISOP, the impact of varying experimental conditions on the formation of gas-phase products as well as secondary organic aerosol formation and composition was explored within 22 different experiments (see Table 1). Typical conditions were close to those found in the atmosphere with 5 ppbv of NO2, 50–100 ppbv of O3 and 3 ppbv of isoprene, or (when high product formation rates were required) NO2 was raised to 25 ppbv and isoprene to 10 ppbv. The high O3 mixing ratios in the chamber ensured that NO was not detectable (<10 pptv) in the darkened chamber.
Table 1Experimental conditions in the SAPHIR chamber during the NO3ISOP campaign.
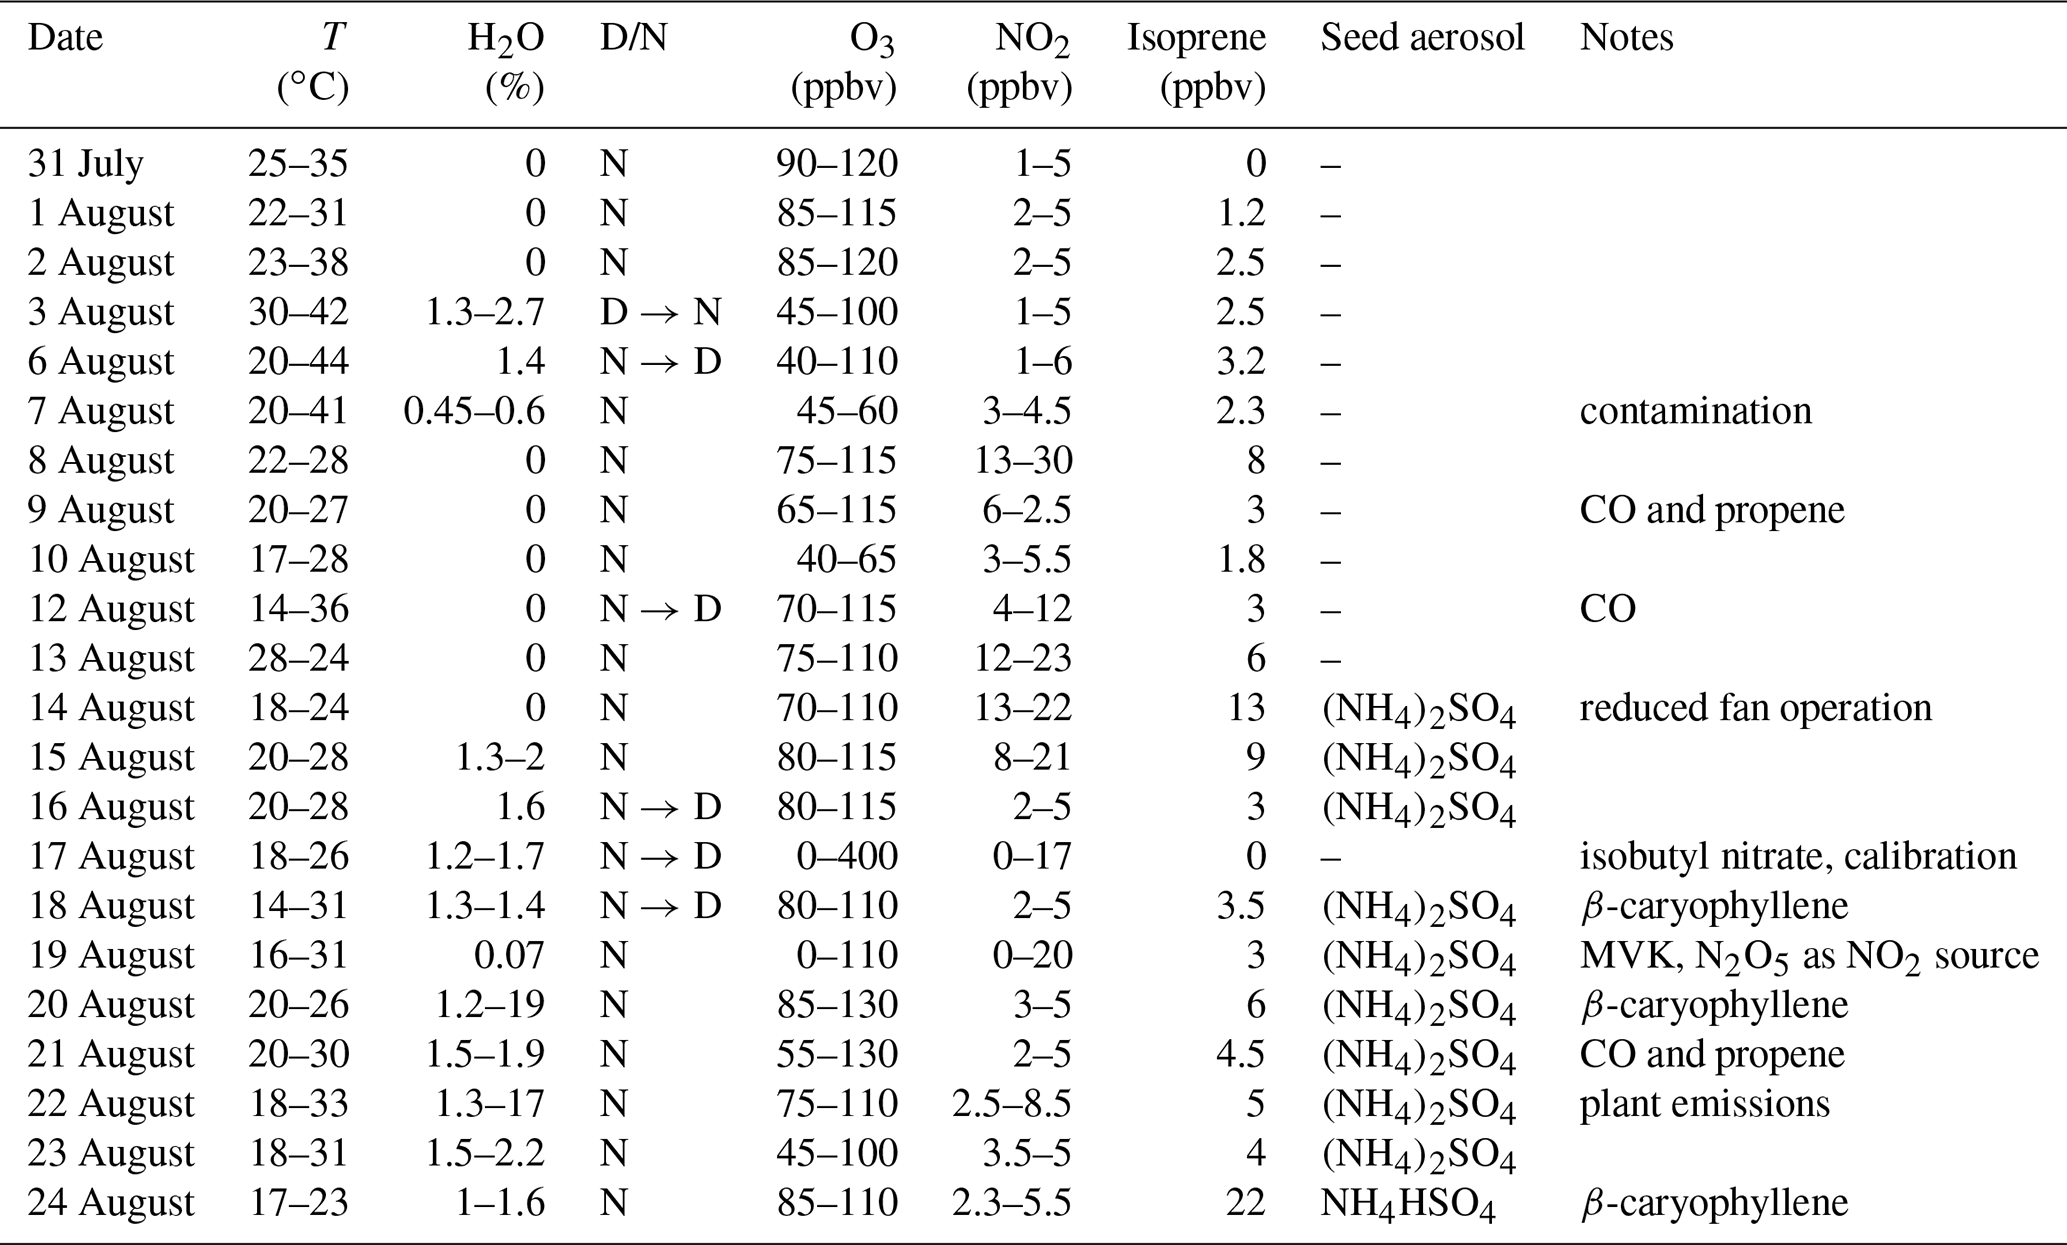
D/N denotes if the experiment was conducted with the chamber roof opened (D: daytime) or closed (N: night-time) and in which order a transition was done. Only maximum values of measured isoprene are listed.
The first 11 experiments of NO3ISOP were dedicated to gas-phase chemistry; in the second part seed aerosol ((NH4)2SO4) was added and the focus shifted to aerosol measurements. Due to a contamination event in the chamber, the experiment from the 7 August is not considered for further analysis. The SAPHIR chamber and the measurements and instruments that are relevant for the present analysis are described briefly below.
2.1 The SAPHIR chamber
The atmospheric simulation chamber SAPHIR has been described in detail on various occasions (Rohrer et al., 2005; Bossmeyer et al., 2006; Fuchs et al., 2010), and we present only a brief description of some important features here: the outdoor chamber consists of two layers of FEP (fluorinated ethylene propylene) foil defining a cylindrical shape with a volume of 270 m3 and a surface area of 320 m2. The chamber is operated at ambient temperature and its pressure is ∼ 30 Pa above ambient level. A shutter system in the roof enables the chamber to be completely darkened or illuminated with natural sunlight. Two fans result in rapid (2 min) mixing of the gases in the chamber, which was flushed with synthetic air (obtained from mixing high-purity nitrogen and oxygen) at a rate of 250 m3 h−1 for several hours between each experiment. Leakages and air consumption by instruments leads to a dilution rate of typically s−1. Coupling to a separate plant chamber enabled the introduction of plant emissions into the main chamber (Hohaus et al., 2016).
2.2 NO3 reactivity measurements: FT-CRDS
The FT-CRDS instrument for directly measuring NO3 reactivity () has been described in detail (Liebmann et al., 2017) and only a brief summary is given here. NO3 radicals are generated by sequential oxidation of NO with O3 (Reactions R1 and R2) in a darkened, thermostated glass reactor at a pressure of 1.3 bar. The reactor surfaces are coated with Teflon (DuPont, FEPD 121) to reduce the loss of NO3 and N2O5 at the surface during the ∼ 5 min residence time. The gas mixture exiting the reactor (400 sccm) is heated to 140 ∘C before being mixed with either zero air or ambient air (at room temperature) and enters the FEP-coated flow tube where further NO3 production (Reaction R2), equilibrium reaction with N2O5 (Reactions R3 and R4), and NO3 loss via reactions with VOCs/NO (Reactions R5/R6) or with the reactor wall (Reaction R10) take place. NO3 surviving the flow reactor after a residence time of 10.5 s is quantified by CRDS at a wavelength of 662 nm. The NO3 reactivity is calculated from relative change in NO3 concentration when mixed with zero air or ambient air. In order to remove a potential bias by ambient NO3∕N2O5, sampled air is passed through an uncoated 2 L glass flask (∼ 60 s residence time) heated to 45 ∘C to favour N2O5 decomposition before reaching the flow tube. Ambient NO3 (or other radicals, e.g. RO2) is lost by its reaction with the glass walls. In addition to the reaction of interest (Reaction R5), Reactions (R2) to (R4) and (R10) affect the measured NO3 concentration so that corrections via numerical simulation of this set of reactions are necessary to extract from the measured change in NO3 concentration, necessitating accurate measurement of O3, NO and especially NO2 mixing ratios. For this reason, the experimental setup was equipped with a second cavity for the measurement of NO2 at 405 nm as described recently (Liebmann et al., 2018b). In its current state the instrument's detection limit is ∼ 0.005 s−1. By diluting highly reactive ambient air with synthetic air, ambient reactivities up to 45 s−1 can be measured. The overall uncertainty in results from instability of the NO3 source and the CRDS detection of NO3 and NO2 as well as uncertainty introduced by the numerical simulations. Under laboratory conditions, measurement errors result in an uncertainty of 16 %. The uncertainty associated with the numerical simulation was estimated by Liebmann et al. (2017), who used evaluated rate coefficients and associated uncertainties (IUPAC), to show that the uncertainty in is highly dependent on the ratio between the NO2 mixing ratio and the measured reactivity. If a reactivity of 0.046 s−1 (e.g. from 3 ppbv of isoprene) is measured at 5 ppbv of NO2 (typical for this campaign), the correction derived from the simulation would contribute an uncertainty of 32 % to the resulting overall uncertainty of 36 %. For an experiment with 25 ppbv of NO2 and 10 ppbv of isoprene, large uncertainties (>100 %) are associated with the correction procedure as the NO3 loss caused by reaction with NO2 exceeds VOC-induced losses. Later we show that data obtained even under unfavourable conditions (high NO2 mixing ratios) are in accord with isoprene measurements, which suggests that the recommended uncertainties in rate coefficients for Reactions (R3) and (R4) are overly conservative.
The sampled air was typically mixed with ∼ 50 pptv of NO3 radicals, and the reaction between NO3 and RO2 radicals generated in the flow tube (Reaction R5) represents a potential bias to the measurement of . In a typical experiment (e.g. 3 ppbv of isoprene), the reactivity of NO3 towards isoprene is 0.046 s−1. A simple calculation shows that a total of 20 pptv of RO2 radicals has been formed after 10.5 s reaction between NO3 and isoprene in the flow tube. Assuming a rate coefficient of cm3 molecule−1 s−1 for reaction between NO3 and RO2, we calculate a 5 % contribution of RO2 radicals to NO3 loss. In reality, this value represents a very conservative upper limit as RO2 is present at lower concentrations throughout most of the flow tube, and its concentration will be significantly reduced by losses to the reactor wall and self-reaction. In our further analysis we therefore do not consider this reaction.
2.3 VOC measurements: PTR-ToF-MS
During the NO3ISOP campaign, isoprene and other VOCs were measured by two different PTR-ToF-MS (proton transfer reaction time-of-flight mass spectrometer) instruments. The PTR-TOF1000 (IONICON Analytic GmbH) has a mass resolution >1500 m∕Δm and a limit of detection of <10 ppt for a 1 min integration time. The instrumental background was determined every hour by pulling the sample air through a heated tube (350 ∘C) filled with a Pt catalyst for 10 min. Data processing was done using PTRwid (Holzinger, 2015), and the quantification and calibration was done once per day, following the procedure as described recently (Holzinger et al., 2019).
The Vocus PTR (Tofwerk AG and Aerodyne Research Inc.) features a newly designed focusing ion–molecule reactor, resulting in a resolving power of 12 000 m∕Δm (Krechmer et al., 2018). Calibration was performed on an hourly basis for 5 min. The isoprene measurements of the two instruments agreed mostly within the uncertainties (14 %). An exemplary comparison between the two instruments of an isoprene measurement can be found in the Supplement (Fig. S1). For the evaluation of the experiment on the 2 August, only data from the PTR-TOF1000 were available. For all the other experiments of the campaign, isoprene and monoterpene mixing ratios were taken from the Vocus PTR, owing to its higher resolution and data coverage.
2.4 , and O3 measurements
The NO3∕N2O5 mixing ratios used for analysis are from a harmonized data set including the measurements from two CRDS instruments. Data availability, quality and consistency with the expected equilibrium ratios were criteria for selecting which data set to use for each experiment. Both instruments measure NO3 (and N2O5 after its thermal decomposition to NO3 in a heated channel) using cavity ring-down spectroscopy at a wavelength of ∼ 662 nm. The 5-channel device operated by the Max Planck Institute (MPI) additionally measured NO2 and has been described recently in detail (Sobanski et al., 2016a). Its NO3 channel has a limit of detection (LOD) of 1.5 pptv (total uncertainty of 25 %); the N2O5 channel has a LOD of 3.5 pptv (total uncertainty of 28 % for mixing ratios between 50 and 500 pptv). Air was subsampled from a bypass flow drawing ∼ 40 SLPM through a 4 m length of 0.5 in. (inner diameter, i.d.) PFA (perfluoroalkoxy alkane) tubing from the chamber. Variation of the bypass flow rate was used to assess losses of NO3 (<10 %) in transport to the instrument, for which correction was applied. Air entering the instrument was passed through a Teflon membrane filter (Pall Corp., 47 mm, 0.2 µm pore), which was changed every 60 min. Corrections for loss of NO3 and N2O5 on the filter and inlet lines were carried out as described previously (Sobanski et al., 2016a).
The second CRDS was built by the NOAA Chemical Sciences Laboratory (Dubé et al., 2006; Fuchs et al., 2008, 2012; Wagner et al., 2011; Dorn et al., 2013) and operated by the Institut de Combustion, Aérothermique, Réactivité et Environnement (ICARE). During the NO3ISOP campaign, the NOAA-CRDS was positioned beneath the chamber, and air was sampled through an individual port in the floor. The sampling flow rate was 5.5–7 L min−1 through a Teflon FEP line (i.d. 1.5 mm, total length about 0.9 m) extending by about 50 cm (i.d. 4 mm) with 25 cm (i.d. 4 mm) in the chamber. A Teflon filter (25 µm thickness, 47 mm diameter, 1–2 µm pore size) was placed downstream of the inlet to remove aerosol particles and changed automatically at an interval of 1.5–2 h, depending on the conditions of the experiments, such as the amount of aerosol in the chamber. The instrument was operated with a noise equivalent 1σ detection limit of 0.25 and 0.9 pptv in 1 s for the NO3 and N2O5 channels, respectively. The total uncertainties (1σ) of the NOAA-CRDS instrument were 25 % (NO3) and −8 %/+11 % (N2O5).
NO2 mixing ratios were taken from a harmonized data set combining the measurements of the 5-channel CRDS with that of the NO3 reactivity setup as well as the NOx measurement of a thermal dissociation CRDS setup (Thieser et al., 2016). The NOx measurement could be considered a NO2 measurement since during dark periods of the experiments NO would have been present at extremely low levels. The total uncertainty associated with the NO2 mixing ratios is 9 %.
NO was measured with a LOD of 4 pptv via chemiluminescence (CL; Ridley et al., 1992) detection (ECO Physics, model TR780), and ozone was quantified with a LOD of 1 ppbv by ultraviolet absorption spectroscopy at 254 nm (Ansyco, ozone analyser 41M). Both instruments operate with an accuracy (1σ) of 5 %.
2.5 Box model
The results of the chamber experiments were analysed using a box model based on the oxidation of isoprene by NO3, OH and O3 as incorporated in the Master Chemical Mechanism (MCM), version 3.3.1 (Saunders et al., 2003; Jenkin et al., 2015). In this work, the analysis focusses on the fate of the NO3 radical, so the oxidation of some minor products was omitted in order to reduce computation time. Moreover, the most recently recommended rate coefficient (IUPAC, 2020) for the reaction between NO3 and isoprene ( cm3 molecule−1 s−1) was used instead of the value found in the MCM v3.3.1, which is 6.8 % higher. Chamber-specific parameters such as temperature and pressure as well as the time of injection and amount of trace gases added (usually O3, NO2 and isoprene) were the only constraints to the model. The chamber dilution flow was implemented as first-order loss rates for all trace gases and wall loss rates for NO3 or N2O5 were introduced (see Sect. 3.2). The numerical simulations were performed with FACSIMILE/CHEKMAT (release H010, date 28 April 1987, version 1) at 1 min time resolution (Curtis and Sweetenham, 1987). The chemical scheme used is listed in the Supplement (Table S1).
An overview of the experimental conditions (e.g. isoprene, NO3, NO2 and O3 mixing ratios) on each day of the campaign is given in Fig. 1. The temperature in the chamber was typically between 20 and 30 ∘C but increased up to 40 ∘C when the chamber was opened to sunlight. The relative humidity was close to 0 % during most of the experiments before 14 August. After this date, the experiments focussed on secondary organic aerosol formation and humidified air was used.
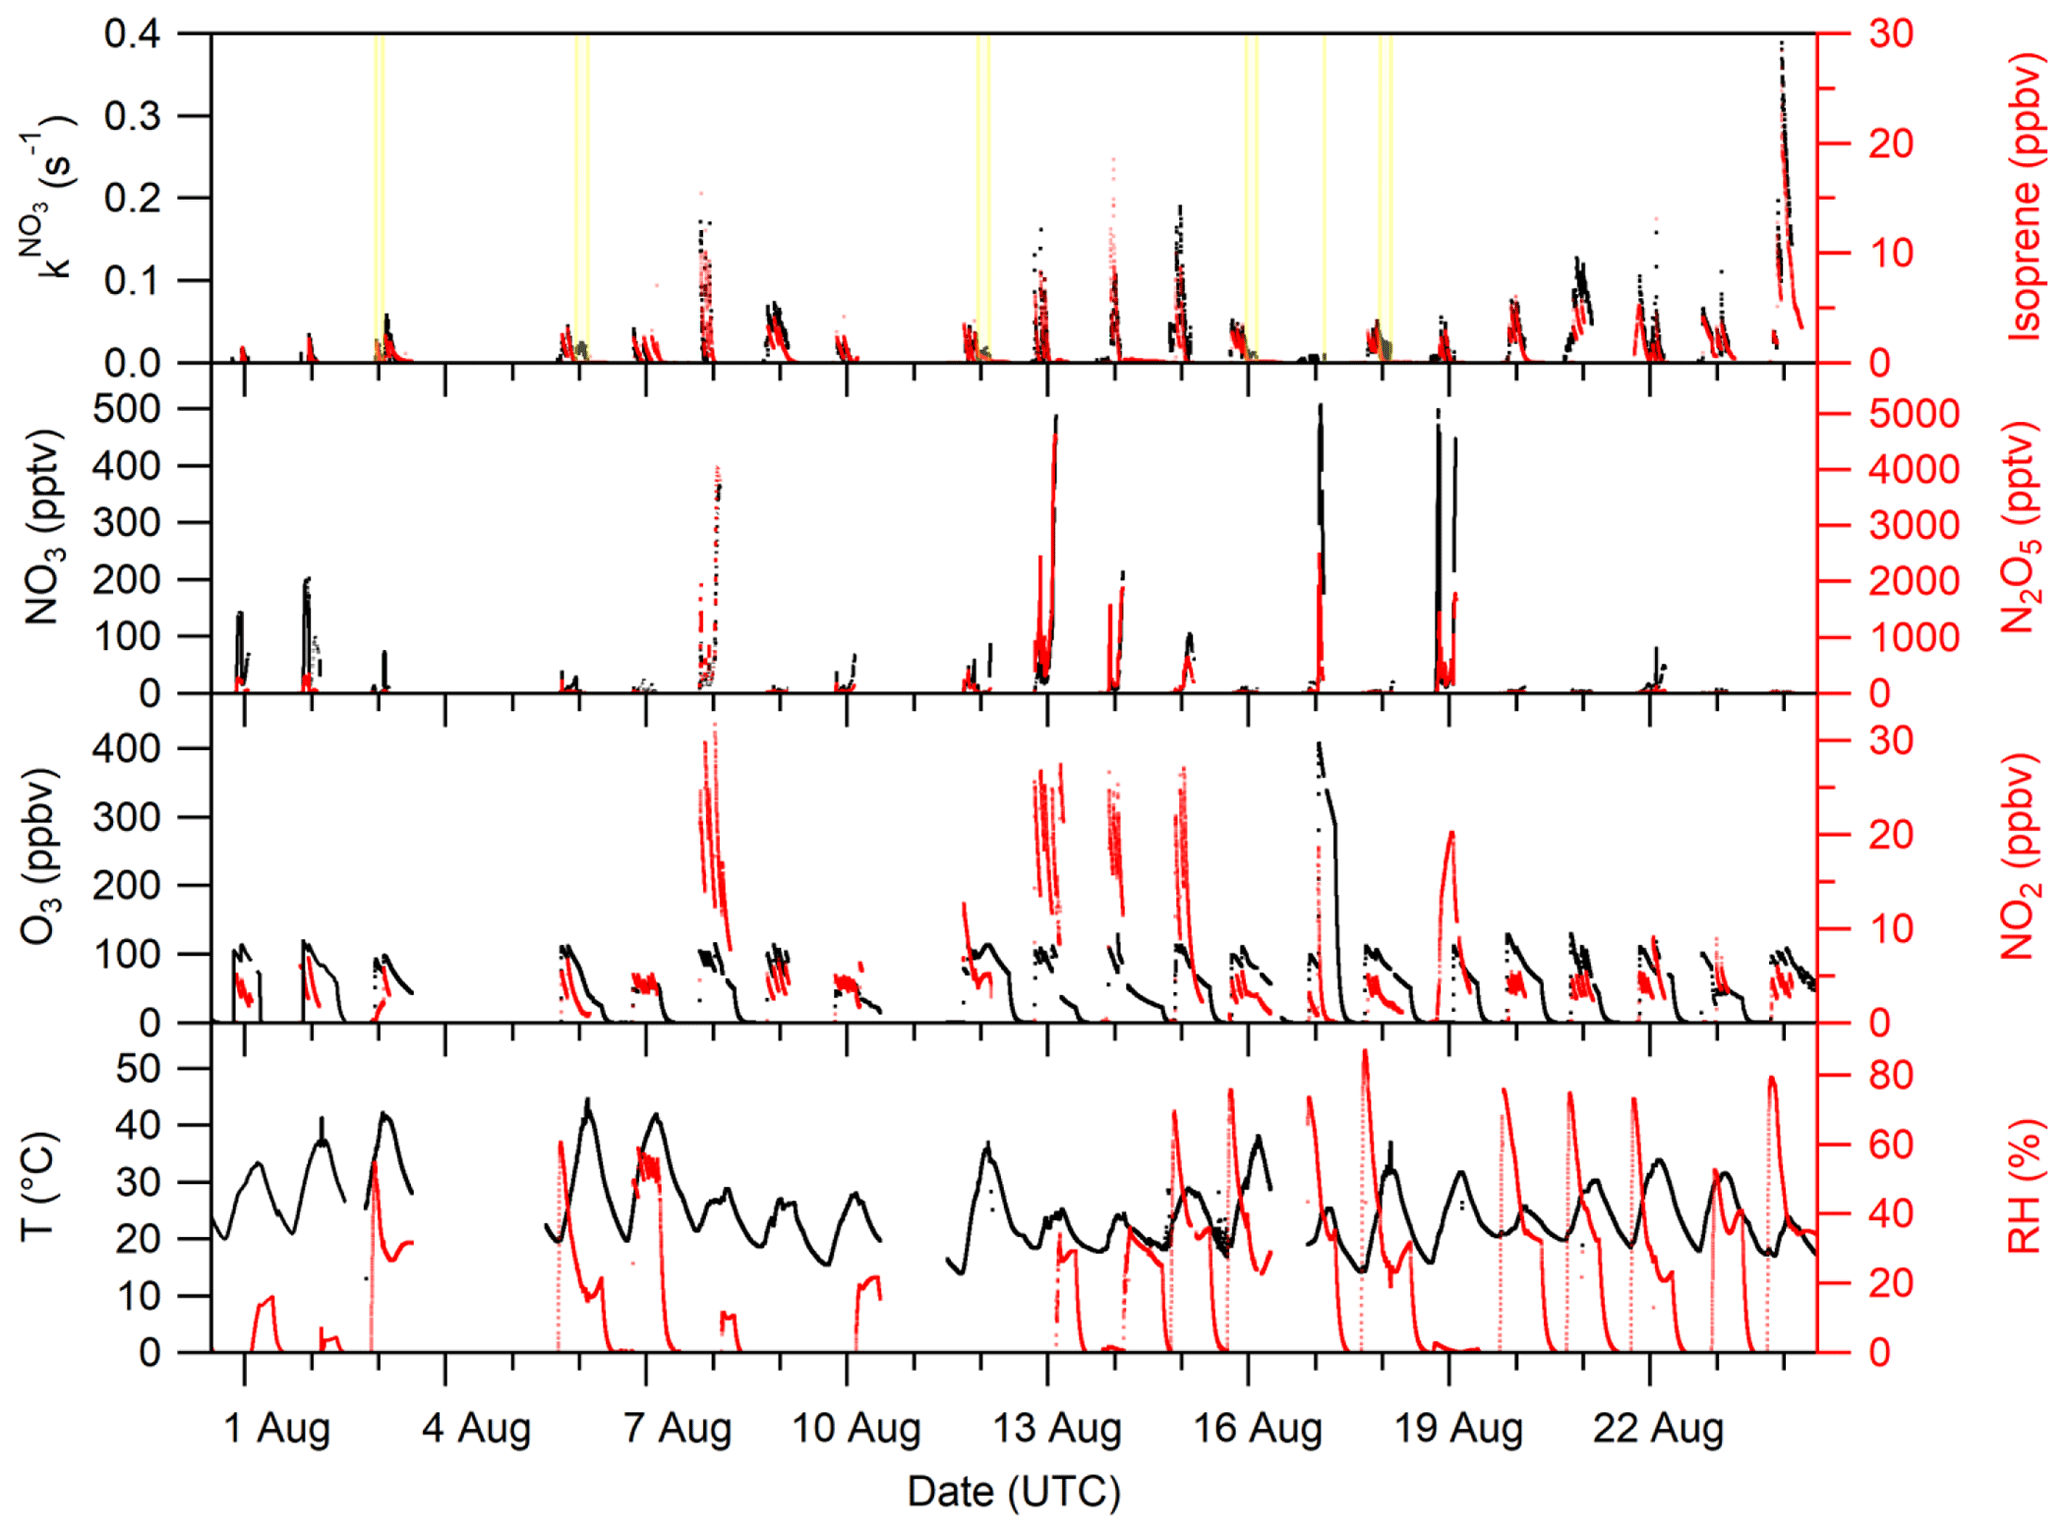
Figure 1Overview of the temperature (T); relative humidity (RH); VOC-induced NO3 reactivity (); and the O3, NO2, NO3, N2O5, and isoprene mixing ratios during the NO3ISOP campaign. The yellow shaded area in the upper panel represent phases of the experiment when the chamber roof was opened. The ticks mark 12:00 UTC of the corresponding day.
We divide the experiments into two broad categories according to the initial conditions: type 1 experiments were undertaken with NO3 production from 5 ppbv of NO2 and 100 ppbv of O3. The addition of isoprene with mixing ratios of ∼ 3 ppbv resulted in NO3 reactivities of around 0.05 s−1 at the time of injection. The NO3 and N2O5 mixing ratios were typically of the order of several tens of parts per trillion by volume (pptv) in the presence of isoprene under dry conditions. During humid experiments (with seed aerosol), NO3 mixing ratios were mostly below the LOD in the presence of isoprene, owing to increased uptake of NO3∕N2O5 on particles. An exceptionally large isoprene injection (∼ 20 ppbv) resulted in the maximum NO3 reactivity of 0.4 s−1 on the 24 August. In type 2 experiments, higher NO3 production rates were achieved by using 25 ppbv of NO2 and 100 ppbv of O3. In these experiments, with the goal of generating high concentrations of organic oxidation products, isoprene mixing ratios of 10 ppbv resulted in reactivities of ∼ 0.2 s−1 at the time of isoprene injection. Owing to high NO3 production rates, several hundred parts per trillion of NO3 and a few parts per billion of N2O5 were present in the chamber.
Figure 1 shows that once isoprene has been fully removed at the end of each experiment, the NO3 reactivity tends towards its LOD of 0.005 s−1, indicating that the evolution of the NO3 reactivity is closely linked to the changing isoprene mixing ratio.
3.1 Comparison of with calculated reactivity based on measurements of VOCs
The VOC contribution to the NO3 reactivity is the summed first-order loss rate coefficient attributed to all non-radical VOCs present in the chamber that can be transported to the FT-CRDS according to Eq. (1):
where ki is the rate coefficient (cm3 molecule−1 s−1) for the reaction between a VOC of concentration [VOC]i and NO3.
Reliable values of and VOC data are available from the 2 August onwards (see Table 1 for experimental conditions) and were used to compare FT-CRDS measurements of with Σki[VOC]i. For most of the experiments, isoprene was the only VOC initially present in the chamber, and at the beginning of the experiments should be given by k5[isoprene], with the latter measured by the PTR-MS instruments (see above). On the 9 and 21 August, both isoprene and propene (100 ppbv) were injected into the chamber; the summed NO3 reactivity from these trace gases was then k5[isoprene]+kpropene[propene], with cm3 molecule−1 s−1 at 298 K (IUPAC, 2020). As no propene data were available, the propene mixing ratios were assessed with the model (see above) based on injected amounts as well as subsequent loss by oxidation chemistry (mainly ozonolysis) and dilution. On the 22 August, coupling to a plant emission chamber permitted the introduction of monoterpenes and isoprene into the main chamber so that the NO3 reactivity was k5[isoprene]+kmonoterpenes[monoterpenes]. The uncertainty in Σki[VOC]i was propagated from the standard deviation of the isoprene and monoterpene mixing ratios and from the uncertainties of 41 % in k5, 58 % in kpropene (IUPAC, 2020) and 47 % in kmonoterpenes (average uncertainty of three dominant terpenes; see below).
Figure 2a depicts an exemplary time series of and Σki[VOC]i between the 9 and 13 August. The measured and values of Σki[VOC]i calculated from measured isoprene (and modelled propene in the case of the 9 August) are, within experimental uncertainty, equivalent, indicating that the NO3 reactivity can be attributed entirely to its reaction with isoprene (and other reactive trace gases like propene) injected into the chamber.
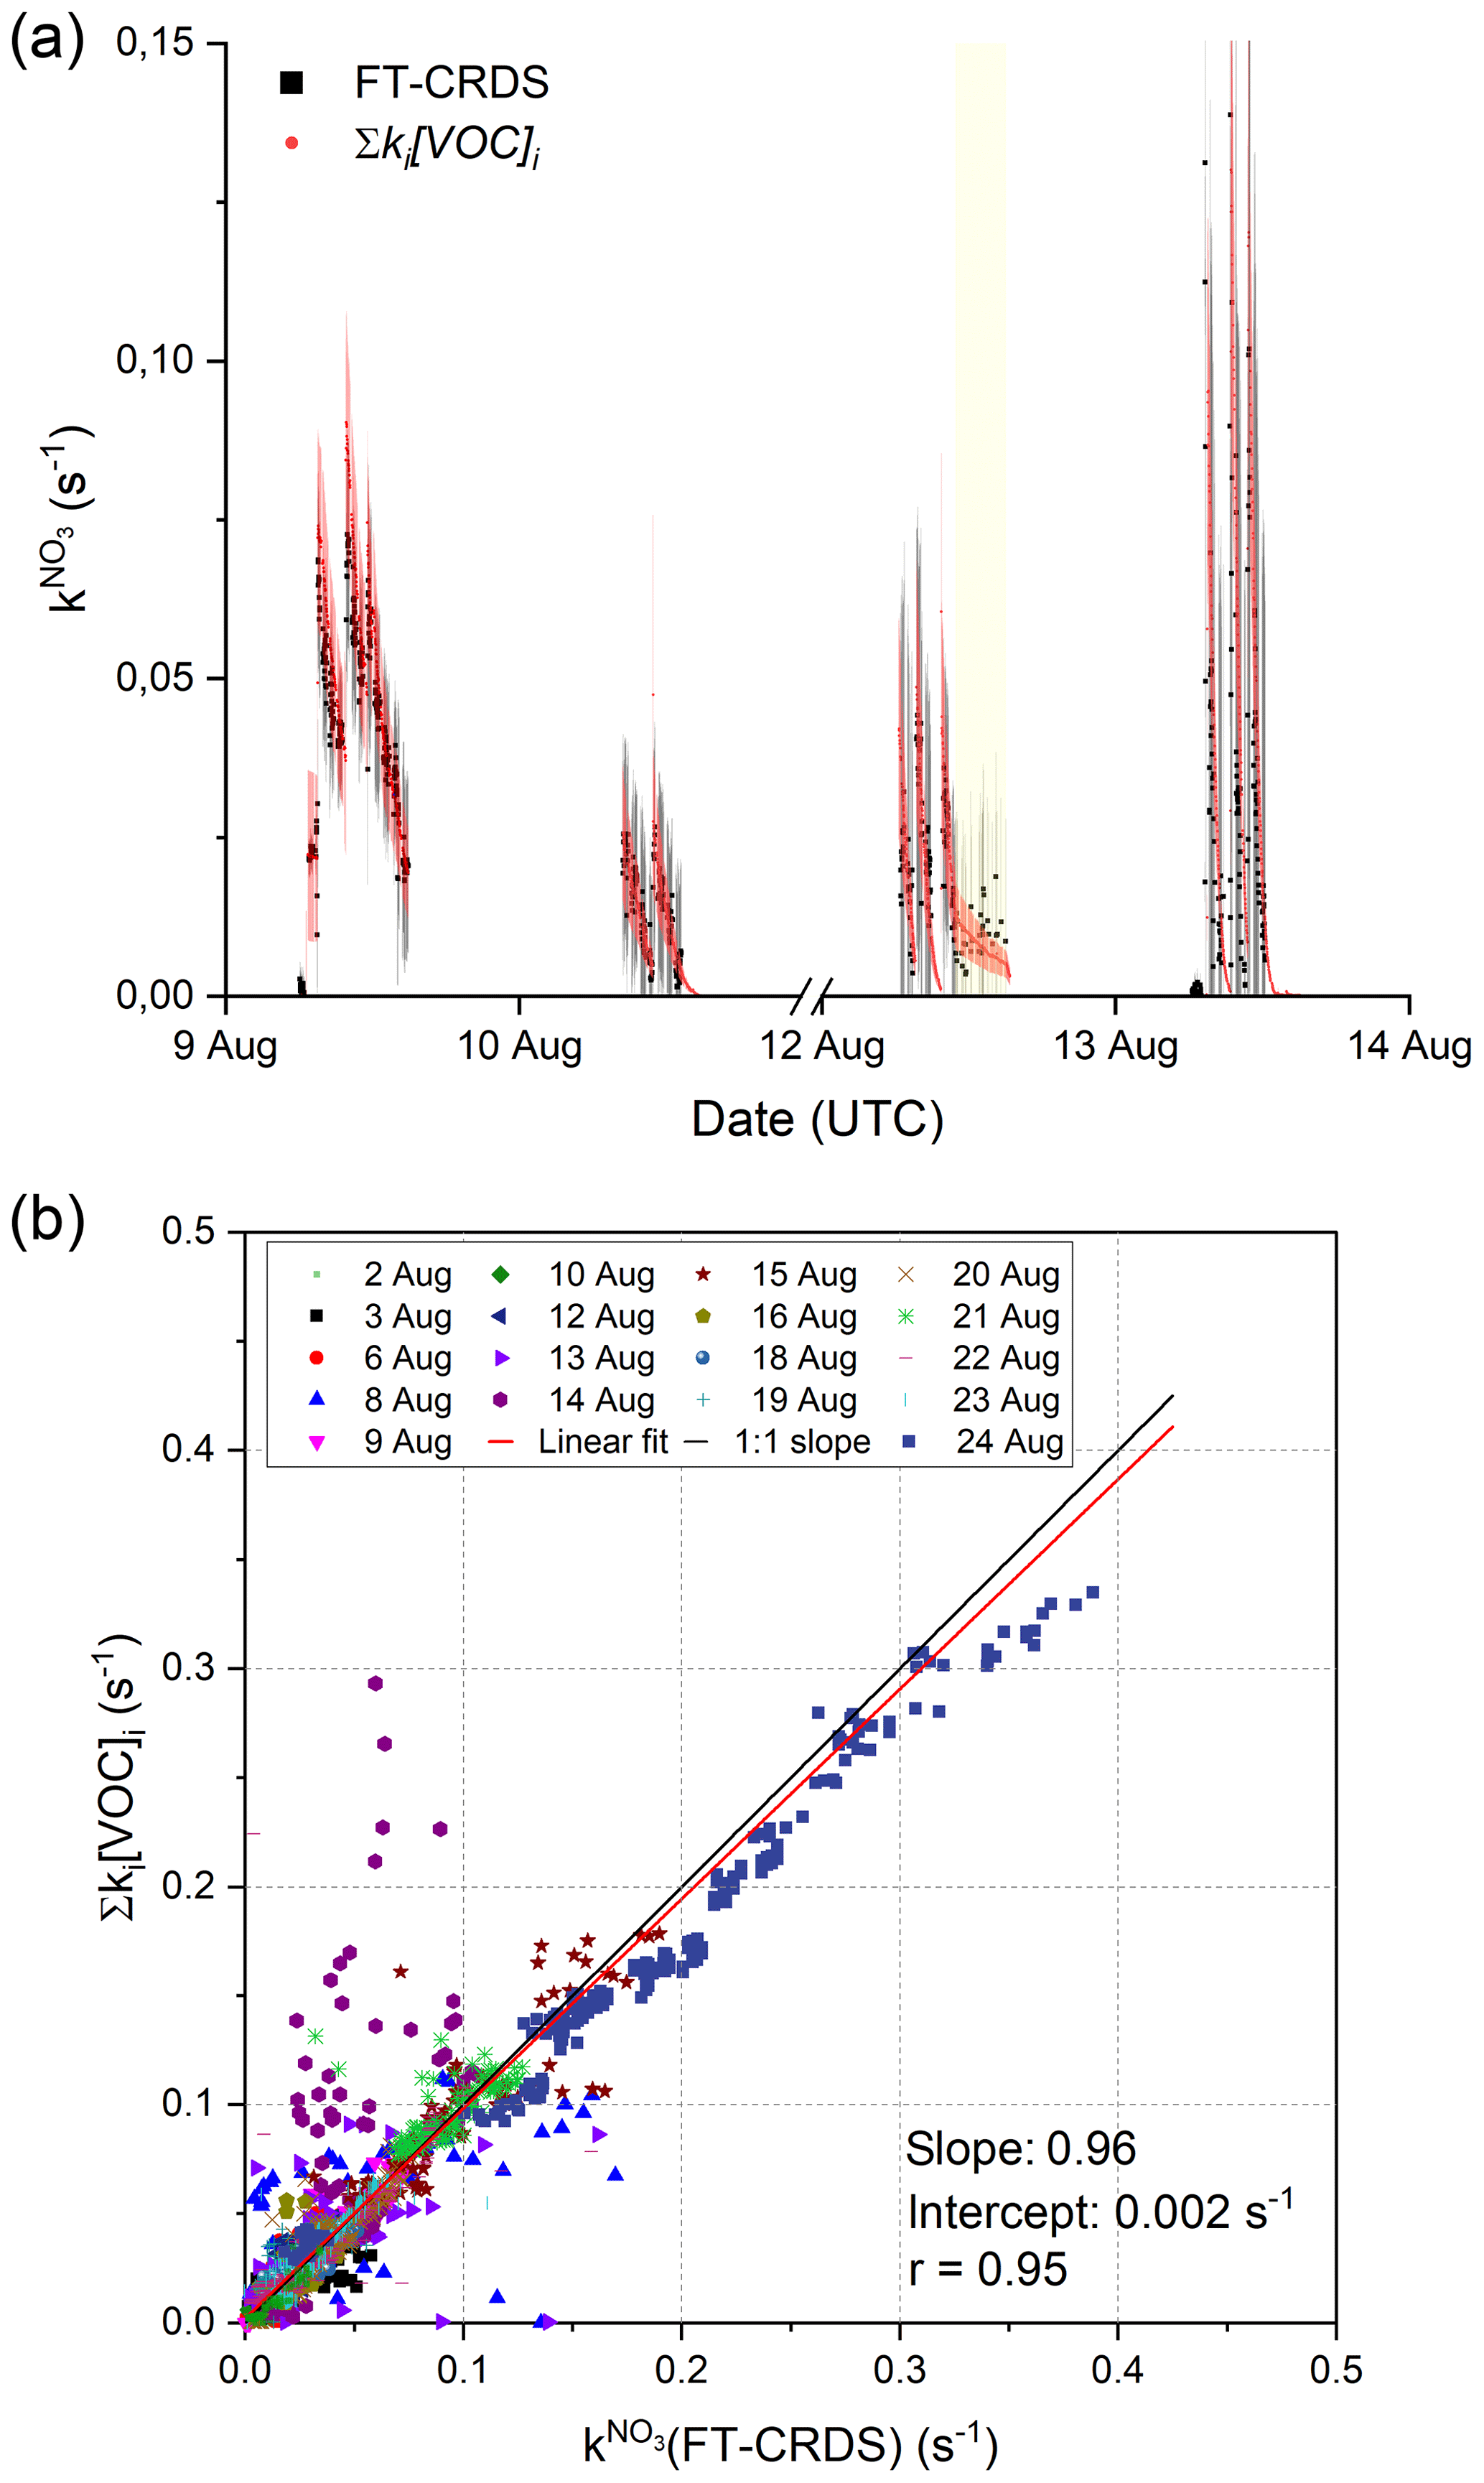
Figure 2(a) 4 d time series of and Σki[VOC]i. The total uncertainty in was calculated as described by Liebmann et al. (2017) and is indicated by the grey shaded area. The red shaded area shows the associated uncertainty of the calculated reactivities and are derived from error propagation using the standard deviation of the isoprene mixing ratios and an uncertainty of 41 % for the rate coefficient for reaction between NO3 and isoprene (IUPAC, 2020). The ticks mark 00:00 UTC of the corresponding date, and yellow shaded areas represent periods in which the chamber roof was opened. (b) Correlation between Σki[VOC]i and measurements. The red line represents a least-squares linear fit to the entire data set, while the black line illustrates an ideal slope of 1 : 1.
The correlation between and Σki[VOC]i for the entire campaign data set is illustrated in Fig. 2b. Type 2 experiments (high NO2 mixing ratios) were included despite the unfavourable conditions for measurement of , which result in large correction factors via numerical simulation (see above). The data points obtained on the 14 August display large variability, which is likely to have been caused by non-operation of the fans leading to poor mixing in the chamber. An unweighted linear regression of the whole data set yields a slope of 0.962±0.003, indicating excellent agreement between the directly measured NO3 and those calculated from Eq. (1). The intercept of (0.0023±0.0004) s−1 is below the LOD of the reactivity measurement. A correlation coefficient of 0.95 underlines the linearity of the whole data set despite increased scatter caused by the unfavourable conditions during type 2 experiments. Note that data from the 7 August (chamber contamination) were not used. On the 15 and 21 August, additional flushing of the chamber with synthetic air (150–300 m3) and humidification shortly before the actual beginning of the experiment resulted in a constant background reactivity in of 0.04 s−1 on the 15 August and 0.012 s−1 on the 21 August. High background reactivity was not observed during other humid experiments if the chamber was flushed extensively with synthetic air (∼ 2000 m3) during the night between experiments and if the additional flushing was omitted. The trace gas(es) causing this background reactivity could not be identified with the available measurements, but they are probably released from the chamber walls during flushing and humidification. In order to make a detailed comparison with the VOC data, the background reactivity, which was fairly constant, was simply added.
A more detailed examination of data from two type 1 experiments (low NO2) is given in Fig. 3. The grey shaded areas indicate the total uncertainty associated with the FT-CRDS measurement of (Liebmann et al., 2017); the scatter in the data stems mostly from the correction procedure via numerical simulation.

Figure 3Measured reactivity (, black data points) and reactivity calculated from Eq. (1) (red data points), which is equivalent to k5[isoprene]. The grey shaded area represents the total uncertainty in ; the red shaded areas represent the total uncertainty in k5[isoprene] and were estimated as explained in Fig. 2. (a) 20 August: type 1 experiment with initial mixing ratios of NO2=4.6 ppbv and O3=120 ppbv. (b) 23 August: only O3 (100 ppbv) and isoprene (4 ppbv) were initially present.
On the 20 August (Fig. 3a), in addition to NO2 and O3, (NH4)2SO4 seed aerosol (∼ 50 µg cm−3) and β-caryophyllene (∼ 2 ppbv) were injected at 08:40 UTC in order to favour formation of secondary organic aerosol. The instrument was zeroing until shortly after the injection of this terpene. As the lifetime of β-caryophyllene is extremely short in the chamber under the given conditions (∼ 150 s), only the small fraction of unreacted β-caryophyllene contributes to the signal observed after 08:40 UTC. At 09:20, 10:13 and 11:50 UTC isoprene was injected into the chamber, resulting in step-like increases in the measured NO3 reactivity. Each increase in reactivity and the ensuing evolution over time match well with the calculated values of k5[isoprene] (red data points). The red shaded area indicates the overall uncertainty in the latter. Clearly, within experimental uncertainty, the NO3 reactivity is driven almost entirely by reaction with isoprene, with negligible contribution from stable, secondary products.
During the experiment of the 23 August (Fig. 3b), only isoprene and ozone were present in the chamber for the first 4 h. Isoprene depletion is dominated by ozonolysis at this phase, whereas the sudden drop in is caused by an increased dilution flow during humidification of the chamber around 10:00 UTC. The absence of NO2 results in a more accurate, less scattered measurement of and underscores the reliability of the measurement under favourable conditions. All of the observed reactivity can be assigned to isoprene that was injected at 06:52 UTC. This implies that stable secondary oxidation of products from isoprene ozonolysis (such as formaldehyde, MACR (methacrolein), MVK) are insignificant for , which is consistent with the low rate coefficients (e.g. cm3 molecule−1 s−1 as highest of the three; IUPAC, 2020).
The results of a type 2 experiment with NO2 mixing ratios of ∼ 20 ppbv as well as higher isoprene mixing ratios (injections of ∼ 8 and ∼ 3 ppbv under dry conditions) are depicted in Fig. 4a. Despite the requirement of large correction factors to owing to the high NO2 to isoprene ratios, fair agreement between measured and the expected reactivity is observed for each of the isoprene injections at 07:30, 09:20 and 10:50 UTC. The agreement may indicate that the uncertainty in (grey shaded area), which is based on uncertainty in, for example, the rate coefficient for reaction between NO3 and NO2 (Liebmann et al., 2017), is overestimated.
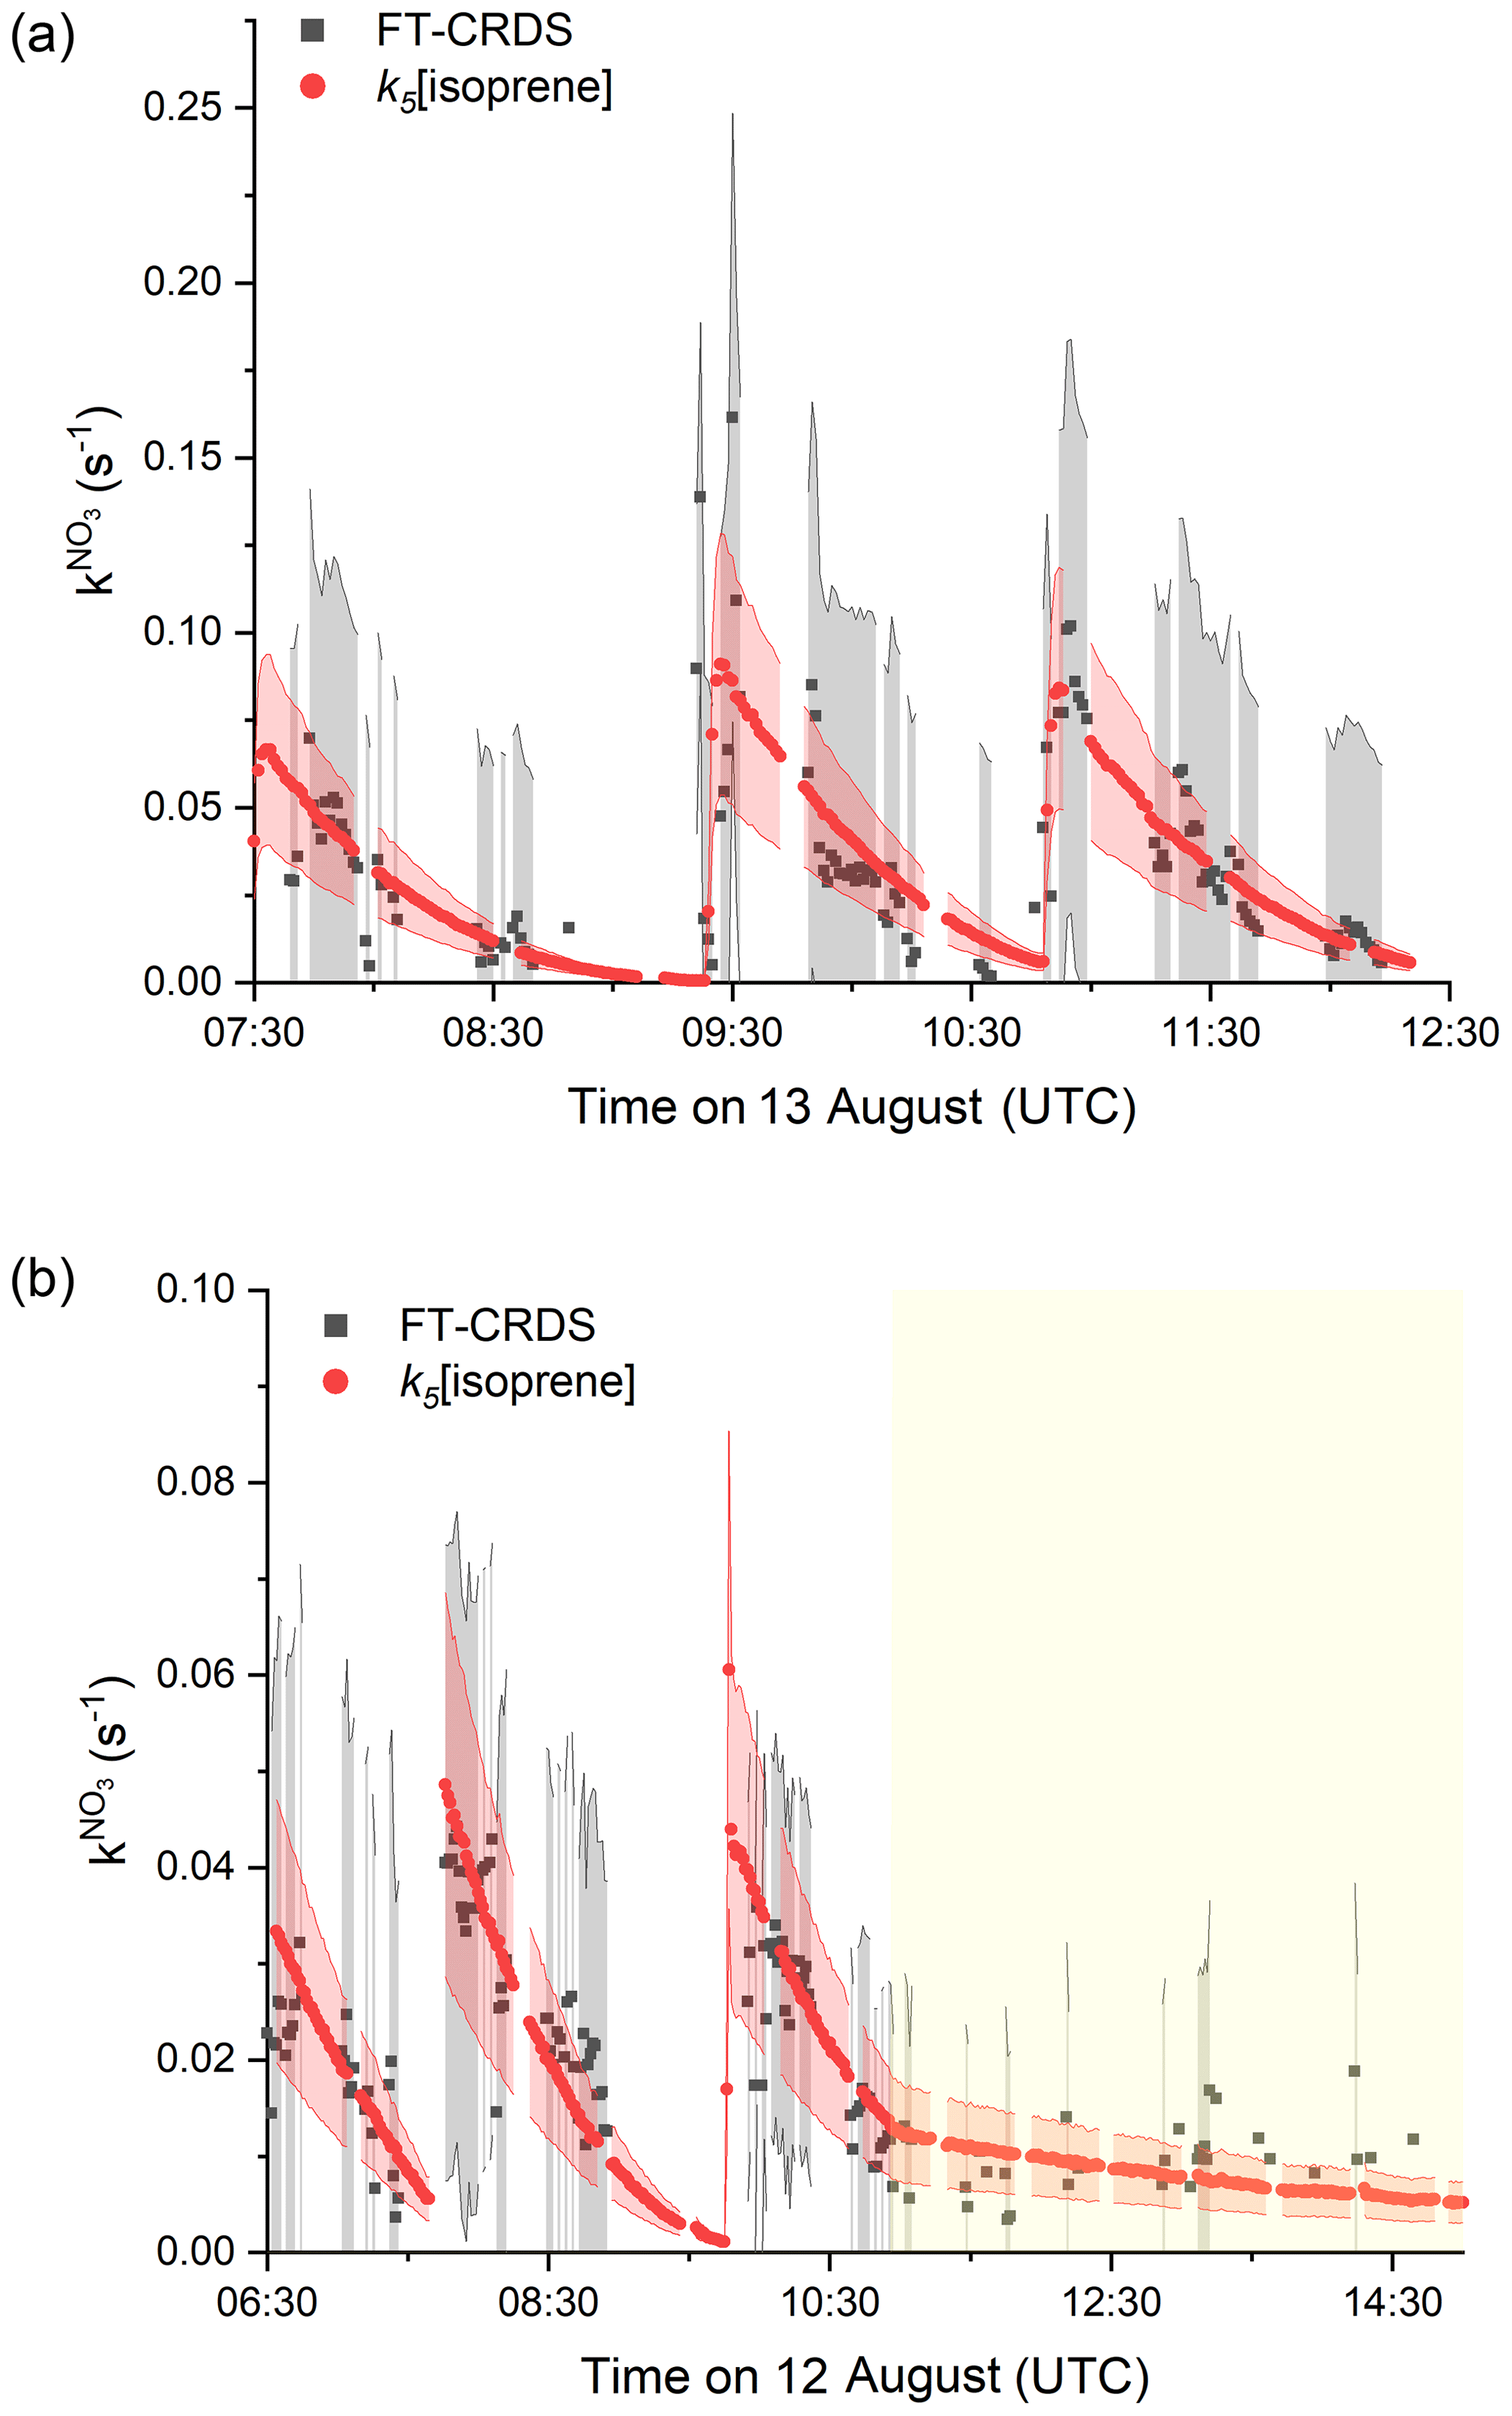
Figure 4Measured (black) and expected (red) NO3 reactivity using Eq. (1). The corresponding uncertainties were estimated as described in Fig. 2 and are indicated as shaded areas. (a) Type 2 experiment is from the 13 August under dry conditions with initial mixing ratios of NO2=25 ppbv and O3=104 ppbv. (b) Experiment from the 12 August is with NO2 mixing ratios between 7 and 12 ppbv and initial mixing ratio of O3=79 ppbv. The yellow shaded area denotes the period with the chamber roof opened after 11:00 UTC.
In Fig. 4b we display the results of an experiment on 12 August, in which the initially darkened chamber (first ∼ 4 h) was opened to sunlight (final 4 h). NO2 mixing ratios varied between 12 and 4 ppbv and isoprene was injected (∼ 3 ppbv) three times at 05:55, 07:40 and 09:45 UTC. During the dark phase, measured follows k5[isoprene]. At 11:00 UTC the chamber was opened to sunlight, during which approximately 5 ppbv of NO2, 200–150 pptv of NO and <1 ppbv of isoprene were present in the chamber. In this phase, the loss of NO3 was dominated by its photolysis and reaction with NO. Within experimental uncertainty, the measured daytime after correction for both NO2 and NO (correction factors between 0.05 and 0.02) during the sunlit period was still close to k5[isoprene].
On the 22 August, the SAPHIR chamber was filled with air from a plant chamber (SAPHIR-PLUS) containing six European oaks (Quercus robur) which emit predominantly isoprene but also monoterpenes, mainly limonene, 3-carene and α-pinene (van Meeningen et al., 2016).
The time series of measured NO3 reactivity (, black data points) after coupling to the plant chamber at 08:00 UTC is shown in Fig. 5. Data after 11:40 UTC are not considered, because the chamber lost its pressure after several recoupling attempts to the plant chamber. Also plotted (red data points) is the NO3 reactivity calculated from Σki[VOC]i, whereby both isoprene and the total terpene mixing ratio (up to 500 pptv) were measured by the Vocus PTR-MS. As only the mixing ratio of the sum of the monoterpenes was known, an average value of the very similar NO3 rate coefficients (IUPAC, 2020) for limonene, 3-carene and α-pinene was used for the calculation of Σki[VOC]i with cm3 molecule−1 s−1 (analogously averaged uncertainty of 47 %). Figure 5 indicates very good agreement between measured and calculated NO3 reactivity, with ∼ 70 % of the overall reactivity caused by isoprene, which is indicated by the purple shaded area. Despite being present at much lower mixing ratios that isoprene, the terpenes contribute ∼ 30 % to the overall NO3 reactivity, which reflects the large rate constants for reaction of NO3 with terpenes.
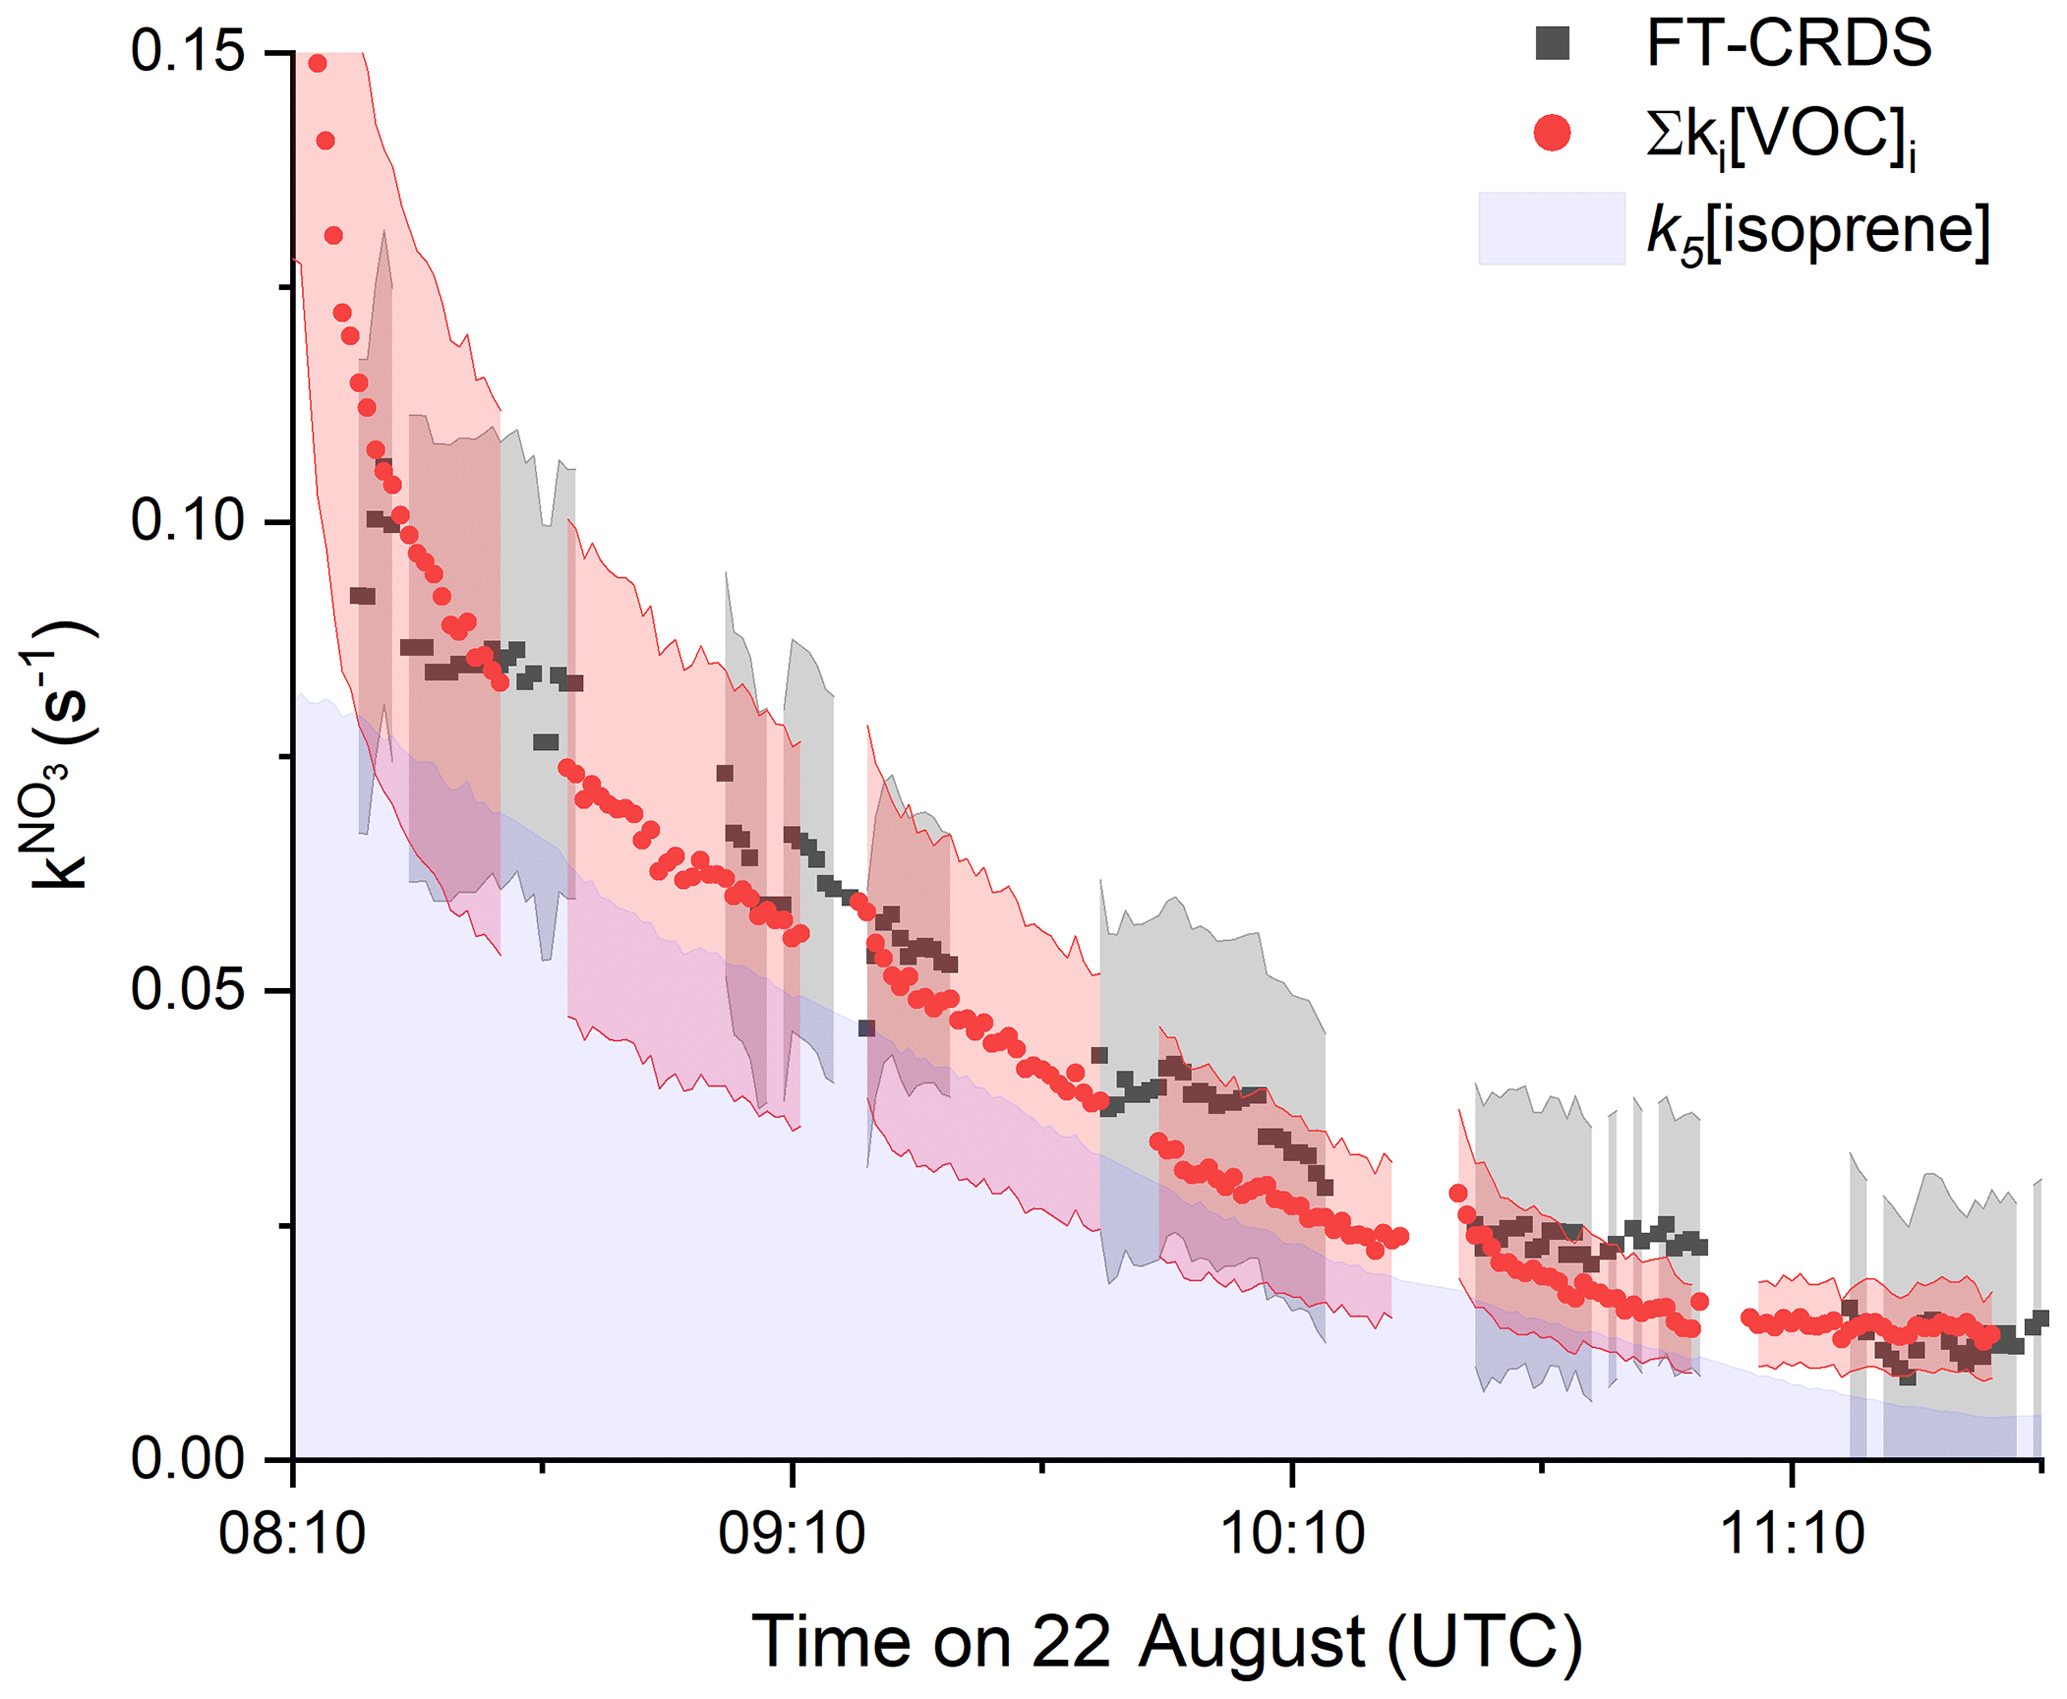
Figure 5Results from 22 August between 08:00 and 11:40 UTC. Comparison between (black data points, uncertainty as grey shaded area) and NO3 reactivity calculated from Σki[VOC]i (red data points) using the measured isoprene and Σmonoterpenes mixing ratios. The associated uncertainty (red area) was derived by error propagation by considering the standard deviations of the VOC mixing ratios as well as the uncertainties of the rate coefficients (41 % for k5 and 47 % for kmonoterpenes). The uncertainty of was estimated as explained in Fig. 2. The contribution of isoprene to the observed reactivity is indicated by the area in purple.
The experiments described above indicate that, for a chemical system initially containing only isoprene as the reactive organic trace gas, the measured values of can be fully assigned to the isoprene present in the chamber over the course of its degradation. During the NO3ISOP campaign, not only NO3 reactivity but also OH reactivity (kOH) was measured; the experimental technique is described briefly in the Supplement. A detailed analysis of the OH reactivity data set will be subject of a further publication, and in Fig. S1 we only compare values of and kOH obtained directly after isoprene injections, where kOH should not be significantly influenced by the reaction of OH with secondary products. As shown in Fig. S2, isoprene concentrations derived from both and kOH are generally in good agreement when [isoprene] <5 ppbv.
The oxidation of isoprene by NO3 in air results in the formation of stable (non-radical) products as well as organic peroxy radicals (RO2) that can also react with NO3. As radicals (e.g. NO3, RO2 and HO2) are not sampled by the FT-CRDS, the equivalence of and k5[isoprene] indicates that non-radical, secondary oxidation products do not contribute significantly to the NO3 reactivity.
3.2 Steady-state and model calculations: role of RO2 and chamber walls
The contribution of RO2, HO2 and stable products to NO3 reactivity was examined using a box model based on the chemical mechanistic oxidation processes of isoprene by NO3, OH and O3 as incorporated in the Master Chemical Mechanism, version 3.3.1 (Saunders et al., 2003; Jenkin et al., 2015; Khan et al., 2015). A numerical simulation (Fig. 6) of the evolution of NO3 reactivity was initialized using the experimental conditions of the first isoprene injection on 10 August (5.5 ppbv NO2, 60 ppbv O3 and 2 ppbv isoprene, dry air), including chamber-specific parameters such as temperature, the NO3 and N2O5 wall loss rates (quantified in detail below), and the dilution rate. In the model, NO3 reacts with both stable products and peroxy radicals. One of several major stable oxidation products according to MCM is an organic nitrate with aldehyde functionality (O2NOC4H6CHO, NC4CHO). As the corresponding rate coefficient for the reaction of this molecule with NO3 is not known, MCM uses a generic rate coefficient based on the IUPAC-recommended temperature-dependent expression for acetaldehyde + NO3 scaled with a factor of 4.25 to take differences in molecular structure into account. The maximum modelled mixing ratio of NC4CHO was ∼ 5 ppbv in type 2 experiments, which would result in a NO3 reactivity of 0.001 s−1. This value is below the instrument's LOD and would only become observable at extremely low isoprene concentrations. As apparent in Fig. 6, the contribution of stable oxidation products (blue) to the NO3 reactivity is insignificant compared to the primary oxidation of isoprene (red).

Figure 6Experimental results for and numerical simulation (MCM v3.3.1) of the NO3 reactivity following the first isoprene injection of the experiment on the 10 August. The simulation was run with 1 min resolution; initial conditions were 60 ppbv of O3, 5.5 ppbv of NO2 and 2 ppbv of isoprene and used actual chamber temperatures, which increased from 293 to 301 K during the course of the experiment. Wall losses of NO3 and N2O5 were parameterized as described in the text. Individual contributions to the NO3 reactivity of isoprene, peroxy radicals and secondary oxidation products are highlighted.
Since the rate coefficients for reaction of isoprene-derived peroxy radicals and NO3 are (unlike NO3+HO2) poorly constrained by experimental data, the MCM uses a generic value of cm3 molecule−1 s−1, which is based on the rate coefficient for the reaction between NO3 and C2H5O2. The modelled overall NO3 reactivity when reactions with RO2 and HO2 are included (black line) is on average 22 % higher than the reactivity associated only with isoprene, with the major contributors to the additional NO3 reactivity being nitrooxy isopropyl peroxy radicals (O2NOC5H8O2, NISOPOO) formed in the primary oxidation step. As neither RO2 nor HO2 radicals will survive the inlet tubing (and heated glass flask) between the SAPHIR chamber and the FT-CRDS instrument, our measurement of does not include their contribution. The measured values of (black data points) scatter around the isoprene-induced reactivity (red), which is understood to result from the minor role of stable (non-radical) oxidation products (blue) in removing NO3 and the exclusion of peroxy radicals in the measurement.
Another method of deriving NO3 reactivity is to calculate it from NO3 (and/or N2O5) mixing ratios and production rates under the assumption of steady state as has been carried out on several occasions for the analysis of ambient NO3 measurements (Heintz et al., 1996; Geyer and Platt, 2002; Brown et al., 2004; Sobanski et al., 2016b). In contrast to our direct measurement of , all loss processes (including reaction of NO3 with RO2 and HO2 and uptake of NO3 and N2O5 to surfaces) are assessed using the steady-state calculations. A comparison between and NO3 reactivity based on a steady-state analysis should enable us to extract the contribution of peroxy radicals and wall losses of NO3 in the SAPHIR chamber. In steady state, the NO3 reactivity () is derived from the ratio between the NO3 production rate via Reaction (R2) with rate coefficient k2 and the mixing ratios of O3, NO2 and NO3 (Eq. 2).
Acquiring steady state can take several hours if the NO3 lifetime is long, temperatures are low or NO2 mixing ratios are high (Brown et al., 2003). In the NO3ISOP experiments, the NO3 reactivities were generally high, and steady state is achieved within a few minutes of isoprene being injected into the chamber. However, NO2 reinjections in the chamber during periods of low reactivity at the end of an experiment when isoprene was already depleted can lead to a temporary breakdown of the steady-state assumption. In order to circumvent this potential source of error, the non-steady-state reactivities () based on NO3 and N2O5 measurements (McLaren et al., 2010) were calculated using Eq. (3).
This expression is similar to Eq. (2) except for the subtraction of the derivatives d[NO3]∕dt and d[N2O5]∕dt from the production term. A comparison of and is given in the Supplement and verifies the assumptions above: as soon as isoprene is injected into the system, and are equivalent (see Fig. S3a), but shows short-term deviations at NO2 reinjections (see Fig. S3b). As the non-steady-state reactivities are less affected by such events, the latter were used for the comparison with the measured NO3 reactivities. The steady-state and the non-steady-state calculations are only valid if equilibrium between NO3 and N2O5 is established. Moreover, the N2O5 measurements are usually less sensitive to instrument-specific losses under dry conditions. For this reason, measured NO3 mixing ratios were checked for consistency with the equilibrium to N2O5 using the equilibrium constant Keq for Reactions (R3)/(R4) as well as the measured N2O5 and NO2 mixing ratios as denoted in Eq. (4) for this analysis. In the case when a significant deviation was observed, NO3 mixing ratios from [NO2], [N2O5] and Keq were used.
A time series of measured and calculated is depicted in Fig. 7a, which shows the results from experiments in the absence of aerosol only. It is evident that is much higher than . In Fig. 7b we plot versus : an unweighted, orthogonal, linear fit has a slope of 0.54±0.01 and indicates that the measured values of are almost a factor of 2 lower than . Propagation of the uncertainties in k2 (15 %; IUPAC, 2020) and the NO3, NO2 and O3 mixing ratios (25 %, 9 % and 5 %, respectively) results in an overall uncertainty of 31 % for , which cannot account for its deviation to .
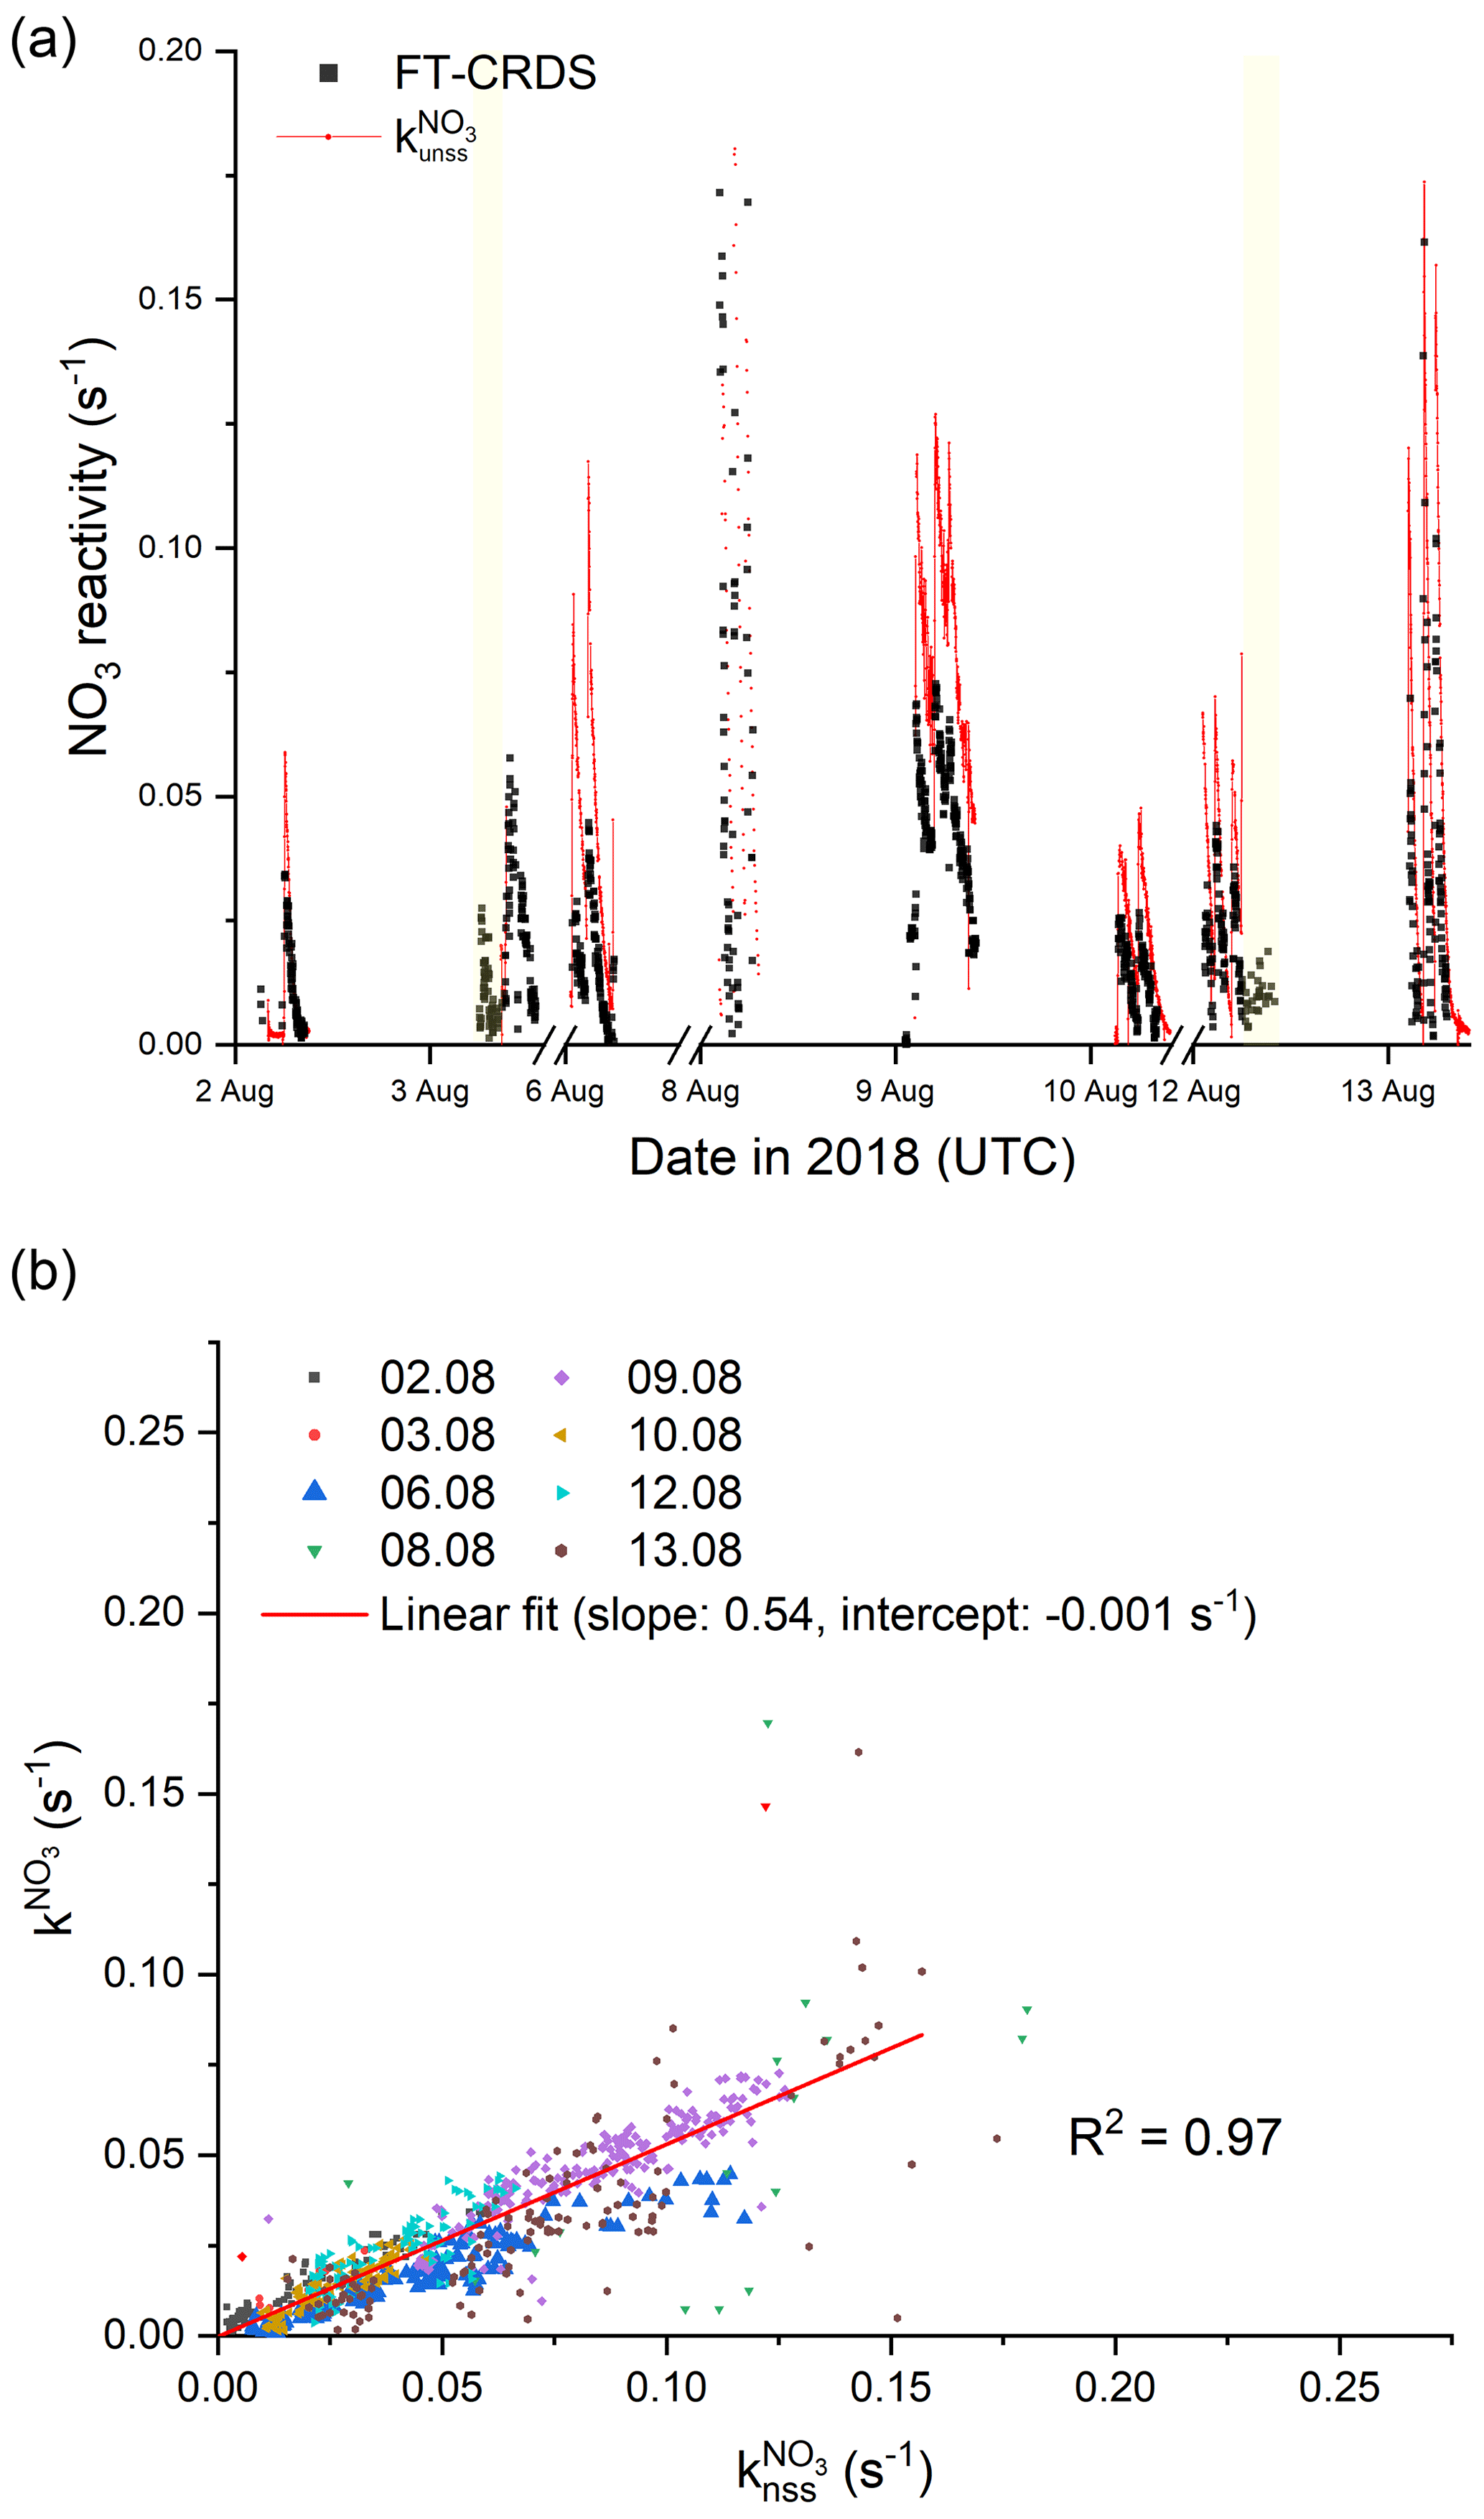
Figure 7(a) Overview of measured (black) and calculated NO3 reactivity with Eq. (3) (red). The ticks mark 00:00 UTC of the corresponding day. The yellow areas denote periods with an opened chamber roof. For the sake of clarity, the uncertainties are not included. (b) Correlation plot between and . The red line represents an unweighted, orthogonal linear regression (R2=0.97) of the complete data set.
The fact that is significantly larger than indicates that NO3 can be lost by reactions other than those with reactive, stable VOCs that can be sampled by the FT-CRDS instrument. As discussed above, RO2 represents the most likely candidate to account for some additional loss of NO3; the numerical simulations (MCM v3.3.1) predict an additional reactivity of the order of ∼ 22 % based on a generic value for . However, in order to bring and into agreement, either the RO2 level or the rate coefficient for reaction between NO3 and RO2 (especially NISOPOO) would have to be a factor of 2 larger than incorporated into the model (see below). Alternatively, losses of NO3 (and N2O5) to surfaces enhance but not . As no aerosol was present in the experiments analysed above, the only surface available is provided by the chamber walls.
In order to quantify the contribution of NO3 and N2O5 wall losses to , we analysed the experiments from the 1 and 2 August during isoprene-free periods, i.e. when no RO2 radicals are present and (in the absence of photolysis and NO) uptake of NO3 (or N2O5) to the chamber walls represents the only significant sink. Consequently, plotting from this period against Keq[NO2] enables separation of direct NO3 losses (Reaction R10) from indirect losses via N2O5 uptake (Reaction R9) and to derive first-order loss rates ( and ) of NO3 and N2O5 according to Eq. (5) (Allan et al., 2000; Brown et al., 2009b; Crowley et al., 2010; McLaren et al., 2010).
The results from the isoprene-free periods of experiments on the 1 and 2 August are shown in Fig. 8. A linear regression of the data yields a slope () of s−1 and an intercept () of (0.0016±0.0001) s−1, indicating that NO3 losses dominate and that heterogeneous removal of N2O5 does not contribute significantly to the overall loss rate constant of ∼ 0.002 s−1. The data reproducibility from one experiment to the next indicates that the NO3∕N2O5 wall loss rates are unchanged if the experimental conditions, i.e. dry air and no aerosols, are comparable. Humidification of the air, on the other hand, may facilitate heterogeneous reactions of NO3 or N2O5 with the chamber walls and increase corresponding loss rates. This might be an explanation for observation of a larger difference between and during an experiment under humid conditions on the 6 August (Fig. 7b, blue triangles). Lack of extensive isoprene-free periods on this day impede the extraction of wall loss rates with this approach: even after subtraction of from , Eq. (5) is not applicable in experiments once isoprene is present (and becomes the dominant sink of NO3) as reactions of RO2 indirectly co-determine the NO2 mixing ratios.
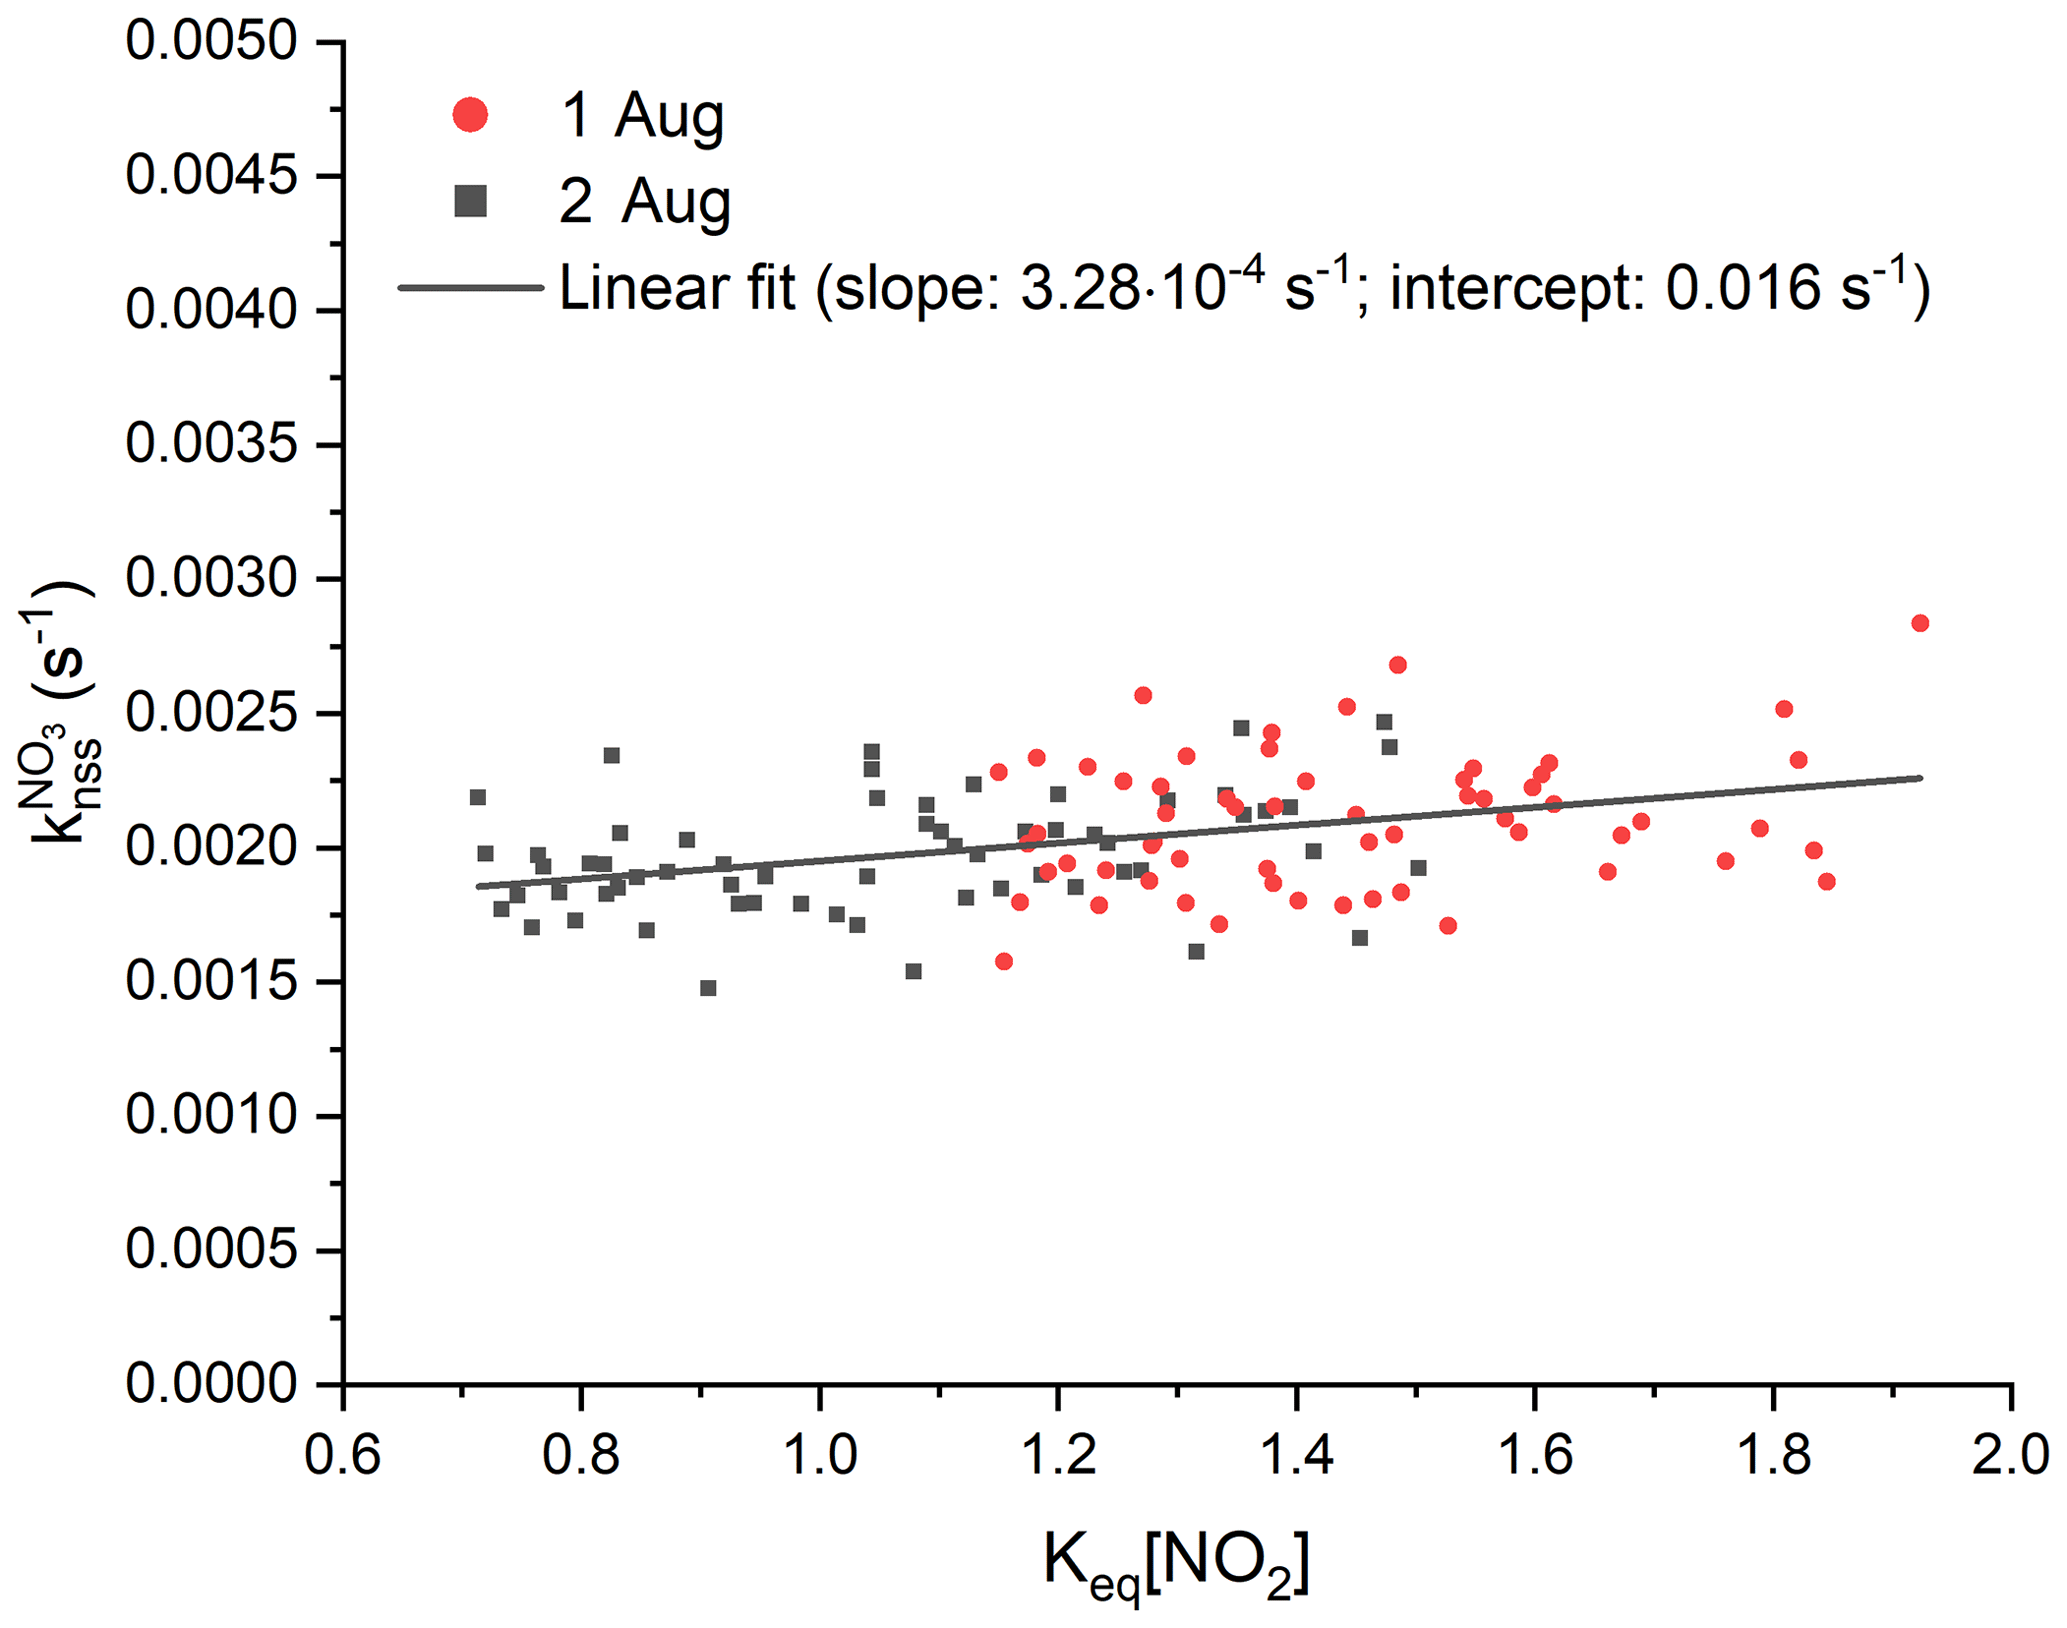
Figure 8Analysis of the contribution of wall losses of NO3 and N2O5 to NO3 reactivity, , are using experimental data during isoprene-free periods on the 1 August (red) and 2 August (black). Least-squares linear fit of the data is shown with a black line and yielded to an intercept of 0.016 s−1 and to a slope of s−1. For the sake of better clarity, error bars are not included.
For further analysis, the wall loss rate constants of NO3 and N2O5 were fixed as long as there was neither humidity nor particles in the chamber, and they are considered invariant with time after isoprene injections. This implicitly assumes that low-volatility oxidation products that deposit on chamber walls do not enhance the reactivity of the walls to NO3. As these products have less double bonds than isoprene and react only very slowly with NO3, this assumption would appear reasonable.
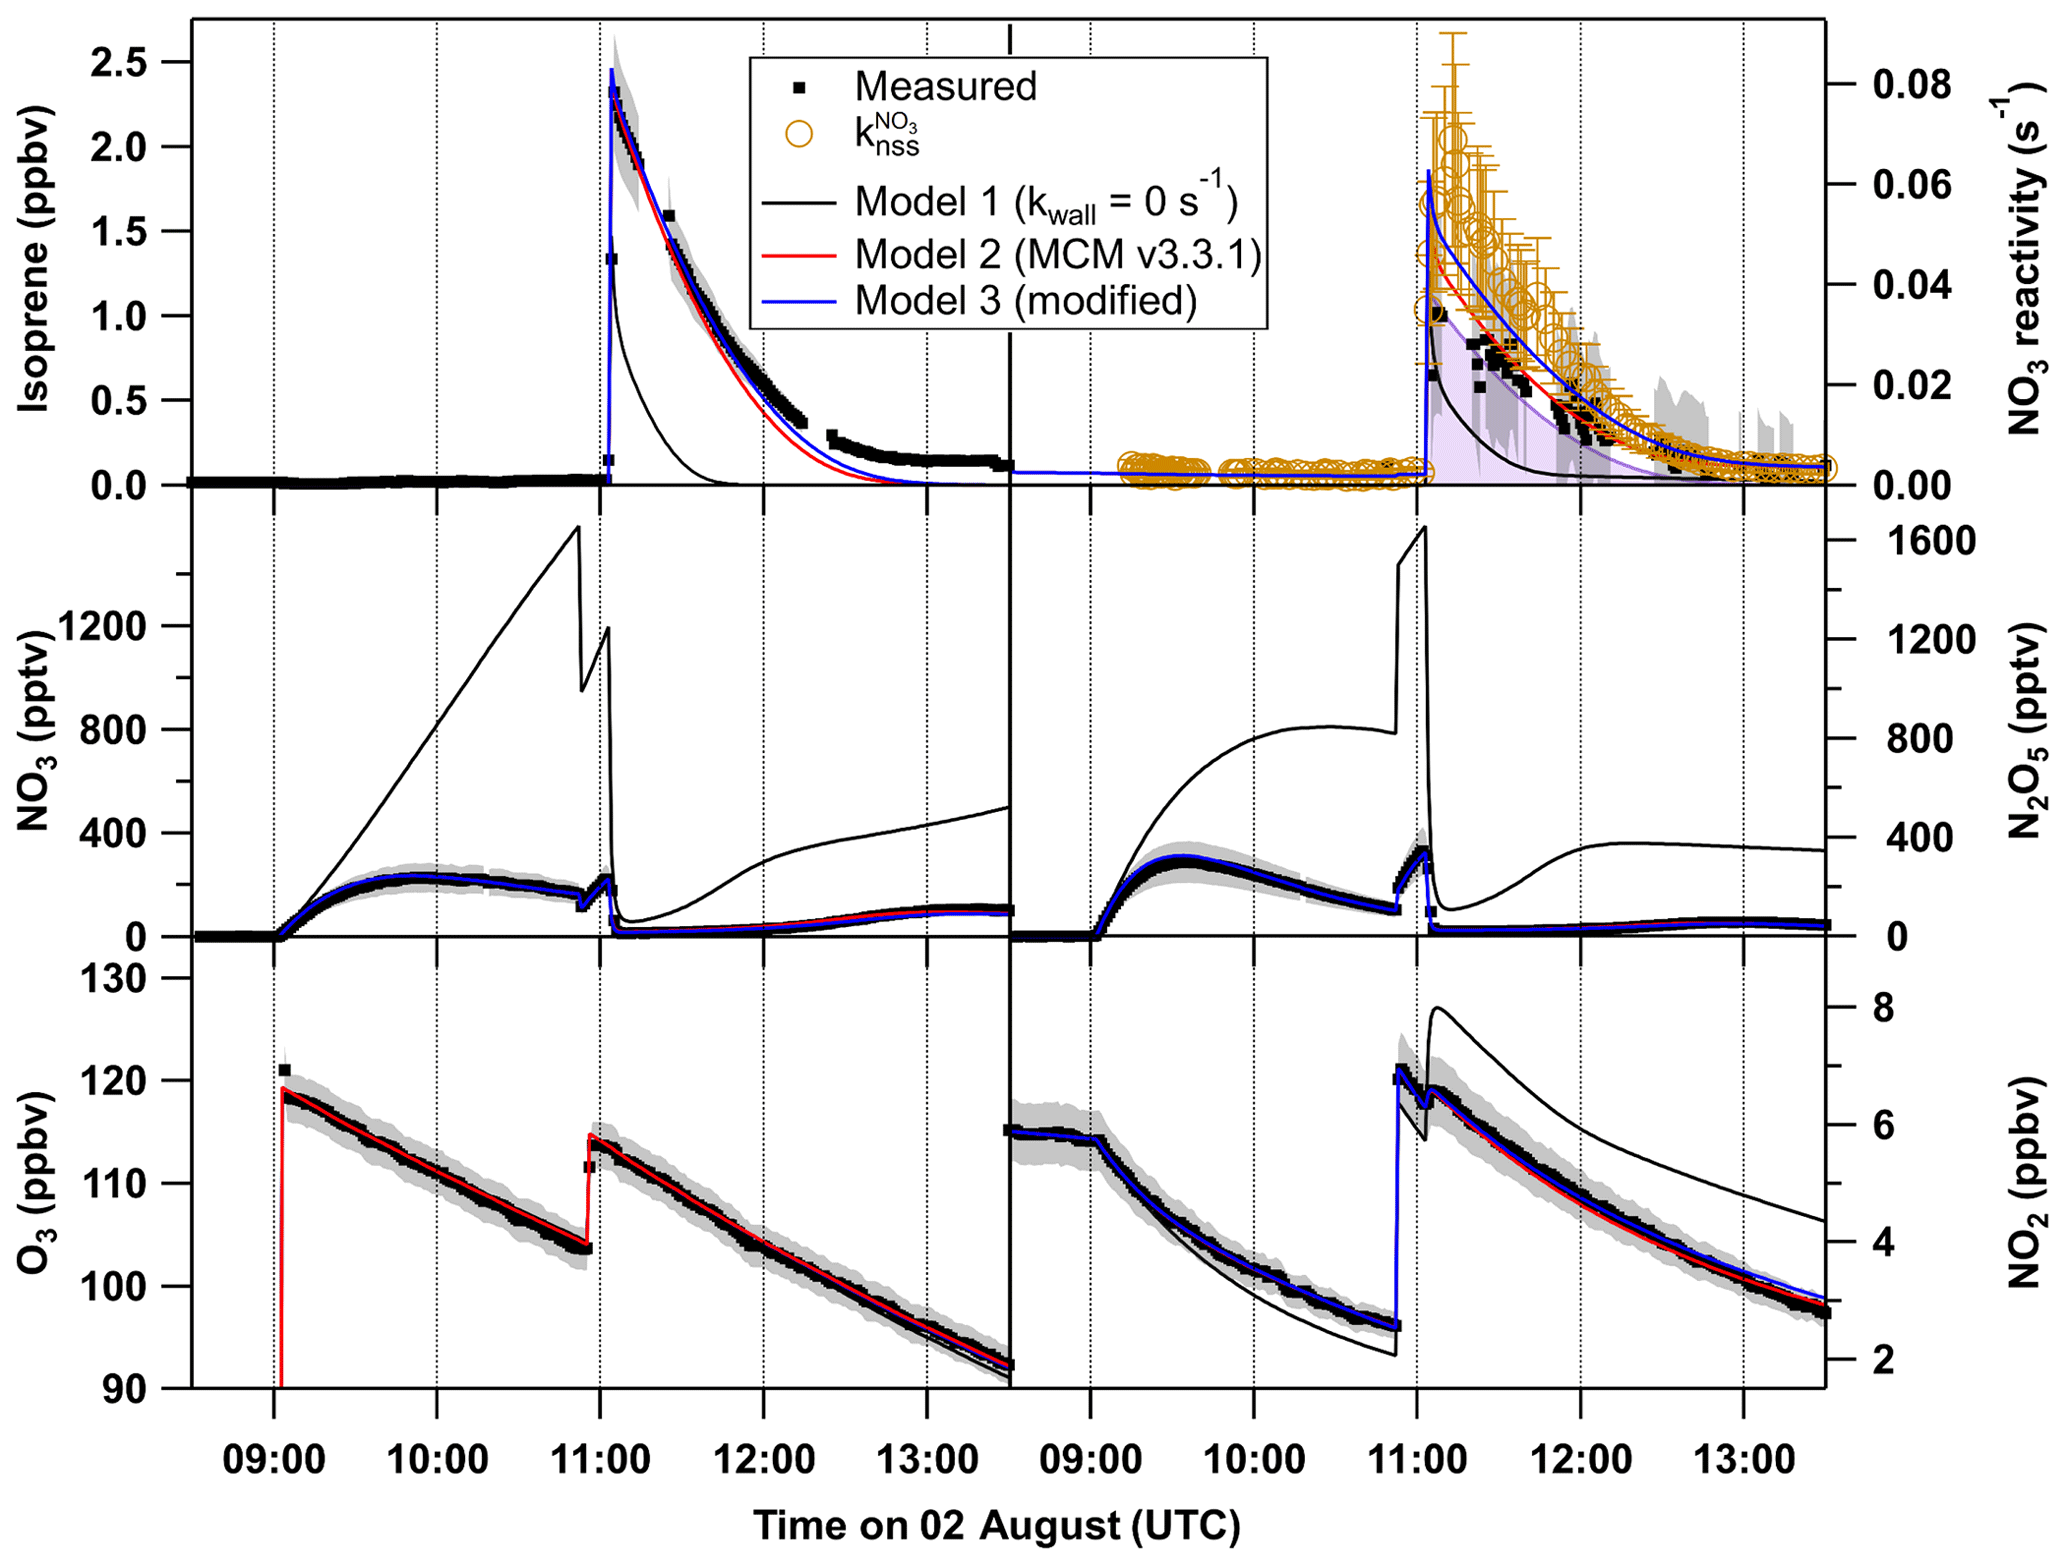
Figure 9O3, NO2, NO3, N2O5 and isoprene mixing ratios and NO3 reactivity on 2 August (black). The grey shaded area symbolizes the overall uncertainty associated with each measurement. Orange circles denote the reactivity obtained using Eq. (3). The results of the numerical simulation using MCM v.3.3.1 with NO3 and N2O5 wall loss rates set to 0 s−1 (model 1) are shown by black lines. The model output with introduction of NO3 and N2O5 wall loss rates of 0.016 s−1 and s−1, respectively, for each of the reactants is shown by a red line (model 2), whereas the blue line (model 3) shows the result of model 2 with the rate coefficient for reaction between NO3 and RO2 set to cm3 molecule−1 s−1, which is twice the value estimated by the MCM.
We examined the effect of introducing the NO3 and N2O5 wall loss rate constants calculated as described above into the chemical scheme used in the box model (MCM v3.3.1). The results from three different model outputs for the experiment on the 2 August are summarized in Fig. 9, which compares simulated and measured mixing ratios of NO3, N2O5, NO2, O3 and isoprene (following its addition at 11:00 UTC) as well as the measured and non-steady-state NO3 reactivities and . The omission of NO3∕N2O5 wall losses (model 1) results in simulated NO3 and N2O5 mixing ratios up to 1400 and 1600 pptv, respectively, during the isoprene-free period, which exceed measurements by factors of 4–8. This is because the only loss process for these species in this phase is the dilution rate that is 2 orders of magnitude lower than the estimated wall loss rates. Such high amounts of NO3∕N2O5 in the parts per billion range result in rapid depletion of nearly half of the total injected isoprene within the first minute, which is why model 1 cannot describe the measurements either before or after the injection. Model 2 (red lines) includes the estimated wall loss rates and reproduces the measurements more accurately: the NO2 and O3 mixing ratios are accurately simulated. Furthermore, NO3 and N2O5 mixing ratios that are only 10 % to 30 % higher than those measured and therefore NO3 reactivities lower than (orange circles) are predicted.
The evolution of the isoprene mixing ratio is reproduced by the model, which is why (mostly determined by k5[isoprene], purple area) is only slightly lower than the simulated overall reactivity by model 2. After quantification of NO3∕N2O5 wall losses, NO3+RO2 reactions remain the only source of additional NO3 reactivity to explain the difference between and . As already mentioned above, the model may underestimate the effect of RO2-induced losses of NO3 either because the RO2 mixing ratios are underestimated or because the rate coefficient is larger than assumed.
The result of a simulation (model 3) with set to cm3 molecule−1 s−1 (twice the generic value in MCM v3.3.1) is displayed as the blue lines in Fig. 9. The O3, NO2, N2O5 and isoprene mixing ratios are only slightly affected by this change in the reaction constant, whereas its impact on the NO3 mixing ratios as well as on the reactivity is very significant. The higher rate coefficient for reaction of NO3 with RO2 would be sufficient for the observed discrepancy between the overall reactivity and within the uncertainties associated with the analysis. Optimum agreement irrespective of uncertainties would be achieved with a value of cm3 molecule−1 s−1 for (i.e. a factor of 4 higher than in MCM), which is demonstrated in a comparable experiment under dry conditions on the 10 August (see Fig. S4 in the Supplement).
There are only few experimental studies on reactions of NO3 with RO2, and the rate coefficient for reaction of NO3 with isoprene-derived RO2 has never been measured. For the reaction between NO3 and the methyl peroxy radical (CH3O2), values between and cm3 molecule−1 s−1 have been reported (Crowley et al., 1990; Biggs et al., 1994; Daele et al., 1995; Helleis et al., 1996; Vaughan et al., 2006), with a preferred value of cm3 molecule−1 s−1 (Atkinson et al., 2006). Increasing the length of the C−C backbone in the peroxy radical appears to increase the rate coefficient, with values of cm3 molecule−1 s−1 preferred for reaction of NO3 with C2H5O2 (Atkinson et al., 2006), whereas the presence of electron-withdrawing groups attached to the peroxy carbon atom reduces the rate coefficient (Vaughan et al., 2006). A single study of the reaction between NO3 and an acylperoxy radical indicates that the rate coefficient ( cm3 molecule−1 s−1) may be larger than the MCM adopted value of cm3 molecule−1 s−1 (Canosa-Mas et al., 1996). Similarly, an indirect study (Hjorth et al., 1990) of the rate coefficient for the reaction between NO3 and a nitro-substituted C6 peroxy radical ((CH3)2C(ONO2)C(CH3)2O2) reports a value of cm3 molecule−1 s−1, which may be appropriate for longer-chain peroxy radicals derived from biogenic trace gases. In light of the large uncertainty associated with the kinetics of RO2+NO3 reactions, a rate coefficient of cm3 molecule−1 s−1 for reaction between NISOPOO and NO3 is certainly plausible.
We note, however, that use of a faster rate coefficient for the reaction between RO2 and NISOPOO, RO2 isomerization processes and differentiation between the fates of the main NISOPOO isomers as proposed by Schwantes et al. (2015) would result in lower RO2 mixing ratios. If in MCM v3.3.1 is set to a value of cm3 molecule−1 s−1 (average over all isomers, Schwantes et al., 2015), a slightly higher value of cm3 molecule−1 s−1 for would be necessary to bring modelled and measured NO3 reactivity into agreement within associated uncertainties. Conversely, increasing RO2 concentrations by the required factor of 2 would necessitate a significant reduction in the model rate coefficients for RO2+RO2 or RO2+HO2 reactions, which contradicts experimental results (Boyd et al., 2003; Schwantes et al., 2015) and is considered unlikely.
Differences in measurement of and modelled NO3 reactivity could also result from incorrectly modelled product yields, owing to the simplified mechanism used, which, for example, does not consider in detail the formation of methyl vinyl ketone (MVK) via β-NISOPOO isomers or the reaction between NO3 and other main products like hydroxy isopropyl nitrates (e.g. O2NOCH2C(CH3)CHCH2OH, ISOPCNO3) and nitrooxy isopropyl hydroperoxide (O2NOCH2C(CH3)CHCH2OOH, NISOPOOH). However, none of these products is expected to react sufficiently rapidly with NO3 to make a difference: the rate coefficient for reaction of NO3 with MVK is cm3 molecule−1 s−1 and that for 2-methyl-3-butene-2-ol (a comparable molecule to ISOPCNO3) is cm3 molecule−1 s−1 at 298 K (IUPAC, 2020). Even parts per billion amounts of these products would not cause significant additional NO3 reactivity.
On the other hand, the FT-CRDS will underestimate the reactivity of NO3 if products that are formed do not make it to the inlet (i.e. traces gases with high affinity for surfaces). One potential candidate for this category is NISOPOOH, formed in the reaction between NISOPOO and HO2. There are no kinetic data on the reaction of NO3 with NISOPOOH, though given the lack of reactivity of NO3 towards organic peroxides it is very unlikely that the rate coefficient would be larger than for . Analysis of one experiment (9 August, Fig. 7b), in which HO2 production (and thus the yield of NISOPOOH) was enhanced by the addition of propene and CO, shows that the difference between and on that day is comparable to those of the other experiments. This would also indicate that the influence of the potential non-detection of the hydroperoxide on the analysis should be low.
All in all, the results of the analysis above strongly suggest that the difference between directly measured and non-steady-state reactivity is caused by reactions of NO3 with RO2 with the results best explained when a rate coefficient of cm3 molecule−1 s−1 is used. Quantifying the impact of peroxy radicals on the fate of NO3, however, is challenging. The rate coefficients for RO2+NO3 are scarce and uncertain and the rate constants for self-reaction of RO2 derived from NO3 + isoprene have not been determined in direct kinetic measurement but via analyses of non-radical product yields.
Direct measurements of NO3 reactivity () in chamber experiments exploring the NO3-induced oxidation of isoprene showed excellent agreement with NO3 loss rate constants calculated from isoprene mixing ratios, thus underlining the reliability of the reactivity measurements even under unfavourable conditions with as much as 25 ppbv of NO2 in the chamber. The main contributor to the overall uncertainty in is the correction (via numerical simulation) for the reaction of NO3 with NO2 and the thermal decomposition of the N2O5 product. The results of the NO3ISOP campaign indicate that previously derived overall uncertainties (Liebmann et al., 2017) that considered an uncertainty of 10 % in the rate coefficients of both reactions (Burkholder et al., 2015) and an 8 % uncertainty for the NO2 mixing ratios are too large.
The measured reactivity, , could be completely assigned to the reaction between NO3 and isoprene, indicating that contributions from reactions of non-radical oxidation products are minor, which is consistent with predictions of the current version of the Master Chemical Mechanism.
Values of NO3 reactivity as calculated from NO3 and N2O5 mixing ratios and the NO3 production term were found to be a factor of ∼ 1.85 higher than the directly measured NO3 reactivities (). A box model analysis indicates that the most likely explanation is a larger fractional loss of NO3 via reactions with organic peroxy radicals (RO2) formed during the oxidation of isoprene. A rate coefficient ( cm3 molecule−1 s−1) is necessary to align model predictions (MCM v.3.3.1) and observations within associated uncertainties.
The data from the experiments in the SAPHIR chamber used in this work are available on the EUROCHAMP data home page (https://data.eurochamp.org/data-access/chamber-experiments/, EUROCHAMP, 2020).
The supplement related to this article is available online at: https://doi.org/10.5194/acp-20-10459-2020-supplement.
HF, AN and SSB designed and conducted the chamber experiments. PD, JML and JaS were responsible for the NO3 reactivity measurements. CC and AN were responsible for the OH reactivity measurements. JuS, JNC, FB, LZ, SSB and WM were responsible for the NO3 and N2O5 measurements and its evaluation. KX, RH, RT and DR were responsible for the PTR-MS measurements of VOCs. PD, NF, JML and JuS took and evaluated NO2 and NOx data. FR was responsible for O3 and NO measurements. PD did the analysis and, with the help of JNC, wrote the paper. JL, HF, SSB, AN, CC, JML, FB, RH, KX and RT contributed to the article.
The authors declare that they have no conflict of interest.
This article is part of the special issue “Simulation chambers as tools in atmospheric research (AMT/ACP/GMD inter-journal SI)”. It is not associated with a conference.
We thank Chemours for provision of the FEP sample used to coat the cavities and flow tube reactor of the NO3 reactivity setup.
This research has been supported by Horizon 2020 (EUROCHAMP-2020 (grant no. 730997) and SARLEP (grant no. 681529)) and French National Research Agency/Labex VOLTAIRE (grant no. ANR-10-LABX-100-01).
The article processing charges for this open-access
publication were covered by the Max Planck Society.
This paper was edited by Thomas Karl and reviewed by two anonymous referees.
Allan, B. J., McFiggans, G., Plane, J. M. C., Coe, H., and McFadyen, G. G.: The nitrate radical in the remote marine boundary layer, J. Geophys. Res.-Atmos., 105, 24191–24204, 2000.
Atkinson, R. and Arey, J.: Gas-phase tropospheric chemistry of biogenic volatile organic compounds: a review, Atmos. Environ., 37, S197–S219, 2003.
Atkinson, R., Baulch, D. L., Cox, R. A., Crowley, J. N., Hampson, R. F., Hynes, R. G., Jenkin, M. E., Rossi, M. J., Troe, J., and IUPAC Subcommittee: Evaluated kinetic and photochemical data for atmospheric chemistry: Volume II – gas phase reactions of organic species, Atmos. Chem. Phys., 6, 3625–4055, https://doi.org/10.5194/acp-6-3625-2006, 2006.
Biggs, P., Canosa-Mas, C. E., Fracheboud, J.-M., Shallcross, D. E., and Wayne, R. P.: Investigation into the kinetics and mechanism of the reaction of NO3 with CH3O2 at 298 K and 2.5 Torr: a potential source of OH in the night-time troposphere?, J. Chem. Soc., Faraday Trans., F90, 1205–1210, https://doi.org/10.1039/FT9949001205, 1994.
Bossmeyer, J., Brauers, T., Richter, C., Rohrer, F., Wegener, R., and Wahner, A.: Simulation chamber studies on the NO3 chemistry of atmospheric aldehydes, Geophys. Res. Lett., 33, L18810, https://doi.org/10.1029/2006GL026778, 2006.
Boyd, A. A., Flaud, P. M., Daugey, N., and Lesclaux, R.: Rate constants for RO2+HO2 reactions measured under a large excess of HO2, J. Phys. Chem. A, 107, 818–821, 2003.
Brown, S. S. and Stutz, J.: Nighttime radical observations and chemistry, Chem. Soc. Rev., 41, 6405–6447, 2012.
Brown, S. S., Stark, H., and Ravishankara, A. R.: Applicability of the steady state approximation to the interpretation of atmospheric observations of NO3 and N2O5, J. Geophys. Res.-Atmos., 108, 4539, https://doi.org/10.1029/2003JD003407, 2003.
Brown, S. S., Dibb, J. E., Stark, H., Aldener, M., Vozella, M., Whitlow, S., Williams, E. J., Lerner, B. M., Jakoubek, R., Middlebrook, A. M., DeGouw, J. A., Warneke, C., Goldan, P. D., Kuster, W. C., Angevine, W. M., Sueper, D. T., Quinn, P. K., Bates, T. S., Meagher, J. F., Fehsenfeld, F. C., and Ravishankara, A. R.: Nighttime removal of NOx in the summer marine boundary layer, Geophys. Res. Lett., 31, L07108, https://doi.org/10.1029/2004GL019412, 2004.
Brown, S. S., Ryerson, T. B., Wollny, A. G., Brock, C. A., Peltier, R., Sullivan, A. P., Weber, R. J., Dube, W. P., Trainer, M., Meagher, J. F., Fehsenfeld, F. C., and Ravishankara, A. R.: Variability in nocturnal nitrogen oxide processing and its role in regional air quality, Science, 311, 67–70, 2006.
Brown, S. S., deGouw, J. A., Warneke, C., Ryerson, T. B., Dubé, W. P., Atlas, E., Weber, R. J., Peltier, R. E., Neuman, J. A., Roberts, J. M., Swanson, A., Flocke, F., McKeen, S. A., Brioude, J., Sommariva, R., Trainer, M., Fehsenfeld, F. C., and Ravishankara, A. R.: Nocturnal isoprene oxidation over the Northeast United States in summer and its impact on reactive nitrogen partitioning and secondary organic aerosol, Atmos. Chem. Phys., 9, 3027–3042, https://doi.org/10.5194/acp-9-3027-2009, 2009a.
Brown, S. S., Dube, W. P., Fuchs, H., Ryerson, T. B., Wollny, A. G., Brock, C. A., Bahreini, R., Middlebrook, A. M., Neuman, J. A., Atlas, E., Roberts, J. M., Osthoff, H. D., Trainer, M., Fehsenfeld, F. C., and Ravishankara, A. R.: Reactive uptake coefficients for N2O5 determined from aircraft measurements during the Second Texas Air Quality Study: Comparison to current model parameterizations, J. Geophys. Res.-Atmos., 114, D00F10, https://doi.org/10.1029/2008JD011679, 2009b.
Burkholder, J. B., Sander, S. P., Abbatt, J., Barker, J. R., Huie, R. E., Kolb, C. E., Kurylo, M. J., Orkin, V. L., Wilmouth, D. M., and Wine, P. H.: Chemical Kinetics and Photochemical Data for Use in Atmospheric Studies, Evaluation No. 18, JPL Publication 15-10, Jet Propulsion Laboratory, Pasadena, available at: http://jpldataeval.jpl.nasa.gov (last access: 7 September 2020), 2015.
Canosa-Mas, C. E., King, M. D., Lopez, R., Percival, C. J., Wayne, R. P., Shallcross, D. E., Pyle, J. A., and Daele, V.: Is the reaction between CH3C(O)O2 and NO3 important in the night-time troposphere?, J. Chem. Soc., Faraday Trans., 92, 2211–2222, 1996.
Crowley, J. N., Burrows, J. P., Moortgat, G. K., Poulet, G., and LeBras, G.: Room temperature rate coefficient for the reaction between CH3O2 and NO3, Int. J. Chem. Kinet., 22, 673–681, 1990.
Crowley, J. N., Schuster, G., Pouvesle, N., Parchatka, U., Fischer, H., Bonn, B., Bingemer, H., and Lelieveld, J.: Nocturnal nitrogen oxides at a rural mountain-site in south-western Germany, Atmos. Chem. Phys., 10, 2795–2812, https://doi.org/10.5194/acp-10-2795-2010, 2010.
Crowley, J. N., Thieser, J., Tang, M. J., Schuster, G., Bozem, H., Beygi, Z. H., Fischer, H., Diesch, J.-M., Drewnick, F., Borrmann, S., Song, W., Yassaa, N., Williams, J., Pöhler, D., Platt, U., and Lelieveld, J.: Variable lifetimes and loss mechanisms for NO3 and N2O5 during the DOMINO campaign: contrasts between marine, urban and continental air, Atmos. Chem. Phys., 11, 10853–10870, https://doi.org/10.5194/acp-11-10853-2011, 2011.
Curtis, A. R. and Sweetenham, W. P.: Facsimile, Atomic Energy Research Establishment, Report R-12805, Harwell Laboratory, Oxfordshire, UK, 1987.
Daele, V., Laverdet, G., Lebras, G., and Poulet, G.: Kinetics of the reactions CH3O+NO, CH3O+NO3, and CH3O2+NO3, J. Phys. Chem., 99, 1470–1477, https://doi.org/10.1021/j100005a017, 1995.
Dorn, H.-P., Apodaca, R. L., Ball, S. M., Brauers, T., Brown, S. S., Crowley, J. N., Dubé, W. P., Fuchs, H., Häseler, R., Heitmann, U., Jones, R. L., Kiendler-Scharr, A., Labazan, I., Langridge, J. M., Meinen, J., Mentel, T. F., Platt, U., Pöhler, D., Rohrer, F., Ruth, A. A., Schlosser, E., Schuster, G., Shillings, A. J. L., Simpson, W. R., Thieser, J., Tillmann, R., Varma, R., Venables, D. S., and Wahner, A.: Intercomparison of NO3 radical detection instruments in the atmosphere simulation chamber SAPHIR, Atmos. Meas. Tech., 6, 1111–1140, https://doi.org/10.5194/amt-6-1111-2013, 2013.
Dubé, W. P., Brown, S. S., Osthoff, H. D., Nunley, M. R., Ciciora, S. J., Paris, M. W., McLaughlin, R. J., and Ravishankara, A. R.: Aircraft instrument for simultaneous, in situ measurement of NO3 and N2O5 via pulsed cavity ring-down spectroscopy, Rev. Sci. Instrum., 77, 034101, https://doi.org/10.1063/1.2176058, 2006.
Edwards, P. M., Aikin, K. C., Dube, W. P., Fry, J. L., Gilman, J. B., de Gouw, J. A., Graus, M. G., Hanisco, T. F., Holloway, J., Huber, G., Kaiser, J., Keutsch, F. N., Lerner, B. M., Neuman, J. A., Parrish, D. D., Peischl, J., Pollack, I. B., Ravishankara, A. R., Roberts, J. M., Ryerson, T. B., Trainer, M., Veres, P. R., Wolfe, G. M., Warneke, C., and Brown, S. S.: Transition from high- to low-NOx control of night-time oxidation in the southeastern US, Nat. Geosci., 10, 490–495, https://doi.org/10.1038/Ngeo2976, 2017.
EUROCHAMP: Database of Atmospheric Simulation Chamber Studies, available at: https://data.eurochamp.org/data-access/chamber-experiments/, last accesss: 8 September 2020.
Fry, J. L., Brown, S. S., Middlebrook, A. M., Edwards, P. M., Campuzano-Jost, P., Day, D. A., Jimenez, J. L., Allen, H. M., Ryerson, T. B., Pollack, I., Graus, M., Warneke, C., de Gouw, J. A., Brock, C. A., Gilman, J., Lerner, B. M., Dubé, W. P., Liao, J., and Welti, A.: Secondary organic aerosol (SOA) yields from NO3 radical + isoprene based on nighttime aircraft power plant plume transects, Atmos. Chem. Phys., 18, 11663–11682, https://doi.org/10.5194/acp-18-11663-2018, 2018.
Fuchs, H., Dube, W. P., Cicioira, S. J., and Brown, S. S.: Determination of inlet transmission and conversion efficiencies for in situ measurements of the nocturnal nitrogen oxides, NO3, N2O5 and NO2, via pulsed cavity ring-down spectroscopy, Anal. Chem., 80, 6010–6017, 2008.
Fuchs, H., Ball, S. M., Bohn, B., Brauers, T., Cohen, R. C., Dorn, H.-P., Dubé, W. P., Fry, J. L., Häseler, R., Heitmann, U., Jones, R. L., Kleffmann, J., Mentel, T. F., Müsgen, P., Rohrer, F., Rollins, A. W., Ruth, A. A., Kiendler-Scharr, A., Schlosser, E., Shillings, A. J. L., Tillmann, R., Varma, R. M., Venables, D. S., Villena Tapia, G., Wahner, A., Wegener, R., Wooldridge, P. J., and Brown, S. S.: Intercomparison of measurements of NO2 concentrations in the atmosphere simulation chamber SAPHIR during the NO3Comp campaign, Atmos. Meas. Tech., 3, 21–37, https://doi.org/10.5194/amt-3-21-2010, 2010.
Fuchs, H., Simpson, W. R., Apodaca, R. L., Brauers, T., Cohen, R. C., Crowley, J. N., Dorn, H.-P., Dubé, W. P., Fry, J. L., Häseler, R., Kajii, Y., Kiendler-Scharr, A., Labazan, I., Matsumoto, J., Mentel, T. F., Nakashima, Y., Rohrer, F., Rollins, A. W., Schuster, G., Tillmann, R., Wahner, A., Wooldridge, P. J., and Brown, S. S.: Comparison of N2O5 mixing ratios during NO3Comp 2007 in SAPHIR, Atmos. Meas. Tech., 5, 2763–2777, https://doi.org/10.5194/amt-5-2763-2012, 2012.
Geyer, A. and Platt, U.: Temperature dependence of the NO3 loss frequency: A new indicator for the contribution of NO3 to the oxidation of monoterpenes and NOx removal in the atmosphere, J. Geophys. Res.-Atmos., 107, 4431, https://doi.org/10.1029/2001JD001215, 2002.
Geyer, A., Alicke, B., Konrad, S., Schmitz, T., Stutz, J., and Platt, U.: Chemistry and oxidation capacity of the nitrate radical in the continental boundary layer near Berlin, J. Geophys. Res.-Atmos., 106, 8013–8025, 2001.
Guenther, A. B., Jiang, X., Heald, C. L., Sakulyanontvittaya, T., Duhl, T., Emmons, L. K., and Wang, X.: The Model of Emissions of Gases and Aerosols from Nature version 2.1 (MEGAN2.1): an extended and updated framework for modeling biogenic emissions, Geosci. Model Dev., 5, 1471–1492, https://doi.org/10.5194/gmd-5-1471-2012, 2012.
Heintz, F., Platt, U., Flentje, H., and Dubois, R.: Long-term observation of nitrate radicals at the tor station, Kap Arkona (Rugen), J. Geophys. Res.-Atmos., 101, 22891–22910, 1996.
Helleis, F., Moortgat, G. K., and Crowley, J. N.: Kinetic investigations of the reaction of CD3O2 with NO and NO3 at 298 K, J. Phys. Chem., 100, 17846–17854, 1996.
Hjorth, J., Lohse, C., Nielsen, C. J., Skov, H., and Restelli, G.: Products and Mechanisms of the Gas-Phase Reactions between NO3 and a Series of Alkenes, J. Phys. Chem., 94, 7494–7500, https://doi.org/10.1021/j100382a035, 1990.
Hohaus, T., Kuhn, U., Andres, S., Kaminski, M., Rohrer, F., Tillmann, R., Wahner, A., Wegener, R., Yu, Z., and Kiendler-Scharr, A.: A new plant chamber facility, PLUS, coupled to the atmosphere simulation chamber SAPHIR, Atmos. Meas. Tech., 9, 1247–1259, https://doi.org/10.5194/amt-9-1247-2016, 2016.
Holzinger, R.: PTRwid: A new widget tool for processing PTR-TOF-MS data, Atmos. Meas. Tech., 8, 3903–3922, https://doi.org/10.5194/amt-8-3903-2015, 2015.
Holzinger, R., Acton, W. J. F., Bloss, W. J., Breitenlechner, M., Crilley, L. R., Dusanter, S., Gonin, M., Gros, V., Keutsch, F. N., Kiendler-Scharr, A., Kramer, L. J., Krechmer, J. E., Languille, B., Locoge, N., Lopez-Hilfiker, F., Materić, D., Moreno, S., Nemitz, E., Quéléver, L. L. J., Sarda Esteve, R., Sauvage, S., Schallhart, S., Sommariva, R., Tillmann, R., Wedel, S., Worton, D. R., Xu, K., and Zaytsev, A.: Validity and limitations of simple reaction kinetics to calculate concentrations of organic compounds from ion counts in PTR-MS, Atmos. Meas. Tech., 12, 6193–6208, https://doi.org/10.5194/amt-12-6193-2019, 2019.
IUPAC: Task Group on Atmospheric Chemical Kinetic Data Eval-uation, edited by: Ammann, M., Cox, R. A., Crowley, J. N., Herrmann, H., Jenkin, M. E., McNeill, V. F., Mellouki, A., Rossi, M. J., Troe, J., and Wallington, T. J., available at: http://iupac.pole-ether.fr/index.html, last access: 7 September 2020.
Jenkin, M. E., Young, J. C., and Rickard, A. R.: The MCM v3.3.1 degradation scheme for isoprene, Atmos. Chem. Phys., 15, 11433–11459, https://doi.org/10.5194/acp-15-11433-2015, 2015.
Khan, M. A. H., Cooke, M. C., Utembe, S. R., Archibald, A. T., Derwent, R. G., Xiao, P., Percival, C. J., Jenkin, M. E., Morris, W. C., and Shallcross, D. E.: Global modeling of the nitrate radical (NO3) for present and pre-industrial scenarios, Atmos. Res., 164, 347–357, https://doi.org/10.1016/j.atmosres.2015.06.006, 2015.
Krechmer, J., Lopez-Hilfiker, F., Koss, A., Hutterli, M., Stoermer, C., Deming, B., Kimmel, J., Warneke, C., Holzinger, R., Jayne, J., Worsnop, D., Fuhrer, K., Gonin, M., and de Gouw, J.: Evaluation of a New Reagent-Ion Source and Focusing Ion-Molecule Reactor for Use in Proton-Transfer-Reaction Mass Spectrometry, Anal. Chem., 90, 12011–12018, https://doi.org/10.1021/acs.analchem.8b02641, 2018.
Lelieveld, J., Butler, T. M., Crowley, J. N., Dillon, T. J., Fischer, H., Ganzeveld, L., Harder, H., Lawrence, M. G., Martinez, M., Taraborrelli, D., and Williams, J.: Atmospheric oxidation capacity sustained by a tropical forest, Nature, 452, 737–740, 2008.
Lelieveld, J., Gromov, S., Pozzer, A., and Taraborrelli, D.: Global tropospheric hydroxyl distribution, budget and reactivity, Atmos. Chem. Phys., 16, 12477–12493, https://doi.org/10.5194/acp-16-12477-2016, 2016.
Liebmann, J. M., Schuster, G., Schuladen, J. B., Sobanski, N., Lelieveld, J., and Crowley, J. N.: Measurement of ambient NO3 reactivity: design, characterization and first deployment of a new instrument, Atmos. Meas. Tech., 10, 1241–1258, https://doi.org/10.5194/amt-10-1241-2017, 2017.
Liebmann, J., Karu, E., Sobanski, N., Schuladen, J., Ehn, M., Schallhart, S., Quéléver, L., Hellen, H., Hakola, H., Hoffmann, T., Williams, J., Fischer, H., Lelieveld, J., and Crowley, J. N.: Direct measurement of NO3 radical reactivity in a boreal forest, Atmos. Chem. Phys., 18, 3799–3815, https://doi.org/10.5194/acp-18-3799-2018, 2018a.
Liebmann, J. M., Muller, J. B. A., Kubistin, D., Claude, A., Holla, R., Plass-Dülmer, C., Lelieveld, J., and Crowley, J. N.: Direct measurements of NO3 reactivity in and above the boundary layer of a mountaintop site: identification of reactive trace gases and comparison with OH reactivity, Atmos. Chem. Phys., 18, 12045–12059, https://doi.org/10.5194/acp-18-12045-2018, 2018b.
Martinez, M., Perner, D., Hackenthal, E. M., Kulzer, S., and Schutz, L.: NO3 at Helgoland during the NORDEX campaign in October 1996, J. Geophys. Res.-Atmos., 105, 22685–22695, 2000.
McLaren, R., Wojtal, P., Majonis, D., McCourt, J., Halla, J. D., and Brook, J.: NO3 radical measurements in a polluted marine environment: links to ozone formation, Atmos. Chem. Phys., 10, 4187–4206, https://doi.org/10.5194/acp-10-4187-2010, 2010.
Mogensen, D., Gierens, R., Crowley, J. N., Keronen, P., Smolander, S., Sogachev, A., Nölscher, A. C., Zhou, L., Kulmala, M., Tang, M. J., Williams, J., and Boy, M.: Simulations of atmospheric OH, O3 and NO3 reactivities within and above the boreal forest, Atmos. Chem. Phys., 15, 3909–3932, https://doi.org/10.5194/acp-15-3909-2015, 2015.
Ng, N. L., Brown, S. S., Archibald, A. T., Atlas, E., Cohen, R. C., Crowley, J. N., Day, D. A., Donahue, N. M., Fry, J. L., Fuchs, H., Griffin, R. J., Guzman, M. I., Herrmann, H., Hodzic, A., Iinuma, Y., Jimenez, J. L., Kiendler-Scharr, A., Lee, B. H., Luecken, D. J., Mao, J., McLaren, R., Mutzel, A., Osthoff, H. D., Ouyang, B., Picquet-Varrault, B., Platt, U., Pye, H. O. T., Rudich, Y., Schwantes, R. H., Shiraiwa, M., Stutz, J., Thornton, J. A., Tilgner, A., Williams, B. J., and Zaveri, R. A.: Nitrate radicals and biogenic volatile organic compounds: oxidation, mechanisms, and organic aerosol, Atmos. Chem. Phys., 17, 2103–2162, https://doi.org/10.5194/acp-17-2103-2017, 2017.
Paulot, F., Henze, D. K., and Wennberg, P. O.: Impact of the isoprene photochemical cascade on tropical ozone, Atmos. Chem. Phys., 12, 1307–1325, https://doi.org/10.5194/acp-12-1307-2012, 2012.
Phillips, G. J., Thieser, J., Tang, M., Sobanski, N., Schuster, G., Fachinger, J., Drewnick, F., Borrmann, S., Bingemer, H., Lelieveld, J., and Crowley, J. N.: Estimating N2O5 uptake coefficients using ambient measurements of NO3, N2O5, ClNO2 and particle-phase nitrate, Atmos. Chem. Phys., 16, 13231–13249, https://doi.org/10.5194/acp-16-13231-2016, 2016.
Ridley, B. A., Grahek, F. E., and Walega, J. G.: A small, high-sensitivity, medium-response ozone detector suitable for measurements from light aircraft, J. Atmos. Ocean. Tech., 9, 142–148, 1992.
Rohrer, F., Bohn, B., Brauers, T., Brüning, D., Johnen, F.-J., Wahner, A., and Kleffmann, J.: Characterisation of the photolytic HONO-source in the atmosphere simulation chamber SAPHIR, Atmos. Chem. Phys., 5, 2189–2201, https://doi.org/10.5194/acp-5-2189-2005, 2005.
Rollins, A. W., Kiendler-Scharr, A., Fry, J. L., Brauers, T., Brown, S. S., Dorn, H.-P., Dubé, W. P., Fuchs, H., Mensah, A., Mentel, T. F., Rohrer, F., Tillmann, R., Wegener, R., Wooldridge, P. J., and Cohen, R. C.: Isoprene oxidation by nitrate radical: alkyl nitrate and secondary organic aerosol yields, Atmos. Chem. Phys., 9, 6685–6703, https://doi.org/10.5194/acp-9-6685-2009, 2009.
Saunders, S. M., Jenkin, M. E., Derwent, R. G., and Pilling, M. J.: Protocol for the development of the Master Chemical Mechanism, MCM v3 (Part A): tropospheric degradation of non-aromatic volatile organic compounds, Atmos. Chem. Phys., 3, 161–180, https://doi.org/10.5194/acp-3-161-2003, 2003.
Schwantes, R. H., Teng, A. P., Nguyen, T. B., Coggon, M. M., Crounse, J. D., St Clair, J. M., Zhang, X., Schilling, K. A., Seinfeld, J. H., and Wennberg, P. O.: Isoprene NO3 Oxidation Products from the RO2+HO2 Pathway, J. Phys. Chem. A, 119, 10158–10171, https://doi.org/10.1021/acs.jpca.5b06355, 2015.
Sharkey, T. D. and Yeh, S.: Isoprene emission from plants, Annu. Rev. Plant. Phys., 52, 407–436, https://doi.org/10.1146/annurev.arplant.52.1.407, 2001.
Sobanski, N., Schuladen, J., Schuster, G., Lelieveld, J., and Crowley, J. N.: A five-channel cavity ring-down spectrometer for the detection of NO2, NO3, N2O5, total peroxy nitrates and total alkyl nitrates, Atmos. Meas. Tech., 9, 5103–5118, https://doi.org/10.5194/amt-9-5103-2016, 2016a.
Sobanski, N., Tang, M. J., Thieser, J., Schuster, G., Pöhler, D., Fischer, H., Song, W., Sauvage, C., Williams, J., Fachinger, J., Berkes, F., Hoor, P., Platt, U., Lelieveld, J., and Crowley, J. N.: Chemical and meteorological influences on the lifetime of NO3 at a semi-rural mountain site during PARADE, Atmos. Chem. Phys., 16, 4867–4883, https://doi.org/10.5194/acp-16-4867-2016, 2016b.
Thieser, J., Schuster, G., Schuladen, J., Phillips, G. J., Reiffs, A., Parchatka, U., Pöhler, D., Lelieveld, J., and Crowley, J. N.: A two-channel thermal dissociation cavity ring-down spectrometer for the detection of ambient NO2, RO2NO2 and RONO2, Atmos. Meas. Tech., 9, 553–576, https://doi.org/10.5194/amt-9-553-2016, 2016.
van Meeningen, Y., Schurgers, G., Rinnan, R., and Holst, T.: BVOC emissions from English oak (Quercus robur) and European beech (Fagus sylvatica) along a latitudinal gradient, Biogeosciences, 13, 6067–6080, https://doi.org/10.5194/bg-13-6067-2016, 2016.
Vaughan, S., Canosa-Mas, C. E., Pfrang, C., Shallcross, D. E., Watson, L., and Wayne, R. P.: Kinetic studies of reactions of the nitrate radical (NO3) with peroxy radicals (RO2): an indirect source of OH at night?, Phys. Chem. Chem. Phys., 8, 3749–3760, 2006.
Wagner, N. L., Dubé, W. P., Washenfelder, R. A., Young, C. J., Pollack, I. B., Ryerson, T. B., and Brown, S. S.: Diode laser-based cavity ring-down instrument for NO3, N2O5, NO, NO2 and O3 from aircraft, Atmos. Meas. Tech., 4, 1227–1240, https://doi.org/10.5194/amt-4-1227-2011, 2011.
Warneke, C., de Gouw, J. A., Goldan, P. D., Kuster, W. C., Williams, E. J., Lerner, B. M., Jakoubek, R., Brown, S. S., Stark, H., Aldener, M., Ravishankara, A. R., Roberts, J. M., Marchewka, M., Bertman, S., Sueper, D. T., McKeen, S. A., Meagher, J. F., and Fehsenfeld, F. C.: Comparison of daytime and nighttime oxidation of biogenic and anthropogenic VOCs along the New England coast in summer during New England Air Quality Study 2002, J. Geophys. Res.-Atmos., 109, D10309, https://doi.org/10.1029/2003JD004424, 2004.
Wayne, R. P., Barnes, I., Biggs, P., Burrows, J. P., Canosamas, C. E., Hjorth, J., Lebras, G., Moortgat, G. K., Perner, D., Poulet, G., Restelli, G., and Sidebottom, H.: The Nitrate Radical – Physics, Chemistry, and the Atmosphere, Atmos. Environ., 25, 1–203, 1991.
Wennberg, P. O., Bates, K. H., Crounse, J. D., Dodson, L. G., McVay, R. C., Mertens, L. A., Nguyen, T. B., Praske, E., Schwantes, R. H., Smarte, M. D., St Clair, J. M., Teng, A. P., Zhang, X., and Seinfeld, J. H.: Gas-Phase Reactions of Isoprene and Its Major Oxidation Products, Chem. Rev., 118, 3337–3390, https://doi.org/10.1021/acs.chemrev.7b00439, 2018.
Simulation of Atmospheric PHotochemistry In a large Reaction