the Creative Commons Attribution 4.0 License.
the Creative Commons Attribution 4.0 License.
 | 08 Sep 2020
The global dust cycle and uncertainty in CMIP5 (Coupled Model Intercomparison Project phase 5) models
Zhaohui Lin
Xiaohong Liu
The dust cycle is an important component of the Earth system and has been implemented in climate models and Earth system models (ESMs). An assessment of the dust cycle in these models is vital to address their strengths and weaknesses in simulating dust aerosol and its interactions with the Earth system and enhance the future model developments. This study presents a comprehensive evaluation of the global dust cycle in 15 models participating in the fifth phase of the Coupled Model Intercomparison Project (CMIP5). The various models are compared with each other and with an aerosol reanalysis as well as station observations. The results show that the global dust emission in these models varies by a factor of 4–5 for the same size range. The models generally agree with each other and observations in reproducing the “dust belt”, which extends from North Africa, the Middle East, Central and South Asia to East Asia, although they differ greatly in the spatial extent of this dust belt. The models also differ in other dust source regions such as North America and Australia. We suggest that the coupling of dust emission with dynamic vegetation can enlarge the range of simulated dust emission.
For the removal process, all the models estimate that wet deposition is smaller than dry deposition and wet deposition accounts for 12 %–39 % of total deposition. The models also estimate that most (77 %–91 %) dust particles are deposited onto continents and 9 %–23 % of dust particles are deposited into oceans. Compared to the observations, most models reproduce the dust deposition and dust concentrations within a factor of 10 at most stations, but larger biases by more than a factor of 10 are also noted at specific regions and for certain models. These results highlight the need for further improvements of the dust cycle especially on dust emission in climate models.
- Article
(10973 KB) - Full-text XML
- BibTeX
- EndNote


The dust cycle is an important component of the Earth system as it has strong impacts on the Earth environment and climate system (Shao et al., 2011). Dust aerosol in the atmosphere significantly impacts the climate systems via various pathways, such as scattering and absorbing the solar and terrestrial radiation, modifying cloud radiative forcing by acting as cloud condensation nuclei and ice-nucleating particles, and reducing the snow albedo when depositing onto snow (Forster et al., 2007; Liu et al., 2012b; Mahowald et al., 2011; Boucher et al., 2013 ; Wu et al., 2018b; Rahimi et al., 2019). Dust affects the biogeochemical cycle by delivering the nutrients (e.g. mineral, nitrogen, and phosphorus) from dust sources to the oceans or other continents (Jickells et al., 2005; Mahowald et al., 2011). Dust aerosol is also one of the main contributors to air pollution that is hazardous to human health (Bell et al., 2008; Lin et al., 2012).
To quantify the dust impacts on the Earth system, the dust cycle including dust emission, transport, and dry and wet deposition has been incorporated into climate models and Earth system models (ESMs) since the 1990s. These models have the capability to reproduce the general patterns of global dust distribution (e.g. Ginoux et al., 2001; Zender et al., 2003; Yue et al., 2009; Huneeus et al., 2011; Liu et al., 2012a). However, large uncertainties still exist in the simulated global dust budgets in these models, as revealed by a wide range of model results (e.g. Textor et al., 2006; Huneeus et al., 2011). A comparison of 14 different models from the Aerosol Comparison between Observations and Models (AeroCom) Phase I showed the estimated global dust emission ranges from 514 to 4313 Tg yr−1 and annual mean dust burden from 6.8 to 29.5 Tg (Huneeus et al., 2011). Compared to the observations, these models from AeroCom Phase I produce the dust deposition and surface concentration mostly within a factor of 10 (Huneeus et al., 2011). Uncertainties in the dust cycle have led to difficulty in the interpretation of climate impacts of dust aerosol (Forster et al., 2007; Yue et al., 2010; Boucher et al., 2013).
The Coupled Model Intercomparison Project Phase 5 (CMIP5) provides a comprehensive dataset of meteorological variables and climate forcing agents such as aerosols including dust during the period of 1850s to 2000s from a variety of climate models and ESMs. The dust cycle is interactively calculated in some CMIP5 models for historical climate simulations and future climate projections. Until now, only a few studies have investigated dust simulations in CMIP5. Evan et al. (2014) evaluated African dust in 23 CMIP5 models and found that the models underestimate dust emission, deposition, and aerosol optical depth (AOD) and have low ability in reproducing the interannual variations in the dust burden. Pu and Ginoux (2018) compared the dust optical depth (DOD) from seven CMIP5 models with satellite observations from 2004 to 2016. They found that these models can capture the global spatial patterns of DOD but with an underestimation of DOD by 25.2 % in the boreal spring, and some models cannot capture the seasonal variations in DOD in several key regions such as northern China and Australia. Wu et al. (2018a) evaluated the dust emission in East Asia from 15 CMIP5 models and found that none of the models can reproduce the observed declining trend in dust event frequency from 1961 to 2005 over East Asia.
None of the above studies has investigated the global dust cycles including their sources and sinks in the CMIP5 models. Therefore, this study is aimed at filling the gap by presenting the strengths and weaknesses of CMIP5 models in simulating global dust cycles. This study will also investigate the associated model uncertainties. As there are a variety of complexities in the CMIP5 models (Flato et al., 2013), this study aims at identifying the difference in the simulated dust cycle as a result of these different complexities. It is of particular interest that some models couple dust emission with dynamic vegetation, while others calculate dust emission based on prescribed vegetation conditions (Table 1), and thus the impacts of dynamic vegetation on dust emission can be examined by comparing the results from these two types of models, which has been rarely studied previously.
Table 1CMIP5 model used in this study. For comparison with CMIP5 models, the MERRA-2 reanalysis is also included.
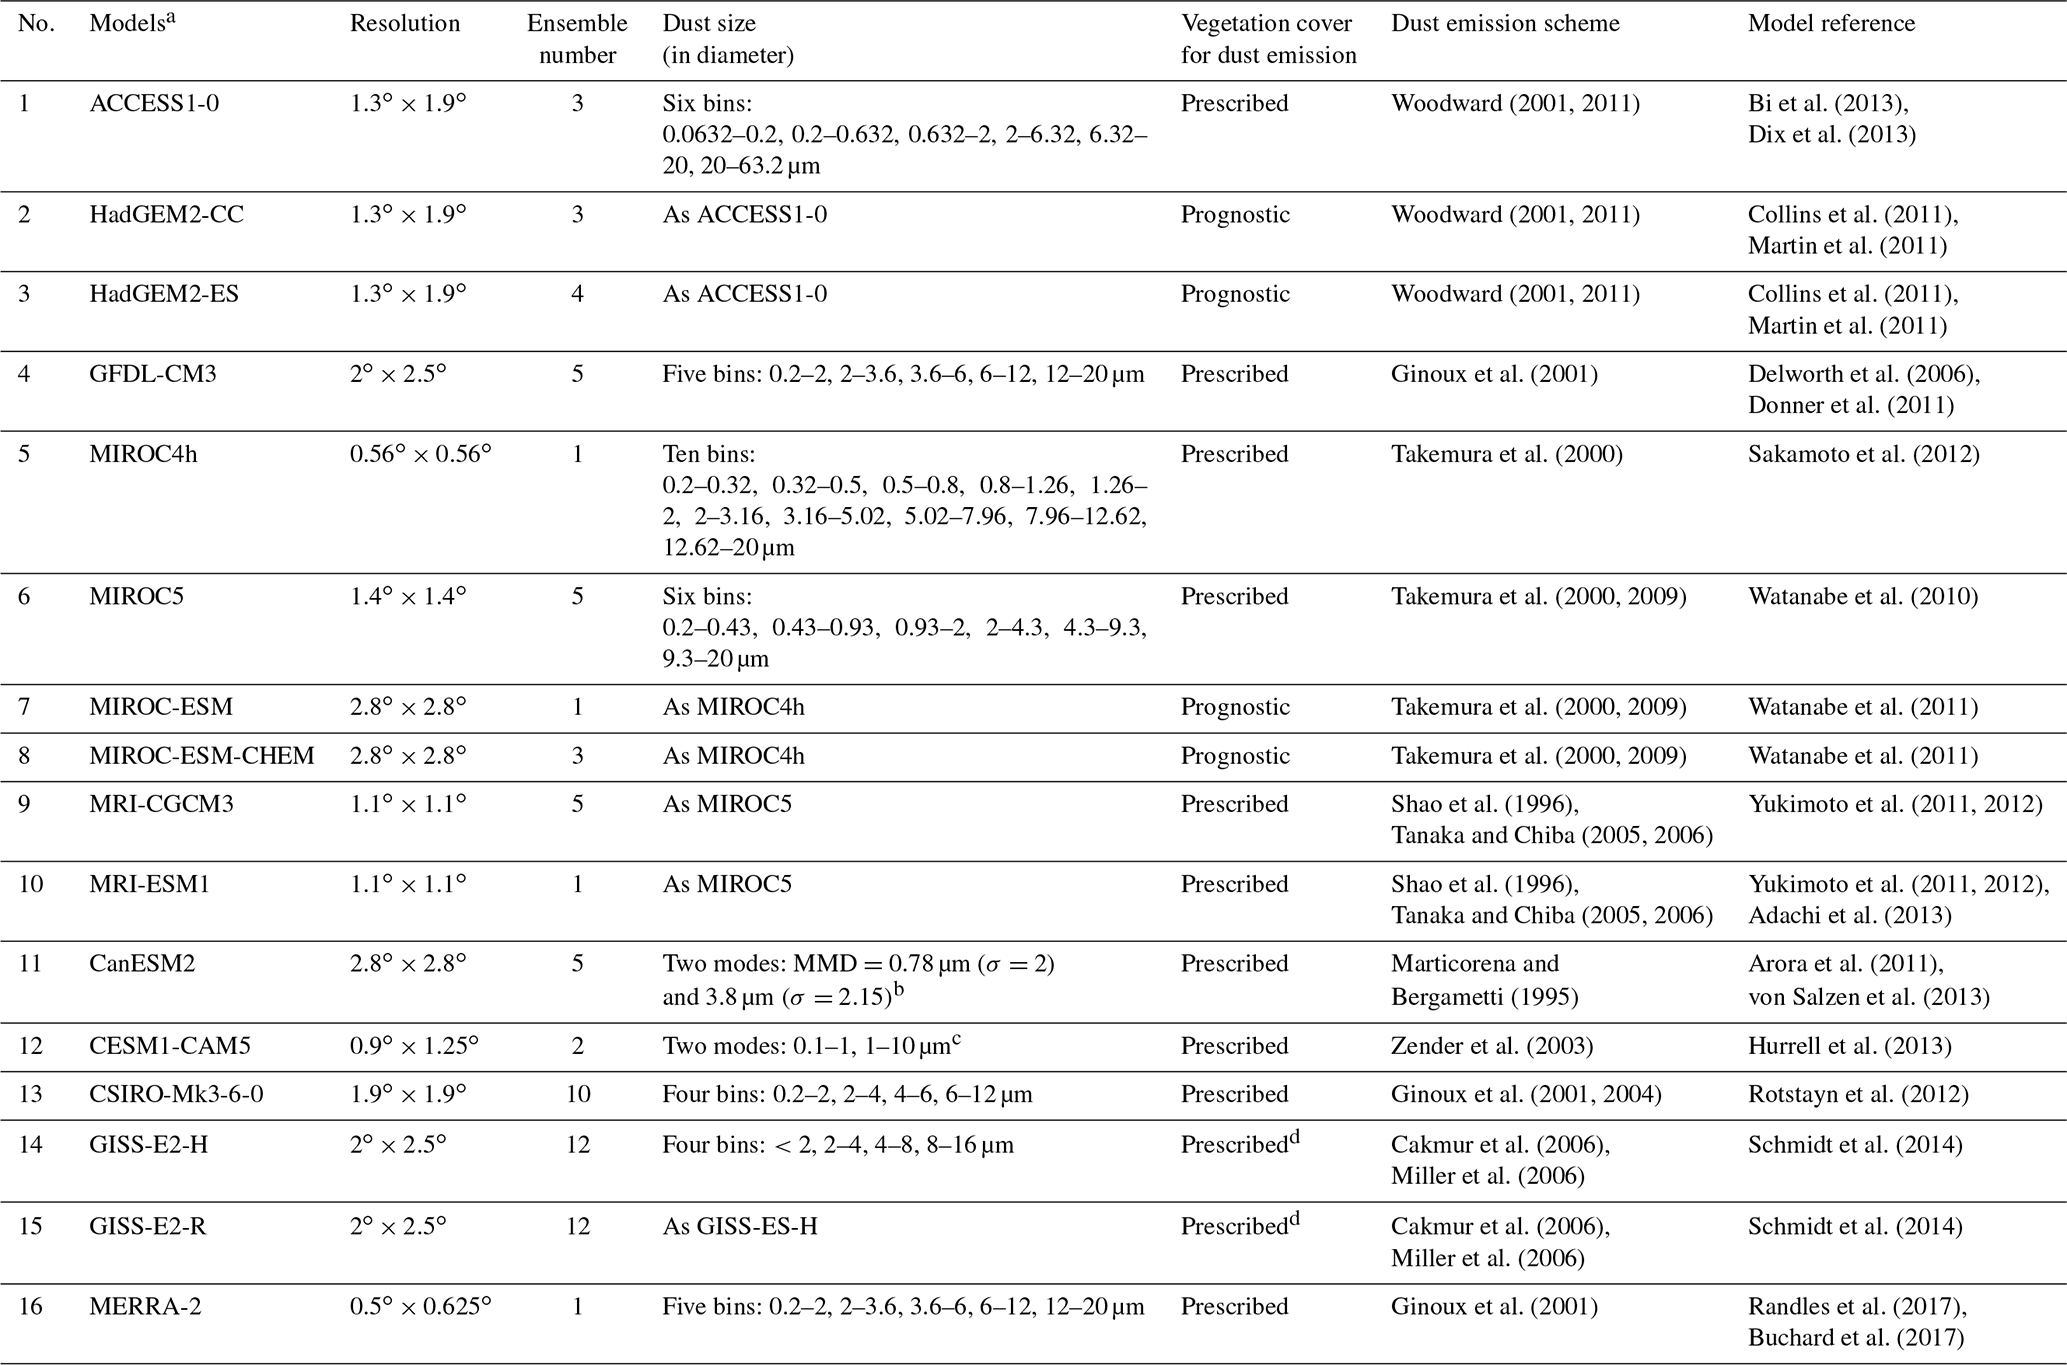
a Expansions of abbreviations: ACCESS1-0, Australian Community Climate and Earth-System Simulator version 1.0; CanESM2, Second Generation Canadian Earth System Model; CESM1-CAM5, Community Earth System Model version 1-Community Atmosphere Model version 5; CSIRO-Mk3-6-0, Commonwealth Scientific and Industrial Research Organization Mark 3.6.0; GFDL-CM3, Geophysical Fluid Dynamics Laboratory Climate Model version 3; GISS-E2-H, Goddard Institute for Space Studies Model E2 coupled with HYCOM (Hybrid Coordinate Ocean Model); GISS-E2-R, Goddard Institute for Space Studies Model E2 coupled with the Russell ocean model; HadGEM2-CC, Hadley Centre Global Environment Model version 2 with Carbon Cycle configuration; HadGEM2-ES, Hadley Centre Global Environment Model version 2 with Earth System configuration; MIROC4h, Model for Interdisciplinary Research on Climate version 4 (high resolution); MIROC5, Model for Interdisciplinary Research on Climate version 5; MIROC-ESM, Model for Interdisciplinary Research on Climate-Earth System Model; MIROC-ESM-CHEM, Model for Interdisciplinary Research on Climate-Earth System Model with Chemistry Coupled; MRI-CGCM3, Meteorological Research Institute Coupled Atmosphere–Ocean General Circulation Model version 3; MRI-ESM1, Meteorological Research Institute Earth System Model version 1. b MMD is the abbreviation of mass median diameter and σ is geometric standard deviation. c Dust emission is calculated in the size ranges 0.1–1 and 1–10 µm for accumulation and coarse modes, respectively. d Surface roughness that is comparable to vegetation data is used for dust emission calculation (Miller et al., 2006).
The paper is organized as follows. Section 2 introduces the CMIP5 models, including the dust emission parameterization. Section 3 describes the observation data used for model validation. Section 4 presents the global dust budget and dust emission, followed by evaluations of dust deposition flux and dust concentration with observations. Conclusions and future work are given in Sect. 5 and Sect. 6, respectively.
Here we use the historical simulations from 15 CMIP5 models (Table 1). CMIP5 provides a well-coordinated framework for climate change experiments (Taylor et al., 2012). The experiment design in CMIP5 is given in Taylor et al. (2009). The models in CMIP5 were run with their own formulations and resolutions, and CMIP5 represented a variety of best-effort attempts to simulate the climate system at the time. CMIP5 results have been included in the Fifth Assessment Report of Intergovernmental Panel on Climate Change (Flato et al., 2013). For the historical experiment, the models were run from 1850 to at least 2005 with the same forcing data such as greenhouse gas, solar radiation, and anthropogenic aerosol and precursor emissions (Taylor et al., 2009). All the 15 models used here are fully coupled models. A brief description of these model is given in Table 1 and more detailed information can be found in the references as listed.
An essential part of the dust cycle is dust emission. The dust emission schemes used in these models and the references are also listed in Table 1. Here we only provide a brief summary of similarities and differences in these dust emission schemes. More details can be found in the references (Cakmur et al., 2006; Ginoux et al., 2001, 2004; Marticorena and Bergametti, 1995; Miller et al., 2006; Shao et al., 1996; Takemura et al., 2000, 2009; Tanaka and Chiba, 2005, 2006; Woodward, 2001, 2011; Zender et al., 2003). In general, these emission schemes similarly calculate dust emission based on near-surface wind velocity (in terms of friction wind velocity or wind velocity at 10 m), soil wetness, and vegetation cover, and they mainly differ in how to account for these factors and associated input parameters. In addition, to make the simulated dust patterns close to the observations, the dust schemes in six models (ACCESS1-0, HadGEM2-CC, HadGEM2-ES, GFDL-CM3, CESM1-CAM5, CSIRO-Mk3-6-0) further adopt a source erodibility (also called source function) on dust emission. CESM1-CAM5 adopts a source erodibility from Zender et al. (2003), and the other five models use that of Ginoux et al. (2001). Land cover data are crucial for dust modelling, and they also vary in different models. Eleven models use prescribed vegetation or roughness, and these data originate from different studies (an example of this can be seen in the difference between MIROC4h and MIROC5, shown in Sect. 4.2). In the other four models (HadGEM2-CC, HadGEM2-ES, MIROC-ESM, MIROC-ESM-CHEM), the dust emission scheme is coupled to dynamic vegetation. These models use prognostic vegetation to determine the dust source regions. This introduces additional degrees of freedom and thus increases the difficulty in simulating dust emission in these models compared to other models with prescribed vegetation that is constructed from the observation. This will be discussed in Sect. 4.
Another difference in the dust emission scheme is the treatment of dust sizes including the size range and mass partitioning into different sizes. Seven models (GFDL-CM3, MIROC4h, MIROC5, MIROC-ESM, MIROC-ESM-CHEM, MRI-CGCM3, MRI-ESM1) have the same dust size range of 0.2–20 µm in diameter. Five of the other eight models (CanESM2, CESM1-CAM5, CSIRO-Mk3-6-0, GISS-E2-H, GISS-E2-R) have smaller size ranges (listed in Table 1), while the remaining three models (ACCESS1-0, HadGEM2-CC, HadGEM2-ES) have the larger size range of 0.0632–63.2 µm in diameter. The impacts of dust size distribution on the simulation of the dust cycle will be discussed in later sections. However, as only the total dust emission, deposition, and concentration for the whole size range are provided, we are unable to investigate the difference in the mass partitioning among different dust sizes and its evolution, which will be left to future studies.
Note that we select these models because they calculate dust emission interactively by the dust emission schemes implemented, and meanwhile, the model output of dust emission flux and dust concentration is available from the CMIP5 archive. These models have different horizontal resolutions (Table 1). To generate multi-model statistics of dust emission intensity (Sect. 4.2), individual model results are interpolated to the coarsest resolution among these models (i.e. ) using area conserve remapping (http://www.ncl.ucar.edu/Document/Functions/Contributed/area_conserve_remap_Wrap.shtml, last access: 6 June 2020).
Also note that not all the models have both dry and wet deposition archived and eight models provide only dry (GFDL-CM3) or wet deposition flux (HadGEM2-CC, HadGEM2-ES, MIROC4h, MIROC5, MIROC-ESM, MIROC-ESM-CHEM, CSIRO-Mk3-6-0). Therefore, for dust deposition, we derive the global total amount of dry (wet) deposition by subtracting wet (dry) deposition from emission if only wet (dry) deposition is available. For comparison with station observations, we will only use seven models with both dry and wet deposition provided. If there are multiple ensemble simulations available for a specific model, we will use the ensemble means from these simulations for this model (Table 1). The historical simulations of CMIP5 cover the period of 1850–2005. However, some model results prior to 1960 or 1950 are not provided in the CMIP5 archive (e.g. ensemble no. 2 and no. 3 from HadGEM2-CC prior to 1960 is not available; MIROC4h prior to 1950 is not available). Therefore, we will focus on the period of 1960–2005 to include as many models as possible and to include as many years as possible for the analysis of the present-day dust cycle.
3.1 Observations
There are limited observational datasets that can be used for model evaluations. There is no direct observation of dust emission flux, but satellite observations can provide the locations of dust source regions where dust appears most frequently (e.g. Prospero et al., 2002; Ginoux et al., 2012). Here we do not directly use these observations as they are not available for our use, but we will refer to the dust source map based on satellite observations from previous studies (e.g. Prospero et al., 2002; Ginoux et al., 2012) and qualitatively compare simulated dust emission regions with them.
Dust deposition is an important constraint on the global dust budget. Here we use the dust deposition flux at 84 stations across the globe available from the AeroCom project (Huneeus et al., 2011). The dataset is compiled from the Dust Indicators and Records in Terrestrial and Marine Paleoenvironments (DIRTMAP) database (Kohfeld and Harrison, 2001; Tegen et al., 2002) and the data of Ginoux et al., (2001) and Mahowald et al. (1999, 2009). The observation periods vary for different stations. Dust deposition from DIRTMAP is from sediment traps, and following Tegen et al. (2002), we only use those 41 stations with a deployment period greater than 50 d. The original data of Ginoux et al. (2001) contain both measurements and model estimates. We only use the measurements from Ginoux et al. (2001) which consist of 10 stations, and the observation periods varied from 1 to 20 years (see site nos. 2, 3, 4, 5, 6, 7, 8, 14, 15, and 16 in Table 6 of Ginoux et al., 2001). The data of Mahowald et al. (1999) were derived from ice core data and consist of six stations. Except at one of the stations (i.e. Renland) where the period was 5 years (i.e. 1813–1819 excluding 1816–1817), the exact observation periods at the other five stations were not provided and generally covered a time slice of tens of years or more for the current climate. In addition, Mahowald et al. (2009) further compiled 27 stations from several campaigns and the observation periods mostly covered 1 to 4 years.
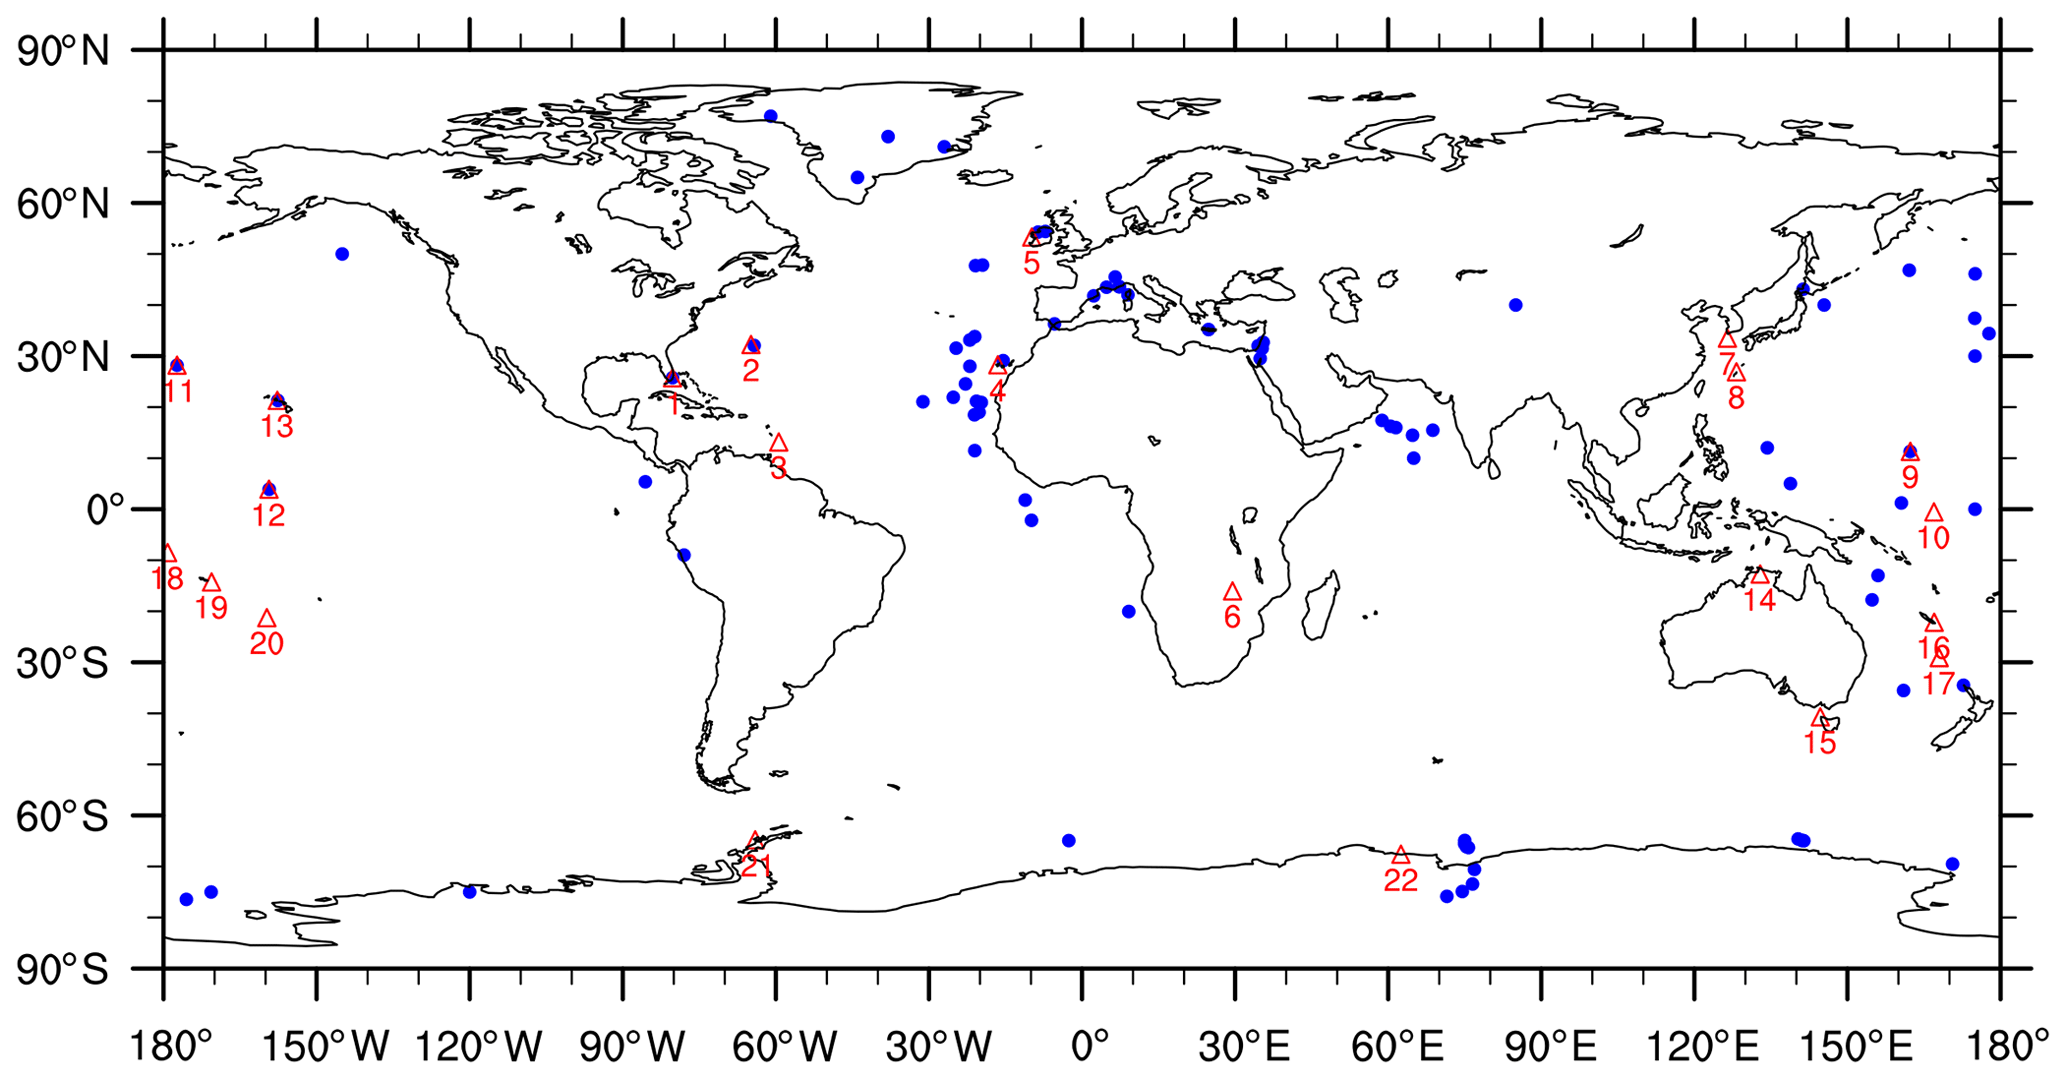
Figure 1The distribution of observational stations used in this study: blue circles for dust deposition and red triangles for surface dust concentrations. The descriptions of all these stations can be found in Sect. 3.1.
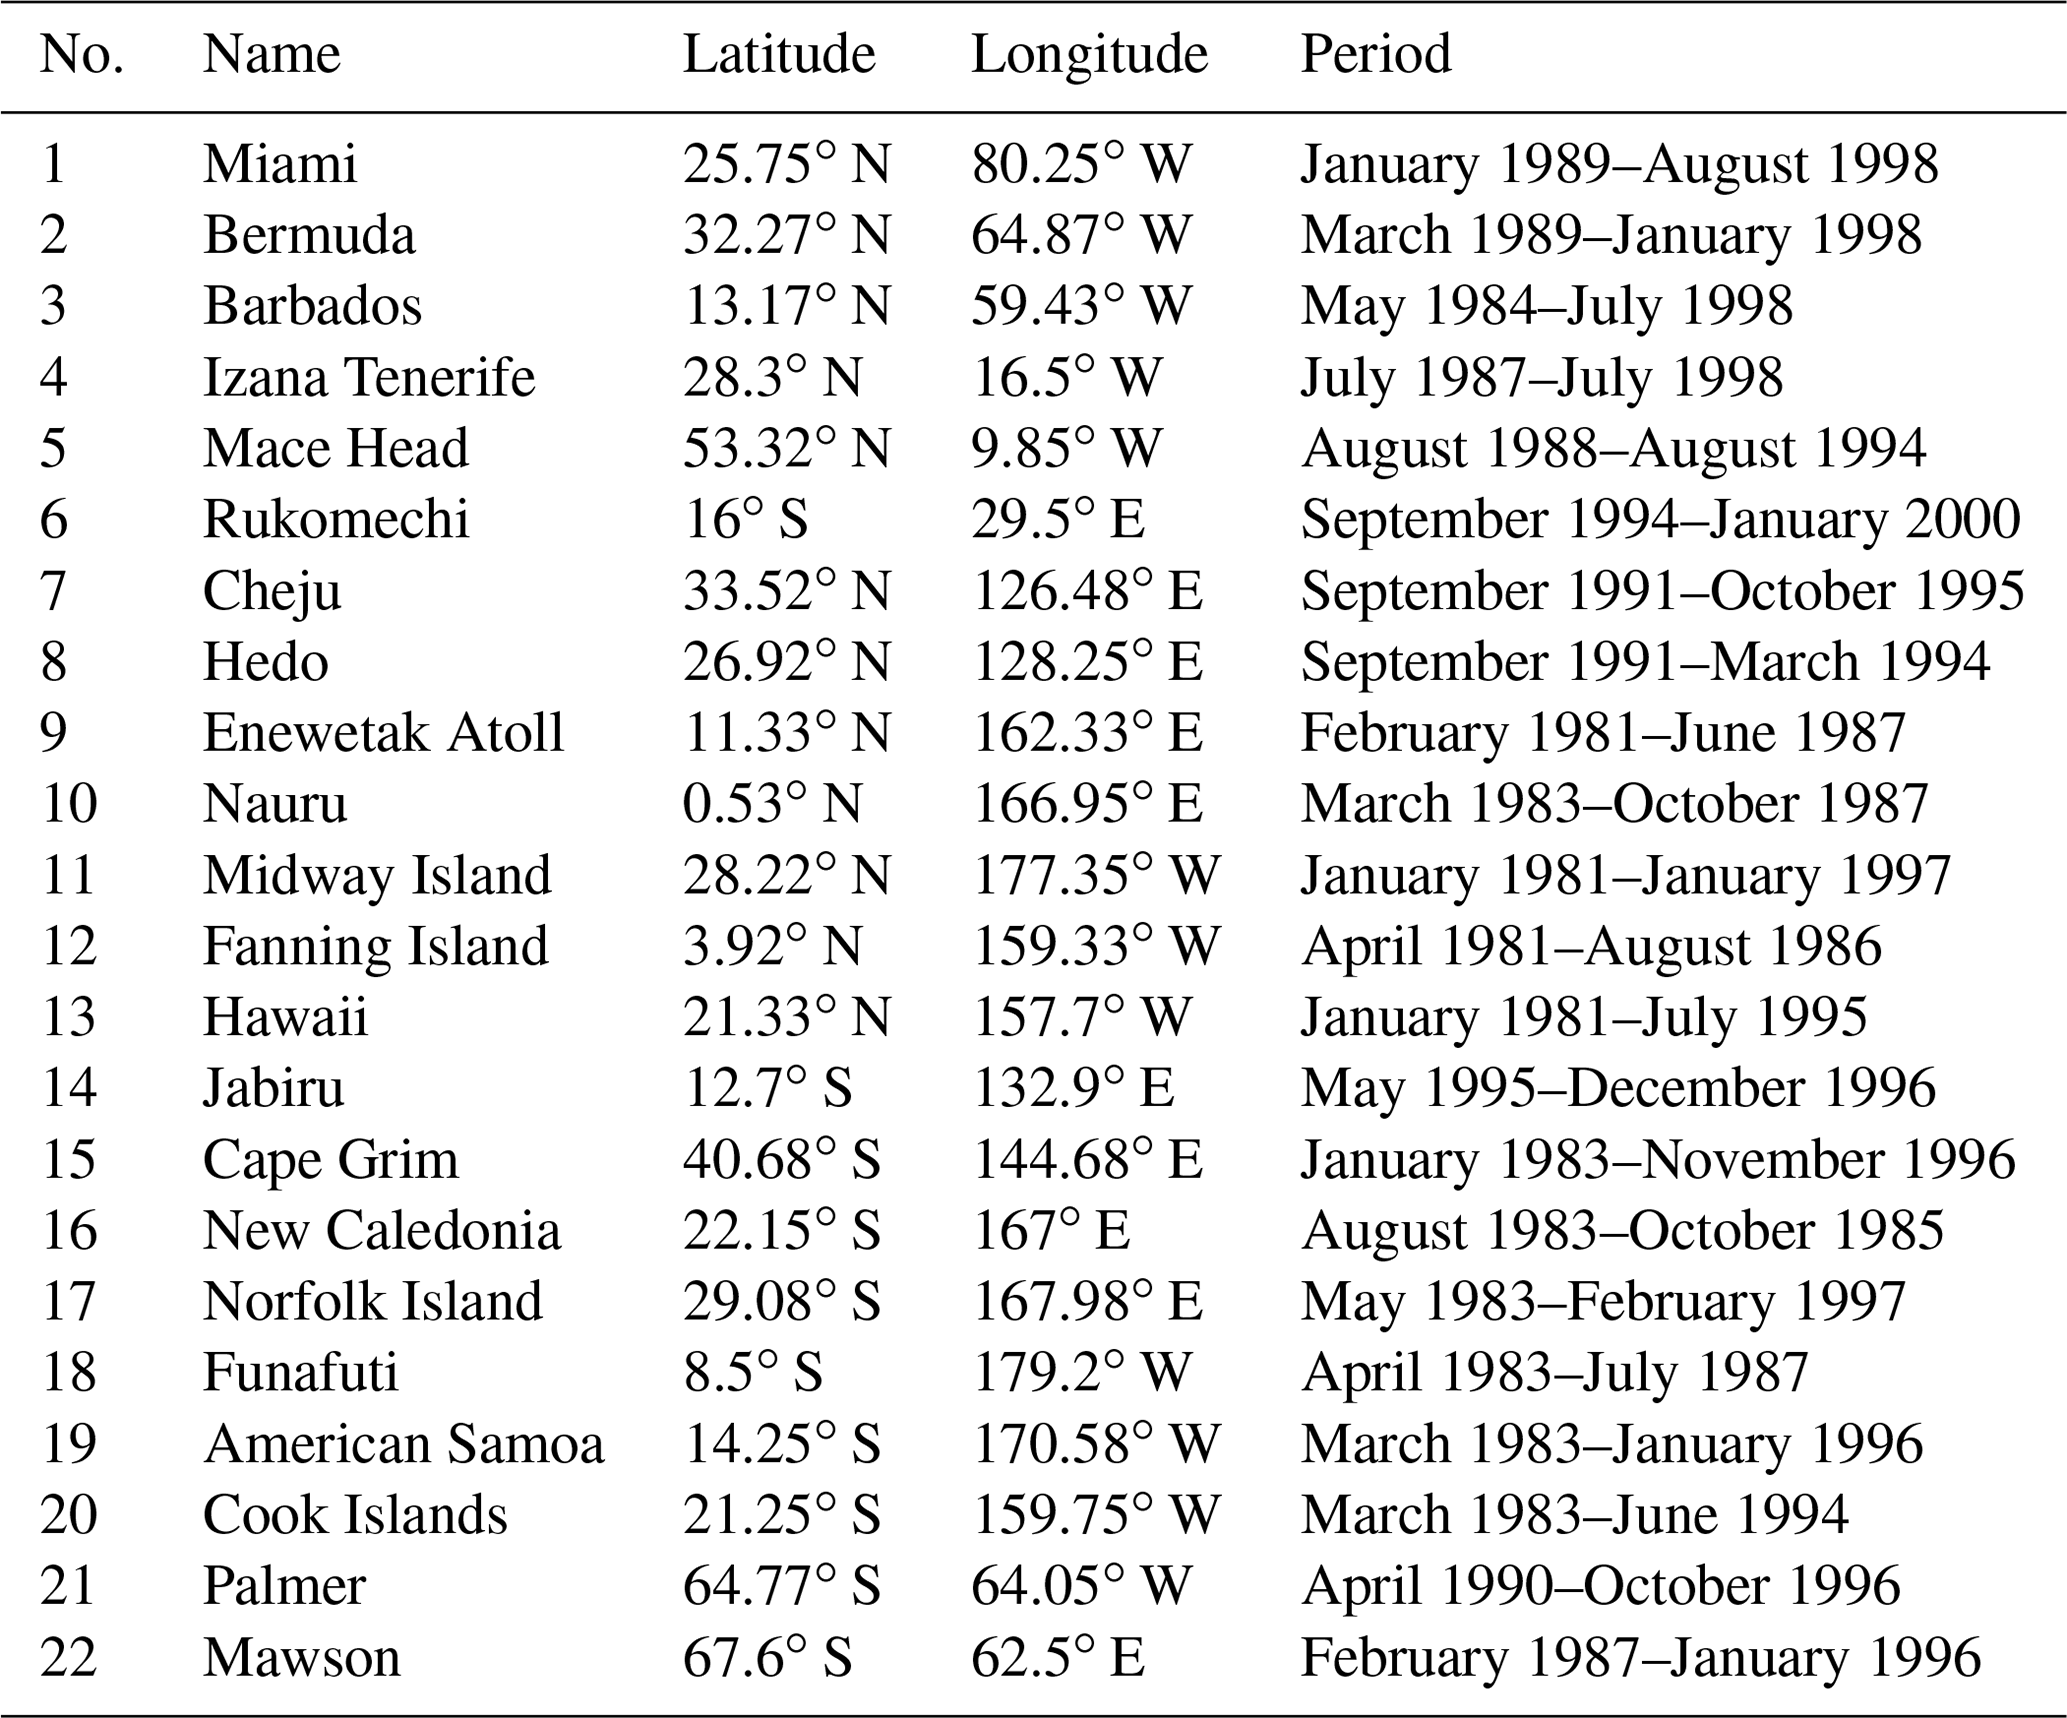
Dust concentration is a key variable that reflects both dust emission and transport. We use the monthly surface dust concentrations at 20 sites managed by the Rosenstiel School of Marine and Atmospheric Science at the University of Miami (Prospero, 1996). We also use the monthly surface dust concentrations measured at two other stations: Rukomechi, Zimbabwe (Maenhaut et al., 2000a; Nyanganyura et al., 2007), and Jabiru, Australia (Maenhaut et al., 2000b; Vanderzalm et al., 2003). In total, there are 22 stations globally. These stations are generally located downwind of dust source regions, and some of them are located in remote regions (Table 2; Fig. 1). Measurements at these stations are taken over a period of 2 to tens of years (Table 2). This dataset has been widely used to evaluate global dust models (e.g. Ginoux et al., 2001; Zender et al., 2003; Liu et al., 2012a) and has also been included in the AeroCom project (Huneeus et al., 2011).
Table 2The location of observational stations for surface dust concentration used in this study.
We consider the datasets above as a climatology although some of them did not cover a long enough period, such as tens of years. Therefore, for the stations with shorter periods of observations but large dust variability at interannual to decadal timescales, some model discrepancies may be induced due to the inconsistency between these observations and the model results that are averaged over a period of 46 years. We will discuss this in the next sections. The distribution of these stations (for dust deposition and surface dust concentration) is shown in Fig. 1. To compare model results with station observations, bilinear interpolation is used to generate the model results at the stations.
3.2 MERRA-2 reanalysis
Because the station observations are limited in spatial coverage (Fig. 1), we also use the aerosol reanalysis from Modern-Era Retrospective Analysis for Research and Applications, version 2 (MERRA-2; Global Modeling and Assimilation Office, 2015a, b) to evaluate the CMIP5 model results. MERRA-2 is the latest atmospheric reanalysis produced by NASA's Global Modeling and Assimilation Office (Gelaro et al., 2017). MERRA-2 assimilates more observation types and has improved significantly compared to its processor, MERRA. A major advancement of MERRA-2 is that it includes the assimilation of AOD (Randles et al., 2017). The aerosol fields (including dust) in MERRA-2 are significantly improved compared to an identical control simulation that does not include the AOD assimilation (Randles et al., 2017; Buchard et al., 2017).
The MERRA-2 aerosol reanalysis uses an incremental analysis update procedure, which derives three-dimensional analysis increments for the aerosol mixing ratio based on the AOD analysis increment (Randles et al., 2017). The procedure further affects the aerosol deposition flux. It should be noted that as only AOD is taken into account in the aerosol assimilation, there may be discrepancies in the individual aerosol components including dust if the underlying aerosol model has a bias in one aerosol component. This will also cause discrepancies in aerosol deposition flux that depends on the aerosol concentration and deposition velocity. In addition, dust emission is calculated directly from surface wind speed and soil wetness is based on the dust emission scheme of Ginoux et al. (2001), and there is no direct impact on emissions from aerosol assimilation. Therefore, there may be an inconsistency between dust emission, burden, and deposition. In fact, as shown in Sect. 4, there is an imbalance between total dust emission and deposition globally, and an adjustment of dust emission to fit the dust burden is still needed.
Despite the aforementioned limitations, MERRA-2 provides a well-constrained global dust dataset, which is very useful for model evaluations. We will use MERRA-2 as referential data but with the knowledge of their limitation. We will use the long-term means of dust-related variables during the whole period when data are available (i.e. 1980–2018). Dust in MERRA-2 is treated in five size bins ranging from 0.2 to 20 µm, which are summed to provide the total values. MERRA-2 is provided at the resolution of , which is similar to one CMIP5 model (MIROC4h) and finer than the other CMIP5 models.
4.1 Global dust budget
First, we present the global dust budgets in CMIP5 models. The key global budget terms include global dust emission (E; kg s−1), dust deposition (D; kg s−1), and dust burden (B; kg), defined respectively as
where Fe is emission flux (kg m−2 s−1), Fd is deposition flux (kg m−2 s−1), mb is column dust concentration (kg m−2), and S is surface area (m2). mb is an integration of dust concentration (C; kg m−3) over the entire column:
The mass equation for dust aerosols around the globe is
or
where ΔB is the change in dust burden between the start time and the end time, is mean global dust emission, is mean global dust deposition, and Δt is the cumulative time. For a long-term period, ΔB is relatively small (i.e. ΔB≈0); then
Dust deposition can be separated into two terms: dry deposition and wet deposition. According to Eq. (6), the mean dust lifetime (also called residence time; ) can be defined by assuming as
where is mean global dust burden.
Table 3 lists the global dust emission, wet deposition, burden, and lifetime in all the 15 models. Global dust emission and wet deposition are given in teragrams (Tg) per year; burden is given in teragrams; lifetime is given in days. The area fraction of global dust emissions and the ratio of wet deposition to total deposition are also given. The dust size ranges considered in the models are not exactly the same. Three models (ACCESS1-0, HadGEM2-CC, HadGEM2-ES) consider dust particles with a diameter of 0.06 to 63 µm, and estimated global dust emissions range from 2218 to 8186 Tg yr−1. Seven models (GFDL-CM3, four MIROC models, and two MRI models) consider dust particles with a diameter of 0.2–20 µm, and they estimate global dust emission to be in the range of 735–3598 Tg yr−1. The remaining five models consider dust particles with a diameter below 10–16 µm, and they estimate global dust emission to be 1677–3698 Tg. If ACCESS1-0, HadGEM2-CC, and HadGEM2-ES are excluded, these estimations here are similar to those of AeroCom models in a similar size range, which gave dust emissions in the range of 514–4313 Tg yr−1 (Huneeus et al., 2011). HadGEM2-CC and HadGEM2-ES give more than twice that of the other CMIP5 model estimates. The larger value in HadGEM2-CC and HadGEM2-ES is mainly due to the larger dust size range in the models (0.06 to 63 µm). Indeed, they simulate 3300 Tg yr−1 of dust emission for particles smaller than 20 µm in diameter (Bellouin et al., 2011), which falls between the range of the other estimations. However, ACCESS1.0 with the same size range as HadGEM2-CC and HadGEM2-ES produces 3–4 times smaller dust mission. As shown in the evaluation of surface dust concentrations in Sect. 4.4, HadGEM2-CC and HadGEM2-ES simulate the surface dust concentrations downwind of North Africa and East Asia well, but greatly overestimate the surface dust concentrations in other regions (by more than 5 times). This overestimation is related to the excessive bare-soil area simulated by the dynamic vegetation module in these models (Collins et al., 2011; Martin et al., 2011), as will be shown in Sect. 4.2.
Table 3Global dust budgets in CMIP5 models. The models are classified into three groups according to the dust size range considered. Also included for comparison is the MERRA-2 reanalysis.
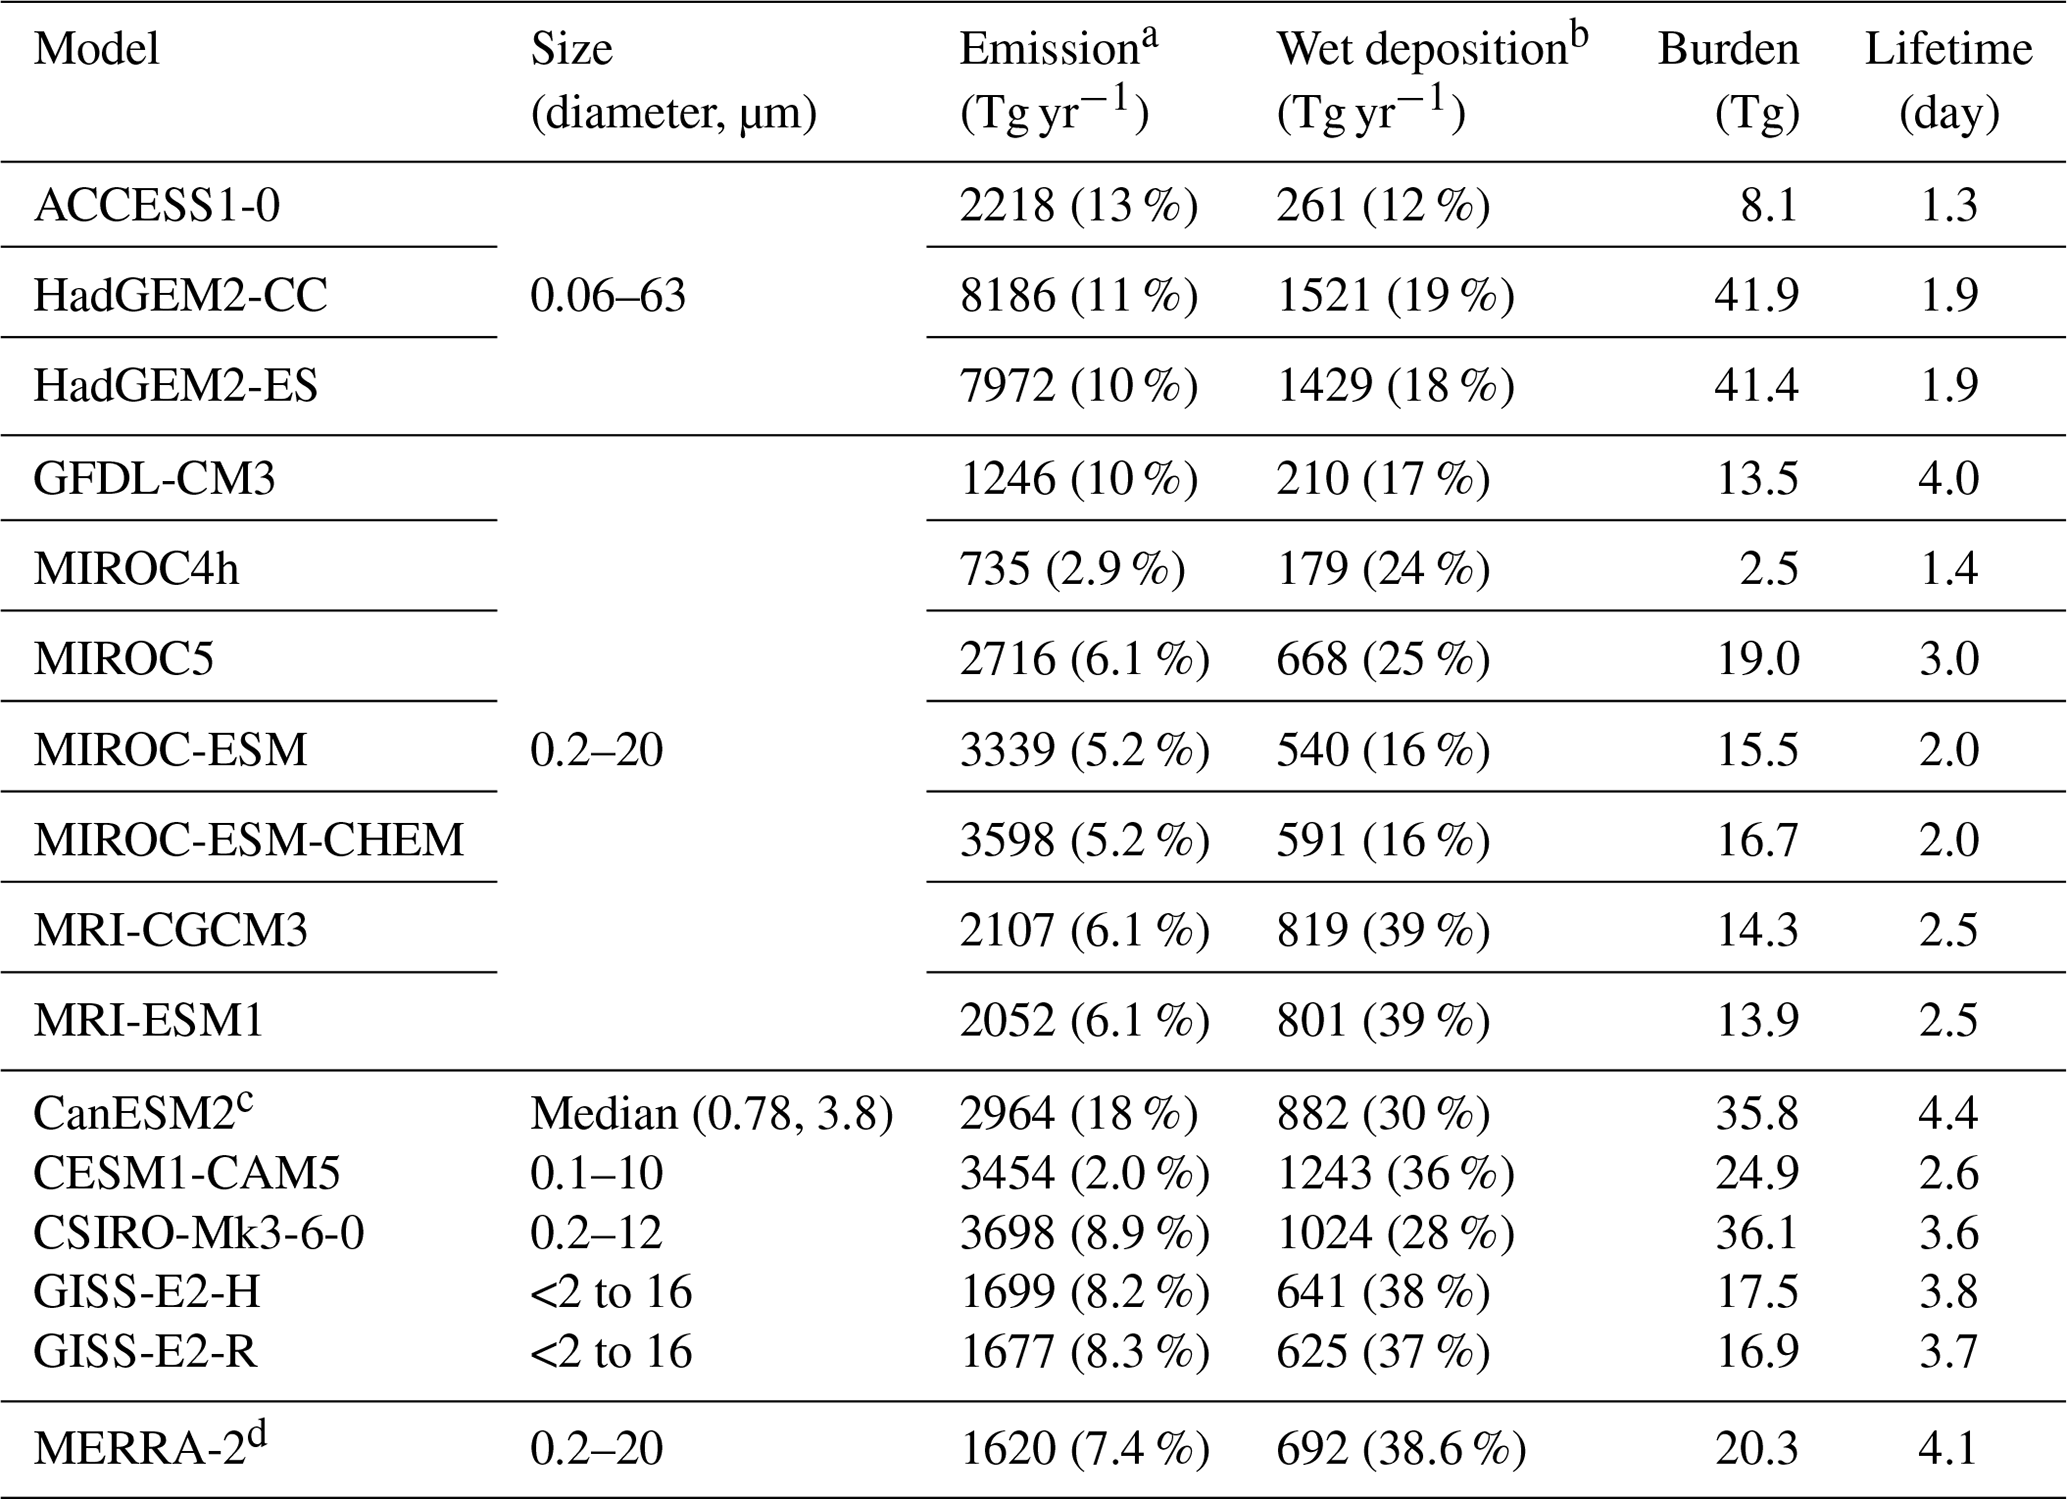
a The global dust emission area fraction is given in parentheses next to the global dust emission. The dust emission area is defined as the region with an annual mean dust emission flux larger than 1 % of the global mean annual dust emission flux. b The ratio of wet deposition to total deposition is given in parentheses next to wet deposition. c Using two modes, CanESM2 represents more than 97 % of dust mass for particles smaller than 16 µm (in diameter). Therefore, CanESM2 is put into the third group. d The global dust deposition is 1792 Tg, which is larger than dust emission because no adjustment was done with dust emission after aerosol assimilation (Sect. 2).
MIROC4h has the smallest global dust emission (735 Tg yr−1), which is also much smaller than other estimates (1246–3598 Tg yr−1) in the same size range (0.2–20 µm in diameter). The MIROC4h estimate may be too low, as the MIROC4h model underestimates the surface dust concentrations by more than 10 times (Sect. 4.4). If the estimations of HadGEM2-CC, HadGEM2-ES, and MIROC4h are not considered, global dust emissions in CMIP5 models are in the range of 1246–3698 Tg yr−1. The global dust emission in MERRA-2 is 1620 Tg yr−1, which is within the range of CMIP5 models.
For dust deposition, dust particles are deposited to the Earth's surface mainly by dry deposition, and wet deposition accounts for 12 %—39 % of total deposition in CMIP5 models. Early model studies estimated the fraction of global wet deposition ranges from 10 % (Ginoux et al., 2004) to 49 % (Luo et al., 2003). The 14 AeroCom models estimated the fraction of global wet deposition in the range of 16 %–66 %. Therefore, this result of 12 %–39 % lies in the middle to low end of previous estimates. The ratio of wet deposition to total deposition depends on several factors, for example, dust size distribution, geographical locations of dust emission regions, and climate states such as circulation and precipitation (e.g. Wu and Lin, 2013). Overall, the models with the largest dust size ranges (ACCESS1-0, HadGEM2-CC, HadGEM2-ES) simulate a smaller fraction of wet deposition (12 %–19 %) than the other models (16 %–39 %). The estimated global dust burden ranges from 2.5 to 41.9 Tg; it ranges from 8.1 to 36.1 Tg when HadGEM2-CC, HadGEM2-ES, and MIROC4h are excluded. The lifetime of global dust particles ranges from 1.3 to 4.4 d. The dust burden (lifetime) in MERRA-2 is 20.3 Tg (4.1 d), which is larger (longer) than in most CMIP5 models. The fraction of wet deposition to total deposition in MERRA-2 is 38.6 %, which is at the upper end of CMIP5 results. There is a linear relationship (with the correlation coefficient R=0.67, above the statistically significant level of 0.01) between global dust burden and lifetime in CMIP5 models (excluding HadGEM2-CC and HadGEM2-ES; Fig. 2a), indicating that a longer lifetime of dust is generally associated with a larger dust burden. A linear relationship (R=0.46, above the statistically significant level of 0.05) is also found between lifetime and the fraction of wet deposition (Fig. 2b), which indicates that a longer lifetime corresponds to a larger fraction of wet deposition in the total deposition.
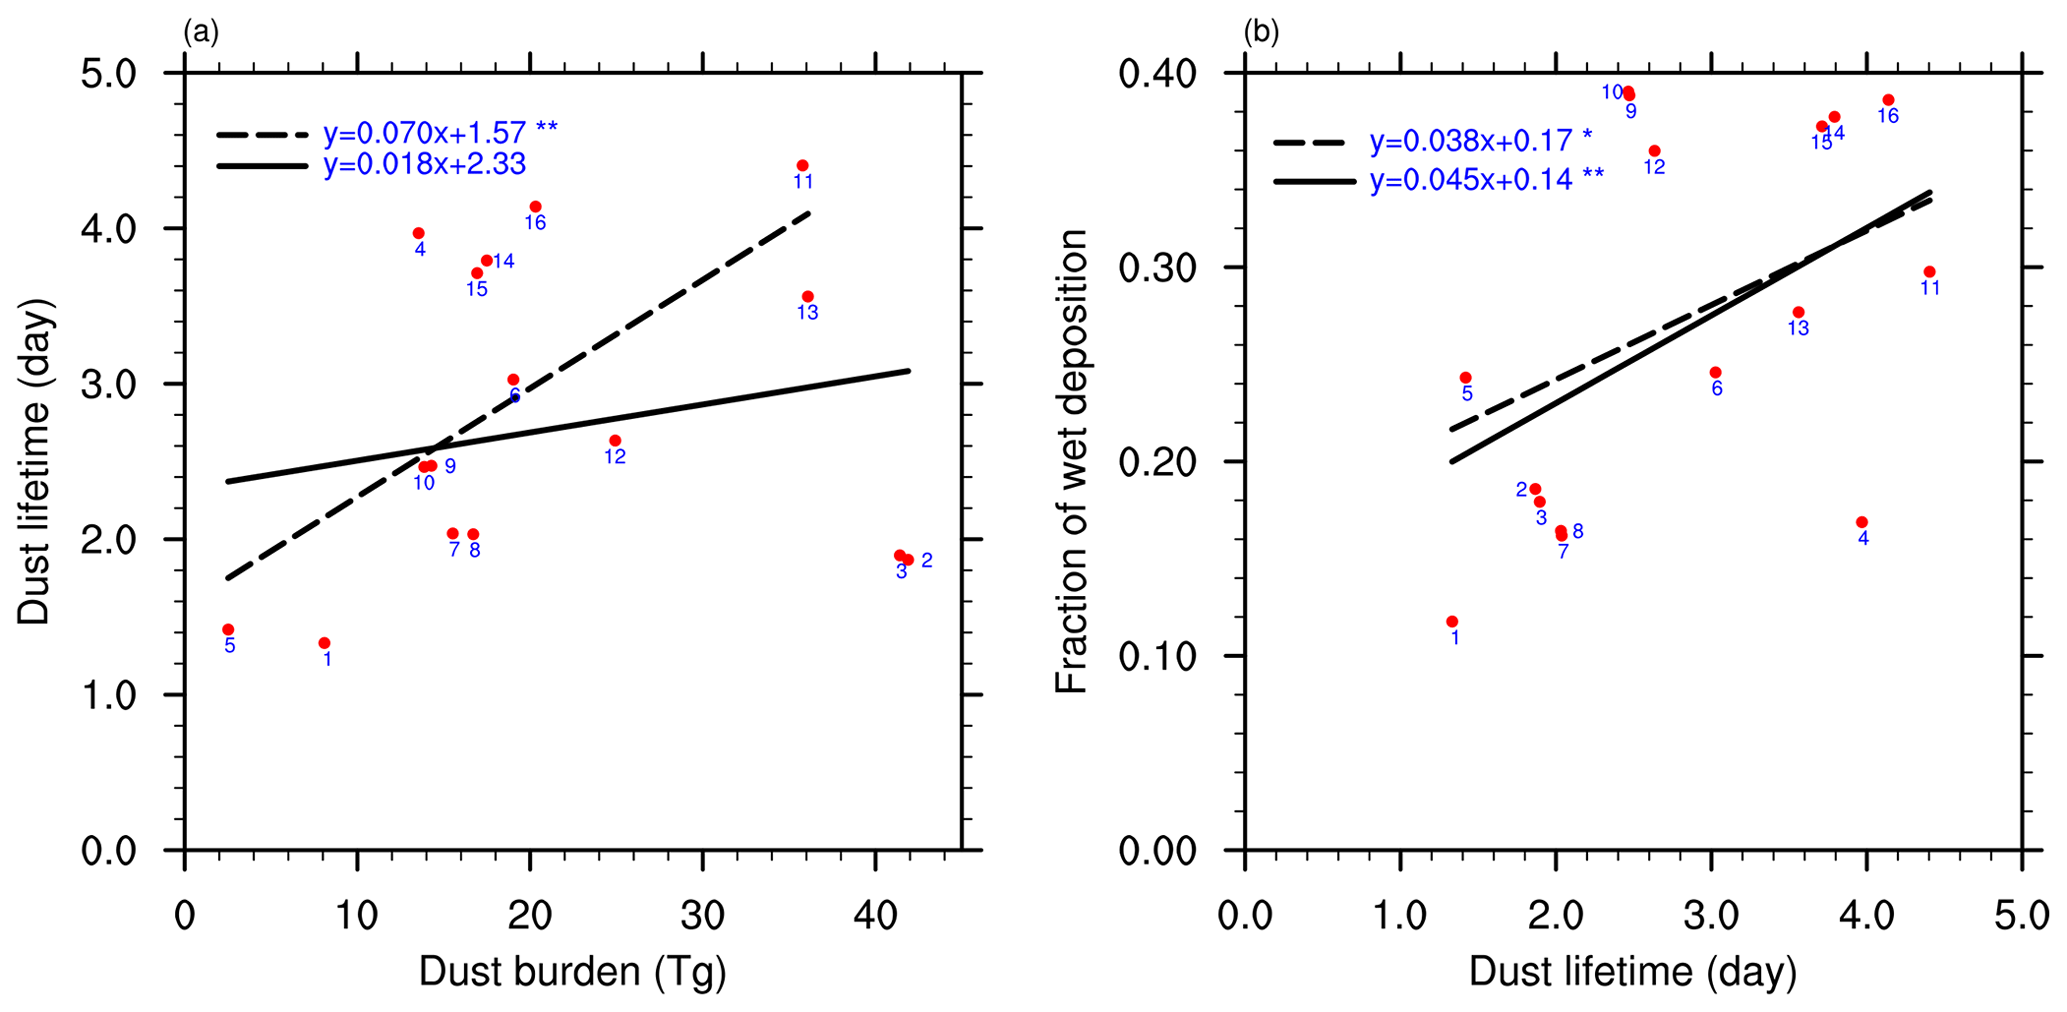
Figure 2Scatter plot of (a) dust burden versus dust lifetime and (b) dust lifetime versus the fraction of wet deposition to total deposition in 15 CMIP5 models and in the MERRA-2 reanalysis. The models are indexed in Table 1. The regression lines from all the CMIP5 models (solid) and the CMIP5 models excluding HadGEM2-CC and HadGEM2-ES (dashed) are also shown with the slopes and intercepts for the regression equation. The significance test for each regression is denoted by one asterisk (*; above significant level of 0.1) or two asterisks (; above significant level of 0.05) after each regression equation.
4.2 Global dust emissions
4.2.1 Spatial distributions
Dust emission is the first and the foremost process in the dust cycle and determines the amount of dust entrained into the atmosphere. Figure 3 shows the spatial distribution of dust emission fluxes from 15 CMIP5 models and the MERRA-2 reanalysis. In general, all the models can reproduce the main dust sources, known as the “dust belt”, which extends from North Africa, the Middle East, Central Asia, South Asia to East Asia and which can be seen from satellite observations (Prospero et al., 2002; Ginoux et al., 2012). This result is consistent with Pu and Ginoux (2018), who investigated the global distribution of dust optical depth in seven CMIP5 models. However, the models differ significantly in the extent of this dust belt. Although a large group of CMIP5 models (GFDL-CM3, MIROC5, MIROC-ESM, MIROC-ESM-CHEM, MRI-CGCM3, MRI-ESM1, CSIRO-Mk3-6-0, GISS-E2-H, GISS-E2-R) simulates similarly the dust emission regions mostly over deserts and adjacent arid/semi-arid regions, two of the models (MIROC4h and CESM1-CAM5) simulate much smaller areas of dust emission and a few others (ACCESS1-0, HadGEM2-CC, HadGEM2-ES, CanESM2) simulate more extended dust emission regions. CESM1-CAM5 simulates isolated dust emission regions with “hotspots” of dust emissions larger than 500 g m−2 yr−1, and dust emission in MIROC4h concentrates only over the centres of deserts. In contrast, ACCESS1-0, HadGEM2-CC, HadGEM2-ES, and CanESM2 not only simulate the dust emissions in deserts and adjacent regions but also produce a considerable amount of dust emissions over East India and northern parts of the Indochinese Peninsula, which are rarely regarded as potential dust sources (Shao, 2008; Formenti et al., 2011; Ginoux et al., 2012). The extent of the dust belt can be more clearly seen when we zoom into specific regions such as North Africa (Evan et al., 2014) and East Asia (Wu et al., 2018a). For example, in East Asia, although the CMIP5 models can reproduce the dust emissions in the deserts of northern China and southern Mongolia, they differ greatly at the edges of these deserts, with three models (MIROC5, CanESM2, and CSIRO-MK3-6-0) simulating dust emission over the Tibetan Plateau and seven models (e.g. ACCESS1-0) simulating dust emission in the southern part of North China (Wu et al., 2018a).
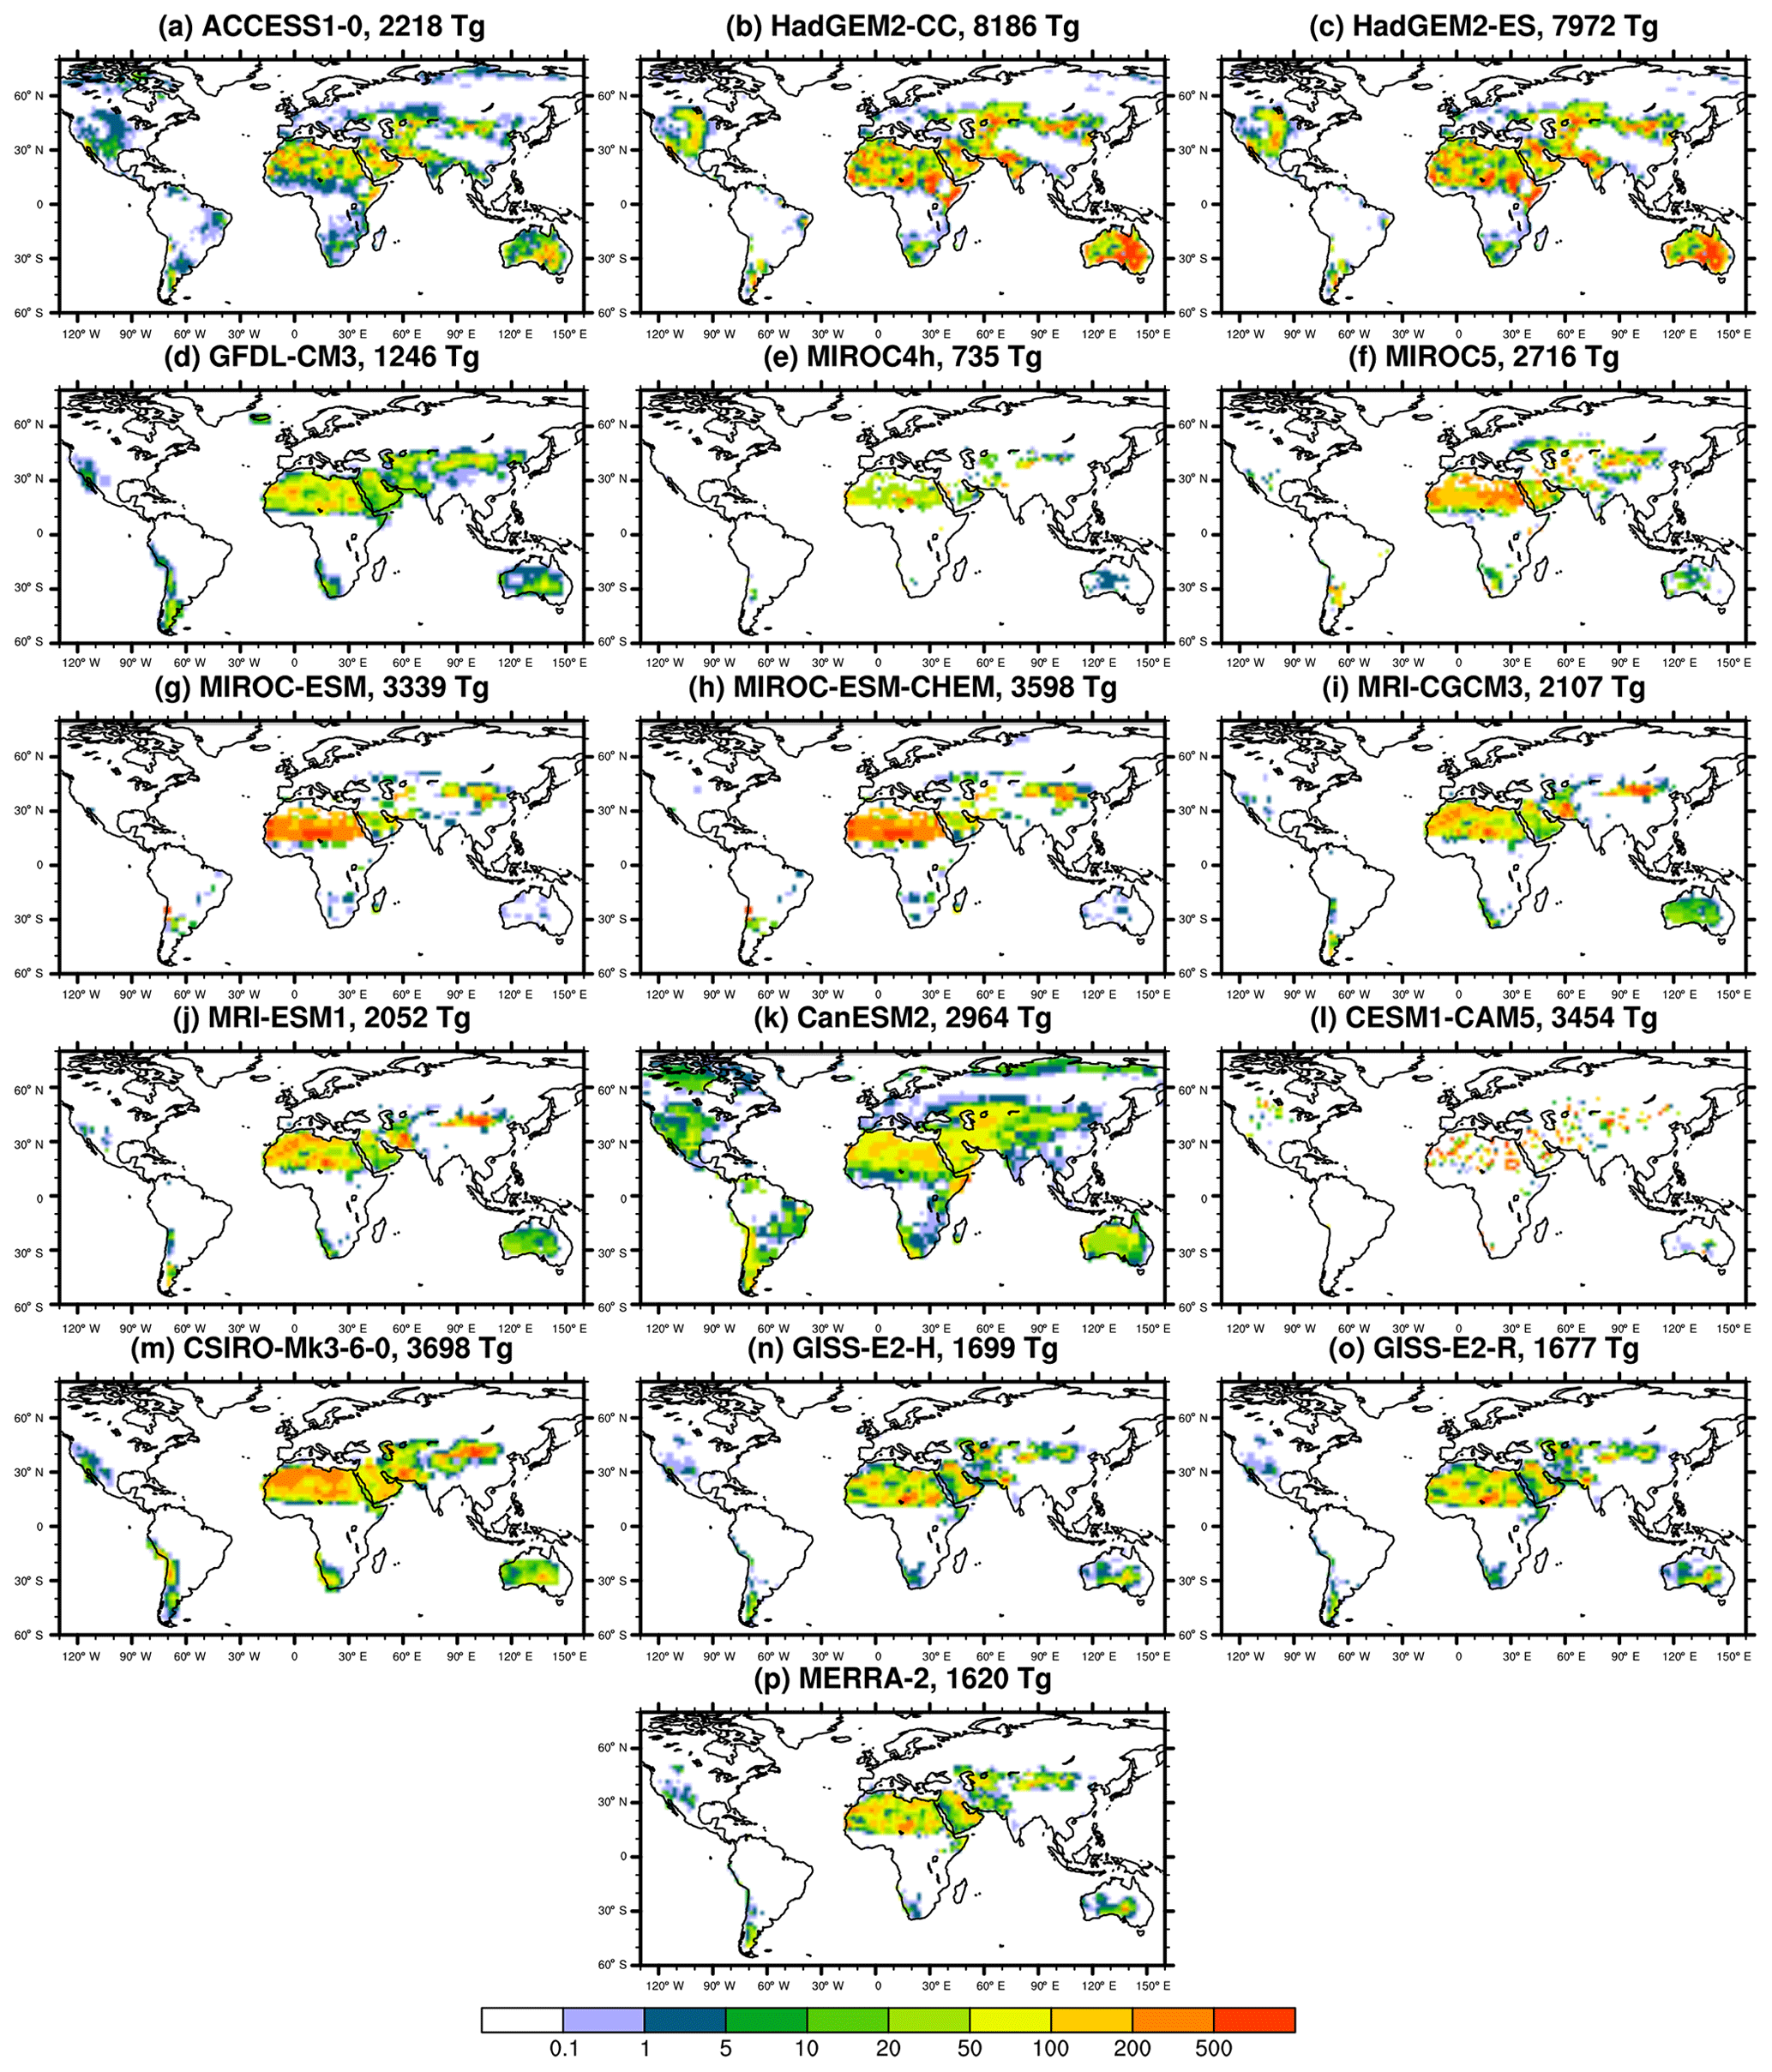
Figure 3(a–o) Annual mean dust emission flux (g m−2 yr−1) during 1960–2005 from 15 CMIP5 models and (p) annual mean dust emission (g m−2 yr−1) during 1980–2018 from the MERRA-2 reanalysis. The total annual global dust emission is included in the title of each panel.
Dust sources also exist in Australia, North America, South America, and southern Africa, as evident from surface observations (e.g. Shao, 2008) and satellite observations (Prospero et al., 2002; Ginoux et al., 2012), although the emission fluxes are smaller than those in the aforementioned dust belt. In these regions, most models produce a considerable amount of dust emissions (>5 g m−2 yr−1), while a small group of models simulate much less or even negligible dust emissions. The models differ greatly in these regions. For example, in Australia, two models (MIROC-ESM and MIROC-ESM-CHEM) produces little dust emissions, while seven models (ACCESS1-0, HadGEM2-CC, HadGEM2-ES, CanESM2, CSIRO-Mk3-6-0, GISS-E2-H, GISS-E2-R) produce much larger dust emissions with emission fluxes higher than 10 g m−2 yr−1 in a large part of the region. In North America which also has some dust sources (Prospero et al., 2002; Ginoux et al., 2012; Wu et al., 2018b), five models (MIROC4h, MIROC-ESM, MIROC-ESM-CHEM, MRI-CGCM3, MRI-ESM1) simulate little dust emissions, while four models (ACCESS1-0, HadGEM2-CC, HadGEM2-ES, CanESM2) simulate dust emission fluxes exceeding 5 g m−2 yr−1 in a large part of the region. Note that ACCESS1-0 and CanESM2 also produce dust emissions in the high latitudes of the Northern Hemisphere (>60∘ N) and the eastern part of South America. The importance of high-latitude dust has been recognized recently (Bullard et al., 2016), but the eastern part of South America has not been regarded as a potential dust source (Formenti et al., 2011; Shao, 2008).
4.2.2 Contributions from nine sources
The contributions of dust emissions in nine different regions to global dust emission is summarized in Table 4. The total amount of dust emission in North Africa and East Asia has been presented in Evan et al. (2014) and Wu et al. (2018a), respectively. Here we show the results for all the nine regions on the globe and their comparison. The models consistently simulate the largest dust emission in North Africa, which accounts for 36 %–79 % of the global total dust emission. This is consistent with previous model intercomparison of AeroCom (Huneeus et al., 2011). The models also estimate large dust emissions in the Middle East and East Asia, which account for 7 %–20 % and 4 %–19 % of global dust emission, respectively. The contributions from Central Asia and South Asia in CMIP5 models range from 1 % to 14 % and 0.9 % to 10 %, respectively. The contributions from other sources (North America, southern Africa, Australia, South America) are much less consistent among the models, and the largest differences are in North America (0.008 %–4.5 %) and Australia (0.02 %–28 %) by 3 orders of magnitude. The large scatter of CMIP5 results in North America and Australia is also indicated by dust optical depth, as shown in Pu and Ginoux (2018).
Table 4Dust emission amount (Tg) in nine dust source regions. The contribution of each source region to global total dust emission is given in the parentheses next to the dust emission amount.
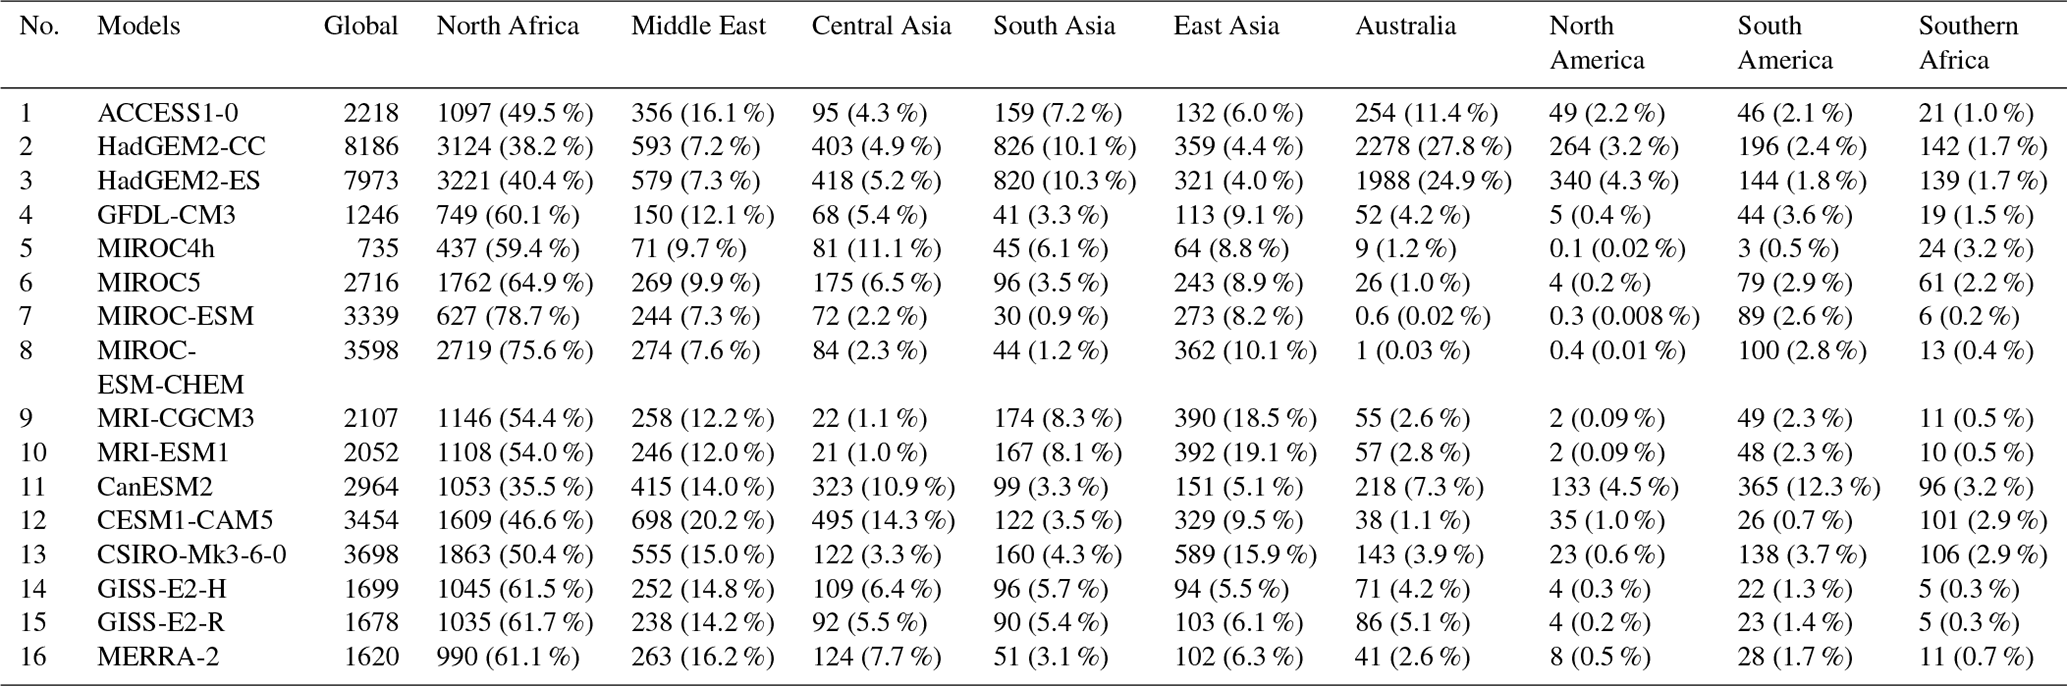
In particular, HadGEM2-CC and HadGEM2-ES simulate 25 %–28 % of global dust emission from Australia, which is comparable to that from the sum of all Asian sources (Middle East, Central Asia, South Asia, and East Asia). This estimate is unrealistically high, as will be indicated by the comparison of surface dust concentrations in Sect. 4.4. The excessive dust emission in Australia from HadGEM2-CC and HadGEM2-ES is mainly ascribed to the excessive bare-soil fraction simulated by HadGEM2-CC and HadGEM2-ES, as indicated by its comparison with International Geosphere-Biosphere Programme (IGBP) data used in ACCESS1-0 (Fig. 4a–c). The overestimation of the bare-soil fraction in HadGEM2-ES is also illustrated in Collins et al. (2011). In fact, the ACCESS1-0 model that uses a similar dust emission parameterization but with the prescribed vegetation from IGBP simulates a much lower dust emission than HadGEM2-CC and HadGEM2-ES. Compared to ACCESS1.0, HadGEM2-CC and HadGEM2-ES simulate larger surface wind speed and slightly lower soil moisture in Australia (Fig. 4d–i), which can also partly explain the larger dust emission in these two models.
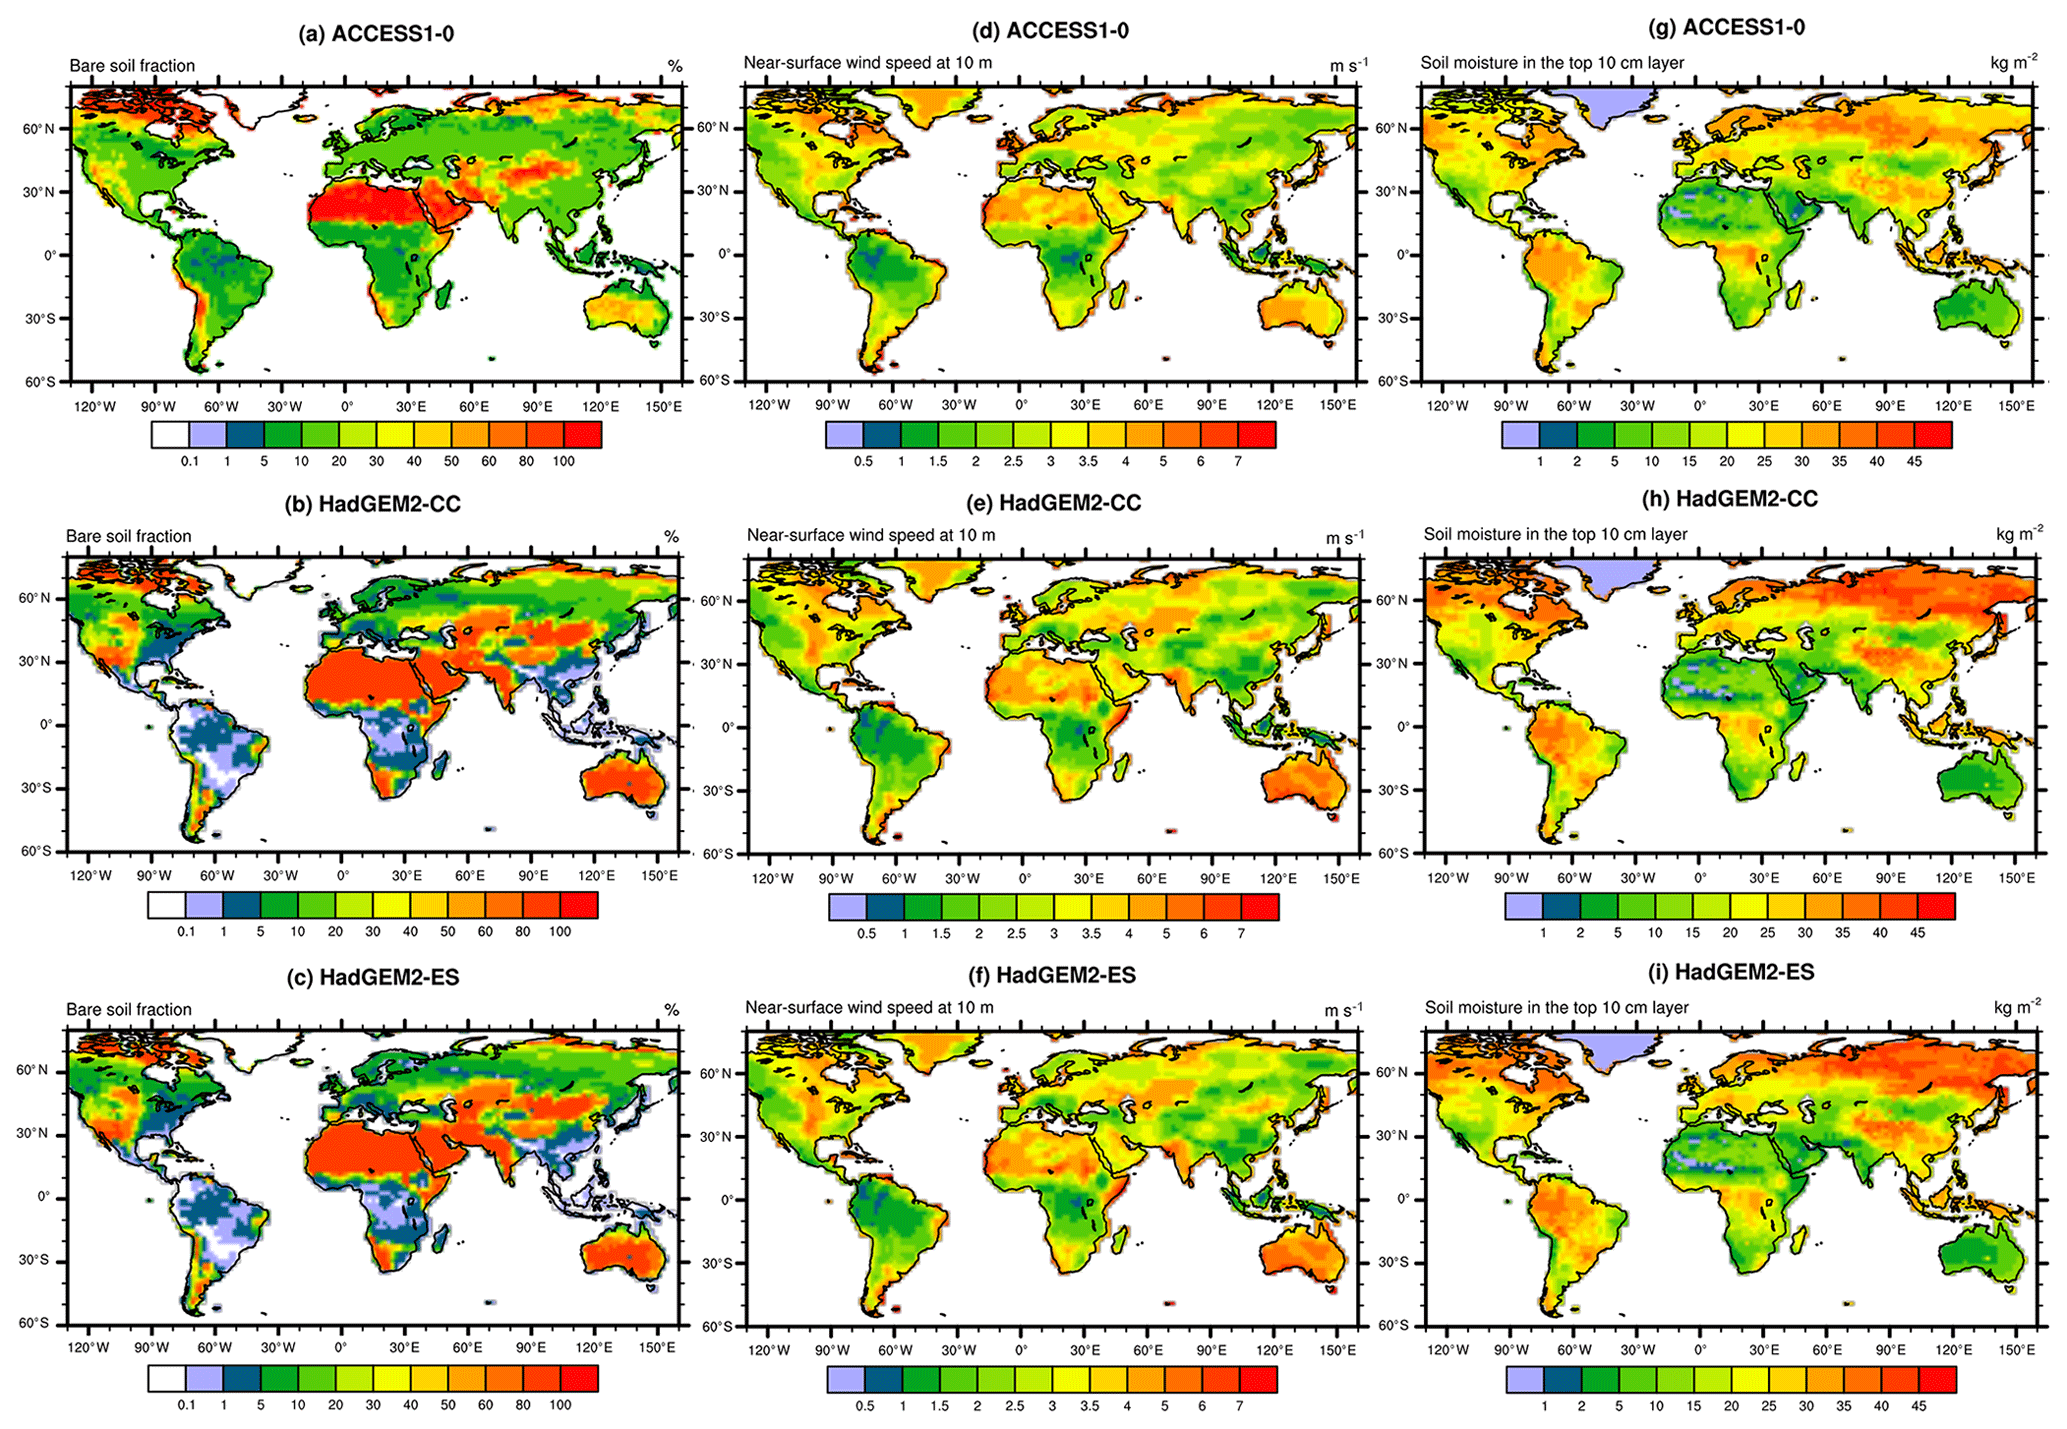
Figure 4Bare-soil fraction (%), near-surface wind speed at 10 m over land (m s−1), and soil moisture in the top 10 cm layer (kg m−2) in ACCESS1-0, HadGEM2-CC, and HadGEM2-ES. Note that except for the bare-soil fraction in ACCESS1-0, which is prescribed and set constant for each year, the other results are all from model simulations during 1960–2005.
The lowest dust emission in Australia is simulated by MIROC-ESM and MIROC-ESM-CHEM, which contribute only 0.02 %–0.03 % (1 Tg yr−1 or less) to the total dust emission. This estimate is unrealistically low as Australia is an important dust source (e.g. Shao et al., 2007) and is also much smaller than previous studies (e.g. Huneeus et al., 2011). The low dust emission in Australia from MIROC-ESM and MIROC-ESM-CHEM is related to the prognostic vegetation used for dust emission. As shown in Fig. 5a–d, MIROC-ESM and MIROC-ESM-CHEM simulate a much larger leaf area index compared to the two other MIROC family models (MIROC4h and MIROC5). With a smaller leaf area index, MIROC4h and MIROC5 simulate significantly higher dust emissions (∼1 % of total dust emission).
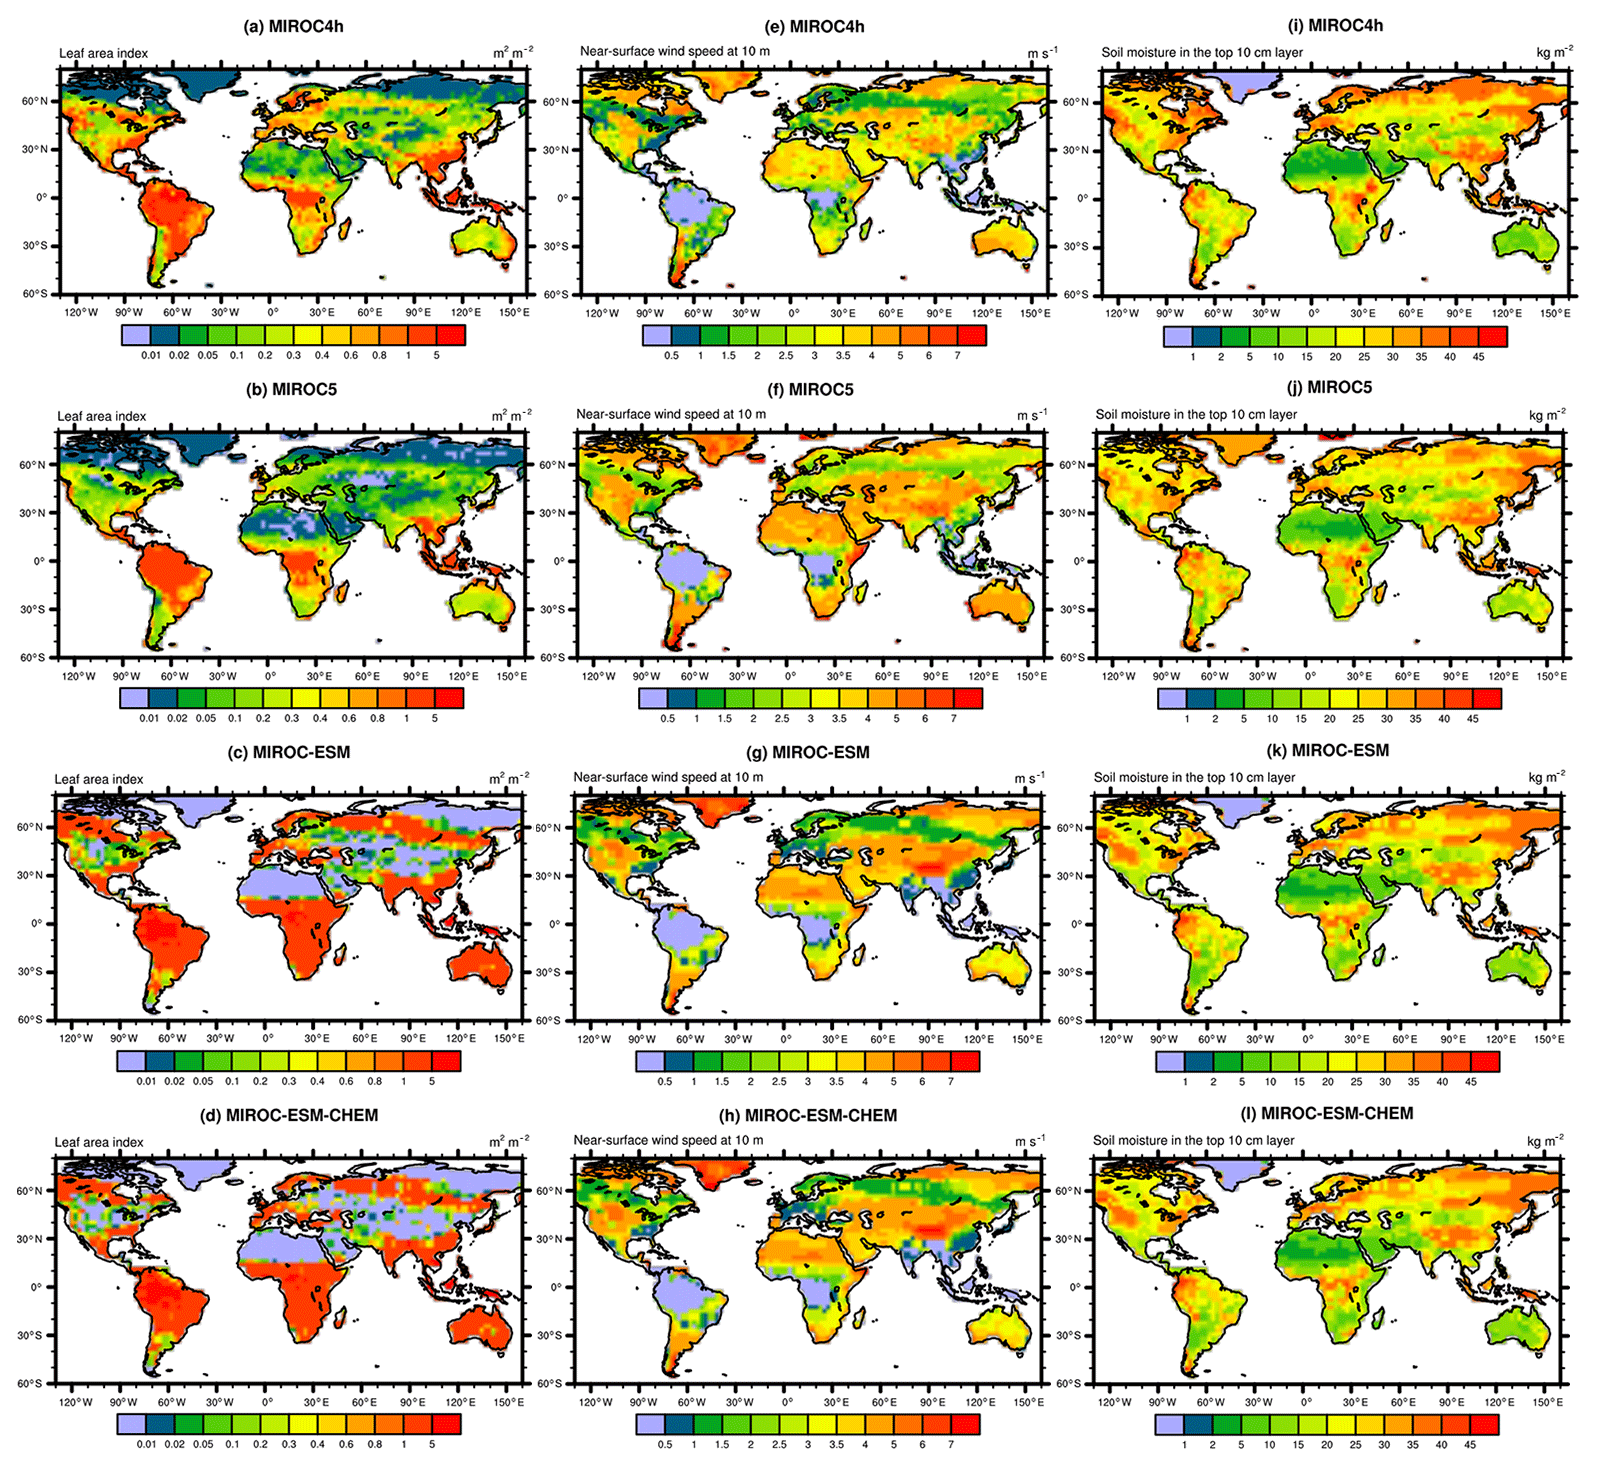
Figure 5Minimum leaf area index of a calendar year (m2 m−2), annual mean surface wind speed at 10 m (m s−1), and mean soil moisture in the top 10 cm layer (kg m−2) during 1960–2005 in four MIROC family models. For each grid box, the monthly mean leaf area index for each month of a calendar year is first derived based on the average of 1960–2005, and then the minimum of the leaf area index among these months (i.e. January to December) is plotted.
The contributions from nine source regions in MERRA-2 to the total dust emission are within the range of CMIP5 models. MERRA-2 estimates are obtained through the assimilation of meteorology in model integrations and therefore uncertainties are reduced.
4.2.3 Normalized dust emission flux
Since the amount of global dust emission differs substantially among different models, the dust emission flux is further normalized by its global mean value in each model for the comparison of dust emission area and intensity (Fig. 6). Here the dust emission area is defined as the region with a normalized emission flux greater than 0.01. In Fig. 6, we also present the maximum normalized dust emission flux to illustrate the spatial heterogeneity. Among the CMIP5 models, MIROC4h and CESM-CAM5 simulate the smallest dust emission area, which is 2 %–3 % of the global surface area, while CanESM2 simulates the largest dust emission area (18 % of the global surface area; Fig. 6 and Table 3). The maximum normalized dust emission flux is also the largest at 3635 and 2682 in MIROC4h and CESM1-CAM5, respectively, indicating the hotspots with extremely high dust emission flux in the two models. The maximum normalized dust emission flux is generally between 100 and 300 in the other CMIP5 models and is approximately 200 in the MERRA-2 reanalysis.
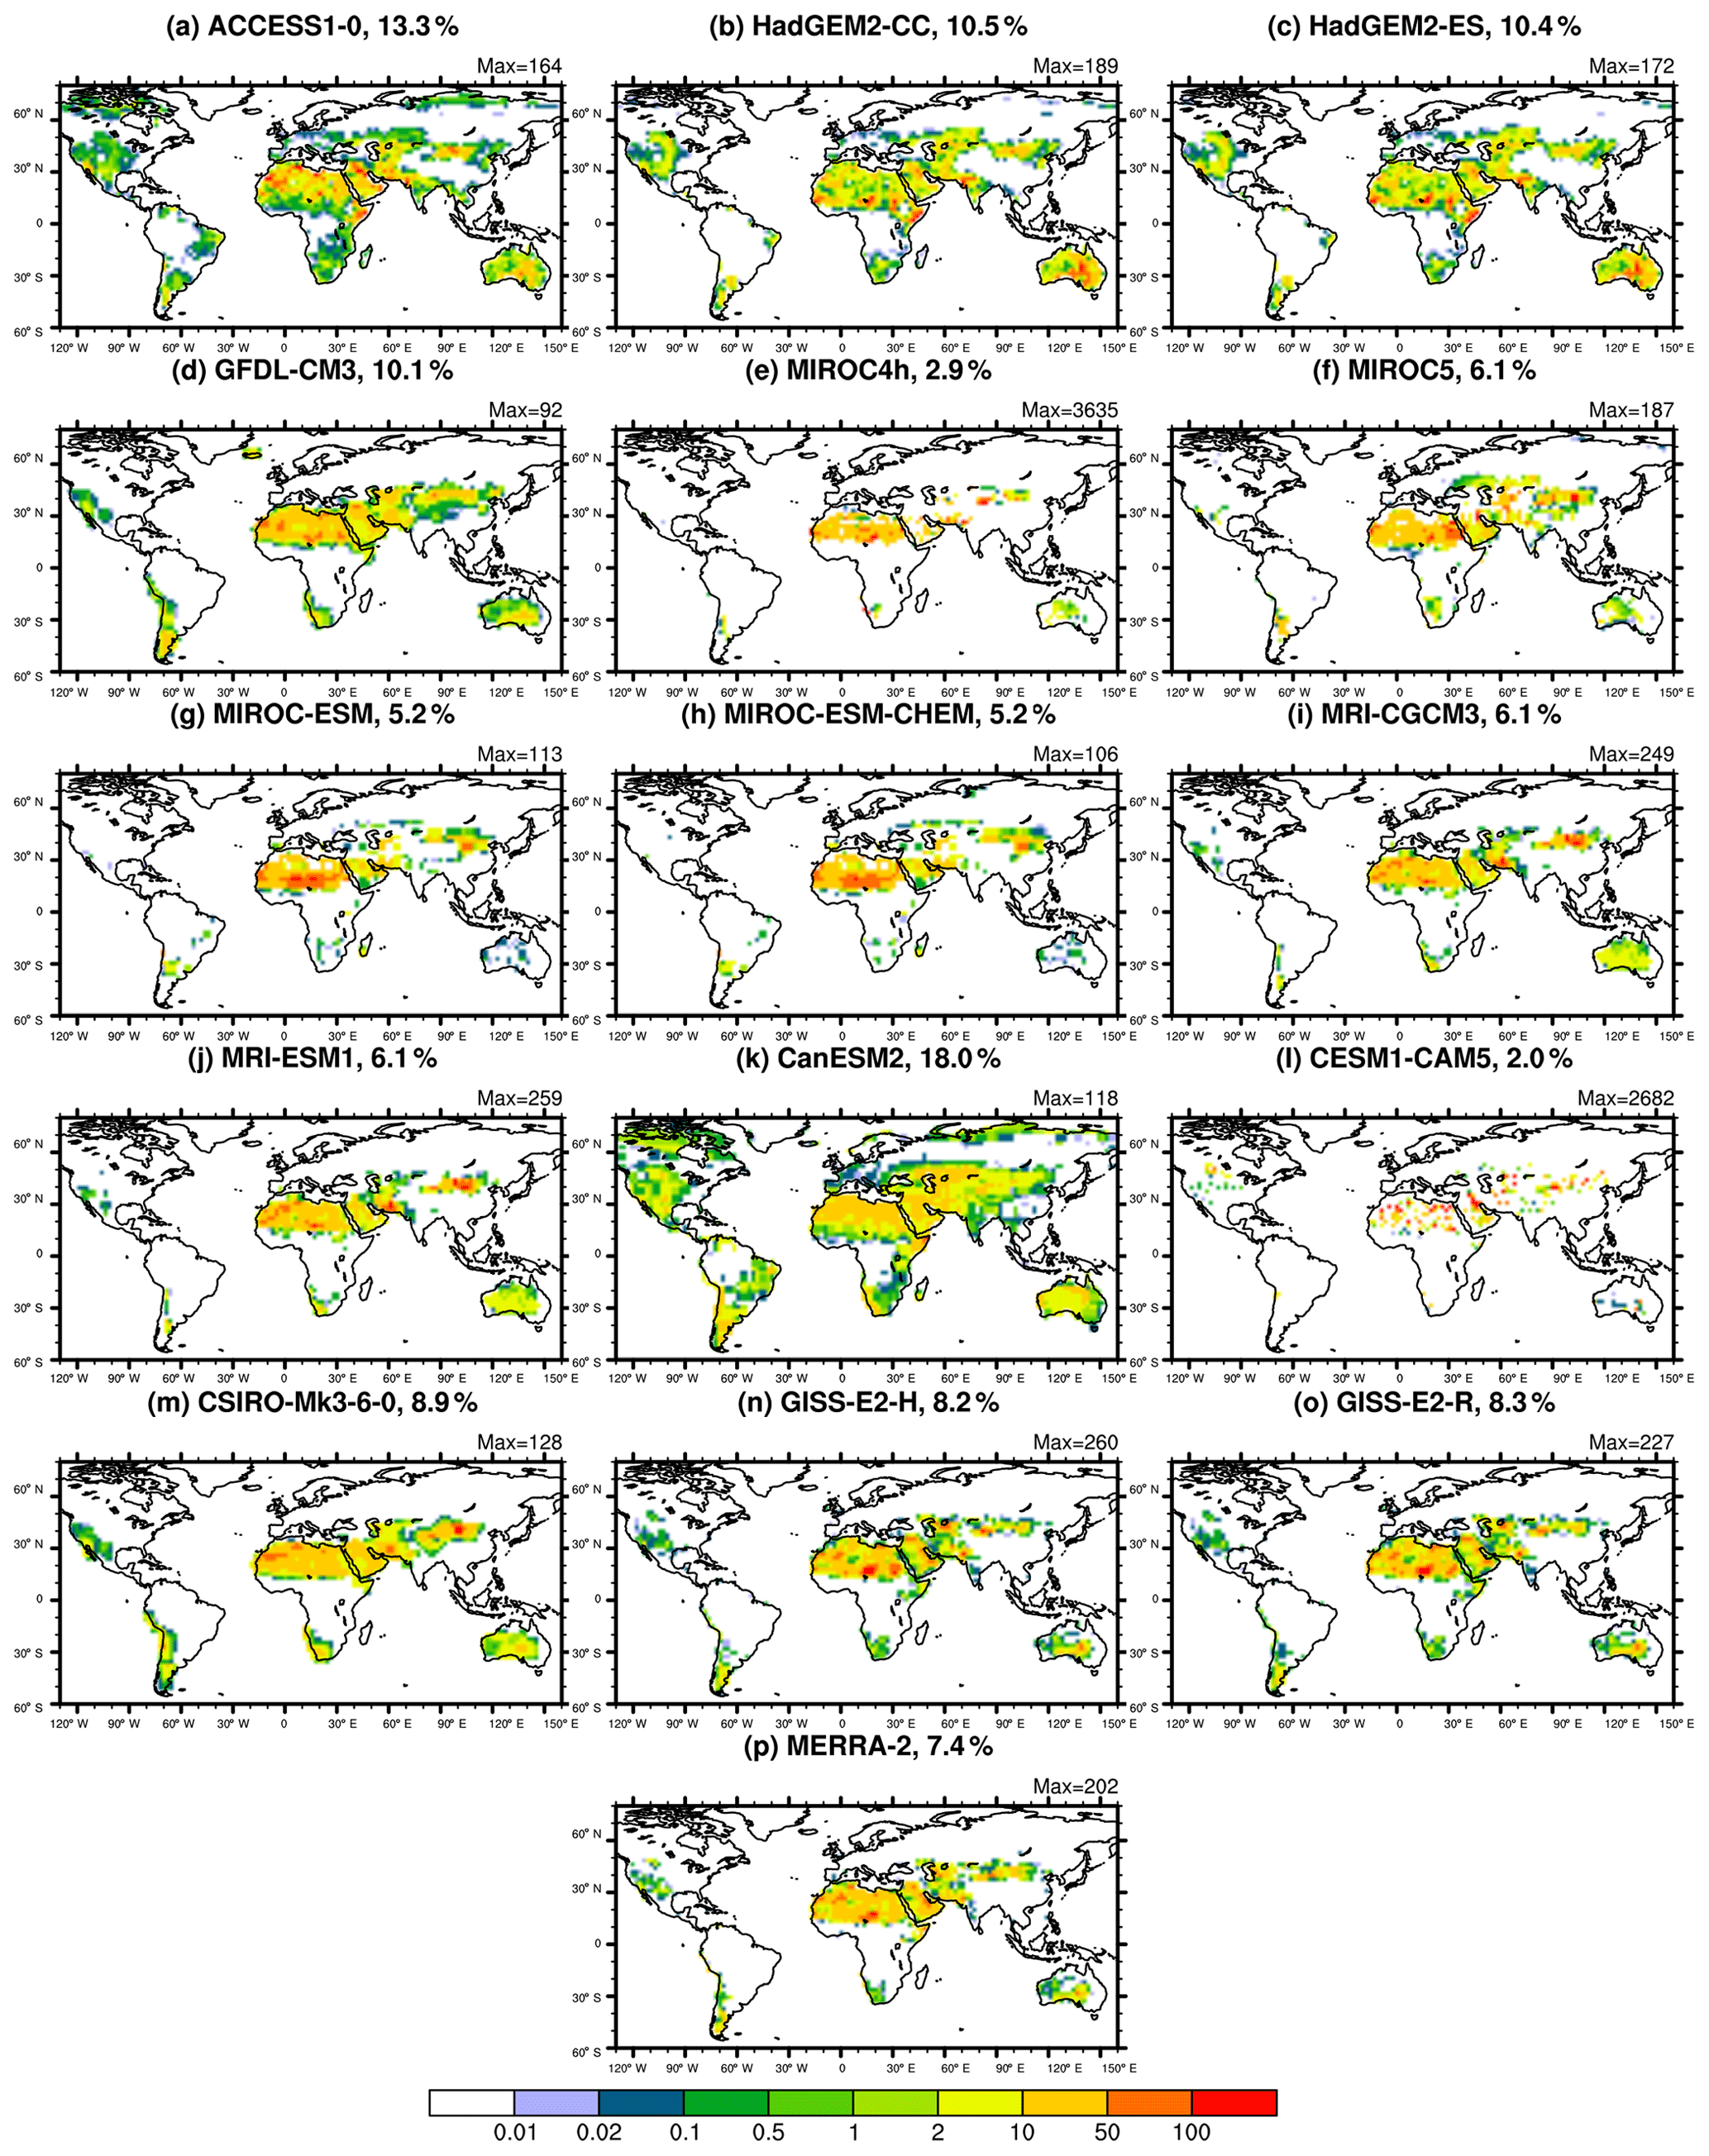
Figure 6Normalized dust emission flux in 15 CMIP5 models and the MERRA-2 reanalysis. The normalized dust emission flux is calculated from the dust emission flux divided by the global mean for each model. The percentage of dust source area relative to global total surface area is given in the title of each panel. The dust source area is defined as a normalized dust emission flux greater than 0.01. The maximum normalized dust emission flux is also given in the top right corner of each panel.
The smallest dust emission area in CESM1-CAM5 is mainly due to the fact that the model adopts a geomorphic source erodibility with its threshold of 0.1 for the dust emission occurrences (Zender et al., 2003; Wu et al., 2016). The small dust emission area in MIROC4h may be mainly due to the weaker surface winds in MIROC4h compared to the other three MIROC family models (MIROC5, MIROC-ESM, MIROC-ESM-CHEM) (Fig. 5e–h). In the dust source regions (normalized dust emission flux >0.01), the annual mean surface wind speeds are 3.7, 4.4, 4.1, and 4.1 m s−1, respectively, in MIROC4h, MIROC5, MIROC-ESM, and MIROC-ESM-CHEM. MIROC4h differs much from the other three MIROC models in both dynamic core and physical parameterizations (Watanabe et al., 2010, 2011; Sakamoto et al., 2012), which can explain the weakest surface winds in MIROC4h. In the Northern Hemisphere, MIROC4h adopts a larger leaf area index than MIROC5, which can also lead to the smaller dust emission area in MIROC4h (Fig. 5a, b). The largest dust emission area in CanESM2 may be due to its prescribed land cover map and/or adoption of gustiness adjustment for wind friction velocity (von Salzen et al., 2013). MERRA-2 gives a value of 7.4 % for the dust emission area, which is in the median of all the CMIP5 model results. Note GFDL-CM3 and CSIRO-Mk3-6.0, which adopt the same dust emission scheme and source erodibility (Sect. 2), show similar dust emission regions.
As normalized dust emission flux is comparable among the CMIP5 models, a global map of the multi-model mean and standard deviation of normalized dust emission flux is thus constructed and shown in Fig. 7. The multi-model mean represents the general consensus among the CMIP5 models, while the standard deviation indicates the variability among models. The relative standard deviation is calculated by the ratio of the standard deviation to the mean, which is shown to illustrate the uncertainty among the models. Mean normalized dust emission flux is large (>10) in the desert regions in North Africa, the Middle East, Central Asia, South Asia, East Asia, and Australia (Fig. 7a). It ranges from 1 to 10 in the desert-adjacent regions and in small regions of South America, North America, and southern Africa (Fig. 7a). The patterns of the standard deviation of multi-model results are generally similar to those of mean normalized dust emission flux (Fig. 7b). However, the relative standard deviation is quite different from the mean normalized dust emission flux, and its pattern is nearly opposite (Fig. 7c). The relative standard deviation is mostly below 1 in the aforementioned desert regions with larger mean normalized dust emission (>10), and it increases to 1–4 in other regions with relatively smaller dust emissions, indicating the large uncertainty in estimated dust emission flux in the CMIP5 models.
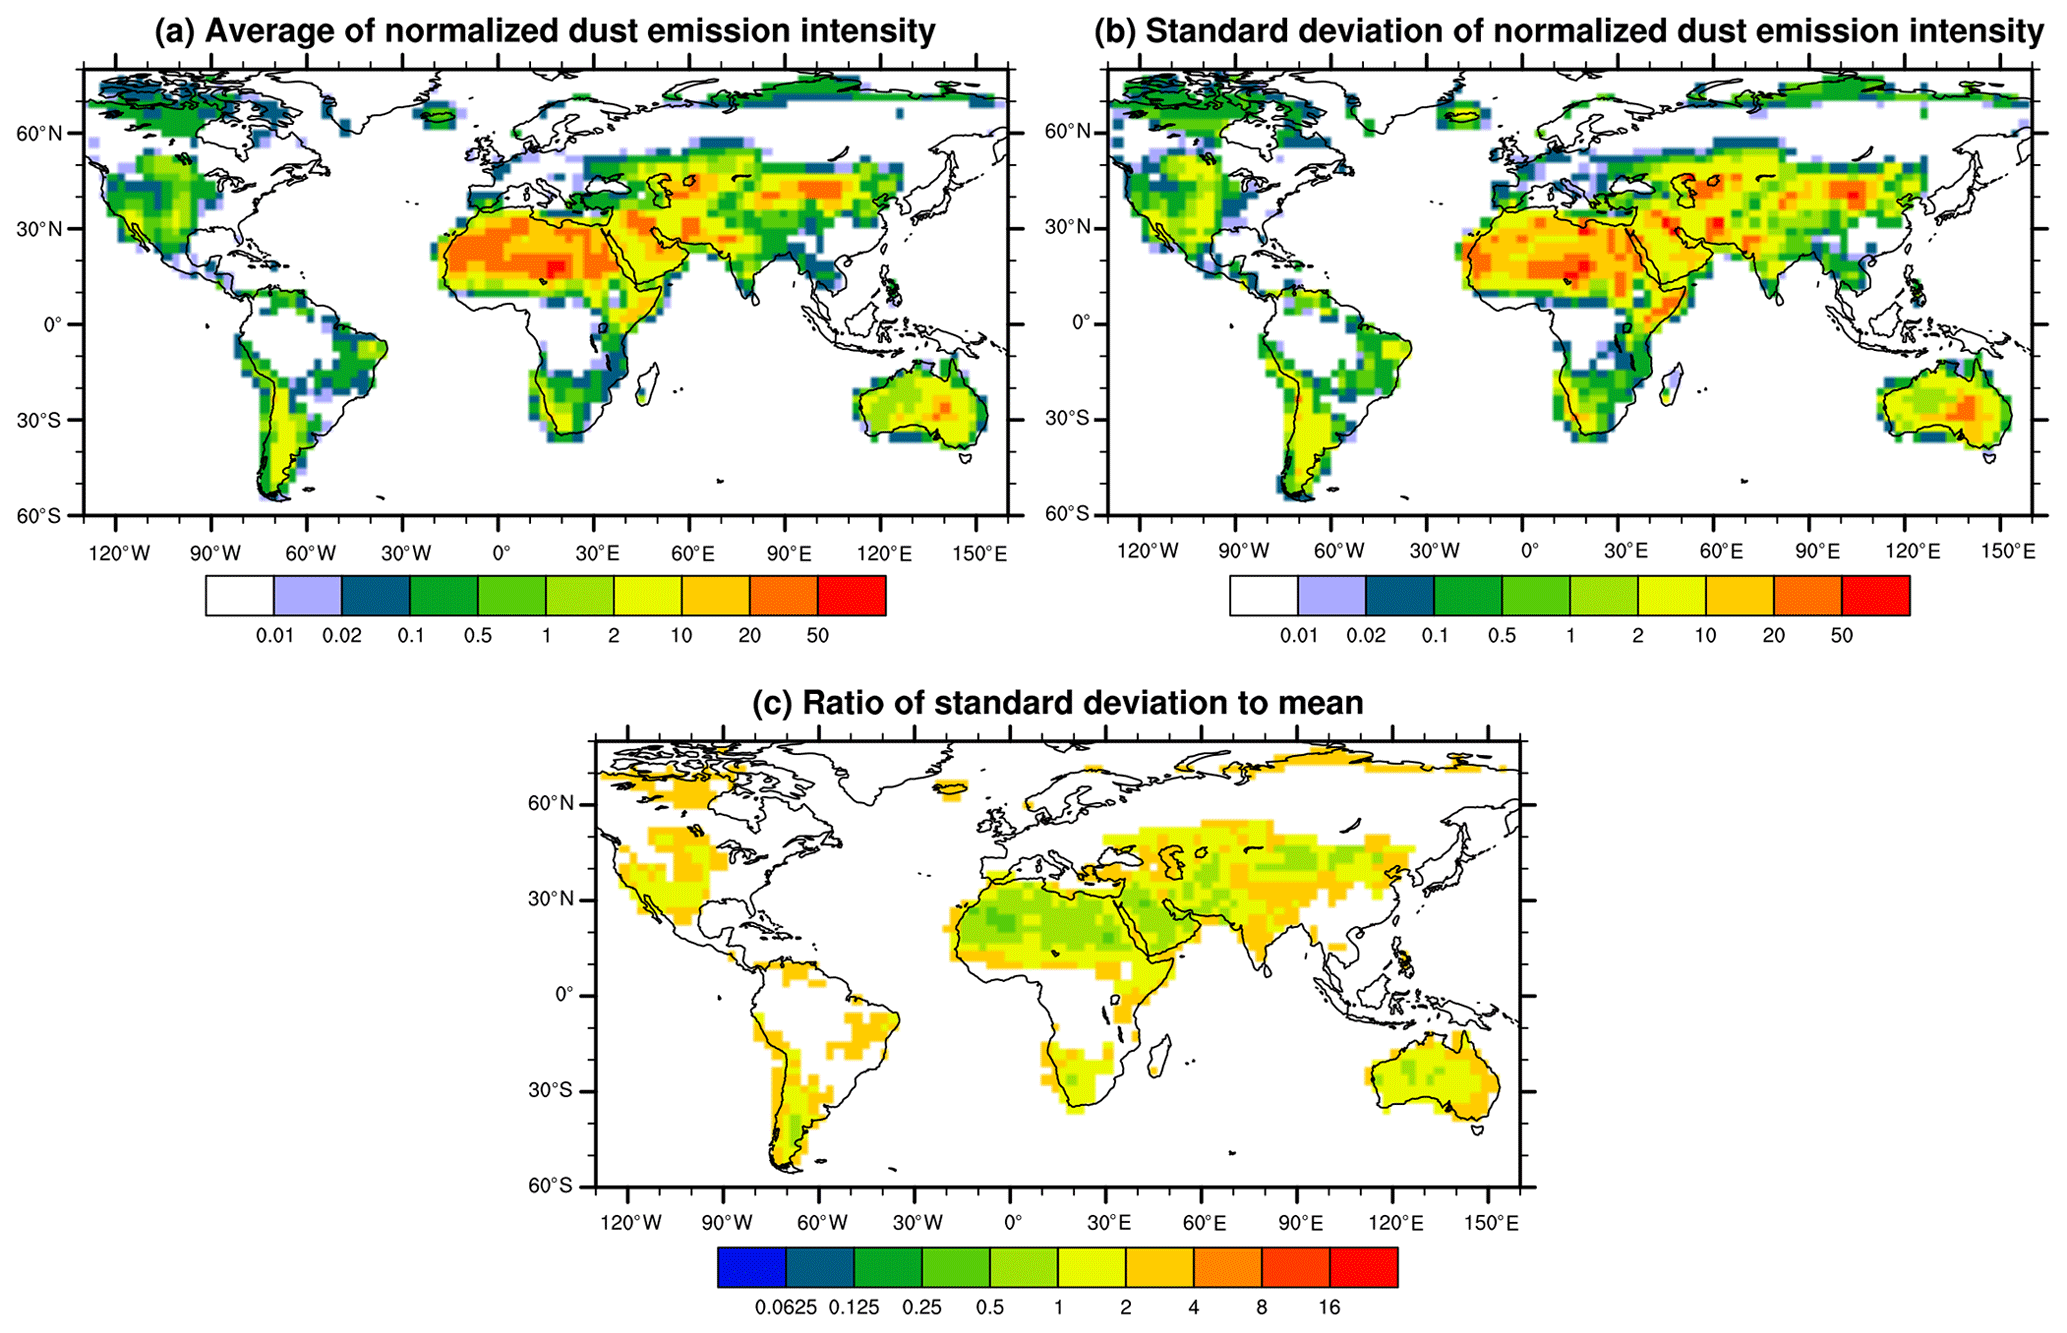
Figure 7Mean, standard deviation, and relative standard deviation (also known as coefficient of variation) of the normalized dust emission flux from 15 CMIP5 models. The relative standard deviation is derived by calculating the ratio of the standard deviation to the mean.
The difference in dust emission uncertainty in different regions can be explained by two factors. First, in the deserts, soil is extremely dry (below the criteria for dust emission) and the surface is covered with little vegetation. In these regions, the models agree with each other more easily in simulating the occurrence of dust emission. In the regions adjacent to the deserts or with localized sandy lands, where soil is wetter and there is more vegetation cover at the surface, the models differ significantly in the parameterizations of dust emission, treatment of land cover, and simulated meteorology, and thus climate models differ in their estimation of dust emission more strongly. Second, there is a larger variety of complexities in the CMIP5 models compared to the models participating in the AeroCom intercomparison (Sect. 2). Some models use the dynamic vegetation for dust emission (e.g. HadGEM2-CC, HadGEM2-ES, MIROC-ESM, MIROC-ESM-CHEM) and deviate greatly from other models over the regions with sparse vegetation cover such as Australia. This further increases the differences in dust emission among the CMIP5 models.
4.3 Dust deposition flux
Dust deposition is a vital process in the dust cycle which removes dust particles from the atmosphere and provides nutrients to the terrestrial and marine ecosystems. Figure 8 shows the comparison of dust deposition flux at 84 selected stations between the models and observations. Only seven CMIP5 models provide total dust deposition flux (sum of dry and wet deposition), which is used here. The global dust emission in these seven models ranges from 1600 to 3500 Tg yr−1, which is at the medium level of all the CMIP5 models. The observed annual mean dust deposition flux ranges from 10−4 to 103 g m−2 yr−1, indicating large spatial variabilities of dust deposition. In general, six of seven CMIP5 models (excluding ACCESS1-0) reproduce the observed dust deposition flux within a factor of 10 in most regions except over the Southern Ocean, Antarctica, and the Pacific. Over the Southern Ocean and in Antarctica, all the models except CESM1-CAM5 overestimate the dust deposition flux by more than a factor of 10 at two stations. Over the Pacific Ocean, all the models except CanESM2 underestimate the dust deposition flux by more than 10 times at several stations. In addition to the overestimation over the Southern Ocean and Antarctica and the underestimation over the Pacific Ocean, ACCESS1-0 mostly underestimates the dust deposition flux in other regions with an underestimation by more than a factor of 10 at several stations. Overall ACCESS1-0 underestimates the dust deposition flux by approximately a factor of 2 on average.
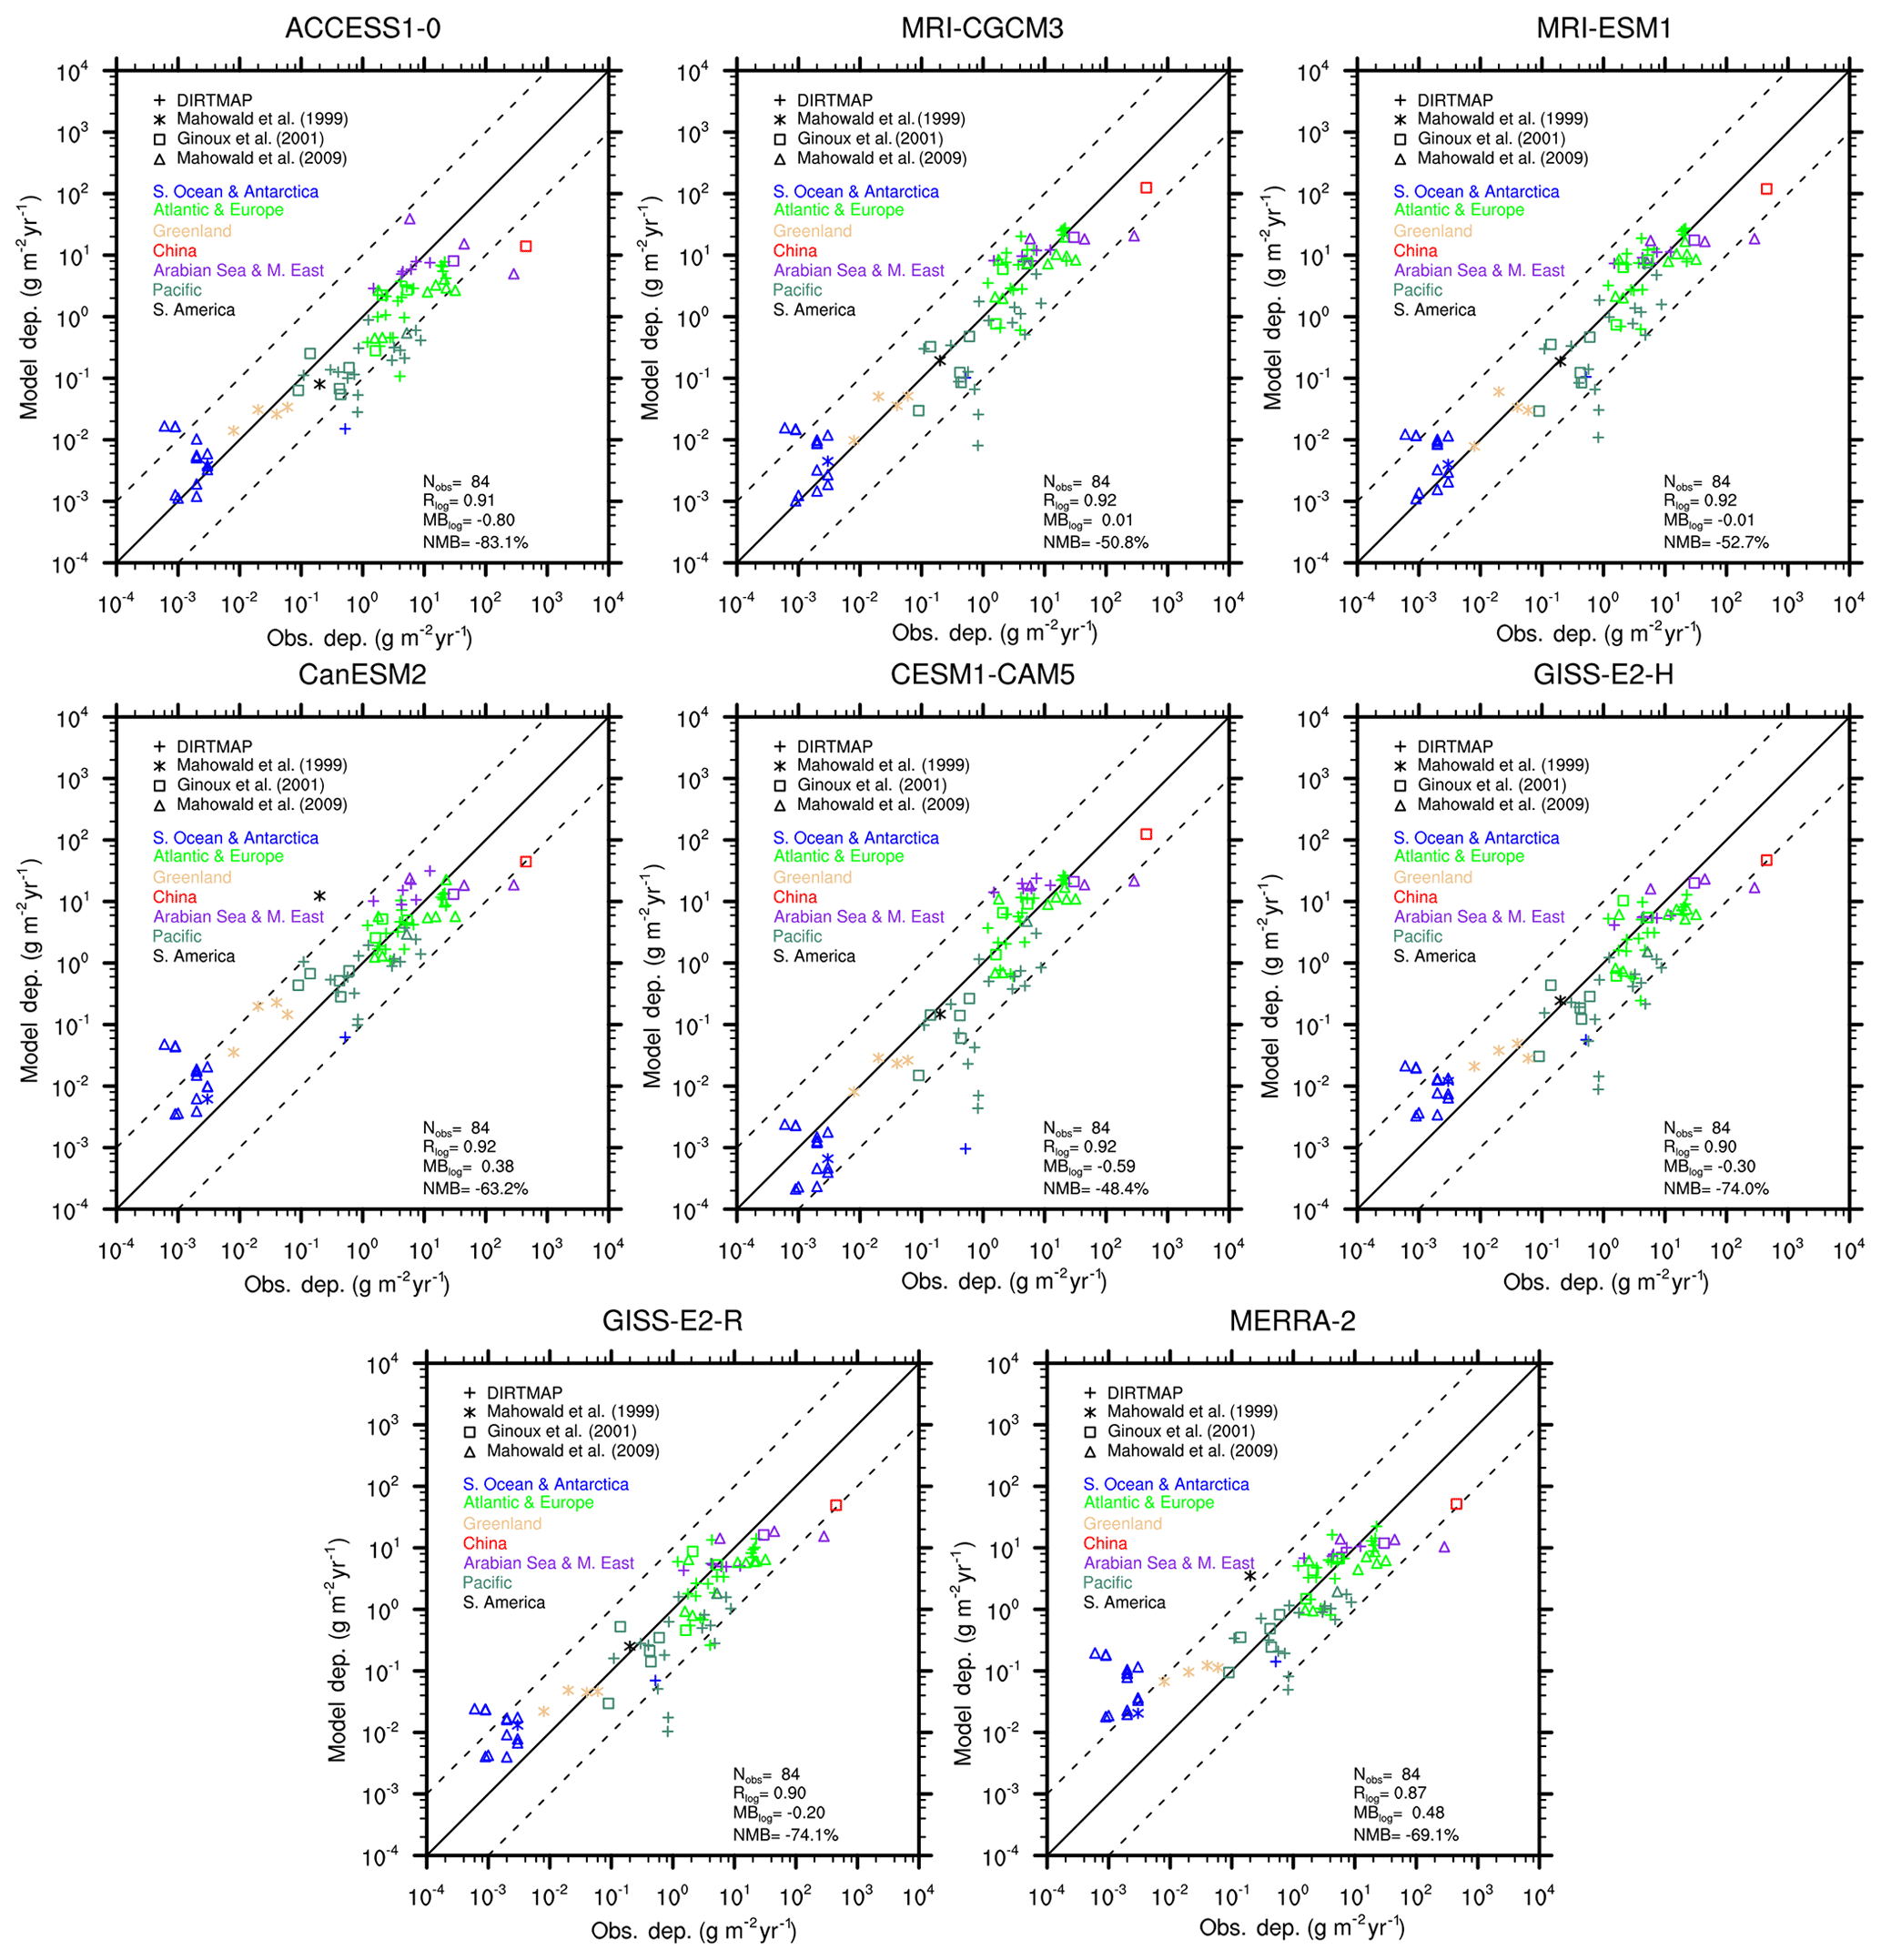
Figure 8Scatter plot of dust deposition flux at 84 selected stations between models and observations. The stations are marked with different styles according to the sources of data and with different colours for different locations (Sect. 3.1). Also given are the correlation coefficients and mean bias between models and observations (after taking the logarithms; Rlog and MBlog, respectively). The normalized mean bias (NMB) that is calculated from the mean bias divided by mean observations is given as well. The 1:1 (solid) and (dashed) lines are plotted for reference.
Similar to most of the CMIP5 models, MERRA-2 reproduces the observed dust deposition flux within a factor of 10 at most stations except over the Southern Ocean and Antarctica. Over the Southern Ocean and Antarctica, MERRA-2 tends to overestimate the dust deposition flux by more than a factor of 10 at most stations. Compared to the CMIP5 models, larger dust deposition over the Southern Ocean and Antarctica in MERRA-2 may be related to the adoption of both meteorology and aerosol assimilation in MERRA-2, which affects the dust transport and deposition. As mentioned in Sect. 2, only AOD is taken into account in the aerosol assimilation for MERRA-2. Therefore the large discrepancy in dust deposition at several stations in MERRA-2 may result from the unrealistic representation of dust vertical profiles, size distribution, and deposition process. Overall, the correlation coefficients between CMIP5 models and observations (after taking the logarithms of both them; Rlog) range from 0.90 to 0.92 and are slightly higher than that of MERRA-2 (0.87). The model biases may result from an inaccurate representation of underlying model processes such as dust emission, transport, and deposition. The biases may also be partly explained by the inconsistency between the observations and simulations, especially for those observations which were made over a relatively short-term period (1 to several years), as mentioned in Sect. 3.1.
The dust cycle can deliver nutrients from continents to oceans. Table 5 summarizes the dust deposition and fraction of wet deposition onto the global surface, continents, and oceans in seven CMIP5 models and the MERRA-2 reanalysis. Total deposition onto continents ranges from 1331 to 2850 Tg yr−1 in seven CMIP5 models and accounts for 77 %–91 % of global total deposition. Total deposition in all the oceans ranges from 197 to 686 Tg yr−1 and accounts for 9 %–23 % of global total deposition, indicating a considerable uncertainty in dust deposition, which should be taken into account in modelling the marine biogeochemistry with ESMs. It is interesting to mention that if ACCESS1-0, with the largest dust particle size range (0.06–63 µm in diameter) and the largest fraction (91 %) for continental deposition, is excluded, the other six models simulate quite similar fractions of continental deposition (78 %–83 %). MERRA-2 estimates 71 % (29 %) of dust deposited onto continents (oceans), and this estimation is smaller (larger) than all seven CMIP5 models, indicating that MERRA-2 transports dust more efficiently to oceans. This is consistent with the comparison of dust deposition flux shown in Fig. 8 and may be related to the assimilation of both meteorology and aerosols in MERRA-2. The fractions of wet deposition (with respect to total deposition) in seven CMIP5 models are 8 %–33 % and 49 %–71 % over continents and oceans, respectively. MERRA-2 estimates the fraction of wet deposition (with respect to total deposition) at 26 % and 69 % over the continents and oceans, respectively, which lies within the range of CMIP5 models.
Table 5Total dust deposition and wet deposition (Tg) in the global surface, continents, and oceans from CMIP5 models and the MERRA-2 reanalysis. Only the seven CMIP5 models with both dry and wet depositions provided are used here.
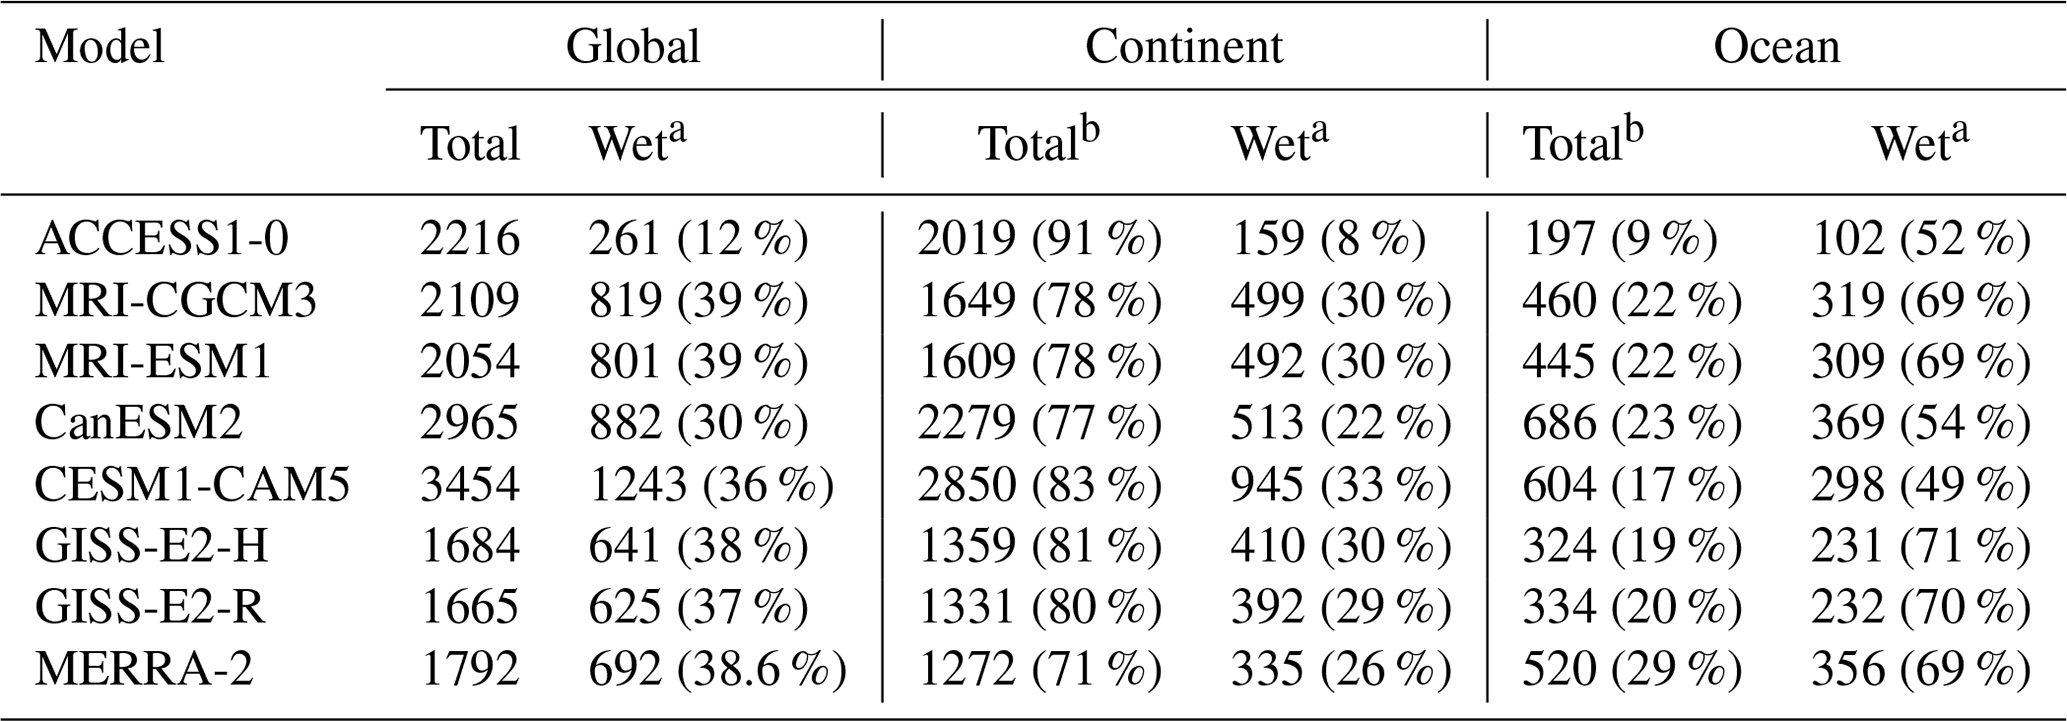
a The ratio of wet deposition to total deposition is given in parentheses next to wet deposition. b The fraction of continental (or oceanic) deposition to global deposition is given next to continental (or oceanic) deposition.
4.4 Surface dust concentration
Dust concentration is an important variable for its cycle. Figure 9 shows the comparison of surface dust concentrations between models and observations at 22 selected stations. These stations are located in the downwind regions of dust sources, and annual mean dust concentrations at these stations range from 10−1 to 102 µg m−3. In general, the models reproduce observed surface dust concentrations within a factor of 10, with the exceptions of HadGEM2-CC, HadGEM2-ES, and MIROC4h. Although HadGEM2-CC and HadGEM2-ES simulate observed surface dust concentrations at the stations over the Atlantic Ocean well (stations nos. 1–4) and slightly underestimate the observations in East Asia (stations nos. 7–8), the two models significantly overestimate surface dust concentrations at most other stations especially at the station located in Australia and downwind regions (stations nos. 15–21). This is consistent with their much higher dust emission in Australia compared to other models (Table 3; Sect. 4.2). This is also consistent with the overestimation of dust optical depth in Australia by HadGEM2-CC and HadGEM2-ES compared to satellite observations (Pu and Ginoux, 2018). In contrast, MIROC4h greatly underestimates surface dust concentrations by 1–2 orders of magnitude at most stations. Although compared to MIROC5, MIROC4h only simulates approximately 4 times lower global dust emission, MIROC4h tends to concentrate all the dust emissions over smaller regions of global surface (2.9 % compared to 6.1 %). Therefore, dust is less widely distributed in the atmosphere and a smaller fraction of dust is transported to the downwind regions in MIROC4h, as indicated by its almost 8 times smaller dust burden and only half the dust lifetime compared to MIROC5. This difference can explain lower surface dust concentrations in MIROC4h. Another reason may lie in the vertical diffusion of dust, which also determines the distance of its horizontal transport.
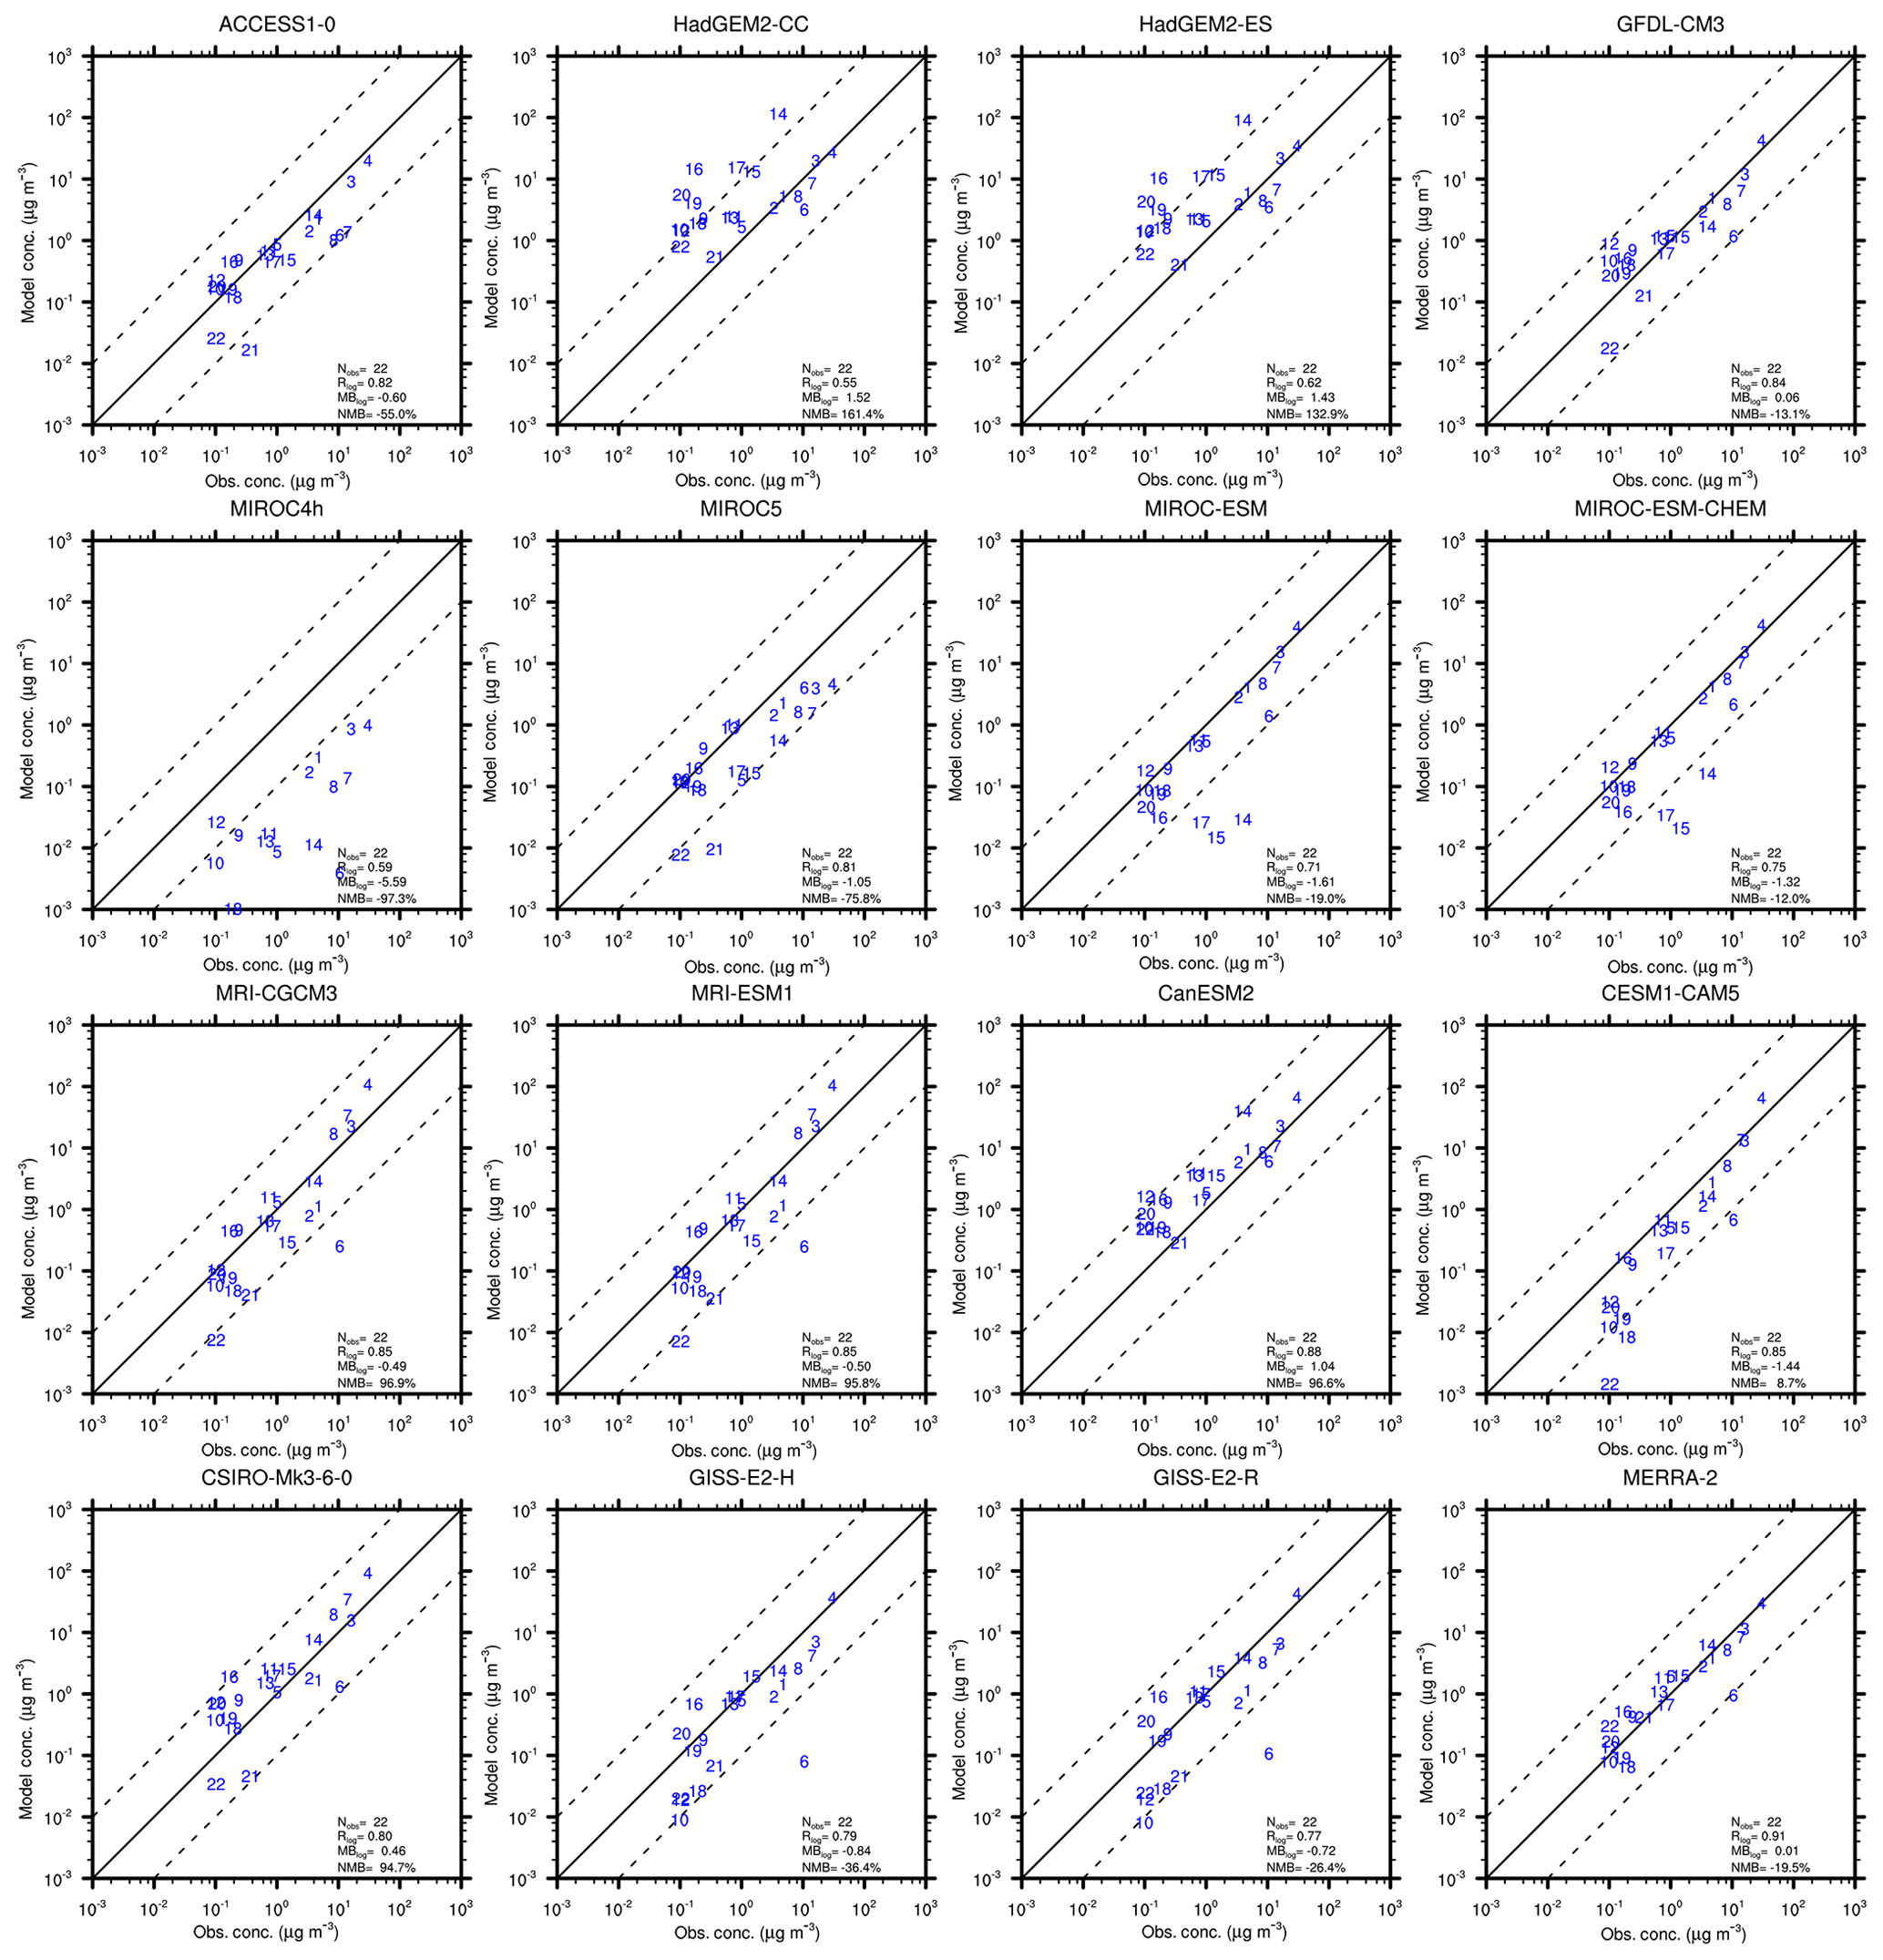
Figure 9Scatter plot of surface dust concentration at 22 selected stations between models and observations. The stations are indexed in Table 2 and their locations are shown in Fig. 1. Also given are the correlation coefficients and mean bias between models and observations (after taking the logarithms; Rlog and MBlog, respectively). The normalized mean bias (NMB) that is calculated from the mean bias divided by mean observations is given as well. The 1:1 (solid) and (dashed) lines are plotted for reference. The comparison results for some stations (nos. 15–17 and nos. 19–22 for MIROC4h; no. 21 and no. 22 for MIROC-ESM and MIROC-ESM-CHEM) are not shown as they are located too low and outside the frame.
Although the CMIP5 models (excluding HadGEM2-CC, HadGEM2-ES, and MIROC4h) can roughly reproduce the observed magnitudes of surface dust concentrations at most stations, a considerable discrepancy between models and observations can be found in certain regions. Most models except CanESM2 significantly underestimate dust concentrations at stations in Antarctica (stations no. 21 and no. 22), with the largest underestimation being more than 2 orders of magnitude in MIROC-ESM and MIROC-ESM-CHEM, which also simulate much lower dust emissions in Australia, southern Africa, and southeastern South America (Fig. 3; Sect. 4.2). Eight models (ACCESS1-0, GFDL-CM3, GISS-E2-H, GISS-E2-R, MRI-CGCM3, MRI-ESM1, CESM-CAM5, CSIRO-Mk3-6-0) greatly underestimate dust concentrations by 1–2 orders of magnitude at station no. 6 in southern Africa. Three MIROC family models (MOROC5, MOROC-ESM, MIROC-ESM-CHEM) underestimate dust concentrations by 1–2 orders of magnitude at several stations in the downwind regions of Australia (stations nos. 14, 15, and 17). Other noticeable discrepancies include underestimations in East Asia by ACCESS1-0/MIROC5, underestimations over the Tropical Pacific Ocean by CESM-CAM5/GISS-H2-H/GISS-E2-R, and overestimations in Australia by CanESM2.
Overall the correlation coefficients and mean biases between CMIP5 models and observations (after taking the logarithms of both of them; Rlog and MBlog) range from 0.55 to 0.88 and from −5.59 to 1.52 for all CMIP5 models, respectively. All the correlation coefficients are statistically significant at the 0.005 level. If HadGEM2-CC, HadGEM2-ES, and MIORC4h are excluded for the calculation, Rlog and MBlog range from 0.60 to 0.88 and from −1.61 to 1.04, respectively. As a MBlog of −0.7 (0.7) corresponds to a general underestimation (overestimation) by a factor of 2, six models (MIROC5, MIROC-ESM, MIROC-ESM-CHEM, CESM1-CAM5, GISS-E2-H, GISS-ES-R) underestimate surface dust concentrations by more than a factor of 2 on average, while CanESM2 overestimates surface dust concentrations by a similar magnitude.
Compared to observations, MERRA-2 simulates the dust concentrations at all stations well except for station no. 6 in southern Africa. This improvement by MERRA-2 compared to the CMIP5 models may be due to the inclusion of both meteorology and aerosol assimilation in MERRA-2. The correlation coefficients (Rlog) between MERRA-2 and observations are 0.91, which is larger than for all the CMIP5 models, and the mean bias (MBlog) is close to 0 (0.01).
In this study we examine the present-day global dust cycle simulated by the 15 climate models participating in the CMIP5 project. The simulations are also compared with a dataset, MERRA-2, and observations of dust deposition and concentration. The results show that the global dust emission in these models differs much: from 2218 to 8186 Tg yr−1 (size range 0.06–63 µm in diameter), from 735 to 3598 Tg yr−1 (size range 0.06–20 µm in diameter), and from 1677 to 3698 Tg yr−1 (size <16 µm in diameter). The global dust emission differs by a factor of 4–5 for dust particles in the same size range.
The simulated dust emission regions also differ greatly, accounting for a global surface area of 2.9 %–18 %. The models mostly agree with each other in reproducing the dust belt, which extends from North Africa, the Middle East, Central Asia, South Asia to East Asia, but there are large uncertainties in the extent of this dust belt and other source regions including Australia, North America, South America, and southern Africa. In particular, some models simulate little dust emissions (<0.1 % of global dust emission) in Australia and North America, while some other models simulate larger dust emissions there which account for 10 %–30 % and 3 %–4 % of global dust emission in Australia and North America, respectively. It is also revealed that the increasing complexity of ESMs (HadGEM2-CC, HadGEM2-ES, MIROC-ESM, and MIROC-ESM-CHEM) by coupling dust emission with dynamic vegetation can amplify the uncertainty associated with dust emissions.
The removal of dust particles in the CMIP5 models is mainly through dry deposition, and wet deposition only accounts for 12 %–39 % of total deposition. The associated dust lifetime is about 1.3–4.4 d. A clear linear relationship between dust burden, dust lifetime, and fraction of wet deposition to total deposition is present in the CMIP5 models, suggesting a general consistency among these models. The models also estimate that 77 %–91 % of emitted dust is deposited back onto continents and 9 %–23 % of them are deposited into the oceans. The fraction of wet deposition is smaller in most CMIP5 models, and dust lifetime is shorter compared to the MERRA-2 reanalysis, indicating a shorter distance for dust transport from its sources in most CMIP5 models. Compared to the observations, the CMIP5 models (except for MIRCO4h) reproduce dust deposition flux and surface dust concentration by a factor of 10 at most stations. Larger discrepancies are found in remote regions such as Antarctica and tropical Pacific Ocean. In Australia and downwind regions, four MIROC family models (MIROC4h, MIROC5, MIROC-ESM, MIROC-ESM-CHEM) which simulate little dust emission in Australia greatly underestimate the dust concentrations at stations in the remote regions. By contrast, HadGEM2-CC and HadGEM2-ES overestimate dust concentrations. MIROC4h shows the largest discrepancy by underestimating the surface dust concentrations by more than a factor of 100 in Australia and downwind regions. Overall, although MIROC4h simulates 4–5 times lower global dust emission than the other three MIROC family models, MIROC4h simulates on average more than 50 times smaller surface dust concentrations at 22 stations. This can be ascribed to the fact that most dust emissions in MIROC4h are concentrated over the desert centres, which limits the long-range transport of dust particles to the remote regions.
These results show large uncertainties in the global dust cycle in ESMs. In fact, these models are fully coupled atmosphere–land–ocean models and some of them also include dynamic vegetation. In several key regions such as Australia and North America, uncertainties are larger compared to those in previous models participating in the AeroCom project, where sea surface temperature is prescribed, and in some models, meteorological fields are prescribed from reanalysis (Huneeus et al., 2011). Larger uncertainties in the CMIP5 models with dynamic vegetation are expected, as a prognostic vegetation would depart from the observed or constructed vegetation and may also lead to a large bias in soil moisture, which may thus lead to an additional bias in dust emissions in these models. Uncertainties in dust simulations also vary with regions, and a smaller uncertainty is found in the deserts over the dust belt in the Northern Hemisphere, but a larger uncertainty exists in other regions including Australia and North America. The large uncertainties in the global dust cycle in the CMIP5 models would cast a doubt on the reliability of dust radiative forcing estimated in these models. Future work is therefore needed to identify the sources of these uncertainties and improve the global dust cycle in climate models.
Because dust life cycles involve various processes with scales from micrometres to tens of thousands of kilometres and consist of many parameters, the representation of the dust cycle in climate models is a big challenge for the modelling community. Dust emission is the first and foremost process for model improvements of the dust cycle (Shao, 2008; Shao et al., 2011). Improving dust emission not only lies in the development of a dust emission scheme but also in its implementation in climate models (e.g. Shao, 2008; Wu et al., 2016, 2019). For example, different dust emission schemes with specific land cover datasets and criteria for the occurrence of dust emission are adopted in the models (Table 1 and references therein). Therefore, different results of dust emission among the CMIP5 models reflect the uncertainty in many aspects of the model, including meteorology, soil moisture, land cover data, and dust emission parameterizations, as in many previous intercomparison studies (e.g. Uno et al., 2006; Textor et al., 2006; Todd et al., 2008; Huneeus et al., 2011). A close look at these factors in each model will help to unravel reasons behind the biases in these models. In addition, it is also helpful to set up more constrained experiments to separate the sensitivity of model estimates to individual factors, by varying one single factor such as the dust emission scheme (e.g. Wu and Lin, 2013) and the land surface scheme (e.g. Lin et al., 2012) or by using identical emissions (e.g. Textor et al., 2007).
In this study the models are only evaluated with observed dust deposition and surface concentrations. Some of these observations, however, were made over a relatively short period of 1 to several years and are insufficient to represent current climatology, which may partly contribute to model discrepancies (Sect. 4). It is desirable to collect a long-term dataset. Moreover, it is also desirable to collect the observations of dust emission flux and use them for model evaluation. In particular, for dust deposition and dust concentration, some biases come from dust emission and others from circulation and deposition parameterizations. It is only possible to separate the contributions of different processes to the biases in dust deposition and concentration if observations of dust emission are also included in model comparison. In addition, a dust aerosol reanalysis could serve as benchmark data to evaluate model performance. However, the current aerosol reanalysis is still not sufficient for a comprehensive evaluation of the dust cycle (Sect. 3.2). In particular, because of the limitation in dust emission, we are unable to analyse the contribution of different factors such as meteorological fields and land surface states to biases in dust emission. It is desirable that future aerosol reanalysis also includes adjoint inversion of dust emissions using more specific observations such as lidar observations, as done in Yumimoto et al. (2007).
We have compared the global dust emission and burden among the models with the same dust size range considered. It should be mentioned that dust size distribution is an important parameter for the dust cycle (e.g. Shao, 2008; Mahowald et al., 2014), and it is not included in this study as the model data are not available. The evolution of dust size distribution during dust transport and deposition is critical to our understanding of the model bias in the dust cycle. We suggest that the size-resolved dust emission, concentration, and deposition should be outputted and provided in the latest CMIP6 project (Eyring et al., 2016). Moreover, observations of size-resolved dust concentration and deposition are urgently needed. A compilation of available observations of dust size distribution (e.g. Mahowald et al., 2014: Ryder et al., 2018) is also required for model evaluation.
CMIP5 results are available through the Earth System Grid Federation (ESGF) portal (Program for Climate Model Diagnosis and Intercomparison – PCMDI: https://esgf-node.llnl.gov/search/cmip5/, last access: 15 August 2020). MERRA-2 is available at https://doi.org/10.5067/RZIK2TV7PP38 (Global Modeling and Assimilation Office, 2015a) and https://doi.org/10.5067/FH9A0MLJPC7N (Global Modeling and Assimilation Office, 2015b). Observations of dust deposition are available in the literature written by Nicolas Huneeus and coauthors (https://www.atmos-chem-phys.net/11/7781/2011/, Huneeus et al., 2011). Observations of surface dust concentrations are provided by Joseph M. Prospero from the Rosenstiel School of Marine and Atmospheric Science at the University of Miami.
CW and ZL designed the study. CW did the data analyses with advice from ZL and XL. CW wrote the paper with contributions from ZL and XL.
The authors declare that they have no conflict of interest.
We acknowledge the WCRP's Working Group on Coupled Modelling, which is responsible for CMIP, and the various climate modelling groups for producing and making available their model output. We also thank the team for generating MERRA-2 data and making them available. We also thank Joseph M. Prospero for providing the observations of surface dust concentrations and helpful discussions.
This research has been supported by the National Natural Science Foundation of China (grant nos. 41975119 and 41830966), the Chinese Academy of Sciences (CAS) Strategic Priority Research Program (grant no. XDA19030403), and the CAS Belt and Road Initiatives Program on International Cooperation (grant no. 134111KYSB20060010). Chenglai Wu is also supported by the CAS Pioneer Hundred Talents Program for Promising Youth (Class C).
This paper was edited by Ashu Dastoor and reviewed by Yaping Shao and one anonymous referee.
Adachi, Y., Yukimoto, S., Deushi, M., Obata, A., Nakano, H., Tanaka, T. Y., Hosaka, M., Sakami, T., Yoshimura, H., Hirabara, M., Shindo, E., Tsujino, H., Mizuta, R., Yabu, S., Koshiro, T., Ose, T., and Kitoh, A.: Basic performance of a new earth system model of the Meteorological Research Institute (MRI-ESM 1), Pap. in Meteorol. Geophys., 64, 1–19, https://doi.org/10.2467/mripapers.64.1, 2013.
Arora, V. K., Scinocca, J. F., Boer, G. J., Christian, J. R., Denman, K. L., Flato, G. M., Kharin, V. V., Lee, W. G., and Merryfield, W. J.: Carbon emission limits required to satisfy future representative concentration pathways of greenhouse gases, Geophys. Res. Lett., 38, L05805, https://doi.org/10.1029/2010GL046270, 2011.
Bell, M. L., Levy, J. K., and Lin, Z.: The effect of sandstorms and air pollution on cause-specific hospital admissions in Taipei, Taiwan, Occup. Environ. Med., 65, 104–111, https://doi.org/10.1136/oem.2006.031500, 2008.
Bellouin, N., Rae, J., Jones, A., Johnson, C., Haywood, J., and Boucher, O.: Aerosol forcing in the Climate Model Intercomparison Project (CMIP5) simulations by HadGEM2-ES and the role of ammonium nitrate, J. Geophys. Res., 116, D20206, https://doi.org/10.1029/2011JD016074, 2011.
Bi, D., Dix, M., Marsland, S., O' Farrell, S., Rashid, H., Uotila, P., Hirst, A. C., Kowalczyk, E., Golebiewski, M., Sullivan, A., Yan, H., Hannah, N., Franklin, C., Sun, Z., Vohralik, P., Watterson, I., Zhou, X., Fiedler, R., Collier, M., Ma, Y., Noonan, J., Stevens, L., Uhe, P., Zhu, H., Griffies, S. M., Hill, R., Harris, C., and Puri, K.: The ACCESS Coupled Model: Description, control climate and evaluation, Aust. Meteorol. Ocean, 63, 41–64, https://doi.org/10.22499/2.6301.004, 2013.
Boucher, O., Randall, D., Artaxo, P., Bretherton, C., Feingold, G., Forster, P., Kerminen, V.-M., Kondo, Y., Liao, H., and Lohmann, U.: Clouds and aerosols, in: Climate change 2013: the physical science basis. Contribution of Working Group I to the Fifth Assessment Report of the Intergovernmental Panel on Climate Change, edited by: Stocker, T. F., Qin, D., Plattner, G.-K., Tignor, M., Allen, S. K., Boschung, J., Nauels, A., Xia, Y., Bex, V., and Midgley, P. M., Cambridge University Press, Cambridge, UK, 571–657, 2013.
Buchard, V., Randles, C. A., da Silva, A. M., Darmenov, A., Colarco, P. R., Govindaraju, R., Ferrare, R., Hair, J., Beyersdorf, A. J., Ziemba, L. D., and Yu, H.: The MERRA-2 Aerosol Reanalysis, 1980 Onward. Part II: Evaluation and Case Studies, J. Climate, 30, 6851–6872, https://doi.org/10.1175/JCLI-D-16-0613.1, 2017.
Bullard, J. E., Baddock, M., Bradwell, T., Crusius, J., Darlington, E., Gaiero, D., Gassó, S., Gisladottir, G., Hodgkins, R., McCulloch, R., McKenna-Neuman, C., Mockford, T., Stewart, H., and Thorsteinsson, T.: High-latitude dust in the Earth system, Rev. Geophys., 54, 447–485, https://doi.org/10.1002/2016RG000518, 2016.
Cakmur, R. V., Miller, R. L., Perlwitz, J., Geogdzhayev, I. V., Ginoux, P., Koch, D., Kohfeld, K. E., Tegen, I., and Zender, C. S.: Constraining the magnitude of the global dust cycle by minimizing the difference between a model and observations, J. Geophys. Res., 111, D06207, https://doi.org/10.1029/2005JD005791, 2006.
Collins, W. J., Bellouin, N., Doutriaux-Boucher, M., Gedney, N., Halloran, P., Hinton, T., Hughes, J., Jones, C. D., Joshi, M., Liddicoat, S., Martin, G., O'Connor, F., Rae, J., Senior, C., Sitch, S., Totterdell, I., Wiltshire, A., and Woodward, S.: Development and evaluation of an Earth-System model – HadGEM2, Geosci. Model Dev., 4, 1051–1075, https://doi.org/10.5194/gmd-4-1051-2011, 2011.
Delworth, T. L., Broccoli, A. J., Rosati, A., Stouffer, R. J., Balaji, V., Beesley, J. A., Cooke, W. F., Dixon, K. W., Dunne, J., Dunne, K. A., Durachta, J. W., Findell, K. L., Ginoux, P., Gnanadesikan, A., Gordon, C. T., Griffies, S. M., Gudgel, R., Harrison, M. J., Held, I. M., Hemler, R. S., Horowitz, L. W., Klein, S. A., Knutson, T. R., Kushner, P. J., Langenhorst, A. R., Lee, H.-C., Lin, S.-J., Lu, J., Malyshev, S. L., Milly, P. C. D., Ramaswamy, V., Russell, J., Schwarzkopf, M. D., Shevliakova, E., Sirutis, J. J., Spelman, M. J., Stern, W. F., Winton, M., Wittenberg, A. T., Wyman, B., Zeng, F., and Zhang, R.: GFDL's CM2 Global Coupled Climate Models. Part I: Formulation and Simulation Characteristics, J. Climate, 19, 643–674, https://doi.org/10.1175/jcli3629.1, 2006.
Dix, M., Vohralik, P., Bi, D., Rashid, H., Marsland, S., O' Farrell, S., Uotila, P., Hirst, T., Kowalczyk, E., Sullivan, A., Yan, H., Franklin, C., Sun, Z., Watterson, I., Collier, M., Noonan, J., Rotstayn, L., Stevens, L., Uhe, P., and Puri, K.: The ACCESS Coupled Model: Documentation of core CMIP5 simulations and initial results. Aust. Meteorol. Ocean, 63, 83–99, https://doi.org/10.22499/2.6301.005, 2013.
Donner, L. J., Wyman, B. L., Hemler, R. S., Horowitz, L. W., Ming, Y., Zhao, M., Golaz, J.-C., Ginoux, P., Lin, S.-J., Schwarzkopf, M. D., Austin, J., Alaka, G., Cooke, W. F., Delworth, T. L., Freidenreich, S. M., Gordon, C. T., Griffies, S. M., Held, I. M., Hurlin, W. J., Klein, S. A., Knutson, T. R., Langenhorst, A. R., Lee, H.-C., Lin, Y., Magi, B. I., Malyshev, S. L., Milly, P. C. D., Naik, V., Nath, M. J., Pincus, R., Ploshay, J. J., Ramaswamy, V., Seman, C. J., Shevliakova, E., Sirutis, J. J., Stern, W. F., Stouffer, R. J., Wilson, R. J., Winton, M., Wittenberg, A. T., and Zeng, F.: The Dynamical Core, Physical Parameterizations, and Basic Simulation Characteristics of the Atmospheric Component AM3 of the GFDL Global Coupled Model CM3, J. Climate, 24, 3484–3519, https://doi.org/10.1175/2011jcli3955.1, 2011.
Evan, A. T., Flamant, C., Fiedler, S., and Doherty, O.: An analysis of aeolian dust in climate models, Geophys. Res. Lett., 41, 5996–6001, https://doi.org/10.1002/2014GL060545, 2014.
Eyring, V., Bony, S., Meehl, G. A., Senior, C. A., Stevens, B., Stouffer, R. J., and Taylor, K. E.: Overview of the Coupled Model Intercomparison Project Phase 6 (CMIP6) experimental design and organization, Geosci. Model Dev., 9, 1937–1958, https://doi.org/10.5194/gmd-9-1937-2016, 2016.
Flato, G., Marotzke, J., Abiodun, B., Braconnot, P., Chou, S.C., Collins, W., Cox, P., Driouech, F., Emori, S., Eyring, V., Forest, C., Gleckler, P., Guilyardi, E., Jakob, C., Kattsov, V., Reason, C., and Rummukainen, M.: Evaluation of Climate Models, in: Climate Change 2013: The Physical Science Basis. Contribution of Working Group I to the Fifth Assessment Report of the Intergovernmental Panel on Climate Change, edited by: Stocker, T. F., Qin, D., Plattner, G.-K., Tignor, M., Allen, S. K., Boschung, J., Nauels, A., Xia, Y., Bex, V. and Midgley, P. M., Cambridge University Press, Cambridge, UK, 741–866, 2013.
Formenti, P., Schütz, L., Balkanski, Y., Desboeufs, K., Ebert, M., Kandler, K., Petzold, A., Scheuvens, D., Weinbruch, S., and Zhang, D.: Recent progress in understanding physical and chemical properties of African and Asian mineral dust, Atmos. Chem. Phys., 11, 8231–8256, https://doi.org/10.5194/acp-11-8231-2011, 2011.
Forster, P., Ramaswamy, V., Artaxo, P., Berntsen, T., Betts, R., Fahey, D. W., Haywood, J., Lean, J., Lowe, D. C., Myhre, G., Nganga, J., Prinn, R., Raga, G., Schulz, M., and Van Dorland, R., Changes in atmospheric constituents and in radiative forcing, in: Climate Change 2007: The Physical Science Basis. Contribution of Working Group I to the Fourth Assessment Report of the Intergovernmental Panel on Climate Change, edited by: Solomon, S., Qin, D., Manning, M., Chen, Z., Marquis, M., Averyt, K. B., Tignor, M., and Miller, H. L., Cambridge University Press, Cambridge, UK, 129–234, 2007.
Gelaro, R., McCarty, W., Suárez, M. J., Todling, R., Molod, A., Takacs, L., Randles, C. A., Darmenov, A., Bosilovich, M. G., Reichle, R., Wargan, K., Coy, L., Cullather, R., Draper, C., Akella, S., Buchard, V., Conaty, A., da Silva, A. M., Gu, W., Kim, G.-K., Koster, R., Lucchesi, R., Merkova, D., Nielsen, J. E., Partyka, G., Pawson, S., Putman, W., Rienecker, M., Schubert, S. D., Sienkiewicz, M., and Zhao, B.: The Modern-Era Retrospective Analysis for Research and Applications, Version 2 (MERRA-2), J. Climate, 30, 5419–5454, https://doi.org/10.1175/jcli-d-16-0758.1, 2017.
Ginoux, P., Chin, M., Tegen, I., Prospero, J. M., Holben, B., Dubovik, O., and Lin, S. J.: Sources and distributions of dust aerosols simulated with the GOCART model, J. Geophys. Res.-Atmos., 106, 20255–20273, 2001.
Ginoux, P., Prospero, J. M., Torres, O., and Chin, M.: Long-term simulation of global dust distribution with the GOCART model: correlation with North Atlantic Oscillation, Environ. Modell. Softw., 19, 113–128, https://doi.org/10.1016/S1364-8152(03)00114-2, 2004.
Ginoux, P., Prospero, J. M., Gill, T. E., Hsu, N. C., and Zhao, M.: Global-Scale Attribution of Anthropogenic and Natural Dust Sources and Their Emission Rates Based on Modis Deep Blue Aerosol Products, Rev. Geophys., 50, RG3005, https://doi.org/10.1029/2012RG000388, 2012.
Global Modeling and Assimilation Office: MERRA-2 tavgM_2d_adg_Nx: 2d, Monthly mean, Time-averaged, Single-Level, Assimilation, Aerosol Diagnostics (extended) V5.12.4, Greenbelt, MD, USA, Goddard Earth Sciences Data and Information Services Center (GES DISC), https://doi.org/10.5067/RZIK2TV7PP38, 2015a.
Global Modeling and Assimilation Office: MERRA-2 tavgM_2d_aer_Nx: 2d, Monthly mean, Time-averaged, Single-Level, Assimilation, Aerosol Diagnostics V5.12.4, Greenbelt, MD, USA, Goddard Earth Sciences Data and Information Services Center (GES DISC), https://doi.org/10.5067/FH9A0MLJPC7N, 2015b.
Huneeus, N., Schulz, M., Balkanski, Y., Griesfeller, J., Prospero, J., Kinne, S., Bauer, S., Boucher, O., Chin, M., Dentener, F., Diehl, T., Easter, R., Fillmore, D., Ghan, S., Ginoux, P., Grini, A., Horowitz, L., Koch, D., Krol, M. C., Landing, W., Liu, X., Mahowald, N., Miller, R., Morcrette, J.-J., Myhre, G., Penner, J., Perlwitz, J., Stier, P., Takemura, T., and Zender, C. S.: Global dust model intercomparison in AeroCom phase I, Atmos. Chem. Phys., 11, 7781–7816, https://doi.org/10.5194/acp-11-7781-2011, 2011.
Hurrell, J. W., Holland, M. M., Gent, P. R., Ghan, S., Kay, J. E., Kushner, P. J., Lamarque, J. F., Large, W. G., Lawrence, D., Lindsay, K., Lipscomb, W. H., Long, M. C., Mahowald, N., Marsh, D. R., Neale, R. B., Rasch, P., Vavrus, S., Vertenstein, M., Bader, D., Collins, W. D., Hack, J. J., Kiehl, J., and Marshall, S.: The Community Earth System Model: A Framework for Collaborative Research, B. Am. Meteorol. Soc., 94, 1339–1360, https://doi.org/10.1175/BAMS-D-12-00121.1, 2013.
Jickells, T. D., An, Z. S., Andersen, K. K., Baker, A. R., Bergametti, G., Brooks, N., Cao, J. J., Boyd, P. W., Duce, R. A., Hunter, K. A., Kawahata, H., Kubilay, N., laRoche, J., Liss, P. S., Mahowald, N., Prospero, J. M., Ridgwell, A. J., Tegen, I., and Torres, R.: Global Iron Connections Between Desert Dust, Ocean Biogeochemistry, and Climate, Science, 308, 67–71, https://doi.org/10.1126/science.1105959, 2005.
Kohfeld, K. E. and Harrison, S. P.: DIRTMAP: the geological record of dust, Earth-Sci. Rev., 54, 81–114, https://doi.org/10.1016/S0012-8252(01)00042-3, 2001.
Lin, Z. H., Levy, J. K., Lei, H., and Bell, M. L.: Advances in Disaster Modeling, Simulation and Visualization for Sandstorm Risk Management in North China, Remote Sens.-Basel, 4, 1337–1354, https://doi.org/10.3390/Rs4051337, 2012.
Liu, X., Easter, R. C., Ghan, S. J., Zaveri, R., Rasch, P., Shi, X., Lamarque, J.-F., Gettelman, A., Morrison, H., Vitt, F., Conley, A., Park, S., Neale, R., Hannay, C., Ekman, A. M. L., Hess, P., Mahowald, N., Collins, W., Iacono, M. J., Bretherton, C. S., Flanner, M. G., and Mitchell, D.: Toward a minimal representation of aerosols in climate models: description and evaluation in the Community Atmosphere Model CAM5, Geosci. Model Dev., 5, 709–739, https://doi.org/10.5194/gmd-5-709-2012, 2012a.
Liu, X., Shi, X., Zhang, K., Jensen, E. J., Gettelman, A., Barahona, D., Nenes, A., and Lawson, P.: Sensitivity studies of dust ice nuclei effect on cirrus clouds with the Community Atmosphere Model CAM5, Atmos. Chem. Phys., 12, 12061–12079, https://doi.org/10.5194/acp-12-12061-2012, 2012b.
Luo, C., Mahowald, N. M., and del Corral, J.: Sensitivity study of meteorological parameters on mineral aerosol mobilization, transport, and distribution, J. Geophys. Res., 108, 4447, https://doi.org/10.1029/2003JD003483, 2003.
Maenhaut, W., Fernández-Jiménez, M. T., Rajta, I., Dubtsov, S., Meixner, F. X., Andreae, M. O., Torr, S., Hargrove, J. W., Chimanga, P., and Mlambo, J.: Long-term aerosol composition measurements and source apportionment at Rukomechi, Zimbabwe, J. Aerosol Sci., 31, 228–229, https://doi.org/10.1016/S0021-8502(00)90237-4, 2000a.
Maenhaut, W., Fernández-Jiménez, M. T., Vanderzalm, J. L., Hooper, B., Hooper, M. A., and Tapper, N. J.: Aerosol composition at Jabiru, Australia, and impact of biomass burning, J. Aerosol Sci., 31, 745–746, https://doi.org/10.1016/S0021-8502(00)90755-9, 2000b.
Mahowald, N., Kohfeld, K., Hansson, M., Balkanski, Y., Harrison, S. P., Prentice, I. C., Schulz, M., and Rodhe, H.: Dust sources and deposition during the last glacial maximum and current climate: A comparison of model results with paleodata from ice cores and marine sediments, J. Geophys. Res., 104, 15895–15916, https://doi.org/10.1029/1999JD900084, 1999.
Mahowald, N. M., Engelstaedter, S., Luo, C., Sealy, A., Artaxo, P., Benitez-Nelson, C., Bonnet, S., Chen, Y., Chuang, P. Y., Cohen, D. D., Dulac, F., Herut, B., Johansen, A. M., Kubilay, N., Losno, R., Maenhaut, W., Paytan, A., Prospero, J. M., Shank, L. M., and Siefert, R. L.: Atmospheric Iron Deposition: Global Distribution, Variability, and Human Perturbations, Annu. Rev. Mar. Sci., 1, 245–278, https://doi.org/10.1146/annurev.marine.010908.163727, 2009.
Mahowald, N., Ward, D. S., Kloster, S., Flanner, M. G., Heald, C. L., Heavens, N. G., Hess, P. G., Lamarque, J. F., and Chuang, P. Y.: Aerosol Impacts on Climate and Biogeochemistry, Annu. Rev. Env. Resour., 36, 45–74, https://doi.org/10.1146/annurev-environ-042009-094507, 2011.
Mahowald, N., Albani, S., Kok, J. F., Engelstaeder, S., Scanza, R., Ward, D. S., and Flanner, M. G.: The size distribution of desert dust aerosols and its impact on the Earth system, Aeolian Res., 15, 53–71, https://doi.org/10.1016/j.aeolia.2013.09.002, 2014.
Marticorena, B. and Bergametti, G.: Modeling the Atmospheric Dust Cycle .1. Design of a Soil-Derived Dust Emission Scheme, J. Geophys. Res.-Atmos., 100, 16415–16430, 1995.
Miller, R. L., Cakmur, R. V., Perlwitz, J., Geogdzhayev, I. V., Ginoux, P., Koch, D., Kohfeld, K. E., Prigent, C., Ruedy, R., Schmidt, G. A., and Tegen, I.: Mineral dust aerosols in the NASA Goddard Institute for Space Sciences ModelE atmospheric general circulation model, J. Geophys. Res., 111, D06208, https://doi.org/10.1029/2005JD005796, 2006.
Nyanganyura, D., Maenhaut, W., Mathuthu, M., Makarau, A., and Meixner, F. X.: The chemical composition of tropospheric aerosols and their contributing sources to a continental background site in northern Zimbabwe from 1994 to 2000, Atmos. Environ., 41, 2644–2659, https://doi.org/10.1016/j.atmosenv.2006.11.015, 2007.
Program for Climate Model Diagnosis and Intercomparison (PCMDI): https://esgf-node.llnl.gov/search/cmip5/, last access: 15 August 2020.
Prospero, J. M.: The Atmospheric transport of particles to the Ocean, in: Particle Flux in the Ocean, edited by: Ittekkot, V., Schäfer, P., Honjo, S., and Depetris, P. J., John Wiley & Sons, Chichester, UK, SCOPE Report 57, 19–52, 1996.
Prospero, J. M., Ginoux, P., Torres, O., Nicholson, S. E., and Gill, T. E.: Environmental characterization of global sources of atmospheric soil dust identified with the Nimbus 7 Total Ozone Mapping Spectrometer (TOMS) absorbing aerosol product, Rev. Geophys., 40, 1002, https://doi.org/10.1029/2000rg000095, 2002.
Pu, B. and Ginoux, P.: How reliable are CMIP5 models in simulating dust optical depth?, Atmos. Chem. Phys., 18, 12491–12510, https://doi.org/10.5194/acp-18-12491-2018, 2018.
Rahimi, S., Liu, X., Wu, C., Lau, W. K., Brown, H., Wu, M., and Qian, Y.: Quantifying snow darkening and atmospheric radiative effects of black carbon and dust on the South Asian monsoon and hydrological cycle: experiments using variable-resolution CESM, Atmos. Chem. Phys., 19, 12025–12049, https://doi.org/10.5194/acp-19-12025-2019, 2019.
Randles, C. A., da Silva, A. M., Buchard, V., Colarco, P. R., Darmenov, A., Govindaraju, R., Smirnov, A., Holben, B., Ferrare, R., Hair, J., Shinozuka, Y., and Flynn, C. J.: The MERRA-2 Aerosol Reanalysis, 1980 Onward. Part I: System Description and Data Assimilation Evaluation, J. Climate, 30, 6823–6850, https://doi.org/10.1175/jcli-d-16-0609.1, 2017.
Rotstayn, L. D., Jeffrey, S. J., Collier, M. A., Dravitzki, S. M., Hirst, A. C., Syktus, J. I., and Wong, K. K.: Aerosol- and greenhouse gas-induced changes in summer rainfall and circulation in the Australasian region: a study using single-forcing climate simulations, Atmos. Chem. Phys., 12, 6377–6404, https://doi.org/10.5194/acp-12-6377-2012, 2012.
Ryder, C. L., Marenco, F., Brooke, J. K., Estelles, V., Cotton, R., Formenti, P., McQuaid, J. B., Price, H. C., Liu, D., Ausset, P., Rosenberg, P. D., Taylor, J. W., Choularton, T., Bower, K., Coe, H., Gallagher, M., Crosier, J., Lloyd, G., Highwood, E. J., and Murray, B. J.: Coarse-mode mineral dust size distributions, composition and optical properties from AER-D aircraft measurements over the tropical eastern Atlantic, Atmos. Chem. Phys., 18, 17225-17257, https://doi.org/10.5194/acp-18-17225-2018, 2018.
Sakamoto, T. T., Komuro, Y., Nishimura, T., Ishii, M., Tatebe, H., Shiogama, H., Hasegawa, A., Toyoda, T., Mori, M., Suzuki, T., Imada, Y., Nozawa, T., Takata, K., Mochizuki, T., Ogochi, K., Emori, S., Hasumi, H., and Kimoto, M.: MIROC4h - A New High-Resolution Atmosphere-Ocean Coupled General Circulation Model, J. Meteorol. Soc. Jpn., Ser. II, 90, 325–359, https://doi.org/10.2151/jmsj.2012-301, 2012.
Schmidt, G. A., Kelley, M., Nazarenko, L., Ruedy, R., Russell, G. L., Aleinov, I., Bauer, M., Bauer, S. E., Bhat, M. K., Bleck, R., Canuto, V., Chen, Y.-H., Cheng, Y., Clune, T. L., Del Genio, A., de Fainchtein, R., Faluvegi, G., Hansen, J. E., Healy, R. J., Kiang, N. Y., Koch, D., Lacis, A. A., LeGrande, A. N., Lerner, J., Lo, K. K., Matthews, E. E., Menon, S., Miller, R. L., Oinas, V., Oloso, A. O., Perlwitz, J. P., Puma, M. J., Putman, W. M., Rind, D., Romanou, A., Sato, M., Shindell, D. T., Sun, S., Syed, R. A., Tausnev, N., Tsigaridis, K., Unger, N., Voulgarakis, A., Yao, M.-S., and Zhang, J.: Configuration and assessment of the GISS ModelE2 contributions to the CMIP5 archive, J. Adv. Model. Earth Sy., 6, 141–184, https://doi.org/10.1002/2013MS000265, 2014.
Shao, Y.: Physics and modelling of wind erosion, Springer, Berlin, Germany, 456 pp., ISBN 978-1-4020-8894-0, https://doi.org/10.1007/978-1-4020-8895-7, 2008.
Shao, Y., Raupach, M. R., and Leys, J. F. (1996). A model for predicting aeolian sand drift and dust entrainment on scales from paddock to region, Aust. J. Soil Res., 34, 309–342, https://doi.org/10.1071/SR9960309, 1996.
Shao, Y., Leys, J. F., McTainsh, G. H., and Tews, K.: Numerical simulation of the October 2002 dust event in Australia, J. Geophys. Res., 112, D08207, https://doi.org/10.1029/2006JD007767, 2007.
Shao, Y. P., Wyrwoll, K. H., Chappell, A., Huang, J. P., Lin, Z. H., McTainsh, G. H., Mikami, M., Tanaka, T. Y., Wang, X. L., and Yoon, S.: Dust cycle: An emerging core theme in Earth system science, Aeolian Res., 2, 181–204, https://doi.org/10.1016/j.aeolia.2011.02.001, 2011.
Takemura, T., Okamoto, H., Maruyama, Y., Numaguti, A., Higurashi, A., and Nakajima, T.: Global three-dimensional simulation of aerosol optical thickness distribution of various origins, J. Geophys. Res.-Atmos., 105, 17853–17873, https://doi.org/10.1029/2000JD900265, 2000.
Takemura, T., Egashira, M., Matsuzawa, K., Ichijo, H., O'ishi, R., and Abe-Ouchi, A.: A simulation of the global distribution and radiative forcing of soil dust aerosols at the Last Glacial Maximum, Atmos. Chem. Phys., 9, 3061–3073, https://doi.org/10.5194/acp-9-3061-2009, 2009.
Tanaka, T. Y. and Chiba, M.: Global Simulation of Dust Aerosol with a Chemical Transport Model, MASINGAR, J. Meteorol. Soc. Jpn., Ser. II, 83A, 255–278, https://doi.org/10.2151/jmsj.83A.255, 2005.
Tanaka, T. Y. and Chiba, M.: A numerical study of the contributions of dust source regions to the global dust budget, Global Planet. Change, 52, 88–104, https://doi.org/10.1016/j.gloplacha.2006.02.002, 2006.
Taylor, K. E., Stouffer, R. J., and Meehl, G. A.: A summary of the CMIP5 experiment design, PCDMI Rep., 33 pp., available at: https://pcmdi.llnl.gov/mips/cmip5/docs/Taylor_CMIP5_22Jan11_marked.pdf?id=73 (last access: 25 June 2020), 2009.
Taylor, K. E., Stouffer, R. J., and Meehl, G. A.: An Overview of CMIP5 and the Experiment Design, B. Am. Meteorol. Soc., 93, 485–498, https://doi.org/10.1175/BAMS-D-11-00094.1, 2012.
Tegen, I., Harrison, S. P., Kohfeld, K., Prentice, I. C., Coe, M., and Heimann, M.: Impact of vegetation and preferential source areas on global dust aerosol: Results from a model study, J. Geophys. Res., 107, 4576, https://doi.org/10.1029/2001jd000963, 2002.
Textor, C., Schulz, M., Guibert, S., Kinne, S., Balkanski, Y., Bauer, S., Berntsen, T., Berglen, T., Boucher, O., Chin, M., Dentener, F., Diehl, T., Easter, R., Feichter, H., Fillmore, D., Ghan, S., Ginoux, P., Gong, S., Grini, A., Hendricks, J., Horowitz, L., Huang, P., Isaksen, I., Iversen, I., Kloster, S., Koch, D., Kirkevåg, A., Kristjansson, J. E., Krol, M., Lauer, A., Lamarque, J. F., Liu, X., Montanaro, V., Myhre, G., Penner, J., Pitari, G., Reddy, S., Seland, Ø., Stier, P., Takemura, T., and Tie, X.: Analysis and quantification of the diversities of aerosol life cycles within AeroCom, Atmos. Chem. Phys., 6, 1777–1813, https://doi.org/10.5194/acp-6-1777-2006, 2006.
Textor, C., Schulz, M., Guibert, S., Kinne, S., Balkanski, Y., Bauer, S., Berntsen, T., Berglen, T., Boucher, O., Chin, M., Dentener, F., Diehl, T., Feichter, J., Fillmore, D., Ginoux, P., Gong, S., Grini, A., Hendricks, J., Horowitz, L., Huang, P., Isaksen, I. S. A., Iversen, T., Kloster, S., Koch, D., Kirkevåg, A., Kristjansson, J. E., Krol, M., Lauer, A., Lamarque, J. F., Liu, X., Montanaro, V., Myhre, G., Penner, J. E., Pitari, G., Reddy, M. S., Seland, Ø., Stier, P., Takemura, T., and Tie, X.: The effect of harmonized emissions on aerosol properties in global models – an AeroCom experiment, Atmos. Chem. Phys., 7, 4489–4501, https://doi.org/10.5194/acp-7-4489-2007, 2007.
The HadGEM2 Development Team: G. M. Martin, Bellouin, N., Collins, W. J., Culverwell, I. D., Halloran, P. R., Hardiman, S. C., Hinton, T. J., Jones, C. D., McDonald, R. E., McLaren, A. J., O'Connor, F. M., Roberts, M. J., Rodriguez, J. M., Woodward, S., Best, M. J., Brooks, M. E., Brown, A. R., Butchart, N., Dearden, C., Derbyshire, S. H., Dharssi, I., Doutriaux-Boucher, M., Edwards, J. M., Falloon, P. D., Gedney, N., Gray, L. J., Hewitt, H. T., Hobson, M., Huddleston, M. R., Hughes, J., Ineson, S., Ingram, W. J., James, P. M., Johns, T. C., Johnson, C. E., Jones, A., Jones, C. P., Joshi, M. M., Keen, A. B., Liddicoat, S., Lock, A. P., Maidens, A. V., Manners, J. C., Milton, S. F., Rae, J. G. L., Ridley, J. K., Sellar, A., Senior, C. A., Totterdell, I. J., Verhoef, A., Vidale, P. L., and Wiltshire, A.: The HadGEM2 family of Met Office Unified Model climate configurations, Geosci. Model Dev., 4, 723–757, https://doi.org/10.5194/gmd-4-723-2011, 2011.
Todd, M. C., Karam, D. B., Cavazos, C., Bouet, C., Heinold, B., Baldasano, J. M., Cautenet, G., Koren, I., Perez, C., Solmon, F., Tegen, I., Tulet, P., Washington, R., and Zakey, A.: Quantifying uncertainty in estimates of mineral dust flux: An intercomparison of model performance over the Bodele Depression, northern Chad, J. Geophys. Res.-Atmos., 113, D24107, https://doi.org/10.1029/2008jd010476, 2008.
Uno, I., Wang, Z., Chiba, M., Chun, Y. S., Gong, S. L., Hara, Y., Jung, E., Lee, S. S., Liu, M., Mikami, M., Music, S., Nickovic, S., Satake, S., Shao, Y., Song, Z., Sugimoto, N., Tanaka, T., and Westphal, D. L.: Dust model intercomparison (DMIP) study over Asia: Overview, J. Geophys. Res.-Atmos., 111, D12213, https://doi.org/10.1029/2005jd006575, 2006.
Vanderzalm, J. L., Hooper, M. A., Ryan, B., Maenhaut, W., Martin, P., Rayment, P. R., and Hooper, B. M.: Impact of seasonal biomass burning on air quality in the ”Top End” of regional Northern Australia, Clean Air and Environmental Quality, 37, 28–34, 2003.
von Salzen, K., Scinocca, J. F., McFarlane, N. A., Li, J., Cole, J. N. S., Plummer, D., Verseghy, D., Reader, M. C., Ma, X., Lazare, M., and Solheim, L.: The Canadian Fourth Generation Atmospheric Global Climate Model (CanAM4). Part I: Representation of Physical Processes, Atmos. Ocean, 51, 104–125, https://doi.org/10.1080/07055900.2012.755610, 2013.
Watanabe, M., Suzuki, T., O'ishi, R., Komuro, Y., Watanabe, S., Emori, S., Takemura, T., Chikira, M., Ogura, T., Sekiguchi, M., Takata, K., Yamazaki, D., Yokohata, T., Nozawa, T., Hasumi, H., Tatebe, H., and Kimoto, M.: Improved Climate Simulation by MIROC5: Mean States, Variability, and Climate Sensitivity, J. Climate, 23, 6312–6335, https://doi.org/10.1175/2010jcli3679.1, 2010.
Watanabe, S., Hajima, T., Sudo, K., Nagashima, T., Takemura, T., Okajima, H., Nozawa, T., Kawase, H., Abe, M., Yokohata, T., Ise, T., Sato, H., Kato, E., Takata, K., Emori, S., and Kawamiya, M.: MIROC-ESM 2010: model description and basic results of CMIP5-20c3m experiments, Geosci. Model Dev., 4, 845–872, https://doi.org/10.5194/gmd-4-845-2011, 2011.
Woodward, S.: Modeling the atmospheric life cycle and radiative impact of mineral dust in the Hadley Centre climate model, J. Geophys. Res.-Atmos., 106, 18155–18166, https://doi.org/10.1029/2000JD900795, 2001.
Woodward, S.: Mineral dust in HadGEM2, Hadley Centre tech. Note 87, Met Office, Exeter, Devon, UK, 10 pp., 2011.
Wu, C. and Lin, Z.: Uncertainty in Dust Budget over East Asia Simulated by WRF/Chem with Six Different Dust Emission Schemes, Atmospheric and Oceanic Science Letters, 6, 428–433, https://doi.org/10.3878/j.issn.1674-2834.13.0045, 2013.
Wu, C., Lin, Z., He, J., Zhang, M., Liu, X., Zhang, R., and Brown, H.: A process-oriented evaluation of dust emission parameterizations in CESM: Simulation of a typical severe dust storm in East Asia, J. Adv. Model. Earth Sy., 8, 1432–1452, https://doi.org/10.1002/2016MS000723, 2016.
Wu, C., Lin, Z., Liu, X., Li, Y., Lu, Z., and Wu, M.: Can Climate Models Reproduce the Decadal Change of Dust Aerosol in East Asia?, Geophys. Res. Lett., 45, 9953–9962, https://doi.org/10.1029/2018GL079376, 2018a.
Wu, C., Liu, X., Lin, Z., Rahimi-Esfarjani, S. R., and Lu, Z.: Impacts of absorbing aerosol deposition on snowpack and hydrologic cycle in the Rocky Mountain region based on variable-resolution CESM (VR-CESM) simulations, Atmos. Chem. Phys., 18, 511–533, https://doi.org/10.5194/acp-18-511-2018, 2018b.
Wu, M., Liu, X., Yang, K., Luo, T., Wang, Z., Wu, C., Zhang, K., Yu, H., and Darmenov, A.: Modeling Dust in East Asia by CESM and Sources of Biases, J. Geophys. Res.-Atmos., 124, 8043–8064, https://doi.org/10.1029/2019JD030799, 2019.
Yue, X., Wang, H. J., Wang, Z. F., and Fan, K.: Simulation of dust aerosol radiative feedback using the Global Transport Model of Dust: 1. Dust cycle and validation, J. Geophys. Res., 114, D10202, https://doi.org/10.1029/2008jd010995, 2009.
Yue, X., Wang, H., Liao, H., and Fan, K.: Simulation of dust aerosol radiative feedback using the GMOD: 2, Dust-climate interactions, J. Geophys. Res., 115, D04201, https://doi.org/10.1029/2009jd012063, 2010.
Yukimoto, S., Yoshimura, H., Hosaka, M., Sakami, T., Tsujino, H., Hirabara, M., Tanaka, T. Y., Deushi, M., Obata, A., Nakano, H., Adachi, Y., Shindo, E., Yabu, S., Ose, T., and Kitoh, A.: Meteorological Research Institute-Earth System Model v1 (MRI-ESM 1)–Model description, Technical Report of MRI, Ibaraki, Japan, 2011.
Yukimoto, S., Adachi, Y., Hosaka, M., Sakami, T., Yoshimura, H., Hirabara, M., Tanaka, T. Y., Shindo, E., Tsujino, H., Deushi, M., Mizuta, R., Yabu, S., Obata, A., Nakano, H., Koshiro, T., Ose, T., and Kitoh, A.: A New Global Climate Model of the Meteorological Research Institute: MRI-CGCM3–Model Description and Basic Performance, J. Meteorol. Soc. Jpn., Ser. II, 90A, 23–64, https://doi.org/10.2151/jmsj.2012-A02, 2012.
Yumimoto, K., Uno, I., Sugimoto, N., Shimizu, A., and Satake, S.: Adjoint inverse modeling of dust emission and transport over East Asia, Geophys. Res. Lett., 34, L08806, https://doi.org/10.1029/2006gl028551, 2007.
Zender, C. S., Bian, H. S., and Newman, D.: Mineral Dust Entrainment and Deposition (DEAD) model: Description and 1990s dust climatology, J. Geophys. Res.-Atmos., 108, 4416, https://doi.org/10.1029/2002jd002775, 2003.