the Creative Commons Attribution 4.0 License.
the Creative Commons Attribution 4.0 License.
 | 31 Jul 2019
Modeling the aging process of black carbon during atmospheric transport using a new approach: a case study in Beijing
Yuxuan Zhang
Yafang Cheng
Guannan Geng
Chaopeng Hong
Haiyan Li
Dan Tong
Nana Wu
Xin Zhang
Yixuan Zheng
Yu Bo
Qiang Zhang
The effect of black carbon (BC) on air quality and the climate is still unclear, which is partly because of the poor understanding regarding the BC aging process in the atmosphere. In this work, we developed a new approach to simulate the BC mixing state (i.e., other species coated on the BC surface) based on an emissions inventory and back-trajectory analysis. The model tracks the evolution of the BC aging degree (characterized by the size ratio of the whole particle and BC core) during atmospheric transport. Using the models, we quantified the mass-averaged aging degree of total BC particles transported to a receptor (e.g., an observation site) from various emission origins (i.e., grids). The simulations showed good agreement with the field measurements, which validated our model calculation. Modeling the aging process of BC during atmospheric transport showed that it was strongly dependent on emission levels. BC particles from extensive emission origins (i.e., polluted regions) were characterized by a higher aging degree during atmospheric transport due to more co-emitted coating precursors. On the other hand, high-emission regions also controlled the aging process of BC particles that were emitted from cleaner regions and passed through these polluted regions during atmospheric transport. The simulations identified the important roles of extensive emission regions in the BC aging process during atmospheric transport, implying the enhanced contributions of extensive emission regions to BC light absorption. This provides a new perspective on the phenomenon of pollution building up in the North China Plain, further demonstrating that this is mainly driven by regional transport and transformation. The simulation of the BC aging degree during atmospheric transport provided more clues for improving air pollution and climate change.
- Article
(2816 KB) - Full-text XML
-
Supplement
(268 KB) - BibTeX
- EndNote


Black carbon (BC) plays an important role in the global warming and deterioration of air quality (Bond et al., 2013). The effects of BC aerosols on air quality and climate strongly depend on their light absorption. Accurately assessing the radiative effects of BC aerosols continues to be a major challenge in atmospheric/climate sciences, partly due to unclear light absorption capability of ambient BC particles. Estimates of the light absorption enhancement for BC-containing aerosols caused by coating materials on BC surface differ by a factor of ∼ 3.5, spanning over a wide range from 1.05 to 3.5 (Cappa et al., 2012; Jacobson, 2001; Moffet et al., 2009; Peng et al., 2016). Generally, the aged BC particles during atmospheric transport exhibit a stronger absorption capability compared to near-source BC aerosols (Dahlkötter et al., 2014; Gustafsson and Ramanathan, 2016). In some climate model studies, the light absorption properties obtained from near-source BC aerosols are taken to estimate the direction radiative forcing (DRF) of BC (X. Wang et al., 2014; Schulz et al., 2006; Myhre et al., 2009). However, the climate effects of BC aerosols are on the regional to even global scales. Meanwhile, the effect of BC on air quality by the suppression on the planetary boundary layer (PBL) is associated with the atmospheric aging process of BC particles (Ding et al., 2016; Z. Wang et al., 2018). Therefore, better understanding light absorption properties during atmospheric transport can improve the model prediction of BC effects on climate and air quality.
The change in light absorption of BC-containing particles during atmospheric transport is associated with the evolution of their mixing state. During atmospheric transport from emission sources, BC can internally mix with other atmospheric species (e.g., sulfate, nitrate, secondary organic matter and named coating materials) by condensation and coagulation processes (Jacobson, 2001; Li et al., 2016; Liu et al., 2017; Moffet et al., 2009). The interaction between BC and other aerosol components is defined as the BC aging process. Jacobson (2001), Cheng et al. (2006), Lack and Cappa (2010), Liu et al. (2015) and Zhang et al. (2016) pointed out that aged BC can exhibit light absorption amplification by 2–3 times due to the lensing effect of the coating material on the BC surface, which influences the DRF of BC and then also impacts the development of the PBL (Cheng et al., 2008, 2009; Chung et al., 2012; Moffet et al., 2009; Ramanathan and Carmichael, 2008; Wendisch et al., 2008; Nordmann et al., 2014; Ding et al., 2016). However, the light absorption capability of BC during the aging process is still under debate (Cappa et al., 2012; Jacobson, 2001; Liu et al., 2017) partly due to a lack of understanding of the BC mixing state during atmospheric transport.
The mixing state of atmospheric BC-containing particles can be quantified by field observations, aircraft measurements and model simulations. Field measurements obtain the mixing state of BC particles as they are transported to an observation site (Cheng et al., 2006, 2012; Moffet et al., 2009; Sedlacek et al., 2012; Zhang et al., 2018a, c). These observations characterize the average mixing state of BC over the observation site and cannot distinguish the mixing state of BC particles from different source origins. Moreover, field observations cannot be used to understand the temporal and spatial variations in the BC mixing state during atmospheric transport. Aircraft measurements are commonly applied to explore the evolution of the BC mixing state during atmospheric transport from emission sources (Dahlkötter et al., 2014; Ditas et al., 2018; McMeeking et al., 2011; Moteki et al., 2007). However, aircraft measurements are currently limited due to high costs, especially in developing countries with high BC emissions (e.g., China and India). On the other hand, some models have been developed to simulate the mixing state of BC-containing aerosols based on the mass or volume concentrations of BC and non-BC components (Jacobson, 2001; Matsui et al., 2013; Oshima et al., 2009). The major challenge of these models is how to treat non-BC components as coating materials of BC and BC-free particles. Moreover, when using these models, the computational cost is high when simulating the BC mixing state during atmospheric transport (Matsui et al., 2013). A lack of information on the BC mixing state during the transport process will prevent a good understanding of the light absorption of BC particles in the atmosphere.
Considering the important contribution of BC from polluted regions to the BC amount present in the regional atmosphere (Lu et al., 2012; Zhang et al., 2018c), studies on BC aging during atmospheric transport should pay more attention to BC particles from polluted regions. Based on in situ measurements, Zhang et al. (2018c) found that the light absorption capability of BC increased with increasing levels of air pollution due to more coating materials of BC under more polluted conditions. Cheng et al. (2012) showed that the aging process in polluted areas, such as Beijing, was much faster than that in clean or less polluted regions (Moteki et al., 2007; Shiraiwa et al., 2007) and in modeling studies (Cooke and Wilson, 1996; Jacobson, 2001; Koch, 2001; Lohmann et al., 2000). Peng et al. (2016) also pointed out a higher aging rate of BC particles under more polluted environments. Moreover, Li et al. (2016) and Wang et al. (2017) revealed that the significant change in BC morphology (e.g., increase in fraction dimension) associated with their mixing state (i.e., from bare-like or partly coated to embedded BC) in polluted air, which could enhance BC light absorption (Liu et al., 2015; Peng et al., 2016). These studies identified the importance of understanding the mixing state of BC during atmospheric transport from polluted regions.
Table 1The in situ measurement in this work. (Dp∕Dc)5 % represents the average value of the lowest 5th percentile of the hourly Dp∕Dc ratio for ambient BC-containing particles during the campaign period.
In this work, we developed a new approach to simulate the evolution of the BC mixing state during atmospheric transport based on BC emission inventory and back-trajectory analyses. First, the model calculation was used to simulate the mass-weighted mixing state of overall BC particles at a Beijing site with a fine temporal resolution of 1 h, which was compared with the in situ measurements to evaluate our models. We then used our model to separate the mixing state of BC-containing particles from various spatial origins ( resolution) as they were transported to a receptor site in Beijing during a pollution period in late autumn. Based on the simulations, we focused on the mixing state of BC from polluted regions and discussed the dependence of the BC mixing state during atmospheric transport on emission levels. Finally, we explored the implication for the BC light absorption during atmospheric transport, especially for BC from polluted regions.
2.1 Data
2.1.1 Measured aging degree of BC
In this study, the aging degree of BC particles was characterized by the Dp∕Dc ratio (i.e., the size ratio of the whole particle (including coatings and BC core) and the BC core). The observed Dp∕Dc ratio of BC-containing particles is measured using a single-particle soot photometer (SP2) in this work. The SP2 technique (Droplet Measurement Technology, Boulder, CO, USA) has been described in detail elsewhere (Sedlacek et al., 2012; Moteki and Kondo, 2010; Zhang et al., 2016, 2018b). In brief, SP2 uses incandescence and scattering signals induced by a Nd:YAG intracavity laser beam at 1064 nm to quantify the refractory BC (rBC) mass and the scattering cross section of individual BC-containing particles. The rBC mass determined from incandescence signals of SP2 was calibrated with Aquadag particles of known masses. Details on SP2 calibration were shown in previous studies (Zhang et al., 2018c). To retrieve the scattering cross section of BC-containing particles from scattering signals of SP2, a leading edge only (LEO) fit method was used (Gao et al., 2007). The whole particle diameter (Dp) and the BC core diameter (Dc) were derived from the SP2 measurement and Mie theory, as given by Zhang et al. (2016, 2018c). In Mie calculation, the refractive indices of the rBC core and coating materials were prescribed the values of 2.26–1.26i (Taylor et al., 2015; Zhang et al., 2018b) and 1.50–0i (Cappa et al., 2012; Zhang et al., 2018c); the density of the rBC core was used as the value of 1.8 g cm−3 (Cappa et al., 2012; Taylor et al., 2015). The hourly mass-average Dp∕Dc ratio of BC-containing particles is used in this work.
Figure 1Time series of the PM2.5 concentration, rBC mass concentration, Dp∕Dc ratio of BC-containing particles and the hourly EEI for BC transported to the observation site for 3-day and 5-day back-trajectories during the BJNOV2014 period.
Figure 2(a) The location of the receptor site (Tsinghua site (40∘00′17′′ N, 116∘19′34′′ E), marked as a red star) during the BJNOV2014 measurement period. (b) Spatial distribution () of the BC emission inventory from MIX.
Table 1 lists the field observations: BJNOV2014 (performed on 17–30 November 2014, Fig. 1), BJOCT2014 (performed from 28 October to 2 November 2014), BJSEP2015 (performed on 12–19 September 2015) and BJAUG2015 (performed on 17–23 August 2015). The observation site (40∘00′17′′ N, 116∘19′34′′ E, shown in Fig. 2a) is located at Tsinghua University in the downtown area of Beijing and can be representative of the urban environment (Zhang et al., 2018a, c). In this study, the Tsinghua site was taken as the receptor of BC particles from emission origins (e.g., Hebei, Tianjin, Shandong, Shanxi, Shaanxi and Inner Mongolia, Fig. 2a) during atmospheric transport. The BJNOV2014 measurement contained several pollution episodes (Fig. 1a), which featured the evolution of BC aging degree (i.e., Dp∕Dc ratio) associated with air pollution in the range of 1.4–2.3 (Fig. 1b). During the BJNOV2014 campaign period, BC amount transported to the Tsinghua site was dominated by the emission of Beijing and its surrounding areas (i.e., Hebei, Tianjin, Shanxi, Shaanxi and Inner Mongolia) (Fig. 3). Moreover, Fig. 3 shows that the spatial origins of BC over the observation site during the four pollution episodes for the BJNOV2014 measurement were different (e.g., urban, rural and industrial sources) based on back-trajectory analysis (Lu et al., 2012). Thereby, the BC aging degree (i.e., Dp∕Dc ratio) obtained from BJNOV2014 measurement was representative and was used to establish the model in this study. The other measurement periods (i.e., the BJOCT2014, BJSEP2015 and BJAUG2015 cases) were characterized by the evolution of pollution episodes (i.e., from clean hours to slight pollution and then reaching to the pollution period and finally retuning to clean hours), which were used to identify whether the models could simulate BC aging degree with a high time resolution (i.e., 1 h) to characterize the change in BC mixing state associated with air pollution.
2.1.2 Back-trajectory analysis and BC emissions
During atmospheric transport, information on the location, height and transport time of BC-containing particles is obtained from back-trajectory analysis using the Hybrid Single-Particle Lagrangian Integrated Trajectory (HYSPLIT) model, with the meteorological fields from the National Centers for Environmental Prediction (NCEP) Global Data Assimilation System (GDAS). Back-trajectories with an hourly temporal resolution were calculated. The arrival height was set as 100 m. We ran the trajectories backwards for 3, 5 and 7 days. The effective amount of BC transported to the observation site derived from the 5-day back-trajectories was similar to that from the 7-day back-trajectories, which was significantly larger than that from the 3-day back-trajectories (Fig. 1c). The 5-day back-trajectories were used in the following model calculation.
The gridded BC emissions for the years 2014 and 2015 were obtained from the MIX inventory, with a resolution of (http://www.meicmodel.org/dataset-mix, last access: 18 October 2018). The MIX inventory includes the emission data of anthropogenic sources in Asia (Li et al., 2017). Figure 2b shows the gridded BC emissions at in Beijing and its surrounding regions (i.e., Hebei, Tianjin, Shandong, Shanxi, Shaanxi and Inner Mongolia).
Figure 3Spatial distribution () of the TED and EEI for BC transported to the observation site (40∘00′17′′ N, 116∘19′34′′ E) during episodes 1–4 of the BJNOV2014 measurement period. The TED and EEI were derived from BC emission and black-trajectory analysis (Lu et al., 2012). The TED represents effective trajectory density transported to the receptor site. The EEI quantifies the effective emission amount transported to the receptor site from emission origins.
2.2 Model development of BC aging during atmospheric transport
The BC aging process during atmospheric transport depends on the formation of coating materials (i.e., other species (e.g., sulfate, nitrate and organics) on the BC surface by condensation and coagulation). The more coating materials there are on the BC surface, the more aged BC during atmospheric transport. The quantity of coating materials during atmospheric transport strongly depends on the pollutant emission levels and BC transport time. In this study, the rate of change in coating mass (mcoating) on BC is defined as
where t represents the transport time; kaging represents the aging rate coefficient; and E represents the emissions level of coating precursors, which are co-emitted with BC. To simplify the calculation, E is quantified by BC emissions from the MIX inventory. The variable mcoating is calculated by Eq. (2):
where ρp and ρc represent the densities of the whole BC-containing particles (including coating materials and BC core) and the BC cores only, respectively.
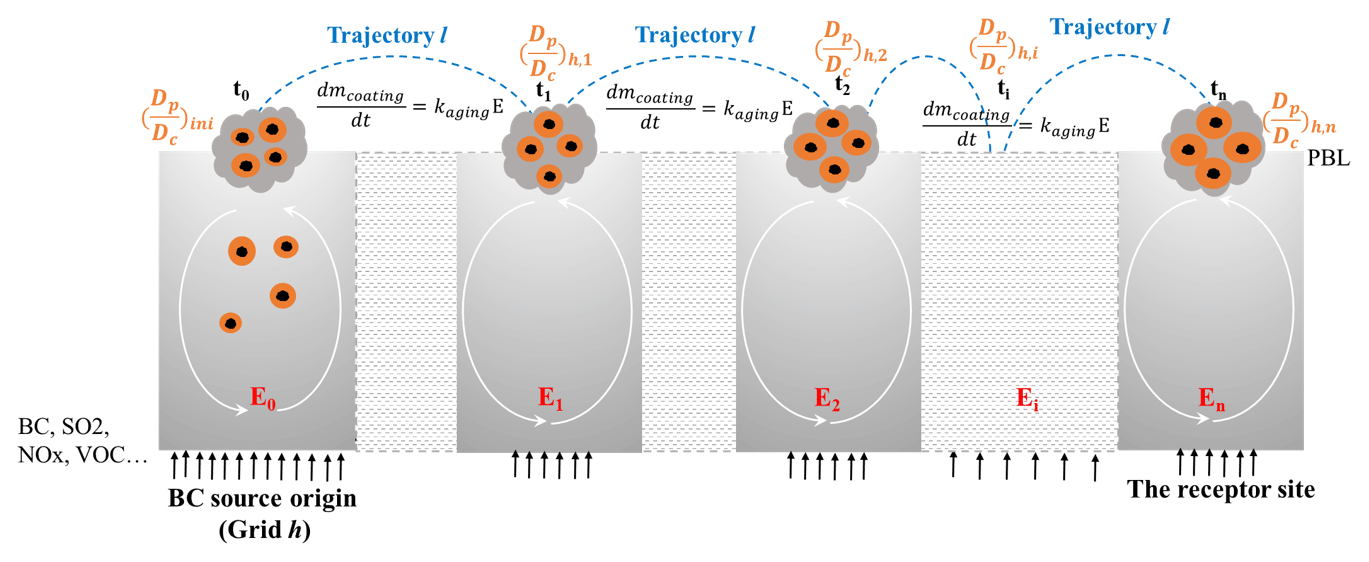
Figure 4Conceptual scheme of the evolution of the mixing state (i.e., the Dp∕Dc ratio) of BC from the source origin (i.e., grid h) to the receptor site following trajectory l.
Combining Eqs. (1) and (2), the BC mixing state (i.e., the Dp∕Dc ratio) during atmospheric transport can be calculated as
where Eaver is the average BC emissions during transport and k represents the normalized aging rate coefficient, which is expressed as
Following Eq. (3), we calculated the Dp∕Dc ratio of BC aerosols transported to the receptor site from different source origins with a resolution (i.e., the origin-resolved mixing state of BC). The conceptual scheme of the evolution of the BC mixing state (i.e., the Dp∕Dc ratio) during atmospheric transport is shown in Fig. 4. When BC aerosols emitted in a grid, h, were transported to the receptor site following a trajectory, l (Fig. 4), the Dp∕Dc ratio (i.e., is given, as shown in Eq. (5):
where and th,l represent the average BC emissions (unit of t grid−1 yr−1) and BC transport time (unit of h) from the grid h to the receptor site following the trajectory l, respectively, and represents the initial value of the Dp∕Dc ratio of BC before transport (Fig. 4).
For a trajectory, l, BC particles pass through a series of grids (i.e., h1, h2, h3, …) to the receptor (i.e., hn), the average Dp∕Dc ratio (i.e., of overall BC particles transported to the receptor site from various source origins (i.e., h1, h2, h3, …, hi, …, hn) is determined by the mass-weighted , which is expressed by Eq. (6):
where TNGl represents the total number of contributing grids to BC over the receptor site following the trajectory l; Wh,l represents the weighting factor of BC from the grid h, which is determined by the effective emission intensity (EEI; defined by Lu et al., 2012). The EEI represents the effective BC amount transported to the receptor site from the emission origins, taking into account the magnitude of BC emission from origin regions, the transport, hydrophobic-to-hydrophilic transformation, as well as dry and wet depositions during atmospheric transport. Wh,l is calculated by Eq. (7):
Following the algorithm developed by Lu et al. (2012), the EEI of BC transported the receptor site from the surface grid h following a trajectory l (i.e., EEIh,l in Eq. 7) can be determined by Eq. (5):
where TEh,l represents the BC transport efficiency following the trajectory l, which is calculated following Eqs. (1)–(4) shown in Lu et al. (2012). The TE is defined to quantify the transport ability of BC from origin regions to the receptor site based on transformation (i.e., hydrophobic-to-hydrophilic BC) and removal processes of BC (i.e., dry and wet depositions) in the atmospheric.
Combining Eqs. (5)–(7), the can be calculated by Eq. (9):
In Eq. (9), two parameters (i.e., and k) need to be retrieved. The characterizes the BC aging degree near emissions. The parameter k represents the rate coefficient of coating materials produced on the surface of BC by atmospheric aging such as condensation, coagulation and cloud process, which is influenced by meteorological factors, chemistry, aerosol phase state as well as other parameters (e.g., particle size).
The value is estimated by the BC aging near different emission sources. In this work, the Dp∕Dc values of BC near the industrial, residential and traffic sources were prescribed as 1.4, 1.6 and 1.2 (Liu et al., 2014, 2017, 2015; Laborde et al., 2013; Healy et al., 2015; Kondo et al., 2011; Morgan et al., 2019; Pan et al., 2017; Ramnarine et al., 2019; Willis et al., 2016; Schwarz et al., 2008; Shi et al., 2019; Y. Wang et al., 2018). The at the source origin (i.e., grid h) was taken as the mass-weighted values of different source types. Figure S1 shows that the values in Beijing and its surrounding areas were dominated by 1.45–1.55, which was agreed with the lowest 5th percentile of the observed Dp∕Dc ratio of ambient BC-containing particles at a Beijing site (Table 1). This validated the value used in the model calculation.
The aging rate coefficient k is retrieved from in situ measurements. The k value can be determined with an assumption that the simulated Dp∕Dc ratio of BC-containing particles was equal to the measured ones. It was noted that the simulated values, with an hourly temporal resolution, from Eq. (9) might not be equal to the observed values at a certain hour because some BC particles transported were not transported out of the observed site within 1 h. To reduce the influence of the incomplete dispersion of ambient aerosols, the experimentally determined k was calculated based on the observed Dp∕Dc ratio of BC-containing particles during a period , such as the mass-average values during a pollution episode and the whole campaign. In this work, the aging rate coefficient k was calculated with the assumption that the values was equal to the simulated Dp∕Dc ratio of BC-containing particles over the receptors from various source origins during a period following various trajectories (i.e., .
Following Eqs. (5)–(7), is calculated using Eq. (10):
where represents the Dp∕Dc ratio of BC-containing aerosols transported to our observation site from a grid, h, during the period; Wh,p represents the weighting factor of BC from the grid h to the receptor site during the period; TNGp represents the total number of contributing grids to BC over the receptor site during the period; TNTh,p represents the total number of trajectories passing through the grid h during the period; and EEIh,p represents the EEI in the surface grid h during our a period, which is calculated by Eq. (11) (Lu et al., 2012):
where TNTh,p represents the total number of trajectories passing through the grid h and TNTp represents the total number of back-trajectories originating at our site during the whole period. Figure 3 shows the TE density (TED) (defined as in Eq. 11, Lu et al., 2012) and EEI on a grid during the episodes 1–4 (Fig. 1a). The gridded EEI analysis revealed that BC particles over the Tsinghua site during the four episodes are from different source types, namely industrial and rural sources, urban and rural sources, urban and industrial sources as well as industrial source during episodes 1–4, respectively. This indicated that the model parameters obtained from the BJNOV2014 measurement are representative.
With the assumption that , the experimentally determined k was calculated by Eq. (12):
In this work, the k value was calculated based on the measured Dp∕Dc ratios of BC-containing particles during BJNOV2014 campaign period at the Tsinghua site (40∘00′17′′ N, 116∘19′34′′ E) in Beijing. In order to obtain the k value and then valid our models, the BJNOV2014 measurements were divided into two parts: the first two episodes (i.e., 17–24 November 2014) used to calculate the k value and the last two episodes (i.e., 24–30 November 2014) used for model validation. Following the Eq. (12), the normalized aging rate coefficient k was determined to have a value of ∼ t−1 h−1. Correspondingly, the value of kaging in Eq. (1) is ∼ 17 % h−1, which was comparable with the observation ones (Cheng et al., 2012; Zhang et al., 2018b).
To evaluate our model calculation of the mixing state of BC-containing particles over the site, the simulated values with an hourly temporal resolution are compared with the observed hourly Dp∕Dc ratio during 24–30 November 2014 (i.e., the last two episodes during the BJNOV2014 measurement). It is noted that the observed Dp∕Dc ratio at a certain hour is not only dominated by the aging degree of BC transported to the site at this time, but is also impacted by the aging degree of BC over the site several hours beforehand due to the incomplete dispersion of ambient aerosols within 1 h. In this work, we averaged the simulated at a certain hour and within n (n=0, 2, 4, 6, …) hours beforehand to compare with the observed hourly Dp∕Dc ratio. is calculated by Eq. (13):
Figure 5 shows an excellent agreement between the simulated and observed hourly Dp∕Dc ratios, with a difference of ∼ 3 %. The simulated values, with n=2, 4, and 6, exhibit a better correlation with the observed hourly Dp∕Dc ratio than those without considering the effect of BC transported over our observation site within a few hours beforehand (i.e., n=0). When n=4, the linear relationship between the simulated and observed Dp∕Dc ratios exhibited the highest correlation coefficient (i.e., R2=0.86), and thereby this value was used in the following calculation.
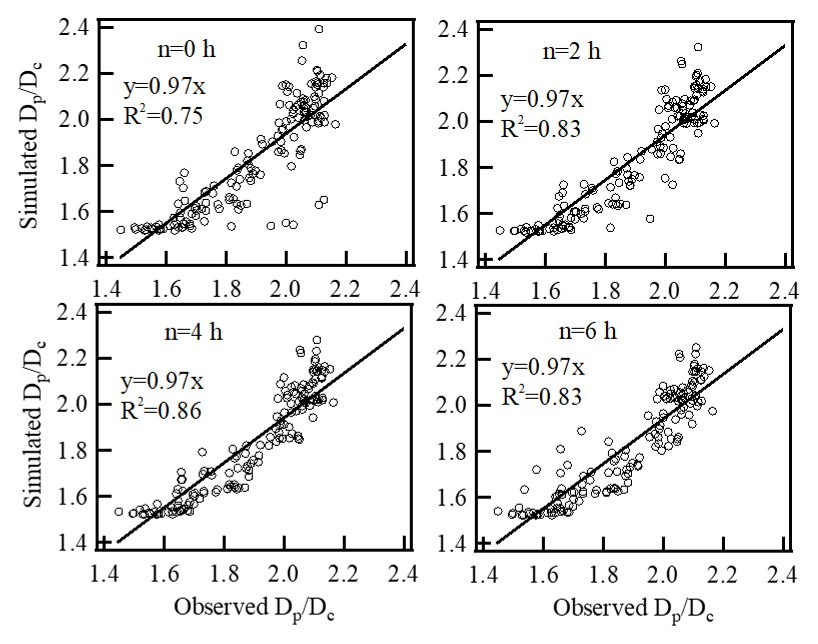
Figure 5Comparison of the hourly Dp∕Dc ratio of BC between the model simulations and observations at our site with different n values in Eq. (13) on 24–30 November 2014 at the Tsinghua site.
3.1 Simulating BC mixing state with a high time resolution
Following Eqs. (9) and (13), we calculated the hourly Dp∕Dc ratios of BC-containing particles during the BJOCT2014, BJSEP2015 and BJAUG2015 measurement periods. Figure 6 shows that the simulated Dp∕Dc values of BC-containing particles exhibit significant changes with pollution levels (i.e., the PM2.5 and rBC concentrations), revealing that our model with a high time resolution can simulate the evolution of the BC aging degree during a pollution episode. The simulation results showed that under pollution conditions, not only did the BC mass concentrations increase, but the aging degree of BC-containing particles was also enhanced. This identified the amplification of BC light absorption associated with air pollution due to more coating material on the BC surface (Zhang et al., 2018c).
Simulation of BC mixing state with a high time resolution is important to evaluate the effect on air quality. The effect of BC on air quality depends on both the mass concentration and the aging degree of BC. Simultaneous increase in the mass concentration and aging degree of BC associated with air pollution could suppress the PBL by the dome effect (Ding et al., 2016). In China, the air pollution often starts rapidly within several hours (Zheng et al., 2016). It is necessary to understand the hourly aging degree of BC-containing particles for better exploring the effect of BC on air quality. Our model calculation can provide BC aging degree (i.e., Dp∕Dc ratio) with a fine temporal resolution of 1 h.
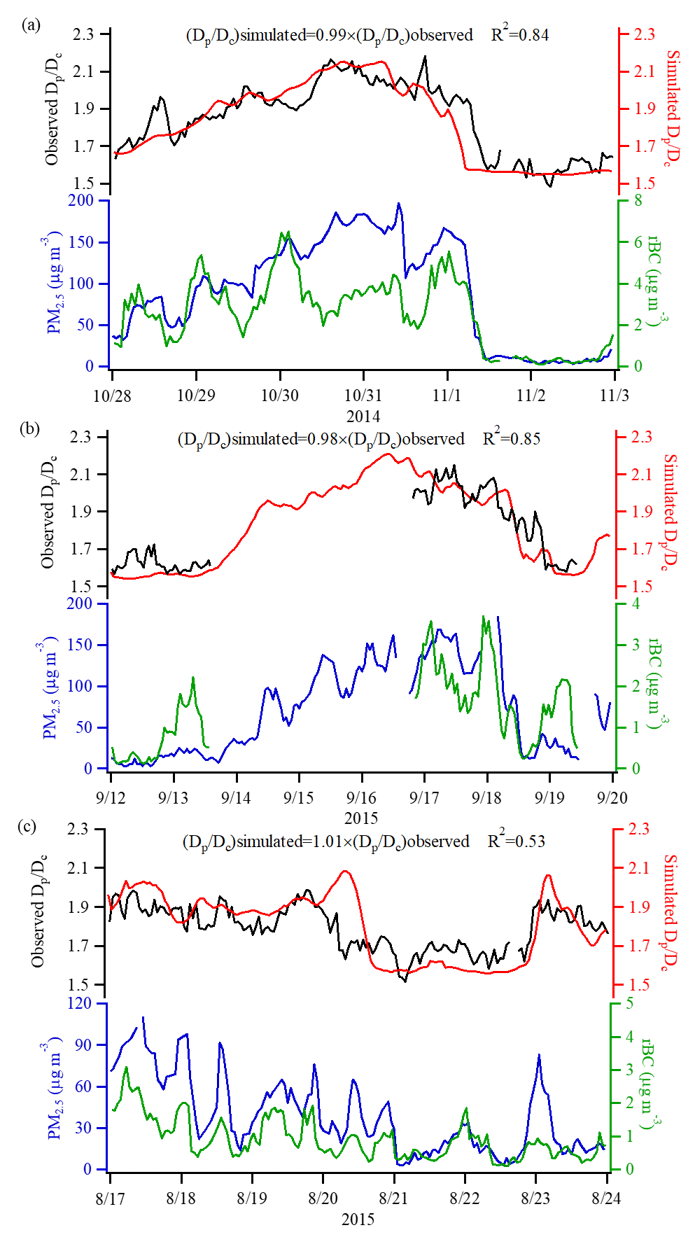
Figure 6Time series of the observed Dp∕Dc ratio, simulated Dp∕Dc ratio, and PM2.5 and rBC concentrations during the (a) BJOCT2014, (b) BJSEP2015 and (c) BJAUG2015 measurement periods.
The simulated BC mixing state with high time resolution during different measurement periods was used to reveal that our models could be generally applied. Although the model is established based on the BJNOV2014 measurement (17–30 November 2014), the model calculation can be applicable to other months under pollution periods (i.e., October 2014, September 2015, and August 2015). Figure 6 reveals an excellent agreement between the simulated and observed hourly Dp∕Dc ratio for the BJOCT2014, BJSEP2015 and BJAUG2015 measurements. During these measurement periods, the linear relationship between the simulated Dp∕Dc ratio and the observed values shows slopes of 0.98–1.01, with a correlation coefficient (R2) of 0.53–0.85. A good correlation further demonstrated the validity of our model for calculating the BC mixing state during atmospheric transport. Accurate simulations for the different measurement periods identify the generalness of our model, especially under polluted environments.

Figure 7Aging degree (i.e., Dp∕Dc) of BC particles as they are transported to the receptor site (40∘00′17′′ N, 116∘19′34′′ E) from emission origins () during the BJNOV2014 campaign period. The gridded Dp∕Dc ratio was calculated by Eq. (11).

Figure 8BC aging from emission origins to the receptor site (40∘00′17′′ N, 116∘19′34′′ E; marked with a red star) during the BJNOV2014 measurement period: (a) classification of the BC emission source regions based on political boundaries (i.e., the Beijing source regions (BJ origins), Hebei source regions (HB origins), Tianjin source regions (TJ origins) and other source regions (OT origins)); (b) aging degree (i.e., Dp∕Dc) of BC particles emitted from the four source regions as they are transported to the receptor site; (c) conceptual scheme of trajectories that pass through low-emission regions (cluster 1), medium-emission regions (cluster 2) and high-emission regions (cluster 3) as they transport from clean origins (e.g., Inner Mongolia) to the receptor site; and (d) the degree of aging of BC reaching the receptor site through different trajectories (i.e., clusters 1, 2 and 3 shown in c).
3.2 BC mixing state during the atmospheric transport process
3.2.1 Aging degree of BC from emission origins to receptor sites
Using our models, we investigated the aging process of BC-containing particles transported from different spatial origins to the receptor (i.e., the Tsinghua site, Beijing) during the BJNOV2014 measurement period. The origin-resolved () Dp∕Dc ratio of BC-containing particles over the receptor site was calculated using Eq. (11), shown in Fig. 7. The BC-containing particles from various spatial origins exhibited significant differences in their mixing state, with the Dp∕Dc ratio in the range of 1.4–2.8 as they reached the Tsinghua site. The Dp∕Dc ratio of BC from the polluted regions (i.e., southern Heibei, northeastern Hebei and Tianjin) could be up to ∼ 2.3–2.8, which characterized the mixing state of fully aged BC in the North China Plain (NCP). These fully aged BC particles played an important role in regional light absorption (Gustafsson and Ramanathan, 2016; Peng et al., 2016). The high Dp∕Dc ratio (∼ 2.3–2.8) of BC transported to our site was consistent with the mixing state of fully aged BC particles (Dp∕Dc ratio ∼ 2.5) in Beijing reported by Peng et al. (2016), implying reliable values of the gridded Dp∕Dc ratio from our model calculation.
In this work, we classified the spatial emission sources of BC-containing particles over the receptor site into local (or Beijing (i.e., BJ origin), shown in Fig. 8a) and non-local (i.e., non-Beijing) origins based on political boundaries. The non-local origins were further divided into Hebei, Tianjin and other origins (i.e., HB, TJ or OT origins, respectively, as shown in Fig. 8a). Based on the gridded Dp∕Dc ratio shown in Fig. 7, the Dp∕Dc ratios of BC-containing particles from Beijing, Hebei, Tianjin and other regions during the campaign period were estimated to be 1.8, 2.2, 2.1 and 2.0, respectively (Fig. 8b). Figure 2b reveals that more intensive emission regions of BC are located in southern Beijing, southern Hebei, northeastern Hebei and Tianjin, which dominated BC amount over the receptor site during the campaign period (Fig. 3). The EEI analysis (Fig. 3) shows that BC-containing particles transported to the site during the campaign period mainly originate from Beijing, Hebei, Tianjin, Inner Mongolia, Shanxi and Shaanxi (the political boundaries of these regions are shown in Fig. 2a).
The contributions of different emission origins to the BC amount over the receptor site during the BJNOV2014 measurement period were estimated by EEI analysis. BC transported to the site was dominated by Hebei and Beijing as the major source regions, accounting for ∼ 40.2 % and ∼ 40.0 % of the total amount transported, respectively. In terms of non-local (i.e., non-Beijing) origins, the contribution of BC from Hebei was significantly higher than that from Tianjin (∼ 4.2 %) and others (∼ 15.5 %) due to more intensive emissions and a larger region in Hebei Province. Approximately 60 % of BC from non-local origins (i.e., Hebei, Tianjin and others) indicated the importance of atmospheric transport to BC concentrations during polluted environments. During the campaign period, the average BC mass concentration was ∼ 4.0 µg m−3 (Fig. 1b). Based on EEI analysis, the mass concentrations of local (i.e., Beijing) and non-local (i.e., non-Beijing) BC at the observed site were estimated to be ∼ 1.6 and ∼ 2.4 µg m−3, respectively.
Atmospheric transport not only played an important role in BC mass concentration in Beijing under polluted environments, but also controlled BC aging. During the investigation period, the Dp∕Dc ratio of non-local (i.e., non-Beijing) BC over the site was ∼ 2.1, which was greater than that of local (i.e., Beijing) BC (∼ 1.8). The higher aging degree of non-local BC could be attributed to the longer transport time and larger emissions from non-local origins. As more intensive emission sources (i.e., polluted regions), Hebei and Tianjin were identified as the two largest contributing regions for the BC mixing state at the site (Figs. 7 and 8b). When BC particles were emitted from Hebei and Tianjin and then transported to the receptor site, their Dp∕Dc ratios could reach up to 2.2 and 2.1, respectively, which were larger than that from other non-local origins (i.e., cleaner regions). This could be due to more pollutant emission from southern Hebei, northeastern Hebei and Tianjin than that from other regions (i.e., Inner Mongolia). The results revealed that BC particles emitted from polluted regions would exhibit a higher aging degree during atmospheric transport, which is most likely attributed to more rapid aging due to more co-emitted coating precursors (Peng et al., 2016).
On the other hand, high emission origins (e.g., southern Hebei, northeastern Hebei and Tianjin) also affect the aging process of BC particles that pass through these regions. When BC particles are emitted from a clean origin and then pass through high emission regions (e.g., southern Hebei) to the receptor site (e.g., cluster 3 shown in Fig. 8c), their Dp∕Dc ratio could reach ∼ 2.2 (Fig. 8d). However, the emitted BC particles from the clean origin passing through a series of clean origins (e.g., cluster 1 shown in Fig. 8c) show a lower Dp∕Dc ratio (∼ 1.6, Fig. 8d) as they reach the site. This difference identifies the important role of extensive emission regions (e.g., southern Hebei) in the atmospheric aging process of BC particles emitted from other clean regions (e.g., Inner Mongolia). When BC particles passed through these polluted regions, their aging degree could be accelerated due to high pollutant emission.
3.2.2 Emission dependence
As discussed above, the aging process of BC particles during atmospheric transport was closely associated with emissions from regions through which they pass. To investigate the dependence of the BC mixing state during atmospheric transport, we normalized the current emissions obtained from the MIX inventory as a unit and set the scenarios of BC emissions reduced by 20 %, 40 %, 50 %, 60 %, and 80 % (i.e., normalized emissions as 0.8, 0.6, 0.5, 0.4, and 0.2, respectively, shown in Fig. 9).
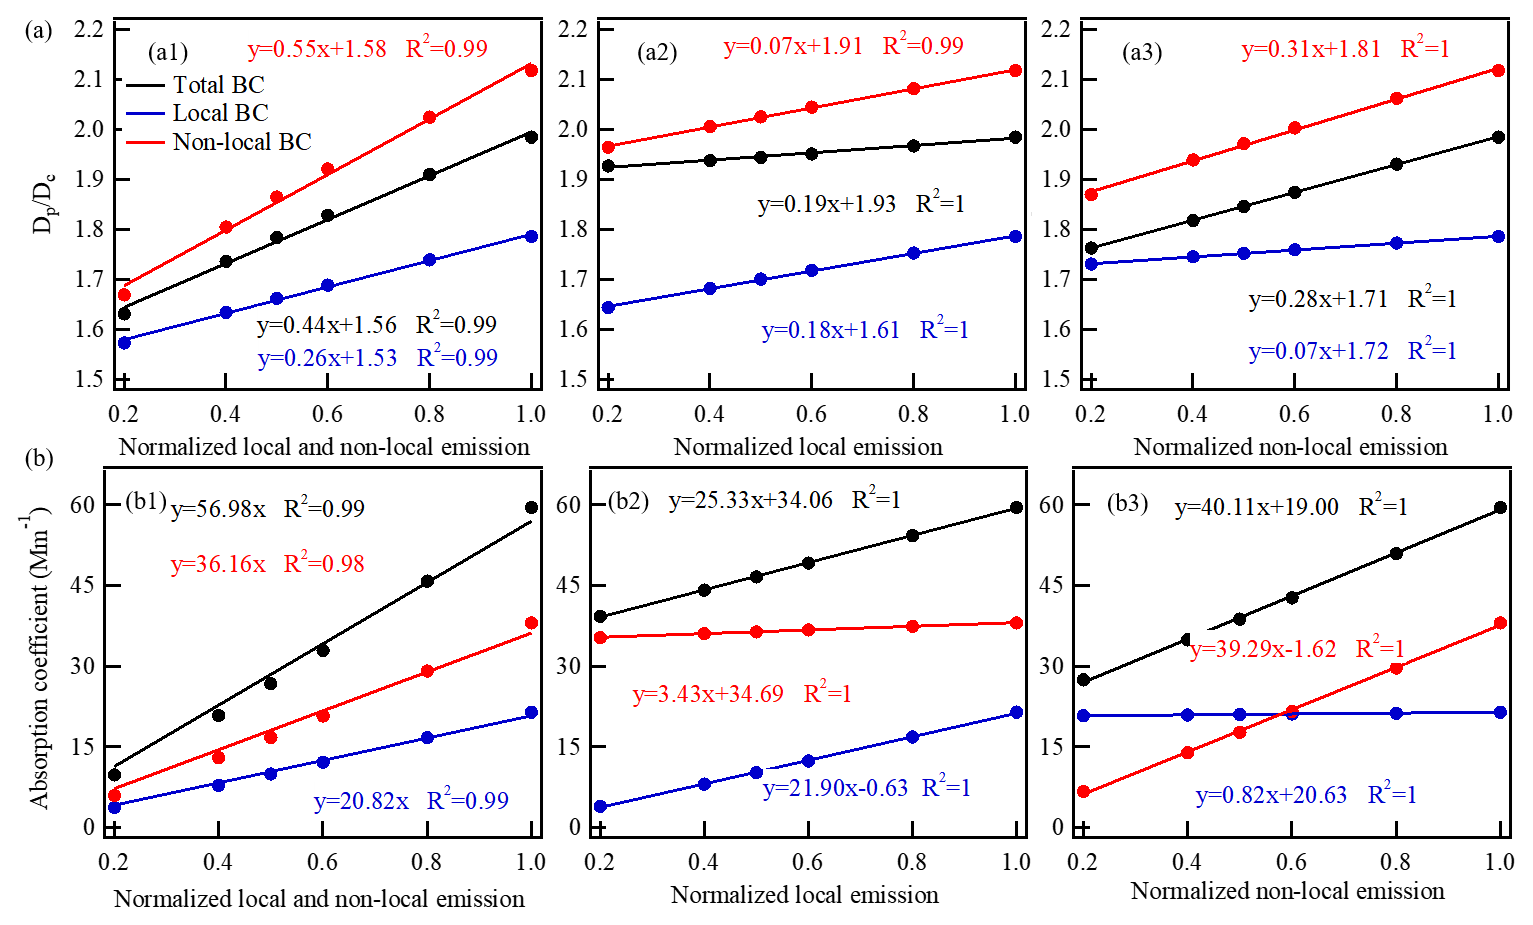
Figure 9Variations in the (a) Dp∕Dc ratio and (b) light absorption coefficient for total, local and non-local BC over the site with normalized emissions. The current emissions obtained from the MIX inventory (Fig. 2b) were normalized as a unit and the emissions reductions of 20 %, 40 %, 50 %, 60 %, and 80 % corresponded to the normalized emissions as 0.8, 0.6, 0.5, 0.4, and 0.2, respectively. (a1) and (b1) represent the simulations for the case of both local and non-local emission variations, respectively; (a2) and (b2) represent the simulations for the case of only local emissions variations; and (a3) and (b3) represent the simulations for the case of only non-local emissions variations. The light absorption coefficient of BC was estimated by the BC mass concentrations, the mass absorption cross section of BC (7.5 m2 g−1 at 550 nm) and the Dp∕Dc ratio. When the normalized emissions of total BC were equal to 1, the average mass concentration of total BC was ∼ 4.0 µg m−3, which was obtained by measurements during the campaign period. The mass concentration of local and non-local BC can be further calculated based on their EEI contributions (i.e., ∼ 1.6 µg m−3 for local BC and ∼ 2.4 µg m−3 for non-local BC). Based on the linear decrease in BC mass concentration with emission reduction, the mass concentrations of total, local and non-local BC for different emission cases were calculated.
Figure 9a1 shows that the Dp∕Dc ratios of local (i.e., Beijing) BC, non-local (i.e., non-Beijing) BC and total BC (including both local and non-local BC) transported to the site were proportional to the emissions, with slopes of 0.55, 0.26 and 0.44, respectively. The slope values revealed that the relative increase or decrease in the Dp∕Dc ratio with emission change for non-local BC was ∼ 2 times that of local BC. This result revealed that the mixing state of non-local BC was more sensitive to emission change than that of local BC. Therefore, emission reduction was more effective in lowering the aging degree of non-local BC compared with that of local BC. For example, when BC emissions were reduced by 50 %, the Dp∕Dc ratios of non-local BC, local BC and total BC at our site decreased by 14 %, 7 % and 11 %, respectively. A greater reduction in the aging degree of non-BC particles could be attributed to most of the non-local BC (∼ 75 %) from high emission origins (i.e., the southern Hebei, northeastern Hebei and Tianjin regions). The origin-resolved Dp∕Dc ratio of BC transported to the site during the campaign period shown in Fig. 7 indicated that a greater reduction in aging degree would be found for BC from higher emission regions, such as southern Hebei, northeastern Hebei and Tianjin, which revealed the benefits of emission controls in extensive emission regions. The results identified the dependence of the BC aging process during atmospheric transport on emissions, especially for non-local BC from high emission origins.
To further evaluate the change in the mixing state of BC at the site from local (i.e., Beijing) and non-local (i.e., non-Beijing) emissions, we simulated the origin-resolved Dp∕Dc ratio of BC over the receptor site, only considering the changes in local (Fig. 9a2) or non-local (Fig. 9a3) emissions. It is noted that the mixing state of total BC at the receptor site not only depended on the respective Dp∕Dc ratio of local and non-local BC, but also on their contributions to the total BC amount. When only altering local or non-local emissions in the simulations, the contributions of various source origins to the BC amount at our site would be changed.
When the changes in only local emissions were included in our simulations, the mixing state of total BC (including both local (i.e., Beijing) and non-local BC (i.e., non-Beijing)) at the observed site was slightly sensitive to emissions. Figure 9a2 presents the linear change in the Dp∕Dc ratio of total BC with changing local emissions, with a slope of 0.07, which is significantly smaller than that (0.44) for the cases of changing both local and non-local emissions (Fig. 8a1). Taking 50 % of the reduction in local emissions as an example, the Dp∕Dc ratio of total BC at our site only decreased by 2 %. Meanwhile, 50 % of the local emission reduction resulted in ∼ 5.0 % and ∼ 4.6 % of the decreases in the Dp∕Dc ratio for local and non-local BC, respectively. The reductions in the Dp∕Dc ratio of local and non-local BC were larger than that in total BC (∼ 2 %), which was due to the increase in the contributions of non-local BC (characterized by a larger Dp∕Dc ratio compared to local BC) with a local emission reduction. The results showed that altering local emissions had a slight effect on the BC mixing state at our site during the investigated period (i.e., under a polluted environment) due to a slight change in the aging degree of non-local BC.
In terms of non-local (i.e., non-Beijing) emission change, the response of the mixing state of total BC at our site to emission changes was more significant than that for the case of local (i.e., Beijing) emission change. The linear correlation between the Dp∕Dc ratio of total BC and normalized non-local emission (i.e., 0.2–1) shown in Fig. 9a3 exhibited a slope of 0.28, which was markedly greater than that (0.07) in the case of local emission change (Fig. 9a2). Figure 9a3 shows that the slope for total BC (i.e., 0.28) was similar to that (i.e., 0.31) for non-local BC, indicating that the variation in the BC mixing state at our site during the investigated period (i.e., under a polluted environment) was controlled by the emission change in non-local BC. This result could be attributed to more aged BC particles being mainly from non-local regions (southern Hebei, northeastern Hebei and Tianjin). These results indicated that the BC mixing state at our site was dominated by non-local emissions (in particular polluted regions with intensive emission), identifying the importance of atmospheric transport in the BC mixing state in Beijing during polluted periods.
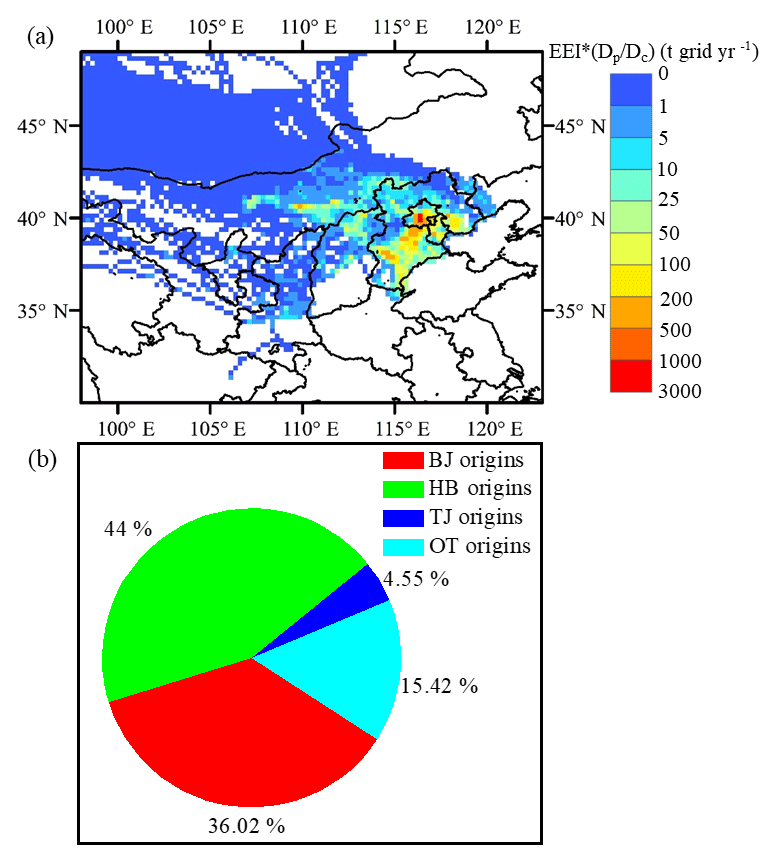
Figure 10(a) Spatial distribution ( resolution) for light absorption levels (i.e., ) of BC as it is transported to the receptor site (40∘00′17′′ N, 116∘19′34′′ E) from various source origins. (b) Contributions of different source regions to BC light absorption at the receptor site. The classification of source regions based on political boundaries is shown in Fig. 8a. The BJ, HB, TJ and OT origins represent spatial sources of emitted BC transported to the receptor site from Beijing, Hebei, Tianjin and other regions, respectively.
3.3 BC light absorption in the atmosphere
BC light absorption depends on both the mass concentration and mixing state of BC. The light absorption of BC can be characterized by multiplying EEI by the Dp∕Dc ratio (i.e., ). In this study, the origin-resolved values represent the light absorption levels of BC particles as they were transported to the receptor site from various source origins (). Figure 10a displays the origin-resolved values during the campaign period. High light-absorption levels of BC were mainly from the local Beijing area, southern Hebei, northeastern Hebei and Tianjin, resulting from high BC emissions and strong BC aging in these regions.
The origin-resolved values revealed the contributions of BC from different source regions to light absorption at the site (Fig. 10b). During the investigated period (i.e., polluted period) in Beijing, Hebei Province was the largest contributing region, accounting for ∼ 44 % of BC light absorption transported to the observed site during the campaign period. Local Beijing was responsible for ∼ 36 % of the light absorption of BC at the site, which was lower than the contribution from Hebei. In total, ∼ 64 % of BC light absorption at the receptor site was contributed by non-local (i.e., non-Beijing) BC source origins, reflecting the importance of atmospheric transport for the light absorption of BC in Beijing during polluted periods. The contribution of non-local origins to BC light absorption at our site was larger than that to BC mass concentration (∼ 60 %, as quantified by the EEI analysis), which was due to the higher aging degree (Dp∕Dc ratio of ∼ 2.12) of non-local BC compared to that of local BC (Dp∕Dc ratio of ∼ 1.78). If the difference between the mixing states of local and non-local BC is not considered, the effect of atmospheric transport on BC light absorption in Beijing during the polluted period would be underestimated. The results revealed that the BC aging process during atmospheric transport strengthens the importance of emissions from surrounding areas (e.g., Hebei and Tianjin) for BC light absorption in Beijing during polluted periods.
The strong dependence of both the mass concentrations and mixing states of BC on emissions indicates that emission reduction could significantly lower light absorption and thus weaken the effect of BC on air quality and climate, especially during polluted periods. A linear decrease in BC light absorption with emission reductions was found (Fig. 9b). When both local (i.e., Beijing) and non-local (i.e., non-Beijing) BC emissions were reduced (Fig. 9b1), the change in light absorption for non-local BC was much more significant than that for local BC. For the case of a 50 % reduction in both local and non-local BC emissions, the light absorption of total BC, local BC and non-local BC decreased by 55 %, 53 % and 56 %, respectively (Fig. 9b1). An extra decrease of ∼ 6 % in light absorption for non-local BC was greater than that (∼ 3 %) for local BC, which could be attributed to a much greater reduction in the aging degree (i.e., Dp∕Dc ratio) of non-local BC (Fig. 9a1). Compared with local BC, a much greater decrease in the light absorption of non-local BC implied that the emission reduction from non-Beijing sources rather than Beijing sources achieved many more benefits in terms of the BC effect in Beijing. This result also revealed that the emissions reduction of the surrounding areas of Beijing not only brought less BC, but also lowered the BC mixing state, which enhanced the decrease in BC light absorption in Beijing.
The analyses of only reducing local emissions or non-local emissions further identified the importance of emission reduction of non-Beijing sources to weaken BC light absorption in Beijing during polluted periods. For the case of local (i.e., Beijing) emissions reduction (Fig. 9b2), the reduction in BC light absorption was significantly smaller than that for the case of non-local (i.e., non-Beijing) emissions reduction (Fig. 9b3), revealing that emissions reduction in non-Beijing sources played a more important role in decreasing BC light absorption in Beijing. For example, when emissions were reduced by 50 % for local and non-local origins, the BC light absorption at the site decreased by 21 % and 35 %, respectively. A greater decrease in BC light absorption in Beijing with non-local emissions reduction resulted from larger contributions of non-Beijing source emissions (especially for polluted regions, such as southern Hebei, northeastern Hebei and Tianjin) to both the mass concentration and mixing state of BC over the site. Moreover, the extra reduction in BC light absorption in Beijing caused by weakening of the BC aging degree was also greater under non-Beijing emissions reduction compared with that under Beijing emissions reduction (e.g., ∼ 5 % and 1 % extra reductions for the cases of 50 % reductions in non-local and local emissions, respectively). The important contribution of emission reduction of non-Beijing sources to decrease in BC light absorption in Beijing under polluted environments was mainly due to a significant decrease in both BC amount and its aging degree in Beijing caused by emission reduction of polluted regions (e.g., southern Hebei, northeastern Hebei and Tianjin). This suggested that the efforts to weaken the influence of BC on air pollution and climate change should pay more attention to emissions reduction in polluted regions.
In this study, a rather simplified scheme was adopted where the aging rate is assumed to be proportional to the emissions without detailed consideration of the effects of temperature, particle sizes, phase state, hygroscopicity and chemistry (Riemer et al., 2009; Cheng et al., 2008, 2012, 2015; Mu et al., 2018). Actually, these factors can influence the model parameter of an aging rate coefficient. Our simulations strongly depend on the emission, initial value of the Dp∕Dc ratio and aging rate coefficient. Accurate values require more measurements of the mixing state of freshly emitted BC-containing particles. In this work, the experimentally determined k value was derived from the observations during the pollution periods in autumn/winter measured in Beijing. In order to extend the application of our model in other seasons (e.g., summer) and sites, further work requires one to understand whether and how the model parameters (i.e., aging rate coefficient and the initial value of the Dp∕Dc ratio) vary at different seasons and sites. In terms of the aging rate coefficient in summer (Cheng et al., 2012; Zhang et al., 2018b), the measurements at two suburban sites (Xianghe and Yufa) in the NCP showed a pronounced diurnal cycle in the range of 0.2 % h−1–20 % h−1 with a maximum at noontime due to stronger photochemistry. The kaging around noontime in summer was comparable with that (∼ 17 % h−1) in autumn/winter. However, other times, especially nighttime in summer, are significantly smaller. For the , its variety is due to different dominated sources of BC in different seasons and sites, which can be estimated by the BC aging degree near different types of emission sources (e.g., industrial, residential and traffic emissions). Figure S1 shows the distinct values at different sites in November. The values are also season dependent. For example, the BC particles in Beijing in summer are controlled by traffic and industrial emissions with a smaller higher Dp∕Dc ratio near sources, but the major sources of BC in autumn/winter are industrial and residential emissions with higher (D. Liu et al., 2019; H. Liu et al., 2019). Lower values both of the aging rate coefficient and the initial value of the Dp∕Dc ratio would lead to thinner coatings of BC in summer compared with those in autumn/winter in the NCP, which was consistent with observations in Beijing (D. Liu et al., 2019).
The retrieved aging rate coefficient kaging indicated that BC particles under polluted environments in autumn/winter in the NCP underwent fast aging during atmospheric transport. The retrieved kaging with a value of ∼ 17 % h−1 used in our models is comparable with the observed values at other suburban sites in the NCP, namely up to ∼ 20 % h−1 and ∼ 21 % h−1 at the Yufa site and Xianghe site, respectively (Cheng et al., 2012; Zhang et al., 2018b). However, the aging rate coefficient commonly used in other models (1 % h−1–5 % h−1) was significantly smaller than that used in our model (Cooke and Wilson, 1996; Jacobson, 2001; Koch, 2001; Lohmann et al., 2000), indicating that the values used in previous models derived in developed countries (Moteki et al., 2007; Shiraiwa et al., 2007) could not represent the characteristic of BC aging processes in China. A similar conclusion was also drawn by Peng et al. (2016) using an environment chamber, namely the timescale of BC aging to achieve high absorption enhancement (∼ 2.4) displaying significant distinction between urban cities in Beijing (∼ 4.6 h) and Houston (∼ 18 h). A higher aging rate coefficient suggested the BC aging under polluted environments in the NCP is most likely dominated by a condensation process during atmospheric transport, taking into account a clear difference between the timescale of BC aging by condensation (2–8 h) and coagulation (10–40 h) (Riemer et al., 2004).
More aged BC aloft increases atmospheric stability, which suppressed the development boundary layer and suppresses or enhances the formation of different types of clouds (Barbaro et al., 2013; Ding et al., 2016; Jacobson, 1998; Zdunkowski et al., 1976; Wendisch et al., 2008; Z. Wang et al., 2018). Our simulations showed that the aging degree of BC from atmospheric transport along with polluted air masses was significantly higher than that of local BC under polluted conditions, implying that the light absorption capability (i.e., mass cross section of BC-containing particles including coating materials on BC surface) of BC in the upper PBL would be higher than that of BC in the lower PBL. This characteristic favored the formation of the inversion layer due to more heating in the upper PBL under polluted conditions (Ding et al., 2016; Z. Wang et al., 2018), which consequently depressed PBL development. In China, air pollution generally occurs at the regional scale due to atmospheric transport (Sun et al., 2014; L. Wang et al., 2014; Yang et al., 2015; Zheng et al., 2015). Regional pollution would bring more aged BC due to faster aging processes during atmospheric transport. The enhanced effect caused by more aged BC from atmospheric transport would further suppress the development of the boundary layer (e.g., Barbaro et al., 2013; Ding et al., 2016; Jacobson, 1998; Zdunkowski et al., 1976; Wendisch et al., 2008; Z. Wang et al., 2018), and together with the special haze chemistry (Cheng et al., 2016) strongly strengthens regional pollution.
The effect of BC-containing particles on air quality and climate is not only dominated by BC mass concentration, but is also controlled by their mixing state. To better understand the mixing state of atmospheric BC in China, we developed a new approach to simulate the BC aging process during atmospheric transport based on the BC emission inventory and back-trajectory analysis. Our models track the BC mixing state (i.e., Dp∕Dc ratio) from an emitted source origin (e.g., a grid) to a receptor (i.e., Tsinghua site). The model calculation can quantify the mass-averaged Dp∕Dc ratio of overall BC particles over the receptor site from various origins, which agreed well with observed ones. The simulations can provide information on the BC mixing state with fine temporal and spatial resolutions.
Based on the simulations of BC mixing state during atmospheric transport, we find a strong dependence of BC mixing state on emissions during atmospheric transport. BC particles with higher aging degrees at our site were mainly from more intensive emission origins (e.g., southern Hebei) due to higher aging rates. On the other hand, when BC particles emitted from clean origins passed through polluted regions, they were also characterized by a greater Dp∕Dc ratio by speeding up the aging process in polluted air. Our simulations demonstrated the importance of regional transport in BC light absorption in Beijing under polluted conditions. This provides a new perspective on the phenomenon of pollution building up in Beijing, further demonstrating that this is driven by regional transport and transformation rather than local sources and processes.
The data used in this study can be provided upon request to Qiang Zhang (qiangzhang@tsinghua.edu.cn).
The supplement related to this article is available online at: https://doi.org/10.5194/acp-19-9663-2019-supplement.
YZha and QZ designed the research and developed the model. YZha, HL and NW performed the field measurements. ML, YB, GG, CH, XL, DT, XZ, BZ and YZhe provided the emission data. YZha analyzed the data. YZha, QZ, YB, YC and HS interpreted the data. YZha and QZ wrote the manuscript with input from all the co-authors.
The authors declare that they have no conflict of interest.
This research has been supported by the National Natural Science Foundation of China (grant nos. 41571130032, 41571130035, 41625020 and 91744310).
This paper was edited by Aijun Ding and reviewed by Weijun Li and one anonymous referee.
Barbaro, E., Vilà-Guerau de Arellano, J., Krol, M. C., and Holtslag, A. A. M.: Impacts of Aerosol Shortwave Radiation Absorption on the Dynamics of an Idealized Convective Atmospheric Boundary Layer, Bound.-Lay. Meteorol., 148, 31–49, https://doi.org/10.1007/s10546-013-9800-7, 2013.
Bond, T. C., Doherty, S. J., Fahey, D. W., Forster, P. M., Berntsen, T., DeAngelo, B. J., Flanner, M. G., Ghan, S., Kärcher, B., Koch, D., Kinne, S., Kondo, Y., Quinn, P. K., Sarofim, M. C., Schultz, M. G., Schulz, M., Venkataraman, C., Zhang, H., Zhang, S., Bellouin, N., Guttikunda, S. K., Hopke, P. K., Jacobson, M. Z., Kaiser, J. W., Klimont, Z., Lohmann, U., Schwarz, J. P., Shindell, D., Storelvmo, T., Warren, S. G., and Zender, C. S.: Bounding the role of black carbon in the climate system: A scientific assessment, J. Geophys. Res.-Atmos., 118, 5380–5552, https://doi.org/10.1002/jgrd.50171, 2013.
Cappa, C. D., Onasch, T. B., Massoli, P., Worsnop, D. R., Bates, T. S., Cross, E. S., Davidovits, P., Hakala, J., Hayden, K. L., Jobson, B. T., Kolesar, K. R., Lack, D. A., Lerner, B. M., Li, S.-M., Mellon, D., Nuaaman, I., Olfert, J. S., Petäjä, T., Quinn, P. K., Song, C., Subramanian, R., Williams, E. J., and Zaveri, R. A.: Radiative Absorption Enhancements Due to the Mixing State of Atmospheric Black Carbon, Science, 337, 1078–1081, https://doi.org/10.1126/science.1223447, 2012.
Cheng, Y. F., Eichler, H., Wiedensohler, A., Heintzenberg, J., Zhang, Y. H., Hu, M., Herrmann, H., Zeng, L. M., Liu, S., Gnauk, T., Brüggemann, E., and He, L. Y.: Mixing state of elemental carbon and non-light-absorbing aerosol components derived from in situ particle optical properties at Xinken in Pearl River Delta of China, J. Geophys. Res.-Atmos., 111, D20204, https://doi.org/10.1029/2005JD006929 2006.
Cheng, Y. F., Wiedensohler, A., Eichler, H., Su, H., Gnauk, T., Brüggemann, E., Herrmann, H., Heintzenberg, J., Slanina, J., Tuch, T., Hu, M., and Zhang, Y. H.: Aerosol optical properties and related chemical apportionment at Xinken in Pearl River Delta of China, Atmos. Environ., 42, 6351–6372, https://doi.org/10.1016/j.atmosenv.2008.02.034, 2008.
Cheng, Y. F., Berghof, M., Garland, R. M., Wiedensohler, A., Wehner, B., Müller, T., Su, H., Zhang, Y. H., Achtert, P., Nowak, A., Pöschl, U., Zhu, T., Hu, M., and Zeng, L. M.: Influence of soot mixing state on aerosol light absorption and single scattering albedo during air mass aging at a polluted regional site in northeastern China, J. Geophys. Res.-Atmos., 114, D00G10, https://doi.org/10.1029/2008JD010883, 2009.
Cheng, Y. F., Su, H., Rose, D., Gunthe, S. S., Berghof, M., Wehner, B., Achtert, P., Nowak, A., Takegawa, N., Kondo, Y., Shiraiwa, M., Gong, Y. G., Shao, M., Hu, M., Zhu, T., Zhang, Y. H., Carmichael, G. R., Wiedensohler, A., Andreae, M. O., and Pöschl, U.: Size-resolved measurement of the mixing state of soot in the megacity Beijing, China: diurnal cycle, aging and parameterization, Atmos. Chem. Phys., 12, 4477–4491, https://doi.org/10.5194/acp-12-4477-2012, 2012.
Cheng, Y., Su, H., Koop, T., Mikhailov, E., and Pöschl, U.: Size dependence of phase transitions in aerosol nanoparticles, Nat. Commun., 6, 5923, https://doi.org/10.1038/ncomms6923, 2015.
Cheng, Y., Zheng, G., Wei, C., Mu, Q., Zheng, B., Wang, Z., Gao, M., Zhang, Q., He, K., and Carmichael, G.: Reactive nitrogen chemistry in aerosol water as a source of sulfate during haze events in China, Sci. Adv., 2, e1601530, https://doi.org/10.1126/sciadv.1601530, 2016.
Chung, C. E., Ramanathan, V., and Decremer, D.: Observationally constrained estimates of carbonaceous aerosol radiative forcing, P. Natl. Acad. Sci. USA, 109, 11624–11629, https://doi.org/10.1073/pnas.1203707109, 2012.
Cooke, W. F. and Wilson, J. J. N.: A global black carbon aerosol model, J. Geophys. Res.-Atmos., 101, 19395–19409, https://doi.org/10.1029/96JD00671, 1996.
Dahlkötter, F., Gysel, M., Sauer, D., Minikin, A., Baumann, R., Seifert, P., Ansmann, A., Fromm, M., Voigt, C., and Weinzierl, B.: The Pagami Creek smoke plume after long-range transport to the upper troposphere over Europe – aerosol properties and black carbon mixing state, Atmos. Chem. Phys., 14, 6111–6137, https://doi.org/10.5194/acp-14-6111-2014, 2014.
Ding, A. J., Huang, X., Nie, W., Sun, J. N., Kerminen, V. M., Petäjä, T., Su, H., Cheng, Y. F., Yang, X. Q., Wang, M. H., Chi, X. G., Wang, J. P., Virkkula, A., Guo, W. D., Yuan, J., Wang, S. Y., Zhang, R. J., Wu, Y. F., Song, Y., Zhu, T., Zilitinkevich, S., Kulmala, M., and Fu, C. B.: Enhanced haze pollution by black carbon in megacities in China, Geophys. Res. Lett., 43, 2873–2879, https://doi.org/10.1002/2016GL067745, 2016.
Ditas, J., Ma, N., Zhang, Y., Assmann, D., Neumaier, M., Riede, H., Karu, E., Williams, J., Scharffe, D., Wang, Q., Saturno, J., Schwarz, J. P., Katich, J. M., McMeeking, G. R., Zahn, A., Hermann, M., Brenninkmeijer, C. A. M., Andreae, M. O., Pöschl, U., Su, H., and Cheng, Y.: Strong impact of wildfires on the abundance and aging of black carbon in the lowermost stratosphere, P. Natl. Acad. Sci. USA, 115, E11595–E11603, https://doi.org/10.1073/pnas.1806868115, 2018.
Gao, R. S., Schwarz, J. P., Kelly, K. K., Fahey, D. W., Watts, L. A., Thompson, T. L., Spackman, J. R., Slowik, J. G., Cross, E. S., Han, J. H., Davidovits, P., Onasch, T. B., and Worsnop, D. R.: A Novel Method for Estimating Light-Scattering Properties of Soot Aerosols Using a Modified Single-Particle Soot Photometer, Aerosol Sci. Technol., 41, 125–135, https://doi.org/10.1080/02786820601118398, 2007.
Gustafsson, Ö. and Ramanathan, V.: Convergence on climate warming by black carbon aerosols, P. Natl. Acad. Sci. USA, 113, 4243–4245, https://doi.org/10.1073/pnas.1603570113, 2016.
Healy, R. M., Wang, J. M., Jeong, C.-H., Lee, A. K. Y., Willis, M. D., Jaroudi, E., Zimmerman, N., Hilker, N., Murphy, M., Eckhardt, S., Stohl, A., Abbatt, J. P. D., Wenger, J. C., and Evans, G. J.: Light-absorbing properties of ambient black carbon and brown carbon from fossil fuel and biomass burning sources, J. Geophys. Res.-Atmos., 120, 6619–6633, https://doi.org/10.1002/2015jd023382, 2015.
Jacobson, M. Z.: Studying the effects of aerosols on vertical photolysis rate coefficient and temperature profiles over an urban airshed, J. Geophys. Res.-Atmos., 103, 10593–10604, https://doi.org/10.1029/98JD00287, 1998.
Jacobson, M. Z.: Strong radiative heating due to the mixing state of black carbon in atmospheric aerosols, Nature, 409, 695–697, https://doi.org/10.1038/35055518, 2001.
Koch, K.: Transport and direct radiative forcing of carbonaceous and sulphate aerosols in the GISS GCM, J. Geophys. Res.-Atmos., 106, 20311–20332, https://doi.org/10.1029/2001JD900038, 2001.
Kondo, Y., Matsui, H., Moteki, N., Sahu, L., Takegawa, N., Kajino, M., Zhao, Y., Cubison, M. J., Jimenez, J. L., Vay, S., Diskin, G. S., Anderson, B., Wisthaler, A., Mikoviny, T., Fuelberg, H. E., Blake, D. R., Huey, G., Weinheimer, A. J., Knapp, D. J., and Brune, W. H.: Emissions of black carbon, organic, and inorganic aerosols from biomass burning in North America and Asia in 2008, J. Geophys. Res.-Atmos., 116, D08204, https://doi.org/10.1029/2010jd015152, 2011.
Lack, D. A. and Cappa, C. D.: Impact of brown and clear carbon on light absorption enhancement, single scatter albedo and absorption wavelength dependence of black carbon, Atmos. Chem. Phys., 10, 4207–4220, https://doi.org/10.5194/acp-10-4207-2010, 2010.
Laborde, M., Crippa, M., Tritscher, T., Jurányi, Z., Decarlo, P. F., Temime-Roussel, B., Marchand, N., Eckhardt, S., Stohl, A., Baltensperger, U., Prévôt, A. S. H., Weingartner, E., and Gysel, M.: Black carbon physical properties and mixing state in the European megacity Paris, Atmos. Chem. Phys., 13, 5831–5856, https://doi.org/10.5194/acp-13-5831-2013, 2013.
Li, M., Zhang, Q., Kurokawa, J.-I., Woo, J.-H., He, K., Lu, Z., Ohara, T., Song, Y., Streets, D. G., Carmichael, G. R., Cheng, Y., Hong, C., Huo, H., Jiang, X., Kang, S., Liu, F., Su, H., and Zheng, B.: MIX: a mosaic Asian anthropogenic emission inventory under the international collaboration framework of the MICS-Asia and HTAP, Atmos. Chem. Phys., 17, 935–963, https://doi.org/10.5194/acp-17-935-2017, 2017.
Li, W., Sun, J., Xu, L., Shi, Z., Riemer, N., Sun, Y., Fu, P., Zhang, J., Lin, Y., Wang, X., Shao, L., Chen, J., Zhang, X., Wang, Z., and Wang, W.: A conceptual framework for mixing structures in individual aerosol particles, J. Geophys. Res.-Atmos., 121, 13784–13798, https://doi.org/10.1002/2016jd025252, 2016.
Liu, D., Allan, J. D., Young, D. E., Coe, H., Beddows, D., Fleming, Z. L., Flynn, M. J., Gallagher, M. W., Harrison, R. M., Lee, J., Prevot, A. S. H., Taylor, J. W., Yin, J., Williams, P. I., and Zotter, P.: Size distribution, mixing state and source apportionment of black carbon aerosol in London during wintertime, Atmos. Chem. Phys., 14, 10061–10084, https://doi.org/10.5194/acp-14-10061-2014, 2014.
Liu, D., Joshi, R., Wang, J., Yu, C., Allan, J. D., Coe, H., Flynn, M. J., Xie, C., Lee, J., Squires, F., Kotthaus, S., Grimmond, S., Ge, X., Sun, Y., and Fu, P.: Contrasting physical properties of black carbon in urban Beijing between winter and summer, Atmos. Chem. Phys., 19, 6749–6769, https://doi.org/10.5194/acp-19-6749-2019, 2019.
Liu, D., Whitehead, J., Alfarra, M. R., Reyes-Villegas, E., Spracklen, D. V., Reddington, C. L., Kong, S., Williams, P. I., Ting, Y.-C., Haslett, S., Taylor, J. W., Flynn, M. J., Morgan, W. T., McFiggans, G., Coe, H., and Allan, J. D.: Black-carbon absorption enhancement in the atmosphere determined by particle mixing state, Nature Geosci., 10, 184–188, https://doi.org/10.1038/ngeo2901, 2017.
Liu, H., Pan, X., Liu, D., Liu, X., Chen, X., Tian, Y., Sun, Y., Fu, P., and Wang, Z.: Mixing characteristics of refractory black carbon aerosols determined by a tandem CPMA-SP2 system at an urban site in Beijing, Atmos. Chem. Phys. Discuss., https://doi.org/10.5194/acp-2019-244, in review, 2019.
Liu, S., Aiken, A. C., Gorkowski, K., Dubey, M. K., Cappa, C. D., Williams, L. R., Herndon, S. C., Massoli, P., Fortner, E. C., Chhabra, P. S., Brooks, W. A., Onasch, T. B., Jayne, J. T., Worsnop, D. R., China, S., Sharma, N., Mazzoleni, C., Xu, L., Ng, N. L., Liu, D., Allan, J. D., Lee, J. D., Fleming, Z. L., Mohr, C., Zotter, P., Szidat, S., and Prévôt, A. S. H.: Enhanced light absorption by mixed source black and brown carbon particles in UK winter, Nat Commun., 6, 8435, https://doi.org/10.1038/ncomms9435, 2015.
Lohmann, U., Feichter, J., Penner, J., and Leaitch, R.: Indirect effect of sulfate and carbonaceous aerosols: a mechanistic treatment, J. Geophys. Res.-Atmos., 105, 12193–12206, https://doi.org/10.1029/1999JD901199, 2000.
Lu, Z., Streets, D. G., Zhang, Q., and Wang, S.: A novel back-trajectory analysis of the origin of black carbon transported to the Himalayas and Tibetan Plateau during 1996–2010, Geophys. Res. Lett., 39, L01809, https://doi.org/10.1029/2011GL049903, 2012.
Matsui, H., Koike, M., Kondo, Y., Moteki, N., Fast, J. D., and Zaveri, R. A.: Development and validation of a black carbon mixing state resolved three-dimensional model: Aging processes and radiative impact, J. Geophys. Res.-Atmos., 118, 2304–2326, https://doi.org/10.1029/2012JD018446, 2013.
McMeeking, G. R., Morgan, W. T., Flynn, M., Highwood, E. J., Turnbull, K., Haywood, J., and Coe, H.: Black carbon aerosol mixing state, organic aerosols and aerosol optical properties over the United Kingdom, Atmos. Chem. Phys., 11, 9037–9052, https://doi.org/10.5194/acp-11-9037-2011, 2011.
Moffet, R. C. and Prather, K. A.: In-situ measurements of the mixing state and optical properties of soot with implications for radiative forcing estimates, P. Natl. Acad. Sci. USA, 106, 11872–11877, https://doi.org/10.1073/pnas.0900040106, 2009.
Moteki, N. and Kondo, Y.: Dependence of Laser-Induced Incandescence on Physical Properties of Black Carbon Aerosols: Measurements and Theoretical Interpretation, Aerosol Sci. Technol., 44, 663–675, https://doi.org/10.1080/02786826.2010.484450, 2010.
Moteki, N., Kondo, Y., Miyazaki, Y., Takegawa, N., Komazaki, Y., Kurata, G., Shirai, T., Blake, D. R., Miyakawa, T., and Koike, M.: Evolution of mixing state of black carbon particles: Aircraft measurements over the western Pacific in March 2004, Geophys. Res. Lett., 34, L11803, https://doi.org/10.1029/2006GL028943, 2007.
Morgan, W. T., Allan, J. D., Bauguitte, S., Darbyshire, E., Flynn, M. J., Lee, J., Liu, D., Johnson, B., Haywood, J., Longo, K. M., Artaxo, P. E., and Coe, H.: Transformation and aging of biomass burning carbonaceous aerosol over tropical South America from aircraft in-situ measurements during SAMBBA, Atmos. Chem. Phys. Discuss., https://doi.org/10.5194/acp-2019-157, in review, 2019.
Mu, Q., Shiraiwa, M., Octaviani, M., Ma, N., Ding, A., Su, H., Lammel, G., Pöschl, U., and Cheng, Y.: Temperature effect on phase state and reactivity controls atmospheric multiphase chemistry and transport of PAHs, Sci. Adv., 4, eaap7314, https://doi.org/10.1126/sciadv.aap7314, 2018.
Myhre, G., Berglen, T. F., Johnsrud, M., Hoyle, C. R., Berntsen, T. K., Christopher, S. A., Fahey, D. W., Isaksen, I. S. A., Jones, T. A., Kahn, R. A., Loeb, N., Quinn, P., Remer, L., Schwarz, J. P., and Yttri, K. E.: Modelled radiative forcing of the direct aerosol effect with multi-observation evaluation, Atmos. Chem. Phys., 9, 1365–1392, https://doi.org/10.5194/acp-9-1365-2009, 2009.
Nordmann, S., Cheng, Y. F., Carmichael, G. R., Yu, M., Denier van der Gon, H. A. C., Zhang, Q., Saide, P. E., Pöschl, U., Su, H., Birmili, W., and Wiedensohler, A.: Atmospheric black carbon and warming effects influenced by the source and absorption enhancement in central Europe, Atmos. Chem. Phys., 14, 12683–12699, https://doi.org/10.5194/acp-14-12683-2014, 2014.
Oshima, N., Koike, M., Zhang, Y., Kondo, Y., Moteki, N., Takegawa, N., and Miyazaki, Y.: Aging of black carbon in outflow from anthropogenic sources using a mixing state resolved model: Model development and evaluation, J. Geophys. Res.-Atmos., 114, D06210, https://doi.org/10.1029/2008JD010680, 2009.
Pan, X., Kanaya, Y., Taketani, F., Miyakawa, T., Inomata, S., Komazaki, Y., Tanimoto, H., Wang, Z., Uno, I., and Wang, Z.: Emission characteristics of refractory black carbon aerosols from fresh biomass burning: a perspective from laboratory experiments, Atmos. Chem. Phys., 17, 13001–13016, https://doi.org/10.5194/acp-17-13001-2017, 2017.
Peng, J., Hu, M., Guo, S., Du, Z., Zheng, J., Shang, D., Levy Zamora, M., Zeng, L., Shao, M., Wu, Y.-S., Zheng, J., Wang, Y., Glen, C. R., Collins, D. R., Molina, M. J., and Zhang, R.: Markedly enhanced absorption and direct radiative forcing of black carbon under polluted urban environments, P. Natl. Acad. Sci. USA, 113, 4266–4271, https://doi.org/10.1073/pnas.1602310113, 2016.
Ramanathan, V. and Carmichael, G.: Global and regional climate changes due to black carbon, Nature Geosci., 1, 221–227, https://doi.org/10.1038/ngeo156, 2008.
Ramnarine, E., Kodros, J. K., Hodshire, A. L., Lonsdale, C. R., Alvarado, M. J., and Pierce, J. R.: Effects of near-source coagulation of biomass burning aerosols on global predictions of aerosol size distributions and implications for aerosol radiative effects, Atmos. Chem. Phys., 19, 6561–6577, https://doi.org/10.5194/acp-19-6561-2019, 2019.
Riemer, N., Vogel, H., and Vogel, B.: Soot aging time scales in polluted regions during day and night, Atmos. Chem. Phys., 4, 1885–1893, https://doi.org/10.5194/acp-4-1885-2004, 2004.
Riemer, N., West, M., Zaveri, R. A., and Easter, R. C.: Simulating the evolution of soot mixing state with a particle-resolved aerosol model, J. Geophys. Res.-Atmos., 114, D09202, https://doi.org/10.1029/2008jd011073, 2009.
Schulz, M., Textor, C., Kinne, S., Balkanski, Y., Bauer, S., Berntsen, T., Berglen, T., Boucher, O., Dentener, F., Guibert, S., Isaksen, I. S. A., Iversen, T., Koch, D., Kirkevåg, A., Liu, X., Montanaro, V., Myhre, G., Penner, J. E., Pitari, G., Reddy, S., Seland, Ø., Stier, P., and Takemura, T.: Radiative forcing by aerosols as derived from the AeroCom present-day and pre-industrial simulations, Atmos. Chem. Phys., 6, 5225–5246, https://doi.org/10.5194/acp-6-5225-2006, 2006.
Sedlacek, A. J., Lewis, E. R., Kleinman, L., Xu, J., and Zhang, Q.: Determination of and evidence for non-core-shell structure of particles containing black carbon using the Single-Particle Soot Photometer (SP2), Geophys. Res. Lett., 39, L06802, https://doi.org/10.1029/2012GL050905, 2012.
Shi, S., Cheng, T., Gu, X., Guo, H., Wu, Y., and Wang, Y.: Biomass burning aerosol characteristics for different vegetation types in different aging periods, Environ. Int., 126, 504–511, https://doi.org/10.1016/j.envint.2019.02.073, 2019.
Shiraiwa, M., Kondo, Y., Moteki, N., Takegawa, N., Miyazaki, Y., and Blake, D. R.: Evolution of mixing state of black carbon in polluted air from Tokyo, Geophys. Res. Lett., 34, L16803, https://doi.org/10.1029/2007GL029819, 2007.
Sun, Y., Jiang, Q., Wang, Z., Fu, P., Li, J., Yang, T., and Yin, Y.: Investigation of the sources and evolution processes of severe haze pollution in Beijing in January 2013, J. Geophys. Res.-Atmos., 119, 4380–4398, https://doi.org/10.1002/2014JD021641, 2014.
Schwarz, J. P., Gao, R. S., Spackman, J. R., Watts, L. A., Thomson, D. S., Fahey, D. W., Ryerson, T. B., Peischl, J., Holloway, J. S., and Trainer, M.: Measurement of the mixing state, mass, and optical size of individual black carbon particles in urban and biomass burning emissions, Geophys. Res. Lett., 35, L13810, https://doi.org/10.1029/2008GL033968, 2008.
Taylor, J. W., Allan, J. D., Liu, D., Flynn, M., Weber, R., Zhang, X., Lefer, B. L., Grossberg, N., Flynn, J., and Coe, H.: Assessment of the sensitivity of core / shell parameters derived using the single-particle soot photometer to density and refractive index, Atmos. Meas. Tech., 8, 1701–1718, https://doi.org/10.5194/amt-8-1701-2015, 2015.
Wang, L. T., Wei, Z., Yang, J., Zhang, Y., Zhang, F. F., Su, J., Meng, C. C., and Zhang, Q.: The 2013 severe haze over southern Hebei, China: model evaluation, source apportionment, and policy implications, Atmos. Chem. Phys., 14, 3151–3173, https://doi.org/10.5194/acp-14-3151-2014, 2014.
Wang, X., Heald, C. L., Ridley, D. A., Schwarz, J. P., Spackman, J. R., Perring, A. E., Coe, H., Liu, D., and Clarke, A. D.: Exploiting simultaneous observational constraints on mass and absorption to estimate the global direct radiative forcing of black carbon and brown carbon, Atmos. Chem. Phys., 14, 10989–11010, https://doi.org/10.5194/acp-14-10989-2014, 2014.
Wang, Y., Liu, F., He, C., Bi, L., Cheng, T., Wang, Z., Zhang, H., Zhang, X., Shi, Z., and Li, W.: Fractal Dimensions and Mixing Structures of Soot Particles during Atmospheric Processing, Environ. Sci. Technol. Lett., 4, 487–493, https://doi.org/10.1021/acs.estlett.7b00418, 2017.
Wang, Y., Ma, P.-L., Peng, J., Zhang, R., Jiang, J. H., Easter, R. C., and Yung, Y. L.: Constraining Aging Processes of Black Carbon in the Community Atmosphere Model Using Environmental Chamber Measurements, J. Adv. Model. Earth Sy., 10, 2514–2526, https://doi.org/10.1029/2018ms001387, 2018.
Wang, Z., Huang, X., and Ding, A.: Dome effect of black carbon and its key influencing factors: a one-dimensional modelling study, Atmos. Chem. Phys., 18, 2821–2834, https://doi.org/10.5194/acp-18-2821-2018, 2018.
Wendisch, M., Hellmuth, O., Ansmann, A., Heintzenberg, J., Engelmann, R., Althausen, D., Eichler, H., Müller, D., Hu, M., Zhang, Y., and Mao, J.: Radiative and dynamic effects of absorbing aerosol particles over the Pearl River Delta, China, Atmos. Environ., 42, 6405–6416, https://doi.org/10.1016/j.atmosenv.2008.02.033, 2008.
Willis, M. D., Healy, R. M., Riemer, N., West, M., Wang, J. M., Jeong, C.-H., Wenger, J. C., Evans, G. J., Abbatt, J. P. D., and Lee, A. K. Y.: Quantification of black carbon mixing state from traffic: implications for aerosol optical properties, Atmos. Chem. Phys., 16, 4693–4706, https://doi.org/10.5194/acp-16-4693-2016, 2016.
Yang, Y. R., Liu, X. G., Qu, Y., An, J. L., Jiang, R., Zhang, Y. H., Sun, Y. L., Wu, Z. J., Zhang, F., Xu, W. Q., and Ma, Q. X.: Characteristics and formation mechanism of continuous hazes in China: a case study during the autumn of 2014 in the North China Plain, Atmos. Chem. Phys., 15, 8165–8178, https://doi.org/10.5194/acp-15-8165-2015, 2015.
Zdunkowski, W. G., Welch, R. M., and Paegle, J.: One-Dimensional Numerical Simulation of the Effects of Air Pollution on the Planetary Boundary Layer, J. Atmos. Sci., 33, 2399–2414, https://doi.org/10.1175/1520-0469(1976)033<2399:ODNSOT>2.0.CO;2, 1976.
Zhang, Y., Zhang, Q., Cheng, Y., Su, H., Kecorius, S., Wang, Z., Wu, Z., Hu, M., Zhu, T., Wiedensohler, A., and He, K.: Measuring the morphology and density of internally mixed black carbon with SP2 and VTDMA: new insight into the absorption enhancement of black carbon in the atmosphere, Atmos. Meas. Tech., 9, 1833–1843, https://doi.org/10.5194/amt-9-1833-2016, 2016.
Zhang, Y., Li, X., Li, M., Zheng, Y., Geng, G., Hong, C., Li, H., Tong, D., Zhang, X., Cheng, Y., Su, H., He, K., and Zhang, Q.: Reduction in black carbon light absorption due to multi-pollutant emission control during APEC China 2014, Atmos. Chem. Phys., 18, 10275–10287, https://doi.org/10.5194/acp-18-10275-2018, 2018a.
Zhang, Y., Su, H., Ma, N., Li, G., Kecorius, S., Wang, Z., Hu, M., Zhu, T., He, K., Wiedensohler, A., Zhang, Q., and Cheng, Y.: Sizing of Ambient Particles From a Single-Particle Soot Photometer Measurement to Retrieve Mixing State of Black Carbon at a Regional Site of the North China Plain, J. Geophys. Res.-Atmos., 123, 12778–12795, https://doi.org/10.1029/2018JD028810, 2018b.
Zhang, Y., Zhang, Q., Cheng, Y., Su, H., Li, H., Li, M., Zhang, X., Ding, A., and He, K.: Amplification of light absorption of black carbon associated with air pollution, Atmos. Chem. Phys., 18, 9879–9896, https://doi.org/10.5194/acp-18-9879-2018, 2018c.
Zheng, G. J., Duan, F. K., Su, H., Ma, Y. L., Cheng, Y., Zheng, B., Zhang, Q., Huang, T., Kimoto, T., Chang, D., Pöschl, U., Cheng, Y. F., and He, K. B.: Exploring the severe winter haze in Beijing: the impact of synoptic weather, regional transport and heterogeneous reactions, Atmos. Chem. Phys., 15, 2969–2983, https://doi.org/10.5194/acp-15-2969-2015, 2015.
Zheng, G., Duan, F., Ma, Y., Zhang, Q., Huang, T., Kimoto, T., Cheng, Y., Su, H., and He, K.: Episode-Based Evolution Pattern Analysis of Haze Pollution: Method Development and Results from Beijing, China, Environ. Sci. Technol., 50, 4632–4641, https://doi.org/10.1021/acs.est.5b05593, 2016.