the Creative Commons Attribution 4.0 License.
the Creative Commons Attribution 4.0 License.
 | 30 Jul 2019
Peroxy radical measurements by ethane – nitric oxide chemical amplification and laser-induced fluorescence during the IRRONIC field campaign in a forest in Indiana
Shuvashish Kundu
Benjamin L. Deming
Michelle M. Lew
Brandon P. Bottorff
Pamela Rickly
Philip S. Stevens
Sebastien Dusanter
Sofia Sklaveniti
Thierry Leonardis
Nadine Locoge
Ezra C. Wood
Peroxy radicals were measured in a mixed deciduous forest atmosphere in Bloomington, Indiana, USA, during the Indiana Radical, Reactivity and Ozone Production Intercomparison (IRRONIC) during the summer of 2015. Total peroxy radicals () were measured by a newly developed technique involving chemical amplification using nitric oxide (NO) and ethane (C2H6) followed by NO2 detection by cavity-attenuated phase-shift spectroscopy (hereinafter referred to as ECHAMP – Ethane CHemical AMPlifier). The sum of hydroperoxy radicals (HO2) and a portion of organic peroxy radicals (, ) was measured by the Indiana University (IU) laser-induced fluorescence–fluorescence assay by gas expansion instrument (LIF-FAGE). Additional collocated measurements include concentrations of NO, NO2, O3, and a wide range of volatile organic compounds (VOCs) and meteorological parameters. XO2 concentrations measured by ECHAMP peaked between 13:00 and 16:00 local time (LT), with campaign average concentrations of 41±15 ppt (1σ) at 14:00 LT. Daytime concentrations of isoprene averaged 3.6±1.9 ppb (1σ), whereas average concentrations of NOx ([NO] + [NO2]) and toluene were 1.2 and 0.1 ppb, respectively, indicating a low impact from anthropogenic emissions at this site.
We compared ambient measurements from both instruments and conducted a calibration source comparison. For the calibration comparison, the ECHAMP instrument, which is primarily calibrated with an acetone photolysis method, sampled the output of the LIF-FAGE calibration source which is based on the water vapor photolysis method and, for these comparisons, generated a 50 %–50 % mixture of HO2 and either butane or isoprene-derived RO2. A bivariate fit of the data yields the relation ppt. This level of agreement is within the combined analytical uncertainties for the two instruments' calibration methods.
A linear fit of the daytime (09:00–22:00 LT) 30 min averaged [XO2] ambient data with the 1 min averaged [] data (one point per 30 min) yields the relation . Day-to-day variability in the ratio was observed. The lowest ratios between 13:00 and 16:00 LT were 0.8 on 13 and 18 July, whereas the highest ratios of 1.1 to 1.3 were observed on 24 and 25 July – the same 2 d on which the highest concentrations of isoprene and ozone were observed. Although the exact composition of the peroxy radicals during IRRONIC is not known, zero-dimensional photochemical modeling of the IRRONIC dataset using two versions of the Regional Atmospheric Chemistry Mechanism (RACM2 and RACM2-LIM1) and the Master Chemical Mechanism (MCM 3.2 and MCM 3.3.1) all predict afternoon ratios of between 1.2 and 1.5. Differences between the observed ambient ratio and that predicted with the 0-D modeling can be attributed to deficiencies in the model, errors in one of the two measurement techniques, or both. Time periods in which the ambient ratio was less than 1 are definitely caused by measurement errors (including calibration differences), as such ratios are not physically meaningful. Although these comparison results are encouraging and demonstrate the viability in using the new ECHAMP technique for field measurements of peroxy radicals, further research investigating the overall accuracy of the measurements and possible interferences from both methods is warranted.
- Article
(4203 KB) - Full-text XML
-
Supplement
(1075 KB) - BibTeX
- EndNote


Peroxy radicals in the atmosphere comprise hydroperoxy (HO2) and organic peroxy radicals (RO2; R is an organic group). The most important sources of peroxy radicals are the reactions of oxidants (OH, O3, and NO3) with volatile organic compounds (VOCs), photolysis of oxygenated VOCs, and decomposition of peroxyacetyl nitrate (PAN; Atkinson, 2000). Chemistry involving ROx radicals () leads to the formation of ozone (O3), oxygenated VOCs, and secondary aerosol particles (Atkinson, 1997; Atkinson and Arey, 2003; Claeys et al., 2004; Kroll and Seinfeld, 2008; Ng et al., 2008). The chemical identity and concentrations of peroxy radicals can provide important information on atmospheric oxidation processes such as ozone production, the removal efficiency of primary pollutants, and radical budgets. This information is ultimately required to formulate pollution control strategies and to evaluate the impacts of atmospheric chemistry on health and global climate. It is therefore crucial to understand the concentrations and chemistry of ROx radicals in the atmosphere.
Comparison of measured radical concentrations with those produced by photochemical models is a common exercise used to assess our understanding of atmospheric chemistry. Discrepancies of a factor of 2 or more between measured and modeled OH concentrations have been reported in biogenic VOC-rich forest environments (Lelieveld et al., 2008; Lu et al., 2012; Pugh et al., 2010), suggesting that our knowledge of atmospheric photochemistry is deficient. Similarly, discrepancies between measured and modeled peroxy radicals have suggested the presence of unknown sources or sinks of peroxy radicals (Griffith et al., 2013; Wolfe et al., 2014). These findings have fueled research into the oxidation mechanisms of biogenic VOCs, especially isoprene (e.g., Wennberg et al., 2018). Although much has been learned in the past decade, the atmospheric fate of biogenic VOCs remains incompletely understood.
Some past model–measurement comparisons are difficult to interpret because of measurement errors that have recently been discovered. Measurements of OH by the laser-induced fluorescence technique can be affected by a sampling-related interference which can exceed the actual concentration of OH (Mao et al., 2012), though the magnitude of this interference and even its presence vary greatly depending on instrument design. Similarly, many previous measurements of HO2 by chemical conversion to OH through the reaction using both the Indiana University (IU) laser-induced fluorescence–fluorescence assay by gas expansion instrument (LIF-FAGE) and the peroxy radical chemical ionization mass spectrometer (perCIMS) techniques have been shown to have been affected by a variable contribution from organic peroxy radicals (Fuchs et al., 2011; Hornbrook et al., 2011), and the LIF-based measurements subject to this interference are now referred to as (, 0<α<1). The sensitivity of the LIF-FAGE technique to each type of organic peroxy radical varies with the amount of NO added for the conversion and is dependent on the instrument, but in general, it is highest (up to ∼ 90 %) for β-hydroxy peroxy radicals derived from alkenes and lowest for those derived from small alkanes (Fuchs et al., 2011; Lew et al., 2018; Whalley et al., 2013). This RO2 interference can be greatly reduced by use of lower NO concentrations or reaction times, yielding conversion efficiencies for isoprene-RO2 under 20 % (Feiner et al., 2016; Fuchs et al., 2011; Tan et al., 2017; Whalley et al., 2013).
Discrepancies between measured and model-predicted OH and XO2 concentrations can be caused by a combination of measurement errors, missing or incorrect chemistry in models, and erroneous model constraints. Measurement errors can be evaluated by the comparison of atmospheric measurements by multiple techniques. Several HOx intercomparison projects have been conducted in the past few decades (Eisele et al., 2003; Fuchs et al., 2010, 2012; Hofzumahaus et al., 1998; Mount and Williams, 1997; Onel et al., 2017; Ren et al., 2003, 2012; Sanchez et al., 2018; Schlosser et al., 2009; Zenker et al., 1998). There have been few intercomparisons, however, of total peroxy radical () measurements, and these have produced mixed results. For example, excellent agreement between the matrix-isolation electron spin resonance (MI-ESR) and the ROx LIF-FAGE techniques was observed in a chamber study involving HO2, CH3O2, and C4H7O2 produced by the oxidation of methane and 1-butene (Fuchs et al., 2009). An earlier comparison of XO2 measurements between a CO-based chemical amplifier (PERCA) and MI-ESR showed overall agreement of within 10 % (Platt et al., 2002). In contrast, XO2 measurements in a forest from two similar CO-based chemical amplifiers differed by more than a factor of 3 (Burkert et al., 2001). This disagreement was attributed to sampling losses on a rain cover. Similarly, XO2 measurements from two CO-based chemical amplifiers during the airborne African Monsoon Multidisciplinary Analysis (AMMA) campaign differed by factors of 2–4 when the usual relative-humidity-dependent calibration (Mihele and Hastie, 1998) was used for the chemical amplifier data, though the performance of one of the instruments was not assessed with in-flight calibrations (Andrés-Hernández et al., 2010).
The relative-humidity dependence of the chemical amplification technique is addressed in a variety of ways. Most research groups characterize their instrument's amplification factor (chain length) as a function of relative humidity (RH) which they then apply to their measurements based on the ambient RH. In some cases, because the RH in the amplification chamber can be lower than ambient because of reduced pressure and higher temperatures, the variability in RH can be considered negligible compared to other experimental uncertainties (Andrés-Hernández et al., 2010; Kartal et al., 2010). In one case the need to apply an RH-dependent calibration was disputed (Sommariva et al., 2011) despite strong experimental evidence (Butkovskaya et al., 2007, 2005, 2009; Mihele et al., 1999; Mihele and Hastie, 1998; Reichert et al., 2003). Due to the paucity of XO2 measurement intercomparisons and these new questions regarding the impact of relative humidity on the traditional chemical amplifier technique, further intercomparisons involving different instruments are required before we have enough confidence in the measurements to interpret model–measurement discrepancies as arising from unknown chemistry in models.
This paper presents measurements of XO2 in a mixed deciduous forest by the new Ethane CHemical AMPlifier (ECHAMP) technique (Wood et al., 2017), which is a variation of the traditional chemical amplification or PERCA method (Cantrell and Stedman, 1982; Hastie et al., 1991; Wood and Charest, 2014). Measured XO2 concentrations at this high-isoprene, low-NOx environment are described along with supporting measurements of ozone (O3), nitrogen oxides (NOx), biogenic and anthropogenic VOCs, and meteorology. We compare measurements of XO2 by ECHAMP with collocated ambient measurements of by the Indiana University LIF-FAGE technique. We also describe calibration comparison experiments in which ECHAMP, which was calibrated by an acetone photolysis calibration method, quantified radical concentrations produced by the LIF-FAGE calibration source which is based on the more common water photolysis method. Ozone formation rates are also calculated based on measured XO2 and NO concentrations.
2.1 Site description
The measurements were carried out at the Indiana University Research and Teaching Preserve (IURTP) field laboratory during the Indiana Radical, Reactivity and Ozone Production Intercomparison (IRRONIC) campaign over the time period of 9 July–8 August 2015. The IURTP is located in a mixed deciduous forest 1 km from the perimeter road for Indiana University in Bloomington (Fig. 1). Instrument inlets and related instrumental accessories were set atop a 3 m scaffolding platform in a clearing behind the IURTP building. The height of the scaffolding was several meters below the forest canopy. The major analytical instruments and gas cylinders were housed inside the building.
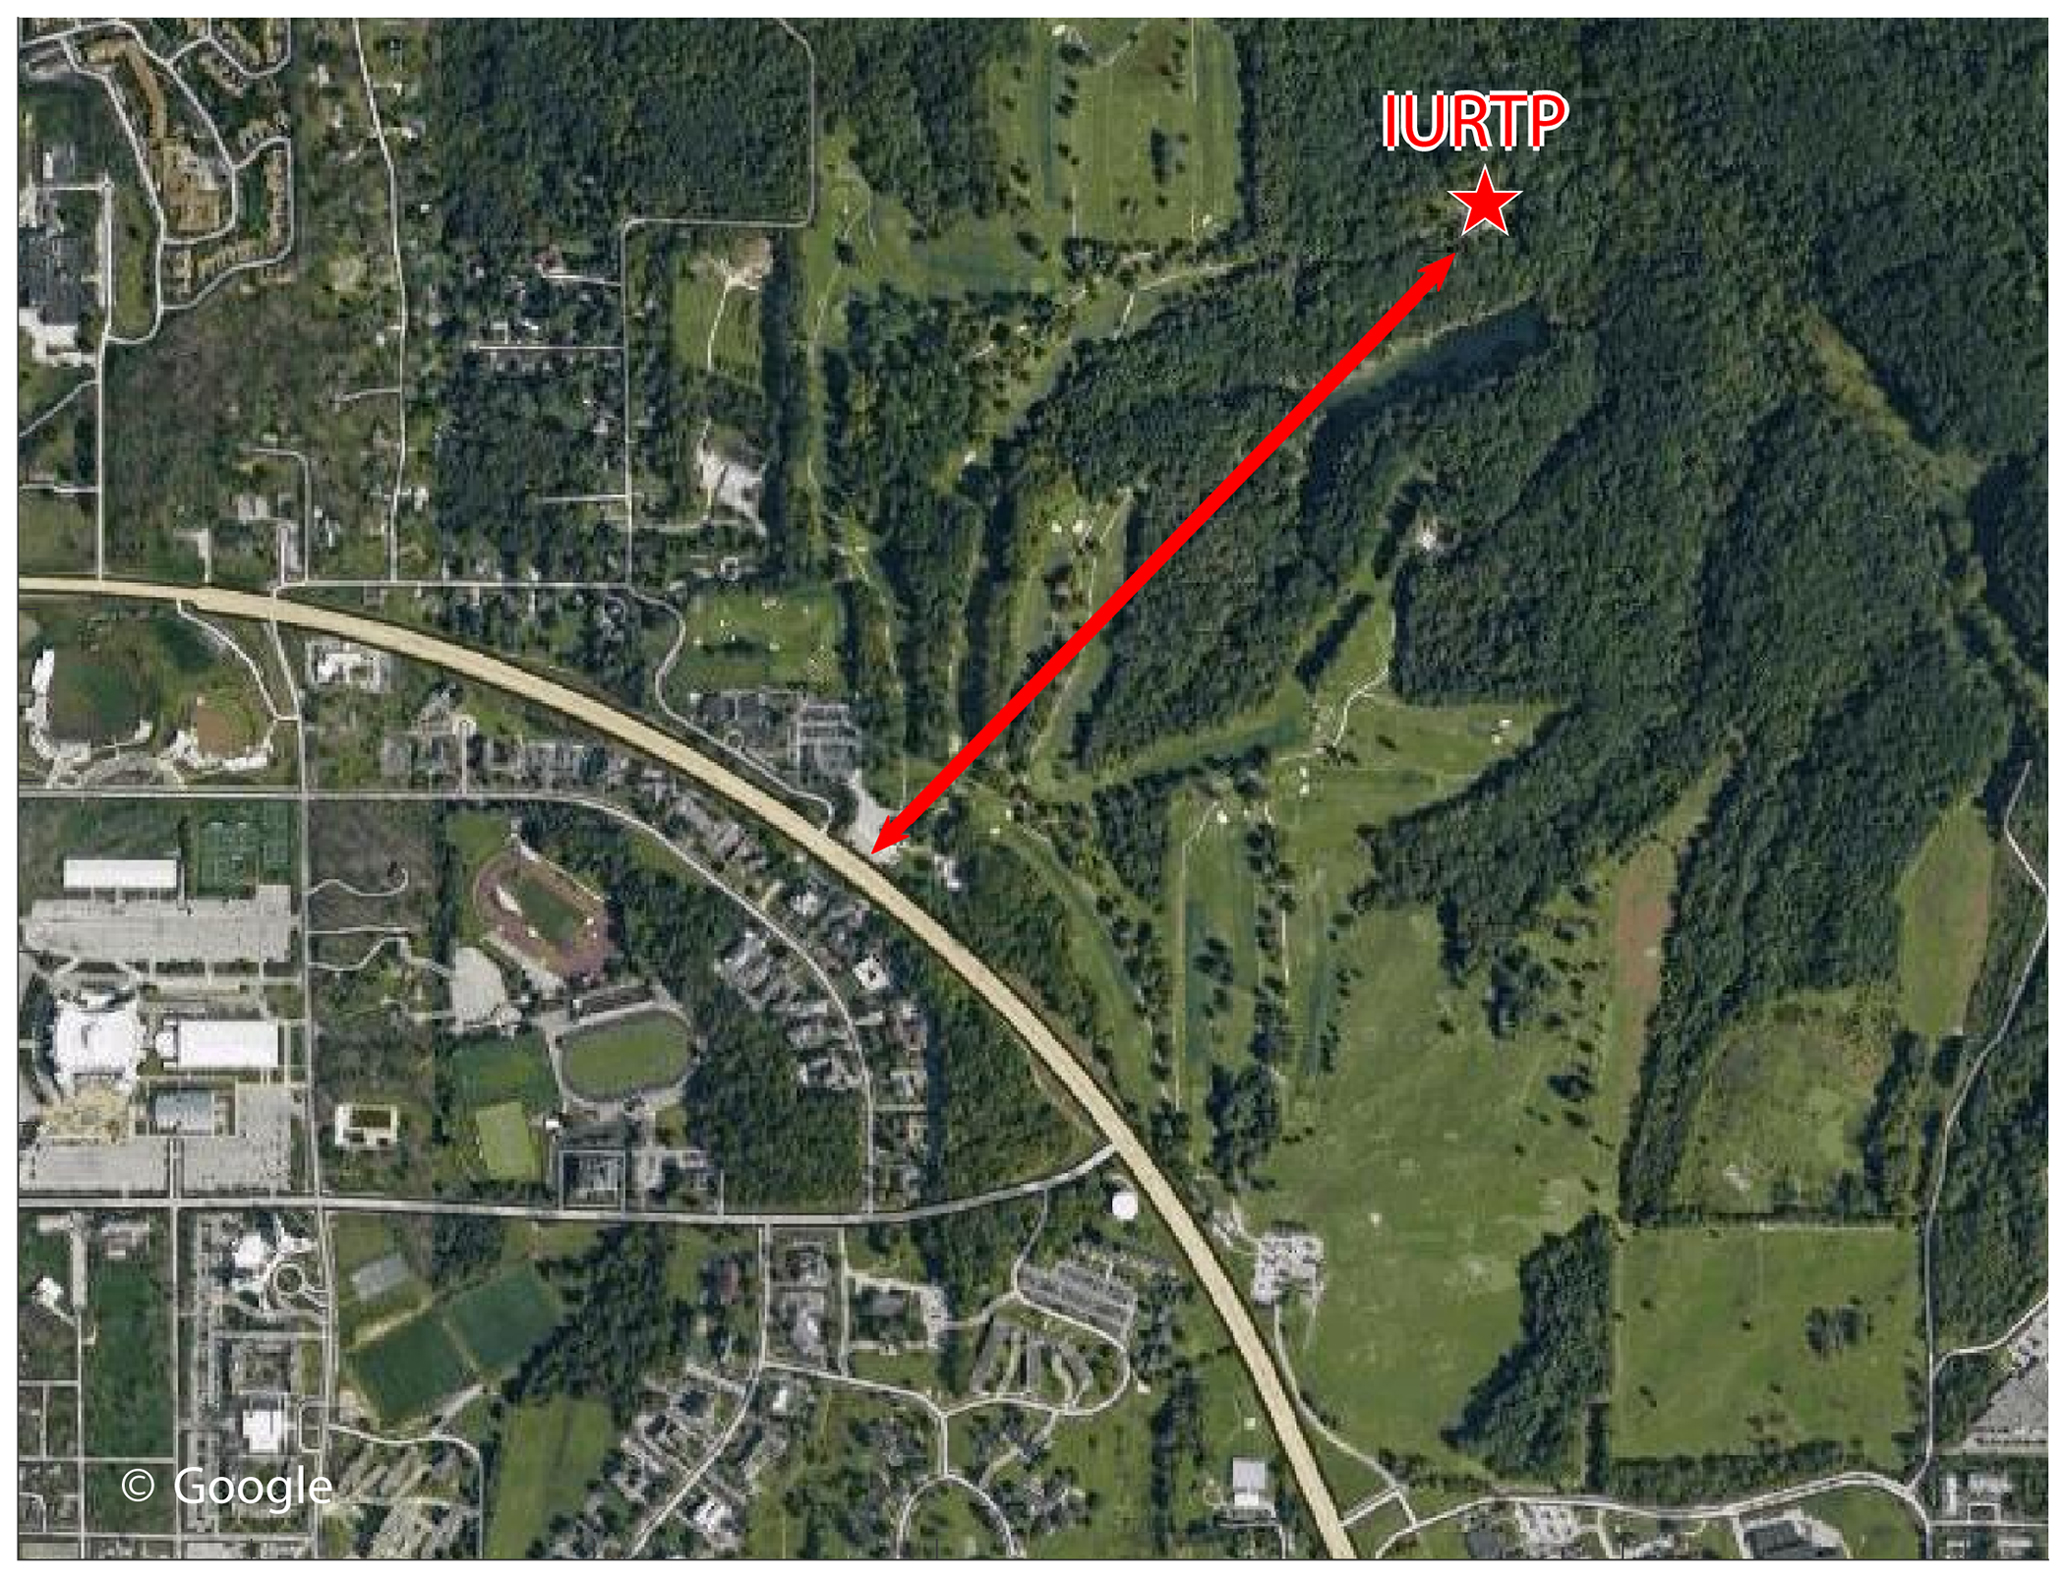
Figure 1Map of the sampling site. The star symbol represents the Indiana University Research and Teaching Preserve (IURTP) in Bloomington, Indiana, USA. The arrow represents a distance of 1 km.
2.2 ECHAMP measurements of total peroxy radicals (XO2)
XO2 concentrations were quantified using a newly developed analytical technique, which involves chemical amplification by ethane (C2H6) and nitric oxide (NO) followed by nitrogen dioxide (NO2) detection using cavity-attenuated phase-shift spectroscopy (hereinafter referred as ECHAMP – Ethane CHemical AMPlifier; Wood et al., 2017). This instrument can be thought of as a descendent of “traditional” chemical amplifiers, also known as PERCA, in which ambient air is mixed with carbon monoxide and nitric oxide and the resulting “amplified” NO2 are measured by the luminol technique (Cantrell and Stedman, 1982; Clemitshaw et al., 1997; Kartal et al., 2010; Mihele and Hastie, 2000). Our initial peroxy radical sensor (Wood and Charest, 2014) relied on the original CO and NO amplification chemistry but utilized a modern, highly sensitive NO2 detection method: cavity-attenuated phase-shift spectroscopy (CAPS; Kebabian et al., 2007, 2008). The major modification made for the ECHAMP method used for the measurements described in this study is that ethane (C2H6) replaces CO as a reagent. This results in a greatly improved ability to deploy thanks to the relative safety of C2H6 compared to CO, and a smaller dependence of the sensitivity on relative humidity, but at the expense of lower amplification factors. The cause of the RH dependence of the CO-based amplification chemistry is the RH dependence of the main radical termination step: the reaction of HO2 with NO to form HNO3 (Butkovskaya et al., 2007, 2005, 2009; Mihele et al., 1999; Reichert et al., 2003), with a smaller contribution from the RH-dependent wall losses of HO2. These two RH-dependent radical termination steps affect the ethane-based amplification chemistry as well, but the most important terminations steps are from the formation of ethyl nitrite and ethyl nitrate – neither of which depends on relative humidity.
Details of the experimental technique are described elsewhere (Wood et al., 2017), but its deployment at the IURTP is described here. The ECHAMP inlet was attached to scaffolding at a height of 3 m. Ambient air was sampled at a flow rate of 5.5 standard liters per minute (slpm) into a 0.4 cm inner diameter (ID) glass sampling cross internally coated with halocarbon wax (Halocarbon Products Corporation, series 1500) and externally coated with polytetrafluoroethylene (PTFE) tape. The sampled air then entered two identical reaction chambers (0.4 cm ID,× 61 cm, FEP – fluorinated ethylene propylene – tubing) at a flow rate of 0.87 slpm; see schematic in Wood and Charest (2014). The total residence time in the sampling cross before entering the reaction chambers was approximately 18 ms.
At any given point in time, one reaction chamber operated in amplification (ROx) mode while the other operated in background (Ox) mode. In ROx mode, the air was immediately mixed with NO and C2H6 in the “upstream” reagent addition port and, 0.1 second later, mixed with nitrogen (N2) in the “downstream” reagent addition port, effecting the following radical propagation reactions:
Reactions (R3)–(R7) repeat several times, leading to the formation of NO2 that is subsequently measured by a CAPS sensor. In background (Ox) mode, the N2 and C2H6 flows were switched: sampled air was mixed with NO and N2 upstream and C2H6 downstream. During this sampling mode, sampled radicals are removed by a combination of Reactions (R1)–(R3) and finally the reaction of OH with NO to form HONO. The flow rates of NO, N2, and C2H6 were each maintained at 45 sccm using mass flow controllers (MKS model 1179A and Alicat MC series). Cylinder concentrations of NO and C2H6 (Indiana Oxygen Company) were 21.1 ppm and 30 %, respectively, leading to concentrations in the reaction chamber of 0.9 ppm and 1.4 %, respectively. Both upstream and downstream injections were delivered with perfluoroalkoxy (PFA) tubing (0.16 cm ID). Each reaction chamber alternated between ROx and Ox mode every 45 s on an anti-synchronized schedule using four solenoid valves controlled by LabVIEW software (National Instruments). After the downstream reagent addition, the air from each reaction chamber flowed through 1 m of 0.32 cm ID FEP tubing, a particulate matter filter (United Filtration Systems, Inc., DIF BN60), and another 6 m of tubing before entering identical CAPS monitors located inside the laboratory. The CAPS NO2 measurements during ROx mode are from ambient NO2, NO2 from the reaction of NO and O3 in the reaction chamber and transport tubing, and NO2 from the chemical amplification reactions involving HO2 and RO2 (Reactions R1–R7). In Ox mode, the CAPS measures NO2 from the first two categories above and NO2 produced by Reactions (R1) and (R3) but not from the amplification reactions (Reactions R3–R7), as ethane is not added until all radicals are removed by formation of HONO.
The concentrations of peroxy radicals were calculated by dividing the difference between the two CAPS sensors' NO2 measurements (ΔNO2) between ROx and Ox modes by an experimentally determined amplification factor F:
The RH-dependent amplification factor F was measured using the acetone photolysis method described by Wood and Charest (2014). Briefly, methyl peroxy (CH3O2) and peroxyacetyl (CH3C(O)OO) radicals (50–400 ppt) were produced by the photolysis of acetone vapor and reacted with excess NO to form NO2, which was quantified using a CAPS NO2 sensor. The accuracy of this calibration method ultimately depends on the accuracy of the CAPS NO2 measurement (see Supplement) and knowledge of the products of the reaction of CH3O2 and CH3C(O)OO with NO but does not depend on measurements of actinic flux.
The amplification factor F was measured to be 28 at 0 % relative humidity (RH) and decreased to 6 at 90 % RH (Wood et al., 2017). The RH was typically between 50 % and 75 % during the afternoon, corresponding to values of F between 20 and 11. These values are based on laboratory calibrations performed before and after the field project. During the field campaign, we attempted to use a variation on the calibration method described by Wood and Charest (2014). Rather than flow air through the headspace over pure acetone to produce dilute acetone vapor, we instead flowed air through the headspace of dilute (1 %) aqueous acetone in an attempt to obviate the need to dilute the resulting acetone vapor (i.e., by reducing the vapor pressure of the acetone per Raoult's law). Inconsistent calibrations were a result, however, and subsequent laboratory tests demonstrated that the use of aqueous acetone sometimes produced compounds that absorb blue light and therefore interfered with the CAPS NO2 measurement, which is based on absorption of light at 450 nm with a bandpass of 10 nm (full width at half maximum). Because field calibrations were unsuccessful, we have increased the measurement uncertainty accordingly (see below). The acetone vapor photolysis calibration results obtained in the laboratory also agreed with our prototype H2O photolysis method as described in Wood et al. (2017). Further details on the calibration are described in the Supplement.
Individual peroxy radicals are not detected with equal sensitivity by ECHAMP due to the formation of organic nitrates and organic nitrites in the reaction chambers:
Including a sampling loss term, the sensitivity “α” of ECHAMP to individual organic peroxy radicals relative to that of HO2 can be estimated using Eq. (2):
where is the sensitivity of ECHAMP to individual RO2 compounds relative to that of HO2, Li is the fractional sampling transmission of an individual organic peroxy species RiO2 through the short inlet into the reaction chambers (relative to that of HO2), Y is the alkyl nitrate yield (), and the remaining terms in parentheses account for alkyl nitrite (RONO) formation. Alkyl nitrate yields increase with the carbon backbone number, from less than 0.1 % for CH3O2 to 8 % for isoprene and to over 25 % for C10 and larger alkyl peroxy radicals (Lockwood et al., 2010; Orlando and Tyndall, 2012). Alkyl nitrite (RONO) formation accounts for less than a 4 % loss for most organic peroxy radicals and is likely negligible for alkene-derived peroxy radicals due to the rapid decomposition of β-hydroxy alkoxy radicals (Atkinson, 1997) but can sequester a calculated 10 % loss of CH3O2 (Wood et al., 2017). Sampling losses are limited to the 18 ms transit time in the halocarbon wax-coated sampling cross to the tee in which the NO and C2H6 are added. Mihele et al. (1999) measured effective first-order wall loss rate constants of 3 to 7 s−1 for HO2 onto 0.64 cm OD (outer diameter) PFA tubing, depending on RH, and ∼ 0.5 s−1 for CH3O2 and C2H5O2. Though this would suggest losses in our inlet of up to 12 % for HO2 and 1 % for the alkyl peroxy radicals, laboratory tests on our inlet have demonstrated losses of less than 2 % for HO2 in our inlet and loss rate constants onto various fluoropolymers much lower than presented in Mihele et al. (1999), as described in the Supplement.
At an RH of 50 %, the theoretical 1σ precision of the ECHAMP measurements, limited by only the precision of the CAPS NO2 measurements and the amplification factor, was 0.8 ppt for a 90 s average. The atmospheric variability in O3, which after reaction with NO accounts for most of the NO2 observed by the CAPS sensors, led to an additional contribution to the noise due to the slightly different time responses of the two CAPS sensors. The observed precision during sampling was typically 2.5 ppt (1σ) for 90 s averaging (Wood et al., 2017), leading to a detection limit of 5 ppt for 90 s averaging and 1.6 ppt for 15 min averages at a signal-to-noise ratio of 2. At night, although variability in O3 was negligible, high RH values of over 95 % and the resulting low values of F led to detection limits of between 2 and 8 ppt for 90 s average measurements.
We assign an uncertainty of 27 % (2σ) to the ECHAMP measurements during the IRRONIC project, comprising the uncertainty in the NO2 calibration of the CAPS sensors (5 %), the uncertainty in the relative-humidity-dependent amplification factor (usually 16 %, but it increased to 25 % because post-deployment laboratory calibrations were used instead of the unsuccessful field calibrations using aqueous acetone), and the variable sensitivity to speciated peroxy radicals. We estimate an elevated uncertainty of ∼ 50 % for the measurements at night, as we have not investigated the sensitivity of ECHAMP to peroxy radicals produced by ozonolysis and NO3 reactions. These uncertainties are more fully described in Wood et al. (2017). Except where noted otherwise, all ECHAMP XO2 measurements presented are 15 min averages.
2.3 Laser-induced fluorescence measurements
was measured by the LIF-FAGE technique described in detail elsewhere (Griffith et al., 2013; Dusanter et al., 2008). Briefly, air is sampled through a pinhole into a low-pressure chamber and mixed with NO which converts HO2 into OH. OH radicals are excited by 308 nm radiation from a tunable dye laser, and the subsequent fluorescence is detected with a time-gated microchannel plate photomultiplier (MCP-PMT) detector. Some organic peroxy radicals are also converted into OH in the LIF-FAGE. Based on laboratory tests, the sensitivities α of the LIF-FAGE measurement for the added NO concentrations used in this study relative to HO2 for the following RO2 radicals are 83 % for isoprene-RO2, 91 % for methyl vinyl ketone RO2, 54 % for methacrolein RO2, 65 % for ethene-RO2, 65 % for toluene-RO2, 15 % for propane-RO2, and 31 % for butane-RO2 (Lew et al., 2018). The conversion efficiencies for other major RO2 types are estimated as 5 % for CH3O2 and the acetyl peroxy radical (CH3C(O)O2), 8 % for the ethyl peroxy radical (C2H5O2), and 31 %–55 % for RO2 compounds from the OH oxidation of high-molecular-weight hydrocarbons based on comparisons to several other interference tests (Fuchs et al., 2011; Griffith et al., 2016; Lew et al., 2018). These conversion efficiencies are average values weighted over the distribution of isomers, where applicable.
The LIF-FAGE was calibrated using a portable calibrator in which quantified amounts of OH∕HO2 and RO2 were produced through the photolysis of water vapor by a low-pressure mercury lamp at 184.9 nm (Dusanter et al., 2008). Humid air containing either isoprene (80 ppb) or n-butane (1.4 ppm) entered the rectangular calibrator (1.27 cm×1.27 cm×30 cm). Light from a low-pressure mercury lamp (UVP, Inc., model 11SC-1) illuminated a ∼ 3 cm3 photolysis volume through a quartz window. The flow rate of air was maintained at 45 slpm. A mixture with equal concentrations of HO2 and either C5H8(OH)O2 (from isoprene) or C4H9O2 (from butane) were produced when isoprene or butane was added to the calibration gas upstream of the photolysis region, respectively. Ozone actinometry was used to quantify the product of the actinic flux and the exposure time (Ft) in the calibrator (Dusanter et al., 2008). Concentrations of generated peroxy radicals are calculated by the following equation:
where [O3] is the concentration of ozone generated by the photolysis of O2, and are the absorption cross sections of H2O and O2 at 184.9 nm, and and are the photolysis quantum yields, both equal to 2 (Washida et al., 1971). A value of cm2 molecule−1 (base e) was used for (Cantrell et al., 1997; Hofzumahaus et al., 1997; Lanzendorf et al., 1997). The effective value of depends on the O2 optical depth and the operating conditions of the mercury lamp and was determined to be cm2 molecule−1 (Dusanter et al., 2008; Lanzendorf et al., 1997). The water vapor mixing ratio was measured by infrared (IR) absorption spectrometry using a LI-COR 6262 monitor. Ordinarily the ozone mixing ratio is determined using a calibrated photodiode installed in the calibrator (Griffith et al., 2013). The conversion factor (calibration) that converts the photodiode reading to an O3 mixing ratio is determined from separate experiments in which a range of O3 concentrations produced by the calibrator are measured with a UV-absorption O3 sensor. For this project, [O3] was instead quantified by the ECHAMP CAPS NO2 sensors after conversion to NO2 by reaction with excess NO. This was accomplished by having the IU calibration source overflow the ECHAMP inlet. ECHAMP was operated without the ethane flowing so that each reaction channel sampled 1 slpm of air from the calibration source into which 80 sccm of 21 ppm NO was added. This resulted in a diluted concentration of 1.7 ppm NO, which is high enough to react with 99 % of the O3 formed during the transit from the inlet to the CAPS detectors. This produces a very precise measurement of the sum of [O3] and [NO2] (1σ precision of 22 ppt for 10 s averages). The accuracy of this ozone determination is thus ultimately traceable to the CAPS NO2 calibration (see Supplement). Typical [O3] values measured were between 0.4 and 2.0 ppb. Linking the IU FAGE calibration to the ECHAMP NO2 measurement has ramifications for the intercomparison of the IU calibration source and the ambient measurements as discussed in the relevant sections below.
The sensitivity of the instrument is corrected for fluorescence quenching by water vapor as per laboratory characterization. This amounted to a correction of approximately 20 % at a water mixing ratio of 1 %. The limit of detection of was 0.8 ppt (30 s average; signal-to-noise ratio of 2). The overall accuracy of the measurements was ±36 % (2σ). On all days except 22 July, data were collected for 1 min every 30 min, and OH was measured during the rest of the 30 min cycle. On 22 July, OH was not measured, and instead the FAGE measured continuously.
2.4 Supporting measurements
Ambient NO2 was measured using a separate CAPS monitor (Aerodyne Research; Kebabian et al., 2007, 2008). The standard 450 nm bandpass filter used by the CAPS monitor was replaced with a 470 nm bandpass filter to eliminate any interference by glyoxal and methyl glyoxal (Kebabian et al., 2008). This reduced the sensitivity by approximately a factor of 3 but still provided high signal-to-noise ratios (> 100) for the ambient measurements. O3 was measured with a UV absorbance monitor (2B Technologies model 202). NO was measured using a Thermo Fisher chemiluminescence sensor (Model 42i Trace Level). NO, NO2, and O3 data were averaged to 1 min. Additional details regarding the calibrations and baseline measurements for the NO, NO2, and O3 measurements can be found in the Supplement.
A wide variety of biogenic and anthropogenic VOCs, including isoprene and its oxidation products (methyl vinyl ketone and methacrolein), monoterpenes, non-methane hydrocarbons (NMHC; C2–C5 and C6–C12), including aromatics, and oxygenated VOCs (alcohols, aldehydes, and ketones) were measured during IRRONIC. Online gas chromatography with dual flame ionization detectors (GC-FID-FID) was used to measure 57 NMHCs (Badol et al., 2004). Ambient air was sampled through a NAFION membrane, and NMHCs were trapped at a temperature of −30 ∘C inside a quartz tube filled with Carbosieve S-III and Carbopack B. A thermodesorption unit (PerkinElmer, ATD 400) was used to inject the sample into two columns (PLOT alumine and CP-Sil 5 CB) to separate C2–C6 and C6–C12 compounds. Two FID detections provided limits of detection of 10–60 pptv at a time resolution of 90 min. A second online GC-FID instrument was used to measure ethanol, isopropanol, methyl ethyl ketone, and a few monoterpenes (α-pinene and 3-carene; Roukos et al., 2009). A sampler unit (Markes International, air server Unity 1) allowed continuous sampling of ambient air through a trap held at 12 ∘C and filled with Carbopack B and Carbopack X. After thermodesorption, the GC separation was performed using a high-polarity CP-Lowox column (Varian, France). Limits of detection reached with this instrument were in the range 10–90 pptv for a time resolution of 90 min. Offline sampling was performed on multisorbent cartridges to measure > C9 anthropogenic compounds (alkanes and aromatics) and monoterpenes (pinene, terpinenes, limonene, ocimene, terpinolene, camphene, myrcene, borneol, camphor, and cumene) and on DNPH (dinitrophenylhydrazine) cartridges to measure carbonyls, including formaldehyde (which was not measured by the GC-FID system), acetaldehyde, and higher compounds. The cartridge measurements were integrated over 2 h sampling periods. Technical details can be found in Ait-Helal et al. (2014) and Detournay et al. (2011, 2013).
Zero-dimensional photochemical modeling of this field campaign data was performed using the Framework for 0-D Atmospheric Modeling (F0AM), which was constrained by the 30 min average mixing ratios of the supporting measurements (Wolfe et al., 2016). Measured VOC concentrations (every 90 min) were interpolated onto this 30 min time resolution. Carbon monoxide was not measured but instead estimated based on emission ratios of CO with benzene (Warneke et al., 2007). F0AM was executed using four different chemical mechanisms: two versions of the Regional Atmospheric Chemistry Mechanism (RACM2 and RACM2-LIM1) and the Master Chemical Mechanism (MCM 3.2 and 3.3.1). RACM2 groups various compounds based on similar rates of reaction, resulting in 363 reactions from 17 stable inorganics, 4 inorganic intermediates, 55 stable organics, and 43 intermediate organics (Goliff et al., 2013). RACM2-LIM1 incorporates the revision to the isoprene oxidation mechanism (Peeters et al., 2009) that includes the Leuven isoprene mechanism (LIM) including a 1,6-H shift and a 1,5-H shift for isoprene peroxy radicals. MCM is a near-explicit chemical reaction model resulting in approximately 17 000 reactions from 6700 radical species from methane and 142 non-methane species. Similar to the LIM1 mechanism, MCM 3.3.1 was updated to include revisions to the isoprene oxidation mechanism, resulting in HOx recycling from peroxy radical H-shift isomerization as well as NOx recycling and updated ozonolysis rate constants.
3.1 Calibration comparisons between ECHAMP and IU calibration source
On 24 and 26 July the IU calibration source was positioned so that its output overflowed the ECHAMP inlet. Figure 2 compares the response of ECHAMP to variable concentrations of peroxy radicals generated by the IU calibrator. Concentrations of peroxy radicals were varied by adjusting the mixing ratio of water or by changing the intensity of the UV lamp. H2O mixing ratios varied from 0.1 % to 1.4 %, corresponding to relative humidities between 5 % and 45 % and F values between 28 and 17. A bivariate fit (York et al., 2004) between the ECHAMP measurements and the concentrations calculated by Eq. (1) results in the relation ECHAMP = ppt, with an R2 of 0.99. If both instruments' calibrations were perfectly accurate, however, the slope would not be expected to equal unity because the two instruments' calibration methods do not produce the same type of peroxy radicals. ECHAMP is calibrated with the acetone photolysis method, which produces an equimolar mixture of CH3O2 and CH3C(O)O2 radicals (Wood and Charest, 2014). Because a calculated 10 % of both of these radicals will be converted to CH3ONO in the reaction chambers and will not be detected, ECHAMP is expected to be 11 % (1∕0.9) more sensitive to HO2 than to CH3O2 and CH3C(O)O2. Moreover, ECHAMP is expected to be between 7 % and 12 % less sensitive to RO2 from butane and isoprene than to HO2 because of the respective alkyl nitrate yields for both peroxy radicals: 8 % for butane and 7 %–12 % for isoprene (Atkinson et al., 1982; Lockwood et al., 2010; Patchen et al., 2007; Paulot et al., 2009). Thus if both instruments' calibrations were perfectly accurate, then the expected slope for the calibration comparison using butane (i.e., 50 % HO2 and 50 % C4H9O2) would be 1.07 (i.e., 1.11×0.96), and the expected slope when using isoprene would be between 1.07 and 1.04, depending on the isoprene alkyl nitrate yield. These values differ from the observed slope of 0.88 by 18 % to 22 %.

Figure 2Results of the calibration comparison in which ECHAMP measured the total peroxy radical concentration in the output of the IU calibration source. The error bars indicate 2σ uncertainties of the ECHAMP measurements and IU calibration source, adjusted for the fact that the IU actinometry was based on the ECHAMP NO2 calibration. The slope of the dotted line is unity.
The 2σ analytical uncertainty for the IU calibration source and ECHAMP measurements is 36 % and 27 %, respectively. Because the IU calibration source's O3 mixing ratios were determined by ECHAMP, however, a portion of these two uncertainties is correlated. The uncertainty bars in Fig. 2 have been reduced to remove this component of the uncertainty – being reduced to 23 % for IU (Dusanter et al., 2008) and 26.6 % for ECHAMP. The 18 %–22 % difference between the observed slope of 0.88 and the expected slope of 1.04 to 1.07 is within the adjusted uncertainties of both the ECHAMP measurements and the IU calibration source. Moreover, the fact that ECHAMP evidently has near-identical sensitivity to these two types of organic peroxy radicals demonstrates that differences in the mechanisms for converting RO2 to HO2 between β-hydroxy and alkyl peroxy radicals do not appear to affect their detection by ECHAMP.
The excellent linearity of Fig. 2 is notable because the calibrations were performed over a range of relative-humidity values, each of which requires a different amplification factor to be used by ECHAMP. If the RH dependence of the ECHAMP calibration had been ignored and only the dry calibration factor had been used instead, the comparison would have been inferior, as indicated by the squares in Fig. 2, for which a linear fit (not shown) gives the relation ECHAMP = 0.69(IU cal source) + 10.8 ppt. This serves as evidence that RH-dependent calibrations are indeed needed for producing accurate results from chemical amplifiers, including traditional CO- and NO-based instruments (e.g., PERCA).
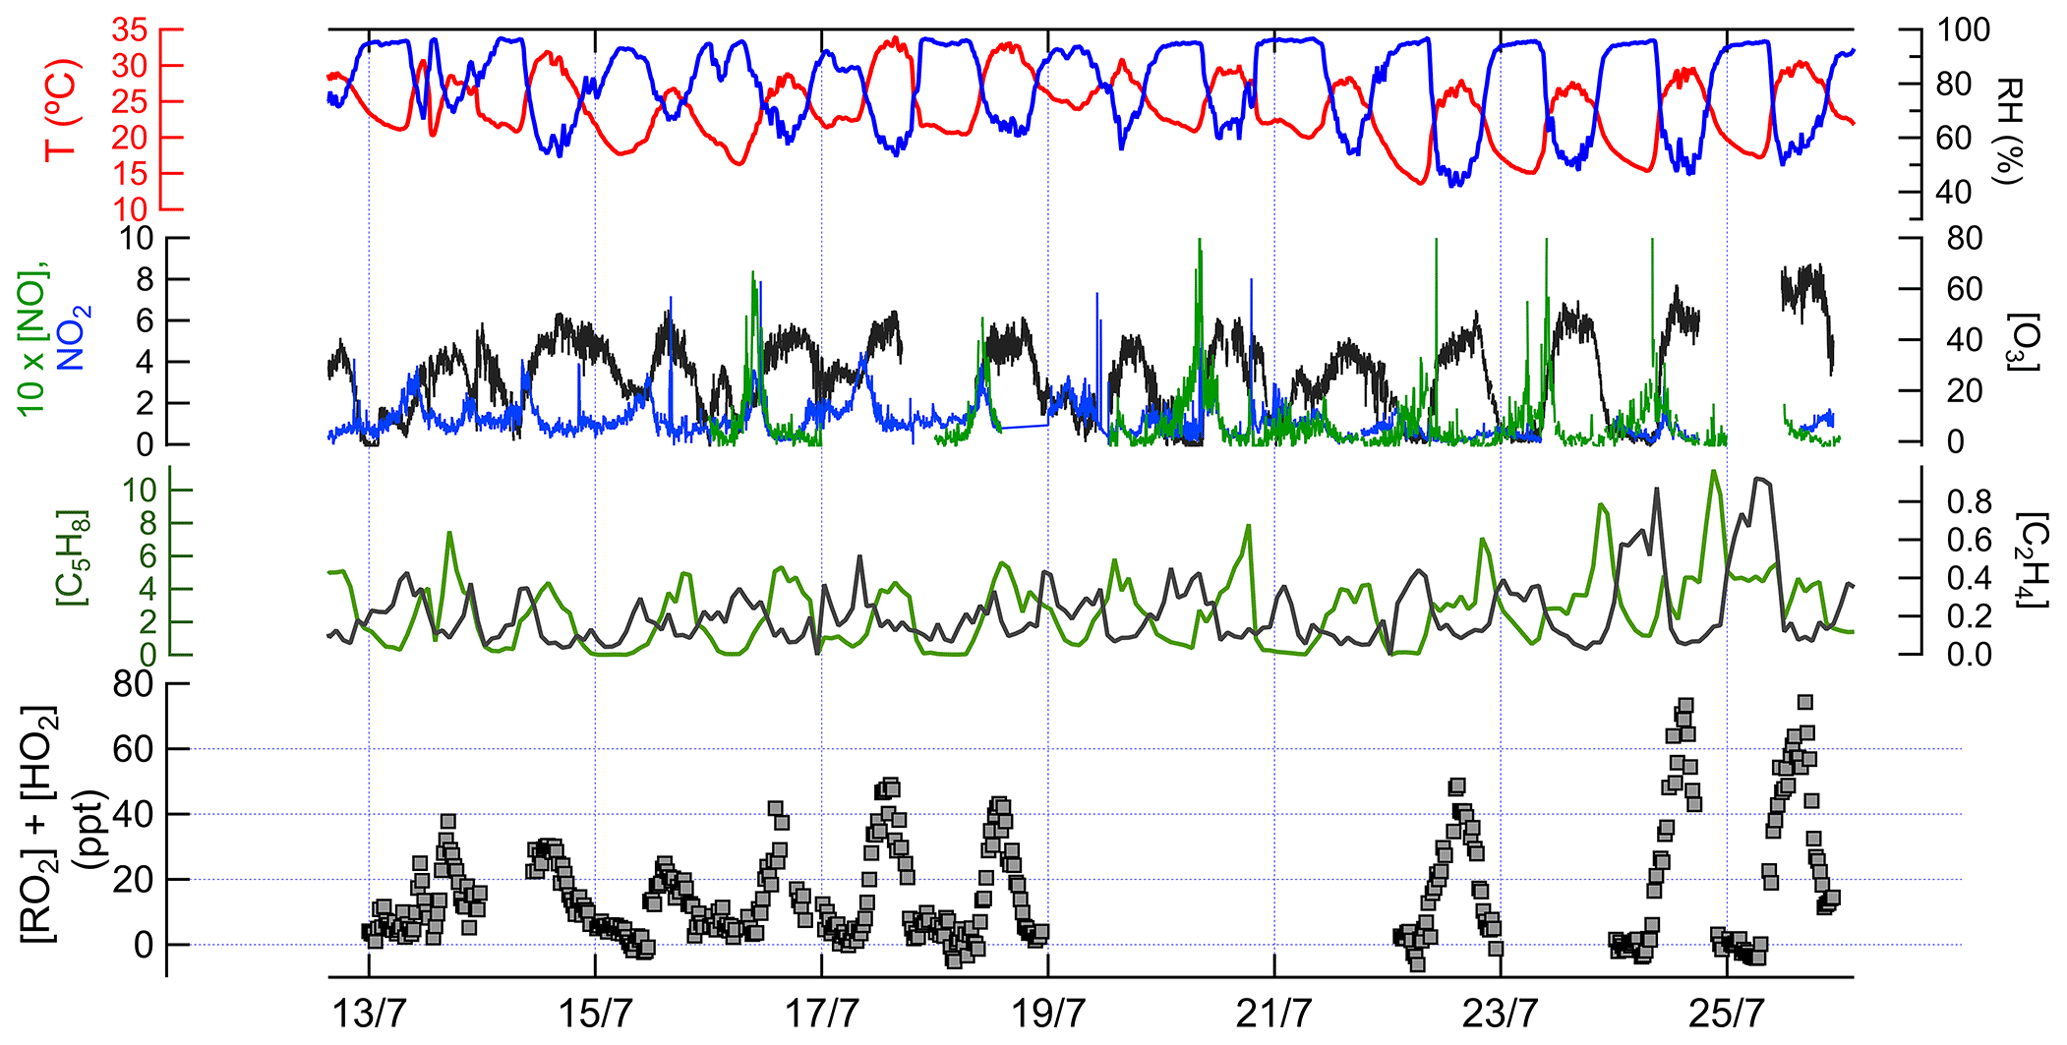
Figure 3Time series data of measured chemical and physical parameters during IRRONIC. Except where noted, all measurements are in parts per billion. The sum of [RO2] and [HO2] was measured by the ECHAMP instrument, with a detection limit typically between 1 and 2 ppt (signal-to-noise ratio of 2). The vertical grid lines indicate midnight for odd-numbered days, in local time.
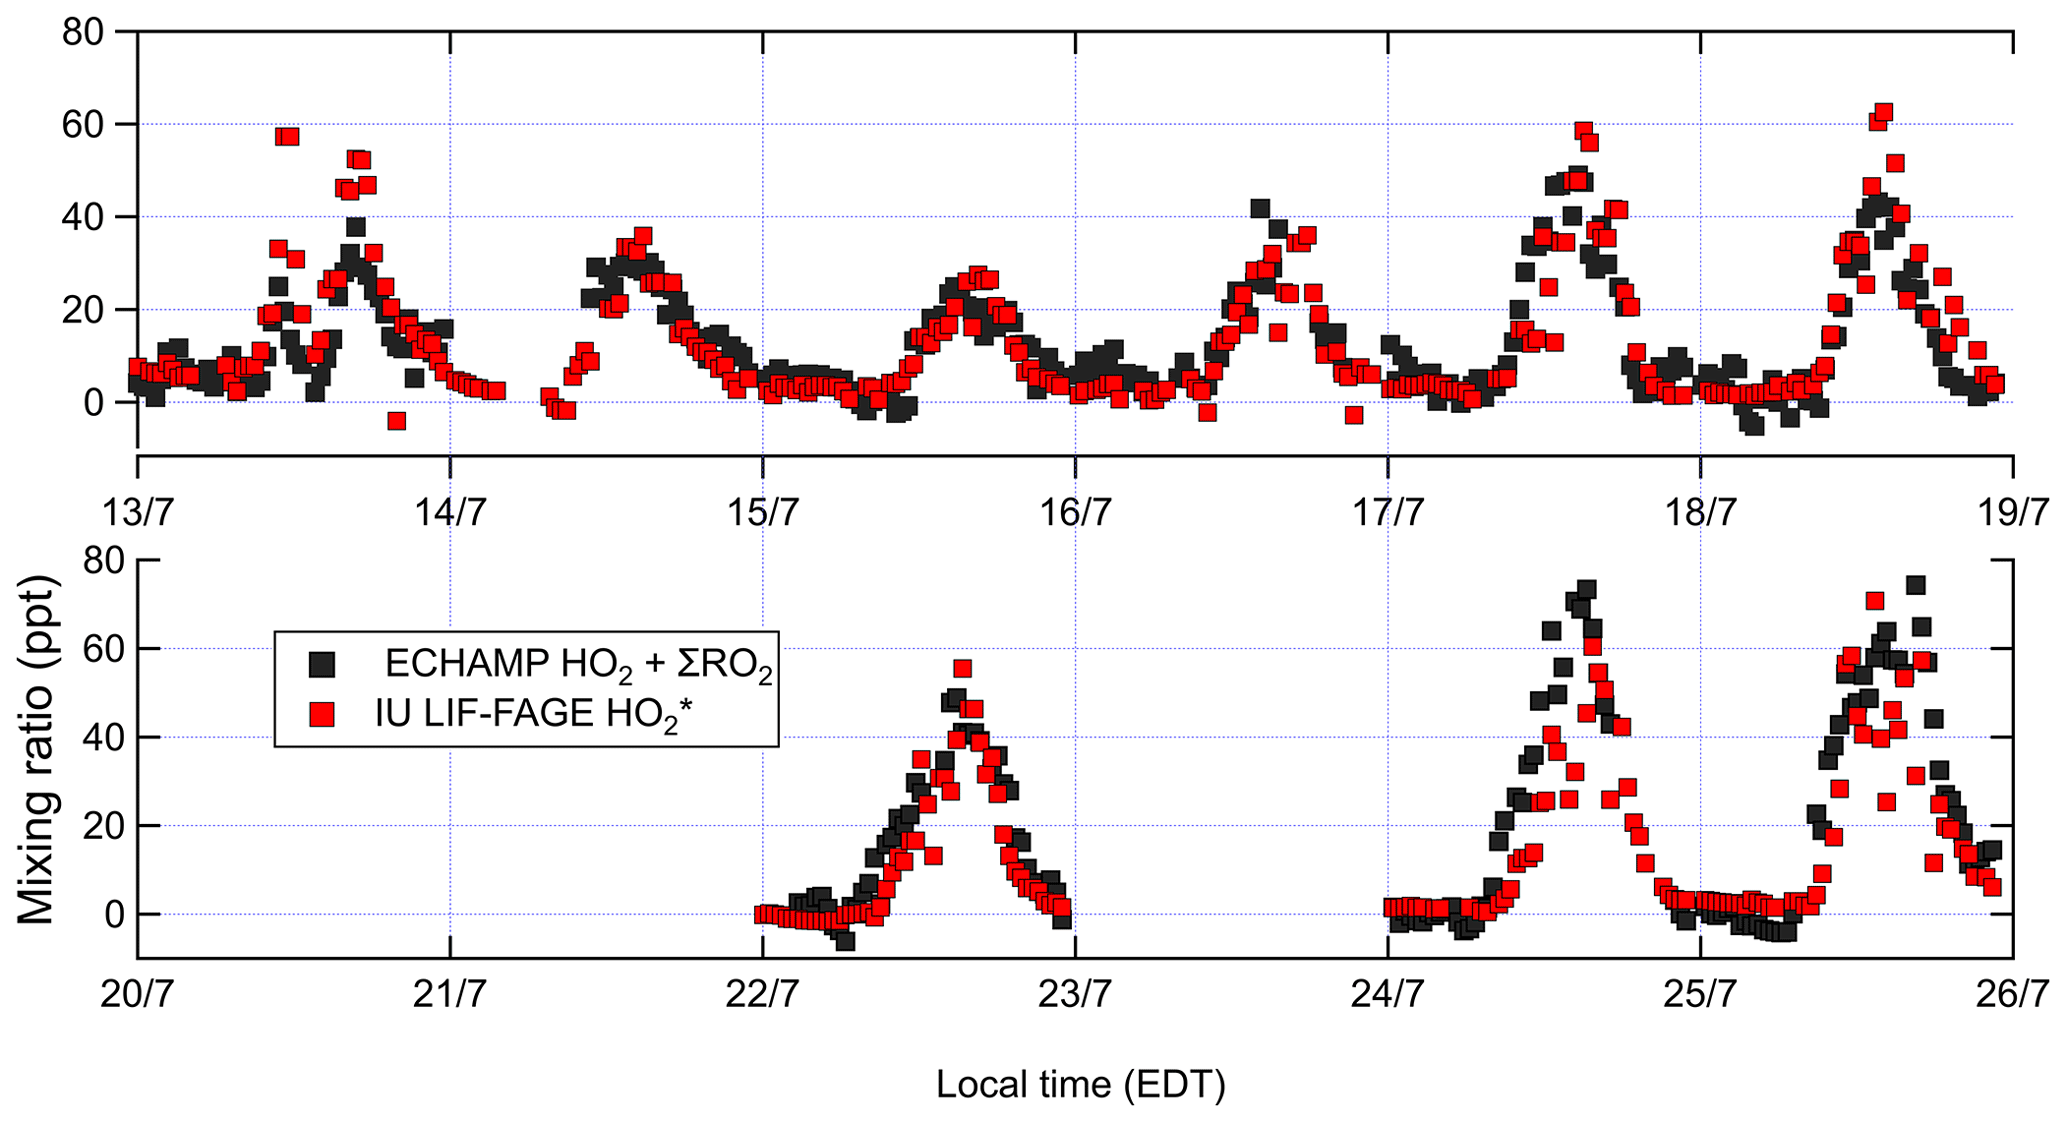
Figure 4Concentrations of ambient total peroxy radicals (XO2) by ECHAMP and by IU LIF-FAGE; 30 min averaged measurements are shown for ECHAMP XO2. For , measurements are 1 min averages every 30 min. The vertical grid lines indicate midnight for odd-numbered days, in local time (EDT – eastern daylight time).
3.2 Ambient concentrations of total peroxy (XO2) radicals, trace gases, and meteorological parameters
Ambient concentrations (15 min averages) of XO2, isoprene, ethene, O3, NO, and NO2, along with meteorological parameters, are shown in Fig. 3.
The 15 min average XO2 concentrations in the daytime ranged from below the detection limit of ∼ 5 ppt to 77 ppt. Among the VOCs measured, the daytime concentrations of low-molecular-weight total alkanes (C2–C5) were the highest (average mixing ratio ±1 standard deviation: 5.7±3.9 ppb) followed by isoprene (3.6±1.9 ppb), total C2–C5 alkenes (1.1±0.3 ppb), high-molecular-weight alkanes (C6–C14; 0.3±0.2 ppb), toluene (0.1±0.1 ppb), and monoterpenes (0.1 ppb). NO concentrations typically peaked at 0.2 to 0.8 ppb between 09:00 and 11:00 local time (LT; times listed hereafter are in local time) and were almost always below 0.2 ppb between 12:00 and 21:00, whereas NO2 concentrations in the daytime ranged between 0.3 and 3 ppb. O3 concentrations varied between 0 and 71 ppb (average 35.0±8.4 ppb).
Measured XO2 concentrations during IRRONIC exhibited a diurnal profile characterized by low mixing ratios (often below detection limit) between 00:00 and 07:00, increasing values from 07:00 to 13:00, and peak values between 13:00 and 16:00, followed by a decrease in the late afternoon, similar to past measurements in other forests (Burkert et al., 2001; Hewitt et al., 2010; Mihele and Hastie, 2003). XO2 mixing ratios were generally positively correlated with concentrations of isoprene, total alkenes, and ozone (Fig. 3). The highest XO2 concentrations of over 60 ppt were measured during the afternoon of 24 and 25 July, coinciding with the highest average concentrations of isoprene (4.4 ppb), total alkenes (1.8 ppb), and O3 (61 ppb) and the lowest average concentration of NO (0.1 ppb). The lowest daytime concentrations of XO2 were observed on 13 and 15 July, which were also characterized by lower isoprene and ozone mixing ratios and higher NO2 mixing ratios.
We compare our XO2 concentrations with reported XO2 and concentrations from other forests. The observed daytime XO2 mixing ratios (campaign daytime average 26 ppt) at the IRRONIC site at Indiana are similar to those reported in a tropical rain forest in Malaysia (range 2–68 ppt; Hewitt et al., 2010), in a northern Michigan forest during several intensive campaigns (range 8–65 ppt; Griffith et al., 2013; Mihele and Hastie, 2003), and in a tropical forest over South America (campaign average 42 ppt; Lelieveld et al., 2008). XO2 concentrations at Indiana never exceeded 80 ppt, in contrast to studies in which measured peroxy radical mixing ratios sometimes exceeded 150 ppt (Burkert et al., 2001; Wolfe et al., 2014).
Measurements of peroxy radical and NO concentrations enable ozone production rates to be calculated directly rather than having to rely on photochemical models. Using the measured concentrations of peroxy radicals and NO, calculated ozone production rates at the IURTP were at most 9 ppb h−1 and described more in the Supplement.
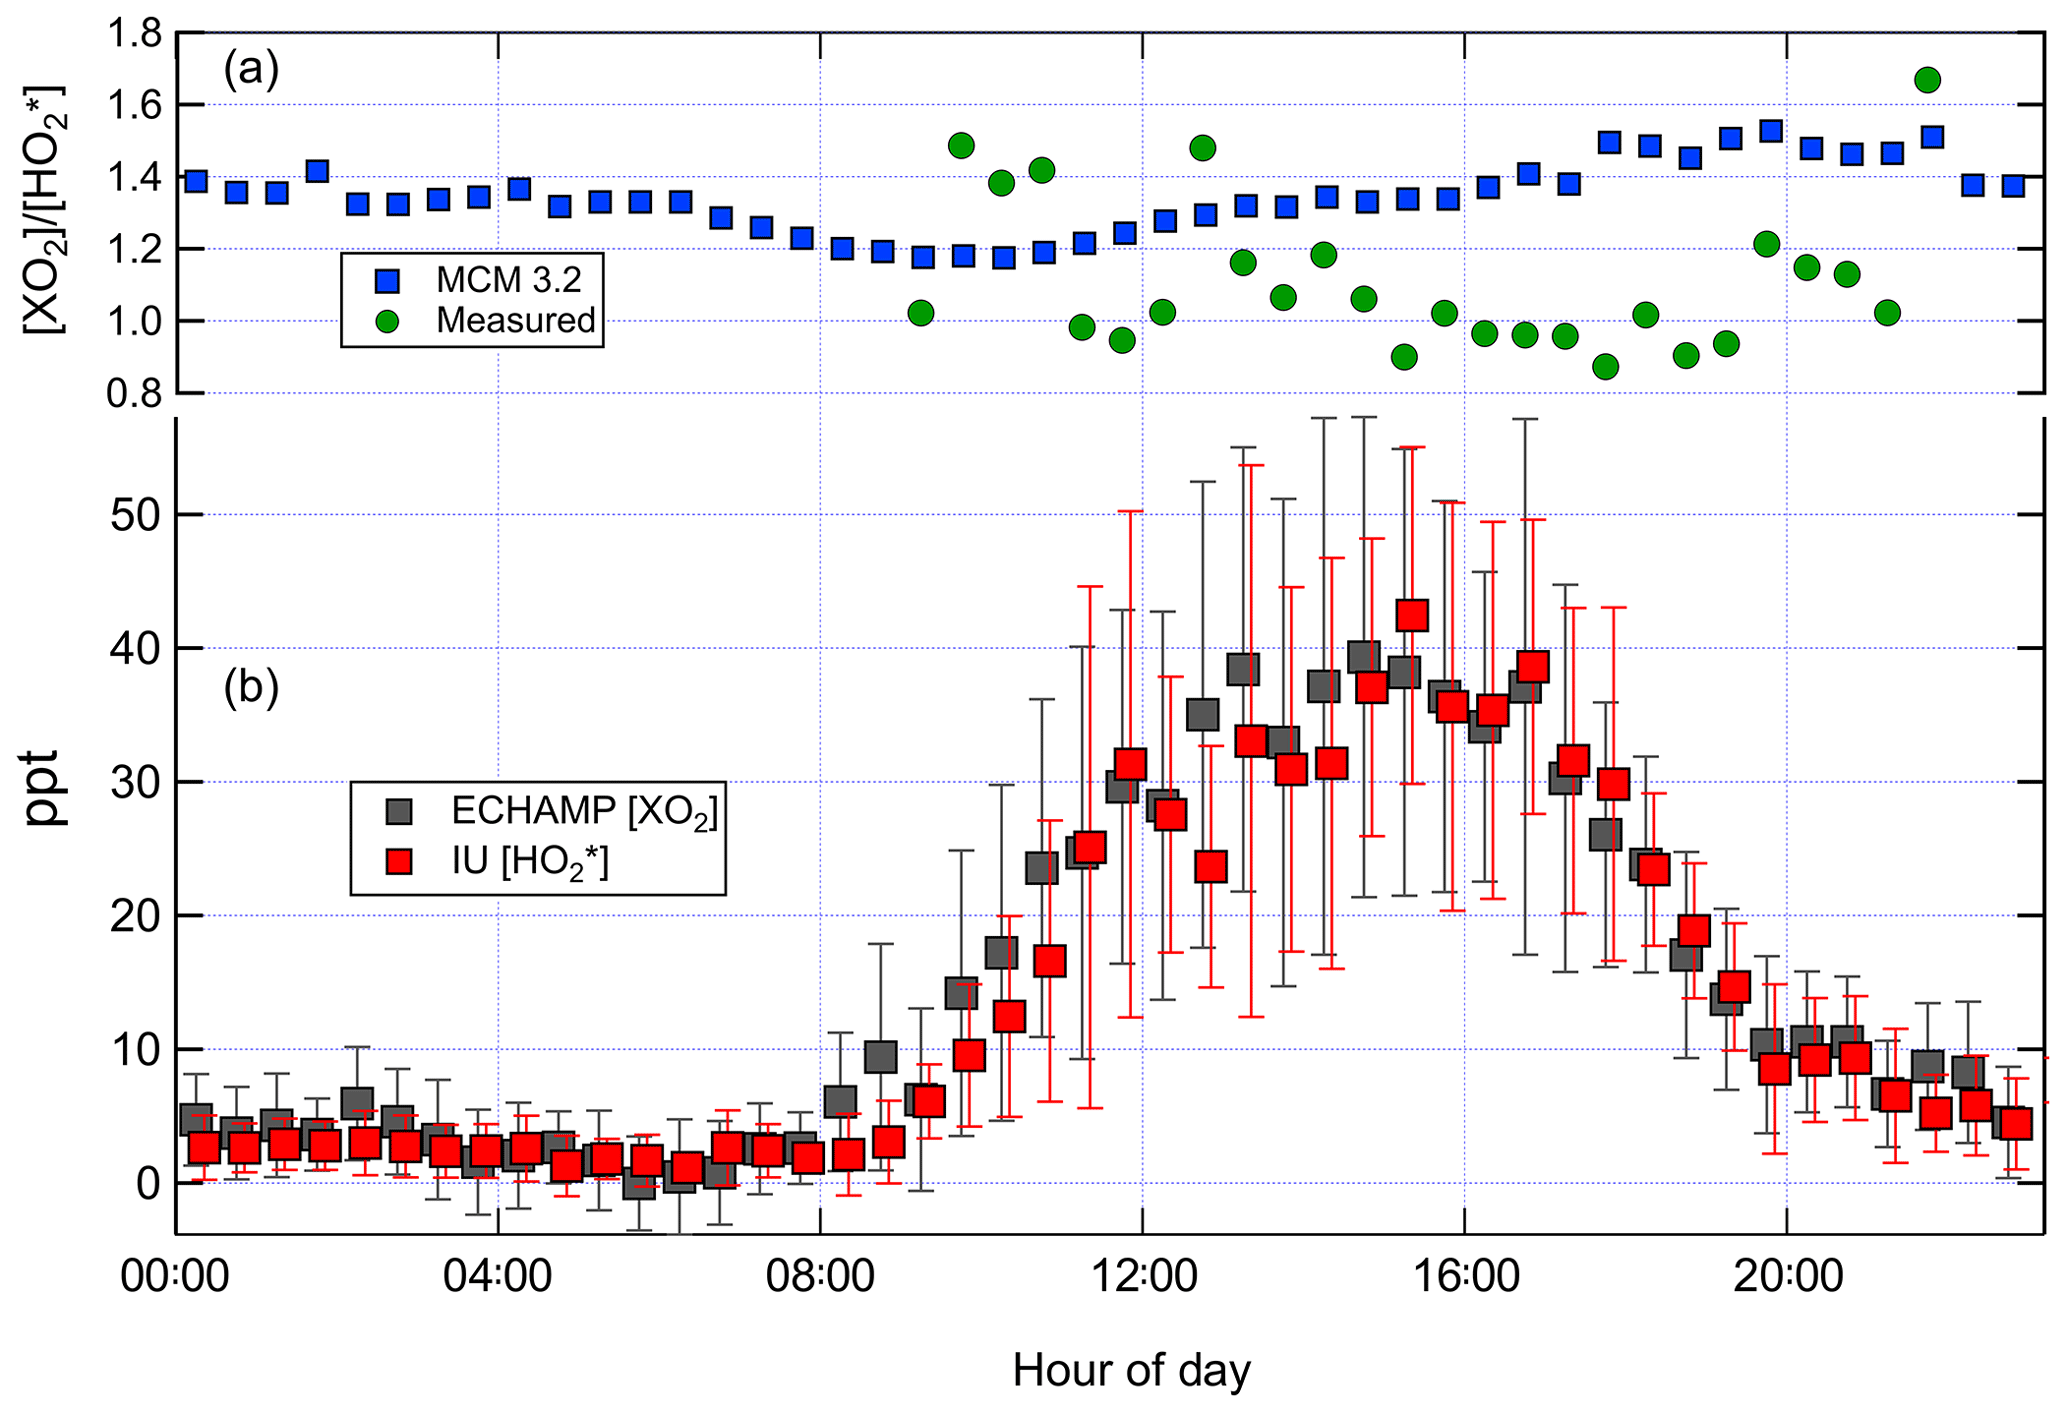
Figure 5(b) Mean diurnal profile of ECHAMP XO2 and IU LIF-FAGE measurements for the 9 d in which both instruments were operational. The values are displayed with a 6 min horizontal offset for clarity. The error bars indicate the ± 1 standard deviation of the measured concentrations in each 30 min time bin during those 9 d. (a) shows the ratio – both measured by the two instruments and modeled using the MCM 3.2 chemical mechanism. The measured ratio is only shown for time periods between 09:00 and 22:00 due to the poor signal-to-noise ratios for the nighttime measurements.
3.3 Comparisons of ambient peroxy radical mixing ratios
Figure 4 compares ambient [XO2] measurements by ECHAMP (30 min averages) with the [] measurements by LIF-FAGE (1 min average every 30 min) during 13–25 July. Only data from days in which both instruments were operational are shown. No adjustments have been made to either of the datasets in Fig. 4 (or any other figures) to account for the calibration difference. Although in general it is preferable to compare measurements with equal time averaging, the precision of ECHAMP during this campaign – typically 2.5 ppt (1σ) for the 1.5 min average measurements – necessitated this averaging. The diurnal profiles of both measurement sets, divided into 30 min bins, are displayed in Fig. 5. Both figures indicate that the ECHAMP and LIF-FAGE measurements are in general well correlated and follow the same diurnal trend, though closer inspection reveals significant day-to-day and even hour-to-hour variability in the ratio.
The “true” ratio, i.e., the ratio that would be produced by the two instruments' measurements if they were calibrated to the same source and operated exactly as expected without any uncharacterized interferences or losses, depends on the composition of the peroxy radicals. As described in Sect. 2 (Experimental section), for both ECHAMP and LIF-FAGE, the sensitivity of the instrument to individual RO2 compounds depends on the R group and is characterized by the parameter α, which is the instrument's sensitivity to each RO2 compound relative to its sensitivity to HO2. For ECHAMP α is determined largely by the fraction of RO2 that is converted to alkyl nitrates (RONO2) and alkyl nitrites (RONO), following the reaction with NO at atmospheric pressure. For LIF-FAGE, α is mostly determined by how quickly each RO2 compound is converted sequentially to HO2 and then OH following reaction with NO after the expansion of the sampled gas into the low-pressure region of the instrument (Fuchs et al., 2011; Lew et al., 2018). Air in which CH3O2, CH3C(O)O2, and small (< C5) alkyl peroxy radicals have a large contribution to the total peroxy radical concentration would thus produce a relatively high value, since ECHAMP is sensitive to those peroxy radicals (α>0.9), whereas the LIF-FAGE measurement is not (α<0.1). In contrast, air with a relatively high fraction of alkene-derived RO2 (e.g., isoprene peroxy radicals), for which both ECHAMP and LIF-FAGE α values are near 1, would be expected to lead to lower values (i.e., closer to unity).
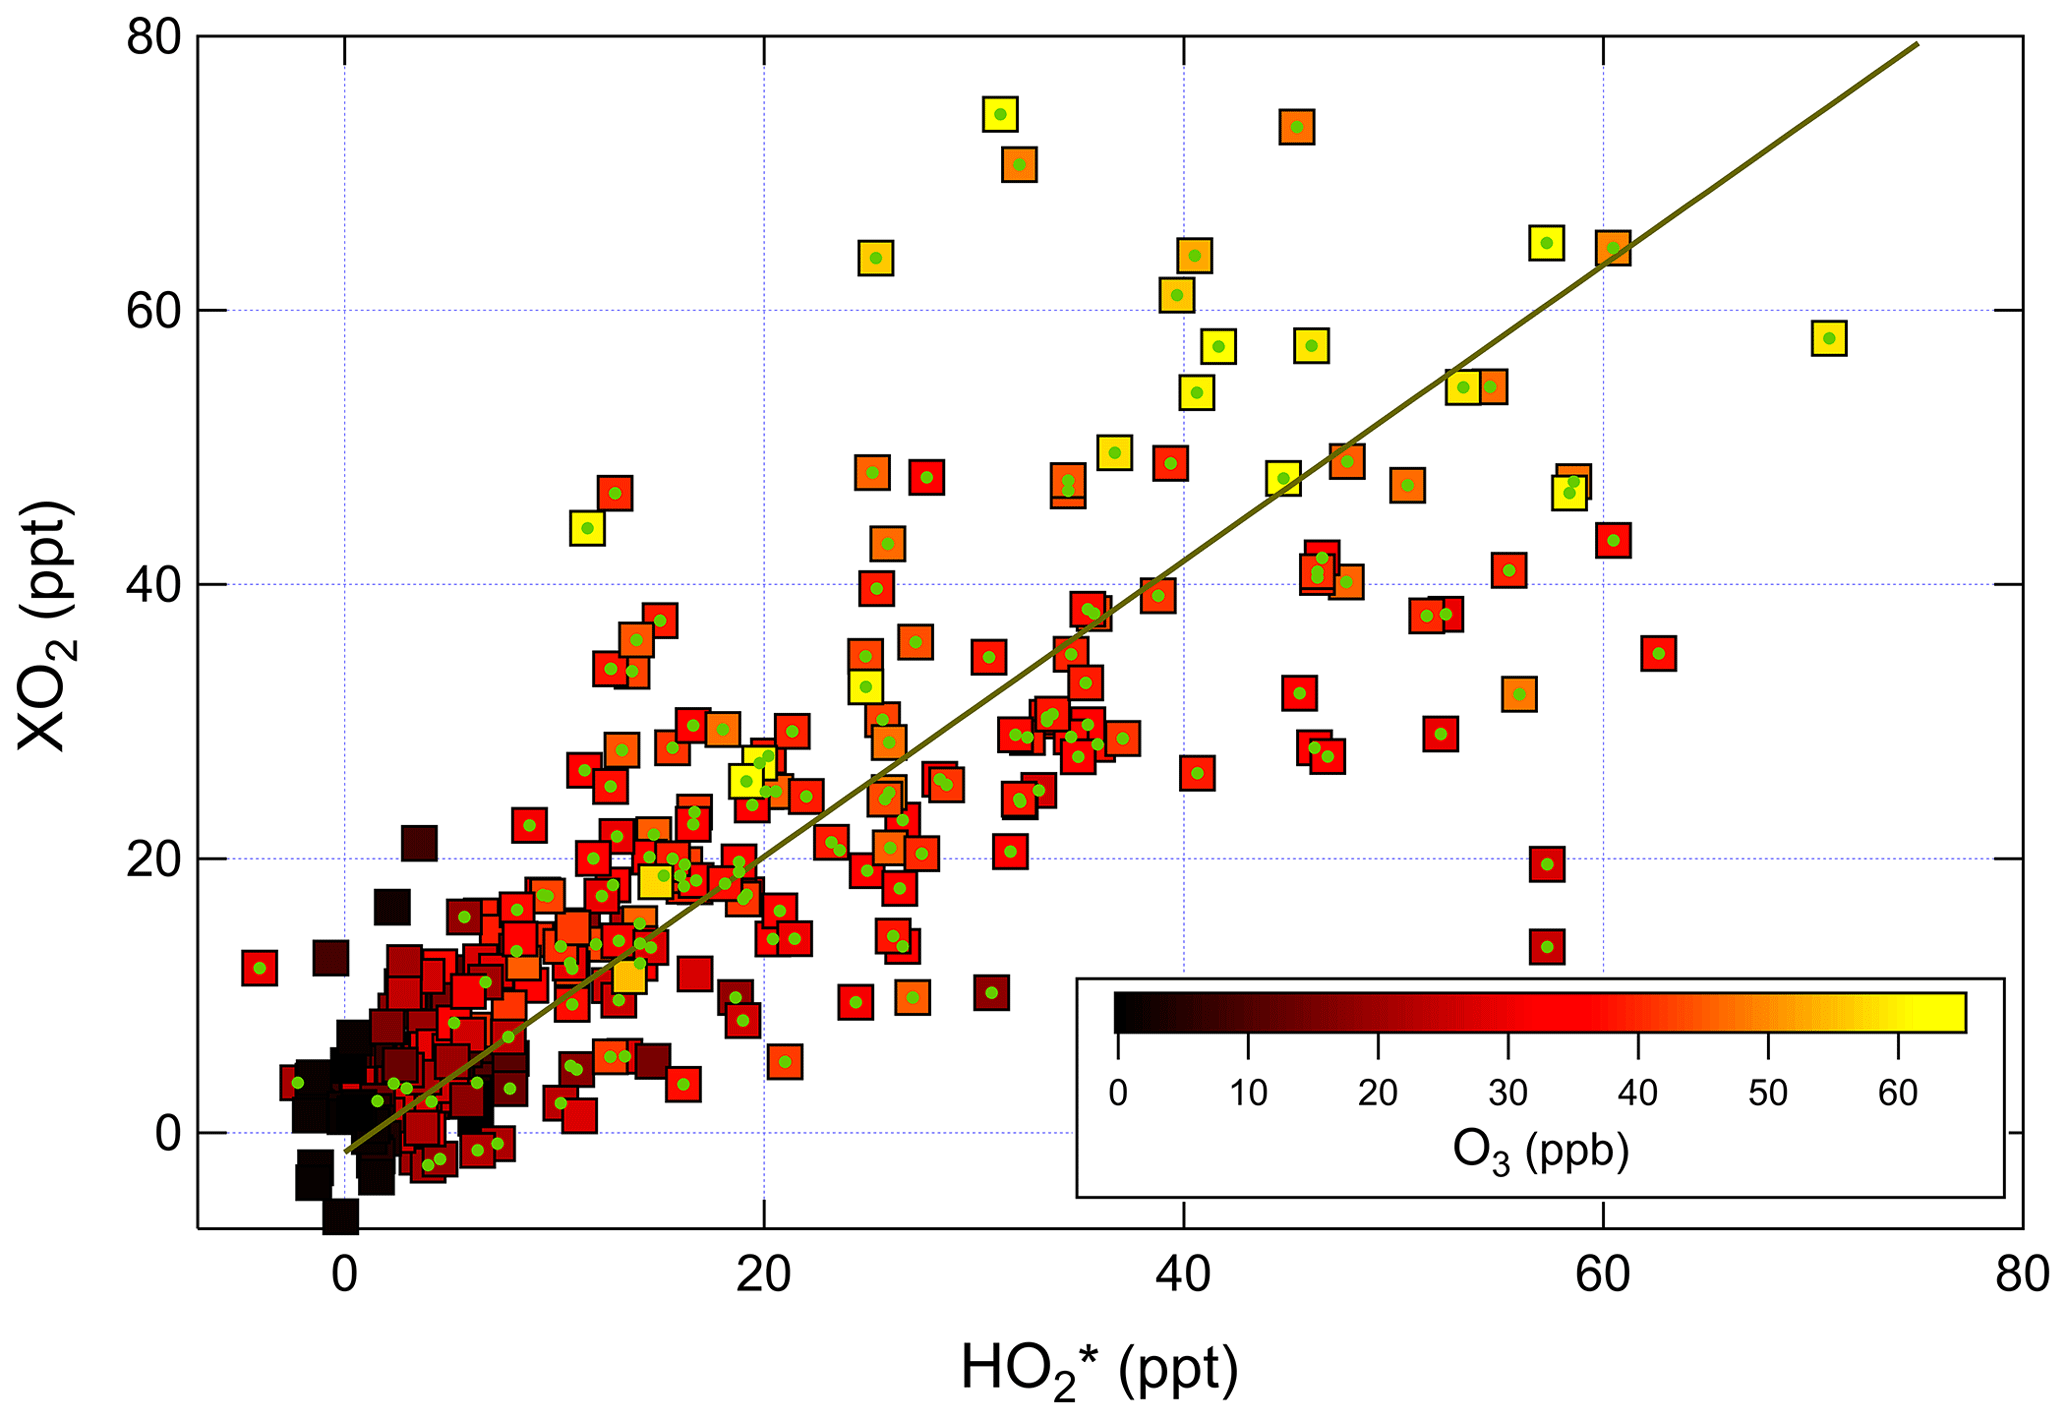
Figure 6Correlation of ambient [XO2] measured by ECHAMP with [] measured by IU LIF-FAGE. The linear fit is for data between 09:00 and 22:00, indicated by the points with green circles. The equation of the fit is ppt.
A bivariate linear regression of the measured XO2 and concentrations between 09:00 and 22:00 yields the relationship ppt (Fig. 6). The regression is restricted to this window of time because of the degraded precision of the ECHAMP measurements at night due to the higher relative humidity. The slopes were highest on the last 2 d of measurements, on 24 and 25 July, with slopes of 1.25 and 1.08, respectively, or 1.5 and 1.3 after adjusting for the calibration difference. These 2 d were characterized by the highest mixing ratios of peroxy radicals, O3, isoprene, and the anthropogenic VOCs ethene and ethyne. The lowest ratios were observed on 13 July, during which a passing thunderstorm led to low concentrations during midday, with higher values before and after the storm. The higher ratios observed later in the field campaign may simply be the result of a change in sensitivity in one of the instruments. These linear regressions are difficult to interpret, however, since the XO2 measurements are 30 min averages and the measurements are 1 min averages taken every 30 min. A regression of the binned data shown in Fig. 5 gives the relation ppt; accounting for the calibration difference gives an adjusted slope of 1.2. The ratio using the binned data was highest between 09:45 and 10:45 (Fig. 5) but was between 0.9 and 1.1 between 14:45 and 19:15. This overall temporal trend is apparent in several days (Fig. 4). Applying a 30 min offset to the XO2 data largely removes this trend and leads to fewer time periods when was less than 1.0, but such an offset does not agree with the synchronized time base of both measurements. The two instruments' different averaging times and precision levels preclude further assessment and conclusions regarding possible time offsets.
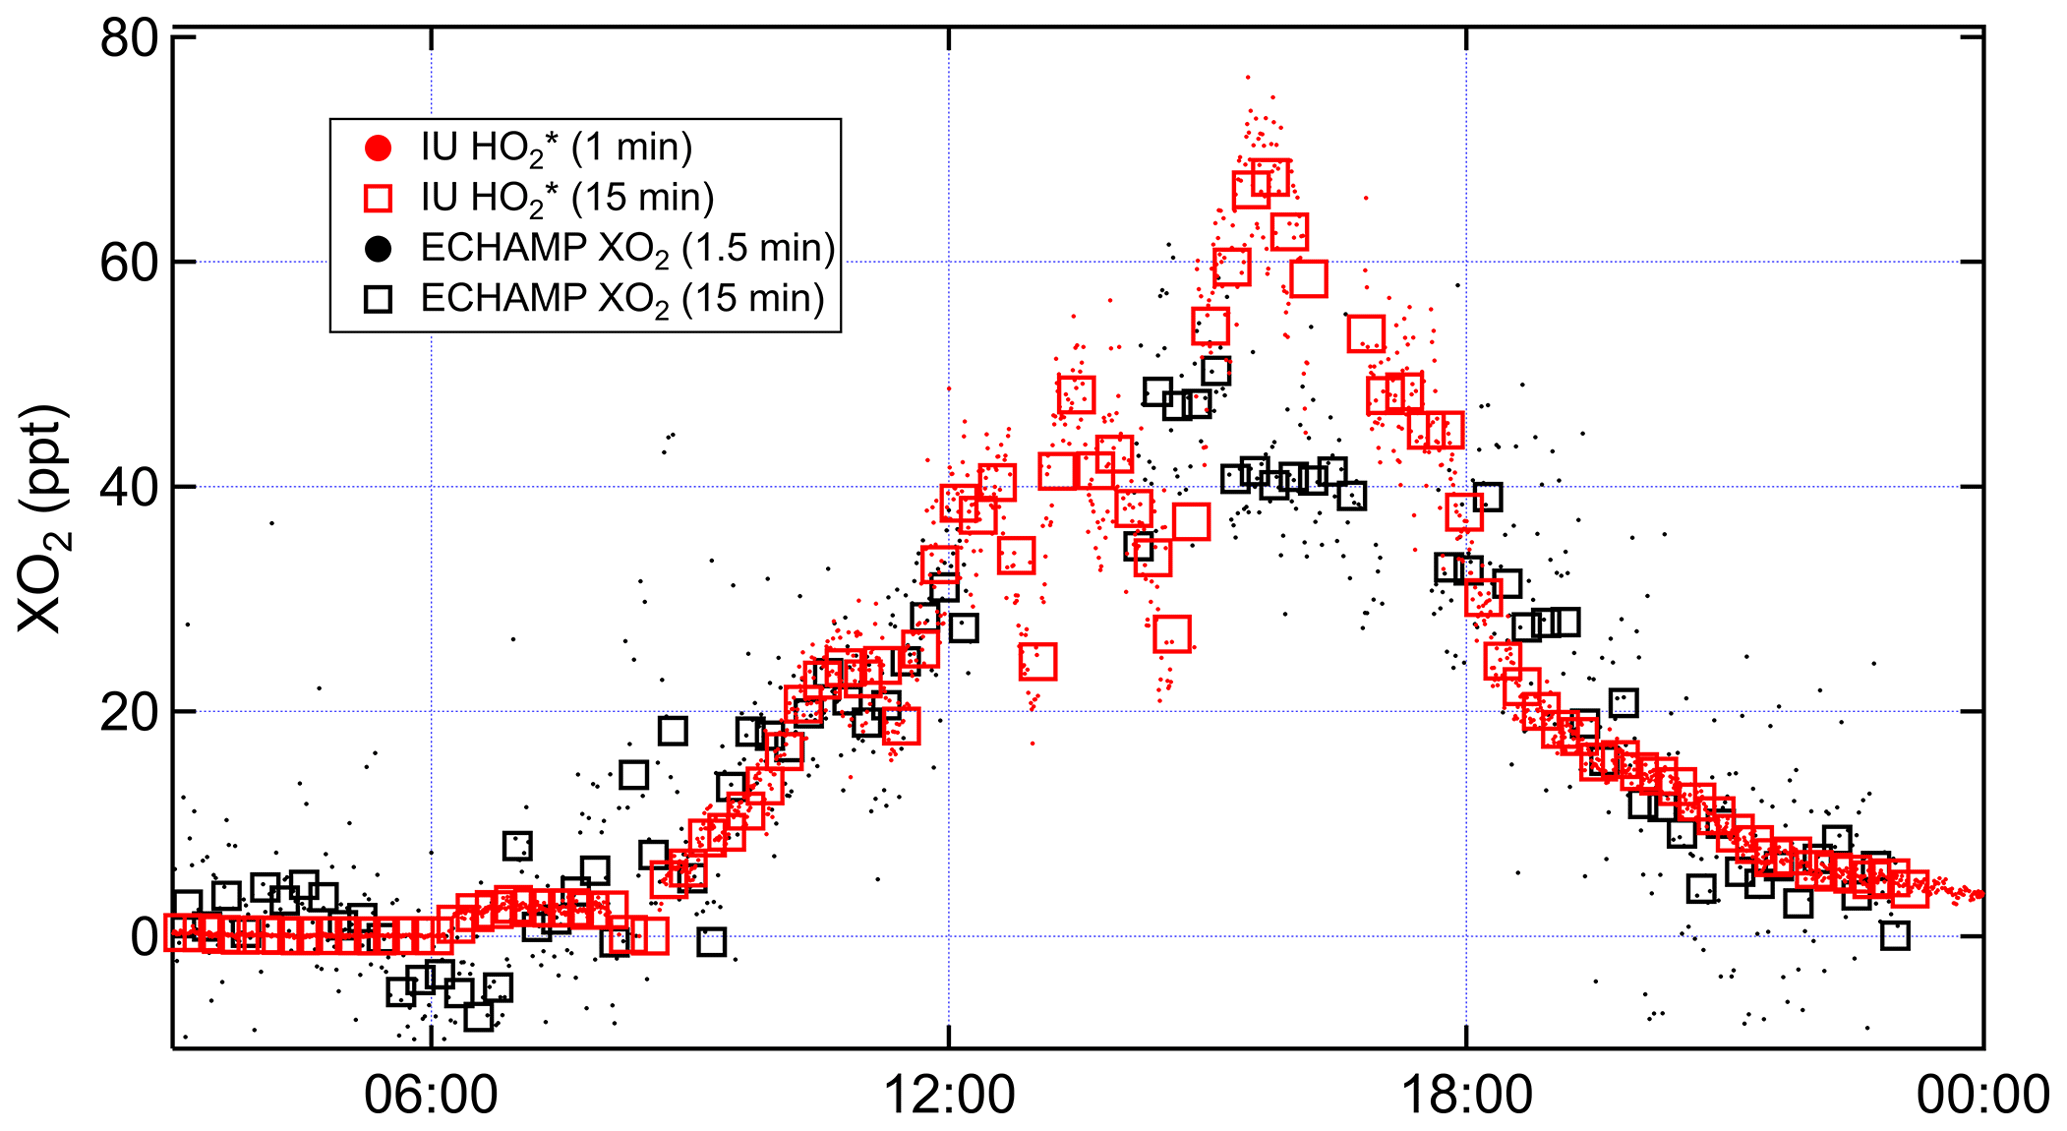
Figure 7Time series comparing IU LIF-FAGE and ECHAMP XO2 measurements from 22 July 2015, when the IU LIF-FAGE was run in -only mode.
To further investigate the effect of this different averaging on the comparison, on 22 July the IU LIF-FAGE operated in -only mode (i.e., with no time devoted to measuring OH). We compare the resulting 1 and 15 min averaged measurements to the 1.5 and 15 min averaged XO2 measurements (Fig. 7). Between 15:00 and 17:00, the measurements increased from 50 to 70 pptv and decreased back to 50 pptv, while the XO2 measurements were relatively invariant at 40 pptv. Ignoring the difference between the average mixing ratios, this difference in the temporal profile of the two instruments' measurements result could only be “real” if there were changes in the peroxy radical relative composition on this 2 h timescale, e.g., a simultaneous increase in HO2 and a decrease in alkyl peroxy radicals, such that [] actually did increase while the mixing ratio of total peroxy radicals was almost constant. Measurements of VOC composition and NOx do not support such a fast change in peroxy radical composition, suggesting that these observations were more likely the result of an instrumental issue, though we are unable to identify the cause.
Because the composition of the peroxy radicals during IRRONIC is not exactly known, we examine the predicted speciation generated by zero-dimensional photochemical modeling of the IRRONIC dataset using RACM2 and RACM2-LIM1 and MCM 3.2 and 3.3.1. A full comparison of the modeled and measured concentrations is beyond the scope of this paper; we use these model outputs mainly to inform the discussion of the relative speciation of total peroxy radicals and its relation to the expected and measured ratio. A fuller description of the photochemistry at this site, including OH reactivity measurements, will be described in a companion paper (Lew et al., 2019).
The accuracy of the model results is, of course, subject to how comprehensive and accurate the supporting measurements and underlying chemical mechanisms are, but it nonetheless helps in framing the interpretation of the two instruments' measurements. Due to gaps in the NO data because of problems with the Thermo Fisher chemiluminescence sensor, there are only 3 d for which we have model results and measured peroxy radical concentrations by both ECHAMP and LIF-FAGE – on 16, 22, and 24 July. The model was run for these 3 d, and a diurnal profile for the entire campaign was run using diurnal average concentrations of constrained species. From these model results we calculate the expected values measured by ECHAMP and LIF-FAGE based on each instrument's relevant values for α:
The “other” category includes all types of peroxy radicals, e.g., from monoterpenes, methyl vinyl ketone, ethene, etc. The α values for ECHAMP are based on the calculated yields of alkyl nitrates and alkyl nitrites as described in Sect. 2.2. For LIF-FAGE, the α value for C5H8(OH)O2 was measured and α for CH3O2 and CH3C(O)O2 are based on measured yields from several similar instruments, all of which have measured values less than 5 %. An α of 0.7 is assumed for the other category, since most alkenes have α values between 0.5 and 0.9, and small alkanes, which have lower values, account for a small portion of the OH reactivity (Lew et al., 2019).
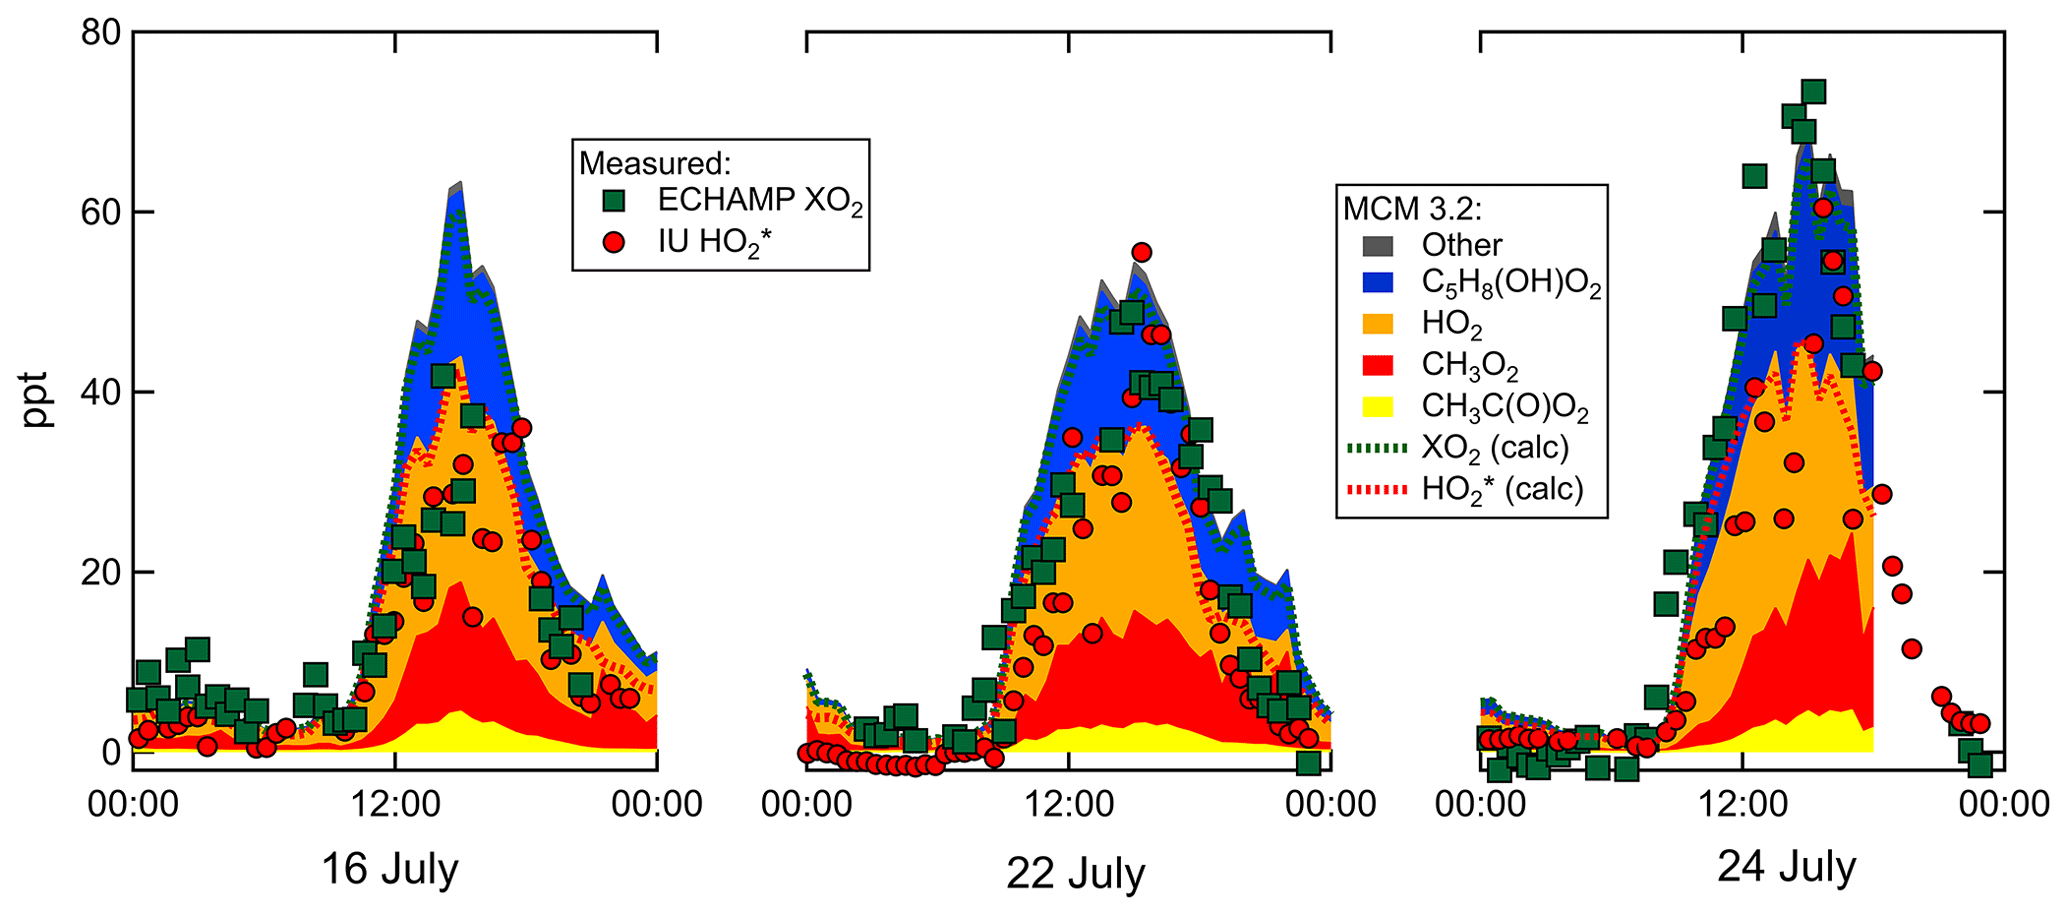
Figure 8Peroxy radical mixing ratios measured by ECHAMP and LIF-FAGE and modeled by MCM v3.2.
Figure 5 shows the average diurnal profile for the ratio modeled by MCM 3.2 and measured using all days when there were both XO2 and measurements. Between 10:00 and 18:00 the modeled ratio using MCM 3.2 varied between 1.2 and 1.5, whereas the measured ratio varied between 0.9 and 1.4, with a greater amount of variability from hour to hour. Increasing the observed ratio by 20 % to account for the calibration comparison (Sect. 3.1) gives an adjusted measured ratio of between 1.1 and 1.7. The highly variable ratios during nighttime mainly reflect the lower signal to noise ratios of both instruments when peroxy radical concentrations were low (less than ∼ 5 ppt).
Measured and MCM 3.2-modeled concentrations for 16, 22, and 24 July are shown in Fig. 8. On all 3 d the relative contributions from the various types of peroxy radicals are comparable. At 15:30 – when concentrations were highest – the modeled peroxy radicals comprised 30 % C5H8(OH)O2, 35 % HO2, 26 % CH3O2, and 7 % CH3C(O)O2. The four chemical mechanisms vary little in the predicted relative speciation (Supplement). The ratio modeled by MCM 3.2 between 15:00 and 16:00 is 1.4 for 16 and 22 July and 1.45 on 24 July. The measured ratio is close to unity on 16 and 22 July and between 1.2 and 1.5 on 24 July. Increasing these measured ratios by 20 % to account for the calibration comparison produces adjusted measured ratios of 1.2 on 16 and 22 July and 1.4 to 1.8 on 24 July. After accounting for the 20 % calibration difference, the modeled and measured ratios agree to within the experimental and model uncertainties.
Although all four chemical mechanisms predict a very similar relative speciation, there are variations in the absolute peroxy radical concentrations predicted. MCM 3.3.1 concentrations are very similar to those from MCM 3.2, but RACM2 and RACM2-LIM1 predict 26 % and 42 % higher peak concentrations, respectively. Measured [XO2] mixing ratios are 20 to % 30 % lower than the MCM 3.2 [XO2] on 16 and 22 July but agree more closely on 24 July (measured-to-modeled ratio varies from 0.8 to 1.15). The comparison between measured [] and modeled [] for these 3 d exhibits more variability (Fig. 8). Further details can be found in the Supplement.
Observations of ratios less than 1 were observed during parts of 13, 17, and 18 July, and even after increasing by 20 % to account for the calibration comparison, they do not seem reasonable or in some cases even possible. These observations were most likely caused by issues with one or both instruments. Two possible causes that warrant investigation in subsequent field measurements are discussed below:
-
Error in the ECHAMP calibration, especially for RH values greater than 45 %. Although the calibration comparison presented in Sect. 3.1 shows that the ECHAMP's and LIF-FAGE's calibrations agreed to within measurement uncertainties, that is not necessarily true for RH values greater than those used during those calibration tests. The highest RH value during the calibration comparisons was 45 %, whereas the daytime minimum RH values between 12:00 and 16:00, when measured [XO2] and [] were both highest, were typically between 45 % and 65 % (Fig. 1). Furthermore, we cannot prove that the ECHAMP calibration was invariant from day to day. We include potential sampling losses to be a part of the overall ECHAMP calibration.
-
Interferences in the LIF-FAGE measurement. The comparison of the high temporal resolution in Fig. 7 revealed differences in the temporal profile of the LIF-FAGE and ECHAMP sensor. If these were caused by an interference in the LIF-FAGE measurement when sampling ambient air, then it would follow that the two instruments would agree when sampling a calibration source but differ when sampling ambient air.
As discussed earlier, the RH dependence of the sensitivity of chemical amplifiers has recently been questioned (Sommariva et al., 2011). Had we ignored the RH dependence for ECHAMP's amplification factor and simply used the value under dry conditions, the daytime XO2 values would have been roughly 50 % lower than those presented in this paper, leading to unrealistically low ratios of ∼ 0.5.
The results of this comparison of the IU calibration source and the ambient measurements of peroxy radicals by ECHAMP and LIF-FAGE provide encouraging first results that the newly developed ECHAMP method can be used for ambient measurements of total peroxy radicals. The ECHAMP measurements, based on the acetone photolysis method, and the IU water vapor photolysis calibration source agreed within 12 %, which was within the experimental uncertainties. The measured mixing ratios of XO2 and were usually lower than the concentrations predicted by the RACM2, RACM2-LIM1, MCM v. 3.2, and MCM v. 3.3.1 chemical mechanisms. The measured ratios usually differed from the ratios predicted by zero-dimensional photochemical modeling by less than the combined measurement and modeling uncertainties, though the lowest ratios observed (0.8) are not physically meaningful and therefore must be due to measurement errors.
An attribute of these comparison exercises is that the two instruments operate on very different measurement principles, and the calibration methods differ greatly. Although the calibration comparison was favorable, due to the time required to conduct successful calibrations with the acetone photolysis method and its overall inconvenience (Wood and Charest, 2014), we have discontinued its use. For subsequent field measurements we used the water vapor photolysis method and another method based on methyl iodide photolysis (Anderson et al., 2019; Clemitshaw et al., 1997; Liu and Zhang, 2014). All three calibration methods indicate that a humidity-dependent calibration must be used for both CO-based and ethane-based chemical amplifiers.
Data are available upon request from the corresponding author (ezra.wood@drexel.edu).
The supplement related to this article is available online at: https://doi.org/10.5194/acp-19-9563-2019-supplement.
EW and PS designed the research project. SK, BD, and EW were responsible for the ECHAMP measurements and supporting measurements of NO, NO2, and O3. ML, BB, PR, and PS were responsible for the LIF-FAGE measurements and photochemical modeling. SD, SS, TL, and NL were responsible for the measurements of VOCs. SK and EW conducted the analysis and wrote the paper, with feedback from all co-authors.
The authors declare that they have no conflict of interest.
We are grateful to James Flynn and Barry Lefer of the University of Houston for the spectroradiometer data used for the chemical modeling.
This research has been supported by the National Science Foundation, Directorate for Geosciences (grant no. AGS-179918 to Drexel University, grant no. AGS-1443842 to the University of Massachusetts, and grant no. AGS-1440834 to Indiana University). This work was also supported by grants from the Regional Council Nord–Pas-de-Calais through the MESFOZAT project as well as the French National Research Agency (ANR–11–LABX–0005–01) and the European Regional Development Fund (ERDF) through the CaPPA (Chemical and Physical Properties of the Atmosphere) project.
This paper was edited by Steven Brown and reviewed by two anonymous referees.
Ait-Helal, W., Borbon, A., Sauvage, S., de Gouw, J. A., Colomb, A., Gros, V., Freutel, F., Crippa, M., Afif, C., Baltensperger, U., Beekmann, M., Doussin, J.-F., Durand-Jolibois, R., Fronval, I., Grand, N., Leonardis, T., Lopez, M., Michoud, V., Miet, K., Perrier, S., Prévôt, A. S. H., Schneider, J., Siour, G., Zapf, P., and Locoge, N.: Volatile and intermediate volatility organic compounds in suburban Paris: variability, origin and importance for SOA formation, Atmos. Chem. Phys., 14, 10439–10464, https://doi.org/10.5194/acp-14-10439-2014, 2014.
Anderson, D. C., Pavelec, J., Daube, C., Herndon, S. C., Knighton, W. B., Lerner, B. M., Roscioli, J. R., Yacovitch, T. I., and Wood, E. C.: Characterization of ozone production in San Antonio, Texas, using measurements of total peroxy radicals, Atmos. Chem. Phys., 19, 2845–2860, https://doi.org/10.5194/acp-19-2845-2019, 2019.
Andrés-Hernández, M. D., Stone, D., Brookes, D. M., Commane, R., Reeves, C. E., Huntrieser, H., Heard, D. E., Monks, P. S., Burrows, J. P., Schlager, H., Kartal, D., Evans, M. J., Floquet, C. F. A., Ingham, T., Methven, J., and Parker, A. E.: Peroxy radical partitioning during the AMMA radical intercomparison exercise, Atmos. Chem. Phys., 10, 10621–10638, https://doi.org/10.5194/acp-10-10621-2010, 2010.
Atkinson, R., Aschmann, S. M., Carter, W. P., Winer, A. M., and Pitts Jr., J. N.: Alkyl nitrate formation from the nitrogen oxide (NOx)-air photooxidations of C2–C8 n-alkanes, J. Phys. Chem., 86, 4563–4569, 1982.
Atkinson, R.: Atmospheric reactions of alkoxy and β-hydroxyalkoxy radicals, Int. J. Chem. Kinet., 29, 99–111, 1997.
Atkinson, R.: Atmospheric Chemistry of VOCs and NOx, Atmos. Environ., 34, 2063–2101, 2000.
Atkinson, R. and Arey, J.: Atmospheric degradation of volatile organic compounds, Chem. Rev., 103, 4605–4638, https://doi.org/10.1021/Cr0206420, 2003.
Badol, C., Borbon, A., Locoge, N., Léonardis, T., and Galloo, J.-C.: An automated monitoring system for VOC ozone precursors in ambient air: development, implementation and data analysis, Anal. Bioanal. Chem., 378, 1815–1827, 2004.
Burkert, J., Behmann, T., Andrés Hernández, M., Stöbener, D., Weißenmayer, M., Perner, D., and Burrows, J.: Measurements of peroxy radicals in a forested area of Portugal, Chemosphere, 3, 327–338, 2001.
Butkovskaya, N., Kukui, A., Pouvesle, N., and Le Bras, G.: Formation of nitric acid in the gas-phase HO2 + NO reaction: Effects of temperature and water vapor, J. Phys. Chem. A, 109, 6509–6520, 2005.
Butkovskaya, N., Kukui, A., and Le Bras, G.: HNO3 Forming Channel of the HO2 + NO Reaction as a Function of Pressure and Temperature in the Ranges of 72–600 Torr and 223–323 K, J. Phys. Chem. A, 111, 9047–9053, 2007.
Butkovskaya, N., Rayez, M.-T., Rayez, J.-C., Kukui, A., and Le Bras, G.: Water vapor effect on the HNO3 yield in the HO2 + NO reaction: experimental and theoretical evidence, J. Phys. Chem. A, 113, 11327–11342, 2009.
Cantrell, C., and Stedman, D.: A possible technique for the measurement of atmospheric peroxy radicals, Geophys. Res. Lett., 9, 846–849, 1982.
Cantrell, C. A., Zimmer, A., and Tyndall, G. S.: Absorption cross sections for water vapor from 183 to 193 nm, Geophys. Res. Lett., 24, 2195–2198, 1997.
Claeys, M., Graham, B., Vas, G., Wang, W., Vermeylen, R., Pashynska, V., Cafmeyer, J., Guyon, P., Andreae, M. O., and Artaxo, P.: Formation of secondary organic aerosols through photooxidation of isoprene, Science, 303, 1173–1176, 2004.
Clemitshaw, K. C., Carpenter, L. J., Penkett, S. A., and Jenkin, M. E.: A calibrated peroxy radical chemical amplifier for ground-based tropospheric measurements, J. Geophys. Res., 102, 25405, https://doi.org/10.1029/97jd01902, 1997.
Detournay, A., Sauvage, S., Locoge, N., Gaudion, V., Leonardis, T., Fronval, I., Kaluzny, P., and Galloo, J.-C.: Development of a sampling method for the simultaneous monitoring of straight-chain alkanes, straight-chain saturated carbonyl compounds and monoterpenes in remote areas, J. Environ. Monitor., 13, 983–990, 2011.
Detournay, A., Sauvage, S., Riffault, V., Wroblewski, A., and Locoge, N.: Source and behavior of isoprenoid compounds at a southern France remote site, Atmos. Environ., 77, 272–282, 2013.
Dusanter, S., Vimal, D., and Stevens, P. S.: Technical note: Measuring tropospheric OH and HO2 by laser-induced fluorescence at low pressure. A comparison of calibration techniques, Atmos. Chem. Phys., 8, 321–340, https://doi.org/10.5194/acp-8-321-2008, 2008.
Eisele, F. L., Mauldin, L., Cantrell, C., Zondlo, M., Apel, E., Fried, A., Walega, J., Shetter, R., Lefer, B., and Flocke, F.: Summary of measurement intercomparisons during TRACE-P, J. Geophys. Res.-Atmos., 108, 8791, https://doi.org/10.1029/2002JD003167, 2003.
Feiner, P. A., Brune, W. H., Miller, D. O., Zhang, L., Cohen, R. C., Romer, P. S., Goldstein, A. H., Keutsch, F. N., Skog, K. M., and Wennberg, P. O.: Testing atmospheric oxidation in an Alabama forest, J. Atmos. Sci., 73, 4699–4710, 2016.
Fuchs, H., Brauers, T., Häseler, R., Holland, F., Mihelcic, D., Müsgen, P., Rohrer, F., Wegener, R., and Hofzumahaus, A.: Intercomparison of peroxy radical measurements obtained at atmospheric conditions by laser-induced fluorescence and electron spin resonance spectroscopy, Atmos. Meas. Tech., 2, 55–64, https://doi.org/10.5194/amt-2-55-2009, 2009.
Fuchs, H., Brauers, T., Dorn, H.-P., Harder, H., Häseler, R., Hofzumahaus, A., Holland, F., Kanaya, Y., Kajii, Y., Kubistin, D., Lou, S., Martinez, M., Miyamoto, K., Nishida, S., Rudolf, M., Schlosser, E., Wahner, A., Yoshino, A., and Schurath, U.: Technical Note: Formal blind intercomparison of HO2 measurements in the atmosphere simulation chamber SAPHIR during the HOxComp campaign, Atmos. Chem. Phys., 10, 12233–12250, https://doi.org/10.5194/acp-10-12233-2010, 2010.
Fuchs, H., Bohn, B., Hofzumahaus, A., Holland, F., Lu, K. D., Nehr, S., Rohrer, F., and Wahner, A.: Detection of HO2 by laser-induced fluorescence: calibration and interferences from RO2 radicals, Atmos. Meas. Tech., 4, 1209–1225, https://doi.org/10.5194/amt-4-1209-2011, 2011.
Fuchs, H., Dorn, H.-P., Bachner, M., Bohn, B., Brauers, T., Gomm, S., Hofzumahaus, A., Holland, F., Nehr, S., Rohrer, F., Tillmann, R., and Wahner, A.: Comparison of OH concentration measurements by DOAS and LIF during SAPHIR chamber experiments at high OH reactivity and low NO concentration, Atmos. Meas. Tech., 5, 1611–1626, https://doi.org/10.5194/amt-5-1611-2012, 2012.
Goliff, W. S., Stockwell, W. R., and Lawson, C. V.: The regional atmospheric chemistry mechanism, version 2, Atmos. Environ., 68, 174–185, 2013.
Griffith, S., Hansen, R., Dusanter, S., Michoud, V., Gilman, J., Kuster, W., Veres, P., Graus, M., De Gouw, J., and Roberts, J.: Measurements of hydroxyl and hydroperoxy radicals during CalNex-LA: Model comparisons and radical budgets, J. Geophys. Res.-Atmos., 121, 4211–4232, 2016.
Griffith, S. M., Hansen, R. F., Dusanter, S., Stevens, P. S., Alaghmand, M., Bertman, S. B., Carroll, M. A., Erickson, M., Galloway, M., Grossberg, N., Hottle, J., Hou, J., Jobson, B. T., Kammrath, A., Keutsch, F. N., Lefer, B. L., Mielke, L. H., O'Brien, A., Shepson, P. B., Thurlow, M., Wallace, W., Zhang, N., and Zhou, X. L.: OH and HO2 radical chemistry during PROPHET 2008 and CABINEX 2009 – Part 1: Measurements and model comparison, Atmos. Chem. Phys., 13, 5403–5423, https://doi.org/10.5194/acp-13-5403-2013, 2013.
Hastie, D. R., Weissenmayer, M., Burrows, J. P., and Harris, G. W.: Calibrated chemical amplifier for atmospheric ROx measurements, Anal. Chem., 63, 2048–2057, 1991.
Hewitt, C. N., Lee, J. D., MacKenzie, A. R., Barkley, M. P., Carslaw, N., Carver, G. D., Chappell, N. A., Coe, H., Collier, C., Commane, R., Davies, F., Davison, B., DiCarlo, P., Di Marco, C. F., Dorsey, J. R., Edwards, P. M., Evans, M. J., Fowler, D., Furneaux, K. L., Gallagher, M., Guenther, A., Heard, D. E., Helfter, C., Hopkins, J., Ingham, T., Irwin, M., Jones, C., Karunaharan, A., Langford, B., Lewis, A. C., Lim, S. F., MacDonald, S. M., Mahajan, A. S., Malpass, S., McFiggans, G., Mills, G., Misztal, P., Moller, S., Monks, P. S., Nemitz, E., Nicolas-Perea, V., Oetjen, H., Oram, D. E., Palmer, P. I., Phillips, G. J., Pike, R., Plane, J. M. C., Pugh, T., Pyle, J. A., Reeves, C. E., Robinson, N. H., Stewart, D., Stone, D., Whalley, L. K., and Yin, X.: Overview: oxidant and particle photochemical processes above a south-east Asian tropical rainforest (the OP3 project): introduction, rationale, location characteristics and tools, Atmos. Chem. Phys., 10, 169–199, https://doi.org/10.5194/acp-10-169-2010, 2010.
Hofzumahaus, A., Brauers, T., Aschmutat, U., Brandenburger, U., Dorn, H. P., Hausmann, M., Hessling, M., Holland, F., Plass Dulmer, C., Sedlacek, M., Weber, M., and Ehhalt, D. H.: The measurement of tropospheric OH radicals by laser-induced fluorescence spectroscopy during the POPCORN field campaign and Intercomparison of tropospheric OH radical measurements by multiple folded long-path laser absorption and laser induced fluorescence – Reply, Geophys. Res. Lett., 24, 3039–3040, 1997.
Hofzumahaus, A., Aschmutat, U., Brandenburger, U., Brauers, T., Dorn, H. P., Hausmann, M., Hessling, M., Holland, F., Plass-Duelmer, C., and Ehhalt, D. H.: Intercomparisons of Tropospheric OH Measurements by Different Laser Techniques during the POPCORN Campaign 1994, J. Atmos. Chem., 31, 227–246, 1998.
Hornbrook, R. S., Crawford, J. H., Edwards, G. D., Goyea, O., Mauldin III, R. L., Olson, J. S., and Cantrell, C. A.: Measurements of tropospheric HO2 and RO2 by oxygen dilution modulation and chemical ionization mass spectrometry, Atmos. Meas. Tech., 4, 735–756, https://doi.org/10.5194/amt-4-735-2011, 2011.
Kartal, D., Andrés-Hernández, M. D., Reichert, L., Schlager, H., and Burrows, J. P.: Technical Note: Characterisation of a DUALER instrument for the airborne measurement of peroxy radicals during AMMA 2006, Atmos. Chem. Phys., 10, 3047–3062, https://doi.org/10.5194/acp-10-3047-2010, 2010.
Kebabian, P. L., Robinson, W. A., and Freedman, A.: Optical extinction monitor using cw cavity enhanced detection, Rev. Sci. Instrum., 78, 063102, https://doi.org/10.1063/1.2744223, 2007.
Kebabian, P. L., Wood, E. C., Herndon, S. C., and Freedman, A.: A Practical Alternative to Chemiluminescence-Based Detection of Nitrogen Dioxide: Cavity Attenuated Phase Shift Spectroscopy, Environ. Sci. Technol., 42, 6040–6045, 2008.
Kroll, J. H. and Seinfeld, J. H.: Chemistry of secondary organic aerosol: Formation and evolution of low-volatility organics in the atmosphere, Atmos. Environ., 42, 3593–3624, 2008.
Lanzendorf, E. J., Hanisco, T. F., Donahue, N. M., and Wennberg, P. O.: Comment on: “The measurement of tropospheric OH radicals by laser-induced fluorescence spectroscopy during the POPCORN field campaign” by Hofzumahaus et al. and “Intercomparison of tropospheric OH radical measurements by multiple folded long-path laser absorption and laser induced fluorescence” by Brauers et al., Geophys. Res. Lett, 24, 3037–3038, https://doi.org/10.1029/97GL02899, 1997.
Lelieveld, J., Butler, T. M., Crowley, J. N., Dillon, T. J., Fischer, H., Ganzeveld, L., Harder, H., Lawrence, M. G., Martinez, M., Taraborrelli, D., and Williams, J.: Atmospheric oxidation capacity sustained by a tropical forest, Nature, 452, 737–-740, 2008.
Lew, M. M., Dusanter, S., and Stevens, P. S.: Measurement of interferences associated with the detection of the hydroperoxy radical in the atmosphere using laser-induced fluorescence, Atmos. Meas. Tech., 11, 95–109, https://doi.org/10.5194/amt-11-95-2018, 2018.
Lew, M. M., Rickly, P. S., Bottorff, B. P., Sklaveniti, S., Léonardis, T., Locoge, N., Dusanter, S., Kundu, S., Wood, E., and Stevens, P. S.: OH and HO2 Radical Chemistry in an Indiana Forest: Measurements and Model Comparisons, in preparation, 2019.
Liu, Y. and Zhang, J.: Atmospheric Peroxy Radical Measurements using Dual-Channel Chemical Amplification Ravity Ringdown Spectroscopy, Anal. Chem., 86, 5391–5398, 2014.
Lockwood, A. L., Shepson, P. B., Fiddler, M. N., and Alaghmand, M.: Isoprene nitrates: preparation, separation, identification, yields, and atmospheric chemistry, Atmos. Chem. Phys., 10, 6169–6178, https://doi.org/10.5194/acp-10-6169-2010, 2010.
Lu, K. D., Rohrer, F., Holland, F., Fuchs, H., Bohn, B., Brauers, T., Chang, C. C., Häseler, R., Hu, M., Kita, K., Kondo, Y., Li, X., Lou, S. R., Nehr, S., Shao, M., Zeng, L. M., Wahner, A., Zhang, Y. H., and Hofzumahaus, A.: Observation and modelling of OH and HO2 concentrations in the Pearl River Delta 2006: a missing OH source in a VOC rich atmosphere, Atmos. Chem. Phys., 12, 1541–1569, https://doi.org/10.5194/acp-12-1541-2012, 2012.
Mao, J., Ren, X., Zhang, L., Van Duin, D. M., Cohen, R. C., Park, J.-H., Goldstein, A. H., Paulot, F., Beaver, M. R., Crounse, J. D., Wennberg, P. O., DiGangi, J. P., Henry, S. B., Keutsch, F. N., Park, C., Schade, G. W., Wolfe, G. M., Thornton, J. A., and Brune, W. H.: Insights into hydroxyl measurements and atmospheric oxidation in a California forest, Atmos. Chem. Phys., 12, 8009–8020, https://doi.org/10.5194/acp-12-8009-2012, 2012.
Mihele, C., Mozurkewich, M., and Hastie, D.: Radical loss in a chain reaction of CO and NO in the presence of water: Implications for the radical amplifier and atmospheric chemistry, Int. J. Chem. Kin., 31, 145–152, 1999.
Mihele, C. and Hastie, D.: Optimized Operation and Calibration Procedures for Radical Amplifier-Type Detectors, J. Atmos. Ocean. Tech., 17, 788–794, https://doi.org/10.1175/1520-0426(2000)017<0788:OOACPF>2.0.CO;2, 2000.
Mihele, C. M. and Hastie, D. R.: The sensitivity of the radical amplifier to ambient water vapour, Geophys. Res. Lett., 25, 1911–1913, https://doi.org/10.1029/98gl01432, 1998.
Mihele, C. M. and Hastie, D. R.: Radical chemistry at a forested continental site: Results from the PROPHET 1997 campaign, J. Geophys. Res., 108, 4450, https://doi.org/10.1029/2002JD002888, 2003.
Mount, G. H. and Williams, E. J.: An overview of the tropospheric OH photochemistry experiment, Fritz Peak/Idaho Hill, Colorado, fall 1993, J. Geophys. Res.-Atmos., 102, 6171–6186, 1997.
Ng, N. L., Kwan, A. J., Surratt, J. D., Chan, A. W. H., Chhabra, P. S., Sorooshian, A., Pye, H. O. T., Crounse, J. D., Wennberg, P. O., Flagan, R. C., and Seinfeld, J. H.: Secondary organic aerosol (SOA) formation from reaction of isoprene with nitrate radicals (NO3), Atmos. Chem. Phys., 8, 4117–4140, https://doi.org/10.5194/acp-8-4117-2008, 2008.
Onel, L., Brennan, A., Gianella, M., Ronnie, G., Lawry Aguila, A., Hancock, G., Whalley, L., Seakins, P. W., Ritchie, G. A. D., and Heard, D. E.: An intercomparison of HO2 measurements by fluorescence assay by gas expansion and cavity ring-down spectroscopy within HIRAC (Highly Instrumented Reactor for Atmospheric Chemistry), Atmos. Meas. Tech., 10, 4877–4894, https://doi.org/10.5194/amt-10-4877-2017, 2017.
Orlando, J. J. and Tyndall, G. S.: Laboratory studies of organic peroxy radical chemistry: an overview with emphasis on recent issues of atmospheric significance, Chem. Soc. Rev., 41, 6294–6317, 2012.
Patchen, A. K., Pennino, M. J., Kiep, A. C., and Elrod, M. J.: Direct kinetics study of the product-forming channels of the reaction of isoprene-derived hydroxyperoxy radicals with NO, Int. J. Chem. Kinet., 39, 353–361, 2007.
Paulot, F., Crounse, J. D., Kjaergaard, H. G., Kroll, J. H., Seinfeld, J. H., and Wennberg, P. O.: Isoprene photooxidation: new insights into the production of acids and organic nitrates, Atmos. Chem. Phys., 9, 1479–1501, https://doi.org/10.5194/acp-9-1479-2009, 2009.
Peeters, J., Nguyen, T. L., and Vereecken, L.: HOx radical regeneration in the oxidation of isoprene, Phys. Chem. Chem. Phys., 11, 5935–5939, 2009.
Platt, U., Alicke, B., Dubois, R., Geyer, A., Hofzumahaus, A., Holland, F., Martinez, M., Mihelcic, D., Klüpfel, T., and Lohrmann, B.: Free radicals and fast photochemistry during BERLIOZ, in: Tropospheric Chemistry, Springer, 359–394, 2002.
Pugh, T. A. M., MacKenzie, A. R., Hewitt, C. N., Langford, B., Edwards, P. M., Furneaux, K. L., Heard, D. E., Hopkins, J. R., Jones, C. E., Karunaharan, A., Lee, J., Mills, G., Misztal, P., Moller, S., Monks, P. S., and Whalley, L. K.: Simulating atmospheric composition over a South-East Asian tropical rainforest: performance of a chemistry box model, Atmos. Chem. Phys., 10, 279–298, https://doi.org/10.5194/acp-10-279-2010, 2010.
Reichert, L., Hernández, A., Stöbener, D., Burkert, J., and Burrows, J.: Investigation of the effect of water complexes in the determination of peroxy radical ambient concentrations: Implications for the atmosphere, J. Geophys. Res., 108, 4017, https://doi.org/10.1029/2002JD002152, 2003.
Ren, X., Edwards, G. D., Cantrell, C. A., Lesher, R. L., Metcalf, A. R., Shirley, T., and Brune, W. H.: Intercomparison of peroxy radical measurements at a rural site using laser-induced fluorescence and Peroxy Radical Chemical Ionization Mass Spectrometer (PerCIMS) techniques, J. Geophy. Res., 108, 4605, https://doi.org/10.1029/2003JD003644, 2003.
Ren, X., Mao, J., Brune, W. H., Cantrell, C. A., Mauldin III, R. L., Hornbrook, R. S., Kosciuch, E., Olson, J. R., Crawford, J. H., Chen, G., and Singh, H. B.: Airborne intercomparison of HOx measurements using laser-induced fluorescence and chemical ionization mass spectrometry during ARCTAS, Atmos. Meas. Tech., 5, 2025–2037, https://doi.org/10.5194/amt-5-2025-2012, 2012.
Roukos, J., Plaisance, H., Leonardis, T., Bates, M., and Locoge, N.: Development and validation of an automated monitoring system for oxygenated volatile organic compounds and nitrile compounds in ambient air, J. Chromatogr. A, 1216, 8642–8651, 2009.
Sanchez, D., Jeong, D., Seco, R., Wrangham, I., Park, J.-H., Brune, W. H., Koss, A., Gilman, J., de Gouw, J., Misztal, P., Goldstein, A., Baumann, K., Wennberg, P. O., Keutsch, F. N., Guenther, A., and Kim, S.: Intercomparison of OH and OH reactivity measurements in a high isoprene and low NO environment during the Southern Oxidant and Aerosol Study (SOAS), Atmos. Environ., 174, 227–236, https://doi.org/10.1016/j.atmosenv.2017.10.056, 2018.
Schlosser, E., Brauers, T., Dorn, H.-P., Fuchs, H., Häseler, R., Hofzumahaus, A., Holland, F., Wahner, A., Kanaya, Y., Kajii, Y., Miyamoto, K., Nishida, S., Watanabe, K., Yoshino, A., Kubistin, D., Martinez, M., Rudolf, M., Harder, H., Berresheim, H., Elste, T., Plass-Dülmer, C., Stange, G., and Schurath, U.: Technical Note: Formal blind intercomparison of OH measurements: results from the international campaign HOxComp, Atmos. Chem. Phys., 9, 7923–7948, https://doi.org/10.5194/acp-9-7923-2009, 2009.
Sommariva, R., Brown, S. S., Roberts, J. M., Brookes, D. M., Parker, A. E., Monks, P. S., Bates, T. S., Bon, D., de Gouw, J. A., Frost, G. J., Gilman, J. B., Goldan, P. D., Herndon, S. C., Kuster, W. C., Lerner, B. M., Osthoff, H. D., Tucker, S. C., Warneke, C., Williams, E. J., and Zahniser, M. S.: Ozone production in remote oceanic and industrial areas derived from ship based measurements of peroxy radicals during TexAQS 2006, Atmos. Chem. Phys., 11, 2471–2485, https://doi.org/10.5194/acp-11-2471-2011, 2011.
Tan, Z., Fuchs, H., Lu, K., Hofzumahaus, A., Bohn, B., Broch, S., Dong, H., Gomm, S., Häseler, R., He, L., Holland, F., Li, X., Liu, Y., Lu, S., Rohrer, F., Shao, M., Wang, B., Wang, M., Wu, Y., Zeng, L., Zhang, Y., Wahner, A., and Zhang, Y.: Radical chemistry at a rural site (Wangdu) in the North China Plain: observation and model calculations of OH, HO2 and RO2 radicals, Atmos. Chem. Phys., 17, 663–690, https://doi.org/10.5194/acp-17-663-2017, 2017.
Warneke, C., McKeen, S., De Gouw, J., Goldan, P., Kuster, W., Holloway, J., Williams, E., Lerner, B., Parrish, D., and Trainer, M.: Determination of urban volatile organic compound emission ratios and comparison with an emissions database, J. Geophys. Res.-Atmos., 112, D10S47, https://doi.org/10.1029/2006JD007930, 2007.
Washida, N., Mori, Y., and Tanaka, I.: Quantum yield of ozone formation from photolysis of the oxygen molecule at 1849 and 1931 Å, J. Chem. Phys., 54, 1119–1122, 1971.
Wennberg, P. O., Bates, K. H., Crounse, J. D., Dodson, L. G., McVay, R. C., Mertens, L. A., Nguyen, T. B., Praske, E., Schwantes, R. H., Smarte, M. D., St Clair, J. M., Teng, A. P., Zhang, X., and Seinfeld, J. H.: Gas-Phase Reactions of Isoprene and Its Major Oxidation Products, Chem. Rev., 118, 3337–3390, https://doi.org/10.1021/acs.chemrev.7b00439, 2018.
Whalley, L. K., Blitz, M. A., Desservettaz, M., Seakins, P. W., and Heard, D. E.: Reporting the sensitivity of laser-induced fluorescence instruments used for HO2 detection to an interference from RO2 radicals and introducing a novel approach that enables HO2 and certain RO2 types to be selectively measured, Atmos. Meas. Tech., 6, 3425–3440, https://doi.org/10.5194/amt-6-3425-2013, 2013.
Wolfe, G. M., Cantrell, C., Kim, S., Mauldin III, R. L., Karl, T., Harley, P., Turnipseed, A., Zheng, W., Flocke, F., Apel, E. C., Hornbrook, R. S., Hall, S. R., Ullmann, K., Henry, S. B., DiGangi, J. P., Boyle, E. S., Kaser, L., Schnitzhofer, R., Hansel, A., Graus, M., Nakashima, Y., Kajii, Y., Guenther, A., and Keutsch, F. N.: Missing peroxy radical sources within a summertime ponderosa pine forest, Atmos. Chem. Phys., 14, 4715–4732, https://doi.org/10.5194/acp-14-4715-2014, 2014.
Wolfe, G. M., Marvin, M. R., Roberts, S. J., Travis, K. R., and Liao, J.: The Framework for 0-D Atmospheric Modeling (F0AM) v3.1, Geosci. Model Dev., 9, 3309–3319, https://doi.org/10.5194/gmd-9-3309-2016, 2016.
Wood, E. C. and Charest, J.: Chemical Amplification – Cavity Attenuated Phase Shift Spectrometer Measurements of Peroxy Radicals, Anal. Chem., 86, 10266–10273, 2014.
Wood, E. C., Deming, B. L., and Kundu, S.: Ethane-Based Chemical Amplification Measurement Technique for Atmospheric Peroxy Radicals, Environ. Sci. Technol. Lett., 4, 15–19, 2017.
York, D., Evensen, N. M., Martınez, M. L., and De Basabe Delgado, J.: Unified equations for the slope, intercept, and standard errors of the best straight line, Am. J. Phys., 72, 367–375, 2004.
Zenker, T., Fischer, H., Nikitas, C., Parchatka, U., Harris, G., Mihelcic, D., Muesgen, P., Paetz, H., Schultz, M., and Volz-Thomas, A.: Intercomparison of NO, NO2, NOy, O3, and ROx measurements during the Oxidizing Capacity of the Tropospheric Atmosphere (OCTA) campaign 1993 at Izaña, J. Geophys. Res.-Atmos., 103, 13615–13634, 1998.