the Creative Commons Attribution 4.0 License.
the Creative Commons Attribution 4.0 License.
 | 26 Jul 2019
Aerosol properties and their influences on low warm clouds during the Two-Column Aerosol Project
Jianjun Liu
Twelve months of measurements collected during the Two-Column Aerosol Project field campaign at Cape Cod, Massachusetts, which started in the summer of 2012, were used to investigate aerosol physical, optical, and chemical properties and their influences on the dependence of cloud development on thermodynamic (i.e., lower tropospheric stability, LTS) conditions. Relationships between aerosol loading and cloud properties under different dominant air-mass conditions and the magnitude of the first indirect effect (FIE), as well as the sensitivity of the FIE to different aerosol compositions, are examined. The seasonal variation in aerosol number concentration (Na) was not consistent with variations in aerosol optical properties (i.e., scattering coefficient, σs, and columnar aerosol optical depth). Organics were found to have a large contribution to small particle sizes. This contribution decreased during the particle growth period. Under low-aerosol-loading conditions, the liquid water path (LWP) and droplet effective radius (DER) significantly increased with increasing LTS, but, under high-aerosol-loading conditions, LWP and DER changed little, indicating that aerosols significantly weakened the dependence of cloud development on LTS. The reduction in LWP and DER from low- to high-aerosol-loading conditions was greater in stable environments, suggesting that clouds under stable conditions are more susceptible to aerosol perturbations than those under more unstable conditions. High aerosol loading weakened the increase in DER as LWP increased and strengthened the increase in cloud optical depth (COD) with increasing LWP, resulting in changes in the interdependence of cloud properties. Under both continental and marine air-mass conditions, high aerosol loading can significantly increase COD and decrease LWP and DER, narrowing their distributions. Magnitudes of the FIE estimated under continental air-mass conditions ranged from 0.07±0.03 to 0.26±0.09 with a mean value of 0.16±0.03 and showed an increasing trend as LWP increased. The calculated FIE values for aerosols with a low fraction of organics are greater than those for aerosols with a high fraction of organics. This implies that clouds over regions dominated by aerosol particles containing mostly inorganics are more susceptible to aerosol perturbations, resulting in larger climate forcing, than clouds over regions dominated by organic aerosol particles.
- Article
(4999 KB) - Full-text XML
- BibTeX
- EndNote


Aerosols can significantly influence climate change through their direct and indirect effects (IPCC, 2013; Li et al., 2016, 2017). The aerosol direct effect is when aerosol particles change Earth's radiative balance by scattering and absorbing solar radiation (e.g., Liu et al., 2012; Yang et al., 2016, 2018). The aerosol indirect effect is when aerosols change cloud microphysical, macrophysical, and precipitation properties through their role as cloud condensation nuclei (CCN) or ice nuclei (IN). Under constant liquid water path (LWP) conditions, an increase in aerosol concentration will lead to an increase in CCN concentration. This results in an increase in cloud droplet number concentration, a decrease in the cloud droplet effective radius (DER), and a more reflective cloud. This is referred to as the first aerosol indirect effect (FIE) (Twomey, 1977; Feingold et al., 2003; Garrett et al., 2004; Zhao et al., 2018, 2019). The decrease in DER will reduce the chances of precipitation forming, which prolongs the lifetime of a cloud and enhances its LWP. This is known as the second aerosol indirect effect (e.g., Albrecht, 1989). Aerosols also influence cloud properties through the thermal emissivity effect (e.g., Garrett and Zhao, 2006; Zhao and Garrett, 2015) and the semidirect effect (e.g., Koren et al., 2004). Estimates of indirect aerosol effects have large uncertainties (Boney and Dufresne, 2006; Lohmann et al., 2010). This makes the impact of aerosols on the prediction of the current and future behaviors of Earth's climate system highly uncertain (McComiskey and Feingold, 2008; IPCC, 2013).
The observed response of warm low cloud properties to aerosol properties has been observed from satellite-based remote sensing (Bréon et al., 2002; Lebsock et al., 2008; Su et al., 2010; Wang et al., 2014), surface-based remote sensing (Kim et al., 2003; Feingold et al., 2003, 2006; Garrett et al., 2004; McComiskey et al., 2009; Liu et al., 2016; Qiu et al., 2017; Liu and Li, 2018a), combined surface measurements and satellite retrievals (Sporre et al., 2012, 2014), and aircraft measurements (Zhang et al., 2011; Twohy et al., 2013; Painemal and Zuidema, 2013; Werner et al., 2014; Zhao et al., 2018, 2019; Yang et al., 2019). Most of these studies have shown that DER significantly decreases as aerosol loading increases. However, LWP can increase or decrease with aerosol loading, depending on cloud thermodynamics and dynamics (Han et al., 2002). Current estimates of FIE from all available observational platforms have a large range of values because each set of measurements used has its own set of uncertainties, and so do their approaches. The large uncertainty and the wide range of FIE values result in large uncertainties in aerosol indirect radiative forcing estimates (McComiskey and Feingold, 2008). Narrowing uncertainties in measures of aerosol–cloud interactions (ACIs) and developing well-constrained parameterizations for models requires analyses of ACIs over different climatic and aerosol regions of the Earth.
Large-scale thermodynamic conditions, such as lower tropospheric stability (LTS), significantly influence cloud development. Changes in ACIs due to different LTS have been widely investigated using observations made from the surface and from satellite remote sensing (Matsui et al., 2004; Su et al., 2010; Liu et al., 2016). However, to what degree the dependence of cloud development to aerosol perturbations is related to large-scale dynamic thermodynamic conditions is not well known. Moreover, the mechanism behind the aerosol FIE is that aerosols affect the cloud droplet number and the cloud DER through their role as CCN, which is determined by the aerosol particle size, number concentration, chemical composition, amount of water vapor, and meteorology (Sekiguchi et al., 2003; Wang et al., 2008; Qiu et al., 2017; Yang et al., 2019). Liu and Li (2018b) reported a significant influence of aerosol hygroscopicity on the magnitude of the aerosol FIE when aerosol optical quantities are used to estimate the FIE. The role of aerosol size and number concentrations on the FIE has also been examined (Garrett et al., 2004; Komppula et al., 2005; Anttila et al., 2009). Garrett et al. (2004) indicated a weak sensitivity of FIE to aerosols with small particle sizes but a stronger sensitivity to aerosols with relatively large sizes. However, the question of how sensitive cloud properties are to aerosol composition in addition to aerosol loading is still under investigation (Hao et al., 2013; Portin et al., 2014).
The Department of Energy's Atmospheric Radiation Measurement (ARM) mobile facility was stationed at Cape Cod, Massachusetts, from July 2012 to June 2013 for the Two-Column Aerosol Project (TCAP) field campaign (Berg et al., 2016). Measurements of aerosol, radiation, and cloud characteristics were made at the site, which is subject to both clear and cloudy conditions as well as clean and polluted conditions. Continental, marine, and continental–marine mixed air masses commonly pass over the site. This study uses data collected during the TCAP field campaign to investigate aerosol physical, optical, and chemical properties and their influence on the dependence of cloud development on large-scale thermodynamic conditions under different air-mass conditions. Also investigated is the influence of aerosol loading on cloud properties under different air-mass conditions and the magnitude of the FIE as well as the sensitivity of the FIE to different aerosol compositions and aerosol loadings. Section 2 describes the data and methods used in this study. Section 3 presents the seasonal variations in aerosol physical, optical, and chemical properties and their influence on low warm clouds. Section 4 gives conclusions.
2.1 Aerosol properties
2.1.1 Surface aerosol properties
The optical properties of surface aerosols were measured by a suite of instruments making up the Aerosol Observing System (AOS), which is the primary ARM platform for in situ aerosol observations. The TSI-3010 condensation particle counter was used to obtain the total number concentration of condensation particles (Na) with diameters larger than 10 nm and smaller than 3 µm. A TSI-3653 nephelometer and a Radiance Research particle soot absorption photometer (PSAP) measured the scattering (σs) coefficients at three wavelengths (450, 550, and 700 nm) and the absorption (σa) coefficients at three wavelengths (470, 528, and 660 nm), respectively, of total (≤10 µm) and fine-mode (≤1 µm) aerosol particles (Jefferson, 2011). Nephelometer and PSAP measurements have undergone calibration and quality control using the methods developed by Anderson and Ogren (1998) and Anderson et al. (1999), respectively. Measurements of σa at 470 nm were normalized to 450 nm to match σs measurements. The single-scattering albedo (SSA) of surface aerosol particles is then calculated as σs/(σs+σa) using σs and σa at 450 nm. The time resolution of the Na, σs, and σa measurements is 1 min.
The aerosol size distribution ranging from 15 to 450 nm was measured by a scanning mobility particle sizer (SMPS) with 5 min averaging. The SMPS contains a cylindrical differential mobility analyzer (TSI Inc., model 3081) and a condensation particle counter (TSI Inc., model 3010) and is calibrated using polystyrene latex standards (Wang et al., 2003). An aerosol chemical speciation monitor (ACSM) measured the bulk chemical composition of the nonrefractory components of submicron (aerodynamic diameter ranging from ∼40 to 1000 nm) aerosol particles (organics, sulfate, nitrate, ammonium, and chloride). The ACSM is a thermal vaporization electron impact ionization mass spectrometer built upon the same technology as the widely used aerosol mass spectrometer. Under ambient conditions, the detection limit of the mass concentration of particles is less than 0.2 µg m−3 for 30 min signal averaging. The ACSM is calibrated with ammonium nitrate following the method of Ng et al. (2011).
2.1.2 Columnar aerosol properties
Columnar aerosol optical depths (AODs) and Ångström exponents (AEs) were obtained from the Aerosol Robotic Network (AERONET) database (Holben et al., 1998). AODs are retrieved from direct Sun measurements with an uncertainty of 0.01–0.02 (Eck et al., 1999). This study uses Level 2.0 quality-assured and cloud-screened data.
2.2 Cloud properties
2.2.1 Cloud boundaries
Cloud-base and cloud-top heights were identified using a combination of observations from the 95 GHz W-band ARM cloud radar (WACR), the micropulse lidar (MPL), and the ceilometer (Kollias et al., 2007). The algorithm used in the cloud boundary retrieval is similar to the method developed by Clothiaux et al. (2000) based on 35 GHz millimeter cloud radar observations. Cloud and precipitation masks are determined from the WACR based on the signal-to-noise ratio thresholds determined for each time profile. An MPL cloud mask is combined with ceilometer cloud-base estimates to produce a best-estimate cloud base for each time point. The MPL and WACR cloud masks are then merged with an additional filter to remove insect returns in the lower troposphere. Insects are identified using a combination of the WACR linear depolarization ratio and reflectivity measurements. The temporal and vertical resolutions of the cloud boundary product are 5 s and 42.856 m, respectively. Cloud-base and cloud-top heights were temporally averaged to generate data at a 1 min time resolution. The cloud-base and cloud-top height uncertainties are ∼7.5 and ∼45 m, respectively (Zhao et al., 2012a; Garrett and Zhao, 2013).
2.2.2 Cloud microphysical properties
A two-channel narrow-field-of-view (NFOV) radiometer and a microwave radiometer profiler (MWRP) generated cloud optical depth (COD) and LWP retrievals. The cloud droplet effective radius (re) was calculated using the following equation:
where ρw is the density of liquid water and τ is the COD in the visible. The NFOV radiometer with a 5.7∘ field of view measuring downwelling zenith radiances at 673 and 870 nm at a 1 s time resolution is used to retrieve COD using the method described by Chiu et al. (2010) and Liu et al. (2013). Simultaneous highly accurate AERONET sun-photometer-measured radiances (Holben et al., 1998) quantified the biases in the NFOV radiance measurements (Fig. 1). AERONET and NFOV radiances agree well at 673 and 870 nm (coefficient of correlation, r, equal to 0.99 in both cases). However, NFOV-measured zenith radiances at 673 nm are underestimated by ∼15 %. Consequently, NFOV measurements at 673 nm were adjusted using the following formula:
where F673,obs represents measured zenith radiances and F673,adj represents adjusted radiances at 673 nm. The total uncertainty in COD retrievals using this method is ∼17 % (Chiu et al., 2010). The COD retrievals were averaged to generate data at a 1 min resolution for matching the time resolution of the LWP retrievals. The MWRP built by the Radiometrics Corporation measures atmospheric brightness temperatures at 12 frequencies. LWPs were retrieved using brightness temperatures measured at the five K-band channels (22.235, 23.035, 23.835, 26.235, and 30.0 GHz) with a 1 min time resolution based on the statistical retrieval algorithm developed by Liljegren and Lesht (2004). Typical uncertainties in LWP retrievals from microwave radiometers are ∼20 g m−2 for LWP < 200 g m−2 and ∼10 % for LWP > 200 g m−2 (Liljegren and Lesht, 2004; Dong et al., 2008).

Figure 1CIMEL sun-photometer-measured radiance as a function of narrow-field-of-view (NFOV) radiometer-measured radiance at 673 nm (black dots) and 870 nm (gray dots). The diagonal line represents the 1:1 line. Units are watts per steradian per squared meter (W sr−1 m−2). The legend gives the coefficient of correlation (r) and the slope of the best-fit linear regression line through each dataset.
This study considers only nonprecipitating, low warm clouds with cloud-top heights less than 3 km. LWP observations less than 40 g m−2 and greater than 300 g m−2 were excluded to avoid very thin clouds, broken cloud cover, postprecipitation conditions (McComiskey et al., 2009), and potential precipitation contamination (Dong et al., 2008).
2.3 Surface and large-scale meteorological parameters
The ARM surface meteorological system measured surface meteorological parameters during the campaign period at a 1 min resolution. The large-scale vertical motion (ω) at 700 hPa and LTS are used in this study to constrain large-scale dynamic and thermodynamic conditions (Su et al., 2010; Medeiros and Stevens, 2011; Liu et al., 2016). The difference between the potential temperature of the free troposphere (700 hPa) and the surface defines LTS.
To investigate the influence of aerosols on cloud properties, aerosol properties (Na, σs, composition), cloud properties (COD, LWP, DER, boundary-layer height), surface meteorological parameters, and ECMWF simulations (LTS, large-scale vertical velocity) were matched according to observation time and averaged and interpolated over 1 min time intervals.
2.4 Air-mass trajectory classification
Two-day air-mass back trajectories arriving at the site at 500 m at midnight were simulated using the Hybrid Single Particle Lagrangian Integrated Trajectory model (Stein et al., 2015; Rolph, 2016). All simulated trajectories are classified into three clusters. Cluster I represents continental air masses generally originating from the continental area located to the west of the site and moving over the site. Air masses originating from the ocean area to the east of the site and directly moving over the site are the marine air masses (cluster II). Cluster III represents an air mass that has passed over both continental regions and the ocean to the site, influenced by anthropogenic and marine aerosols. During the study period, the occurrence frequencies of cluster I, II, and III air masses were 62.5 %, 15.9 %, and 21.6 %, respectively.
3.1 Variations in aerosol properties
3.1.1 Seasonal variations in aerosol optical properties and number concentration
Figure 2 shows monthly statistics describing surface-measured σs for total (σ10) and fine-mode (σ1) aerosol particles and Na. Table 1 summarizes their seasonal and annual mean values. Maxima in σ1 and σ10 are found in the summer months, and minima in σ1 and σ10 are found in the winter months. Fine particles dominate aerosol scattering in the summertime and are responsible for ∼75 % of the total particle scattering. The contribution of fine particle scattering to total particle scattering in other seasons ranges from ∼46 % to ∼54 %, indicating that particles with diameters ≤1 µm and ranging from 1 to 10 µm play a similar role in aerosol scattering extinction. Monthly and seasonal variations in Na show that maximum and minimum seasonally mean Na values occur in spring and autumn, respectively, inconsistent with the variations in aerosol scattering coefficient. This inconsistency is probably due to seasonal differences in aerosol particle size distribution and chemical composition since aerosol extinction properties depend strongly on particle size and chemical composition. The total particle SSA shows a slight seasonal variation, suggesting smaller changes in aerosol particle absorption properties. Figure 3 shows monthly statistics describing columnar AOD and AE. Table 1 summarizes their seasonal and annual mean values. The variations in AOD and AE are consistent with the variations in surface-measured σs and the ratio σ1∕σ10, indicating that surface aerosol properties can represent columnar aerosol properties very well at this site. Figure 4 shows monthly mean wind speeds and wind directions during the campaign period. Monthly mean wind speeds ranged from ∼3.8 to 6.6 m s−1, and southwesterly winds dominated throughout the whole year over the area. Months in summer and winter with the strongest mean surface wind speeds (e.g., June and January/February, respectively) are generally times when the contribution of fine particles to the total scattering extinction is small.
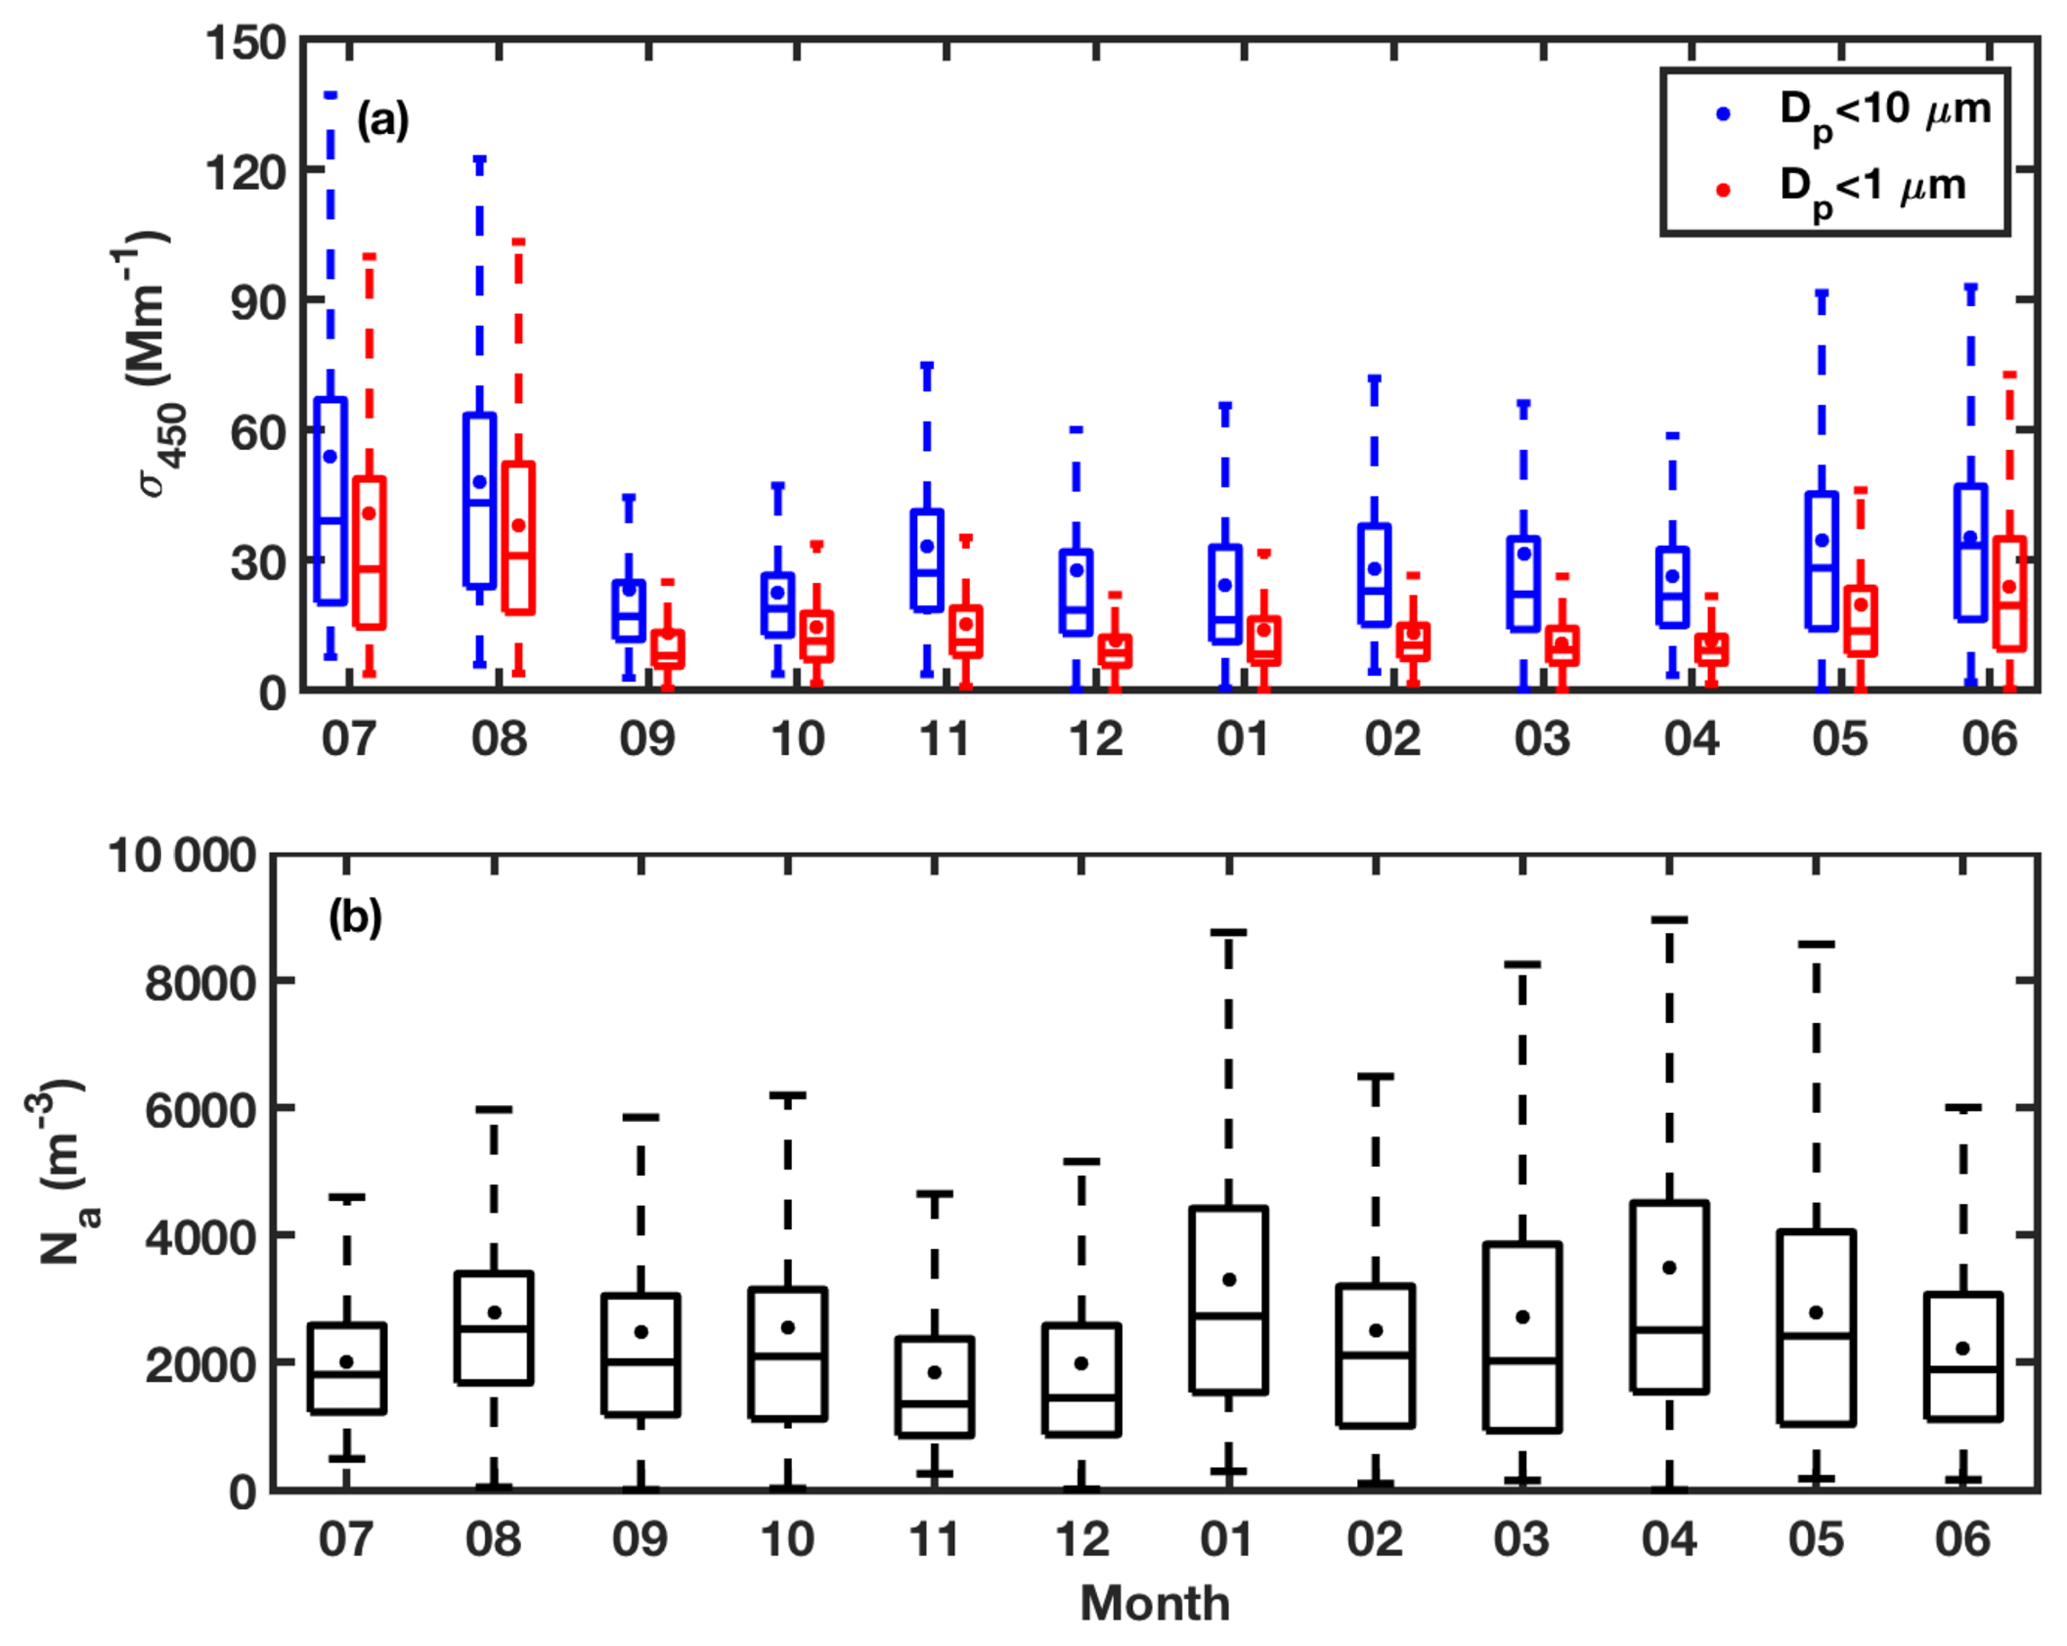
Figure 2Monthly variations in (a) aerosol scattering coefficient at 450 nm (σ450) for total (in blue, particle diameter, Dp, less than 10 µm) and fine-mode (in red, Dp less than 1 µm) aerosol particles and (b) aerosol particle number concentration (Na). Box-and-whisker plots include median values (horizontal lines inside boxes), 25th and 75th percentiles (ends of boxes), 5th and 95th percentiles (ends of whiskers), and mean values (black dots). Months from left to right start at July 2012 and end at June 2013.
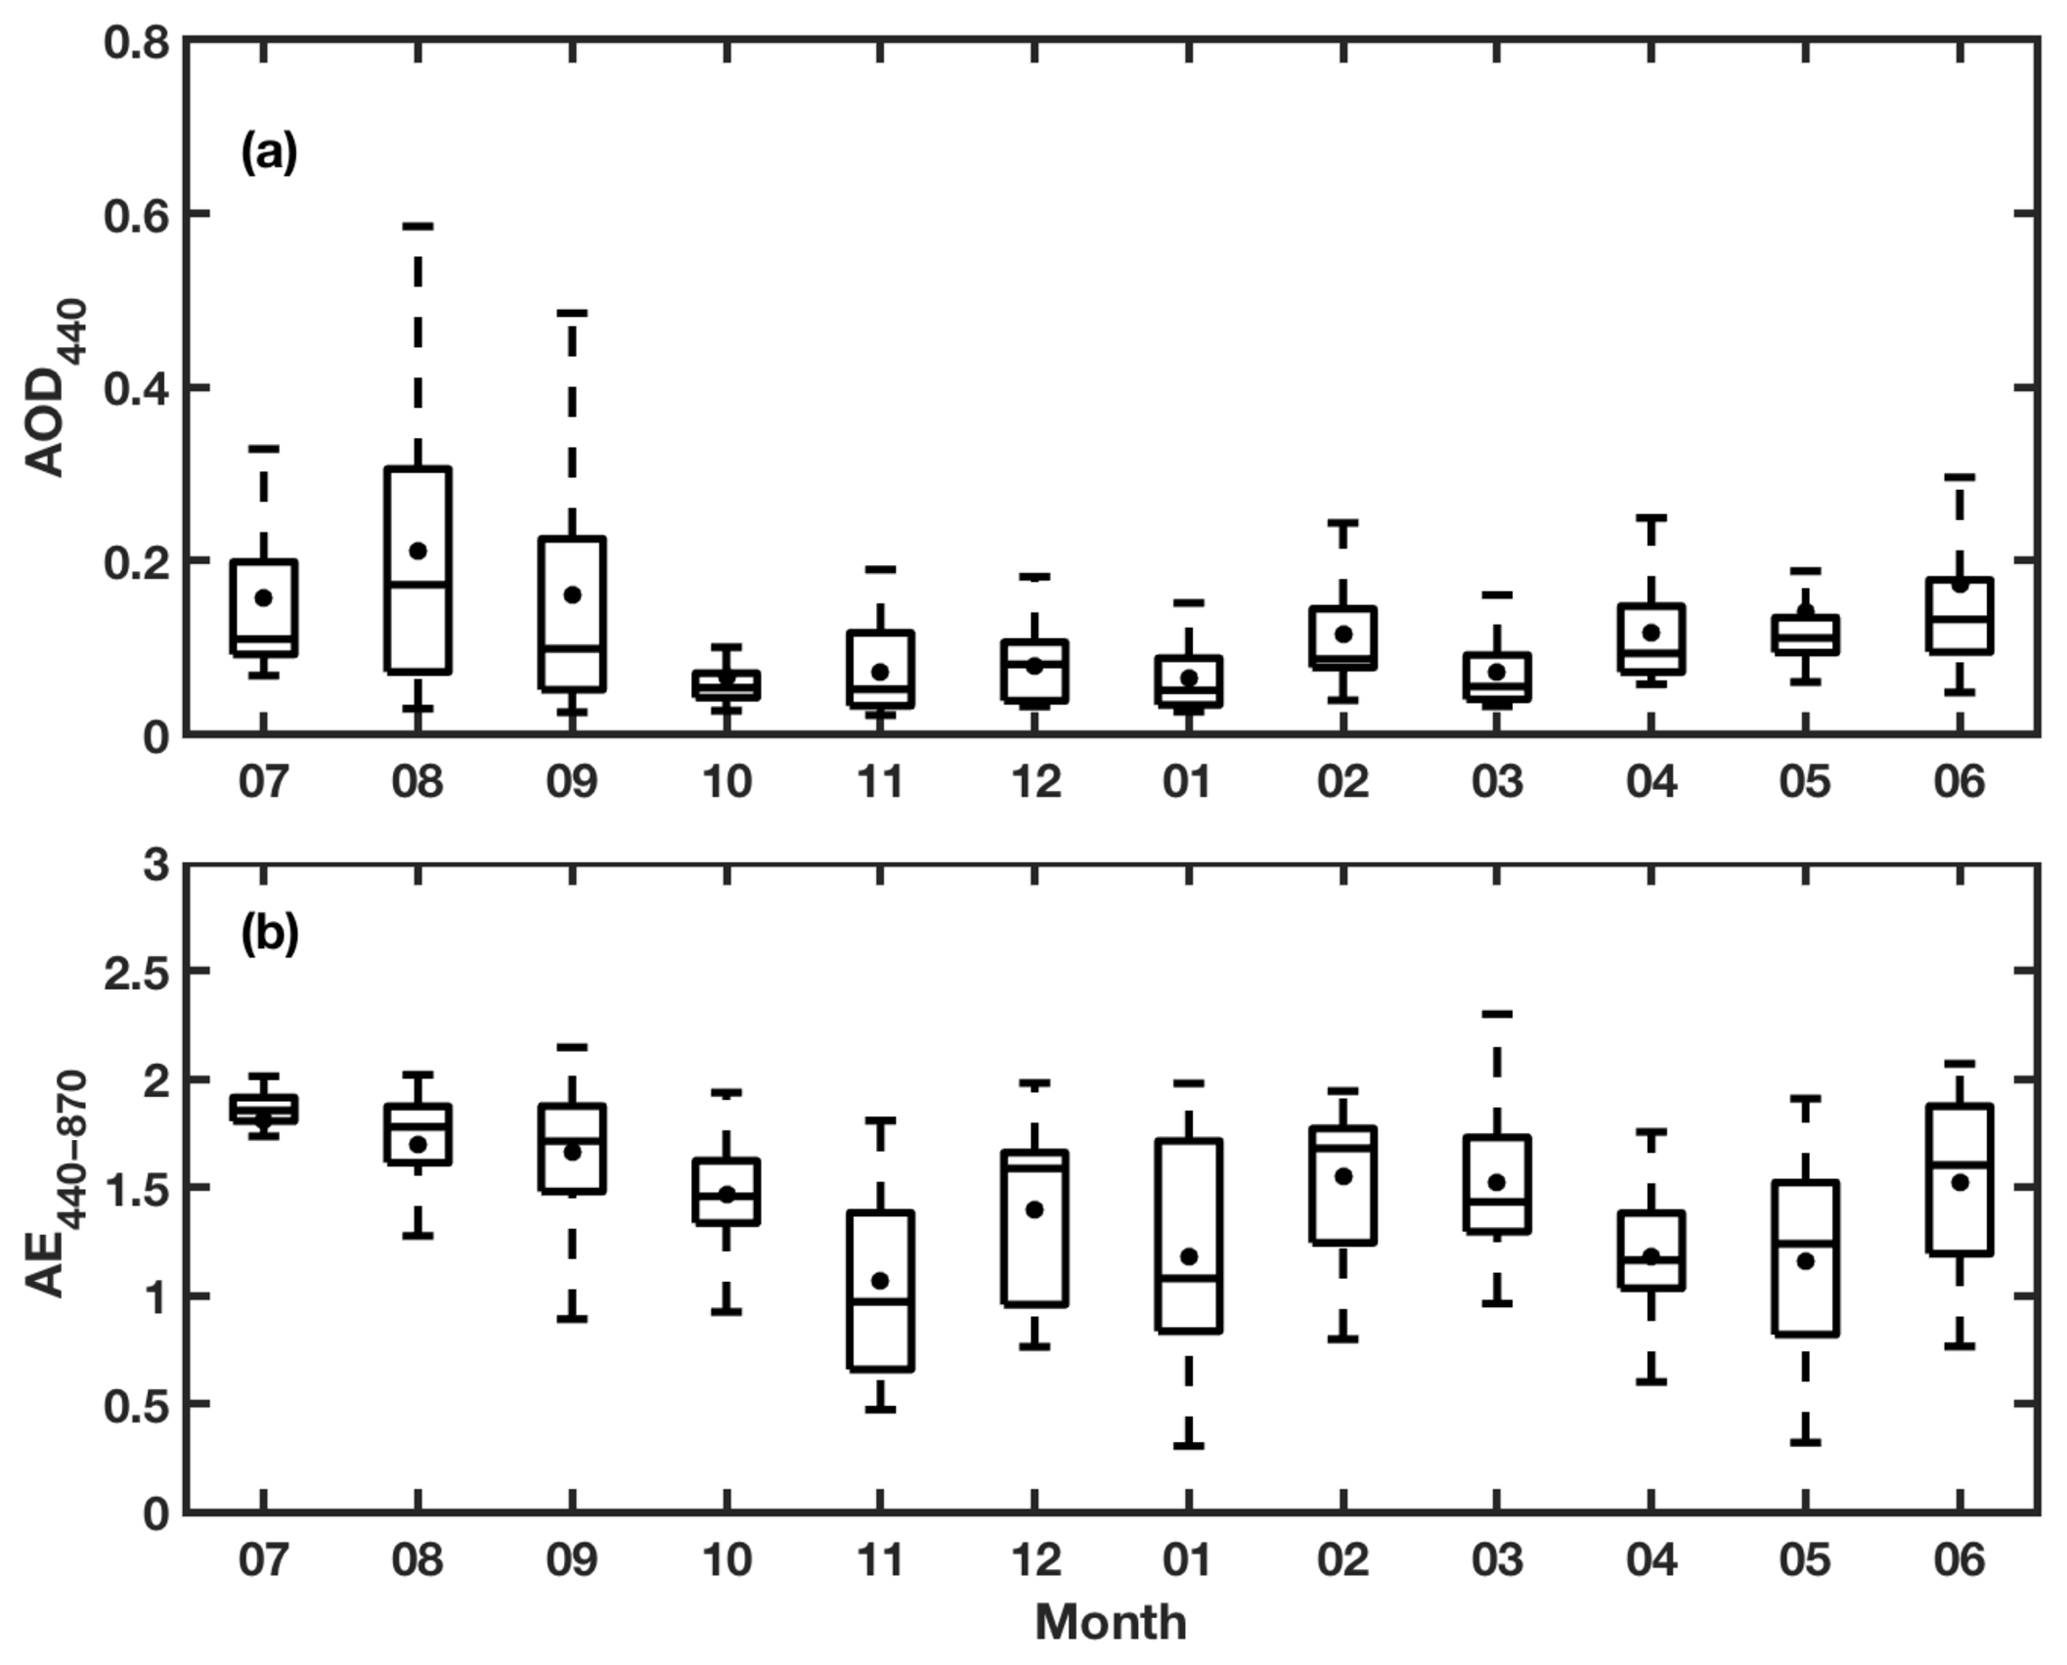
Figure 3Monthly variations in columnar (a) aerosol optical depth at 440 nm (AOD440) and (b) Ångström exponent (AE). Box-and-whisker plots include median values (horizontal lines inside boxes), 25th and 75th percentiles (ends of boxes), 5th and 95th percentiles (ends of whiskers), and mean values (black dots). Months from left to right start at July 2012 and end at June 2013.
Table 1Seasonally averaged aerosol properties during the campaign period.
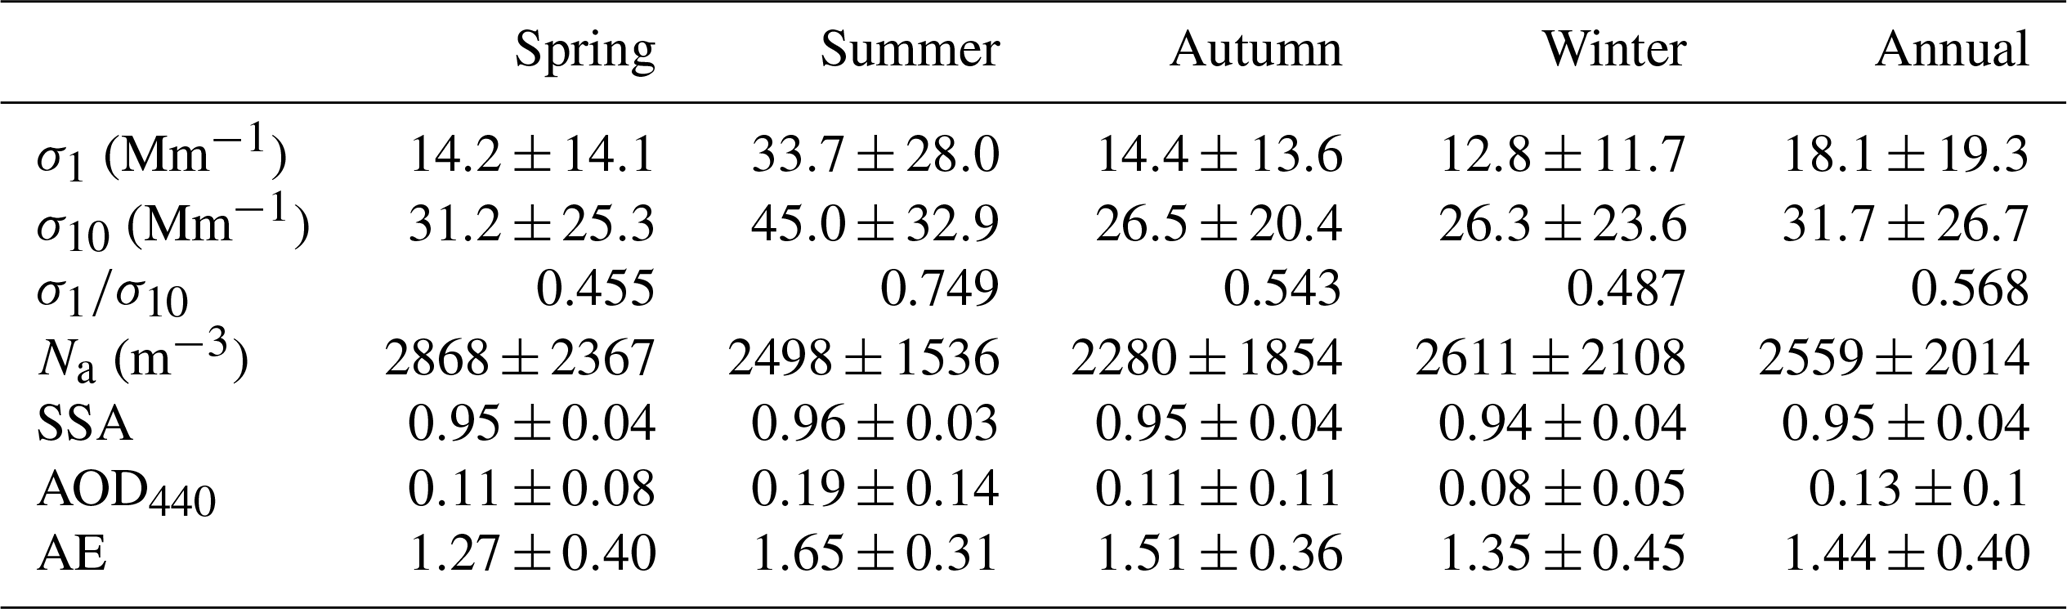
σ1: scattering coefficient, fine-mode particles; σ10: scattering coefficient, total; Na: aerosol number concentration; SSA: single-scattering albedo; AOD440: aerosol optical depth at 440 nm; AE: Ångström exponent.
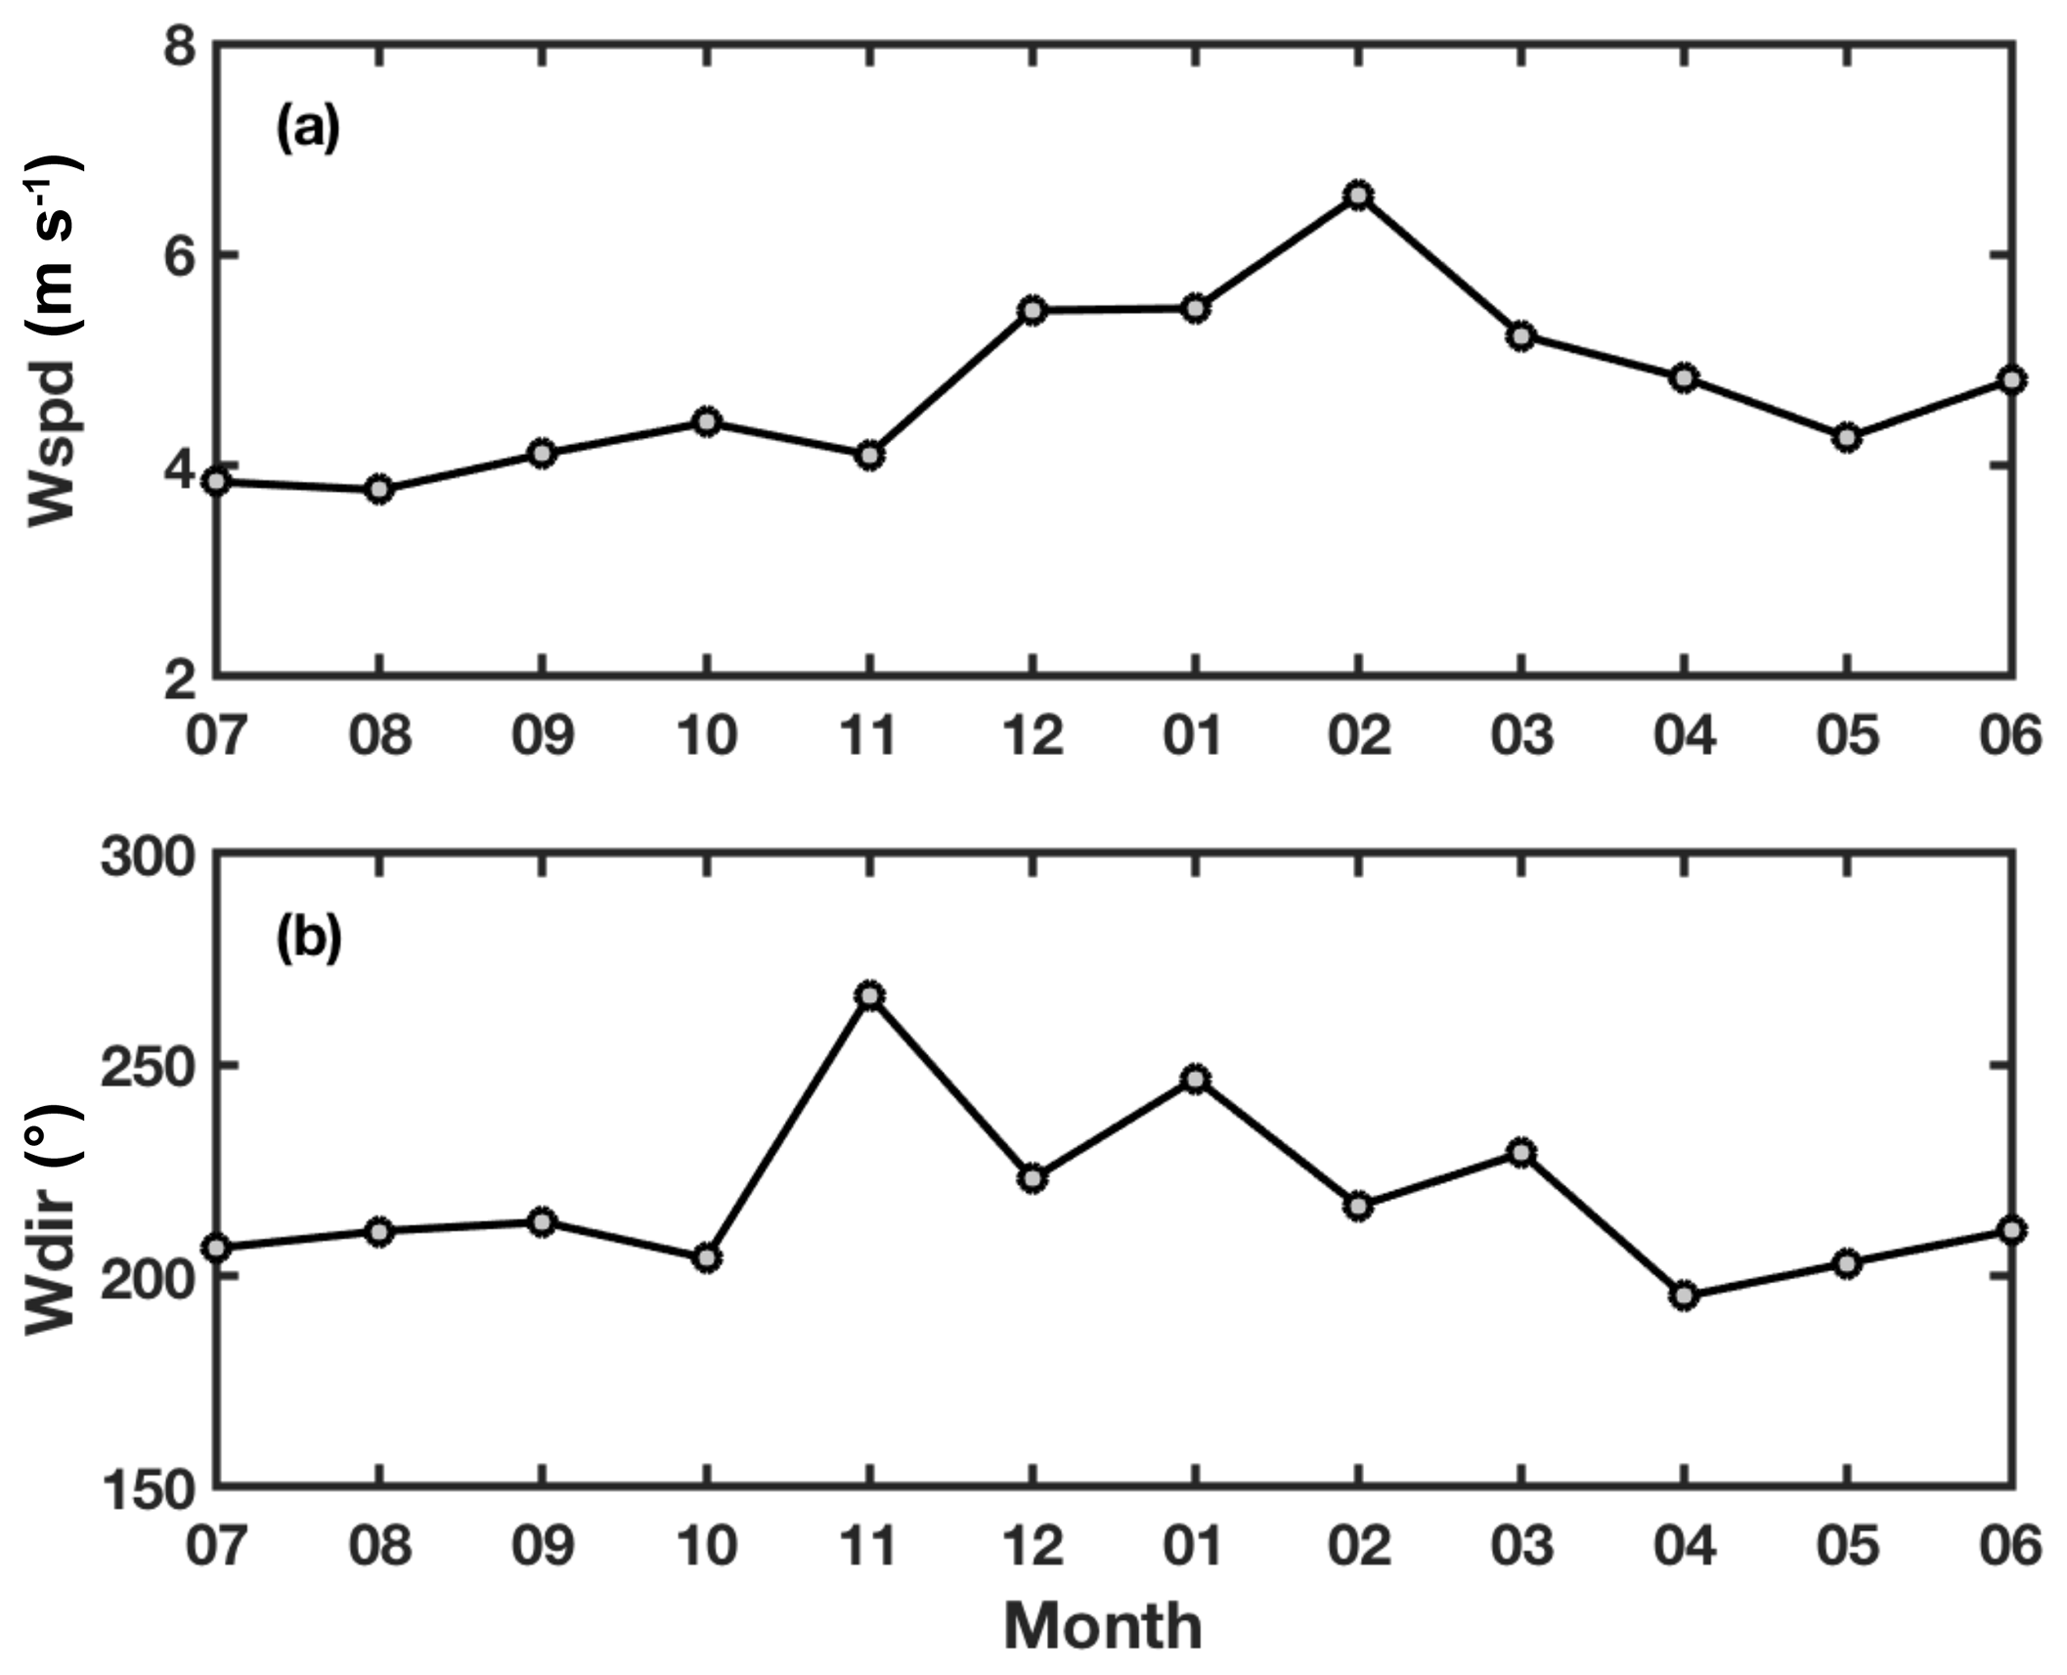
Figure 4Monthly mean (a) wind speed (Wspd) and (b) wind direction (Wdir) during the campaign period. Months from left to right start at July 2012 and end at June 2013.
3.1.2 Aerosol optical properties under different air-mass conditions
Table 2 gives the discrepancies in aerosol properties when different air masses are in place over the site. The mean value of σ1 is the largest/smallest under continental/marine air-mass conditions. However, σ10 is the largest under cluster III conditions and has similar values under cluster I and II conditions. The inconsistent variations in σ1 and σ10 under different air-mass conditions can be explained by dominant particle size as indicated by the ratio σ1∕σ10. When the continental air mass influenced the site, fine particles dominated aerosol scattering and were responsible for ∼65 % of the total particle scattering, indicating that more anthropogenic aerosols with small particle sizes were transported to the site from continental regions to the west. The values of σ1∕σ10 under cluster II and III air-mass conditions show that both fine-mode and coarse-mode particles played similar roles on the total particle scattering. The variation in Na is consistent with that in σ1 with the largest and smallest values under cluster I and II conditions, respectively. Smaller SSA values are found under continental air-mass conditions, suggesting that more absorbing aerosols were present in this air mass than in other air masses due to the anthropogenic influence. AOD values in each air mass are similar, and the variation in AE is consistent with the variation in the ratio σ1∕σ10.
Table 2Means and standard deviations of aerosol and cloud properties for each air-mass cluster.
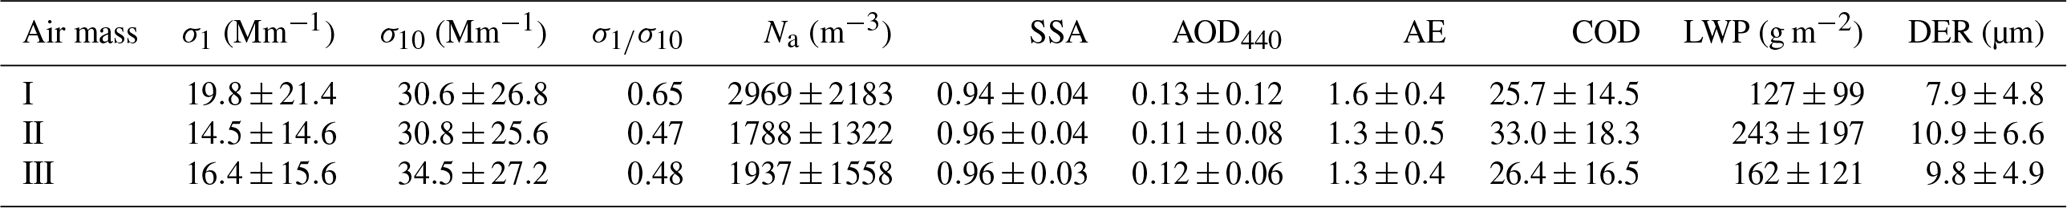
σ1: scattering coefficient, fine-mode particles; σ10: scattering coefficient, total; Na: aerosol number concentration; SSA: single-scattering albedo; AOD440: aerosol optical depth at 440 nm; AE: Ångström exponent; COD: cloud optical depth; LWP: liquid water path; DER: cloud droplet effective radius.
3.1.3 Aerosol chemical composition and size distribution
Figure 5 shows the size distribution and the corresponding mass fraction of organics, sulfate, ammonium, and nitrate of surface aerosol particles sampled in July and August 2012. New-particle-formation and growth periods were detected and are outlined by red rectangles in the figure. During the measurement period, fine particles containing more organics were dominant with a mean particle radius of 91.4±20.6 nm and a mean organic mass fraction of 0.67±0.16. Mean mass fractions of sulfate, ammonium, and nitrate are 0.18±0.11, 0.10±0.09, and 0.04±0.02, respectively. At the beginning of new-particle-formation and growth periods, organics contributed the most to small particle sizes. Their contribution decreased as the growth period progressed to be replaced by contributions from inorganics, in particular sulfate. This is possible because sulfate ions are formed during nucleation involving neutral gaseous species like ammonia and sulfuric acid (Crilley et al., 2014). Small aerosol particles generally contribute more organics to the total aerosol mass over the study site, which can also be seen in the relation between mean aerosol particle radii and organic mass fraction (Fig. 6). The strong decrease in aerosol particle size with increasing organic mass fraction has also been reported by others (Broekhuizen et al., 2006; McFiggans et al., 2006).

Figure 5Time series of (a) particle size distribution and (b) mass fractions of organics (org, dark blue), sulfate (, cyan), ammonium (, yellow), and nitrate () in aerosols sampled during July and August of 2012. Dashed red rectangles outline periods of new particle formation and growth.

Figure 6Mean aerosol particle radius (Dp) as a function of organic mass fraction (FO). The black line is the linear regression line through all FO bins. The gray line is the linear regression line for FO bins ranging from 0.4 to 0.9, which have the most samples. Data are from July and August of 2012. The legend gives the coefficient of correlation (r) and the statistical probability (P).
3.2 Aerosol, cloud, and meteorological conditions
3.2.1 Aerosol effects on the dependence of cloud properties on meteorological conditions
Low-warm-cloud properties are sensitive to changes in thermodynamic conditions (Su et al., 2010; Medeiros and Stevens, 2011; Liu et al., 2016). Figure 7 shows cloud properties (LWP and DER) as functions of LTS under low- and high-scattering-aerosol-index (AI) conditions for continental and marine air masses. The scattering AI here is used as a proxy for CCN (Liu and Li, 2014; Sena et al., 2016) and is defined as the product of surface-measured aerosol scattering coefficients and surface-measured scattering Ångström exponents. Low and high scattering AIs are defined as the lowest and highest quarter of all scattering AI samples, respectively. The cloud properties were averaged over each 6 K LTS bin from 0 to 30 K under low- and high-scattering-AI conditions. The differences in meteorological parameters (e.g., temperature, wind speed, and relative humidity) at the surface and at 850 hPa, and in large-scale dynamic (ω) and thermodynamic parameters (LTS), are not significant under low- and high-scattering-AI conditions (figure not shown). Table 2 summarizes the means and standard deviations of cloud properties under each air-mass condition. Clouds influenced by marine air-mass conditions (cluster II) have the largest COD, LWP, and DER (33.0±18.3, 243±197 g m−2, and 10.9±6.6 µm, respectively), and clouds associated with the air mass from continental areas (cluster I) have the smallest cloud properties (COD = 25.7±14.5, LWP = 127±99 g m−2, and DER = 7.9±4.8 µm). The top panels of Fig. 7 show that LWP significantly increases with increasing LTS under low-aerosol conditions, consistent with results from studies using surface-based measurements (e.g., Liu et al., 2016), satellite measurements (e.g., Su et al., 2010), aircraft measurements (e.g., Cecchini et al., 2016), and model simulations (e.g., Johnson et al., 2004; West et al., 2014). Johnson et al. (2004) showed that an increase in stability induces increases in the buoyancy of free-tropospheric air above the temperature inversion capping the boundary later, inhibiting the entrainment of dry air through the cloud top and increasing LWP as a result. Under high-aerosol conditions, LWP changes little as LTS increases. A likely reason is inhibited cloud droplet sedimentation due to the reduced cloud droplet size, enhancing evaporation and entrainment at the cloud top and reducing LWP (Kaufman et al., 2005; Hill et al., 2009; Zhao and Garrett, 2015; Liu et al., 2016). There are similar variations in DER with increasing LTS under low- and high-aerosol conditions (bottom panels of Fig. 7), i.e., increasing DER as LTS increases under less polluted conditions and almost constant DER as LTS increases under more polluted conditions. The changes in DER with LTS possibly reflect the changes in LWP with LTS due to the high positive correlation between LWP and DER (Zhang et al., 2011; Sporre et al., 2014). The enhanced LWP under highly stable conditions can supply the water needed for cloud droplet growth (Su et al. 2010; Zhang et al., 2011). The increase in LWP is also commonly accompanied by an increase in droplet collision–coalescence, resulting in a decrease in cloud number concentration, thus leading to an increase in DER (Kim et al., 2008; McComiskey et al., 2009; Liu et al., 2016; Zhao et al., 2018, 2019; Yang et al., 2019). Differences in LWP and DER between low- and high-LTS conditions are larger under low-pollution conditions than under high-pollution conditions. This suggests that high-aerosol concentrations can significantly weaken the thermodynamic influence on the increase in LWP and DER due to the aerosol perturbation. These results imply that the development of clouds in a highly polluted environment is inhibited even though the thermodynamic conditions may be the same as those in a much less polluted environment. The chances of precipitation are thus reduced because the rainfall frequency of warm, low clouds and LWP are highly correlated (Chen et al., 2011; Liu et al., 2013).
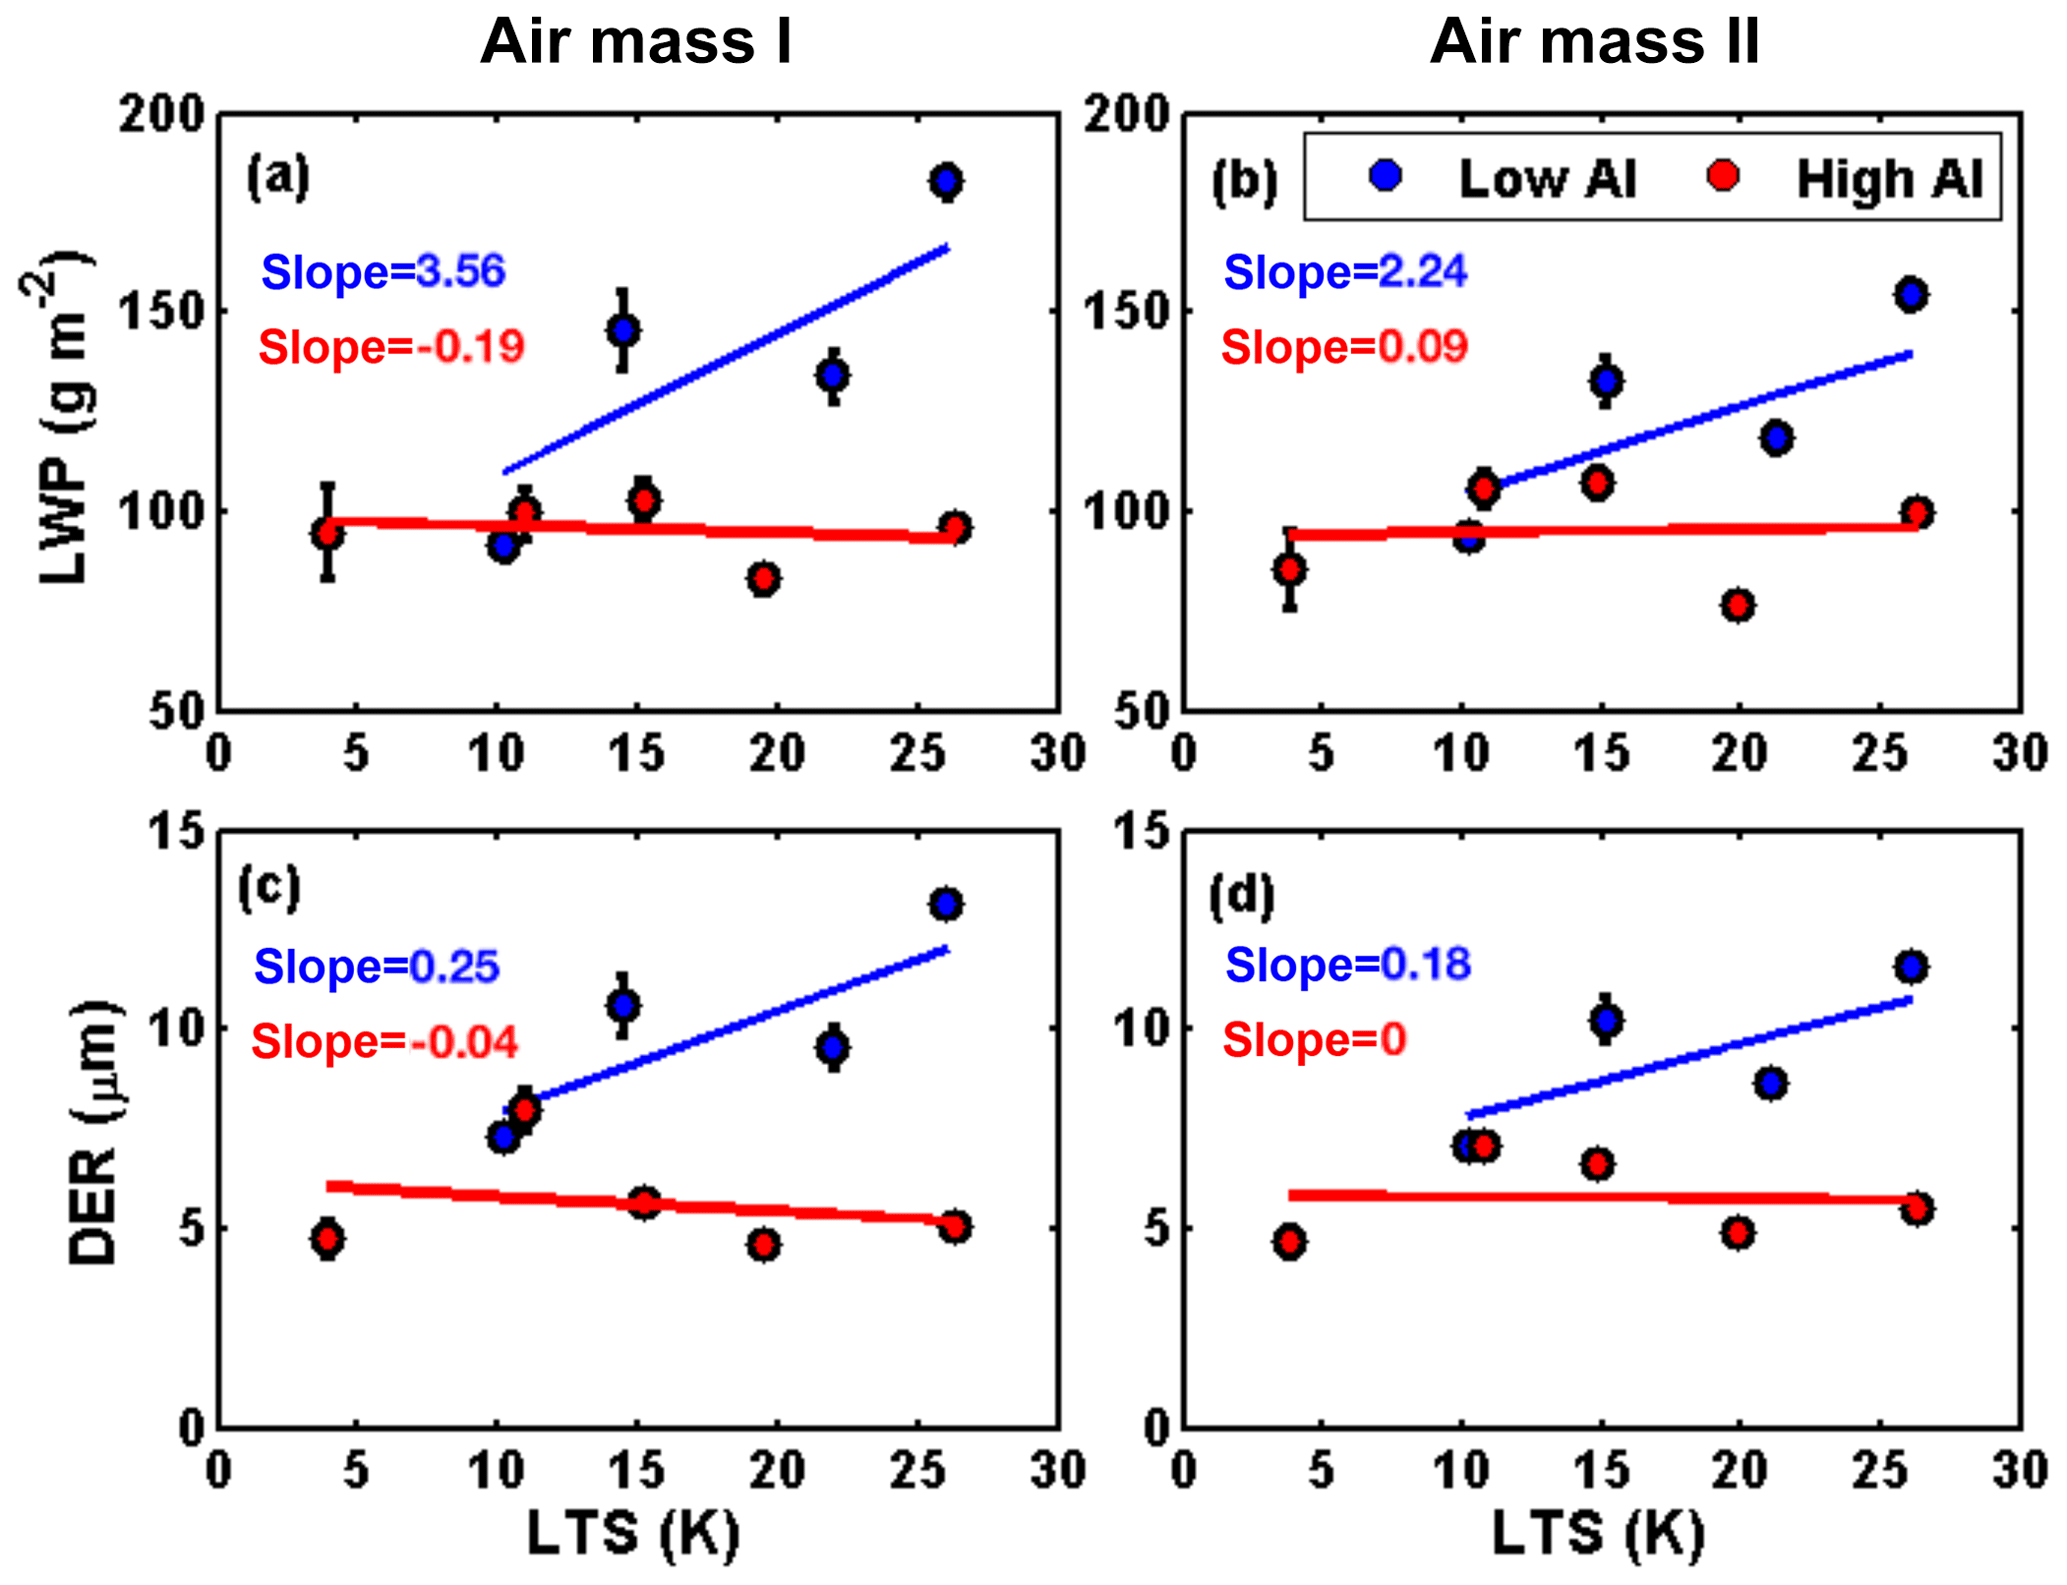
Figure 7Liquid water path (LWP) and cloud droplet effective radius (DER) as functions of lower tropospheric stability (LTS) at low (in blue) and high (in red) scattering aerosol index (AI) levels under cluster I air-mass (a, c) and cluster II air-mass (b, d) conditions. Low and high scattering AIs are defined as the lowest and highest quarter of all scattering AI samples, respectively.
For all LTS bins, clouds under high-aerosol conditions have lower values of LWP and DER than clouds under low-aerosol conditions. The reduction in LWP and DER is greater in stable environments than in unstable environments, suggesting that clouds in stable environments are more affected by the aerosol perturbation than those in more unstable regimes. Studies on marine, warm clouds based on surface measurements have also shown this (Liu et al., 2016).
3.2.2 Aerosol effects on the relationships among cloud properties
Figure 8 shows the dependence of COD and DER on LWP under low- and high-scattering-AI conditions for air-mass clusters I and II. Under high-scattering-AI conditions, COD increases sharply as LWP increases, while, under low-scattering-AI conditions, COD changes little as LWP increases due to the decrease in DER influenced by the aerosol perturbation (Fig. 8a and b). Figure 8c and d suggest that the DER is sensitive to LWP. An increase in LWP leads to a significant increase in the size of cloud droplets (Zhang et al., 2011; Sporre et al., 2014). The increase in DER with LWP is more rapid under low-scattering-AI conditions than under high-scattering-AI conditions. This is because there is a limit to the size a cloud droplet can reach when a given amount of water is shared among a large number of particles (Zhang et al., 2011). High-aerosol-loading conditions weaken the increase in DER and strengthen the increase in COD as LWP increases, indicating that aerosols have an impact on the COD–LWP and DER–LWP relationships.
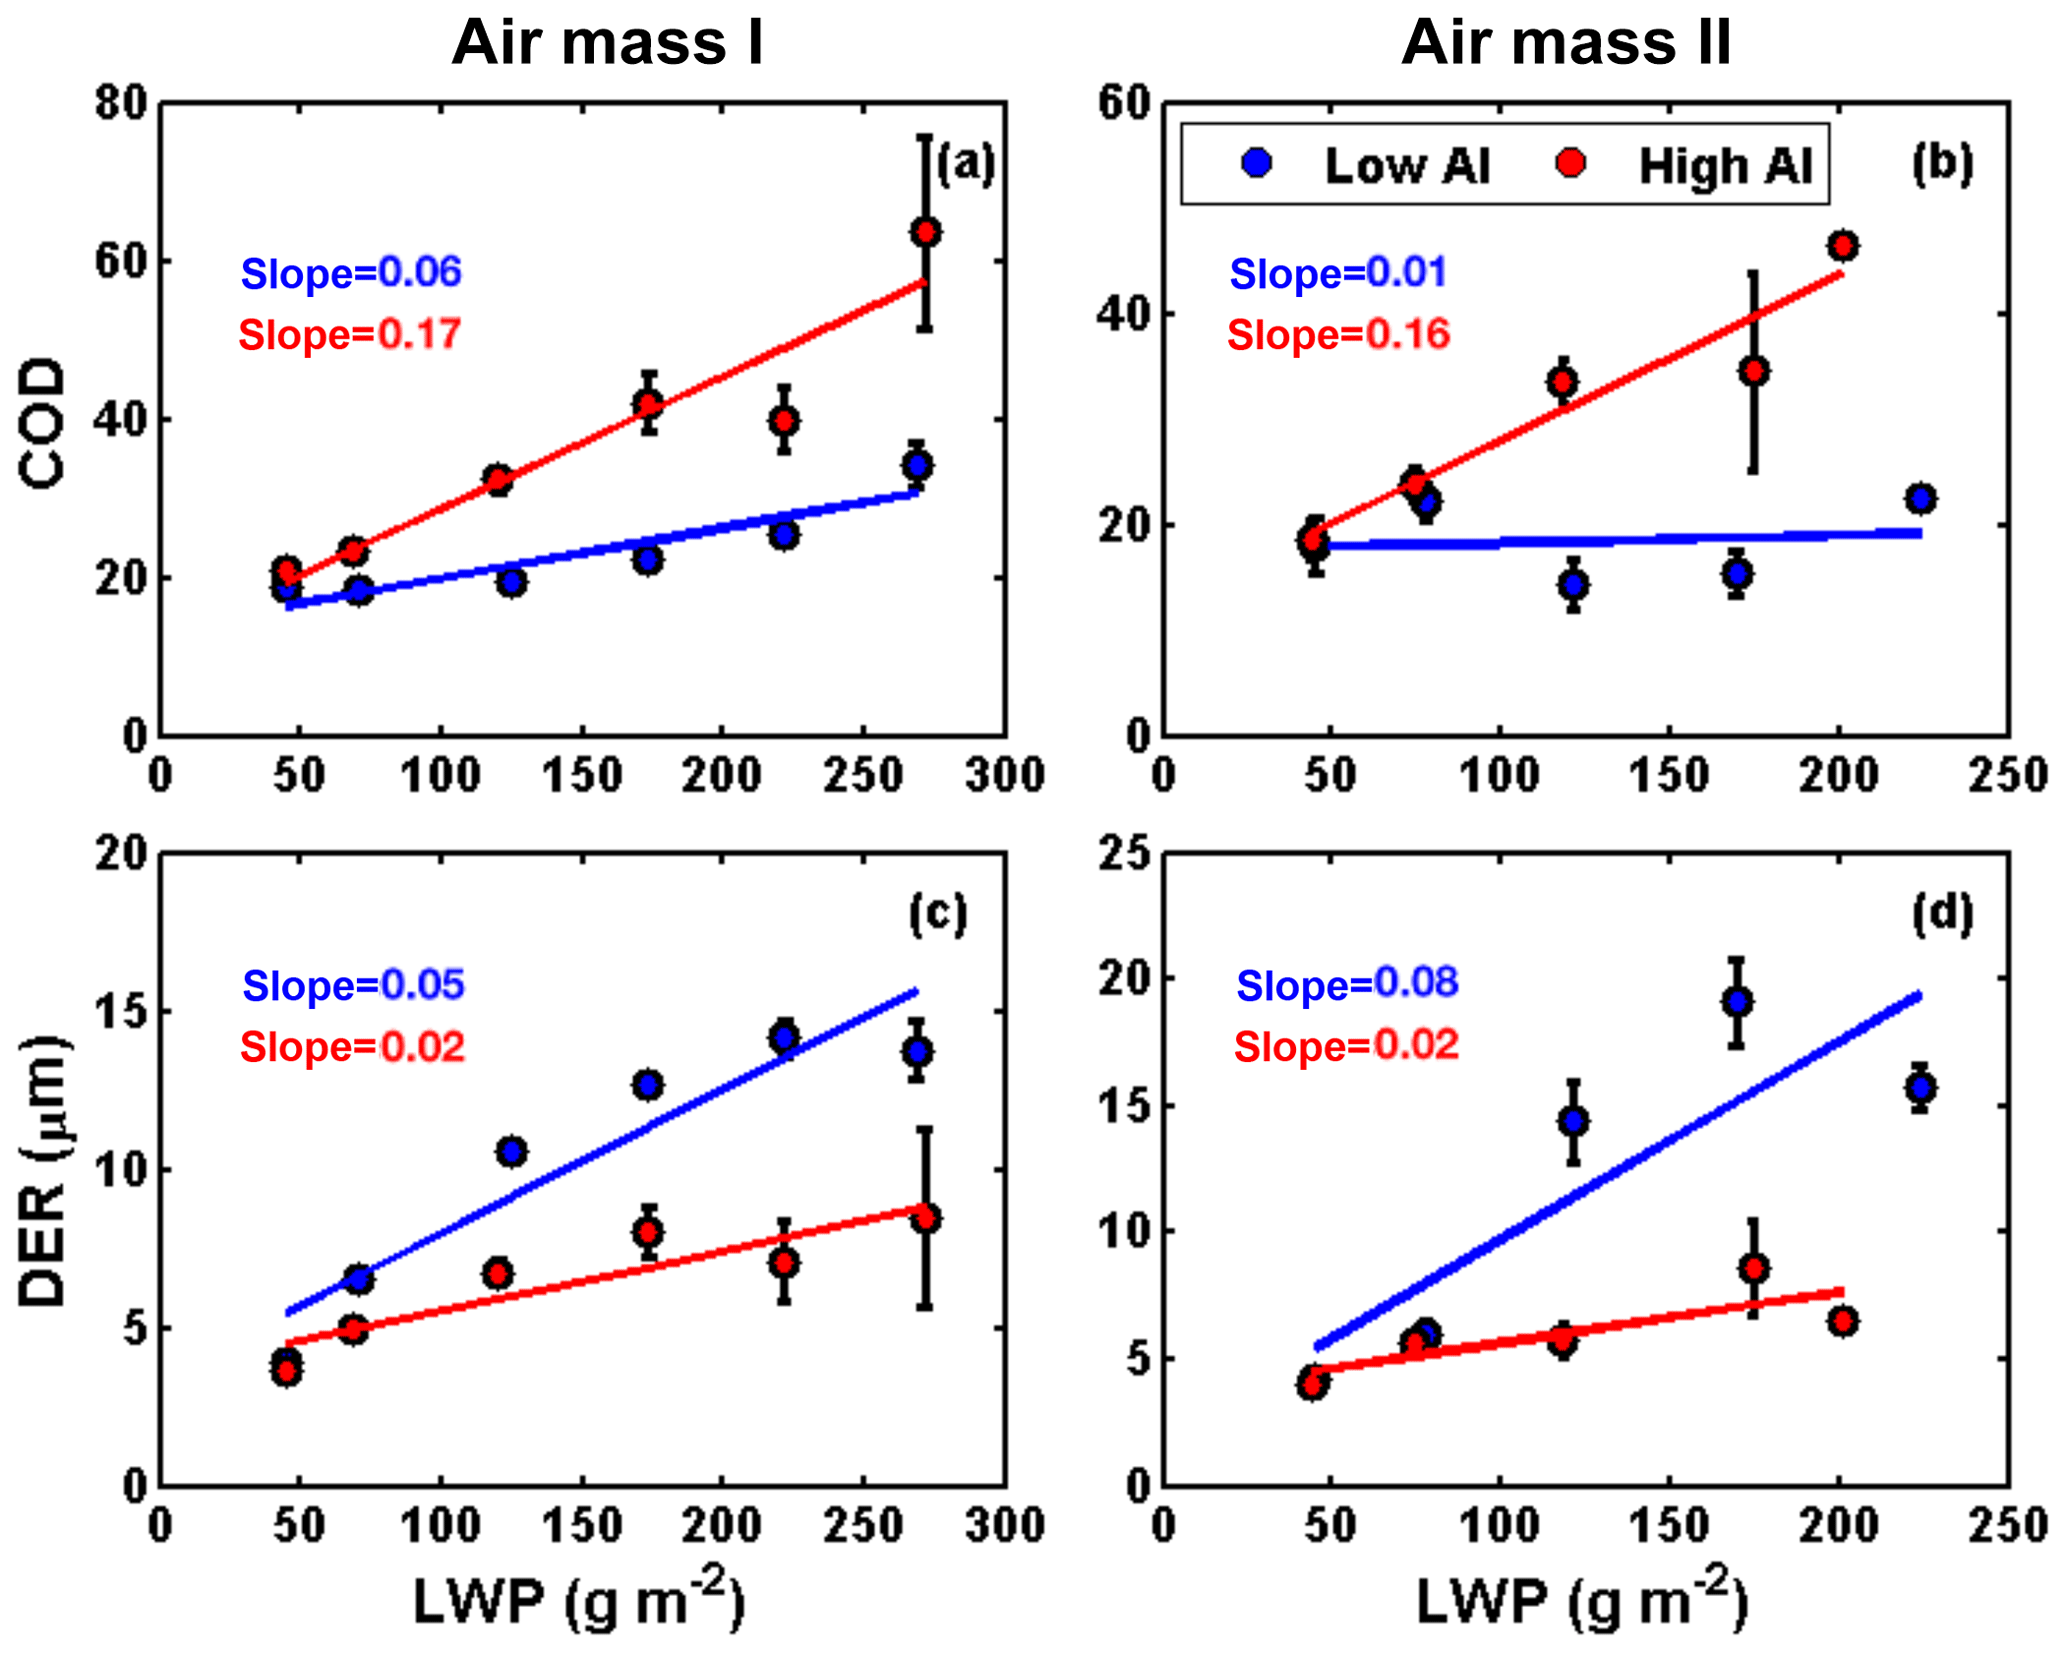
Figure 8Cloud optical depth (COD) and cloud droplet effective radius (DER) as a function of liquid water path (LWP) at low (in blue) and high (in red) scattering aerosol index (AI) levels under cluster I air-mass (a, c) and cluster II air-mass (b, d) conditions. Low and high scattering AIs are defined as the lowest and highest quarter of all scattering AI samples, respectively.
Figure 8 also shows that, across all LWP bins, COD is larger and DER is smaller under high-scattering-AI conditions than under low-scattering-AI conditions, consistent with the Twomey effect. The large differences between COD under low- and high-scattering-AI conditions at high LWP values (Fig. 8a and b) and between DER under low- and high-scattering-AI conditions at high LWP values (Fig. 8c and d) suggest that when clouds have large LWPs, aerosols further inhibit the growth of cloud droplets. Under high-aerosol-loading conditions, more aerosol particles are activated into CCN, resulting in a rapid increase in cloud droplet concentration as LWP increases. However, under low-aerosol-loading conditions, cloud droplet concentrations increase slowly as LWP increases due to the lack of a CCN source, so the size of cloud droplets increases rapidly as LWP increases (Zhang et al., 2011).
3.3 Aerosol effect on cloud properties
3.3.1 Variations in cloud properties with aerosol loading under different air-mass conditions
Figure 9 shows the probability distribution functions (PDFs) of COD, LWP, and DER under low- and high-scattering-AI conditions for air mass clusters I and II. Numbers written in each panel are the mean percentage differences in each cloud property defined as %, where Mc represents the mean value of a cloud property and subscripts h and l represent high and low scattering AI levels, respectively. The PDFs of COD, LWP, and COD under high- and low-scattering-AI conditions differ significantly for both air masses. Although the peak values of COD under low- and high-aerosol-loading conditions are similar, clouds under more polluted conditions have more large values of COD than those under less polluted conditions. There are 24.2 % and 21.9 % increases in COD for cluster I and II respectively. For the low-aerosol-loading case, the PDF of LWP shows a broad maximum with values from 50 to 180 g m−2 (Fig. 9c) and 80 to 230 g m−2 (Fig. 9d) for cluster I and II air masses, respectively. The high-aerosol-loading cases, conversely, have narrower PDFs with distinct peaks between 60 and 70 g m−2. Under high-scattering-AI conditions, the LWP decreases on the order of 30 % and 45 % from the values under low-scattering-AI conditions for the cluster I and II air masses, respectively. Under both air-mass conditions, there is a sharp shift in DER toward smaller values when going from high-aerosol-loading conditions to low-aerosol-loading conditions. Under low-aerosol-loading conditions, the DER values show a broad range with generally higher values varying between 5 and 12 µm for the cluster I air mass and peaking around 15 µm for the cluster II air mass. Under high-aerosol-loading conditions, the PDF of DER for both air masses is significantly narrower, with most of the values less than 10 µm and with peak values around 5 µm. From low- to high-aerosol-loading conditions, DER decreases by ∼40 % (for cluster I) and ∼55 % (for cluster II). As mentioned before, whether low- or high-scattering-AI conditions are in place, meteorological parameters and large-scale dynamic and thermodynamic parameters show little difference, suggesting that aerosols are responsible for the changes in cloud properties. In general, clouds in a marine air mass have slightly larger decreases in LWP and DER from low to high aerosol loading than those in a continental air mass.
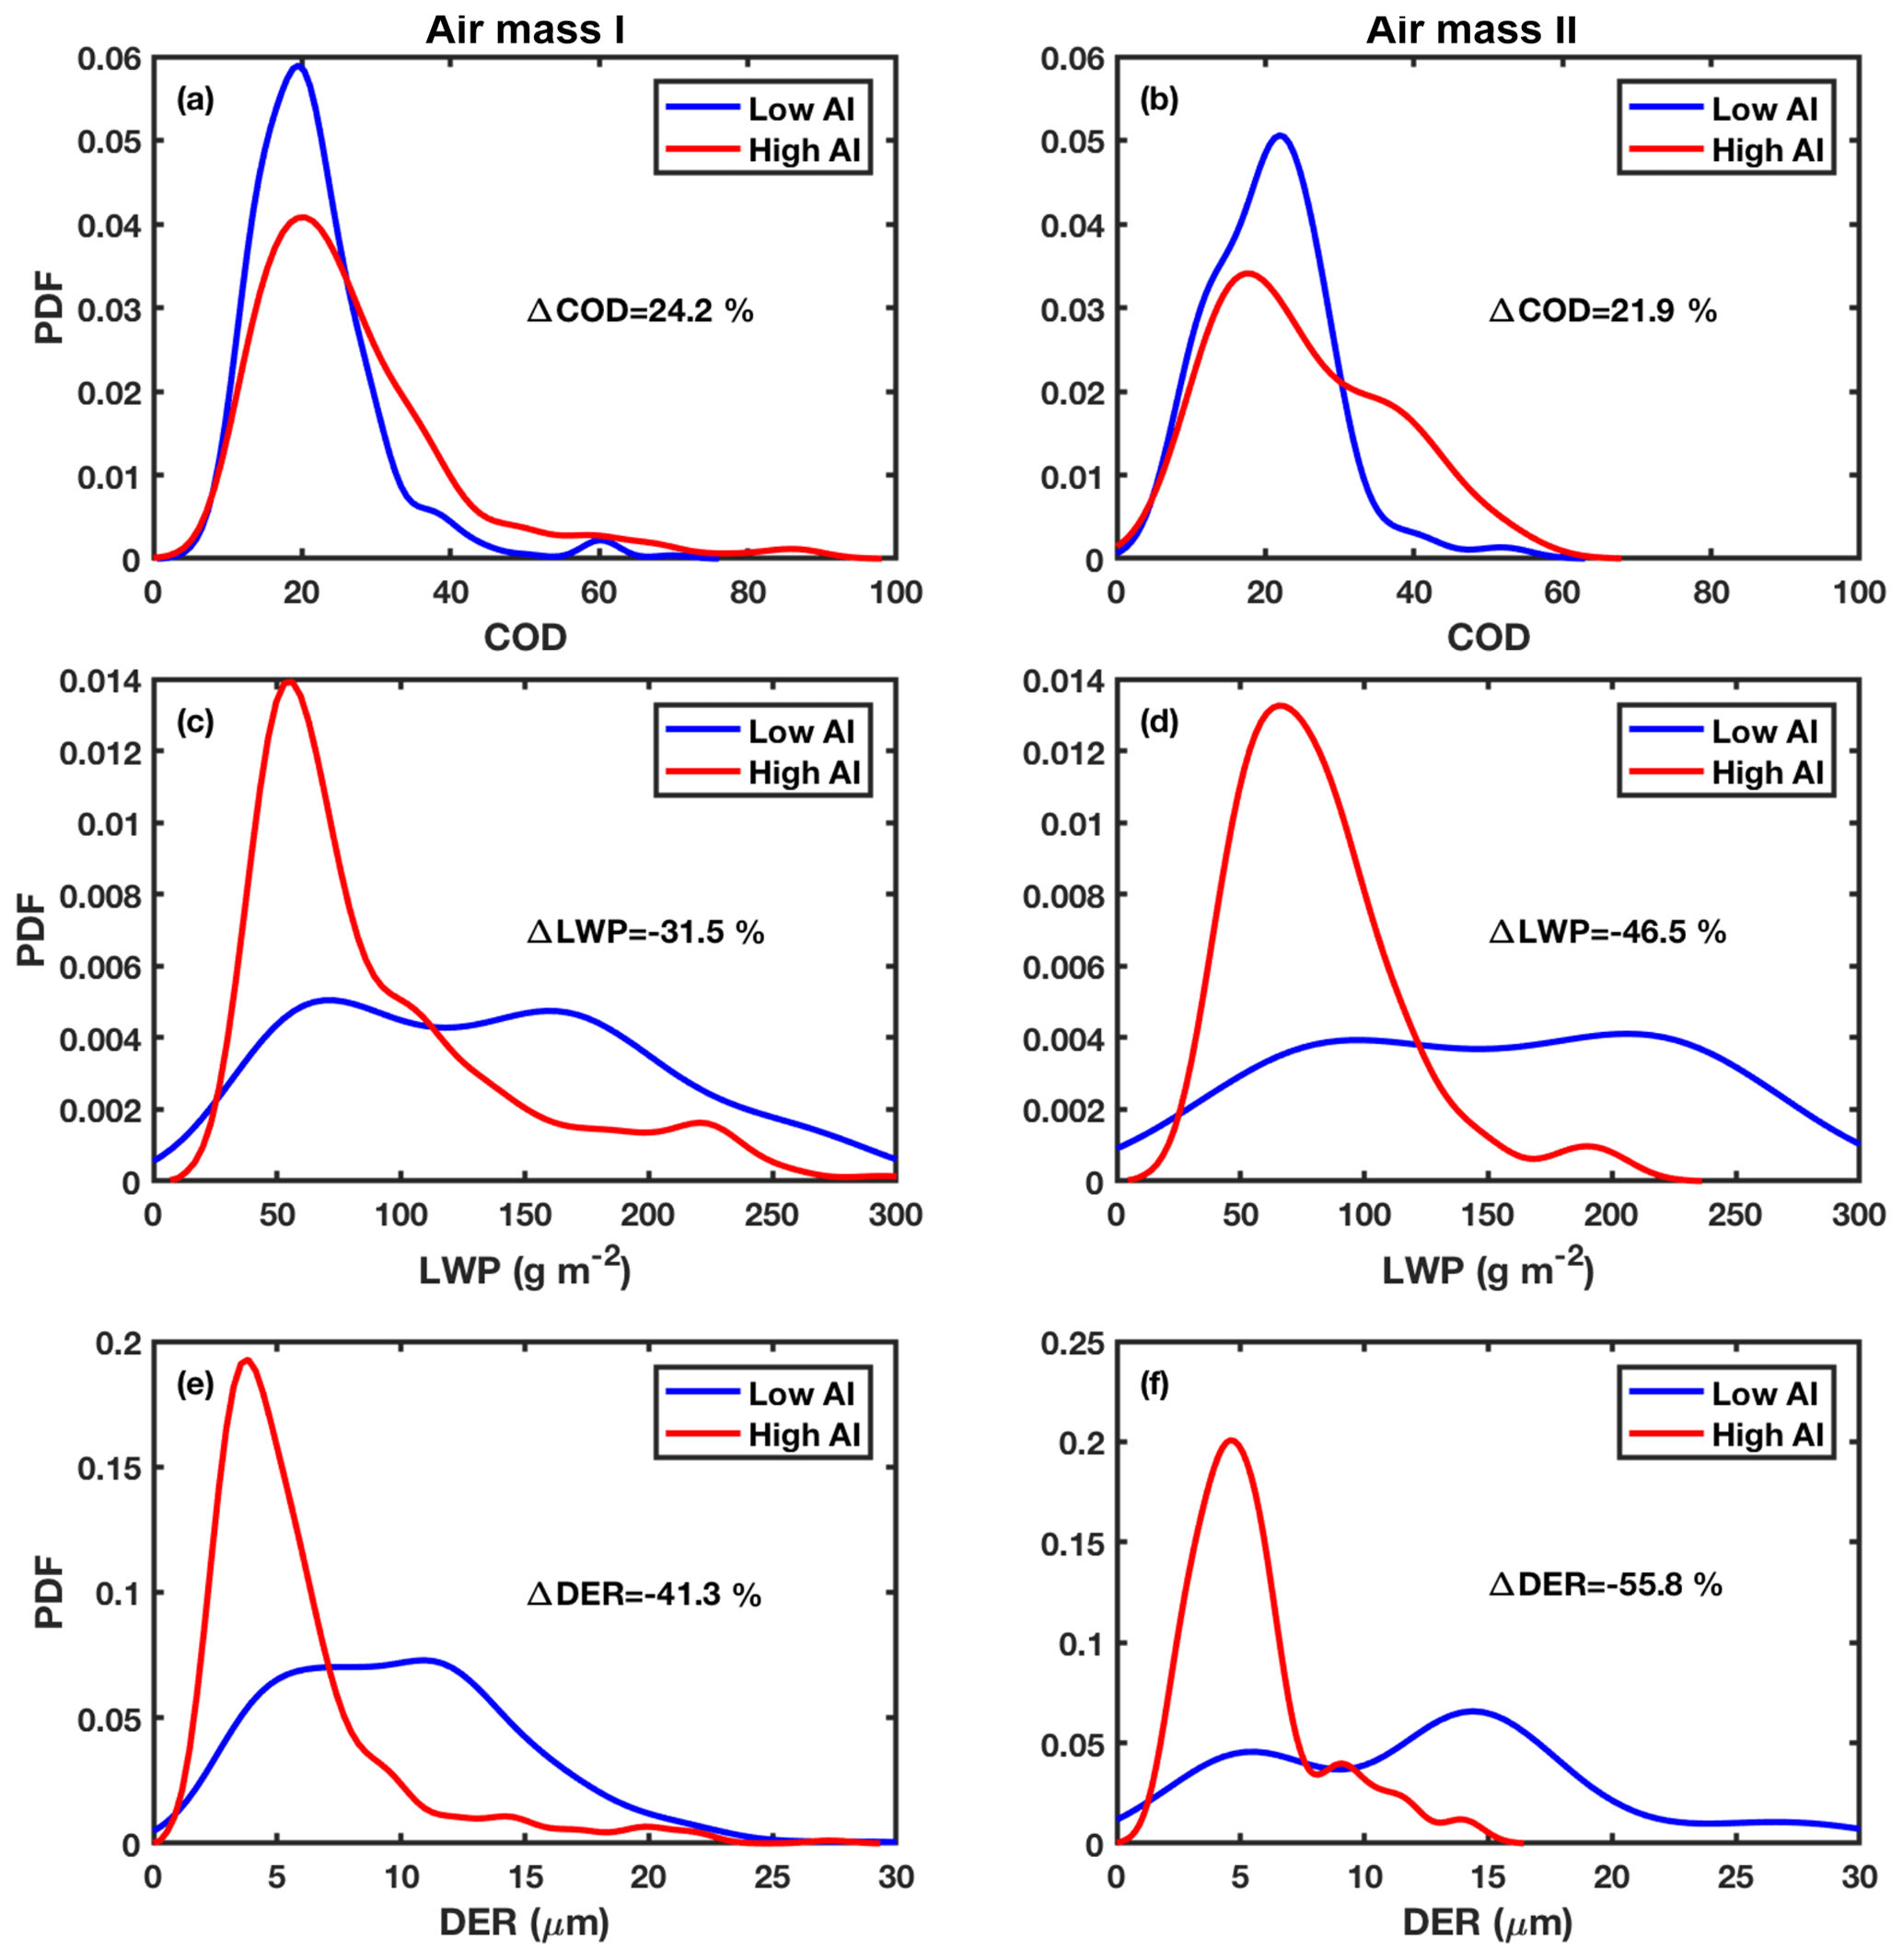
Figure 9From top to bottom, probability distribution functions (PDFs) of cloud optical depth (COD), liquid water path (LWP), and cloud droplet effective radius (DER) at low (L, in blue) and high (H, in red) scattering aerosol index (AI) levels for the cluster I air mass (a, c, e) and the cluster II air mass (b, d, f). The mean percentage difference in COD, LWP, and DER between high and low scattering AI levels (calculated as [(H–L/L)]*100 %) is given in each panel.
3.3.2 Aerosol first indirect effect
The aerosol FIE is generally quantified as
where α represents CCN or CCN proxies. The FIE represents the relative change in mean cloud DER with respect to a relative change in aerosol loading for clouds having the same LWP (Feingold et al., 2003). In some studies, the scattering AI is used as the CCN proxy (Liu and Li, 2014). Cloud samples were categorized according to their LWP values. The LWP bins range from 40 to 200 g m−2 in increments of 20 g m−2. The choice of a small increment ensures that the LWP constraint is met in each bin. Since there were not enough samples under cluster II air-mass conditions, only FIE for clouds and aerosols under cluster I air-mass conditions are calculated. Only those cases with sample numbers greater than 50 per bin where the calculated values of FIE are statistically significant at the 95 % confidence level (P=0.05) are analyzed here. Figure 10a shows DER as function of scattering AI for clouds with LWP ranging from 120 to 140 g m−2. It illustrates how the FIE is estimated. There is a significant decrease in DER as the scattering AI increases. For this case, the magnitude of the FIE is 0.26 with an uncertainty of 0.09. Figure 10b shows the magnitudes and uncertainties of FIE calculated in each LWP bin. Numbers above each bar are the number of samples that went into the calculation of the FIE in each LWP bin. The magnitude of the FIE changes from 0.07±0.03 to 0.26±0.09 with the smallest value found in the LWP bin of 40–60 g m−2 and the largest value found in the LWP bin of 120–140 g m−2. The mean value of FIE during the study period based on all LWP bins is 0.16±0.06. The values of FIE in each LWP bin increase with increasing LWP, especially for LWPs less than 140 g m−2. This is consistent with results from previous studies (e.g., Pandithurai et al., 2009; Sporre et al., 2014; Harikishan et al., 2016). Enhanced aerosol activation due to the increase in LWP may explain this (Zhao et al., 2012b; Painemal and Zuidema, 2013). At higher LWP values, with the availability of more CCN, more droplets can activate. The droplet number increases, but their size decreases at fixed LWP levels (Harikishan et al., 2016). Estimates of the FIE reported from all available platforms range widely and are sensitive to the definition of the aerosol burden (Lihavainen et al., 2010; Zhao et al., 2012b), the methods for retrieving cloud properties (McComiskey et al., 2009), and meteorological conditions such as vertical velocity and atmospheric stability (Feingold et al., 2003; Matsui et al., 2004; McComiskey et al., 2009; Liu et al., 2016; Yang et al., 2019). Theoretical values of the FIE lie between 0 and 0.33 (McComiskey and Feingold, 2008) with most values falling between 0.05 and 0.25 (Zhao et al., 2012b). Based on surface retrievals, Feingold et al. (2003) derived FIE values of 0.02–0.16 with a mean value of 0.10±0.05 for a set of seven cases. In a study using 3 years of data from the United States Southern Great Plains, Kim et al. (2008) found that FIE values ranged from 0.04 to 0.17 over five LWP bins with a mean value of 0.09±0.05. Other estimates of FIE based on surface retrievals have been reported, e.g., 0.07±0.01 for warm, marine boundary-layer clouds over the Azores (Liu et al., 2016); 0.14±0.09 for continental clouds during the monsoon period over a rural continental site in Mahabubnagar, India (Harikishan et al., 2016); and a range of 0.05 to 0.16 over the coastal region at Pt. Reyes, California (McComiskey et al., 2009). The magnitude of the FIE in this study generally falls in this range.

Figure 10(a) Cloud droplet effective radius (DER) as a function of scattering aerosol index (AI) for a sample bin with a constant liquid water path (LWP) range of 120 to 140 g m−2, and (b) the quantified aerosol first indirect effect (FIE) for each LWP bin. Numbers above each bar in (b) are the number of samples that went into the calculation of the FIE.
Examined next is the sensitivity of cloud properties to aerosol chemical composition represented by the mass fraction of organics. The aerosol number concentration is used as the CCN proxy here (Li et al., 2011; Yan et al., 2014; Liu et al., 2016) because aerosol scattering coefficient measurements were not taken during the aerosol chemical composition observation period. Three LWP bins were defined: 40–60, 60–80, and 80–100 g m−2. Figure 11 shows DER as a function of Na in each LWP bin when aerosol particle mass fractions of organics are low and high. Aerosols with low and high mass fractions of organics are defined as aerosols with mass fractions of organics less than and greater than, respectively, the mean value of the mass fraction of organics of all samples in each LWP bin. Mean values of ω and LTS in each aerosol particle mass fraction of organics category are given in the figure. Differences in ω and LTS between low and high mass fractions of organics are not significant in any LWP bin. FIE estimates when aerosol samples with low mass fractions of organics dominate are 0.10±0.05, 0.15±0.06, and 0.23±0.12 (Fig. 11a–c, respectively), which are greater than the FIE estimates when aerosol samples with high mass fractions of organics dominate (0.07±0.04, 0.12±0.06, and 0.07±0.05, respectively). Clouds are more susceptible to inorganics-dominant aerosol than to organic aerosols, resulting in a greater climate forcing. The mechanism behind the aerosol indirect effect is characterized by the ability of aerosol particles to act as CCN, which is primarily governed by particle size and chemical composition (McFiggans et al., 2006). The cloud-nucleating ability of aerosol particles is significantly greater when the aerosol particles are larger and composed of more inorganic compounds than when they are small and composed of more organic compounds (Dusek et al., 2006; Liu et al., 2011). This study (see Fig. 5) and others have demonstrated that aerosols containing more organic particles are generally smaller than those with more inorganic particles (Broekhuizen et al., 2006; McFiggans et al., 2006; Zhang et al., 2011) and that organic particles are generally less CCN-active than inorganic particles (Raymond and Pandis, 2002; Zhang et al., 2011). This can partly explain the smaller FIE values induced by aerosols with large mass fractions of organics.
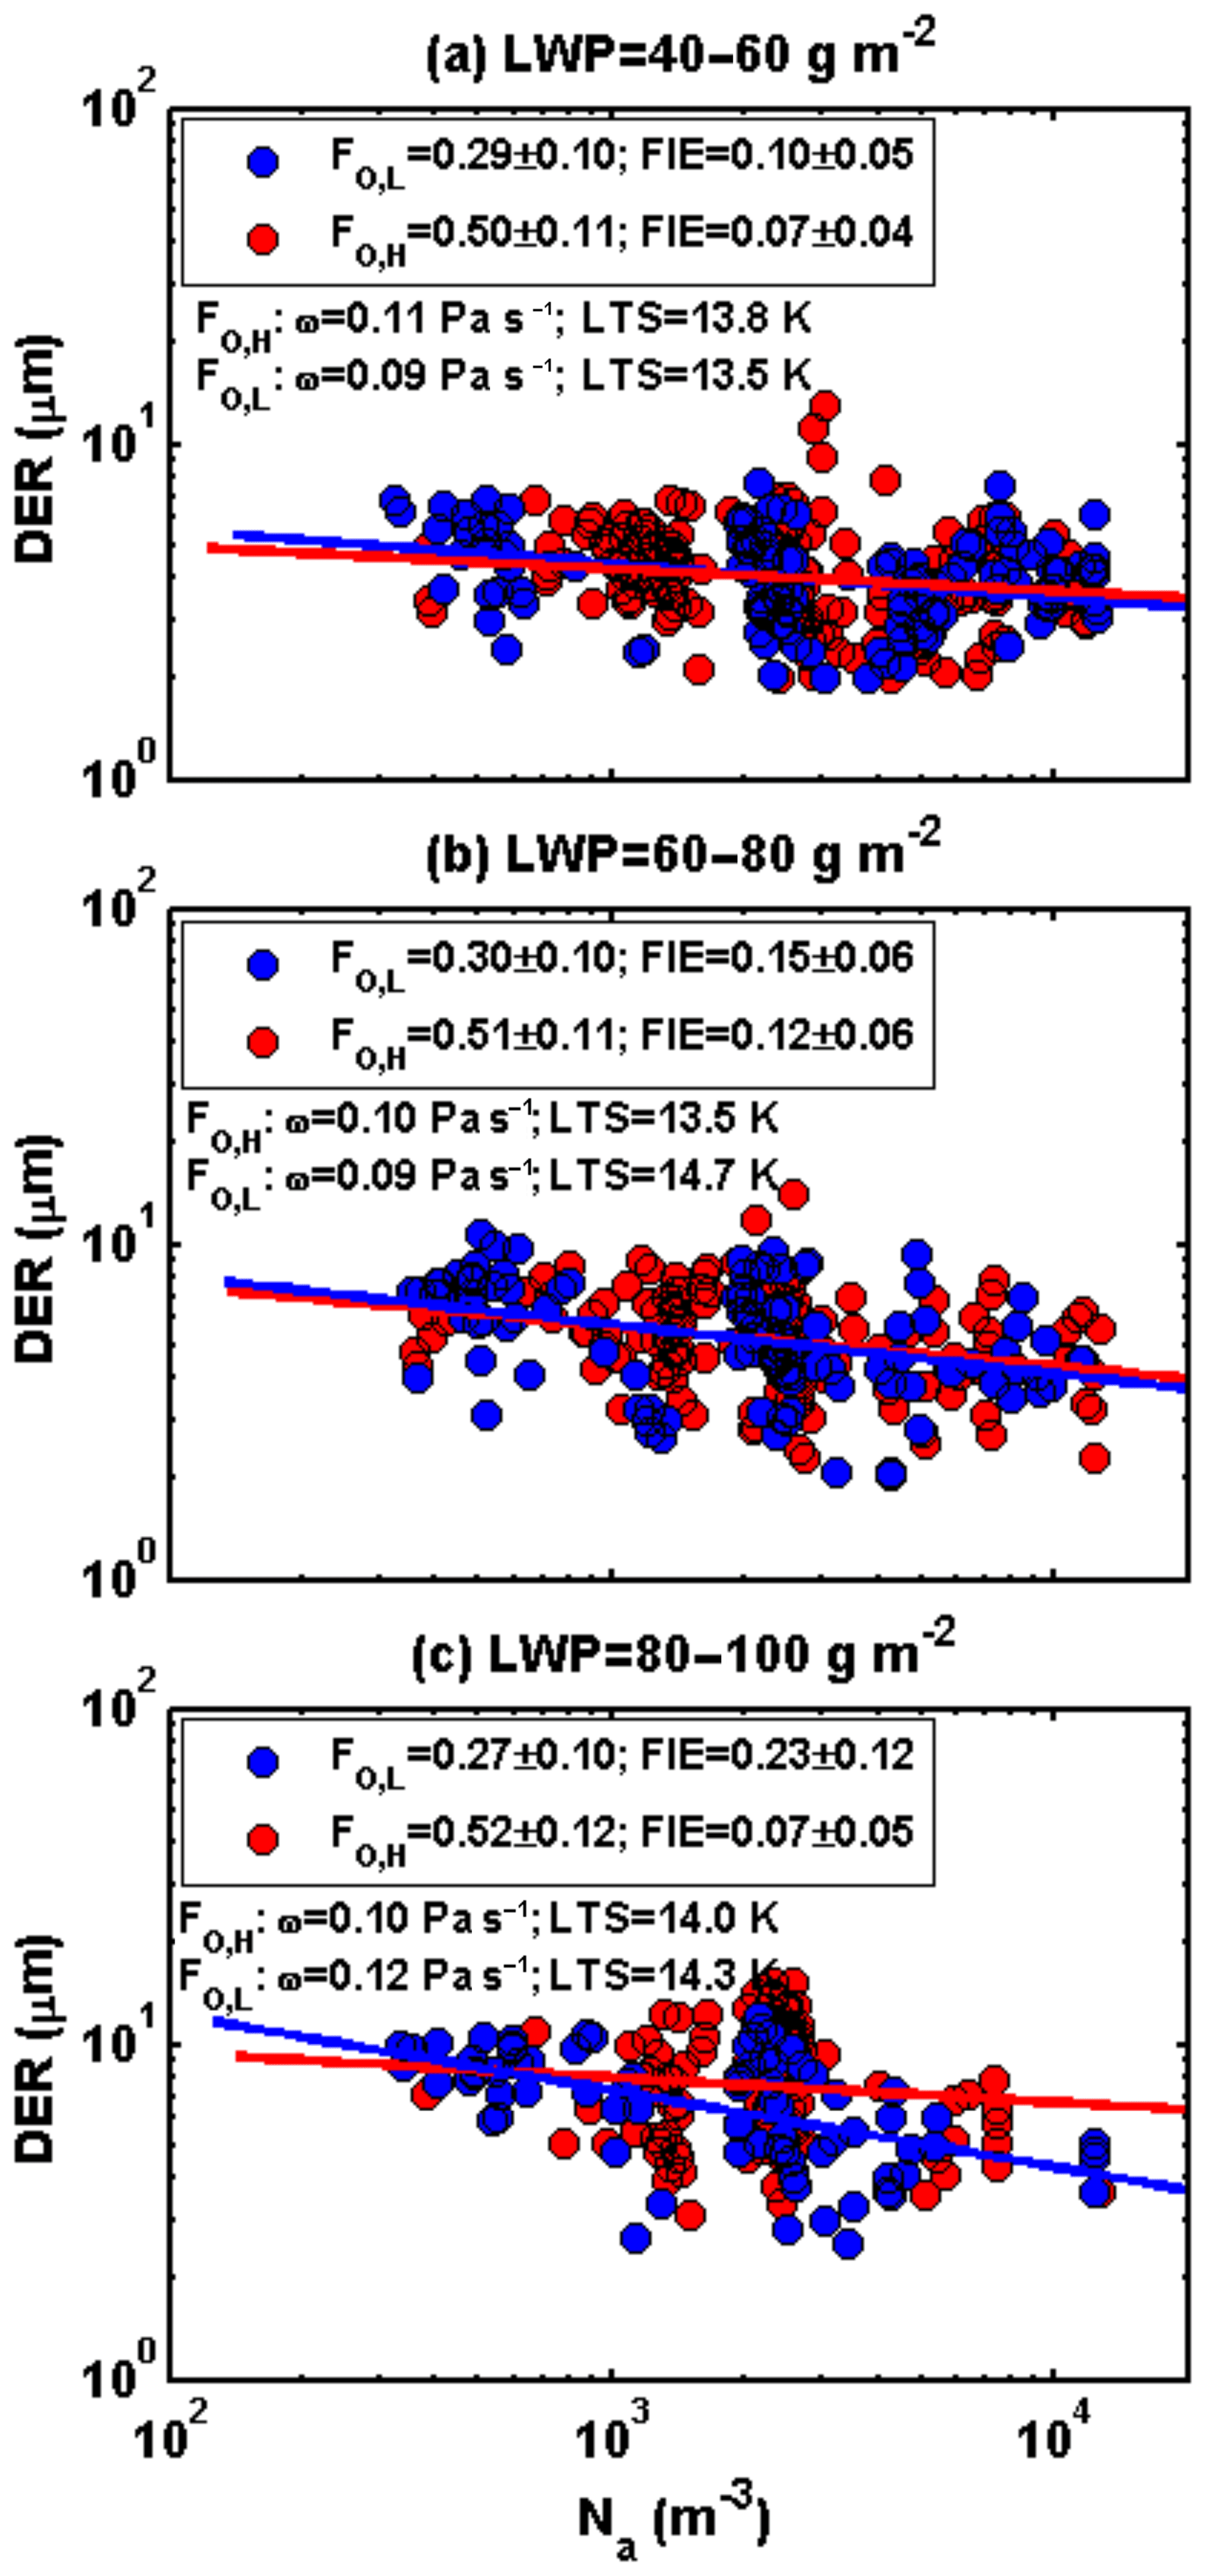
Figure 11Cloud droplet effective radius (DER) as a function of aerosol number concentration (Na) at low (in blue) and high (in red) levels of mass fraction of organics in three liquid water path (LWP) bins: (a) 40–60 g m−2, (b) 60–80 g m−2, and (c) 80–100 g m−2. Linear regression lines through each set of data are drawn. Fo,l and Fo,h are defined as the means of values less than and greater than, respectively, the mean value of the mass fraction of organics from all samples in each LWP bin. The legend gives the mean values of Fo,l and Fo,h with their standard deviations and the magnitudes of the FIE with their uncertainties. Mean values of vertical velocity (ω) and lower tropospheric stability (LTS) corresponding to Fo,l and Fo,h levels in each LWP bin are also given.
Twelve months (July 2012–June 2013) of measurements of aerosol and cloud properties, as well as meteorological variables, were acquired during the Two-Column Aerosol Project field campaign at Cape Cod, Massachusetts. The goal of this study is to characterize aerosol physical, optical, and chemical composition properties and to determine their influences on cloud properties and the dependence of cloud development on large-scale thermodynamic conditions. Also examined was the magnitude of the aerosol FIE and the sensitivities of cloud properties to aerosol composition in addition to aerosol loading.
The maximum and minimum in σ1 and σ10 were found in summer and winter, respectively. Fine particles dominated aerosol scattering in the summer and contributed toward ∼75 % of the total particle scattering. In other seasons, fine particles contributed toward ∼45 %–54 % of the total particle scattering. The maximum and minimum mean values of Na occurred in spring and autumn, which is not consistent with the variation in σs. The variation in AOD is consistent with the variation in surface-measured σs and inconsistent with the variation in Na. This suggests that a large number of particles with less optical sensitivity were present. Months with strong mean surface wind speeds were generally associated with small σs and a small contribution of fine particles to the total scattering extinction but relatively large aerosol number concentrations. This suggests that strong surface winds had ushered in from the inland continental region more optically insensitive aerosols of small particle size. For all new-particle-formation and growth cases considered in this study, a large contribution of organics to small particles was observed, which then decreased during the particle growth period.
Under low-scattering-AI conditions, LWP and DER significantly increased as LTS increased, but, under high-scattering-AI conditions, LWP and DER changed little. Differences in LWP and DER between low- and high-LTS conditions were larger under light pollution than under heavy pollution. This suggests that the dependence of cloud properties is weakened by the aerosol perturbation. The reduction in LWP and DER was greater in stable environments than in unstable environments, indicating that clouds in stable environments are more influenced by aerosol perturbations than those in more unstable regimes. DER significantly increased with increasing LWP under low-aerosol conditions but slowly increased as LWP increased under high-aerosol conditions. Under high-scattering-AI conditions, COD sharply increased with increasing LWP, but, under low-scattering-AI conditions, the increase was slower. This suggests that aerosols can influence the interdependence of cloud properties.
Analyses of the PDFs of COD, LWP, and DER under low- and high-aerosol-loading conditions in continental air mass (clusters I) and oceanic air mass (clusters II) suggest that high aerosol loading can increase COD and decrease LWP and DER and narrow the distributions of LWP and DER. The magnitude of FIE estimated under continental air-mass conditions ranged from 0.07±0.03 to 0.26±0.09 with a mean value of 0.16±0.03 and showed an increasing trend as LWP increased. The magnitude of the FIE estimated for aerosols with a low fraction of organics was larger than that for aerosols with a high mass of organics. This suggests that clouds over regions dominated by inorganic aerosols are more susceptible to aerosol perturbations, resulting in larger climate forcing, than clouds over regions dominated by organic aerosols.
Data used in this study can be accessed from the public FTP of the Atmospheric Radiation Measurement (ARM) at https://www.archive.arm.gov/discovery/ (last access: 20 December 2018).
JL performed the calculations, analyzed the data, and wrote the paper. ZL contributed to the writing of paper and in scientific discussions of the study.
The authors declare that they have no conflict of interest.
The ground-based measurements were obtained from the Atmospheric Radiation Measurement (ARM) program sponsored by the U.S. Department of Energy Office of Energy Research, Office of Health and Environmental Research, Environmental Sciences Division. The reanalysis data were obtained from the European Centre for Medium-Range Weather Forecasts (ECMWF) model runs for ARM provided by the ECMWF.
The study is funded by the DOE/ASR program (DE-SC0018996) and the NSF (AGS1837811).
This paper was edited by Jianping Huang and reviewed by two anonymous referees.
Albrecht, B.: Aerosols, cloud microphysics, and fractional cloudiness, Science, 245, 1227–1230, https://doi.org/10.1126/science.245.4923.1227, 1989.
Anderson, T. L. and Ogren, J. A.: Determining aerosol radiative properties using the TSI 3563 integrating nephelometer, Aerosol Sci. Technol., 29, 57–69, https://doi.org/10.1080/02786829808965551, 1998.
Anderson, T. L., Covert, D. S., Wheeler, J. D., Harris, J. M., Perry, K. D., Trost, B. E., Jaffe, D. J., and Ogren, J. A.: Aerosol backscatter fraction and single scattering albedo: measured values and uncertainties at a coastal station in the Pacific Northwest, J. Geophys. Res.-Atmos., 104, 26793–26807, https://doi.org/10.1029/1999JD900172, 1999.
Anttila, T., Vaattovaara, P., Komppula, M., Hyvärinen, A. P., Lihavainen, H., Kerminen, V. M., and Laaksonen, A.: Size dependent activation of aerosols into cloud droplets at a subarctic background site during the second Pallas Cloud Experiment (2ndPaCE): method development and data evaluation, Atmos. Chem. Phys., 9, 4841–4854, https://doi.org/10.5194/acp-9-4841-2009, 2009.
Berg, L. K., Fast, J. D., Barnard, J. C., Burton, S. P., Cairns, B., Chand, D., Comstock, J. M., Dunagan, S., Ferrare, R. A., Flynn, C. J., Hair, J. W., Hostetler, C., Hubbe, J., Jefferson, A., Johnson, R., Kassianov, E. I., Kluzek, C. D., Kollias, P., Lamer, K., Lantz, K., Mei, F., Miller, M. A., Michalsky, J., Ortega, I., Pekour, M., Rogers, R. R., Russell, P., Redemann, J., Sedlacek, A., Rozenhaimer, M. S., Schmid, B., Shilling, J. E., Shinozuka, Y., Springston, S. R., Tomlinson, J. M., Tyrrell, M., Wilson, J. M., Volkamer, R., Zelenyuk, A., and Berkowitz, C. M.: The Two-Column Aerosol Project: Phase I-Overview and impact of elevated aerosol layers on aerosol optical depth, J. Geophys. Res.-Atmos., 121, 336–361, https://doi.org/10.1002/2015JD023848, 2016.
Boney, S. and Dufresne, J. L.: Marine boundary layer clouds at the heart of tropical cloud feedback uncertainties in climate models, Geophys. Res. Lett., 32, L20806, https://doi.org/10.1029/2005GL023851, 2006.
Bréon, F.-M., Tanré, D., and Generoso, S.: Aerosol effect on cloud droplet size monitored from satellite, Science, 295, 834–838, https://doi.org/10.1126/science.1066434, 2002.
Broekhuizen, K., Chang, R. Y. W., Leaitch, W. R., Li, S. M., and Abbatt, J. P. D.: Closure between measured and modeled cloud condensation nuclei (CCN) using size-resolved aerosol compositions in downtown Toronto, Atmos. Chem. Phys., 6, 2513–2524, https://doi.org/10.5194/acp-6-2513-2006, 2006.
Cecchini, M. A., Machado, L. A. T., Comstock, J. M., Mei, F., Wang, J., Fan, J., Tomlinson, J. M., Schmid, B., Albrecht, R., Martin, S. T., and Artaxo, P.: Impacts of the Manaus pollution plume on the microphysical properties of Amazonian warm-phase clouds in the wet season, Atmos. Chem. Phys., 16, 7029–7041, https://doi.org/10.5194/acp-16-7029-2016, 2016.
Chen, R., Li, Z., Kuligowski, R. J., Ferraro, R., and Weng, F.: A study of warm rain detection using A-Train satellite data, Geophys. Res. Lett., 38, L04804, https://doi.org/10.1029/2010GL046217, 2011.
Chiu, J. C., Huang, C. H., Marshak, A., Slutsker, I., Giles, D. M., Holben, B. N., Knyazikhin, Y., and Wiscombe, W. J.: Cloud optical depth retrievals from the Aerosol Robotic Network (AERONET) cloud mode observations, J. Geophys. Res.-Atmos., 115, D14202, https://doi.org/10.1029/2009JD013121, 2010.
Clothiaux, E. E., Ackerman, T. P., Mace, G. G., Moran, K. P., Marchand, R. T., Miller, M. A., and Martner, B. E.: Objective determination of cloud heights and radar reflectivities using a combination of active remote sensors at the ARM CART sites, J. Appl. Meteor., 39, 645–665, https://doi.org/10.1175/1520-0450(2000)039<0645:ODOCHA>2.0.CO;2, 2000.
Crilley, L. R., Jayaratne, E. R., Ayoko, G. A., Miljevic, B., Ristovski, Z., and Morawska, L.: Observations on the formation, growth and chemical composition of aerosols in an urban environment, Environ. Sci. Technol., 48, 6588–6596, https://doi.org/10.1021/es5019509, 2014.
Dong, X., Minnis, P., Xi, B., Sun-Mack, S., and Chen, Y.: Comparison of CERES-MODIS stratus cloud properties with ground-based measurements at the DOE ARM Southern Great Plains site, J. Geophys. Res.-Atmos., 113, D03204, https://doi.org/10.1029/2007JD008438, 2008.
Dusek, U., Frank, G. P., Hildebrandt, L., Curtius, J., Schneider, J., Walter, S., Chand, D., Drewnick, F., Hings, S., Jung, D., Borrmann, S., and Andreae, M. O.: Size matters more than chemistry for cloud-nucleating ability of aerosol particles, Science, 312, 1375–1378, https://doi.org/10.1126/science.1125261, 2006.
Eck, T. F., Holben, B. N., Reid, J. S., Dubovik, O., Smirnov, A., O'Neill, N. T., Slutsker, I., and Kinne, S.: Wavelength dependence of the optical depth of biomass burning, urban, and desert dust aerosols, J. Geophys. Res.-Atmos., 104, 31333–31349, https://doi.org/10.1029/1999JD900923, 1999.
Feingold, G., Eberhard, W. L., Veron, D. E., and Previdi, M.: First measurements of the Twomey indirect effect using ground-based remote sensors, Geophys. Res. Lett., 30, 1827, https://doi.org/10.1029/2002GL016633, 2003.
Feingold, G., Furrer, R., Pilewskie, P., Remer, L. A., Min, Q., and Jonsson, H.: Aerosol indirect effect studies at Southern Great Plains during the May 2003 Intensive Operations Period, J. Geophys. Res.-Atmos., 111, D05S14, https://doi.org/10.1029/2004JD005648, 2006.
Garrett, T. J. and Zhao, C.: Increased Arctic cloud longwave emissivity associated with pollution from mid-latitudes, Nature, 440, 787–789, https://doi.org/10.1038/nature04636, 2006.
Garrett, T. J. and Zhao, C.: Ground-based remote sensing of thin clouds in the Arctic, Atmos. Meas. Tech., 6, 1227–1243, https://doi.org/10.5194/amt-6-1227-2013, 2013.
Garrett, T. J., Zhao, C., Dong, X., Mace, G. G., and Hobbs, P. V.: Effects of varying aerosol regimes on low-level Arctic stratus, Geophys. Res. Lett., 31, L17105, https://doi.org/10.1029/2004GL019928, 2004.
Han, Q., Rossow, W. B., Zeng, J., and Welch, R.: Three different behaviors of liquid water path of water clouds in aerosol-cloud interactions, J. Atmos. Sci., 59, 726–735, https://doi.org/10.1175/1520-0469(2002)059<0726:TDBOLW>2.0.CO;2, 2002.
Hao, L., Romakkaniemi, S., Kortelaninen, A., Jaatinen, A., Portin, H., Miettinen, P., Komppula, M., Leskinen, A., Virtanen, A., Smith, J. N., Sueper, D., Worsnop, D. R., Lehtinen, K. E. J., and Laaksonen, A.: Aerosol chemical composition in cloud events by high resolution time-of-flight aerosol mass spectrometry, Environ. Sci. Technol., 47, 2645–2653, https://doi.org/10.1021/es302889w, 2013.
Harikishan, G., Padmakumari, B., Maheskumar, R. S., Pandithurai, G., and Min, Q. L.: Aerosol indirect effects from ground-based retrievals over the rain shadow region in Indian subcontinent, J. Geophys. Res.-Atmos., 121, 2369–2382, https://doi.org/10.1002/2015JD024577, 2016.
Hill, A., Feingold, G., and Jiang, H.: The influence of entrainment and mixing assumption on aerosol–cloud interactions in marine stratocumulus, J. Atmos. Sci., 66, 1450–1464, https://doi.org/10.1175/2008JAS2909.1, 2009.
Holben, B. N., Kaufman, Y. J., and Eck, T. F.: AERONET: a federated instrument network and data archive for aerosol characterization, Remote Sens. Environ., 66, 1–16, https://doi.org/10.1016/S0034-4257(98)00031-5, 1998.
IPCC, Climate Change 2013: The Physical Science Basis, Contribution of Working Group I to the Fifth Assessment Report of the Intergovernmental Panel on Climate Change, edited by: Stocker, T. F., Qin, D., Plattner, G.-K., Tignor, M., Allen, S. K., Boschung, J., Nauels, A., Xia, Y., Bex, V., and Midgley, P. M., Cambridge University Press, Cambridge, United Kingdom and New York, NY, USA, 1535 pp., https://doi.org/10.1017/CBO9781107415324, 2013.
Jefferson, A.: Aerosol observing system (AOS) handbook, ARMTR-014, U.S. Dep. of Energy, Washington, D. C., 2011.
Johnson, B. T., Shine, K. P., and Forster, P. M.: The semi-direct aerosol effect: Impact of absorbing aerosols on marine stratocumulus, Q. J. Roy. Meteorol. Soc., 130, 1407–1422, https://doi.org/10.1256/qj.03.61, 2004.
Kaufman, Y. J., Koren, I., Remer, L. A., Rosenfeld, D., and Rudich, Y.: The effect of smoke, dust, and pollution aerosol on shallow cloud development over the Atlantic Ocean, P. Natl. Acad. Sci. USA, 102, 11207–11212, https://doi.org/10.1073/pnas.0505191102, 2005.
Kim, B.-G., Schwartz, S. E., Miller, M. A., and Min, Q.: Effective radius of cloud droplets by ground-based remote sensing: relationship to aerosol, J. Geophys. Res.-Atmos., 108, 4740, https://doi.org/10.1029/2003JD003721, 2003.
Kim, B.-G., Miller, M. A., Schwartz, S. E., Liu, Y., and Min, Q.: The role of adiabaticity in the aerosol first indirect effect, J. Geophys. Res.-Atmos., 113, D05210, https://doi.org/10.1029/2007JD008961, 2008.
Kollias, P., Clothiaux, E. E., Miller, M. A., Luke, E. P., Johnson, K. L., Moran, K. P., Widener, K. B., and Albrecht, B. A.: The Atmospheric Radiation Measurement Program cloud profiling radars: second-generation sampling strategies, processing, and cloud data products, J. Atmos. Ocean. Technol., 24, 1199–1214, https://doi.org/10.1175/JTECH2033.1, 2007.
Komppula, M., Lihavainen, H., Kerminen, V.-M., Kulmala, M., and Viisanen, Y.: Measurements of cloud droplet activation of aerosol particles at a clean subarctic background site, J. Geophys. Res.-Atmos., 110, D06204, https://doi.org/10.1029/2004JD005200, 2005.
Koren, I., Kaufman, Y. J., Remer, L. A., and Martins, J. V.: Measurement of the effect of Amazon smoke on inhibition of cloud formation, Science, 303, 1342–1345, https://doi.org/10.1126/science.1089424, 2004.
Lebsock, M. D., Stephens, G. L., and Kummerow, C.: Multisensor satellite observations of aerosol effects on warm clouds, J. Geophys. Res.-Atmos., 113, D15205, https://doi.org/10.1029/2008JD009876, 2008.
Li, Z., Niu, F., Fan, J., Liu, Y., Rosenfeld, D., and Ding, Y.: Long-term impacts of aerosols on the vertical development of clouds and precipitation, Nature Geosci., 4, 888–894, https://doi.org/10.1038/ngeo1313, 2011.
Li, Z., Lau, W. K. M., Ramanathan, V., Wu, G., Ding, Y., Manoj, M. G., Liu, J., Qian, Y., Li, J., Zhou, T., Fan, J., Rosenfeld, D., Ming, Y., Wang, Y., Huang, J., Wang, B., Xu, X., Lee, S. S., Cribb, M., Zhang, F., Yang, X., Zhao, C., Takemura, T., Wang, K., Xia, X., Yin, Y., Zhang, H., Guo, J., Zhai, P. M., Sugimoto, N., Babu, S. S., and Brasseur, G. P.: Aerosol and monsoon interactions in Asia, Rev. Geophys., 54, 866–929, https://doi.org/10.1002/2015RG000500, 2016.
Li, Z., Rosenfeld, D., and Fan, F.: Aerosols and their impact on radiation, clouds, precipitation, and severe weather events, Oxford Research Encyclopedias, https://doi.org/10.1093/acrefore/9780199389414.013.126, 2017.
Lihavainen, H., Kerminen, V. M., and Remer, L. A.: Aerosol-cloud interaction determined by both in situ and satellite data over a northern high-latitude site, Atmos. Chem. Phys., 10, 10987–10995, https://doi.org/10.5194/acp-10-10987-2010, 2010.
Liljegren, J. C. and Lesht, B. M.: Preliminary results with the twelve-channel microwave radiometer profiler at the North Slope of Alaska Climate Research Facility, Fourteenth ARM Science Team Meeting Proceedings, Albuquerque, New Mexico, 2004.
Liu, J. and Li, Z.: Estimation of cloud condensation nuclei concentration from aerosol optical quantities: influential factors and uncertainties, Atmos. Chem. Phys., 14, 471–483, https://doi.org/10.5194/acp-14-471-2014, 2014.
Liu, J. and Li, Z.: First surface-based estimation of the aerosol indirect effect over a site in southeastern China, Adv. Atmos. Sci., 35, 169–181, https://doi.org/10.1007/s00376-017-7106-2, 2018a.
Liu, J. and Li, Z.: Significant underestimation in the optically-based estimation of the aerosol first indirect effect induced by the aerosol swelling effect, Geophys. Res. Lett., 45, 5690–5699, https://doi.org/10.1029/2018GL077679, 2018b.
Liu, J., Zheng, Y., Li, Z., and Cribb, M.: Analysis of cloud condensation nuclei properties at a polluted site in southeastern China during the AMF-China Campaign, J. Geophys. Res.-Atmos., 116, D00K35, https://doi.org/10.1029/2011jd016395, 2011.
Liu, J., Zheng, Y., Li, Z., Flynn, C., and Cribb, M.: Seasonal variations of aerosol optical properties, vertical distribution and associated radiative effects in the Yangtze Delta region of China, J. Geophys. Res., 117, D00K38, https://doi.org/10.1029/2011JD016490, 2012.
Liu, J., Li, Z., Zheng, Y., Chiu, J. C., Zhao, F., Cadeddu, M., Weng, F., and Cribb, M.: Cloud optical and microphysical properties derived from ground-based and satellite sensors over a site in the Yangtze Delta region, J. Geophys. Res.-Atmos., 118, 9141–9152, https://doi.org/10.1002/jgrd.50648, 2013.
Liu, J., Li, Z., and Cribb, M.: Response of marine boundary layer cloud properties to aerosol perturbations associated with meteorological conditions from the 19-month AMF-Azores campaign, J. Atmos. Sci., 73, 4253–4268, https://doi.org/10.1175/JAS-D-15-0364.1, 2016.
Lohmann, U., Rotstayn, L., Storelvmo, T., Jones, A., Menon, S., Quaas, J., Ekman, A. M. L., Koch, D., and Ruedy, R.: Total aerosol effect: radiative forcing or radiative flux perturbation?, Atmos. Chem. Phys., 10, 3235–3246, https://doi.org/10.5194/acp-10-3235-2010, 2010.
Matsui, T., Masunaga, H., Pielke Sr., R. A., and Tao, W.-K.: Impact of aerosols and atmospheric thermodynamics on cloud properties within the climate system, Geophys. Res. Lett., 31, L06109, https://doi.org/10.1029/2003GL019287, 2004.
McComiskey, A. and Feingold, G.: Quantifying error in the radiative forcing of the first aerosol indirect effect, Geophys. Res. Lett., 35, L02810, https://doi.org/10.1029/2007GL032667, 2008.
McComiskey, A., Feingold, G., Frisch, A. S., Turner, D. D., Miller, M. A., Chiu, J. C., Min, Q., and Ogren, J. A.: An assessment of aerosol-cloud interactions in marine stratus clouds based on surface remote sensing, J. Geophys. Res.-Atmos., 114, D09203, https://doi.org/10.1029/2008JD011006, 2009.
McFiggans, G., Artaxo, P., Baltensperger, U., Coe, H., Facchini, M., Feingold, G., Fuzzi, S., Gysel, M., Laaksonen, A., Lohmann, U., Mentel, T., Murphy, D., O'Dowd, C. D., Snider, J. R., and Weingartner, E.: The effect of physical and chemical aerosol properties on warm cloud droplet activation, Atmos. Chem. Phys., 6, 2593–2649, https://doi.org/10.5194/acp-6-2593-2006, 2006.
Medeiros, B. and Stevens, B.: Revealing differences in GCM representations of low clouds, Clim. Dynam., 36, 385–399, https://doi.org/10.1007/s00382-009-0694-5, 2011.
Ng, N. L., Herndon, S. C., Trimborn, A., Canagaratna, M., Croteau, P., Onasch, T. B., Sueper, D., Worsnop, D. R., Zhang, Q., Sun, Y. L., and Jayne, J. T.: An Aerosol Chemical Speciation Monitor (ACSM) for routine monitoring of the composition and mass concentrations of ambient aerosol, Aerosol Sci. Technol., 45, 770–784, https://doi.org/10.1080/02786826.2011.560211, 2011.
Painemal, D. and Zuidema, P.: The first aerosol indirect effect quantified through airborne remote sensing during VOCALS-REx, Atmos. Chem. Phys., 13, 917–931, https://doi.org/10.5194/acp-13-917-2013, 2013.
Pandithurai, G., Takamura, T., Yamaguchi, J., Miyagi, K., Takano, T., Ishizaka, Y., Dipu, S., and Shimizu, A.: Aerosol effect on cloud droplet size as monitored from surface-based remote sensing over East China Sea region, Geophys. Res. Lett., 36, L13805, https://doi.org/10.1029/2009GL038451, 2009.
Portin, H., Leskinen, A., Hao, L., Kortelainen, A., Miettinen, P., Jaatinen, A., Laaksonen, A., Lehtinen, K. E. J., Romakkaniemi, S., and Komppula, M.: The effect of local sources on particle size and chemical composition and their role in aerosol–cloud interactions at Puijo measurement station, Atmos. Chem. Phys., 14, 6021–6034, https://doi.org/10.5194/acp-14-6021-2014, 2014.
Qiu, Y., Zhao, C., Guo, J., and Li, J.: Eight-year ground-based observational analysis about the seasonal variation of the aerosol-cloud droplet effective radius relationship at SGP site, Atmos. Environ., 164, 139–146, https://doi.org/10.1016/j.atmosenv.2017.06.002, 2017.
Raymond, T. M. and Pandis, S. N.: Formation of cloud droplets by multicomponent organic particles, J. Geophys. Res.-Atmos., 108, 4469, https://doi.org/10.1029/2003JD003503, 2002.
Rolph, G. D.: Real-time Environmental Applications and Display sYstem (READY) Website (available at: http://www.ready.noaa.gov, last access: 10 November 2018), NOAA Air Resources Laboratory, College Park, MD, 2016.
Sekiguchi, M., Nakajima, T., Suzuki, K., Kawamoto, K., Higurashi, A., Rosenfeld, D., Sano, I., and Mukai, S.: A study of the direct and indirect effects of aerosols using global satellite data sets of aerosol and cloud parameters, J. Geophys. Res.-Atmos., 108, 4699, https://doi.org/10.1029/2002JD003359, 2003.
Sena, E. T., McComiskey, A., and Feingold, G.: A long-term study of aerosol-cloud interactions and their radiative effect at the Southern Great Plains using ground-based measurements, Atmos. Chem. Phys., 16, 11301–11318, https://doi.org/10.5194/acp-16-11301-2016, 2016.
Sporre, M. K., Glantz, P., Tunved, P., Swietlicki, E., Kulmala, M., and Lihavainen, H.: A study of the indirect aerosol effect on subarctic marine liquid low-level clouds using MODIS cloud data and ground-based aerosol measurements, Atmos. Res., 116, 56–66, https://doi.org/10.1016/j.atmosres.2011.09.014, 2012.
Sporre, M. K., Swietlicki, E., Glantz, P., and Kulmala, M.: Aerosol indirect effects on continental low-level clouds over Sweden and Finland, Atmos. Chem. Phys., 14, 12167–12179, https://doi.org/10.5194/acp-14-12167-2014, 2014.
Stein, A. F., Draxler, R. R, Rolph, G. D., Stunder, B. J. B., Cohen, M. D., and Ngan, F.: NOAA's HYSPLIT atmospheric transport and dispersion modeling system, B. Am. Meteor. Soc., 96, 2059–2077, https://doi.org/10.1175/BAMS-D-14-00110.1, 2015.
Su, W., Loeb, N. G., Xu, K.-M., Schuster, G. L., and Eitzen, Z. A.: An estimate of aerosol indirect effect from satellite measurements with concurrent meteorological analysis, J. Geophys. Res.-Atmos., 115, D18219, https://doi.org/10.1029/2010jd013948, 2010.
Twohy, C. H., Anderson, J. R., Toohey, D. W., Andrejczuk, M., Adams, A., Lytle, M., George, R. C., Wood, R., Saide, P., Spak, S., Zuidema, P., and Leon, P.: Impacts of aerosol particles on the microphysical and radiative properties of stratocumulus clouds over the southeast Pacific Ocean, Atmos. Chem. Phys., 13, 2541–2562, https://doi.org/10.5194/acp-13-2541-2013, 2013.
Twomey, S.: The influence of pollution on the shortwave albedo of clouds, J. Atmos. Sci., 34, 1149–1152, https://doi.org/10.1175/1520-0469(1977)034<1149:TIOPOT>2.0.CO;2, 1977.
Wang, F., Guo, J., Wu, Y., Zheng, X., Deng, M., Li, X., Zhang, J., and Zhao, J.: Satellite observed aerosol-induced variability in warm cloud properties under different meteorological conditions over eastern China, Atmos. Environ., 84, 122–132, https://doi.org/10.1016/j.atmosenv.2013.11.018, 2014.
Wang, J., Flagan, R. C., and Seinfeld, J. H.: A differential mobility analyzer (DMA) system for submicron aerosol measurements at ambient relative humidity, Aerosol Sci. Technol., 37, 46–52, https://doi.org/10.1080/02786820300891, 2003.
Wang, J., Lee, Y.-N., Daum, P. H., Jayneand, J., and Alexander, M. L.: Effects of aerosol organics on cloud condensation nucleus (CCN) concentration and first indirect aerosol effect, Atmos. Chem. Phys., 8, 6325–6339, https://doi.org/10.5194/acp-8-6325-2008, 2008.
Werner, F., Ditas, F., Siebert, H., Simmel, M., Wehner, B., Pilewskie, P., Schmeissner, T., Shaw, R. A., Hartmann, S., Wex, H., Roberts, G. C., and Wendisch, M.: Twomey effect observed from collocated microphysical and remote sensing measurements over shallow cumulus, J. Geophys. Res.-Atmos., 119, 1534–1545, https://doi.org/10.1002/2013JD020131, 2014.
West, R. E. L., Stier, P., Jones, A., Johnson, C. E., Mann, G. W., Bellouin, N., Partridge, D. G., and Kipling, Z.: The importance of vertical velocity variability for estimates of the indirect aerosol effects, Atmos. Chem. Phys., 14, 6369–6393, https://doi.org/10.5194/acp-14-6369-2014, 2014.
Yan, H., Li, Z., Huang, J., Cribb, M., and Liu, J.: Long-term aerosol-mediated changes in cloud radiative forcing of deep clouds at the top and bottom of the atmosphere over the Southern Great Plains, Atmos. Chem. Phys., 14, 7113–7124, https://doi.org/10.5194/acp-14-7113-2014, 2014.
Yang, X., Zhao, C. F., Zhou, L. J., Wang, Y., and Liu, X. H.: Distinct impact of different types of aerosols on surface solar radiation in China, J. Geophys. Res.-Atmos., 121, 6459–6471, https://doi.org/10.1002/2016JD024938, 2016.
Yang, X., Zhao, C., Zhou, L., Li, Z., Cribb, M., and Yang, S.: Wintertime cooling and a potential connection with transported aerosols in Hong Kong during recent decades, Atmos. Res., 211, 52–61, https://doi.org/10.1016/j.atmosres.2018.04.029, 2018.
Yang, Y., Zhao, C., Dong, X., Fan, G., Zhou, Y., Wang, Y., Zhao, L., Lv, F. and Yan, F.: Toward understanding the process-level impacts of aerosols on microphysical properties of shallow cumulus cloud using aircraft observations, Atmos. Res., 221, 27–33, https://doi.org/10.1016/j.atmosres.2019.01.027, 2019.
Zhang, Q., Quan, J., Tie, X., Huang, M., and Ma, X.: Impact of aerosol particles on cloud formation: aircraft measurements in China, Atmos. Environ., 45, 665–672, https://doi.org/10.1016/j.atmosenv.2010.10.025, 2011.
Zhao, C. and Garrett, T.: Effects of Arctic haze on surface cloud radiative forcing, Geophys. Res. Lett., 42, 557–564, https://doi.org/10.1002/2014GL062015, 2015.
Zhao, C. F., Xie, S. C., Klein, S. A., Protat, A., Shupe, M. D., McFarlane, S. A., Comstock, J. M., Delanoë, J., Deng, M., Dunn, M., Hogan, R. J., Huang, D., Jensen, M. P., Mace, G. G., McCoy, R., O'Connor, E. J., Turner, D. D., and Wang, Z. Z.: Toward understanding of differences in current cloud retrievals of ARM ground-based measurements, J. Geophys. Res.-Atmos., 117, D10206, https://doi.org/10.1029/2011JD016792, 2012a.
Zhao, C., Klein, S. A., Xie, S., Liu, X., Boyle, J. S., and Zhang, Y.: Aerosol first indirect effects on non-precipitating low-level liquid cloud properties as simulated by CAM5 at ARM sites, Geophys. Res. Lett., 39, L08806, https://doi.org/10.1029/2012gl051213, 2012b.
Zhao, C., Qiu, Y., Dong, X., Wang, Z., Peng, Y., Li, B., Wu, Z., and Wang, Y.: Negative aerosol-cloud re relationship from aircraft observations over Hebei, China, Earth Space Sci., 5, 19–29, https://doi.org/10.1002/2017EA000346, 2018.
Zhao, C., Zhao, L., and Dong, X.: A case study of stratus cloud properties using in situ aircraft observations over Huanghua, China, Atmosphere, 10, 19, https://doi.org/10.3390/atmos10010019, 2019.