the Creative Commons Attribution 4.0 License.
the Creative Commons Attribution 4.0 License.
 | 22 Jul 2019
Modeling of aerosol property evolution during winter haze episodes over a megacity cluster in northern China: roles of regional transport and heterogeneous reactions of SO2
Huiyun Du
Jie Li
Xueshun Chen
Zifa Wang
Pingqing Fu
Jianjun Li
Jian Gao
Ying Wei
Regional transport and heterogeneous reactions have been shown to play crucial roles in haze formation over a megacity cluster centered on Beijing. In this study, the updated Nested Air Quality Prediction Model System (NAQPMS) and the Hybrid Single-Particle Lagrangian Integrated Trajectory (HYSPLIT) model were employed to investigate the evolution of aerosols – in terms of the number concentration, size distribution, and degree of aging – in Beijing during six haze episodes between 15 November and 15 December 2016, as part of the Air Pollution and Human Health–Beijing (APHH-Beijing) winter campaign of 2016. The model exhibited reasonable performance not only with respect to mass concentrations of PM2.5 and its components in Beijing but also regarding the number concentration, size distribution, and degree of aging. We revealed that regional transport played a non-negligible role in haze episodes, with contributions of 14 %–31 % to the surface PM2.5 mass concentration. The contribution of regional transport to secondary inorganic aerosols was larger than that to primary aerosols (30 %–63 % and 3 %–12 %, respectively). The chemical transformation of SO2 along the transport pathway from source regions to Beijing was the major source of . We also found that sulfate formed outside Beijing from SO2 emitted in Beijing; this sulfate was then blown back to Beijing and considerably influenced haze formation. Along the transport pathway, aerosols underwent aging, which altered the mass ratio of the coating of black carbon to black carbon (RBC) and the size distribution of number concentrations. During the episodes, the geometric mean diameter (GMD) increased from less than 100 nm at the initial site to approximately 120 nm at the final site (Beijing), and the RBC increased from 2–4 to 4–8. During haze episodes with high humidity, the average contributions of gas and aqueous chemistry, heterogeneous chemistry, and primary emission to sulfate were comparable. However, their relative contributions varied with pollution levels. Primary emissions had the greatest impact under light to moderate pollution levels, whereas heterogeneous chemistry had a stronger effect under high pollution levels.
- Article
(10472 KB) - Full-text XML
-
Supplement
(919 KB) - BibTeX
- EndNote


In past decades, a megacity cluster in China that is centered on Beijing and includes 28 cities (272 500 km2, with a population of 191.7 million people) has experienced frequent severe and persistent haze episodes (Zhao et al., 2013; Sun et al., 2014, 2016). PM2.5 levels exceeding 500 µg m−3 have often been reported. The adverse effects of PM2.5 on visibility, climate, and particularly human health have drawn widespread public attention (Hyslop, 2009; Chen et al., 2018; Yang et al., 2017a, b; Anderson et al., 2010). Although the PM2.5 concentration in Beijing decreased by 35 % over a recent 5-year (2013–2017) span, benefiting from the implementation of the Atmospheric Pollution Prevention and Control Action Plan, the PM2.5 level in 2017 still reached 58 µg m−3, which is 1.7 times the safe level of 35 µg m−3 recommended by the World Health Organization (http://www.bjepb.gov.cn/bjhrb/index/index.html, last access: 13 June 2019). Thus, understanding the mechanism behind haze episodes in this megacity cluster is an urgent task for policymakers.
Observations have revealed that haze episodes in this megacity cluster are mainly caused by the rapid formation of secondary inorganic aerosol (SIA) species, including sulfate, nitrate, and ammonium (Huang et al., 2014; Zheng et al., 2015; Han et al., 2016). The SIA mass fraction in PM2.5 can be up to 55 % on severely polluted days, which is 2.5 times that observed on clear days (Ma et al., 2017). G. Tang et al. (2016) proposed that local chemical transformation associated with humidity dominated the rapid formation of SIA in Beijing. Yang et al. (2015) argued that local chemical conversion would not be fully able to explain the observed rapid formation of SIA over a short period of time. Using a ceilometer and in situ observation data, Zhu et al. (2016) and Ma et al. (2017) further proposed that regional transport was the major cause of the initial haze stage and that local chemistry, particularly heterogeneous chemistry, dominated the subsequent later rise in Beijing. This result differs from the findings of modeling studies (Timmermans et al., 2017; Li and Han, 2016; J. Li et al., 2017), in which regional transport was identified as the dominant factor during haze episodes in the megacity cluster. Comprehensive observations of the physicochemical properties (e.g., mixing state, number concentration, and size distribution) of aerosols can provide more insights into the accuracy of regional transport and chemistry assessment. Black carbon (BC) is usually more thickly coated by SIA and organic aerosols in transported and aged air masses than in fresh particles, as indicated by the higher fractal dimension (Y. Y. Wang et al., 2017), the larger coating fraction (ratio of variation in BC mass equivalent diameter to initial BC diameter, ) (Peng et al., 2016), and the higher mass ratio of the coating of BC to BC (RBC) (Wang et al., 2019). Massoli et al. (2015) and Y. Y. Wang et al. (2017) reported that the RBC exceeded 10 in remote sites after BC had undergone long-term transport. This value was much higher than that reported in an urban area with high fresh-particle emissions, where the RBC was generally less than 1.5 (Liu et al., 2017). The geometric mean diameter (GMD) of PM2.5 also changed significantly due to the impact of regional transport. In haze episodes in Beijing, the GMD increased to 120 nm in regionally transported air masses, which was twice that observed under clean conditions (Ma et al., 2017). Thus, investigating the evolution of aerosol properties other than mass concentration during regional transport is useful for assessing the roles of regional and local chemistry. Such investigations are rarely conducted using the current three-dimensional chemical transport models. The current models generally account for only a part of the observed concentrations (Y. Wang et al., 2014). Heterogeneous chemistry is considered critical to improving model performance (Zheng et al., 2015; Cheng et al., 2016; Li et al., 2018), and the treatment of heterogeneous chemistry is likely another source of modeling uncertainty. Studies found that uptake coefficients (γ) were dynamically related to aerosol liquid water and aerosol mixing states (coating thickness) (Riemer et al., 2009; Morgan et al., 2015). Although these parameters are obtained in some observation studies (Bian et al., 2014; Zhang et al., 2016), the parameterization of heterogeneous chemistry has rarely been linked to them in previous studies (Morgan et al., 2015; Zheng et al., 2015; Li et al., 2018).
From 15 November to 15 December 2016, a field campaign was carried out in Beijing within the framework of the UK–China Air Pollution and Human Health (APHH) project. Details regarding this project are given in Shi et al. (2018). Aerosol properties such as the size distribution, number concentration, and mixing states were simultaneously measured in China. APHH-Beijing aimed to explore the sources and processes affecting urban atmospheric pollution in Beijing. In this study, we used the Nested Air Quality Prediction Model System (NAQPMS) to simulate aerosol properties during the campaign period as a part of the APHH research. To improve model performance, the NAQPMS was updated by incorporating an advanced particle microphysics (APM) module that explicitly accounts for the microphysical process (Chen et al., 2014) and a new heterogeneous chemistry scheme (Li et al., 2018). The Hybrid Single-Particle Lagrangian Integrated Trajectory (HYSPLIT) model was also employed to explicate the evolution of aerosol properties (e.g., mixing state, number concentration, and size distribution). Detailed analysis of the transport of precursors or secondary products, and heterogeneous reactions was mainly focused on sulfate, as recent studies have indicated that sulfate is a key driver for severe haze events (Huang et al., 2014; Zheng et al., 2015). Crucially, the effects of the regional transport and heterogeneous chemistry of SO2 on aerosol properties were quantified. To our knowledge, this is the first study to distinguish the contributions of the transport of SIA alone and its precursors to PM2.5 in Beijing as well as combining trajectories with the evolution of microphysical properties. We believe that this study will help to understand the causes of haze in this megacity cluster.
2.1 Model description
The Nested Air Quality Prediction Model System (NAQPMS) developed by the Institute of Atmospheric Physics, Chinese Academy of Sciences (IAP/CAS) is a three-dimensional Eulerian terrain-following chemical transport model. The Weather Research and Forecasting model (version 3.6.1; WRFv3.6.1), driven by Final Analysis (FNL) data from the National Centers for Environmental Prediction (NCEP), provides the meteorology field for the NAQPMS. The NAQPMS includes emissions, horizontal and vertical advection and diffusion, dry and wet deposition, and chemical (including gas, aqueous, and heterogeneous) reaction processes (Wang et al., 2001; Li et al., 2012, 2018). In the model, aqueous chemistry only occurs in cloud water, including the oxidation reactions of S(IV) by O3, H2O2, methyl hydroperoxide, peroxyacetic acid, and oxidation catalysis of transition metal ions (Fe3+ and Mn2+). Heterogeneous chemistry reactions occur on aerosol's surface with the aqueous layer and are related to aerosol liquid water. For sulfate, assuming that the upper limit of does not exceed the uptake coefficient on dust surfaces, the upper limit of is for aerosol water content (AWC) > 300 µg m−3 and its lower limit is if the AWC < 10 µg m−3. More details can be found in Li et al. (2018). It also incorporates online source tagging, process analysis, an online WRF coupler, and other techniques (Wu et al., 2017; Z. Wang et al., 2014). The Carbon Bond Mechanism version Z (CBMZ) is used for gas-phase chemistry mechanisms. The thermodynamic model ISORROPIA (version 1.7) is used to calculate the composition and phase state of an –––Cl−–Na+–H2O inorganic aerosol system (Nenes et al., 1998). Six secondary organic aerosols (SOAs) are managed using a two-product module. Further details regarding the NAQPMS can be found in J. Li et al. (2013, 2014, 2017), and numerous subsequent papers have been published describing recent updates.
To accurately describe aerosol properties (e.g., number concentration, size distribution, and mixing states), an advanced multi-type, multicomponent, size-resolved advanced particle microphysics (APM) module is coupled to the NAQPMS (Chen et al., 2014). The APM module explicitly describes microphysical aerosol processes, including nucleation, condensation, evaporation, coagulation, thermodynamic equilibrium with local humidity, hygroscopic growth, and dry and wet deposition (Yu and Luo, 2009), and it has already been applied in the global GEOS-Chem model (Ma and Yu, 2014). In the updated NAQPMS, 40 sectional bins covering 0.0012–12 µm were used to represent secondary particle distribution (, , , and secondary organic aerosols) (Chen et al., 2014). The size distribution of BC and primary organic aerosol was represented using 28 section bins. Other primary particles such as dust and sea salt were represented using four bins. The coating of secondary species on primary particles (sea salt, BC, OC, and dust) was explicitly simulated using a scheme that dynamically calculates the aerosol aging time with an hourly resolution on the basis of aerosol microphysics. The mixing state is assumed to be semi-external. Primary particles coated with SIA or SOA are considered to be core–shell mixtures whereas nucleated secondary particle is internally mixed (Chen et al., 2014). The mass concentrations of coating species were also tracked in the model. Chen et al. (2017) employed the updated NAQPMS and revealed that the daytime aging time of BC in Beijing can be less than 2 h in winter. This is much less than the fixed aging timescale of 1.2 d that has been stipulated in previous studies (Liu et al., 2009) but is close to observed levels (2–4 h) (Peng et al., 2016). Li et al. (2018) further developed a heterogeneous chemical scheme based on mixing states to reproduce the chemical transformation of gaseous precursors on aerosol surfaces, which largely altered the sizes and hygroscopicity of particles. Heterogeneous chemistry includes the oxidation of S(IV) on the aqueous layer of aerosols and it is parameterized according to the scheme of Li et al. (2018). Comparison with long-term observations has proven that the updated NAQPMS can successfully estimate aerosol mass and the number concentration, size distribution, mixing states, and BC aging time in China (J. Li et al., 2017, 2018; Chen et al., 2014, 2017).
Distinguishing the contributions of the transport of SIA itself and its precursors to PM2.5 is always difficult (Sun et al., 2014; J. Li et al., 2014, 2017; Ying et al., 2014). These contributions have generally been named regional transport in studies; this leads to ambiguity in regional transport. In this study, we divided the secondary species (e.g., SIA) in the ith receptor region into four parts: (1) SIA locally produced from the ith region locally emitted precursors (LC); (2) SIA chemically formed in other regions from the ith region locally emitted precursors (LTC); (3) SIA chemically formed along the transport pathway to the ith receptor region from precursors emitted in the jth source region (RTC); and (4) SIA produced in the jth region from precursors emitted in the jth source region (RLC).
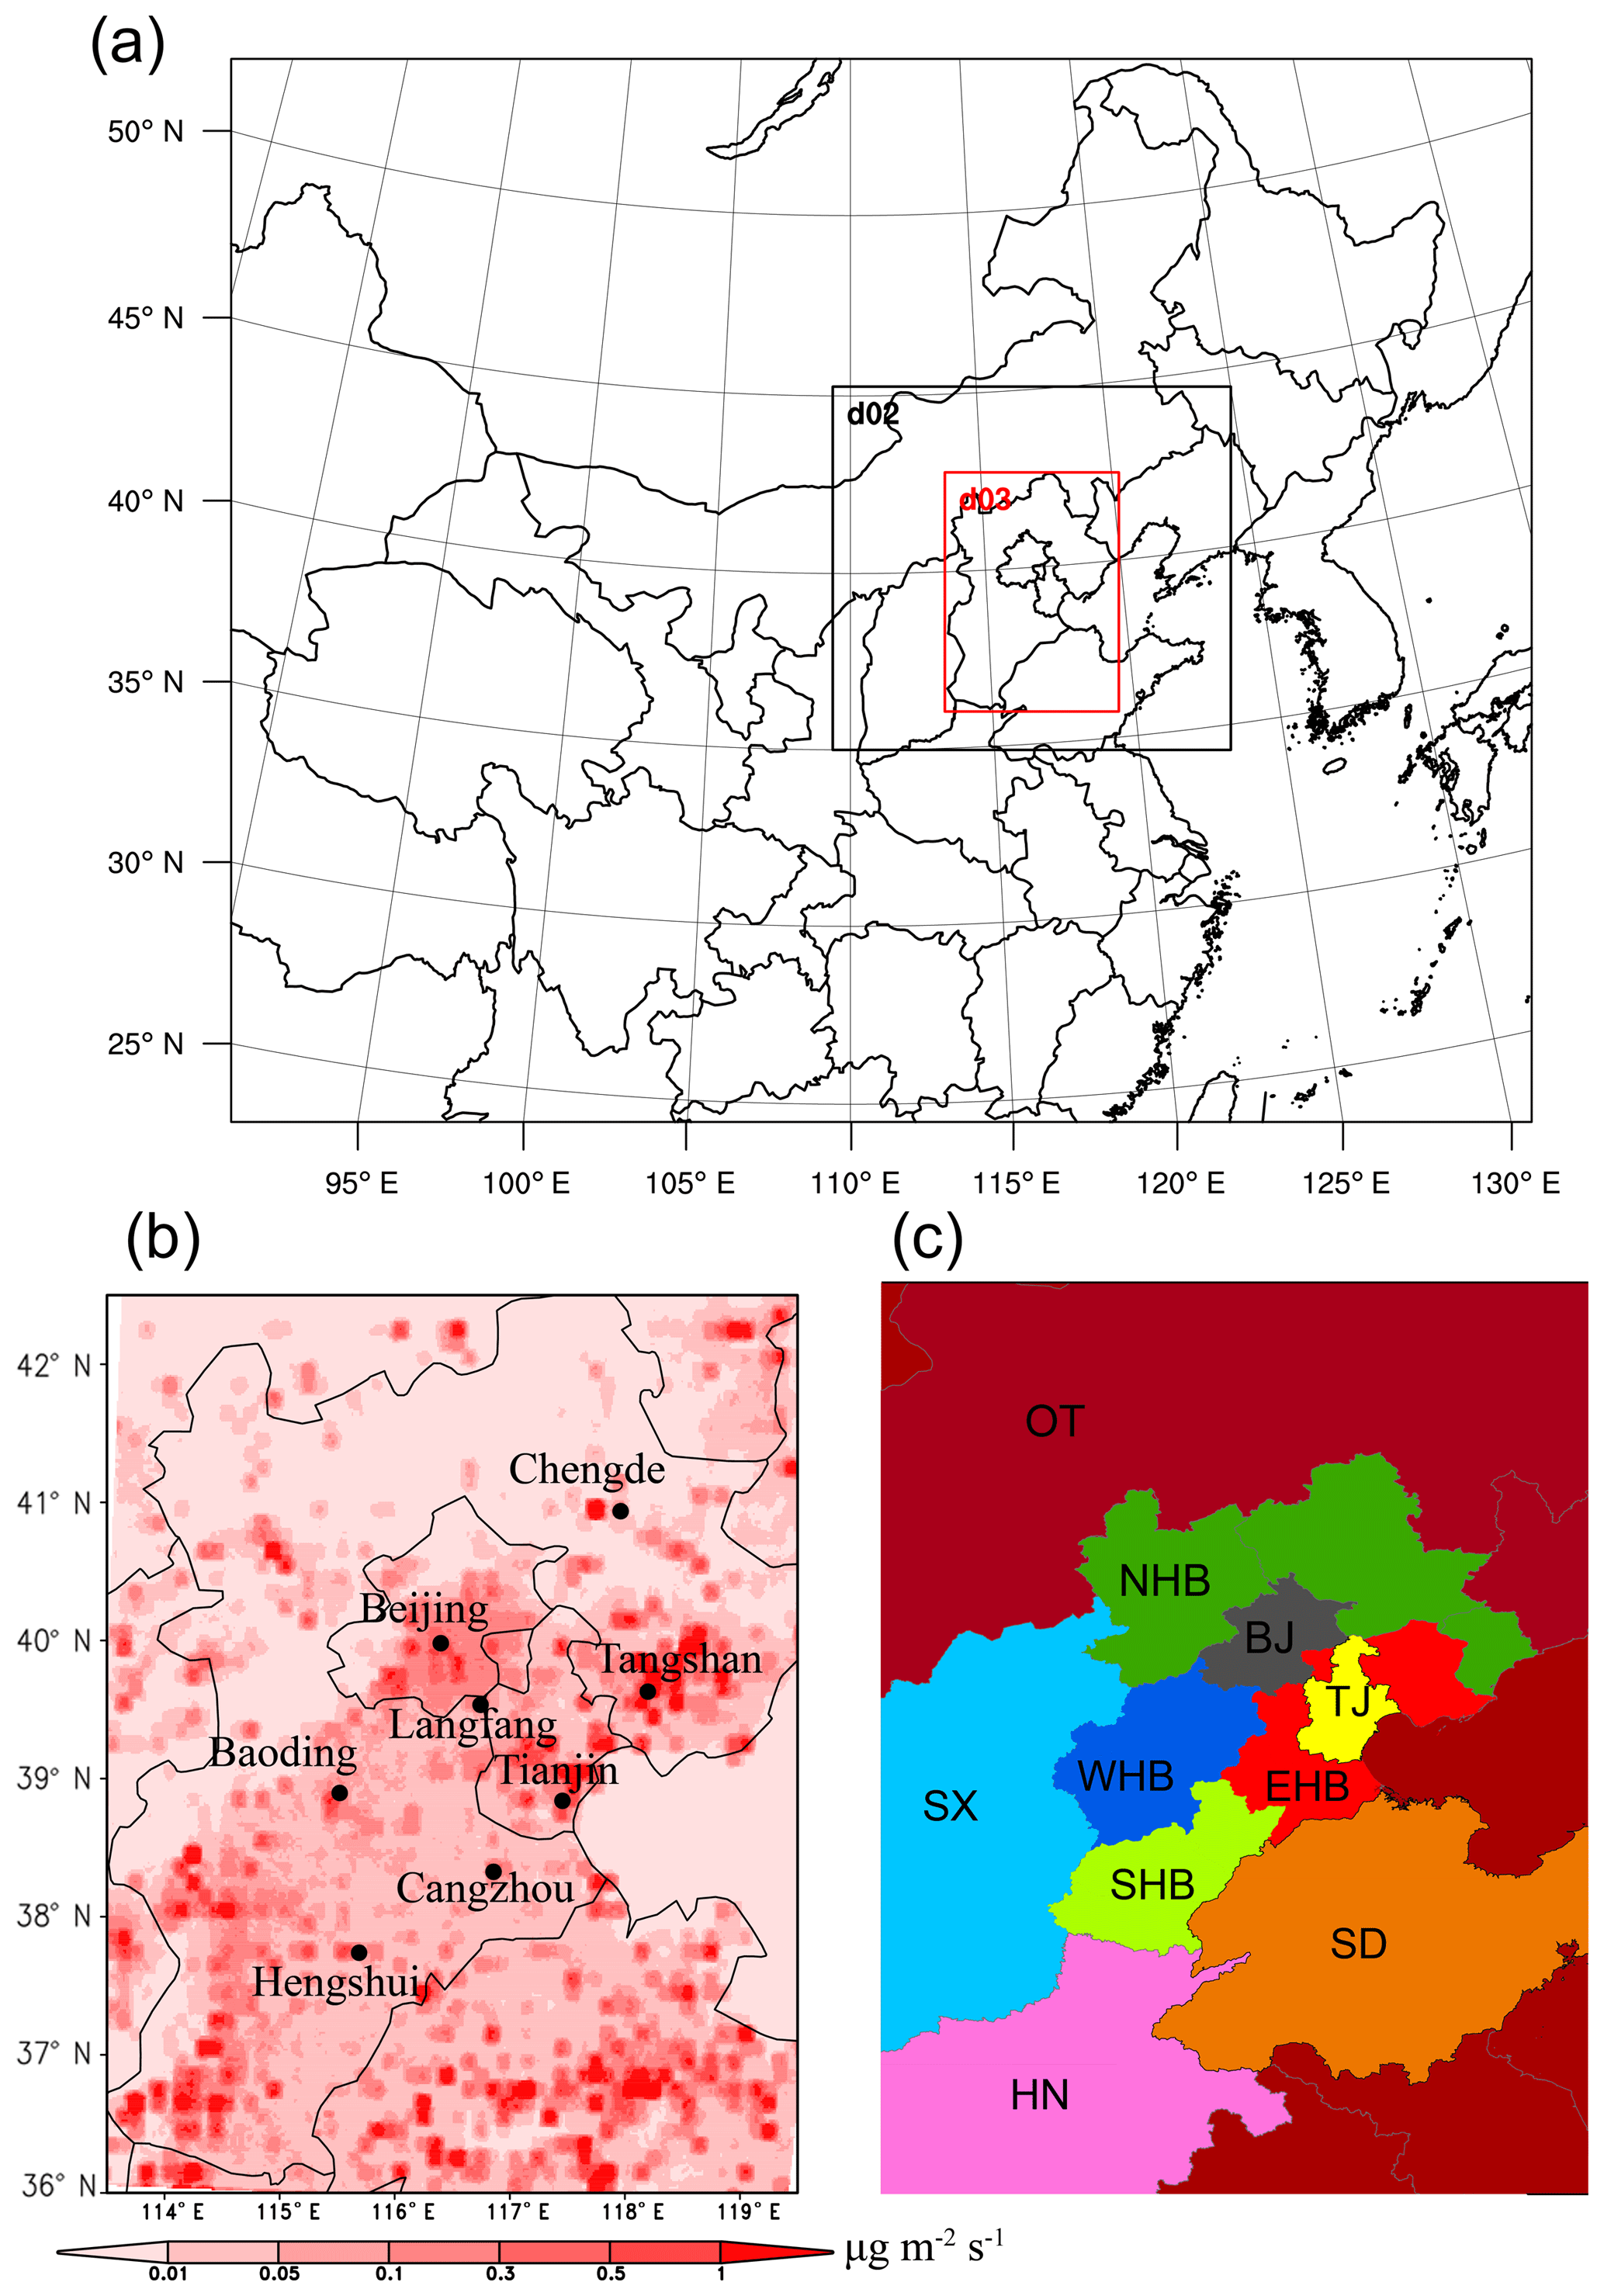
Figure 1(a) Simulation domains: “do2” represents the second domain, and “d03” represents the third domain. (b) Primary PM2.5 emission rates of the innermost domain and locations of observation sites (black dots). (c) Tracer tagging regions that are described in Table 1.
An online tracer-tagging module in the NAQPMS was used to resolve the contributions from LC, LTC, RTC, and RLC. The module is capable of tracing both the emission regions of precursors and the formation regions of secondary aerosols. First, the mass contribution from the locations in which SIA was formed, referred to as C2, was tagged. The mass contribution from precursors emitted in different locations, referred to as C1, was then tagged. More technical details can be found in Li et al. (2014) and Wu et al. (2017). The following equation can be employed to calculate the degree of chemical conversion during transport (TC):
where i represents region, n is the total number of regions, and n is 10 in this study. C1i refers to the absolute mass concentration transported to the receptor site, produced by precursors emitted in region i; C2i refers to the absolute mass concentration formed in region i and transported to receptor site; CCi refers to the local contribution ratio of precursors in region i; C2i×CCi refers to the absolute mass transported to the receptor site and generated at region i by the chemical conversion of precursors released at region i. For Beijing, i=1, refers to LC; i1, refers to RLC; is the mass concentration generated in all regions except I by the chemical conversion of precursors released at region I and finally transported to the receptor site. For Beijing, i=1, refers to LTC; i1, refers to RTC.
In this study, 10 regions, according to administrative division, are selected for source tagging (Fig. 1c), six of which – Chengde, Zhangjiakou, and Qinhuangdao (NHB); Beijing (BJ); Tianjin (LT); Hengshui, Xingtai, and Handan (SHB); Baoding and Shijiazhuang (WHB); and Tangshan, Langfang, and Cangzhou (EHB) – are parts of the Beijing–Tianjin–Hebei (BTH) region. Henan (HN), Shandong (SD), Shanxi (SX), and “Other regions” (OT) are areas outside of the BTH region.
Table 1Source-tagging regions and primary PM2.5 emissions from 15 November to 15 December 2016 in this studya.
a Regions are shown in Fig. 1c; b GDP unit in 2016 is Chinese Yuan (CNY) (http://www.tjcn.org/tjgb/, last access: 13 June 2019); c PM2.5 emissions data are obtained from the 2016 Multi-resolution Emission Inventory for China (MEIC) at a resolution.
2.2 Model configuration
The simulation was conducted from 10 November to 15 December 2016, and the first 5 d were set aside as a spin-up period. The three nested model domains are shown in Fig. 1a. The horizontal resolutions of the domains were 27, 9, and 3 km from the coarsest to the innermost domain. The first level of the NAQPMS was approximately 20 m in height, and there were about 17 layers under 2 km.
To quantitatively assess the contribution of primary emissions, traditional chemistry reactions (gas-phase and aqueous chemistry reactions), and heterogeneous formation of sulfate, three sensitivity simulations were conducted. The baseline scenario (Base) involved all heterogeneous reactions and considered primary sulfate emissions; its results were used for model verification and source apportionment analysis. Control 1 (C1) involved all heterogeneous reactions but did not consider primary sulfate emissions. Compared with Base, Control 2 (C2) excluded the heterogeneous reactions of SO2. Base-C2 represents the effect of heterogeneous reactions on sulfate. Base-C1 represents the contribution of primary sulfate emissions.
The HYSPLIT model was used to analyze the trajectories of air masses (Draxler and Hess, 1998). The calculated trajectories are helpful for resolving the evolution of aerosol properties along the transport pathway by extracting the simulated results by the NAQPMS along trajectories. In this study, the same meteorology data (obtained hourly data of the third domain) used in the NAQPMS were employed to perform trajectory analysis; this avoided the errors caused by inconsistency between the two models (the NAQPMS and HYSPLIT).
2.3 Emission inventory
The anthropogenic emissions were obtained from the Multi–resolution Emission Inventory for China (MEIC), and the base year was 2016 for the BTH region (http://www.meicmodel.org/publications.html, last access: 12 November 2019). In addition, observation data collected at sites within the BTH region were used to update the MEIC on the basis of their latitude and longitude information. Biomass burning emissions were taken from the Fire Inventory from NCAR (National Center for Atmospheric Research) (Wiedinmyer et al., 2011). Primary sulfate was assumed to constitute 5 % of SO2 emissions in the original MEIC inventory. Cao et al. (2014), Wang et al. (2009), Zheng et al. (2013), and Ma et al. (2015) discovered that primary sulfate comprised large amounts of primary PM2.5 from industrial, power, and residential emissions in the main form of (NH4)2SO4 via in situ measurement of source profiles. Thus, we took 40 %, 6 %, and 15 % of primary PM2.5 from industrial, power, and residential emissions, respectively, as primary sulfate emissions in the inventory. Figure 1b displays the hourly primary PM2.5 emission rate.
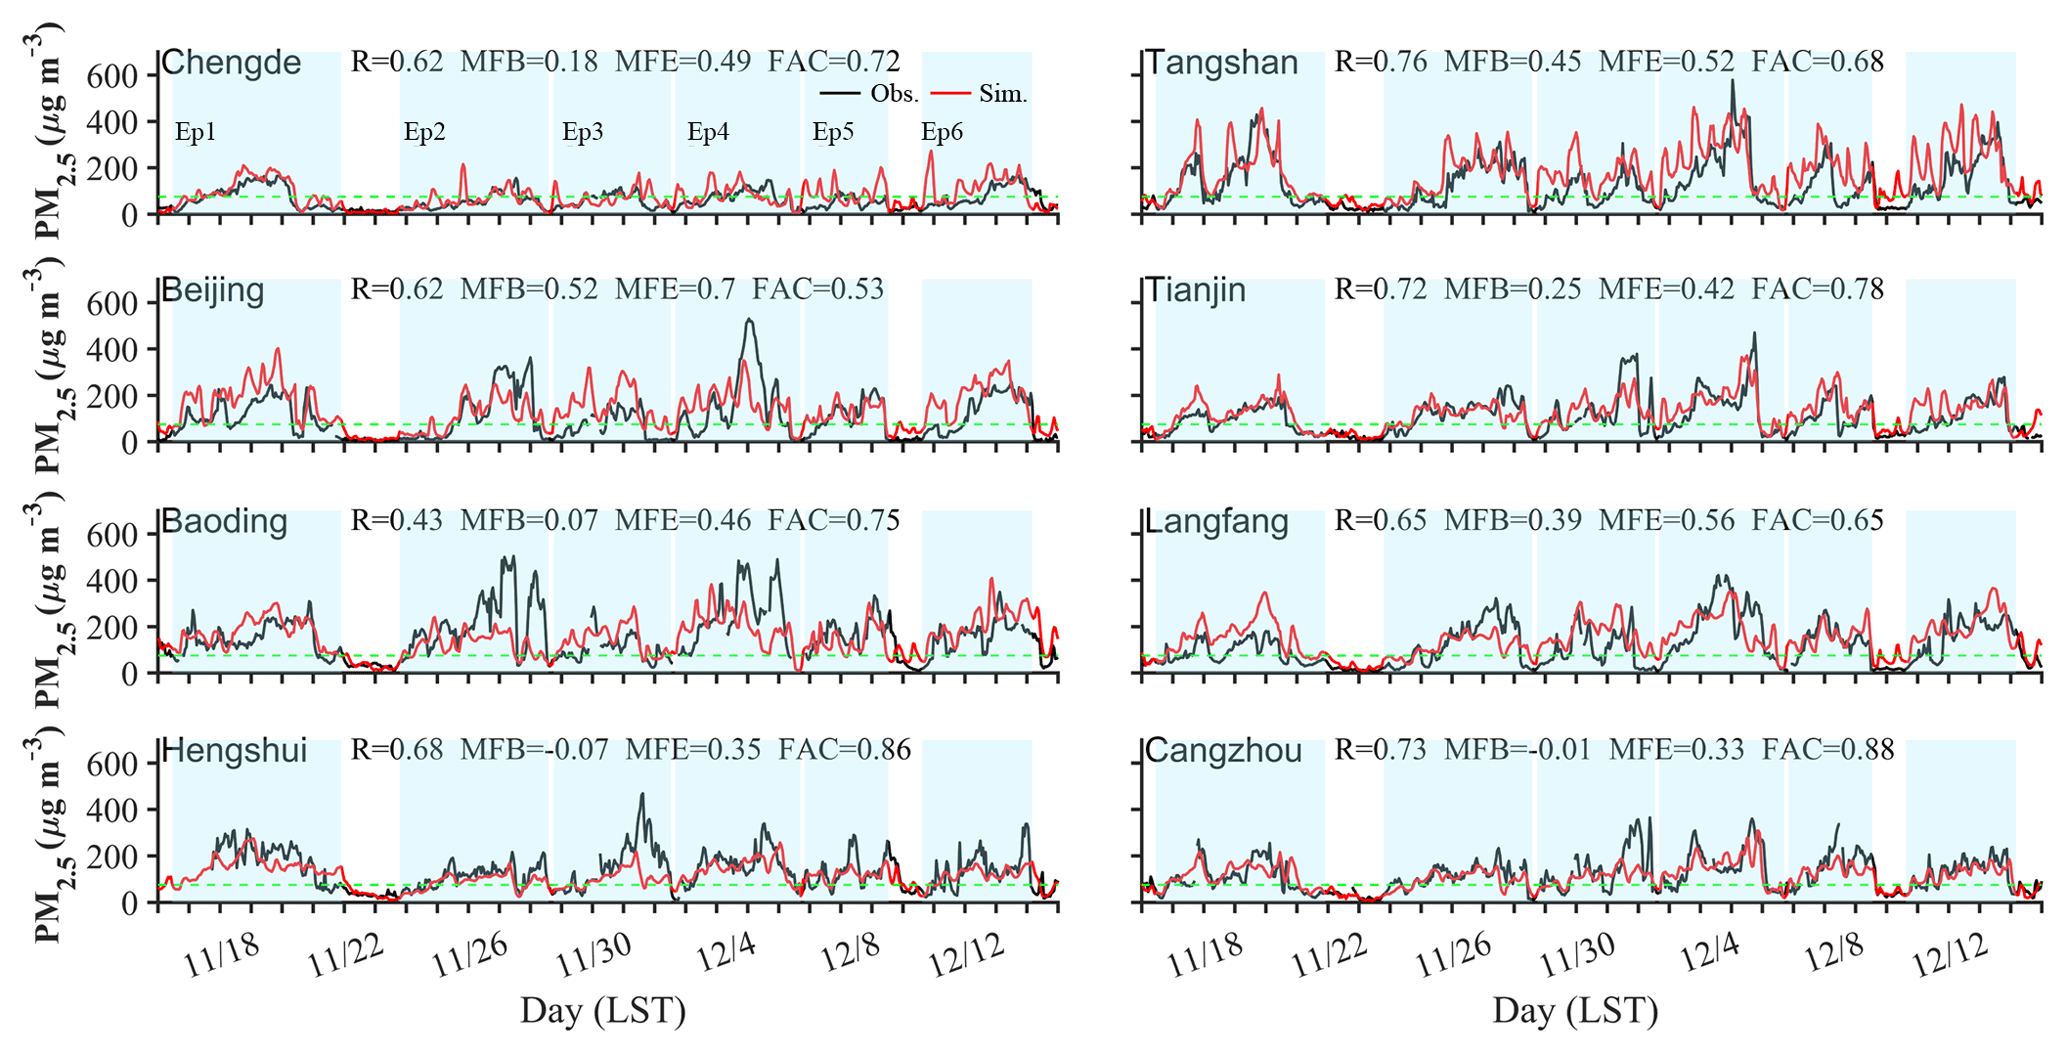
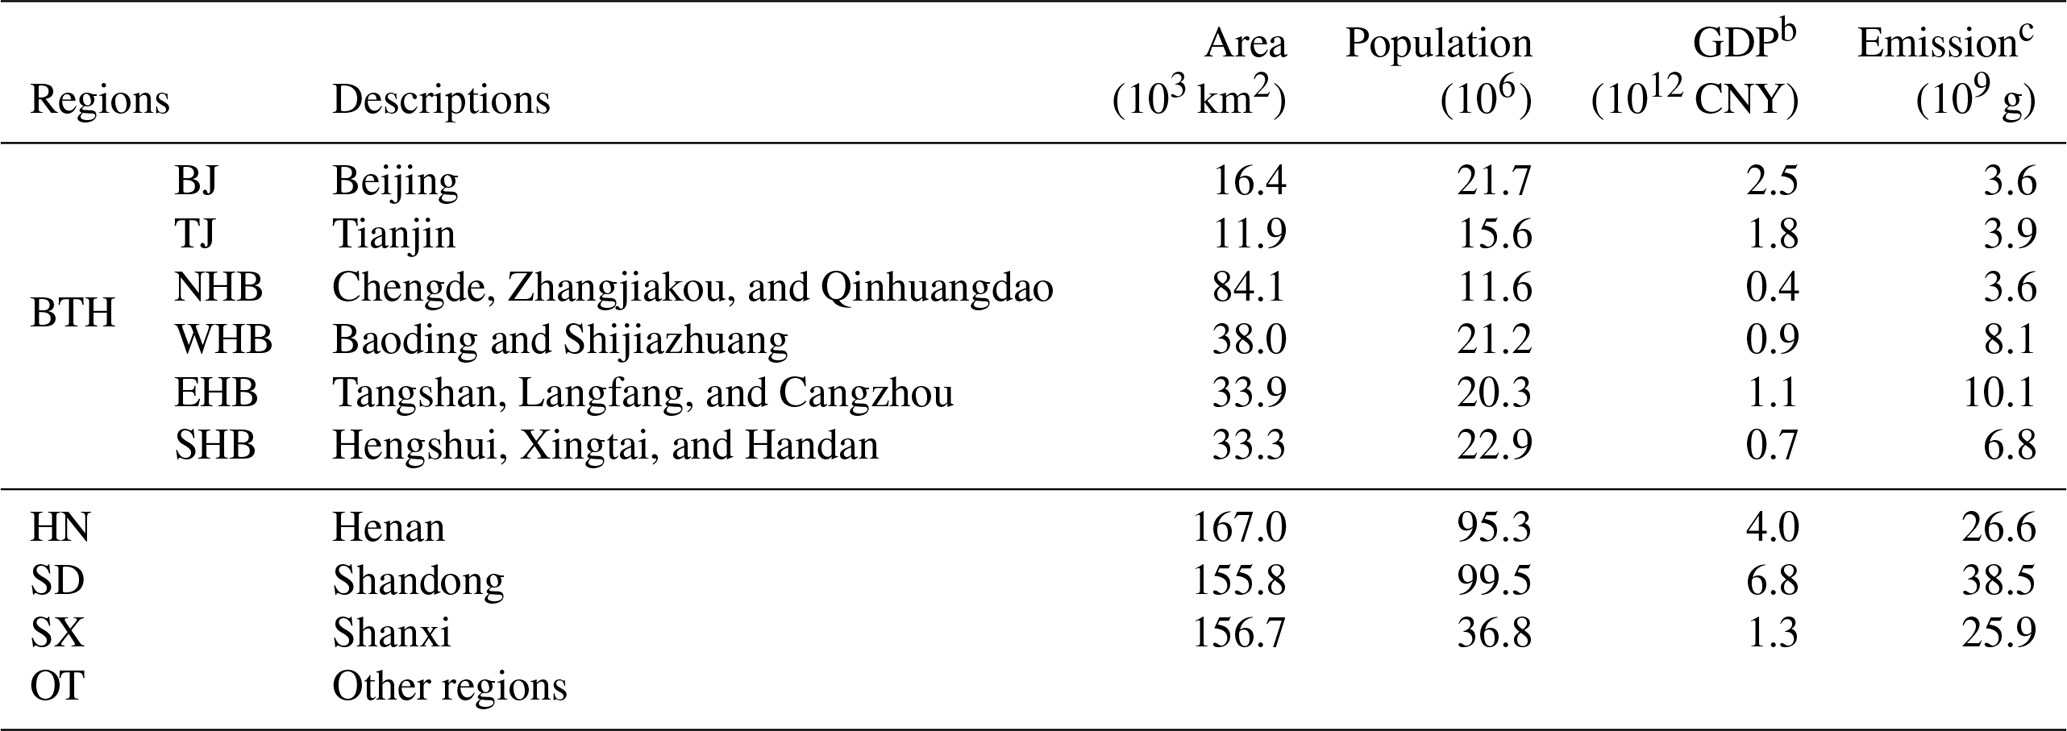
Figure 2Comparison between the simulated and observed hourly concentrations of PM2.5 for different sites. The black lines refer to observations (Obs.) and the red lines are simulation results (Sim.); the light blue shading denotes the six episodes identified; the green lines refer to 75 µg m−3, as a criterion for determining if pollution is present or not. FAC refers to the fraction of the simulation within 0.5 and 2 times the observation.
2.4 Observations
The surface meteorological parameters were obtained from the China Meteorological Administration, whereas the vertical profiles of meteorological parameters were obtained from the University of Wyoming (http://weather.uwyo.edu/upperair/sounding.html, last access: 13 June 2019). Observations of PM2.5, SO2, NO2, and O3 concentrations were obtained from the China National Environmental Monitoring Center (http://www.cnemc.cn/, last access: 13 June 2019). Aerosol components (including organic matter – OM, sulfate, nitrate, and ammonium) were measured in situ in Beijing using an Aerodyne high-resolution time-of-flight aerosol mass spectrometer. Details regarding this instrument can be found in Sun et al. (2015). A seven-wavelength Aethalometer (AE33, Magee Scientific Corp.) was used to measure BC in Beijing (Xie et al., 2019). The OC ∕ EC in aerosol was measured using a field semi-online OC ∕ EC analyzer from Sunset Laboratory Inc. (USA) with a PM2.5 cyclone inlet at Tianjin and Langfang (Gao et al., 2016). Two ambient ion monitors (AIM; Model URG 9000D, URG Corporation) were used to measure hourly concentrations of water-soluble ions in PM2.5, including , Na+, K+, Ca2+, Mg2+, , , and Cl− at TJ and Langfang (Gao et al., 2016). The particle number size distributions at ground level were obtained using a scanning mobility particle sizer (SMPS) with a time resolution of 5 min. Details regarding this instrumentation can be found in Du et al. (2017). All data in this study are presented in Beijing local time (UTC+8 h).
3.1 PM2.5 mass and number concentrations and degree of aging
The time series of simulated and observed PM2.5 in different cities in the BTH region from 15 November to 15 December 2016, are illustrated in Fig. 2. During the study period, six regional haze episodes were identified, namely, 15–20 November (Ep1), 23–26 November (Ep2), 28–30 November (Ep3), 2–4 December (Ep4), 6–8 December (Ep5), and 10–12 December (Ep6). The PM2.5 mass concentration frequently exceeded 200 µg m−3 and the average concentration reached 120 µg m−3 during episodes. Haze usually formed in several hours; for example, the increasing rate of PM2.5 reached 200 µg m−3 h−1 and lasted approximately 12 h in Tangshan. These observed haze patterns were generally reproduced by the NAQPMS. The correlation coefficient (R) between the observation and simulation in most cities was 0.6–0.8, and 60 %–80 % of simulation results were within a factor of 2 of the observation. The mean fractional bias (MFB) and mean fractional error (MFE) ranged from −0.07 to 0.7, meeting the criteria of a MFB ≤ 0.6 and a MFE ≤ 0.75 (Boylan and Russell, 2006). The simulation did, however, underestimate PM2.5 in Beijing and Baoding during Ep2. This was caused by the failure of the mineral aerosol transport simulation. Compared with other cities in the cluster, Beijing and Baoding are closer to the Gobi Desert, a major dust source in East Asia; thus, they are more easily affected by dust storm transport. Pan et al. (2019) found a pronounced peak in the size distribution at 4–5 µm for Ep2 in Beijing. The concentration of Ca2+ was 7 times the campaign average (Fig. S1).
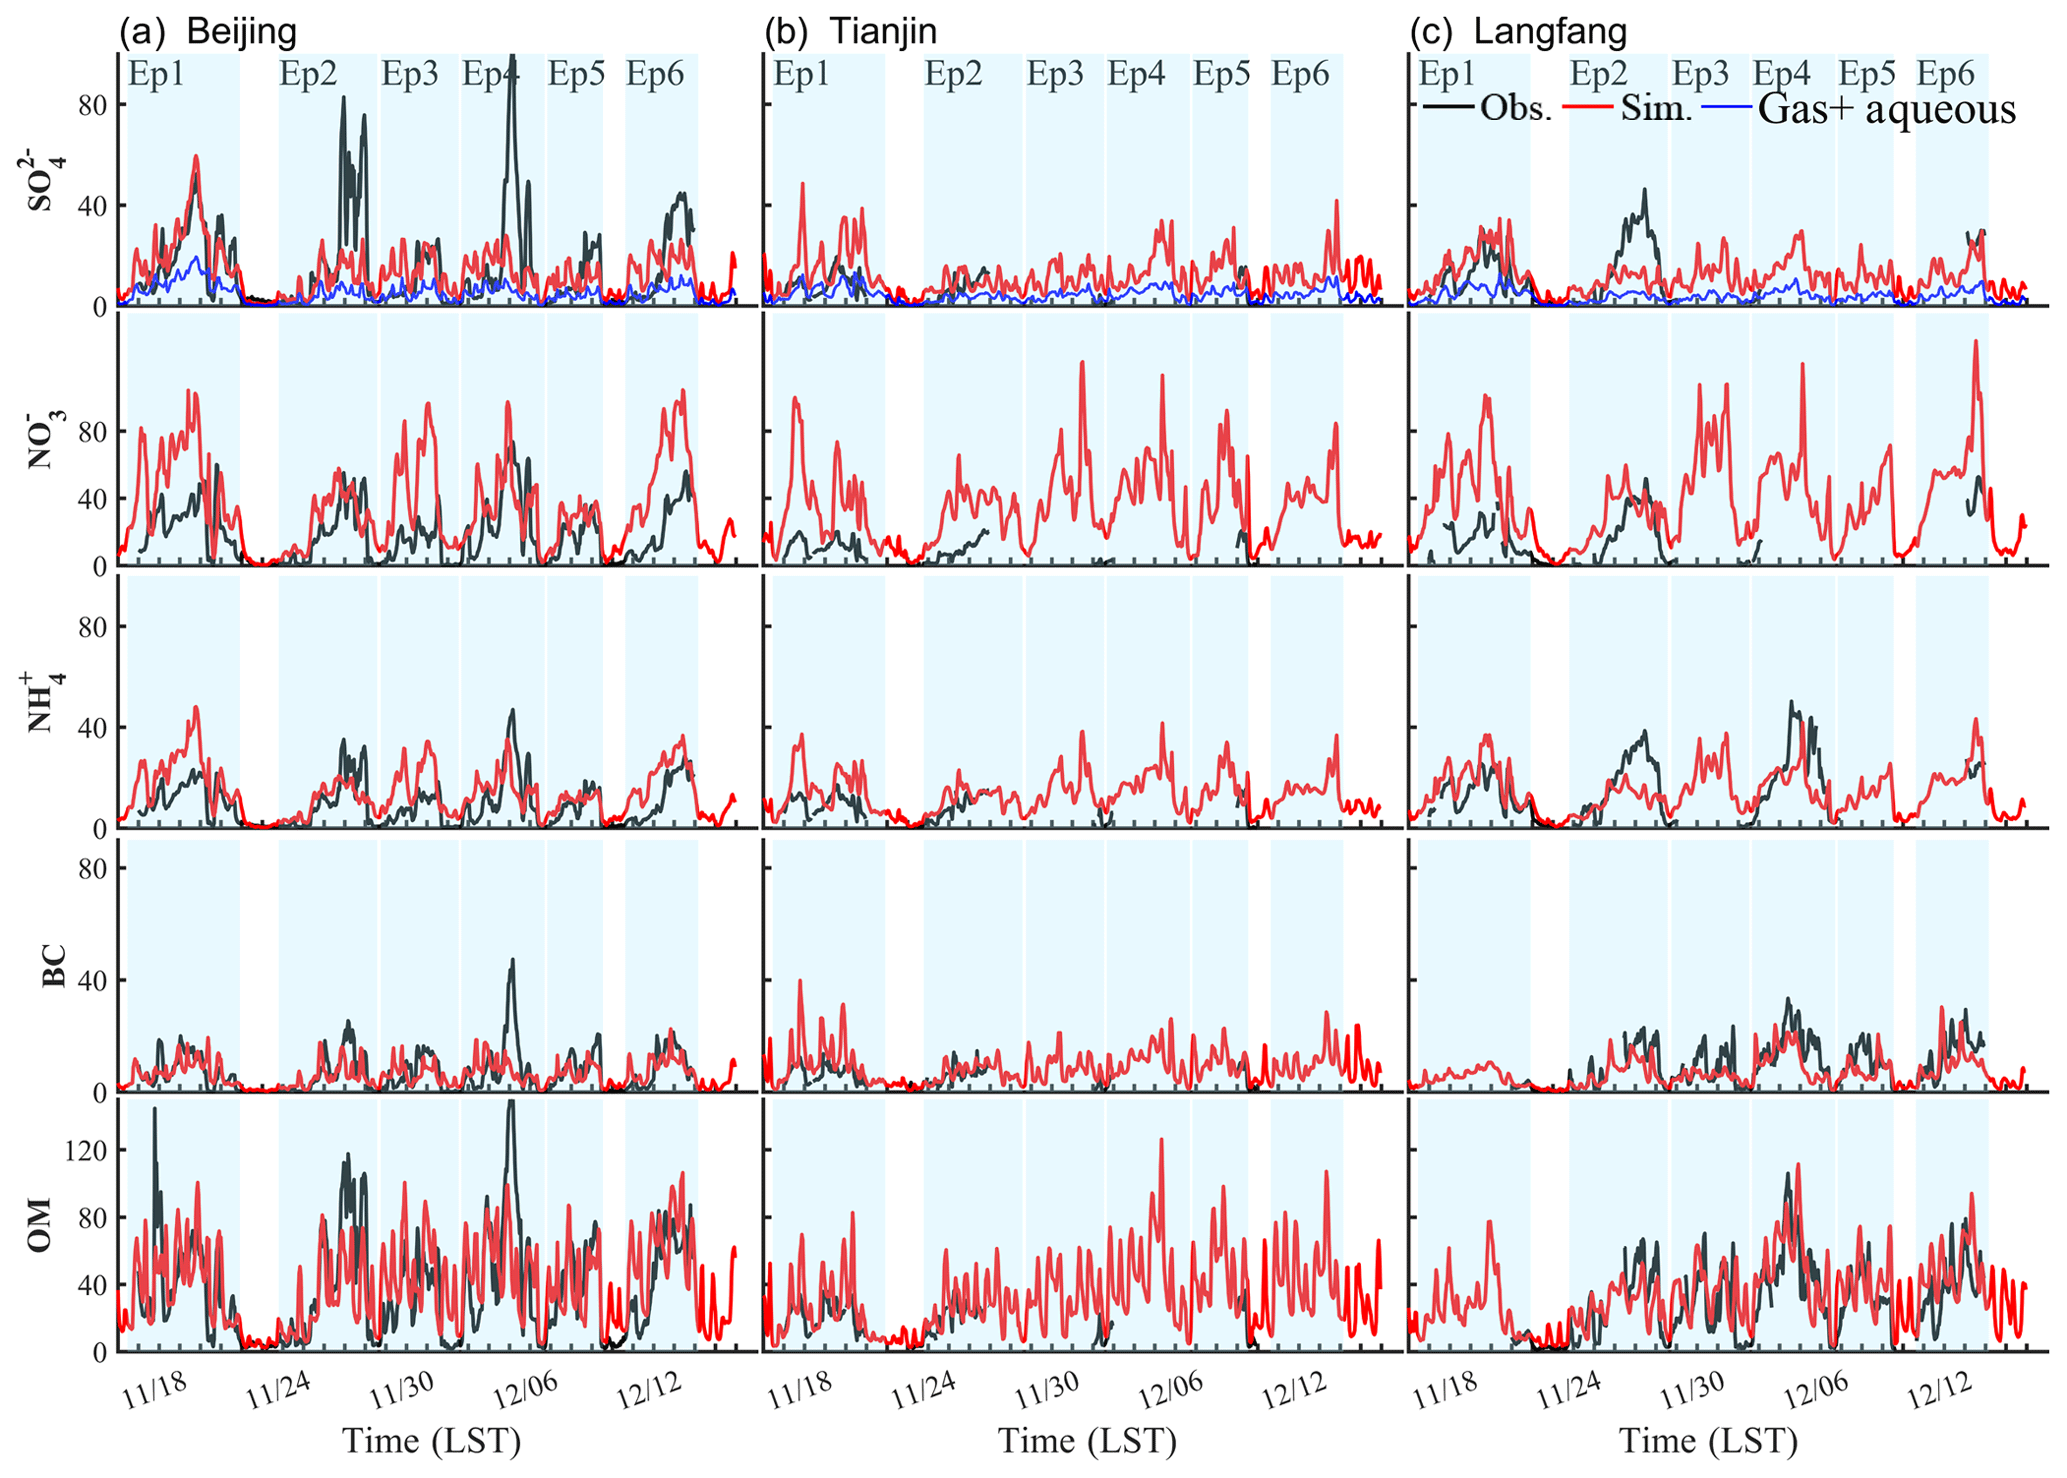
Figure 3Comparison between the simulated (red) and observed (solid black) hourly components including sulfate (), nitrate (), ammonia (), black carbon (BC), and organic matter (OM) at (a) Beijing, (b) Tianjin, and (c) Langfang. Blue lines refer to sulfate produced by gas and aqueous chemistry reactions.
The aerosol components in Beijing, Langfang, and Baoding are compared in Fig. 3. In general, the simulation largely reproduced the variation in primary and secondary aerosols. In particular, the rapid increase in SIA during Ep1, Ep2, and Ep4 was captured by the simulation. Interestingly, the NAQPMS underestimated the sulfate concentration in Beijing during Ep2 and Ep4, but the nitrate and ammoniate concentrations during these two episodes were successfully reproduced. This was related to the transport of mineral dust (Ep2) and local emissions (Ep4). As discussed in the last paragraph, Beijing had high mineral loadings for Ep2, which provided a favorable medium for the chemical transformation of anthropogenic SO2 into sulfate in the form of CaSO4 or MgSO4 (Z. Wang et al., 2018, 2017). Underestimation of the sulfate concentration in Ep4 may have been caused by local emissions in Beijing. As illustrated in Fig. 3, the simulation failed to reproduce the sharp increase in both sulfate and BC in Beijing during this episode. This is different from the case of Ep2, in which sulfate was underestimated but BC was favorably reproduced. Wang et al. (2009) and Ma et al. (2015) found that sulfate accounted for about 40 % and 6.6 % of primary PM2.5 emissions from industry and power plants, respectively, which also emit a large amount of BC. This sharp increase in BC was a local-scale episode. In Langfang, a site located 50–60 km from Beijing, both the observed and simulated BC concentration increased slowly to 20 µg m−3, which is much less than that in Beijing (45 µg m−3). The monthly emissions employed in this study made it difficult to capture these short-term local-scale emission changes. The simulated SO2 concentrations are compared with the observations in Fig. S2, and the normalized mean bias (NMB) values were less than 40 %.

Figure 4(a) Particle size distribution in Beijing at ground level. (b) Comparison of the geometric mean diameter (GMD) for particles in the range of 16–600 nm between observations and simulated values for Beijing. The black solid line and the red solid line represent the observations (Obs.) and simulation (Sim.) results, respectively.
The number size distribution is critical for examining aerosol evolution during haze episodes (Ma et al., 2017). In this study, both the simulation and observations revealed a rapid increase in the GMD from 50 to approximately 120 nm during the initial stages of episodes in Beijing (Fig. 4). The observed mean number concentration of aerosols (dN∕dlog Dp) showed a unimodal distribution and was mainly concentrated in the Aitken mode (25–100 nm) and accumulation mode (100–1000 nm). The highest concentration was approximately 1.8×104 cm−3 at a 100 nm diameter. These patterns were favorably reproduced by the simulation. The simulated number concentrations were underestimated in the 10–60 nm range by 20 %–30 % and overestimated in the 80–150 nm range by 20 %. This indicated that the model needs to be improved regarding its treatment of new particle formation and the volatility of primary organic aerosols.
Herein, the mass ratio of the coating of BC to BC (RBC) was used as an indicator of the degree of aging – which is a measure that has been widely used in previous studies (Oshima et al., 2009; Collier et al., 2018). Figure 11 shows that the mean simulated RBC values in Beijing were 4.5 and 5.0 for the entire study period and for during pollution episodes, respectively, which are extremely close to the observations (∼ 5.0 and 5.1) (Wang et al., 2019). The high performance of the model in terms of mass and number concentrations, compositions, and the degree of aging of aerosols gives us confidence for analyzing aerosol evolution during transport in the megacity cluster centered on Beijing.
3.2 Meteorology
The simulated wind direction and speed coincided with the observations for the haze episodes. In particular, the model captured low wind speeds, and the moments when the wind shifted direction were well reproduced (Fig. S3). Regarding relative humidity and temperature, WRF produced high R values (0.68–0.93) and low NMB values (−0.51 to 0.44; Table S1). In particular, the high relative humidity during Ep1 was well reproduced. Inversion layers were present during the initial stage of haze formation (Fig. S4). The height of the inversion layers varied among episodes. During Ep1 and Ep6, strongly elevated inversion layers were present between 1 and 2 km, whereas the inversion layers were close to the surface during other episodes. Temperature inversion is favorable for pollution accumulation, and the model reproduced this feature well. In summary, the high performance of the meteorological simulation gave us confidence for PM2.5 simulation.
4.1 Source apportionment of surface PM2.5
The simulated spatial distribution of average surface PM2.5 levels and the wind vector during the six haze episodes are shown in Fig. 5. In general, two types of patterns were observed. The first pattern corresponded to Ep1, Ep4, and Ep6 and reflected that a highly polluted belt with PM2.5 over 200 µg m−3 extended from the southwest to the northeast along the Taihang mountain range. In the second pattern (Ep2, Ep3, and Ep5), the PM2.5 level of 150–200 µg m−3 was concentrated in three northern cities (Beijing, Tianjin, and Tangshan). In the other cities, the PM2.5 mass concentrations ranged from 75 to 115 µg m−3, indicating a light pollution level according to the Technical Regulation on Ambient Air Quality Index (on trial).
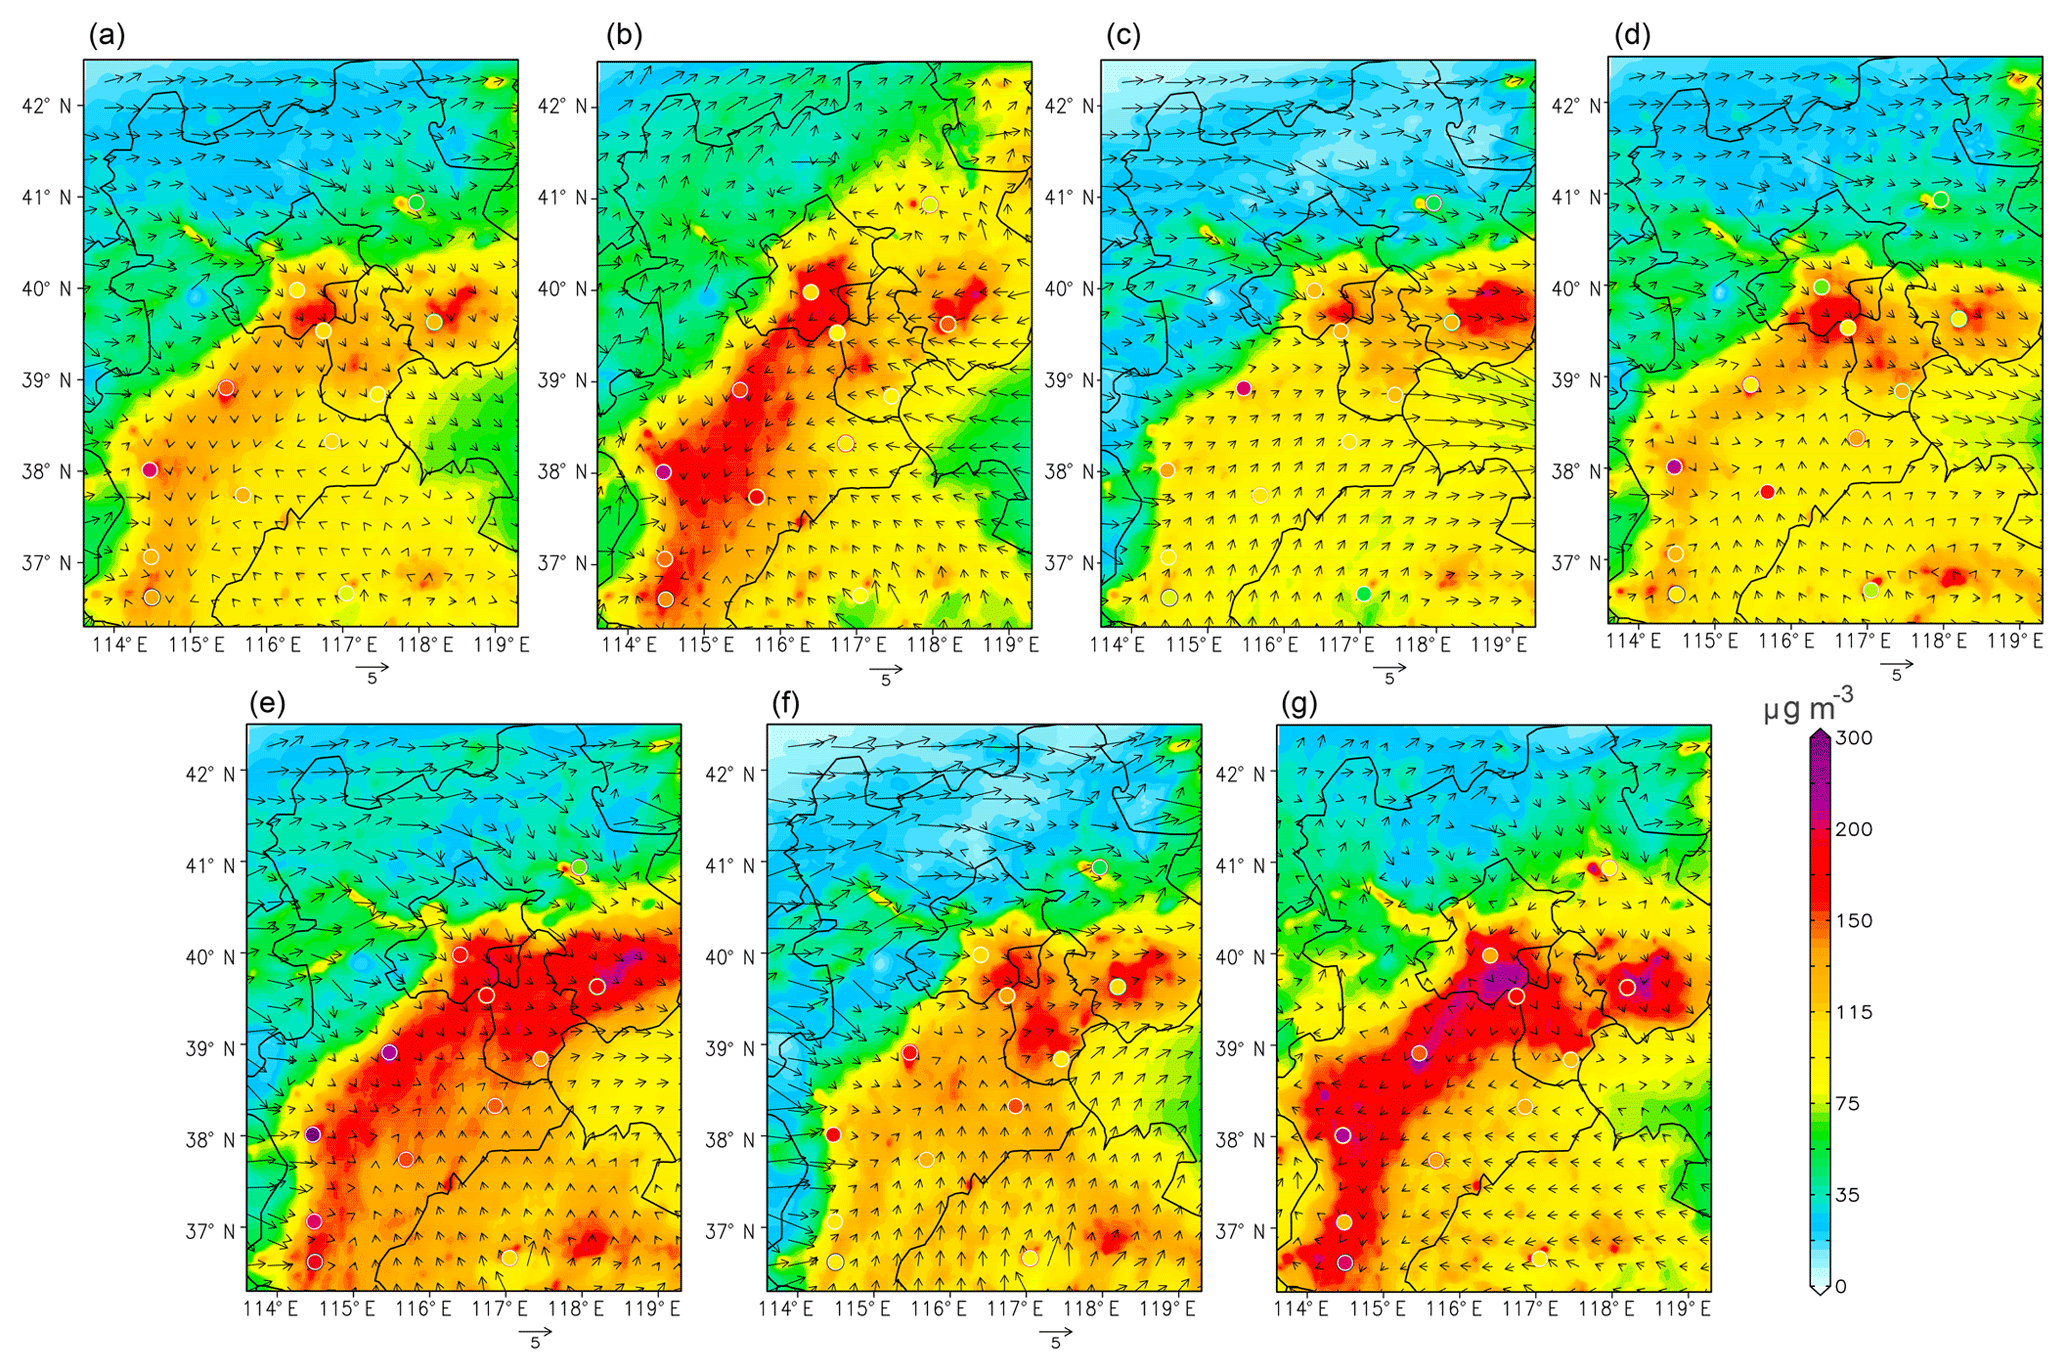
Figure 5Spatial distribution of simulated average surface PM2.5 (µg m−3) and wind (m s−1) over the BTH area. (a) Average of the whole study period. (b)–(g) Episode average of Ep1–Ep6 (identified in the text). Solid circles represent observations and have the same color bar as the simulations.
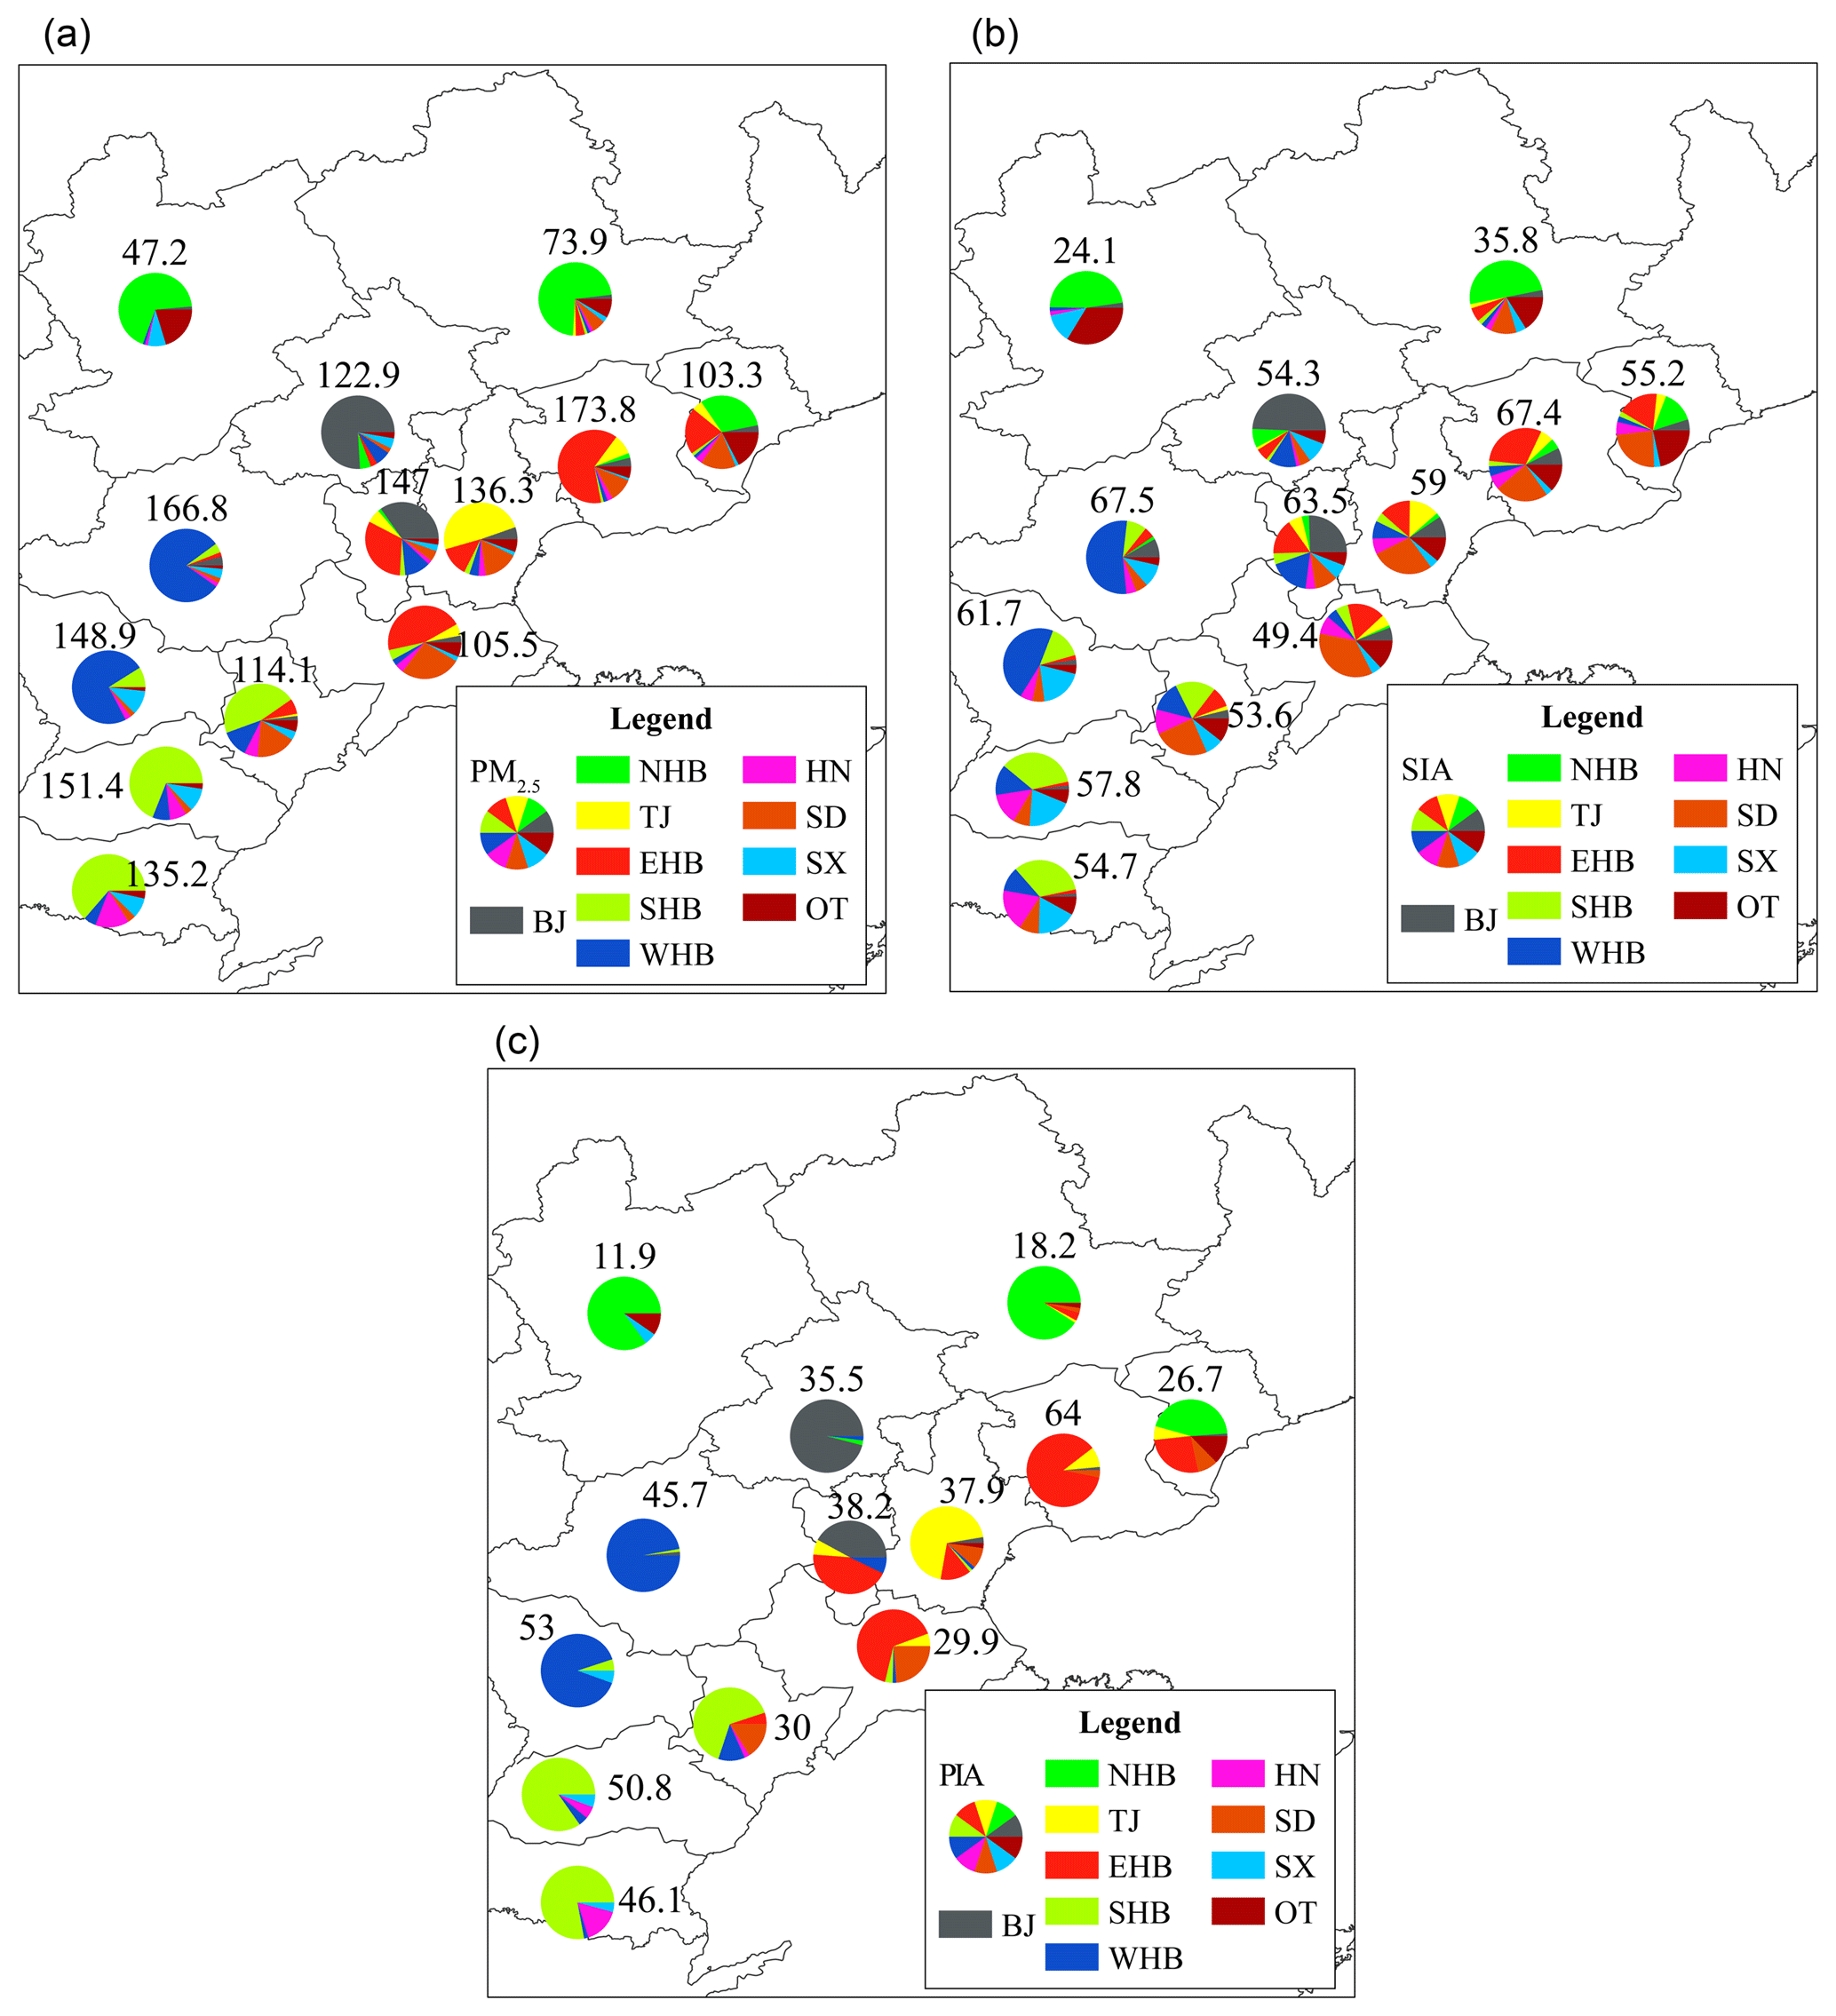
Figure 6The contribution of regional transport and local emissions to the average (a) total PM2.5; (b) secondary inorganic aerosol (SIA); and (c) primary inorganic aerosol (PIA), including BC and primary inorganic PM2.5, over the BTH area. The numbers above the pie charts represent average concentrations (µg m−3) of certain species in certain cities.
Figure 6 shows the contributions of regional transport and local emissions to average PM2.5, primary inorganic aerosol (PIA), including BC and inorganic primary PM2.5), and SIA levels in different cities during the study period. The contribution from local emissions was higher than that of regional transport to the PM2.5 mass concentration in all cities, except Heng Shui, Cangzhou, Langfang, and Qinhuangdao; the magnitude of local emission contributions was 49 %–80 %. The principle reason for this was the accumulation of local PIA emissions. In most cities, 64 %–93 % of PIA originated from local emissions (Fig. 6c). In contrast to PIA, the SIA contribution was dominated by regional transport of emissions from other cities (50 %–87 %). Even the emissions of cities outside the city cluster (e.g., Henan, Shanxi, and Shandong) were transported to the megacity cluster, traveling 500–1000 km. In Beijing, the local contribution to total PM2.5 and PIA was 74 % and 94 %, respectively, whereas regional transport from other cities was the major source of SIA, contributing 51 %. The difference in source apportionment between PIA and SIA was related to the emission of PIA and formation mechanisms of SIA. Regarding PIA, the inversion layer and weak winds during stable weather conditions prevented PIA transport and resulted in local-scale accumulation of PIA emissions. The regional transport provided sufficient time (1–3 d) and aerosol surface for chemical transformation of precursors to SIA (Li et al., 2015; J. Li et al., 2017). This also indicates that regional controls on precursors would be the most efficient way to decreasing the SIA concentration in this megacity cluster. Our results agree favorably with the observed impact of regional emission controls during Asia-Pacific Economic Cooperation China 2014. During this gathering, the SIA concentration in Beijing decreased to a greater degree than the PIA concentration due to regional controls (Sun et al., 2016).
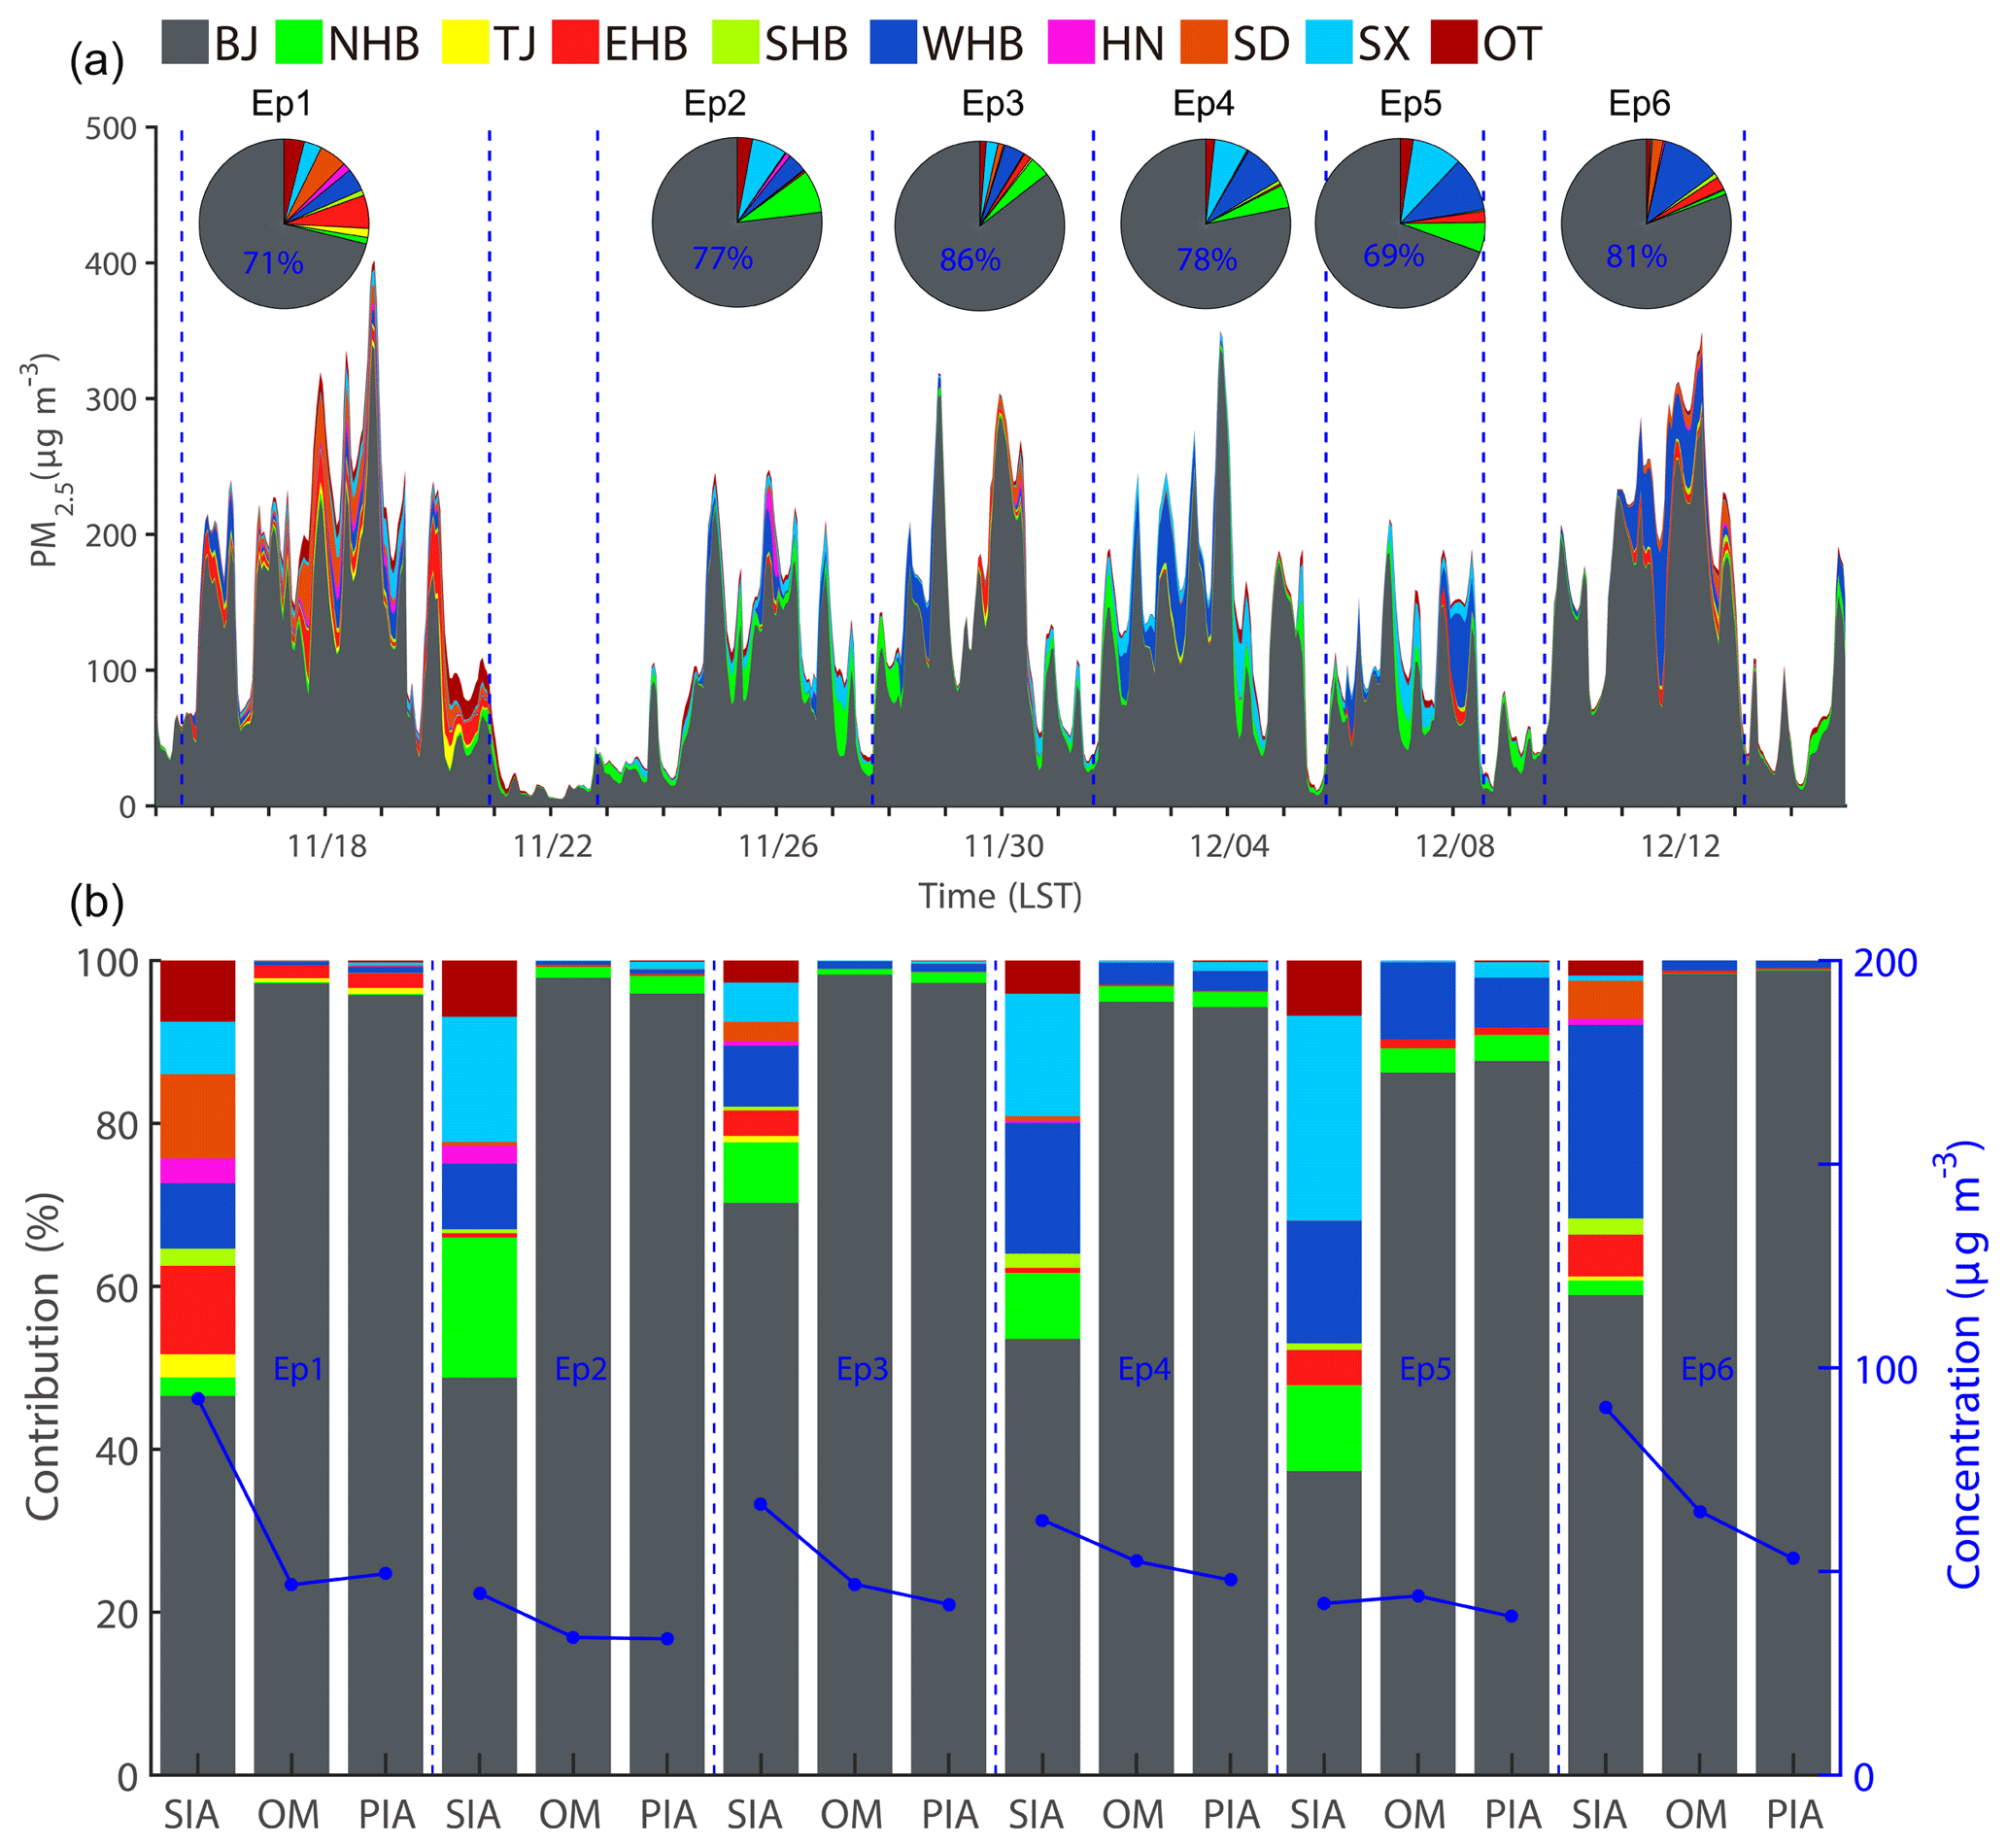
Figure 7(a) Source contribution of PM2.5 in Beijing; the pie charts represent the average status of each episode. (b) The relative contribution of different regions to SIA, OM, and PIA in Beijing at the surface layer during each episode (shaded). The concentrations are also shown (blue line).
The source apportionment in haze episodes in Beijing is illustrated in Fig. 7. Regional transport contributed 14 %–31 % to the surface PM2.5 mass concentration during the six episodes. The highest contribution of regional transport occurred in Ep1 and Ep5 (29 % and 31 % of the total PM2.5, respectively). In Ep1 and Ep5, the contribution of the SIA originating from regional transport reached 53 % and 63 %, respectively. Interestingly, the regionally transported SIA had different source regions in Ep1 and Ep5. In Ep5, SX, WHB, and NHB were the dominant source regions, whereas the source regions for Ep1 were more diverse. This indicates the complexity of regional transport in this megacity cluster. Compared with the episodes in November 2015, the effects of regional transport of PM2.5 and SIA mass concentrations were weaker in this study, which may be related to the weather system and emission controls in 2016 (J. Li et al., 2017). Therefore, more studies on regional transport should be conducted to help further understand regional haze formation mechanisms. In other episodes (Ep2, Ep3, Ep4, and Ep6), regional transport of surface PM2.5, PIA, OM (organic matter; sum of primary organic aerosols, POA, and secondary organic aerosols ,SOA), and SIA mass concentrations were in the range of 14 %–23 %, 3 %–12 %, 3 %–14 %, and 30 %–51 %, respectively. Back trajectories and emissions source regions can be connected (Fig. S5). In Ep6, for example, the air mass mainly originated from Shandong, traveled through SHB and WHB, and finally arrived in Beijing. Furthermore, the height of the trajectory within WHB was low, meaning that the contribution of WHB should have been big, which agrees with results shown in Fig. 7b; additionally, source apportionment results showed that WHB contributed 24 % to SIA in Beijing during Ep6.
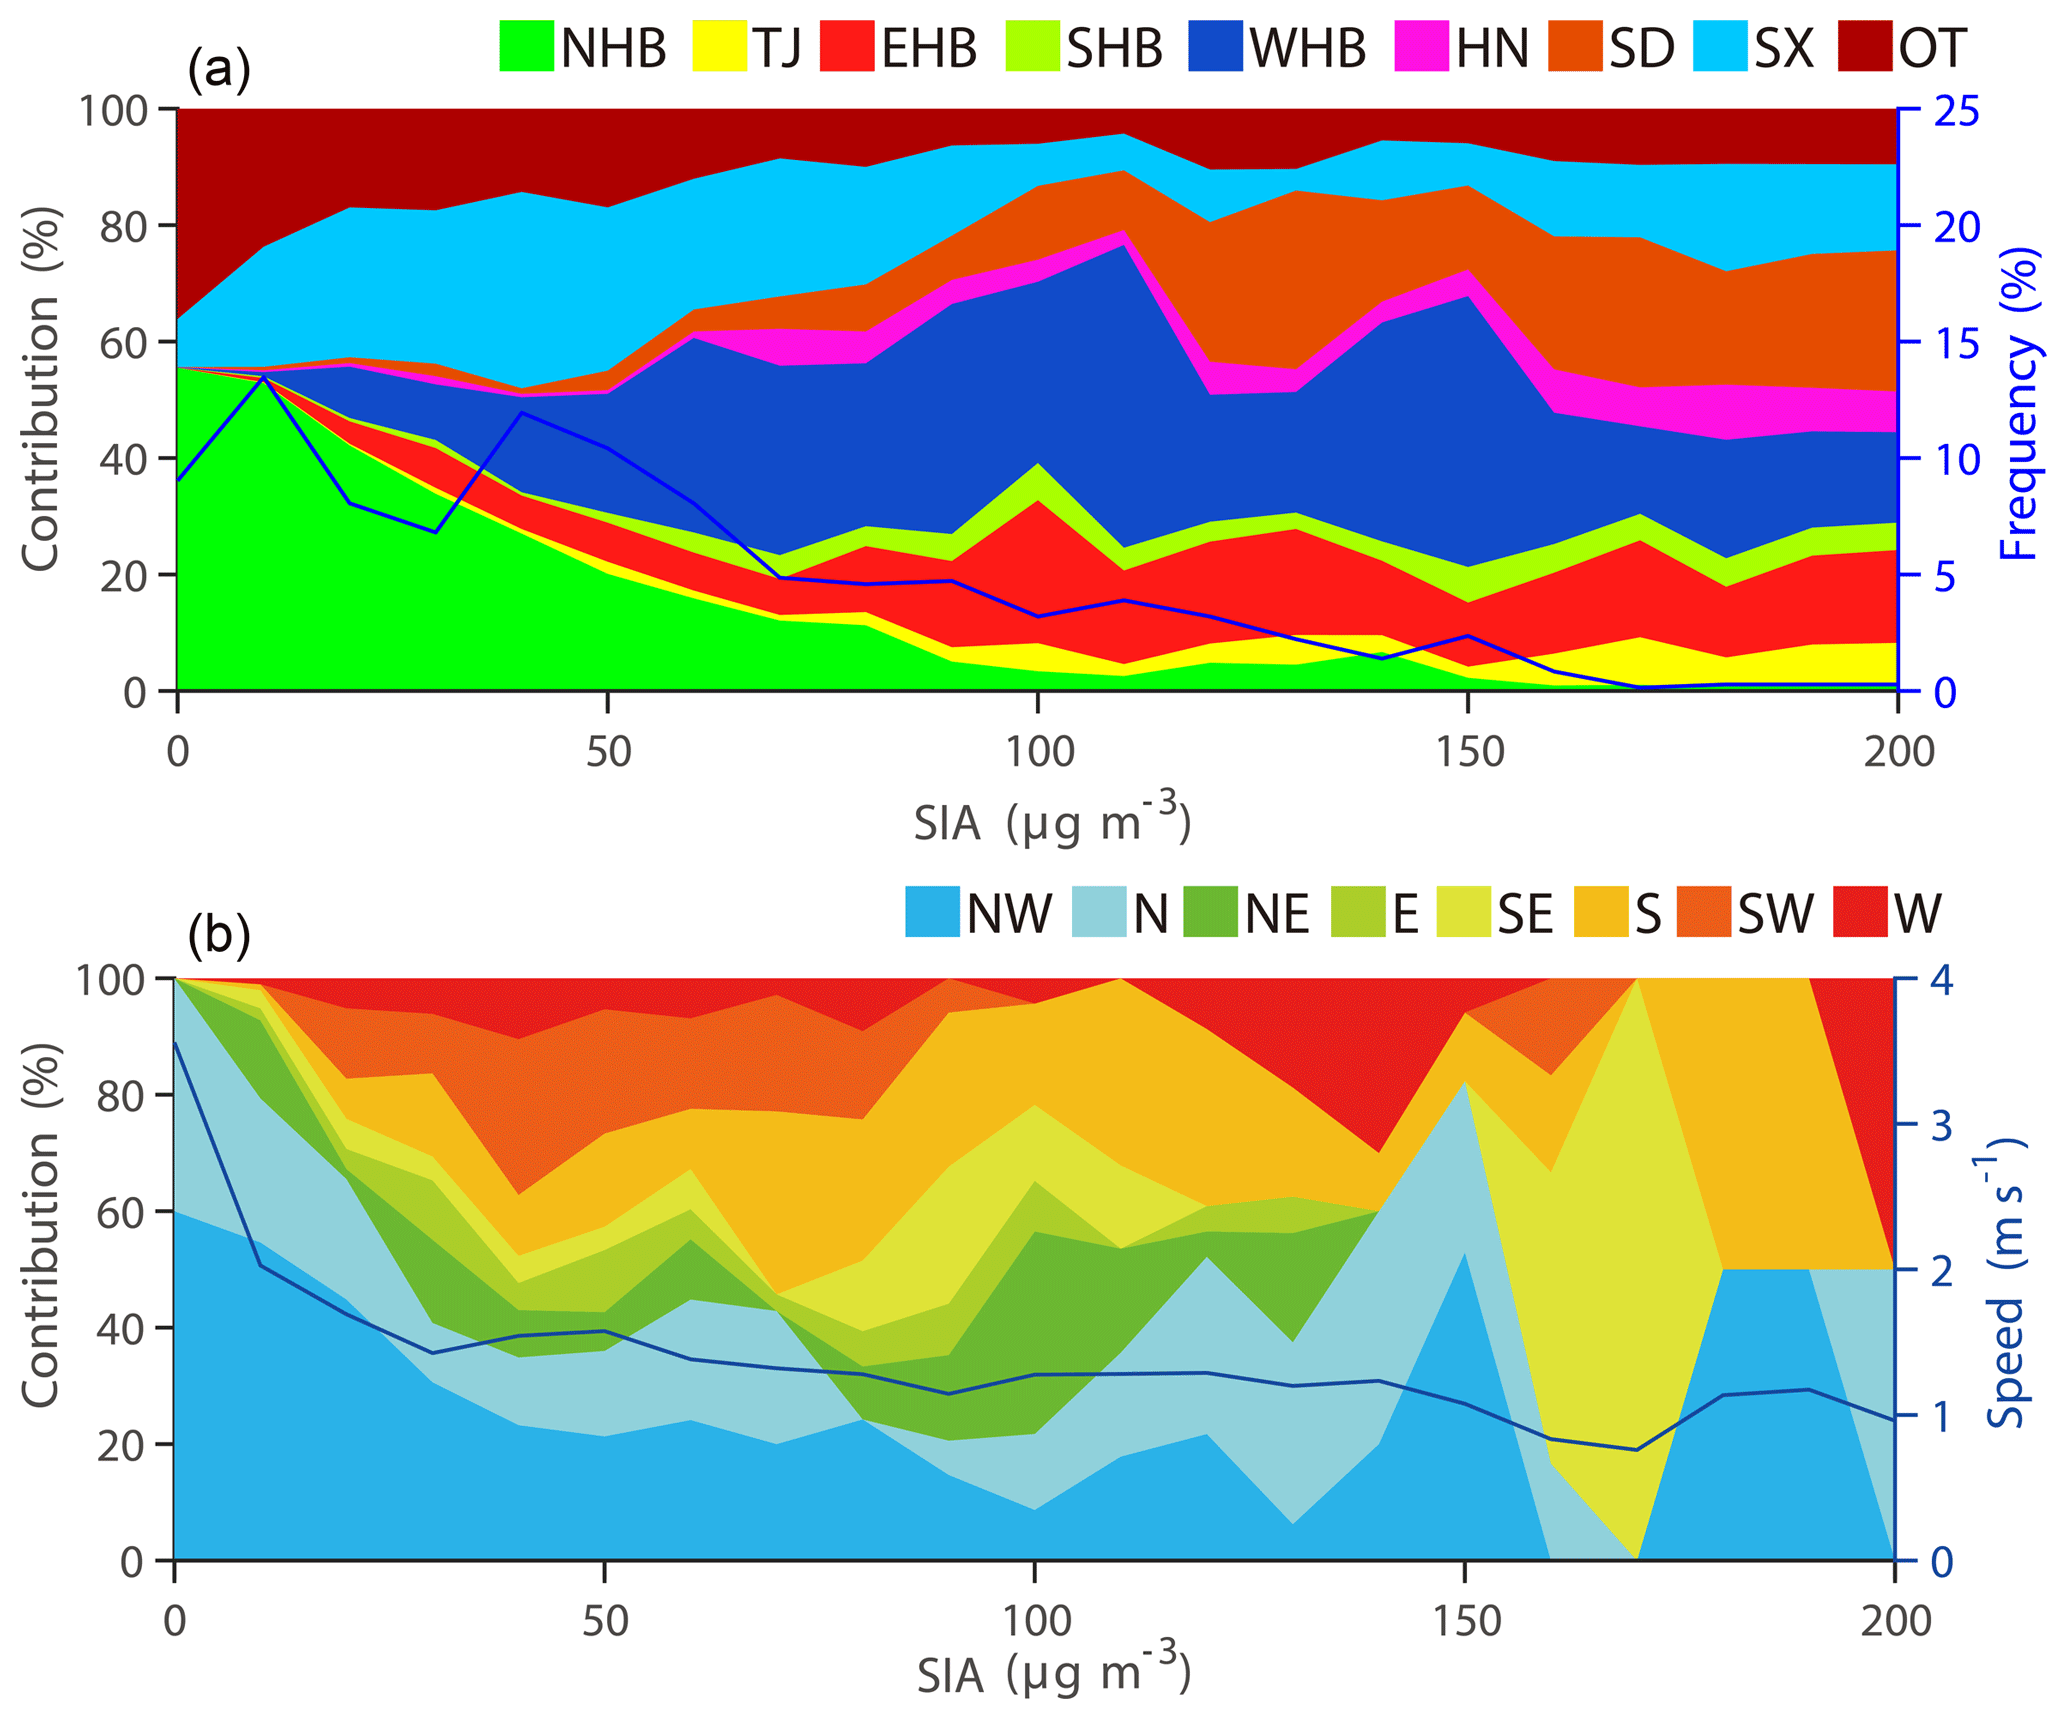
Figure 8(a) Relative contribution of regionally transported SIA under different pollution levels in Beijing during the whole study period. (b) Variation of wind direction under different pollution levels in Beijing during the whole study period.
Figure 8 presents the relative contribution of regionally transported SIA and variation of wind direction under different pollution levels in Beijing. The source regions varied considerably under different pollution levels. When Beijing is controlled by strong northerly winds, NHB and SX are the main source regions, contributing up to 30 % and 19 % to SIA, respectively, resulting in clean conditions (SIA < 50 µg m−3). When Beijing is mainly affected by southerly winds (southeast, south, and southwest), WHB, EHB, and SD become the main source regions, contributing 27 %, 13 % and 15 % to SIA, respectively. Strong emissions of source regions lead to heavier pollution in Beijing. When Beijing is dominated by weak southeasterly winds, the contributions from distant regions like HN and SD increase. Continuous transport and accumulation lead to severe pollution (SIA > 150 µg m−3). This indicates that wider regional emission control is necessary to reduce severe pollution.
4.2 The impact of regional transport of sulfate and its precursors in Beijing
Quantifying the impact of regional transport of sulfate and its precursors is a crucial task. Sun et al. (2014) considered sulfate formed outside Beijing as regionally transported sulfate, and they estimated that its contribution reached 75 % during winter haze episodes. By tagging emission regions of precursors in models and ignoring where secondary aerosols were formed, J. Li et al. (2017) and Timmermans et al. (2017) estimated the contribution of transport to be 40 %–50 %. These estimated contributions of regional transport are different in physical meaning, which may confuse policymakers. In this study, we divided the sulfate mass concentration in Beijing into four parts, LC, LTC, RLC, and RTC as described in Sect. 2.1. The regional transport defined by Sun et al. (2014) was LTC + RLC + RTC, whereas in the studies by J. Li et al. (2017) and Timmermans et al. (2017), it was RLC + RTC. In this study, we employed RLC + RTC as regional transport.

Figure 9(a) Sources of secondary sulfate in Beijing. (b) Variation of secondary sulfate sources with the surface sulfate concentration in Beijing for the whole study period. LC refers to sulfate locally produced from SO2 emitted in Beijing; LTC refers to sulfate chemically formed in regions outside of Beijing from SO2 emitted in Beijing; RTC is sulfate chemically formed along the transport pathway to Beijing from SO2 emitted in source regions outside Beijing; RLC is sulfate produced in regions outside Beijing from locally emitted SO2 and then transported to Beijing. PSO2 refers to particulate sulfate. Sections of the pie charts where the values are not specified represent values of less than 3 %.
Figure 9a shows the contributions of LC, LTC, RLC, and RTC to the daily average sulfate concentration in Beijing during the study period. RTC and LC were the dominant sources of sulfate, contributing 71 %–89 % in total. The contributions of RTC ranged from 29 % in Ep6 to 59 % in Ep2, and contributions of LC were 30 %–42 %. RTC dominated the regional transport over the whole period, which indicates that chemical conversions along the transport pathway of SO2 were critical to haze formation. Notably, the LTC contribution was comparable to that of LC in Ep3, Ep4, and Ep6. This suggests that the SO2 emitted in Beijing was blown away and formed sulfate outside Beijing, and recirculation of air masses can be supported by HYSPLIT trajectories (Fig. S6). Take trajectories at 23:00 on 12 December (LST), for example, air masses were blown away from Beijing by southwesterly winds, moved through Chengde, Tianjin, and Langfang, and finally traveled back to Beijing. These formed sulfates may have been blown back to Beijing under specific weather conditions and were previously considered regional transport. The contribution of LTC also largely explains the difference in estimated regional transport contributions between Sun et al. (2014) and J. Li et al. (2017). In the present study, LTC + RLC + RTC accounted for 58 %–70 % of the sulfate concentration in the six episodes, which is relatively similar to the estimation (75 %) of Sun et al. (2014), which was based on the observed hourly increase rate of the local sulfate concentration.
In the initial and subsequent pollution stages, LC, LTC, and RTC showed different patterns in Beijing. In Ep1, local contributions dominated before the sulfate concentration increased rapidly (15 and 16 November). In particular, sulfate blown back to Beijing from its local emissions (LTC) made a larger contribution (35 %) than RTC (25 %). In the rapid rising phase of sulfate (17 and 18 November), the contribution of RTC increased from 25 % to 47 %. LC was also significant and its contribution increased considerably from 37 % to 41 %. These two parts (LC and RTC) explained the rapid formation of sulfate in Beijing. This suggests that the joint control of local and regional SO2 emissions is essential to prevent the rapid formation of haze in this region, which is receiving considerable attention and eliciting widespread interest among researchers and policymakers (Sun et al., 2014; Ma et al., 2017; J. Li et al., 2017). This feature is also reflected in Fig. 9b. Under clear conditions (sulfate < 20 µg m−3), the local contributions (LC and LTC) were positively correlated with the sulfate mass concentration. In total, they contributed 40 %–60 % of the sulfate mass concentration. The ratio of LC to LTC was approximately 2 : 1. Under moderate sulfate levels (20 µg m−3 < sulfate < 35 µg m−3), the local contribution was lower – particularly the LTC – leading to a ratio of LC to LTC of approximately 8. The contribution of sulfate formed along the regional transport pathway (RTC) significantly increased from 40 % to 65 %. Under heavy pollution levels (> 35 µg m−3), the LC contributed up to 50 % due to extremely stable boundary layers. Our results are consistent with those of Ma et al. (2017), in which regional transport and local heterogeneous chemistry were qualitatively discovered to make high contributions to initial and subsequent pollution stages.
4.3 Evolution of aerosol properties in Beijing during haze episodes
Aerosol properties such as the particle size and the degree of aging can change dramatically on haze days due to fresh emissions, subsequent chemical conversions, and regional transport, which strongly affect regional radiation and climate (Cappa et al., 2012). As illustrated in Fig. 4b, the GMD of aerosols in Beijing increased remarkably to approximately 120 nm during the six haze episodes, compared with 50 nm under clean conditions. Two stages were identified: an initial rising stage and a sustained increase stage. In the initial stage, the GMD of aerosols increased by 50–60 nm over several hours, and the GMD then remained at 100–120 nm for several days in the subsequent elevated pollution stage. This GMD increase during the initial stage was mainly caused by the increase of accumulation-mode particles with diameters of 100–1000 nm and Aitken-mode particles (Fig. 10). Under clean conditions (SIA < 50 µg m−3), the average contributions of the three modes (nucleation, Aitken, and accumulation modes) to the number concentration were comparable, although the number of nucleation-mode particles decreased with SIA concentration. Under light to moderate pollution conditions (50 < SIA < 150 µg m−3), the proportion of accumulation-mode particles significantly increased from 35 % to 60 %, whereas the proportion of Aitken-mode particles slowly decreased. As discussed in previous sections, regional transport played a dominant role during the initial stage. This indicates that condensation, coagulation, and chemical transformation along the transport pathway increased the number of particles with a diameter in the range of 100–1000 nm. Finally, the contributions of Aitken-mode and accumulation-mode particles remained stable under heavy pollution conditions (SIA > 150 µg m−3).

Figure 10Variation of number concentration fraction of particles with SIA in Beijing during the whole study period.

Figure 11(a) Average and standard variation of the mass ratio of the coating of BC to BC (RBC) during different episodes and pollution levels. (b) Diurnal cycles of RBC under different pollution levels. (c) Temporal variation of RBC during study period. “Ave” refers to the average over the whole study period.
Aging processes play a critical role in the growth of particles during haze episodes. According to observations, a significant coating of secondary components was found on BC in the study period (Wang et al., 2019). Figure 11 presents a time series of the simulated RBC, which is a favorable indicator of the degree of aging (Oshima et al., 2009; Collier et al., 2018). A higher RBC indicates that BC has undergone more ageing. In this study, the simulated RBC was 2–10, with an average value of 4.5. Under polluted conditions, the RBC was higher than under clean conditions, with an average value of 5.0. RBC in Beijing even exceeded 10.0 during some extremely severe pollution events, which is close to observations of remote sites (J. Wang et al., 2017; Massoli et al., 2015) and aged particles (Cappa et al., 2012). Urban aerosols usually have a lower RBC owing to fresh emissions, and the high RBC values in this study indicate that Beijing aerosol particles were more aged during the haze episodes. On clean days, RBC values ranged from 2 to 5, with an average of 2.8. This is similar to the RBC of vehicle emissions (< 3) (Liu et al., 2017), indicating that Beijing is affected by local emission. Vehicle emissions contributed 70 % of BC in downtown Beijing in 2016 after strict controls on coal burning had been implemented (Kebin He, personal communication, 2016).
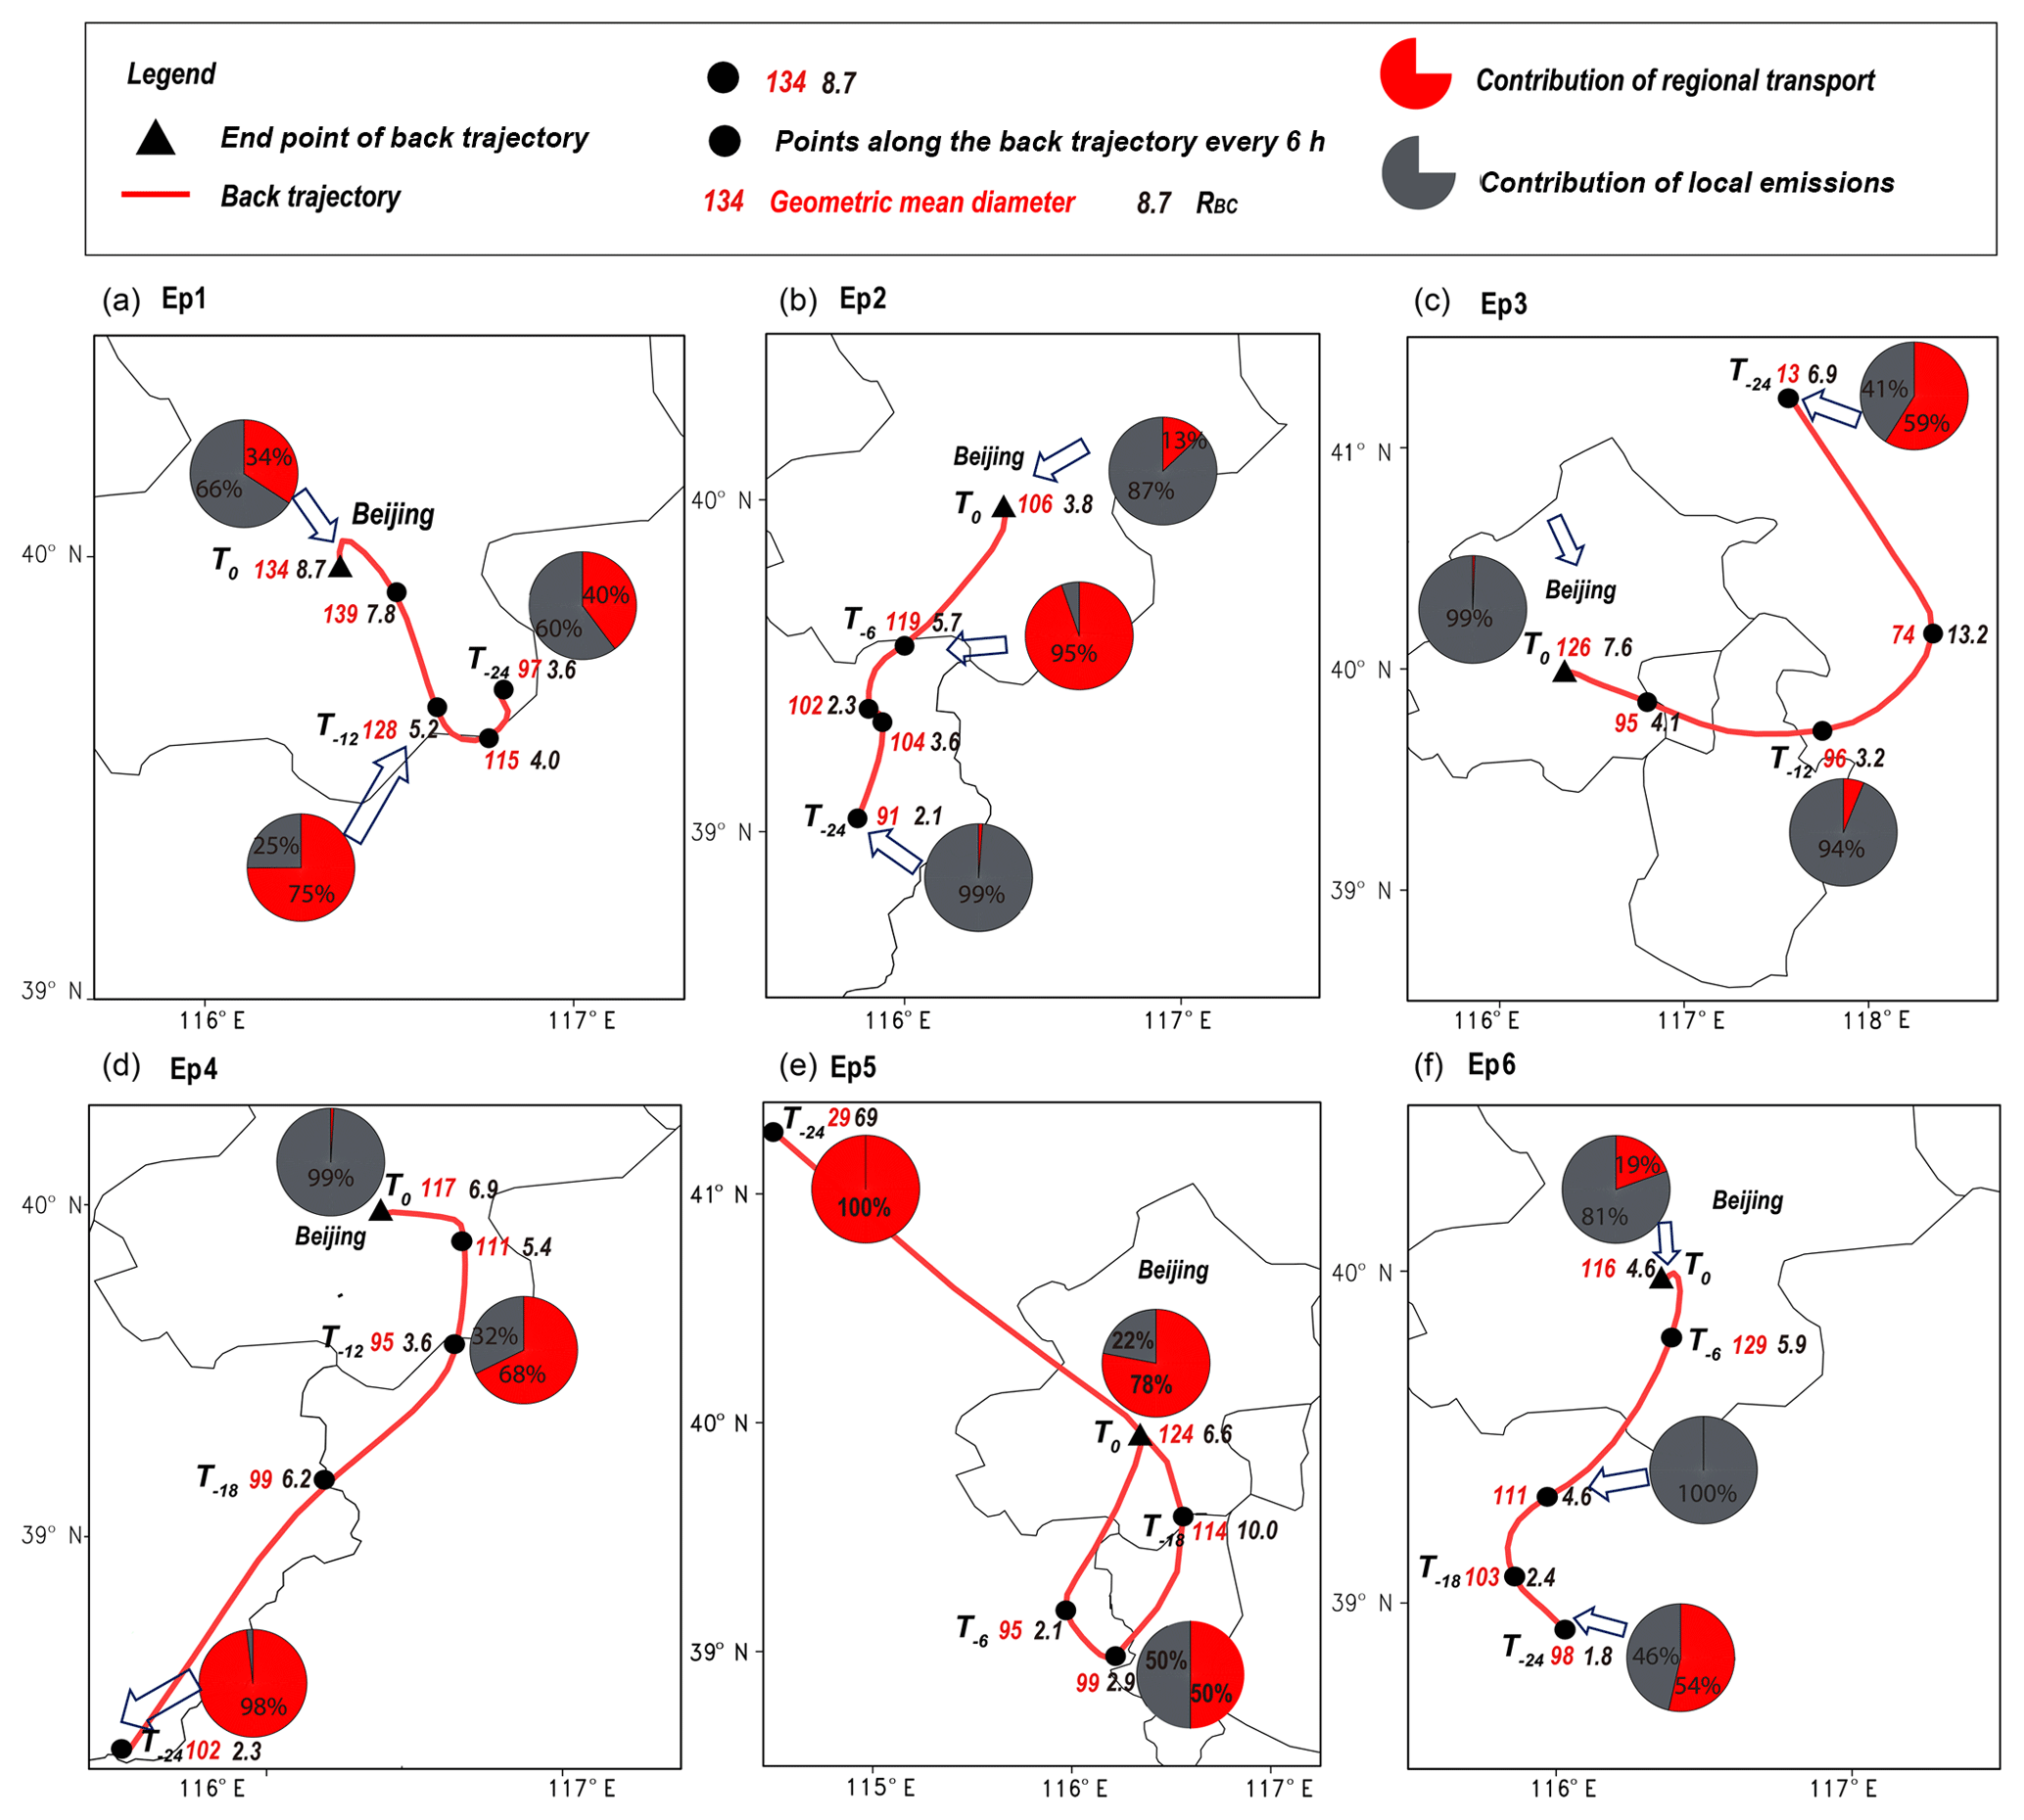
Figure 12Variation of aerosol properties along transport pathways. Panels (a–f) refer to Ep1–Ep6. The red lines refer to 24 h backward trajectories at an altitude of 100 m. Aerosol properties include the geometric mean diameter (GMD; in nanometers – the red numbers beside the solid blocks), the mass ratio of the coating of BC to BC (RBC; an indicator of the degree of aging – represented by the black numbers beside the solid blocks), the regional sources of BC (shown by the pie charts – red represents regional transport and gray is the local contribution). Solid black triangles denote the end points of back trajectories, referred to as T0. Solid black circles denote points along trajectories per 6 h. T−6, T−12, T−18, and T−24 denote 6, 12, 18, and 24 h before arriving at the end point. End times of back trajectories are before pollution peaks at 21:00 on 18 November, 22:00 on 25 November, 16:00 on 29 November, 22:00 on 3 December, 00:00 on 8 December, and 22:00 on 11 December (LST), respectively. Sections of the pie charts where the values are not specified represent values of less than 6 %.
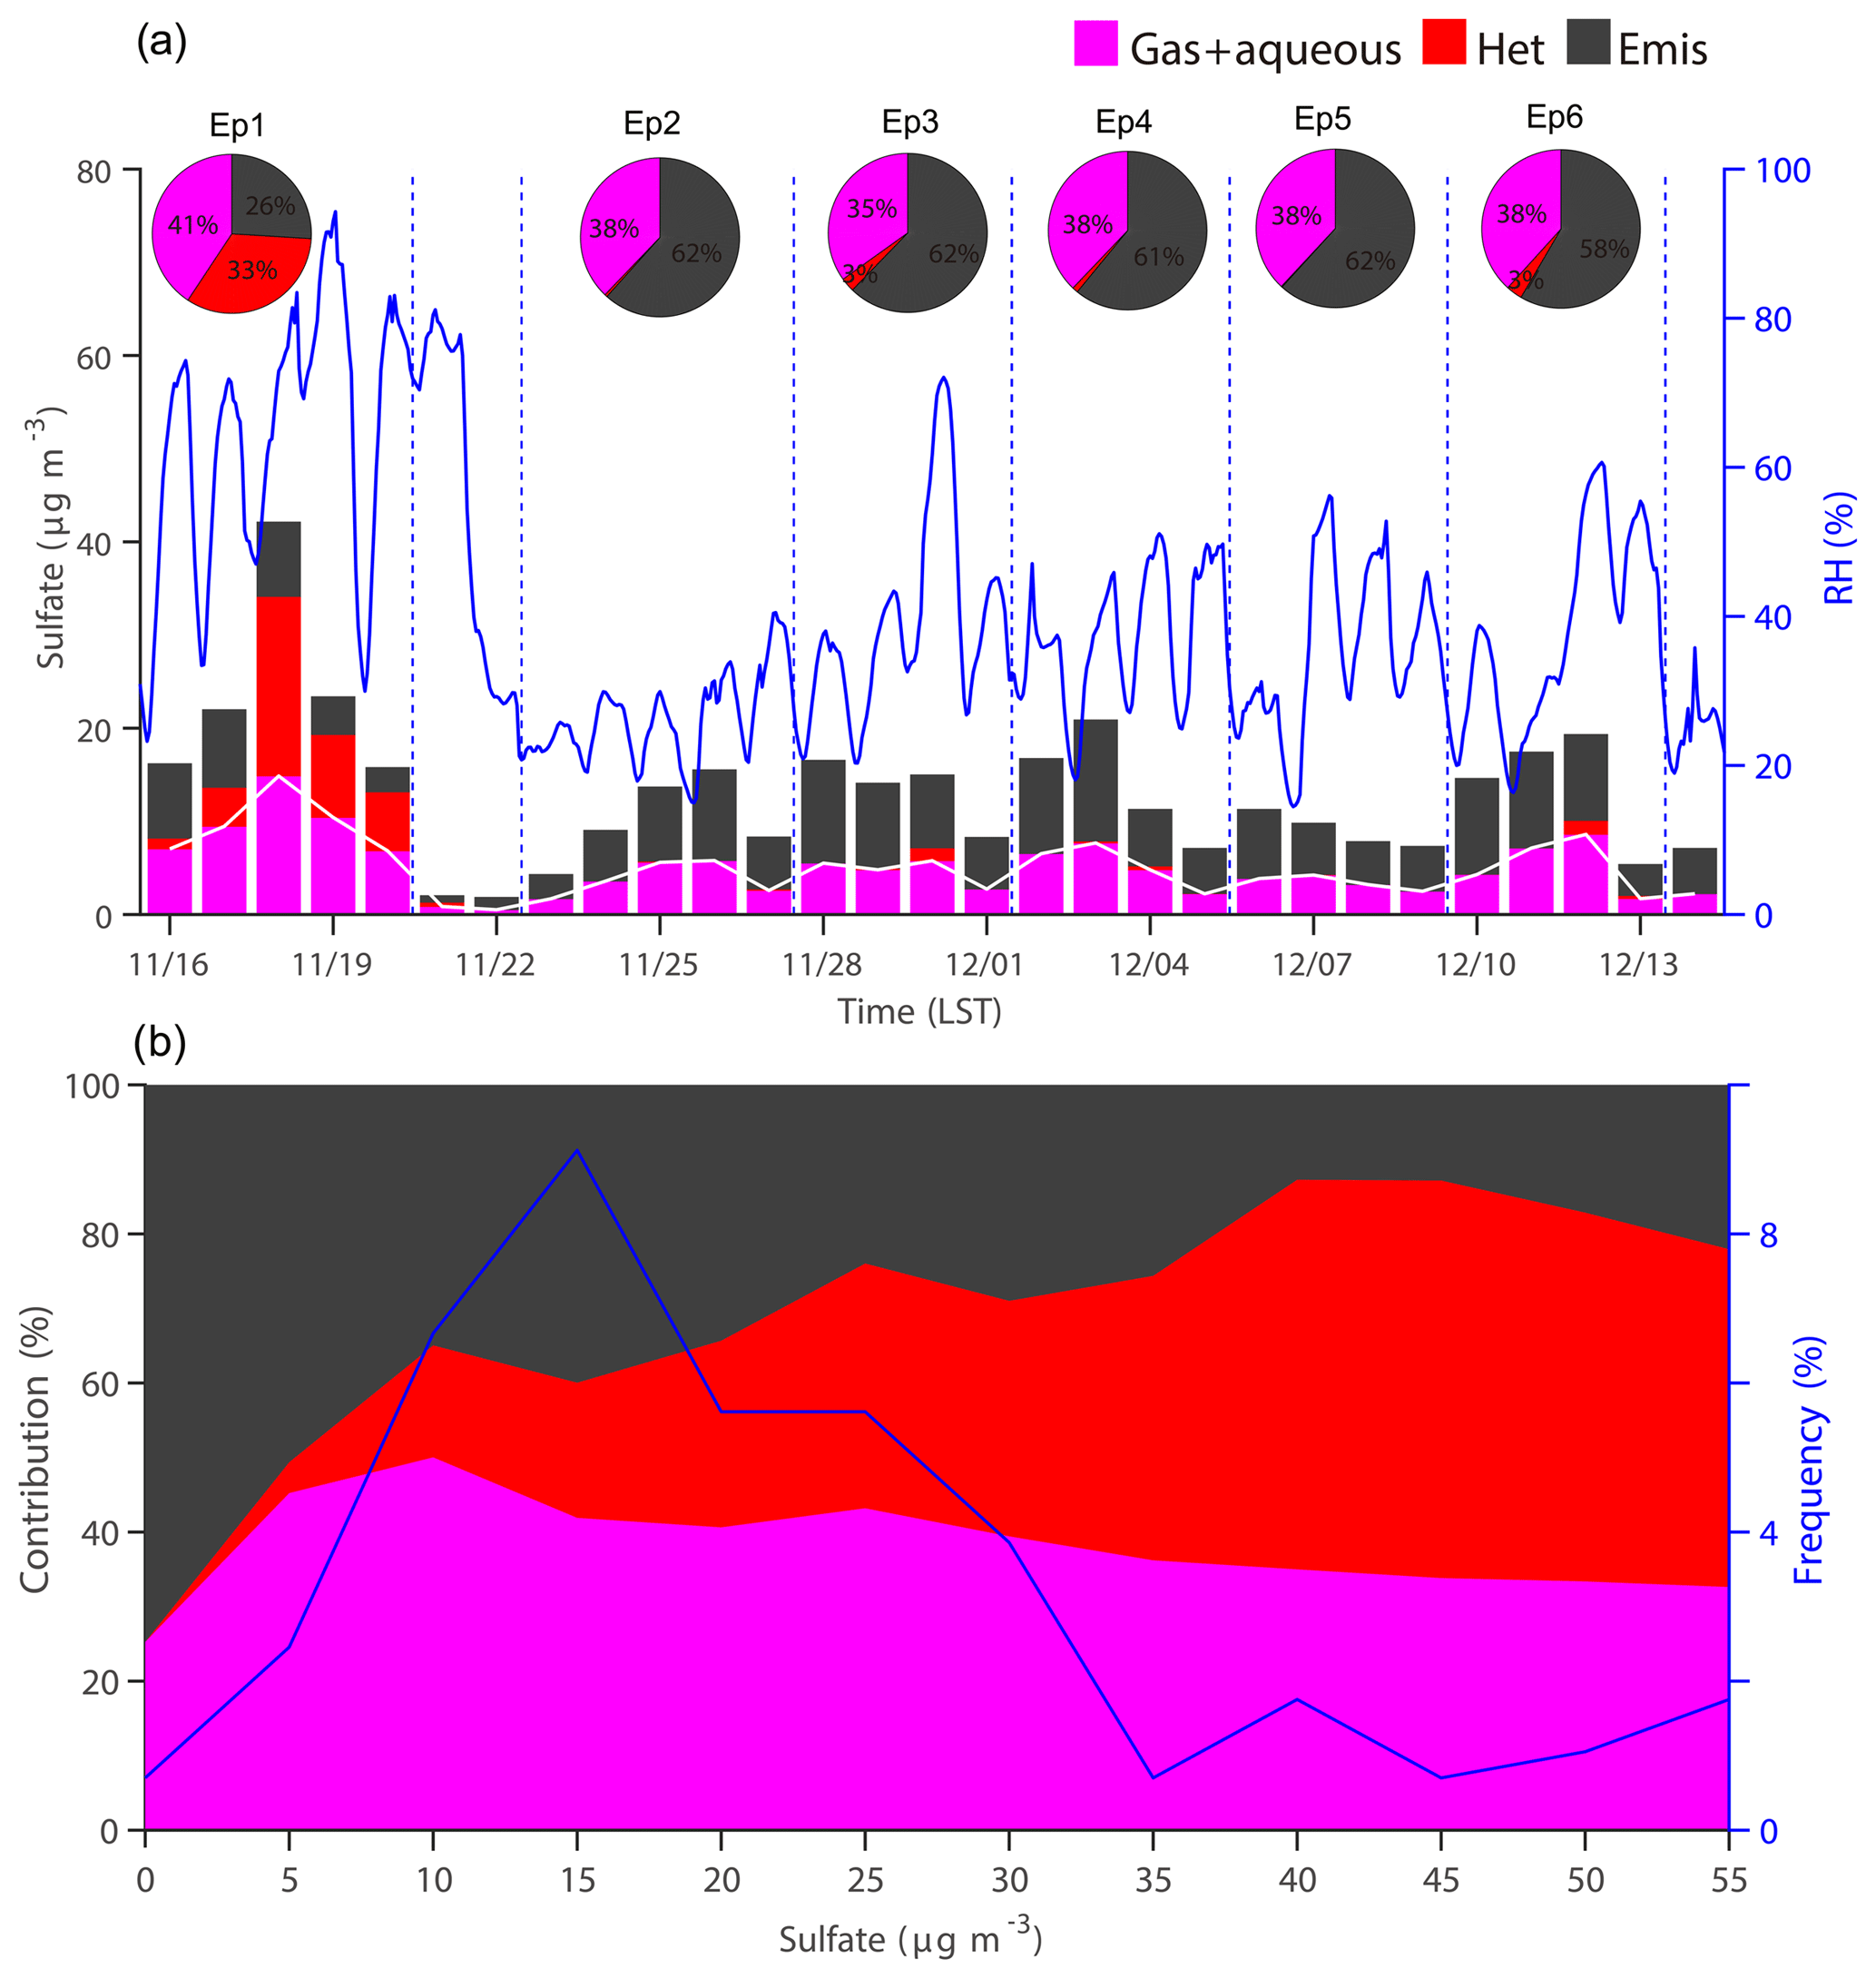
Figure 13The contribution of different formation pathways for sulfate in Beijing. (a) The daily average. The blue line shows relative humidity in Beijing. The pie charts show the average contribution of different pathways during each episode. (b) The relationship between the sulfate concentration and different formation pathways of sulfate during Ep1. “Het” refers to the contribution of heterogenous chemistry of SO2, and “Emis” refers to the contribution of primary sulfate. Sections of the pie charts where the values are not specified represent values of less than 3 %.
Figure 12 shows the evolution of RBC, GMD, and regional sources of BC along the transport pathway from the source region to Beijing during the six haze episodes. Aerosol properties including number concentration along the transport pathway per 6 h are shown in Table S2. The transport pathway was calculated using the HYSPLIT model. The figure clearly shows that the aerosol properties changed considerably along the transport pathway. In Ep1, the GMD of aerosols was only 97 nm at the initial site of the 24 h back trajectory (T−24). At a larger transport distance, the diameters of aerosol particles were markedly increased to 128 nm in the middle (T−12) and 134 nm at the final site (T0) of the back trajectory. RBC increased from 3.6 at T−24 to 8.7 in Beijing (T0) as BC was coated during the transport. This indicates that BC underwent considerable aging and increased in size while moving along the transport pathway. Similar characteristics were discovered for Ep3–Ep6. In Ep3, Ep4, Ep5, and Ep6, the GMD in Beijing (T0) was 126, 117, 124, and 116 nm, respectively, compared with 96, 95, 99, and 111 nm mid-transport (T−12). RBC also increased to between 4.6 and 7.6. Ep2 was an exception, as the GMD (106 nm) and RBC (3.8) at the final end point (Beijing, T0) were lower than those 6 h prior (T−6). Regional transport contributed 95 % of BC at T−6, whereas local emissions accounted for 87 % of BC at T0. The number concentration was smaller at T−6 than at T0. Therefore, we conclude that regional transport of aged aerosols led to a high GMD at T−6, and that the addition of locally emitted fresh air caused a high number concentration but low GMD at T0. In clean areas, such as at T−24 in Ep5, the RBC was higher than 10 and the GMD was considerably smaller.
4.4 Impact of heterogeneous chemistry on sulfate mass concentration
Current models generally account for a part of the observed concentrations in China (Y. Wang et al., 2014). Heterogeneous chemistry on aerosol surfaces under high relative humidity has been considered a potential missing source of sulfate formation (Cheng et al., 2016; Zheng et al., 2015; G. Li et al., 2017; M. J. Tang et al., 2016). Li et al. (2018) developed a simple parameterization of heterogeneous chemistry and discovered that SO2 uptake on aerosols partly closed the gap between simulation results and observations. In their study, uptake coefficients were dependent on the aerosol core and shell species, shell thickness, and the amount of aerosol liquid water. Zheng et al. (2013) and Yang (2014) measured local source profiles, and they reported that primary sulfate from industry and power plants accounted for a large fraction of PIA. Researchers also found that household coal burning can emit a certain amount of sulfate (Zhang et al., 2018).
In this study, we examined the contributions of gas (SO2+OH) and aqueous chemistry, heterogeneous chemistry, and primary sulfate emissions to the sulfate mass concentration in Beijing (Fig. 13). In Ep1, under high relative humidity, the contribution of heterogeneous chemistry was 33 %. Primary emissions mostly exerted an effect under light to moderate pollution levels (sulfate < 20 µg m−3), whereas heterogeneous chemistry played a crucial role under high pollution levels (sulfate > 30 µg m−3). The contributions of gas and aqueous chemistry were largely consistent under all pollution conditions (∼ 30 %). This indicates that high relative humidity and aerosol loading accelerated the SO2 chemical transformation. Interestingly, the contribution of heterogeneous chemistry was markedly higher when the sulfate mass concentration exceeded the threshold of 20 µg m−3. Under high relative humidity and mass concentration conditions, a higher aerosol surface area resulting from hygroscopic growth and haze particles under high RH (60 %–80 %) with an aqueous shell due to phase transition provided a favorable media for heterogeneous reactions (Tie et al., 2017; Sun et al., 2018). The aforementioned threshold is relatively similar to that during the haze episodes in the winter of 2013 (Li et al., 2018). For policymakers, implementing measures to prevent the sulfate concentration from exceeding this threshold is essential. Such measures would be effective for avoiding extremely high sulfate levels. In other episodes, heterogeneous chemistry was depressed because of the low relative humidity (< 70 %). Gas and aqueous chemistry and primary emissions contributed 35 %–40 % and 58 %–61 %, respectively. It should be noted that failure of the model to simulate mineral dust led to an underestimation of the sulfate level in Ep2. The interaction between SO2 and alkaline dust can contribute considerably to the sulfate concentration.
The contributions of regional transport to haze episodes over a megacity cluster centered on Beijing have been under debate in recent decades. Investigating the evolution of aerosol properties along the transport pathway may provide more information regarding how researchers can improve the accuracy of regional transport and chemistry impact assessments. To address one of the aims of the APHH 2016 winter campaign, we employed a Eulerian chemical transport model (NAQPMS) and a Lagrangian trajectory model (HYSPLIT) to assess the evolution of aerosols – in terms of the number concentration, size distribution, and degree of aging – in Beijing during six haze episodes between 15 November and 15 December 2016. The transport of sulfate and its precursors was also quantitatively investigated.
The results demonstrated that regional transport contributed 14 %–31 % to the surface PM2.5 mass concentration in Beijing during the six episodes, with a monthly average contribution of 26 %. Regarding aerosol components, 30 %–62 % of the SIA in Beijing was regionally transported, whereas little PIA (< 10 %) was contributed by emissions from other regions. Source regions differed between episodes. During high pollution periods, WHB, SD, and EHB were the main source regions of SIA regionally transported to Beijing, whereas NHB and SX made greater contributions under clean and light pollution conditions. This indicates the complexity of regional transport in this megacity cluster.
The chemical transformation of SO2 along the transport pathway from source regions outside of Beijing to Beijing (RTC) was the major source of regional transport and was more critical than the transport of sulfate formed in source regions outside Beijing (RLC). Compared with sulfate that was chemically transformed from SO2 emitted in Beijing and then blown back to Beijing (LTC), the contribution of sulfate produced in Beijing from SO2 emitted in Beijing (LC) was generally greater. However, RTC markedly increased in some episodes and explained the rapid formation of sulfate in Beijing. This suggests that the joint control of local and regional SO2 emissions is essential to reduce the rapid formation of haze in this region.
Aerosols became considerably aged during transport in haze episodes, which altered the RBC and the size distribution of number concentrations. During haze episodes, the GMD increased from less than 100 nm at the initial site to approximately 120 nm at the final site (Beijing), and the RBC increased from 2–4 to 4–8. The number of accumulation-mode particles with a diameter between 100 and 1000 nm increased considerably more than the number of particles of different modes. The RBC in Beijing during the episodes was higher than that in other urban regions (Collier et al., 2018). At high pollution levels, the RBC was close to that observed in remote regions (J. Wang et al., 2017), which indicates that BC in Beijing under polluted conditions was more aged and thus more likely to affect radiation and circulation.
Contributions from different pathways to sulfate in Beijing were also examined. In episodes with high humidity (Ep1), the average contributions of gas and aqueous chemistry, heterogeneous chemistry, and primary sulfate were comparable; however, their relative contributions varied with pollution levels. Under light to moderate pollution levels, primary emissions mostly had an effect; however, under high pollution levels during Ep1, heterogeneous chemistry played a relatively crucial role. In other episodes (Ep2, Ep3, Ep4, Ep5, and Ep6), gas and aqueous chemistry and primary emissions contributed 35 %–40 % and 58 %–61 %, respectively.
The simulation data in this study are available from the corresponding author upon request (lijie8074@mail.iap.ac.cn).
The supplement related to this article is available online at: https://doi.org/10.5194/acp-19-9351-2019-supplement.
HD and JL conceived the study and designed the experiments. HD performed all of the model runs, carried out the analysis, and wrote the paper. JL prepared the emissions data and contributed to writing the paper. ZW and XC contributed to the model development. YS, PF, JJL, and JG provided observation data. YW contributed to data processing. All authors discussed the paper.
The authors declare that they have no conflict of interest.
This article is part of the special issue “In-depth study of air pollution sources and processes within Beijing and its surrounding region (APHH-Beijing) (ACP/AMT inter-journal SI)”. It is not associated with a conference.
Many thanks to the anonymous reviewers for their helpful comments that improved our paper. This work was supported by the Natural Science Foundation of China (grant nos. 41571130034, 91544227, 91744203, 41225019, and 41705108) and the Chinese Ministry of Science and Technology (grant nos. 2018YFC0213205 and 2017YFC0212402).
This research has been supported by the National Natural Science Foundation of China (grant nos. 41571130034, 91544227, 91744203, 41225019, and 41705108) and the Chinese Ministry of Science and Technology (grant nos. 2018YFC0213205 and 2017YFC0212402).
This paper was edited by James Allan and reviewed by two anonymous referees.
Anderson, H. R., Atkinson, R., Balbus, J., Brauer, M., Chapman, R., and Chowdhury, Z.: Outdoor Air Pollution and Health in the Developing Countries of Asia: A Comprehensive Review, Special Report 18, Health Effects Institute, Boston, MA, 2010.
Bian, Y. X., Zhao, C. S., Ma, N., Chen, J., and Xu, W. Y.: A study of aerosol liquid water content based on hygroscopicity measurements at high relative humidity in the North China Plain, Atmos. Chem. Phys., 14, 6417–6426, https://doi.org/10.5194/acp-14-6417-2014, 2014.
Boylan, J. W. and Russell, A. G.: PM and light extinction model performance metrics, goals, and criteria for three-dimensional air quality models, Atmos. Environ., 40, 4946–4959, https://doi.org/10.1016/j.atmosenv.2005.09.087, 2006.
Cao J.: PM2.5 and environment, Science Press, 2014.
Cappa, C. D., Onasch, T. B., Massoli, P., Worsnop, D. R., Bates, T. S., Cross, E. S., Davidovits, P., Hakala, J., Hayden, K. L., Jobson, B. T., Kolesar, K. R., Lack, D. A., Lerner, B. M., Li, S. M., Mellon, D., Nuaaman, I., Olfert, J. S., Petaja, T., Quinn, P. K., Song, C., Subramanian, R., Williams, E. J., and Zaveri, R. A.: Radiative Absorption Enhancements Due to the Mixing State of Atmospheric Black Carbon, Science, 337, 1078–1081, https://doi.org/10.1126/science.1223447, 2012.
Chen, X., Wang, Z., Li, J., and Yu, F.: Development of a regional chemical transport model with size-resolved aerosol microphysics and its application on aerosol number concentration simulation over china, Sola, 10, 83–87, https://doi.org/10.2151/sola.2014-017, 2014.
Chen, X., Wang, Z., Yu, F., Pan, X., Li, J., and Ge, B., Wang, Z., Hu, M., Yang, W. Y., and Chen, H. S.: Estimation of atmospheric aging time of black carbon particles in the polluted atmosphere over central-eastern china using microphysical process analysis in regional chemical transport model, Atmos. Environ., 163, 44–56, https://doi.org/10.1016/j.atmosenv.2017.05.016, 2017.
Chen, X., Li, X., Yuan, X., Zeng, G., Liang, J., Li, X., Xu, W., Luo, Y., and Chen, G: Effects of human activities and climate change on the reduction of visibility in Beijing over the past 36 years, Environ. Int., 116, 92–100, https://doi.org/10.1016/j.envint.2018.04.009, 2018.
Cheng, Y., Zheng, G., Wei, C., Mu, Q., Zheng, B., Wang, Z., Gao, M., Zhang, Q., He, K. B., Carmichael, G., Poschl, U., and Su, H.: Reactive nitrogen chemistry in aerosol water as a source of sulfate during haze events in china, Sci. Adv., 2, e1601530, https://doi.org/10.1126/sciadv.1601530, 2016.
Collier, S., Williams, L. R., Onasch, T. B., Cappa, C. D., Zhang, X., and Russell, L. M., ., Chen, C. L., Sanchez, K. J., Worsnop, D. R., and Zhang, Q.: Influence of emissions and aqueous processing on particles containing black carbon in a polluted urban environment: insights from a soot particle-aerosol mass spectrometer, J. Geophys. Res.-Atmos., 123, 6648–6666, https://doi.org/10.1002/2017jd027851, 2018.
Draxler, R. R. and Hess, G. D: An overview of the HYSPLIT 4 modeling system for trajectories, dispersion, and deposition, Aust. Meteorol. Mag., 47, 295–308, 1998.
Du, W., Zhao, J., Wang, Y., Zhang, Y., Wang, Q., Xu, W., Chen, C., Han, T., Zhang, F., Li, Z., Fu, P., Li, J., Wang, Z., and Sun, Y.: Simultaneous measurements of particle number size distributions at ground level and 260 m on a meteorological tower in urban Beijing, China, Atmos. Chem. Phys., 17, 6797–6811, https://doi.org/10.5194/acp-17-6797-2017, 2017.
Gao, J., Peng, X., Chen, G., Xu, J., Shi, G. L., Zhang, Y. C., and Feng, Y. C.: Insights into the chemical characterization and sources of PM2.5 in Beijing at a 1-h time resolution, Sci. Total Environ., 542, 162–171, https://doi.org/10.1016/j.scitotenv.2015.10.082, 2016.
Han, B., Zhang, R., Yang, W., Bai, Z., Ma, Z., and Zhang, W: Heavy haze episodes in Beijing during January 2013: inorganic ion chemistry and source analysis using highly time-resolved measurements from an urban site, Sci. Total Environ., 544, 319–329, https://doi.org/10.1016/j.scitotenv.2015.10.053, 2016.
Huang, R. J., Zhang, Y., Bozzetti, C., Ho, K. F., Cao, J. J., Han, Y., Daellenbach, K. R., Slowik, J. G., Platt, S. M., Canonaco, F., Zotter, P., Wolf, R., Pieber, S. M., Bruns, E. A., Crippa, M., Ciarelli, G., Piazzalunga, A., Schwikowski, M., Abbaszade, G., Schnelle-Kreis, J., Zimmermann, R., An, Z., Szidat, S., Baltensperger, U., El Haddad, I., and Prevot, A. S: High secondary aerosol contribution to particulate pollution during haze events in China, Nature, 514, 218–222, https://doi.org/10.1038/nature13774, 2014.
Hyslop, N. P.: Impaired visibility: the air pollution people see, Atmos. Environ., 43, 182–195, https://doi.org/10.1016/j.atmosenv.2008.09.067, 2009.
Lee, A. K. Y., Chen, C.-L., Liu, J., Price, D. J., Betha, R., Russell, L. M., Zhang, X., and Cappa, C. D.: Formation of secondary organic aerosol coating on black carbon particles near vehicular emissions, Atmos. Chem. Phys., 17, 15055–15067, https://doi.org/10.5194/acp-17-15055-2017, 2017.
Li, G., Bei, N., Cao, J., Huang, R., Wu, J., Feng, T., Wang, Y., Liu, S., Zhang, Q., Tie, X., and Molina, L. T.: A possible pathway for rapid growth of sulfate during haze days in China, Atmos. Chem. Phys., 17, 3301–3316, https://doi.org/10.5194/acp-17-3301-2017, 2017.
Li, J. and Han, Z.: A modeling study of severe winter haze events in Beijing and its neighboring regions, Atmos. Res., 170, 87–97, https://doi.org/10.1016/j.atmosres.2015.11.009, 2016.
Li, J., Wang, Z., Zhuang, G., Luo, G., Sun, Y., and Wang, Q.: Mixing of Asian mineral dust with anthropogenic pollutants over East Asia: a model case study of a super-duststorm in March 2010, Atmos. Chem. Phys., 12, 7591–7607, https://doi.org/10.5194/acp-12-7591-2012, 2012.
Li, J., Wang, Z., Huang, H., Hu, M., Meng, F., Sun, Y., Wang, X., Wang, Y., and Wang, Q: Assessing the effects of trans-boundary aerosol transport between various city clusters on regional haze episodes in spring over east china, Tellus, 65, 60–73, https://doi.org/10.3402/tellusb.v65i0.20052, 2013. Li, J., Yang, W. Y., Wang, Z. F., Chen, H. S., Hu, B., Li, J. J., Sun, Y. L., and Huang, Y.: A modeling study of source–receptor relationships in atmospheric particulate matter over northeast Asia, Atmos. Environ., 91, 40–51, https://doi.org/10.1016/j.atmosenv.2014.03.027, 2014.
Li, J., Du, H., Wang, Z., Sun, Y., Yang, W., Li, J., Tang, X., and Fu, P.: Rapid formation of a severe regional winter haze episode over a mega-city cluster on the North China Plain, Environ. Pollut., 223, 605–615, https://doi.org/10.1016/j.envpol.2017.01.063, 2017. Li, J., Chen, X., Wang, Z., Du, H., Yang, W., Sun, Y., Hu, B., Li, J., Wang, W., Wang, T., Fu, P., and Huang, H.: Radiative and heterogeneous chemical effects of aerosols on ozone and inorganic aerosols over east Asia, Sci. Total Environ., 622–623, 1327–1342, https://doi.org/10.1016/j.scitotenv.2017.12.041, 2018.
Li, P., Yan, R., Yu, S., Wang, S., Liu, W., and Bao, H.: Reinstate regional transport of PM2.5 as a major cause of severe haze in Beijing, P. Natl. Acad. Sci. USA, 112, E2739–E2740, https://doi.org/10.1073/pnas.1502596112, 2015.
Liu, D., Whitehead, J., Alfarra, M. R., Reyes-villegas, E., Spracklen, D. V., Reddington, C. L., Kong, S. F., Williams, P. I., Ting, Y. C., Haslett, S., Taylor, J. W., Flynn, M. J., Morgan, W. T., McFiggans, G., Coe, H., and Allan, J. D.: Black-carbon absorption enhancement in the atmosphere determined by particle mixing state, Nat. Geosci., 10, 184–188, https://doi.org/10.1038/ngeo2901, 2017.
Liu, X. G., Zhang, Y. H., Jung, J. S., Gu, J. W., Li, Y. P., Guo, S., Chang, S. Y., Yue, D. L., Lin, P., Kim, Y. J., Hu, M., Zeng, L. M., and Zhu, T.: Research on the hygroscopic properties of aerosols by measurement and modeling during CAREBeijing-2006, J. Geophys. Res.-Atmos., 114, 4723–4734, https://doi.org/10.1029/2008jd010805,2009.
Ma, Q., Wu, Y., Zhang, D., Wang, X., Xia, Y., Liu, X., Tian, P., Han, Z., Xia, X., Wang, Y., and Zhang, R.: Roles of regional transport and heterogeneous reactions in the PM2.5 increase during winter haze episodes in Beijing, Sci. Total Environ., 599–600, 246–253, https://doi.org/10.1016/j.scitotenv.2017.04.193, 2017.
Ma, X. and Yu, F.: Seasonal variability of aerosol vertical profiles over east us and west Europe: GEOS-Chem/APM simulation and comparison with CALIPSO observations, Atmos. Res., 140–141, 28–37, https://doi.org/10.1016/j.atmosres.2014.01.001, 2014.
Ma, Z., Liang, Y. P., and Zhang, J.: PM2.5 profiles of typical sources in Beijing, Acta Sci. Circumstantiae, 35, 4043–4052, https://doi.org/10.13671/j.hjkxxb.2015.0584, 2015.
Massoli, P., Onasch, T. B., Cappa, C. D., Nuamaan, I., Hakala, J., Hayden, K., Li, S. M., Sueper, D. T., Bates, T. S., Quinn, P. K., Jayne, J. T., and Worsnop, D. R.: Characterization of black carbon containing particles from soot particle aerosol mass spectrometer measurements on the R/V Atlantis during CalNex 2010, J. Geophys. Res.-Atmos., 120, 2575–2593, https://doi.org/10.1002/2014jd022834, 2015.
Morgan, W. T., Ouyang, B., Allan, J. D., Aruffo, E., Di Carlo, P., Kennedy, O. J., Lowe, D., Flynn, M. J., Rosenberg, P. D., Williams, P. I., Jones, R., McFiggans, G. B., and Coe, H.: Influence of aerosol chemical composition on N2O5 uptake: airborne regional measurements in northwestern Europe, Atmos. Chem. Phys., 15, 973–990, https://doi.org/10.5194/acp-15-973-2015, 2015.
Nenes, A., Pandis, S. N., and Pilinis, C.: ISORROPIA: A new thermodynamic equilibrium model for multiphase multicomponent inorganic aerosols, Aquat. Geochem., 4, 123–152, https://doi.org/10.1023/A:1009604003981, 1998.
Oshima, N., Koike, M., Zhang, Y., Kondo, Y., Moteki, N., Takegawa, N., and Miyazaki Y.: Aging of black carbon in outflow from anthropogenic sources using a mixing state resolved model: model development and evaluation, J. Geophys. Res.-Atmos., 114, D06210, https://doi.org/10.1029/2008jd010680, 2009.
Pan, X., Ge, B., Wang, Z., Tian, Y., Liu, H., Wei, L., Yue, S., Uno, I., Kobayashi, H., Nishizawa, T., Shimizu, A., Fu, P., and Wang, Z.: Synergistic effect of water-soluble species and relative humidity on morphological changes in aerosol particles in the Beijing megacity during severe pollution episodes, Atmos. Chem. Phys., 19, 219–232, https://doi.org/10.5194/acp-19-219-2019, 2019.
Peng, J., Hu, M., Guo, S., Du, Z., Zheng, J., Shang, D., Levy Zamora, M., Zeng, L., Shao, M., Wu, Y. S., Zheng, J., Wang, Y., Glen, C. R., Collins, D. R., Molina, M. J., and Zhang, R.: Markedly enhanced absorption and direct radiative forcing of black carbon under polluted urban environments, P. Natl. Acad. Sci. USA, 113, 4266–4271, https://doi.org/10.1073/pnas.1602310113, 2016.
Riemer, N., Vogel, H., Vogel, B., Anttila, T., Kiendler-Scharr, A., and Mentel, T. F.: Relative importance of organic coatings for the heterogeneous hydrolysis of N2O5 during summer in Europe, J. Geophys. Res.-Atmos., 114, D17307, https://doi.org/10.1029/2008jd011369, 2009.
Sun, J., Liu, L., Xu, L., Wang, Y., Wu, Z., Hu, M., Shi, Z., Li, Y., Zhang, X., Chen, J., and Li, W.: Key Role of Nitrate in Phase Transitions of Urban Particles: Implications of Important Reactive Surfaces for Secondary Aerosol Formation, J. Geophys. Res.-Atmos., 123, 1234–1243, https://doi.org/10.1002/2017jd027264, 2018.
Shi, Z., Vu, T., Kotthaus, S., Grimmond, S., Harrison, R. M., Yue, S., Zhu, T., Lee, J., Han, Y., Demuzere, M., Dunmore, R. E., Ren, L., Liu, D., Wang, Y., Wild, O., Allan, J., Barlow, J., Beddows, D., Bloss, W. J., Carruthers, D., Carslaw, D. C., Chatzidiakou, L., Crilley, L., Coe, H., Dai, T., Doherty, R., Duan, F., Fu, P., Ge, B., Ge, M., Guan, D., Hamilton, J. F., He, K., Heal, M., Heard, D., Hewitt, C. N., Hu, M., Ji, D., Jiang, X., Jones, R., Kalberer, M., Kelly, F. J., Kramer, L., Langford, B., Lin, C., Lewis, A. C., Li, J., Li, W., Liu, H., Loh, M., Lu, K., Mann, G., McFiggans, G., Miller, M., Mills, G., Monk, P., Nemitz, E., O'Connor, F., Ouyang, B., Palmer, P. I., Percival, C., Popoola, O., Reeves, C., Rickard, A. R., Shao, L., Shi, G., Spracklen, D., Stevenson, D., Sun, Y., Sun, Z., Tao, S., Tong, S., Wang, Q., Wang, W., Wang, X., Wang, Z., Whalley, L., Wu, X., Wu, Z., Xie, P., Yang, F., Zhang, Q., Zhang, Y., Zhang, Y., and Zheng, M.: Introduction to Special Issue – In-depth study of air pollution sources and processes within Beijing and its surrounding region (APHH-Beijing), Atmos. Chem. Phys. Discuss., https://doi.org/10.5194/acp-2018-922, in review, 2018.
Sun, Y., Jiang, Q., Wang, Z., Fu, P., Li, J., Yang, T., and Yin, Y.: Investigation of the sources and evolution processes of severe haze pollution in Beijing in January 2013, J. Geophys. Res.-Atmos., 119, 4380–4398, https://doi.org/10.1002/2014jd021641, 2014.
Sun, Y., Du, W., Wang, Q., Zhang, Q., Chen, C., Chen, Y., Chen, Z., Fu, P., Wang, Z., Gao, Z., and Worsnop, D. R.: Real-time characterization of aerosol particle composition above the urban canopy in Beijing: insights into the interactions between the atmospheric boundary layer and aerosol chemistry, Environ. Sci. Techol., 49, 11340–11347, https://doi.org/10.1021/acs.est.5b02373, 2015.
Sun, Y., Chen, C., Zhang, Y., Xu, W., Zhou, L., Cheng, X., Zheng, H., Ji, D., Li, J., Tang, X., Fu, P., and Wang, Z.: Rapid formation and evolution of an extreme haze episode in Northern China during winter 2015, Sci. Rep., 6, 27151, https://doi.org/10.1038/srep27151, 2016.
Tang, G., Zhang, J., Zhu, X., Song, T., Münkel, C., Hu, B., Schäfer, K., Liu, Z., Zhang, J., Wang, L., Xin, J., Suppan, P., and Wang, Y.: Mixing layer height and its implications for air pollution over Beijing, China, Atmos. Chem. Phys., 16, 2459–2475, https://doi.org/10.5194/acp-16-2459-2016, 2016.
Tang, M. J., Larish, W. A., Fang, Y., Gankanda, A., and Grassian, V. H.: Heterogeneous Reactions of Acetic Acid with Oxide Minerals: Effects of Mineralogy and Relative Humidity, J. Phys. Chem. A, 120, 5609–5616, https://doi.org/10.1021/acs.jpca.6b05395, 2016.
Tie, X., Huang, R.-J., Cao, J., Zhang, Q., Cheng, Y., Su, H., Chang, D., Pöschl, U., Hoffmann, T., Dusek, U., Li, G., Worsnop, D. R., and O'Dowd, C. D.: Severe Pollution in China Amplified by Atmospheric Moisture, Sci. Rep., 7, 15760, https://doi.org/10.1038/s41598-017-15909-1, 2017.
Timmermans, R., Kranenburg, R., Manders, A., Hendriks, C., Segers, A., Dammers, E., Zhang, Q., Wang, L., Liu, Z., Zeng, L., van der Gon, H. D., and Schaap, M.: Source apportionment of PM2.5 across china using LOTOS-EUROS, Atmos. Environ., 164, 370–386, https://doi.org/10.1016/j.atmosenv.2017.06.003, 2017.
Wang, J. F., Zhang, Q., Chen, M. D., Collier, S., Zhou, S., Ge, X. L., Xu, J. Z., Shi, J. S., Xie, C. H., Hu, J. L., Ge, S., Sun, Y. L., and Coe, H.: First chemical characterization of refractory black carbon aerosols and associated coatings over the Tibetan plateau (4730 m a.s.l), Environ. Sci. Technol., 51, 14072–14082, https://doi.org/10.1021/acs.est.7b03973, 2017.
Wang, J., Liu, D., Ge, X., Wu, Y., Shen, F., Chen, M., Zhao, J., Xie, C., Wang, Q., Xu, W., Zhang, J., Hu, J., Allan, J., Joshi, R., Fu, P., Coe, H., and Sun, Y.: Characterization of black carbon-containing fine particles in Beijing during wintertime, Atmos. Chem. Phys., 19, 447–458, https://doi.org/10.5194/acp-19-447-2019, 2019.
Wang, S., Zhao, X., Li, X., Wei, W., and Hao, J.: Study on fine particle emission characteristics of industrial coal-fired chain furnace, Environ. Sci., 30, 963–968, https://doi.org/10.3321/j.issn:0250-3301.2009.04.004, 2009.
Wang, Y. X., Zhang, Q. Q., Jiang, J. K., Zhou, W., Wang, B. Y., He, K. B., Duan, F. K., Zhang, Q., Philip, S., and Xie, Y. Y.: Enhanced sulfate formation during china's severe winter haze episode in January 2013 missing from current models, J. Geophys. Res.-Atmos., 119, 10425–10440, https://doi.org/10.1002/2013jd021426, 2014.
Wang, Y. Y., Liu, F. S., He, C. L., Bi, L., Cheng, T. H., Wang, Z. L., Zhang, H., Zhang, X. Y., Shi, Z. B., and Li, W. J.: Fractal Dimensions and Mixing Structures of Soot Particles during Atmospheric Processing, Environ. Sci. Tech. Let., 4, 487–493, https://doi.org/10.1021/acs.estlett.7b00418, 2017.
Wang, Z., Maeda, T., Hayashi, M., Hsiao, L. F., and Liu, K. Y.: A nested air quality prediction modeling system for urban and regional scales, application for high-ozone episode in Taiwan, Water, Air, Soil Pollut., 130, 391–396, https://doi.org/10.1023/A:1013833217916, 2001.
Wang, Z. F., Jie, L. I., Wang, Z., Yang, W. Y., Tang, X., Baozhu, G. E., Yan, P. Z., Zhu, L. L., Chen, X. S., and Chen, H. S. J. S. C. E. S.: Modeling study of regional severe hazes over mid-eastern China in January 2013 and its implications on pollution prevention and control, Sci. China Earth Sci., 57, 3–13, https://doi.org/10.1007/s11430-013-4793-0, 2014.
Wang, Z., Pan, X., Uno, I., Li, J., Wang, Z., Chen, X., Fu, P., Yang, T., Kobayashi, H., Shimizu, A., Sugimoto, N., and Yamamoto, S.: Significant impacts of heterogeneous reactions on the chemical composition and mixing state of dust particles: A case study during dust events over northern China, Atmos. Environ., 159, 83–91, https://doi.org/10.1016/j.atmosenv.2017.03.044, 2017.
Wang, Z., Pan, X., Uno, I., Chen, X., Yamamoto, S., Zheng, H., Li, J., and Wang, Z.: Importance of mineral dust and anthropogenic pollutants mixing during a long-lasting high PM event over East Asia, Environ. Pollut., 234, 368–378, https://doi.org/10.1016/j.envpol.2017.11.068, 2018.
Wiedinmyer, C., Akagi, S. K., Yokelson, R. J., Emmons, L. K., Al-Saadi, J. A., Orlando, J. J., and Soja, A. J.: The Fire INventory from NCAR (FINN): a high resolution global model to estimate the emissions from open burning, Geosci. Model Dev., 4, 625–641, https://doi.org/10.5194/gmd-4-625-2011, 2011.
Wu, J. B., Wang, Z., Wang, Q., Li, J., Xu, J., Chen, H., Ge, B., Zhou, G., and Chang, L.: Development of an on-line source-tagged model for sulfate, nitrate and ammonium: A modeling study for highly polluted periods in Shanghai, China, Environ. Pollut., 221, 168–179, https://doi.org/10.1016/j.envpol.2016.11.061, 2017.
Xie, C., Xu, W., Wang, J., Wang, Q., Liu, D., Tang, G., Chen, P., Du, W., Zhao, J., Zhang, Y., Zhou, W., Han, T., Bian, Q., Li, J., Fu, P., Wang, Z., Ge, X., Allan, J., Coe, H., and Sun, Y.: Vertical characterization of aerosol optical properties and brown carbon in winter in urban Beijing, China, Atmos. Chem. Phys., 19, 165–179, https://doi.org/10.5194/acp-19-165-2019, 2019.
Yang, H. H.: Filterable and condensable fine particulate emissions from stationary sources, Aerosol Air Qual. Res., 14, 2010–2016, https://doi.org/10.4209/aaqr.2014.08.0078, 2014.
Yang, Y. R., Liu, X. G., Qu, Y., Wang, J. L., An, J. L., Zhang, Y., and Zhang, F.: Formation mechanism of continuous extreme haze episodes in the megacity Beijing, China, in January 2013, Atmos. Res., 155, 192–203, https://doi.org/10.1016/j.atmosres.2014.11.023, 2015.
Yang, Y., Wang, H., Smith, S. J., Easter, R., Ma, P.-L., Qian, Y., Yu, H., Li, C., and Rasch, P. J.: Global source attribution of sulfate concentration and direct and indirect radiative forcing, Atmos. Chem. Phys., 17, 8903–8922, https://doi.org/10.5194/acp-17-8903-2017, 2017a.
Yang, Y., Wang, H., Smith, S. J., Ma, P.-L., and Rasch, P. J.: Source attribution of black carbon and its direct radiative forcing in China, Atmos. Chem. Phys., 17, 4319–4336, https://doi.org/10.5194/acp-17-4319-2017, 2017b.
Ying, Q., Wu, L., and Zhang, H.: Local and inter-regional contributions to PM2.5 nitrate and sulfate in China, Atmos. Environ., 94, 582–592, https://doi.org/10.1016/j.atmosenv.2014.05.078, 2014.
Yu, F. and Luo, G.: Simulation of particle size distribution with a global aerosol model: contribution of nucleation to aerosol and CCN number concentrations, Atmos. Chem. Phys., 9, 7691–7710, https://doi.org/10.5194/acp-9-7691-2009, 2009.
Zhang, S. L., Ma, N., Kecorius, S., Wang, P. C., Hu, M., Wang, Z. B., Gross, J., Wu, Z. J., and Wiedensohler, A.: Mixing state of atmospheric particles over the North China Plain, Atmos. Environ., 125, 152–164, https://doi.org/10.1016/j.atmosenv.2015.10.053, 2016.
Zhang, Y., Yuan, Q., Huang, D., and Kong, S.: Direct Observations of Fine Primary Particles From Residential Coal Burning: Insights Into Their Morphology, Composition, and Hygroscopicity, J. Geophys. Res., 123, 12964–12979, 2018.
Zhao, X. J., Zhao, P. S., Xu, J., Meng,, W., Pu, W. W., Dong, F., He, D., and Shi, Q. F.: Analysis of a winter regional haze event and its formation mechanism in the North China Plain, Atmos. Chem. Phys., 13, 5685–5696, https://doi.org/10.5194/acp-13-5685-2013, 2013.
Zheng, B., Zhang, Q., Zhang, Y., He, K. B., Wang, K., Zheng, G. J., Duan, F. K., Ma, Y. L., and Kimoto, T.: Heterogeneous chemistry: a mechanism missing in current models to explain secondary inorganic aerosol formation during the January 2013 haze episode in North China, Atmos. Chem. Phys., 15, 2031–2049, https://doi.org/10.5194/acp-15-2031-2015, 2015.
Zheng, M., Zhang, Y., Yan, C., Fu, H., Niu, H., Huang, K., Hu, M., Zheng, L., Li, Q., Peng, B., and Fu, Q.: Establishment of PM2.5 industrial source profile in Shanghai, China Environ. Sci., 33, 1354–1359, https://doi.org/10.3969/j.issn.1000-6923.2013.08.002, 2013.
Zhu, X. W., Tang, G. Q., Hu, B., Wang, L. L., Xin, J. Y., Zhang, J. K., Liu, Z. R., Munkel, C., and Wang, Y. S.: Regional pollution and its formation mechanism over north China plain: a case study with ceilometer observations and model simulations, J. Geophys. Res.-Atmos., 121, 14574–14588, https://doi.org/10.1002/2016jd025730, 2016.