the Creative Commons Attribution 4.0 License.
the Creative Commons Attribution 4.0 License.
 | 10 Jul 2019
Aerosol–radiation feedback deteriorates the wintertime haze in the North China Plain
Jiarui Wu
Naifang Bei
Suixin Liu
Meng Zhou
Qiyuan Wang
Xia Li
Lang Liu
Tian Feng
Zirui Liu
Yichen Wang
Junji Cao
Xuexi Tie
Luisa T. Molina
Guohui Li
Atmospheric aerosols scatter or absorb a fraction of the incoming solar radiation to cool or warm the atmosphere, decreasing surface temperature and altering atmospheric stability to further affect the dispersion of air pollutants in the planetary boundary layer (PBL). In the present study, simulations during a persistent and heavy haze pollution episode from 5 December 2015 to 4 January 2016 in the North China Plain (NCP) were performed using the Weather Research and Forecasting model with Chemistry (WRF-Chem) to comprehensively quantify contributions of aerosol shortwave radiative feedback (ARF) to near-surface (around 15 m above the ground surface) PM2.5 mass concentrations. The WRF-Chem model generally performs well in simulating the temporal variations and spatial distributions of air pollutants concentrations compared to observations at ambient monitoring sites in the NCP, and the simulated diurnal variations of aerosol species are also consistent with the measurements in Beijing. Additionally, the model simulates the aerosol radiative properties, the downward shortwave flux, and the PBL height against observations in the NCP well. During the episode, ARF deteriorates the haze pollution, increasing the near-surface PM2.5 concentrations in the NCP by 10.2 µg m−3 or with a contribution of 7.8 % on average. Sensitivity studies have revealed that high loadings of PM2.5 attenuate the incoming solar radiation reaching the surface to cool the low-level atmosphere, suppressing the development of the PBL, decreasing the surface wind speed, further hindering the PM2.5 dispersion, and consequently exacerbating the haze pollution in the NCP. Furthermore, when the near-surface PM2.5 mass concentration increases from around 50 to several hundred µg m−3, ARF contributes to the near-surface PM2.5 by more than 20 % during daytime in the NCP, substantially aggravating the heavy haze formation. However, when the near-surface PM2.5 concentration is less than around 50 µg m−3, ARF generally reduces the near-surface PM2.5 concentration due to the consequent perturbation of atmospheric dynamic fields.
- Article
(10011 KB) - Full-text XML
- Companion paper
-
Supplement
(3908 KB) - BibTeX
- EndNote


Atmospheric aerosols, produced both naturally and anthropogenically, influence the radiative energy budget of the Earth's atmospheric system in many ways. They scatter or absorb a fraction of the incoming solar radiation to cool or warm the atmosphere, decreasing surface temperature and altering atmospheric stability (e.g., Ackerman, 1977; Jacobson, 1998, 2002). Also, they serve as cloud condensation nuclei (CCN) and ice nuclei (IN), thus modifying cloud optical properties and lifetime (e.g., Zhang et al., 2007; Li et al., 2008a, b, 2009). Among those impacts, the scattering and absorption of solar radiation by aerosols and the associated feedbacks (hereafter referred to as aerosol–radiation feedback or ARF) not only constitute one of the main uncertainties in climate prediction (IPCC, 2007), but also substantially affect the atmospheric chemistry by perturbing the temperature profile and moisture, winds, and planetary boundary layer (PBL) stability (Boucher et al., 2013). In particular, as a short-lived pollutant with uneven distribution and physical and chemical heterogeneities in the atmosphere, ARF varies by more than a factor of 10 with location or time of emissions (Penner et al., 2010).
During wildfire with high-loading absorbing aerosols, ARF has been reported to heat the atmosphere and cool the surface, and thence enhance the PBL stability (e.g., Grell et al., 2011; Fu et al., 2012; Wong et al., 2012). In addition, numerous studies have been performed to evaluate impacts of ARF of dust on the regional meteorology and climate (e.g., Perez et al., 2006; D. F. Zhang et al., 2009; Santese et al., 2010). Anthropogenic aerosols, dominated by scattering components, such as organics and sulfate, primarily attenuate the incoming solar radiation down to the surface, cooling the temperature of the low-level atmosphere to suppress the development of the PBL and hinder the aerosol dispersion in the vertical direction (e.g., Fast et al., 2006; Vogel et al., 2009; Zhang et al., 2010). In addition, the temperature profile perturbation caused by ARF also alters cloud formation and development, possibly causing the precipitation delay or decrease (e.g., Zhao et al., 2005; Koch and Del Genio, 2010; Ding et al., 2013).
Rapid industrialization and urbanization in China have significantly elevated the concentrations of aerosols or fine particulate matter (PM2.5), causing frequent occurrence of haze pollution, particularly during wintertime in North China (e.g., Zhang et al., 2013; Pui et al., 2014). Guo et al. (2014) have elucidated the haze formation mechanism in China, highlighting the efficient aerosol nucleation and growth during haze episodes. Moreover, high-loading aerosols during heavy haze episodes induce efficient ARF, encumbering the PBL development and further deteriorating the haze pollution. It is worth noting that ARF increases precursors for the aerosol nucleation and growth in the PBL, such as sulfuric and organic gases, causing efficient aerosol nucleation and growth (Zhang et al., 2004; Guo et al., 2014). Based on field measurements, recent studies have proposed that the high level of PM2.5 increases the stability of PBL due to ARF and further decreases the PBL height (PBLH), consequently enhancing PM2.5 concentrations ([PM2.5]) (Quan et al., 2013; Petäjä et al., 2016; Yang et al., 2016; Tie et al., 2017; Ding et al., 2017). Online-coupled meteorology and chemistry models have also been used to verify the impact of ARF on the PBLH and near-surface [PM2.5] during haze episodes in Europe, eastern China, and northern China (Forkel et al., 2012; Z. F. Wang et al., 2014; Wang et al., 2015; Zhang et al., 2015; Gao et al., 2015). However, the ARF impact on near-surface [PM2.5] varies, depending on the evaluation time and location (Table 1). For example, the two-way coupled WRF–CMAQ (Community Multiscale Air Quality) system has been employed to evaluate the ARF contribution to the haze formation in January 2013 over the North China Plain (NCP), showing that ARF reduces the PBLH by 100 m and enhances near-surface [PM2.5] by up to 140 µg m−3 in Beijing (J. Wang et al., 2014). Therefore, it is still imperative to comprehensively quantify the ARF contribution to near-surface [PM2.5] under various pollution levels to provide the underlying basis for supporting the design and implementation of emission control strategies.

In this study, simulations are performed using the Weather Research and Forecasting model with Chemistry (WRF-Chem) to interpret the relationship between the near-surface [PM2.5] and the PBLH and further quantify the ARF contribution to near-surface [PM2.5] under various pollution levels. The model and methodology are described in Sect. 2. Analysis results and discussions are presented in Sect. 3, and summary and conclusions are given in Sect. 4.
2.1 WRF-Chem model and configurations
The WRF-Chem model (Grell et al., 2005) with modifications by Li et al. (2010, 2011a, b, 2012) is applied to evaluate effects of ARF on the wintertime haze formation in the NCP. The model includes a new flexible gas-phase chemical module, which can be used with different chemical mechanisms, such as the Carbon Bond Mechanism (CBIV), Regional Acid Deposition Mechanism 2 (RADM2), and Statewide Air Pollution Research Center mechanism (SAPRC). In the study, the SAPRC99 chemical mechanism is used based on the available emission inventory. For the aerosol simulations, the CMAQ/models3 aerosol module (AERO5) developed by the US EPA has been incorporated into the model (Binkowski and Roselle, 2003). The wet deposition is based on the method in the CMAQ module, and the dry deposition of chemical species follows Wesely (1989). The photolysis rates are calculated using the FTUV (fast radiation transfer model) with the aerosol and cloud effects on photolysis (Li et al., 2005, 2011a).
It is worth noting that the most recent extension of ISORROPIA, known as ISORROPIA II, has incorporated a larger number aerosol species (Ca, Mn, K salts) and is designed to be a superset of ISORROPIA (Fountoukis et al., 2009). However, the ISORROPIA version II uses the exact same routines as ISORROPIA to compute the equilibrium composition, which produces identical results to ISORROPIA when crustal species are not considered. Therefore, the inorganic aerosols in this study are predicted using ISORROPIA version 1.7, calculating the composition and phase state of an ammonium–sulfate–nitrate–water inorganic aerosol in thermodynamic equilibrium with gas-phase precursors (Nenes et al., 1998). In addition, a parameterization of sulfate heterogeneous formation involving aerosol liquid water (ALW) has been developed and implemented into the model, which has successfully reproduced the observed rapid sulfate formation during haze days (Li et al., 2017a). The sulfate heterogeneous formation from SO2 is parameterized as a first-order irreversible uptake by ALW surfaces, with a reactive uptake coefficient of assuming that there is enough alkalinity to maintain the high iron-catalyzed reaction rate.
The OA module is based on the volatility basis set (VBS) approach, with aging and detailed information found in Li et al. (2011b). The POA components from traffic-related combustion and biomass burning are represented by nine surrogate species with saturation concentrations (C*) ranging from 10−2 to 106 µg m−3 at room temperature (Shrivastava et al., 2008) and assumed to be semivolatile and photochemically reactive (Robinson et al., 2007). The SOA formation from each anthropogenic or biogenic precursor is calculated using four semivolatile VOCs with effective saturation concentrations of 1, 10, 100, and 1000 µg m−3 at 298 K. The SOA formation via the heterogeneous reaction of glyoxal and methylglyoxal is parameterized as a first-order irreversible uptake by aerosol particles with an uptake coefficient of (Liggio et al., 2005; Zhao et al., 2006; Volkamer et al., 2007).
A persistent air pollution episode from 5 December 2015 to 4 January 2016 in the NCP is simulated using the WRF-Chem model. During the study episode, the average hourly [PM2.5] in the NCP are approximately 127.9 µg m−3, within the fourth grade of National Ambient Air Quality Standards with [PM2.5] between 115 and 150 µg m−3 (moderately polluted, Feng et al., 2016). The persistent and widespread haze pollution episode with high [PM2.5] in the NCP provides a suitable case for observation analyses and model simulations to investigate the ARF effect on haze pollution. Figure 1a shows the model simulation domain, and detailed model configurations can be found in Table 2.
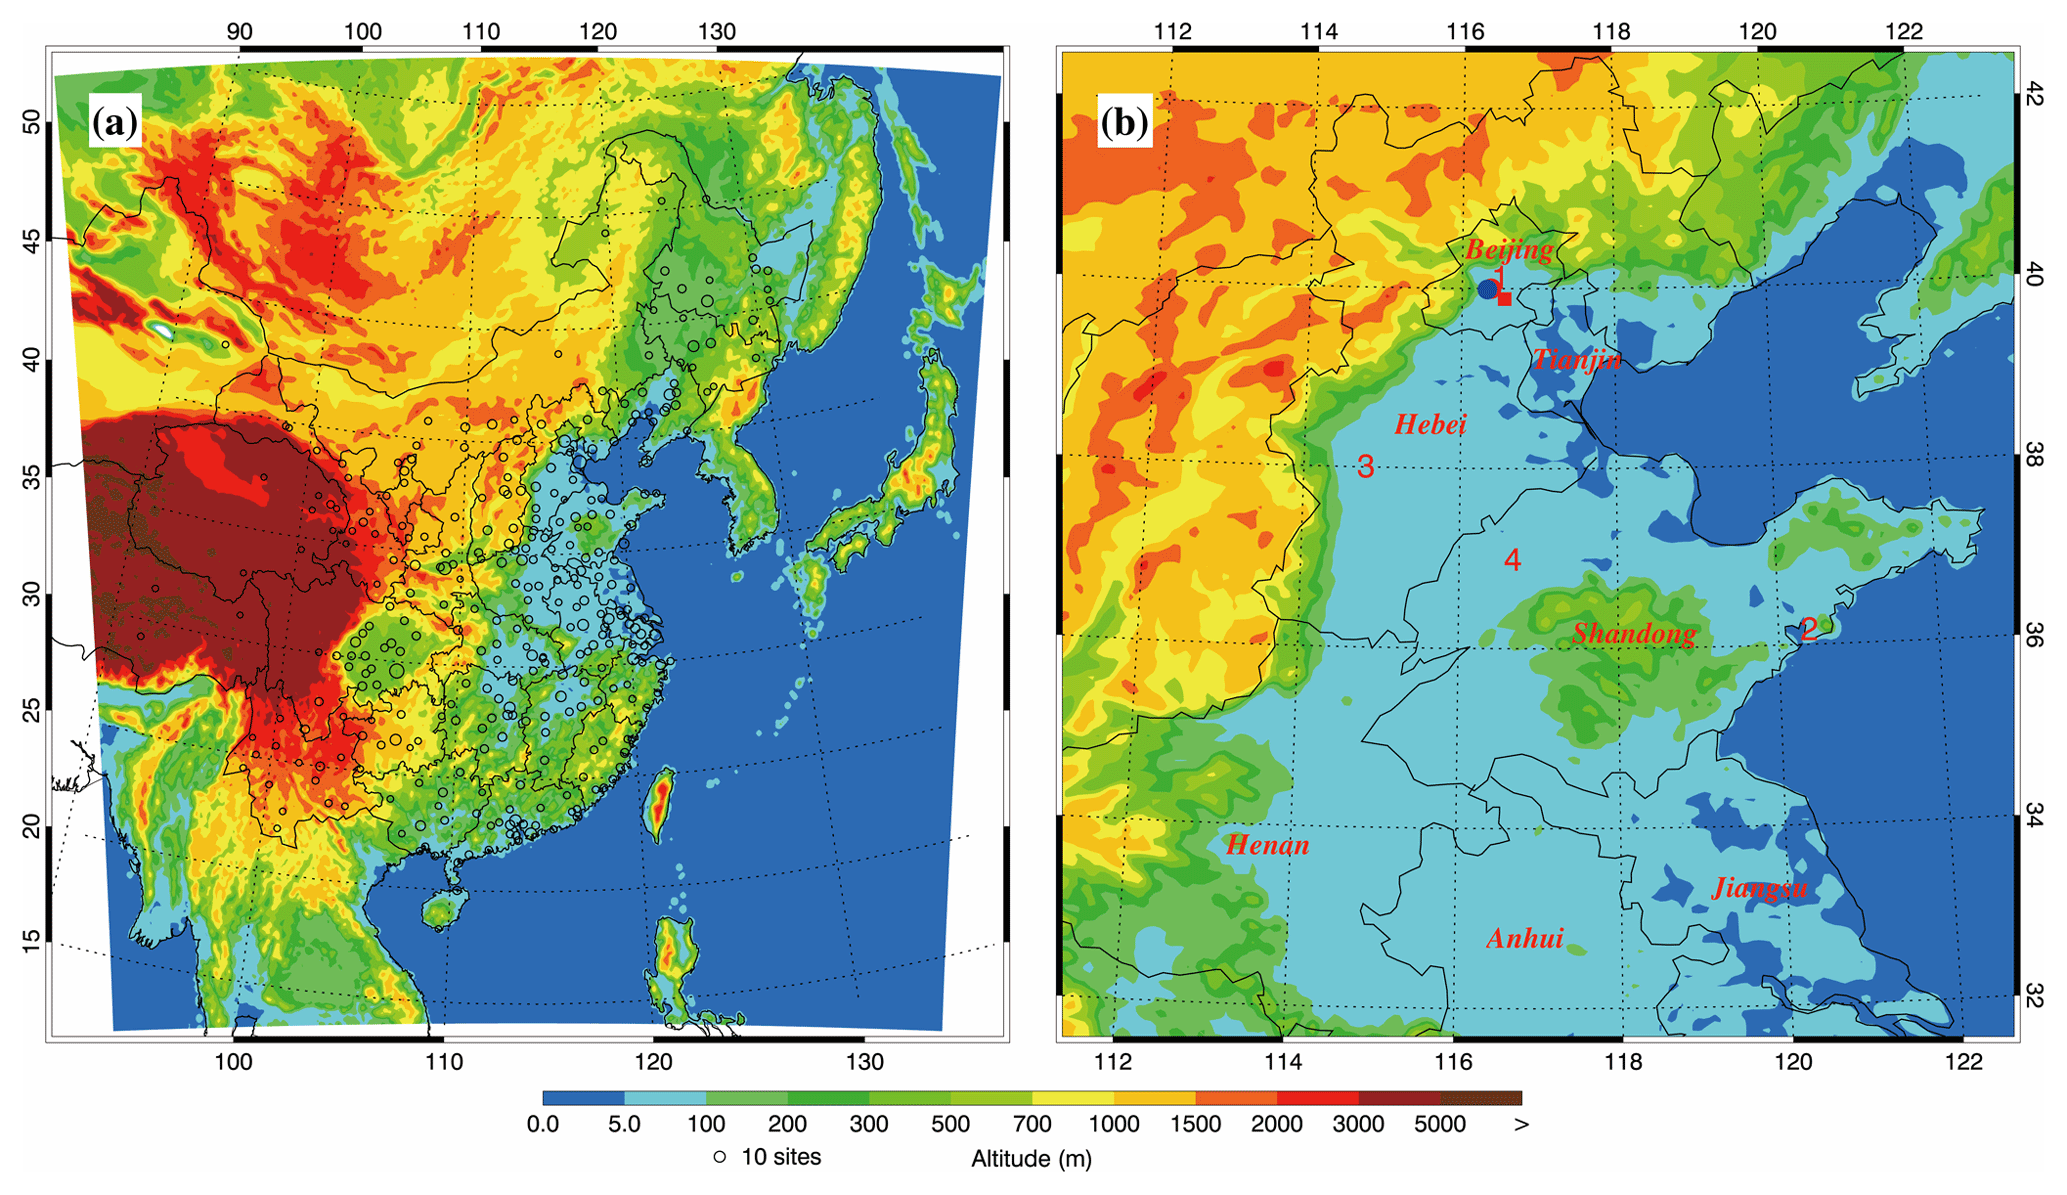
Figure 1(a) WRF-Chem simulation domain with topography and (b) the Beijing–Tianjin–Hebei area. In (a), the blue circles represent centers of cities with ambient monitoring sites, and the size of blue circles denotes the number of ambient monitoring sites of cities. In (b), the blue and red filled circles denote the NCNST and IRSDE site, respectively; the red filled rectangle denotes the meteorological site. The red numbers denote the CERN sites with the solar radiation measurement. (1) Beijing urban; (2) Jiaozhouwan; (3) Yucheng; (4) Luancheng.
2.2 Aerosol radiative module
In the present study, the Goddard shortwave module developed by Chou and Suarez (1999, 2001) is employed to take into account the ARF effect on the haze formation. The aerosol radiative module developed by Li et al. (2011b) has been incorporated into the WRF-Chem model to calculate the aerosol optical depth (AOD or τa), single scattering albedo (SSA or ωa), and the asymmetry factor (ga).
In the CMAQ aerosol module, aerosols are represented by a three-moment approach with a lognormal size distribution:
where D is the particle diameter, N is the number distribution of all particles in the distribution, Dg is the geometric mean diameter, and σg is the geometric standard deviation. To calculate the aerosol optical properties, the aerosol spectrum is first divided into 48 bins from 0.002 to 2.5 µm, with radius ri. The aerosols are classified into four types: (1) internally mixed sulfate, nitrate, ammonium, hydrophilic organics and black carbon, and water; (2) hydrophobic organics; (3) hydrophobic black carbon; and (4) other unidentified aerosols. These four kinds of aerosols are assumed to be mixed externally. For the internally mixed aerosols, the complex refractive index at a certain wavelength (λ) is calculated based on the volume-weighted average of the individual refractive index. Given the particle size and complex refractive index, the extinction efficiency (Qe), ωa, and ga are calculated using the Mie theory at a certain wavelength (λ). The lookup tables of Qe, ωa, and ga are established according to particle sizes and refractive indices to avoid multiple Mie scattering calculation. The aerosol optical parameters are interpolated linearly from the lookup tables with the calculated refractive index and particle size in the module.
The aerosol optical depth (AOD or τa) at a certain wavelength (λ) in a given atmospheric layer k is determined by the summation over all types of aerosols and all bins:
where is the number concentration of jth kind of aerosols in the ith bin. ΔZk is the depth of an atmospheric layer. The weighted-mean values of σ and g are then calculated by (d'Almeida et al., 1991)
When the wavelength-dependent τa, ωa, and ga are calculated, they can be used in the Goddard shortwave module to evaluate the ARF. Detailed information can be found in Li et al. (2011b).
2.3 Data and statistical methods for comparisons
The model performance is validated using the available measurements in the NCP, including AOD, SSA, PBLH, downward shortwave flux (SWDOWN), aerosol species, and air pollutants. The daily AOD is retrieved from Terra and Aqua Moderate Resolution Imaging Spectroradiometer (MODIS) level 2 products, with a resolution of 0.1∘ × 0.1∘. The hourly SSA is calculated using the measurement of the turbidity meter at the National Center for Nanoscience and Technology (NCNST), Chinese Academy of Sciences (116.33∘ E, 39.99∘ N), in Beijing (Fig. 1b). The daily PBLH at 12:00 Beijing time (BJT) is diagnosed from the radiosonde observation at a meteorological site (116.47∘ E, 39.81∘ N) in Beijing. The SWDOWN is measured by CM-11 pyranometers at four sites from the Chinese Ecosystem Research Network (CERN) in the NCP (Liu et al., 2016). The hourly measurements of O3, NO2, SO2, CO and PM2.5 concentrations have been released by China's Ministry of Ecology and Environment (China MEP) since 2013. The hourly submicron sulfate, nitrate, ammonium, and organic aerosols are measured by the Aerodyne Aerosol Chemical Speciation Monitor (ACSM) at NCNST. The primary organic aerosol (POA) and SOA concentrations are obtained from the ACSM measurement analyzed using the positive matrix factorization (PMF). In addition, we have also analyzed the relationship between near-surface [PM2.5] and the PBLH retrieved from the lidar measurement at the Institute of Remote Sensing and Digital Earth (IRSDE), Chinese Academy of Sciences (116.38∘ E, 40.00∘ N), in Beijing (Fig. 1b).
In the present study, the mean bias (MB), root mean square error (RMSE), and the index of agreement (IOA) are used to assess the performance of WRF-Chem model simulations against measurements. The detailed description can be found in the Supplement.
3.1 Model performance
We first define the base simulation in which ARF is considered (hereafter referred to as fbase), and results from fbase are compared to observations in the NCP. Generally, the model simulates the horizontal distributions and temporal variations of PM2.5, O3, NO2, and SO2 mass concentrations against measurements in the NCP well. Additionally, the model also reproduces the temporal profiles of the aerosol species reasonably well compared to observations in Beijing. The detailed model validation of air pollutants in the NCP and the aerosol species in Beijing can be found in the Supplement.
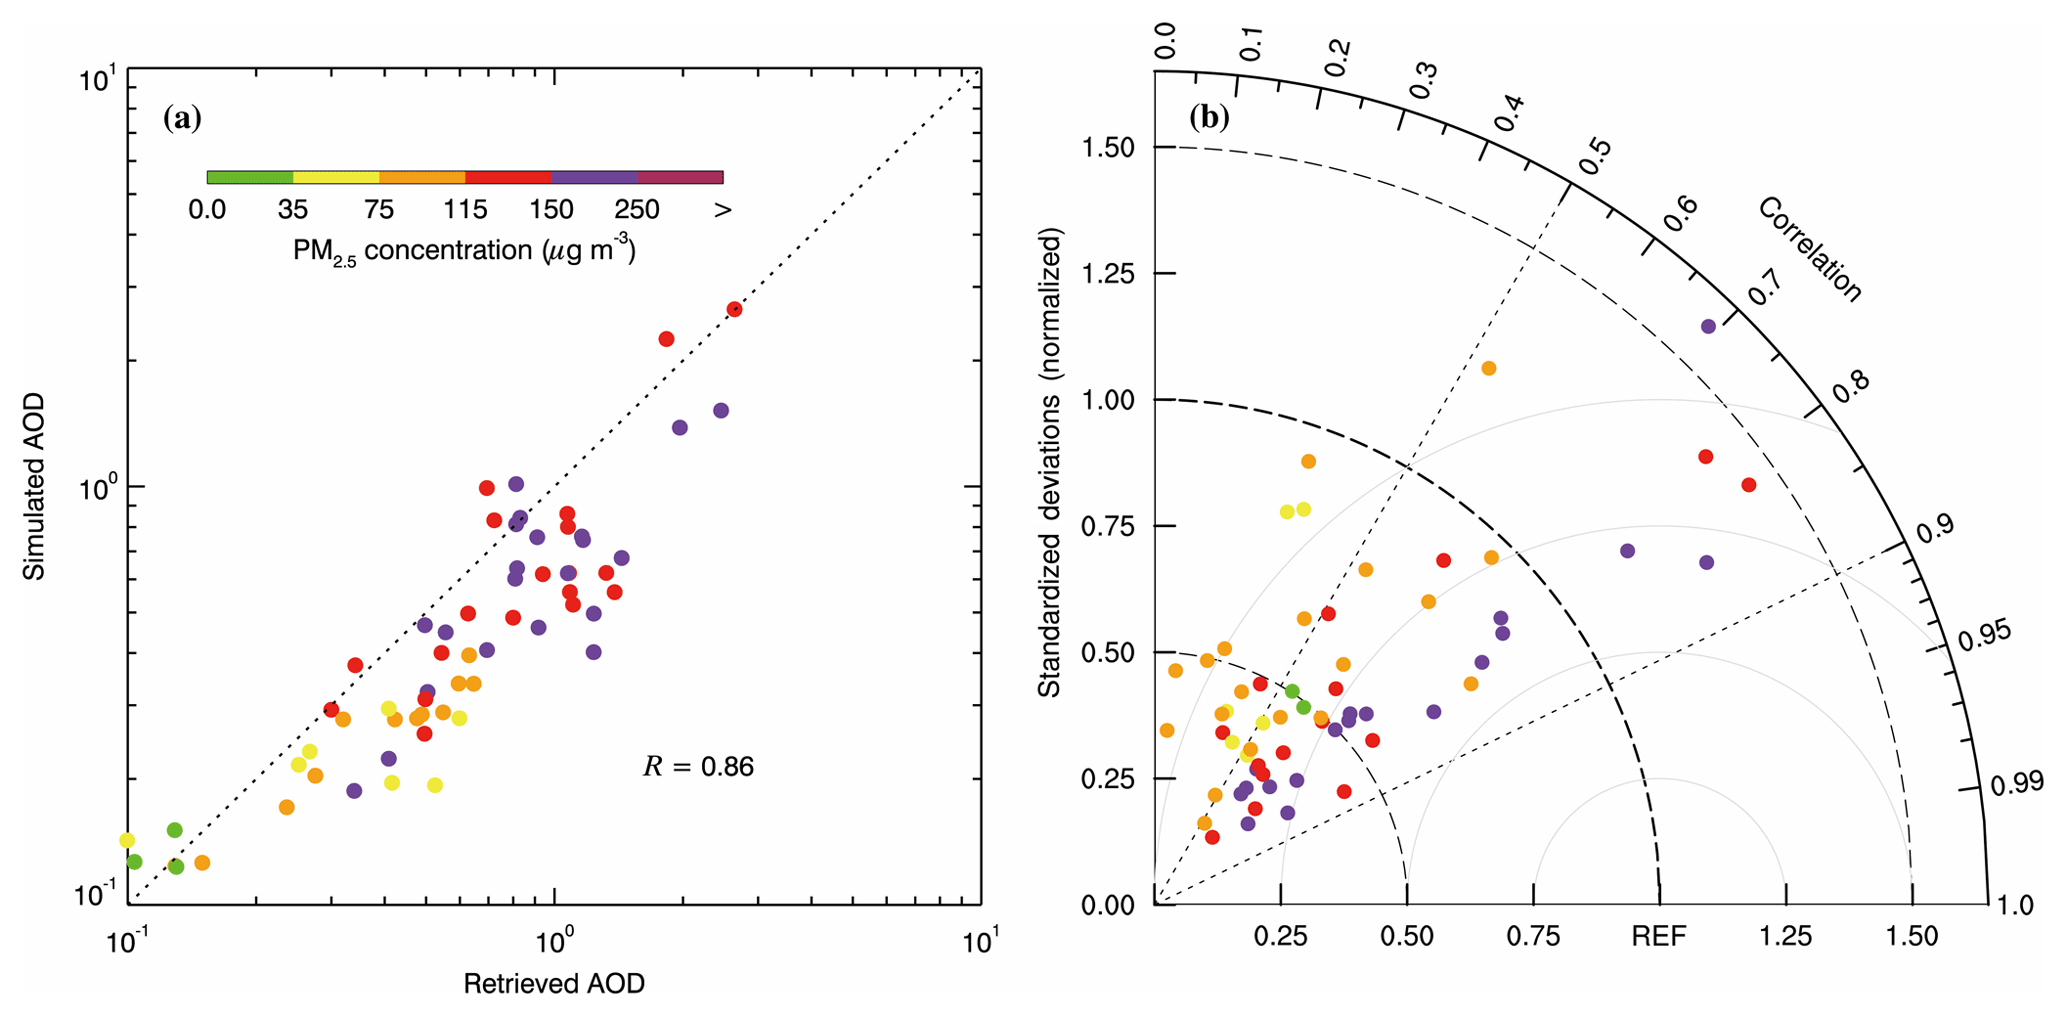
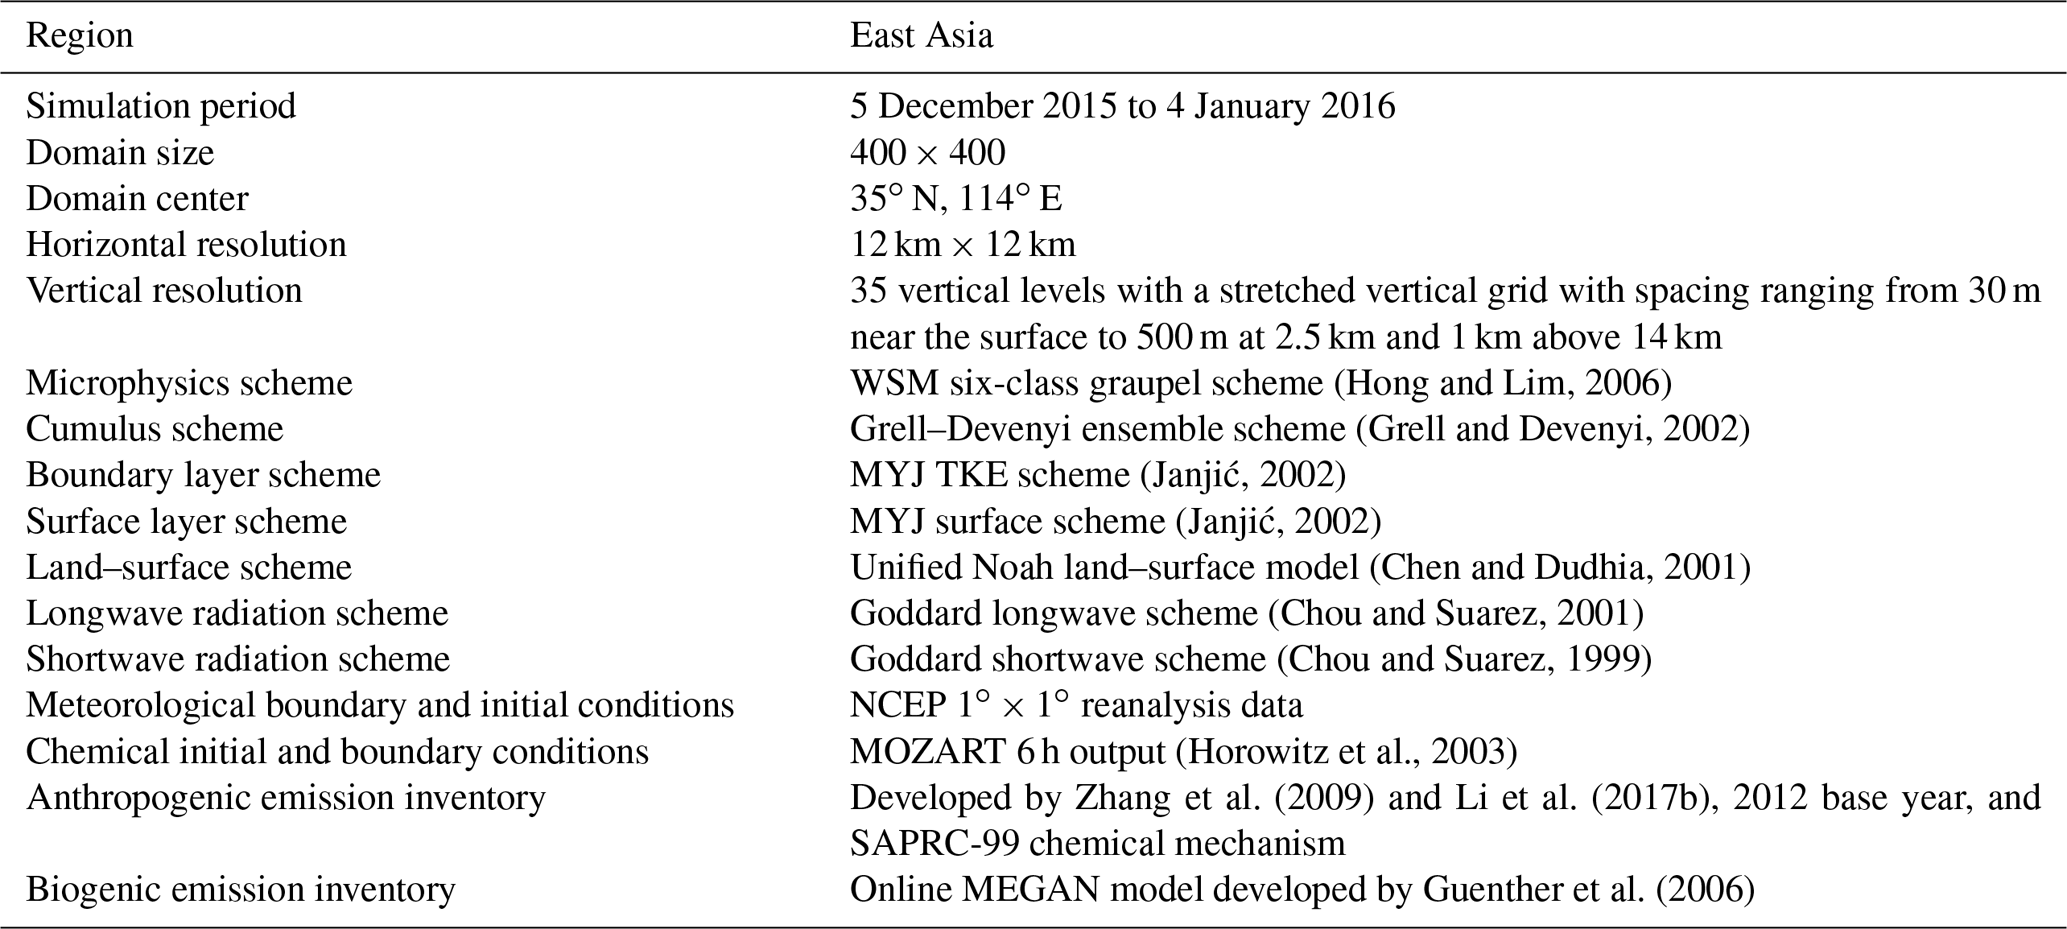
Figure 2(a) Scatter plot of the MODIS-retrieved and simulated daily AOD; (b) Taylor diagram (Taylor, 2001) to present the variance, bias, and correlation of the retrieved and simulated daily AOD averaged in the NCP from 5 December 2015 to 4 January 2016.
3.1.1 Aerosol radiative property simulations in the NCP
Aerosol radiative forcing mainly depends on the AOD, SSA, and asymmetry parameter (g). The model validations of AOD and SSA are provided in this study to further evaluate the aerosol radiative effect on the air pollution. The daily AOD at 550 nm, retrieved from Terra and Aqua MODIS level 2 products, is compared with the simulation. Figure 2a shows the scatter plot of the daily retrieved and simulated AOD averaged in the NCP from 5 December 2015 to 4 January 2016. The simulated daily average AOD correlates well with the observation, with a correlation coefficient of 0.86. Generally, the retrieved and simulated AOD increases with deterioration of the haze pollution, but the model considerably underestimates the AOD against the observation. Figure 2b presents the Taylor diagram (Taylor, 2001) to show the variance, bias, and correlation of the simulated and retrieved AOD from 5 December 2015 to 4 January 2016. There exists a good relationship between the simulated and retrieved daily AOD during the study episode, with correlation coefficients generally ranging from 0.5 to 0.9 and standard deviation mostly varying from 0.25 to 1.0. Figure 3 shows the pattern comparison of the retrieved and simulated AOD averaged during the simulation period. The model reasonably reproduces the AOD distribution compared to the observations in the NCP but considerably underestimates the AOD. The simulated and retrieved AOD averaged in the NCP during the simulation period is 0.43 and 0.59, respectively. It is worth noting that the simulated AOD is not only dependent on the column aerosol content and constituent, but is also significantly influenced by the relative humidity (RH) controlling the aerosol hydroscopic growth. Additionally, the satellite-retrieved AOD is subject to contamination by the existence of clouds, and considering the high occurrence frequency of clouds during haze days, the retrieved AOD is generally higher than the simulation (Engstrom and Ekman, 2010; Chand et al., 2012; Grandey et al., 2013).
Figure 3Spatial distribution of (a) retrieved and (b) simulated AOD averaged from 5 December 2015 to 4 January 2016 in the NCP.
Aerosols are the mixture of absorbing and scattering constituents in the atmosphere. Their radiative effect of cooling or warming the atmosphere relies on many parameters, and SSA is one of the most important ones (Satheesh et al., 2010). Figure 4 depicts the comparison of the measured and simulated diurnal profiles of SSA at NCNST in Beijing during the episodes. The model performs reasonably in simulating the daily variation of SSA in Beijing, with an IOA of 0.69 and a MB of 0.0, but the overestimation or underestimation is rather large. SSA is the ratio of scattering to extinction, which is highly sensitive to the relative distribution of scattering and absorbing aerosol constituents in the atmosphere, as well as the RH determining the hygroscopic growth of aerosols. Therefore, the uncertainties of the simulated SSA probably originated from the model biases of aerosol constituents and the RH.
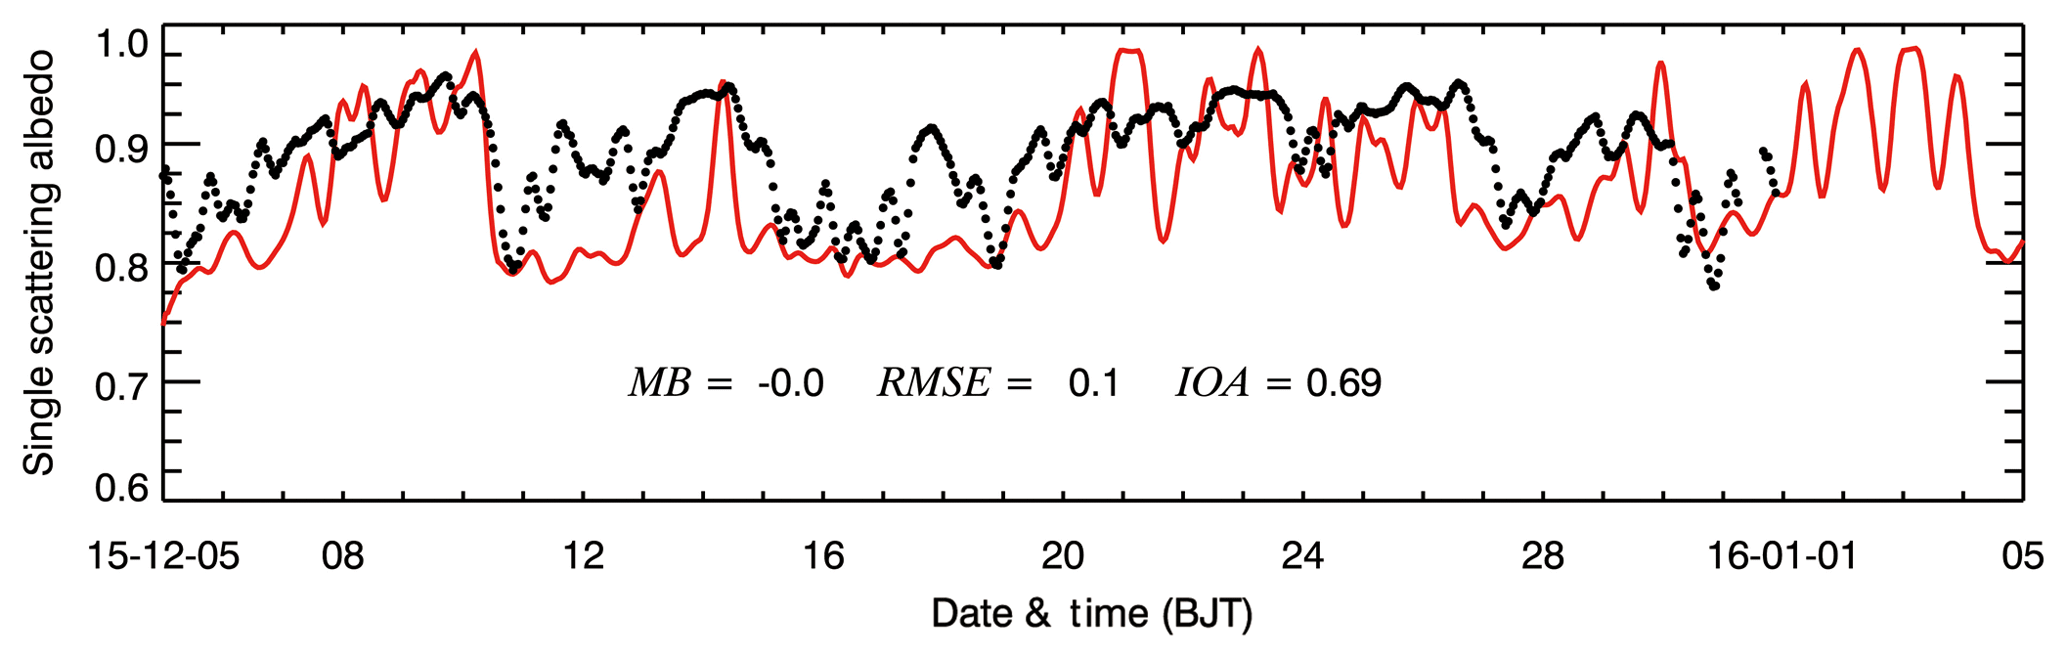
Figure 4Comparison of measured (black dots) and predicted (red line) diurnal profiles of SSA in Beijing from 5 December 2015 to 4 January 2016.
3.1.2 Downward solar radiation simulations in the North China Plain
Figure 5 presents the daily profiles of simulated and observed SWDOWN at ground surfaces in Beijing, Jiaozhouwan, Luancheng, and Yuancheng from 5 December 2015 to 4 January 2016. The WRF-Chem model simulates the daily variation of SWDOWN well, especially in Jiaozhouwan, Luancheng, and Yucheng, with IOAs around 0.90. The model is subject to overestimating the SWDOWN against measurements, with MBs ranging from 6.3 to 86.2 W m−2. The SWDOWN reaching the ground surface is very sensitive to the cloud cover and optical thickness. However, the WRF-Chem model still has difficulties in accurately predicting the cloud cover and optical thickness, which might constitute one of the most important reasons for model biases of the SWDOWN. In addition, the horizontal resolution used in simulations cannot adequately resolve the cumulus clouds, also causing uncertainties in the simulations of the SWDOWN.
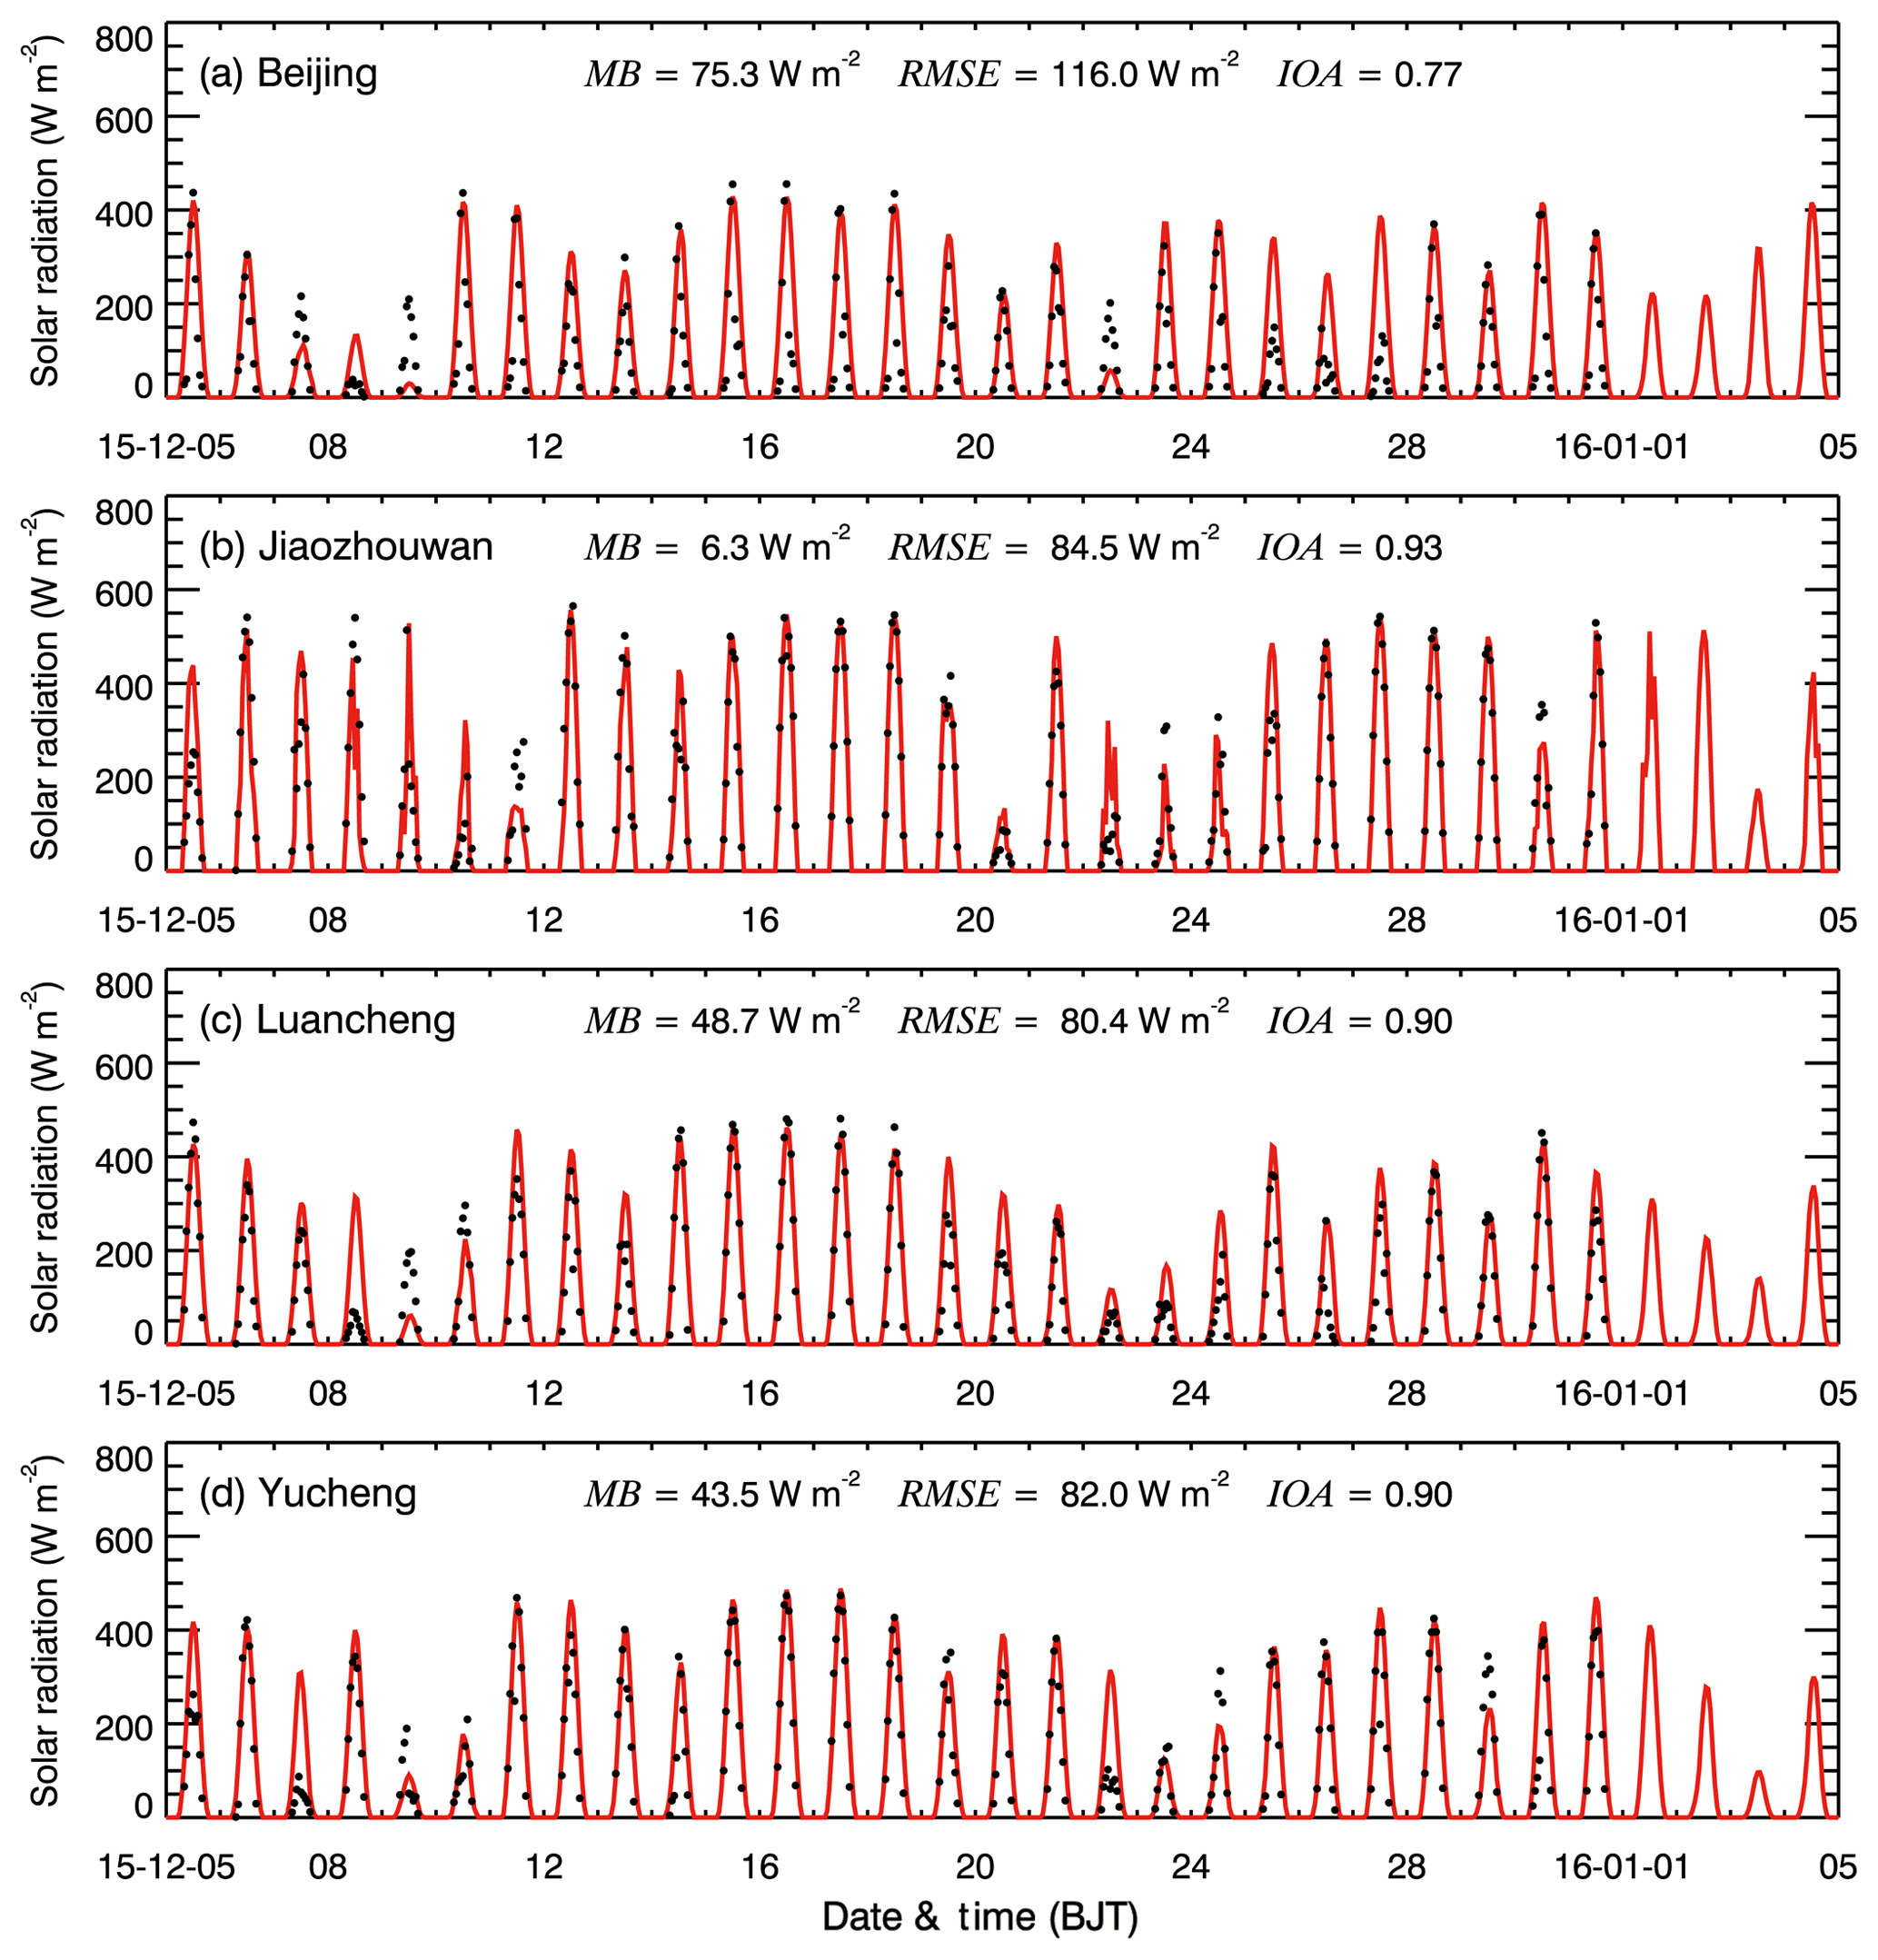
Figure 5Comparison of measured (black dots) and predicted (red line) diurnal profiles of the SWDOWN reaching the ground surface in (a) Beijing, (b) Jiaozhouwan, (c) Luancheng, and (d) Yucheng from 5 December 2015 to 4 January 2016.
3.1.3 PBLH simulations in Beijing
Figure 6 shows the temporal variations of the observed and simulated PBLH at a meteorological site in Beijing from 5 December 2015 to 4 January 2016. The average PBLH at 12:00 BJT during the episode at the meteorological site is 465.2 m, with the minimum of 101.8 m and the maximum of 1017.9 m, showing decreased PBLH during the haze episode. In general, the WRF-Chem model tracks the daily variation of the PBLH in Beijing reasonably, with an IOA of 0.70. However, the model has difficulties in reproducing the observed very low PBLH, e.g., less than 200 m. The PBLH varies substantially with time due to many factors, including large-scale dynamics, cloudiness, convective mixing, and the diurnal cycle of solar radiation (Sivaraman et al., 2013). Therefore, the simulation uncertainties of meteorological conditions constitute the main reason for the simulation bias of PBLH. For example, the overestimation of SWDOWN at 12:00 BJT (Fig. 5a) probably caused the overestimation of PBLH in Beijing.
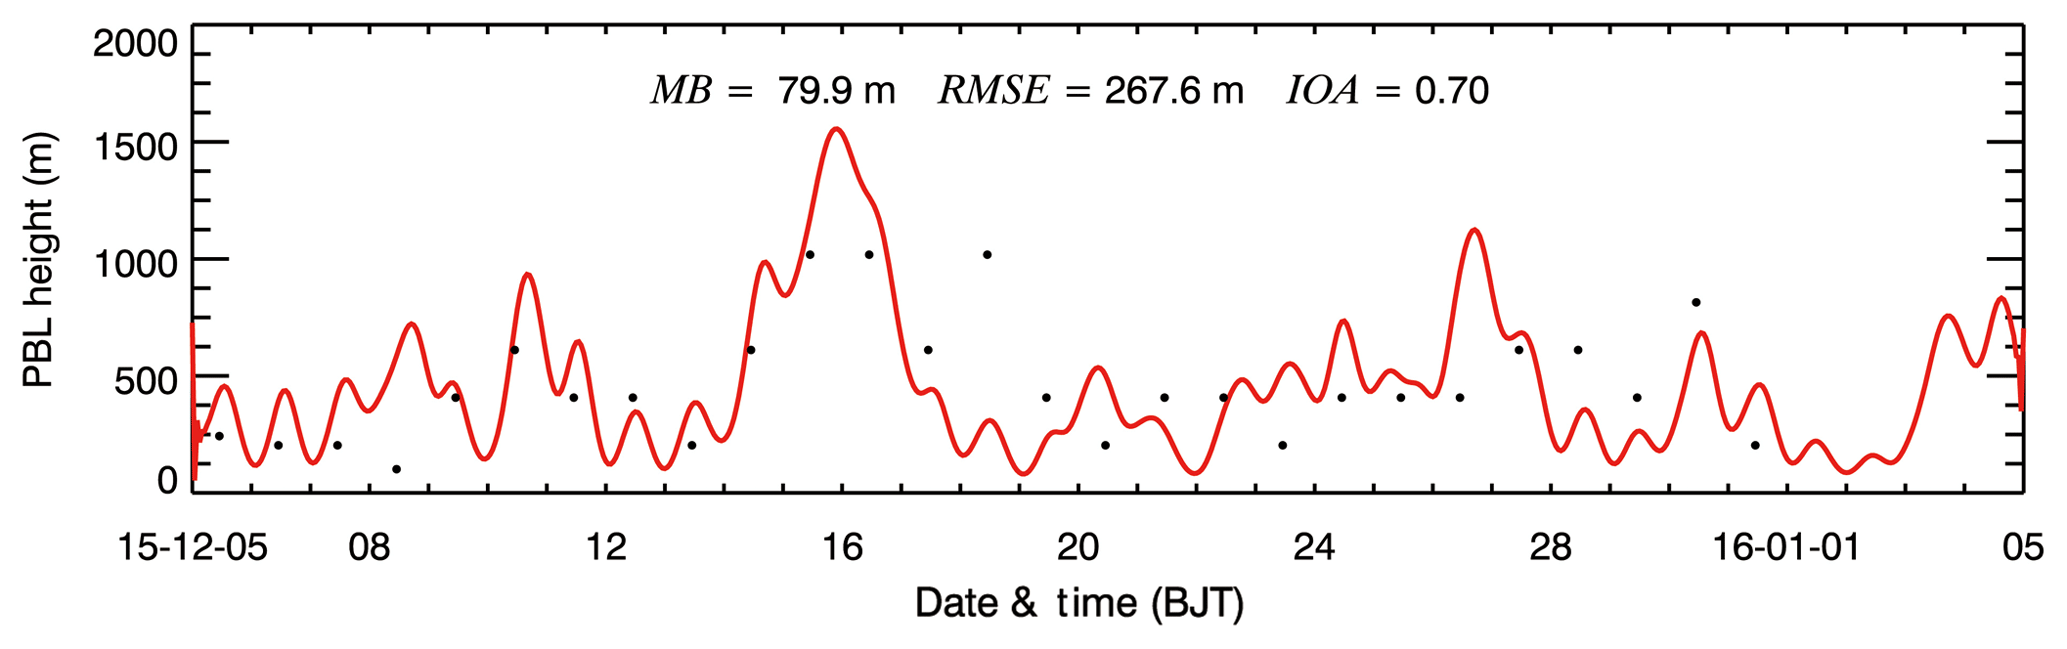
Figure 6Comparison of predicted diurnal profile (red line) of PBLH from 5 December 2015 to 4 January 2016 with observations at 12:00 BJT in Beijing.
In general, the simulated variations of SWDOWN, PBLH, aerosol radiative properties, air pollutants (PM2.5, O3, NO2, SO2, CO), and aerosol species are in good agreement with observations, indicating that the simulations of meteorological conditions, chemical processes, and the emission inventory used in the WRF-Chem model are reasonable, providing a reliable basis for the further investigation.
3.2 Relationship between near-surface [PM2.5] and PBLH
Figure 7 presents the scatter plot of the lidar-retrieved PBLH at IRSDE and near-surface [PM2.5] at a monitoring site close to IRSDE during daytime (08:00–17:00 LT) from 8 January to 20 February 2014. The wind speeds (WSPD) at a meteorological site close to IRSDE are shown by the color of the filled circles in Fig. 7. Additionally, near-surface [PM2.5] during daytime are also subdivided into 20 bins with the interval of 25 µg m−3. The PBLH as the bin of near-surface [PM2.5] is assembled, and an average of PBLH in each bin is calculated (Nakajima et al., 2001; Kawamoto et al., 2006), which is represented by the rectangle in Fig. 7. Generally, on average, when the PBLH decreases from 1500 to around 400 m, the near-surface [PM2.5] increase from 10 to more than 200 µg m−3. When near-surface [PM2.5] exceed 200 µg m−3, the PBLH remains 400–500 m. Previous studies have also reported the nonlinear relationship between the PBLH and near-surface [PM2.5] and proposed that increasing [PM2.5] reduce the PBLH or the ARF is attributed to the PBLH decrease (e.g., Petäjä et al., 2016; Tie et al., 2017; Liu et al., 2018).
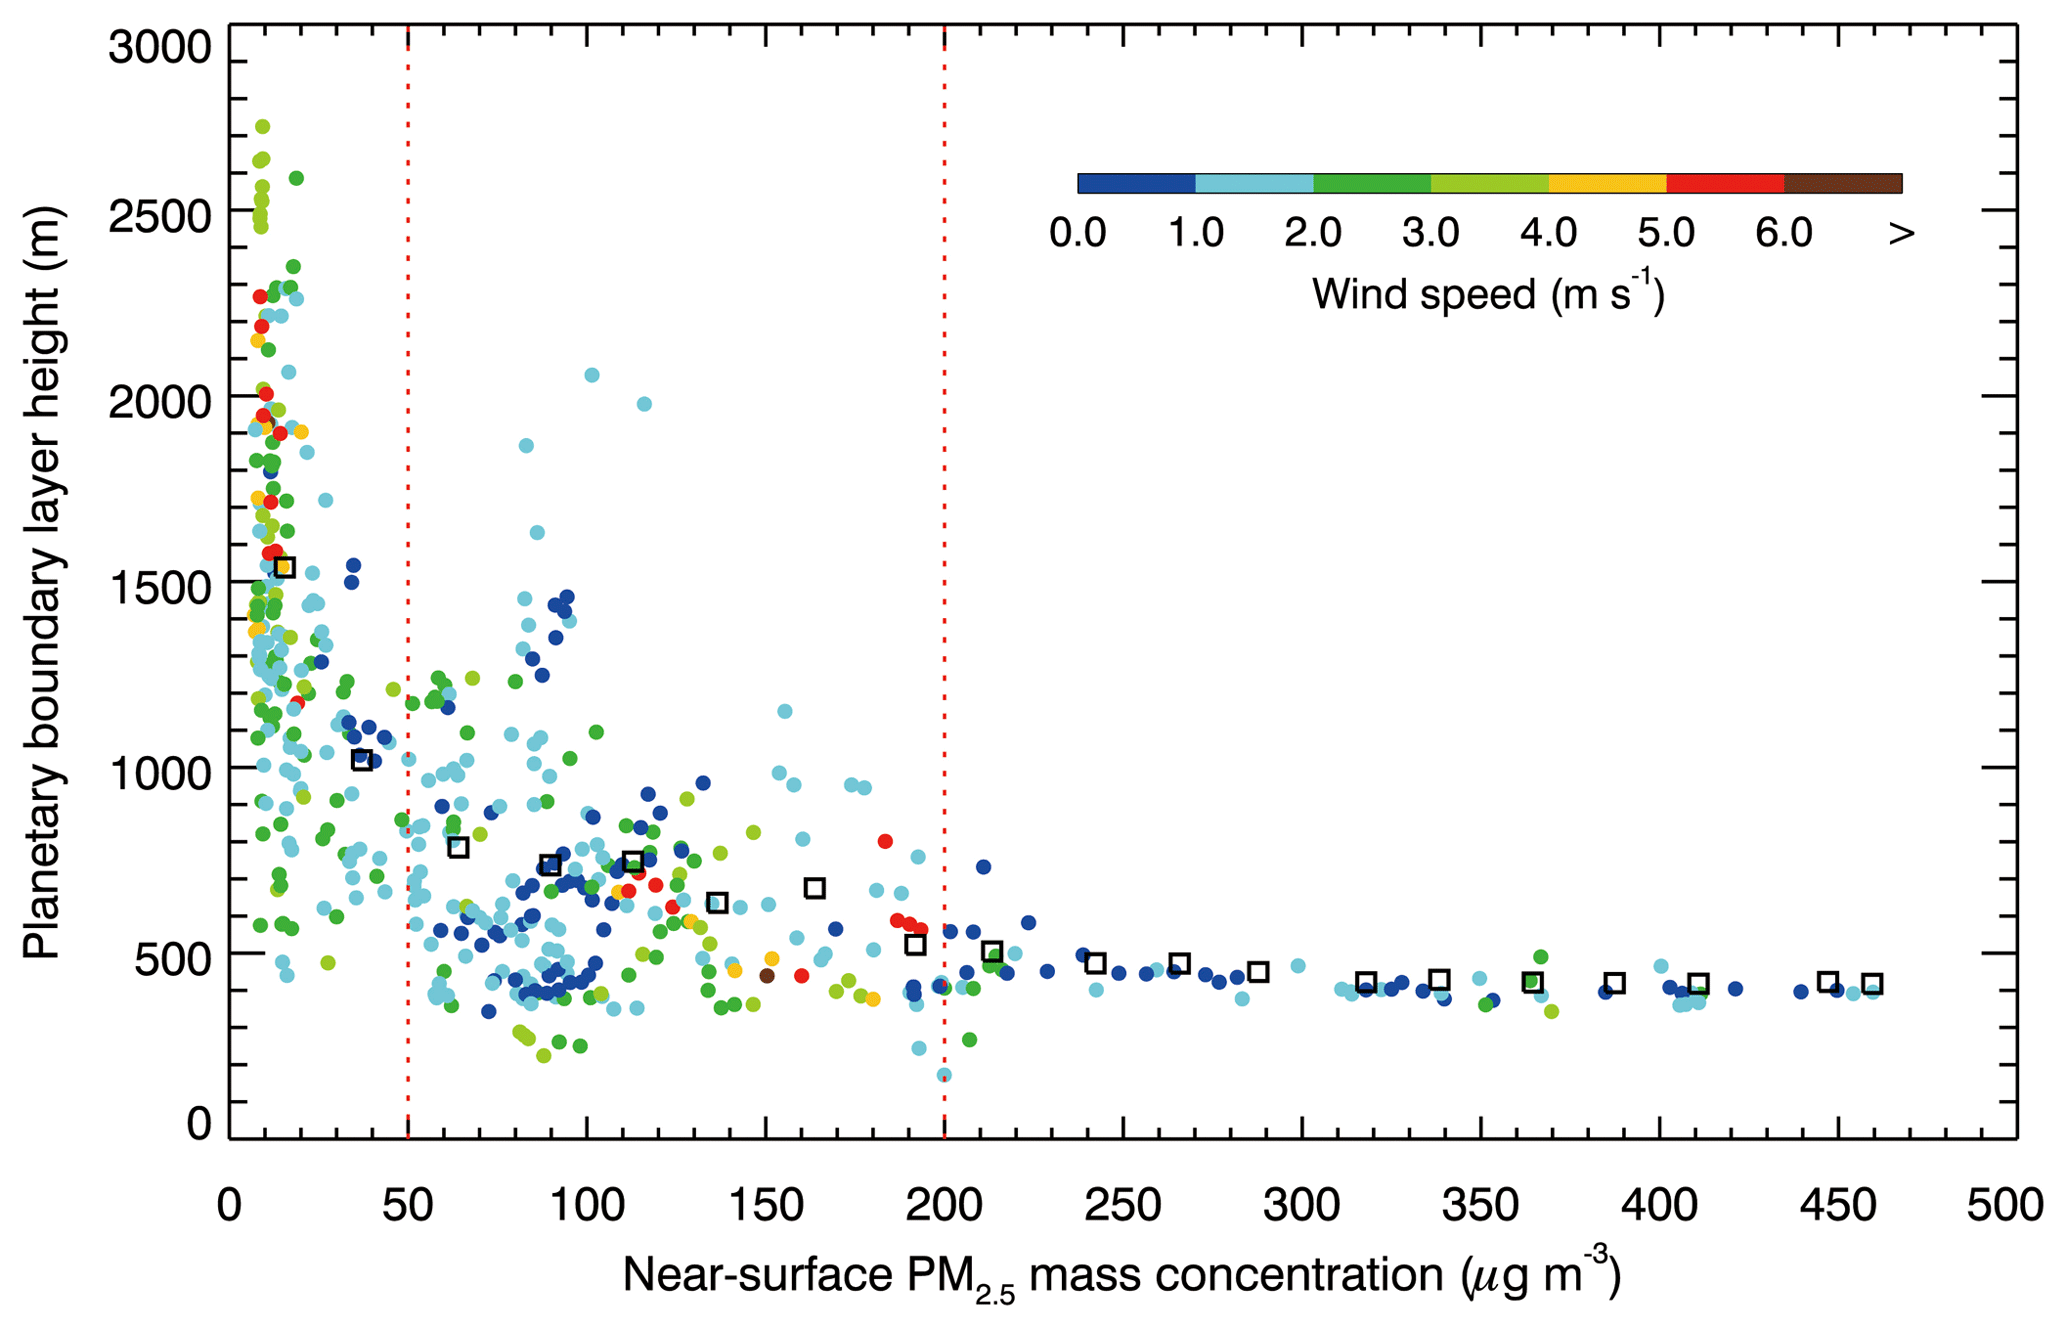
Figure 7Scatter plot of the PBLH and near-surface [PM2.5] at the IRSDE site from 12 January to 20 February 2014. The black rectangle shows the bin average of PBLH. The color of the filled circles denotes the WSPD at the meteorological site close to IRSDE in Fig. 1b.
The PBLH is primarily determined by the wind shear in the vertical direction and the thermal condition of ground surfaces. The occurrence of low near-surface [PM2.5] generally corresponds to efficient dispersions of PM2.5 in horizontal and/or vertical directions. The strong horizontal winds in the lower atmosphere not only disperse PM2.5 emitted or formed efficiently, but also intensify the wind shear in the vertical direction, increasing the PBLH and facilitating the rapid vertical exchange of PM2.5 in the PBL. When near-surface [PM2.5] are less than 50 µg m−3, the PBLH exceeding 1000 m is observed, which is chiefly determined by strong horizontal winds and less influenced by the ground thermal condition during wintertime, and the observed average WSPD is about 2.4 m s−1. The occurrence of high near-surface [PM2.5] indicates that the lower atmosphere is stable or stagnant, with weak horizontal winds and inactive convections, hindering the dispersion of PM2.5 in the horizontal and vertical directions. Additionally, as the horizontal winds become weak or calm, the wind shear in the vertical direction is diminished and the PBLH is dominated by the ground thermal condition. When near-surface [PM2.5] increase from 50 to around 200 µg m−3, the PBLH decreases from around 700 to 400 m, and the average WSPD decreases to 1.8 m s−1. However, the increased PM2.5 reducing PBLH still cannot be fully attributed to ARF, which is more likely caused by the decrease in winds or the formation of stagnant situations in the low-level atmosphere. When near-surface [PM2.5] exceed 200 µg m−3, the observed PBLH fluctuates between 400 and 500 m with the average WSPD of around 1.0 m s−1 and does not exhibit a continuous decrease with the increasing near-surface [PM2.5].
Under the stagnant situation with weak winds, the PBLH is more sensitive to the ground thermal condition. Increasing aerosols or PM2.5 in the low-level atmosphere attenuate the SWDOWN to the ground surface and decrease the surface temperature (TSFC) and turbulence kinetic energy, suppressing the PBL development and further enhancing near-surface [PM2.5]. Therefore, with near-surface [PM2.5] exceeding 200 µg m−3, the inert PBLH might be caused by the defect of the lidar-retrieved PBLH. The aerosol backscatter signal received by lidar is used to retrieve the PBLH. If the atmosphere is stable, the aerosols near the maximal PBLH are subject to being confined in situ, and the retrieved PBLH is generally the maximal one. Additionally, it is worth noting that the occurrence of the wintertime severe haze pollution in the NCP is often accompanied with the high-level convergence between 500 and 700 hPa, producing a persistent and strong sinking motion in the middle lower troposphere to reduce the PBLH and facilitate accumulation of air pollutants (Wu et al., 2017; Ding et al., 2017). Therefore, a subsidence inversion appears in the lower layer as a result of the air masses sinking in the middle troposphere, restraining the PBL development and determining the maximal PBLH. Hence, it is imperative to evaluate the contribution of ARF to the PBLH and near-surface [PM2.5].
3.3 Sensitivity studies
The conceptual model about the ARF contribution to the heavy haze formation has been established in previous studies (e.g., Tie et al., 2017; Liu et al., 2018). During wintertime, under stagnant meteorological situations with weak winds and humid air, air pollutants are subject to accumulation in the PBL, facilitating the formation of PM2.5. Increasing PM2.5 in the PBL absorbs or scatters the incoming solar radiation to decrease the TSFC and facilitate anomalous temperature inversion, subsequently suppressing the vertical turbulent diffusion and decreasing the PBLH to further trap more air pollutants and water vapor to increase the RH in the PBL. Increasing RH enhances aerosol hygroscopic growth and multiphase reactions and augments the particle size and mass, causing further dimming and decrease in the TSFC and PBLH. The whole process constitutes a positive feedback induced by the aerosol radiation effect to enhance near-surface [PM2.5], which has been proposed in many studies (Quan et al., 2013; Petäjä et al., 2016; Yang et al., 2016; Tie et al., 2017; Ding et al., 2017; Liu et al., 2018). The noted positive meteorological condition feedback has also been considered as the main reason for the near-surface PM2.5 explosive growth (Zhong et al., 2018; X. Zhang et al., 2018b).
To comprehensively evaluate the influence of ARF on near-surface [PM2.5] during the haze episode, a sensitivity study in which ARF is turned off has been conducted (hereafter referred as frad0). Therefore, the contribution of ARF to near-surface [PM2.5] can be determined by the difference between fbase and frad0 (fbase−frad0). The most polluted area in the NCP is first selected to verify the conceptual model of the ARF contribution to the heavy haze formation, with the average near-surface [PM2.5] during the haze episode exceeding 150 µg m−3. Figure 8 provides the temporal variation of near-surface [PM2.5], SWDOWN, TSFC, PBLH, and RH averaged in the selected area during the episode in fbase and frad0. Apparently, ARF considerably decreases the solar radiation reaching the ground surface and correspondingly lowers the TSFC (Fig. 8b and c). Subsequently, the PBLH is decreased and the surface RH is increased due to decreasing TSFC during daytime (Fig. 8d and e). However, the variation trend of near-surface [PM2.5], PBLH, TSFC, and RH due to ARF is not similar to that proposed in the conceptual model. During the haze development stage, whether ARF is considered or not, the TSFC and RH exhibit an increasing trend, showing the air mass originated from the south, and the PBLH does not consistently decrease with increasing near-surface [PM2.5]. Additionally, the ARF contribution to near-surface [PM2.5] is generally marginal during the haze development stage. During the haze maturation stage, ARF commences to elevate near-surface [PM2.5] appreciably. It is worth noting that, even if ARF is not considered in frad0, the heavy haze pollution still occurs during the episode. For example, from 17 to 20 December 2015, without ARF, near-surface [PM2.5] still continue to increase from around 30 to 300 µg m−3 and fluctuate between 150 and 300 µg m−3 until the occurrence of favorable meteorological conditions on 25 December. Hence, according to the variation trend of near-surface [PM2.5] with and without the ARF contribution, the continuous accumulation of PM2.5 during the haze episode is not primarily caused by ARF but predominantly induced by the stagnant meteorological conditions as well as the massive air pollutant emissions in the NCP. Figure 9 presents the temporal variation of AOD at 550 nm averaged in the selected area during the episode in fbase and frad0 to evaluate the impact of ARF on AOD. Apparently, except from 8 to 11 December, the ARF contribution to AOD is generally marginal, indicating that ARF does not play an important role in the column-integrated aerosol abundance. Additionally, the considerable AOD enhancement from 8 to 11 December is more likely caused by the substantial increase in RH due to ARF, which facilitates aerosol hygroscopic growth to augment particle size and further increases AOD. It is worth noting that the extinction of haze aerosols in the PBL also decreases the photolysis to suppress the photochemistry, further hindering the secondary aerosol formation to offset effects of ARF on near-surface [PM2.5].
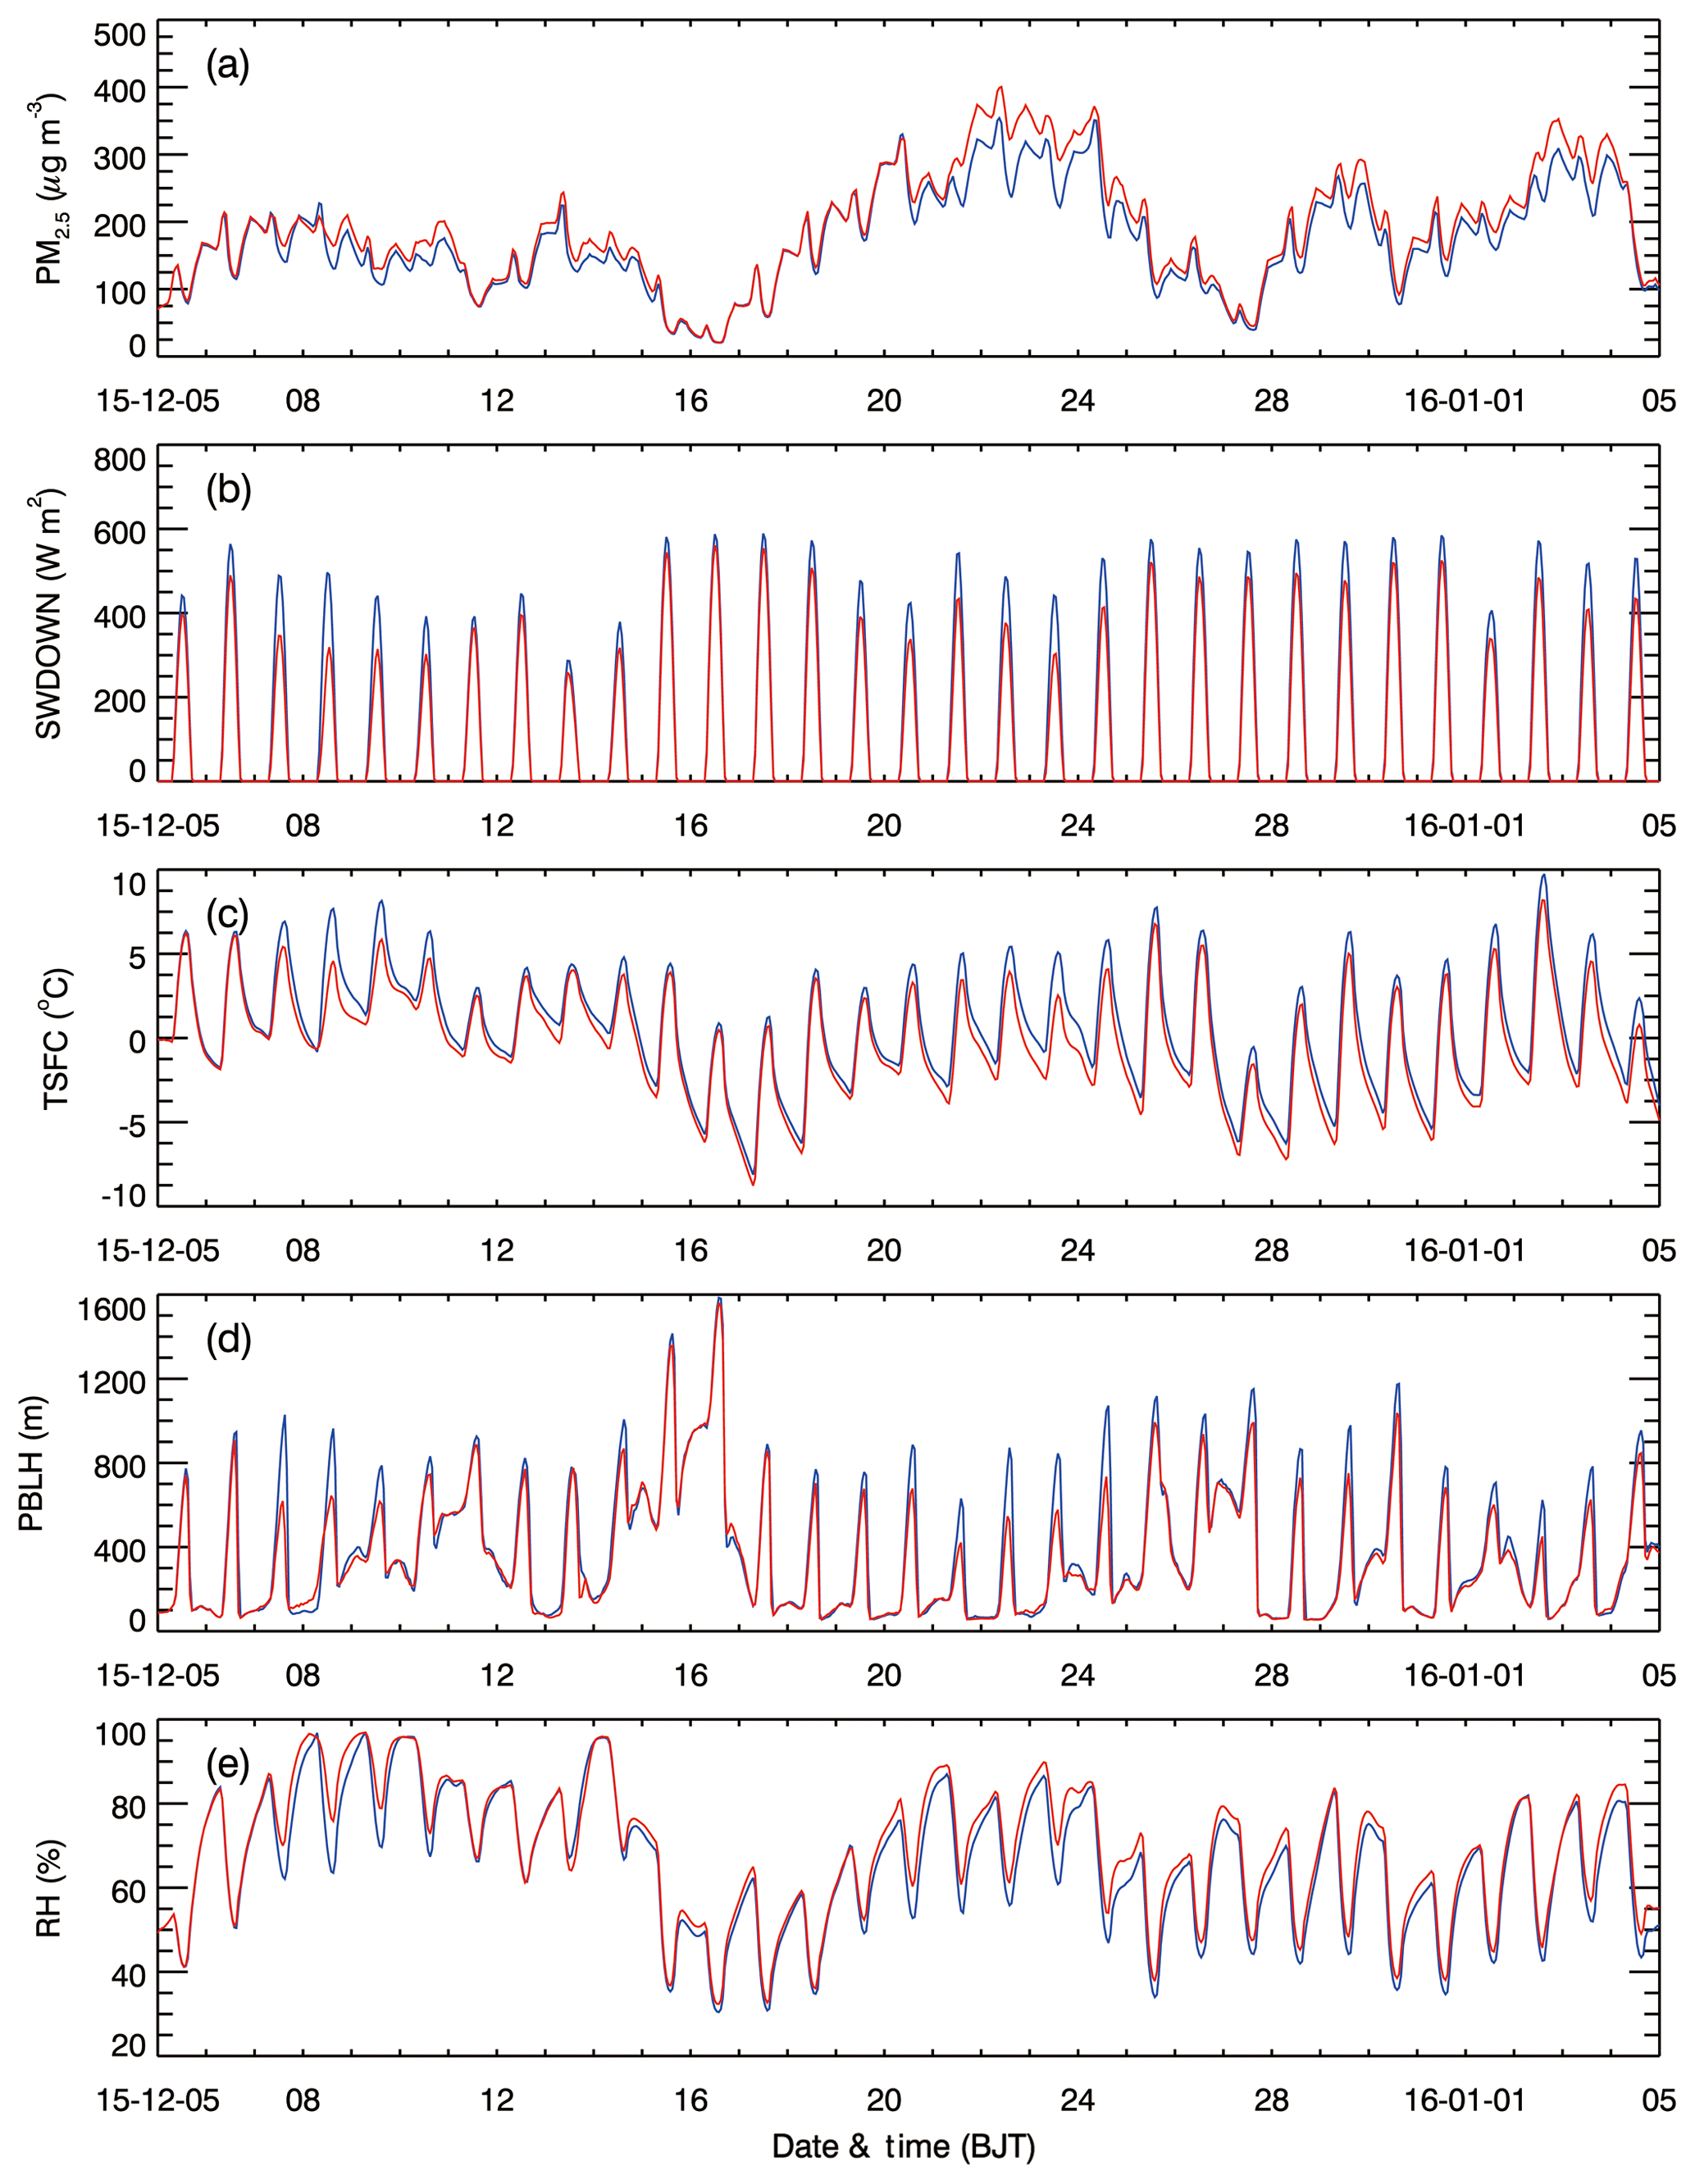
Figure 8Temporal variations of the average (a) near-surface [PM2.5], (b) SWDOWN at the ground surface, (c) TSFC, (d) PBLH, and (e) RH in the most polluted area in the NCP with [PM2.5] of more than 150 µg m−3 in fbase (red solid line) and frad0 (blue solid line) from 5 December 2015 to 4 January 2016.
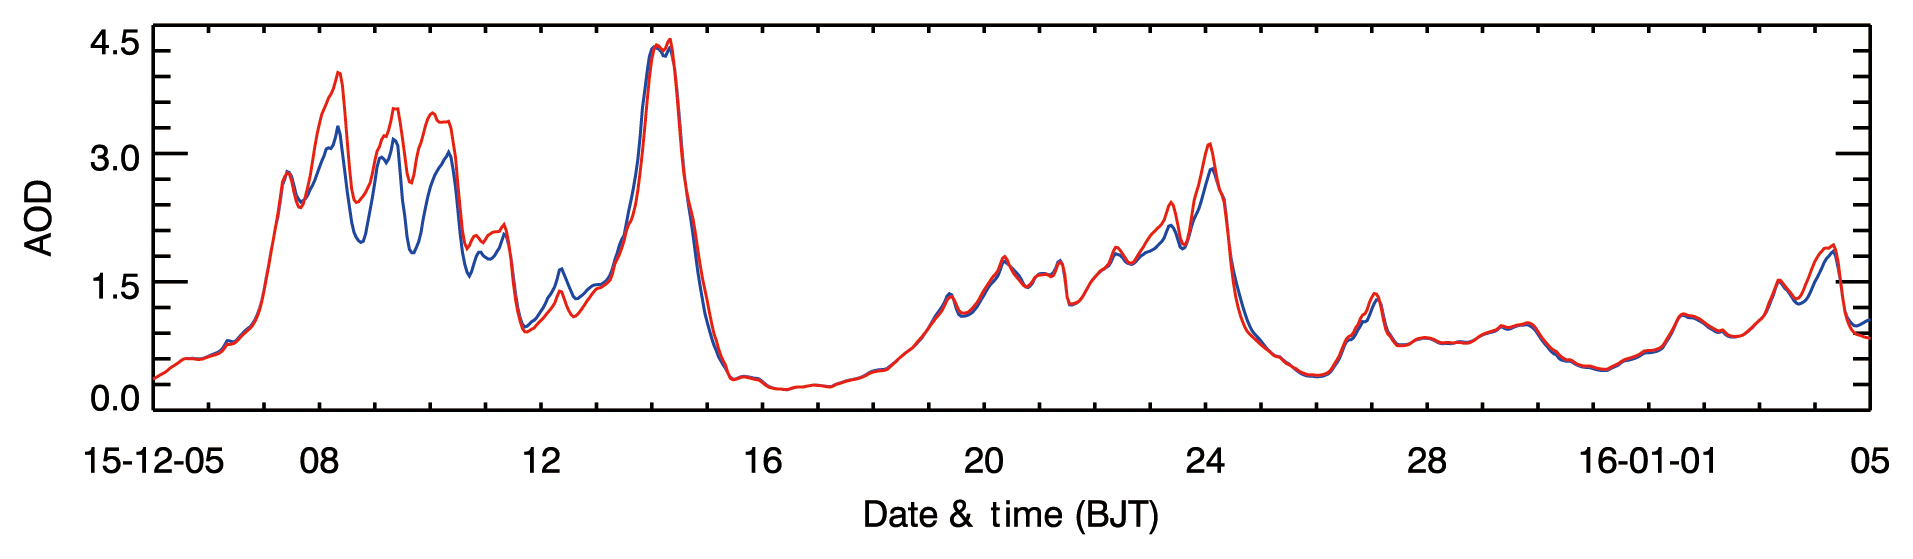
Figure 9Temporal variations of the average AOD at 550 nm in the most polluted area in the NCP with [PM2.5] of more than 150 µg m−3 in fbase (red solid line) and frad0 (blue solid line) from 5 December 2015 to 4 January 2016.
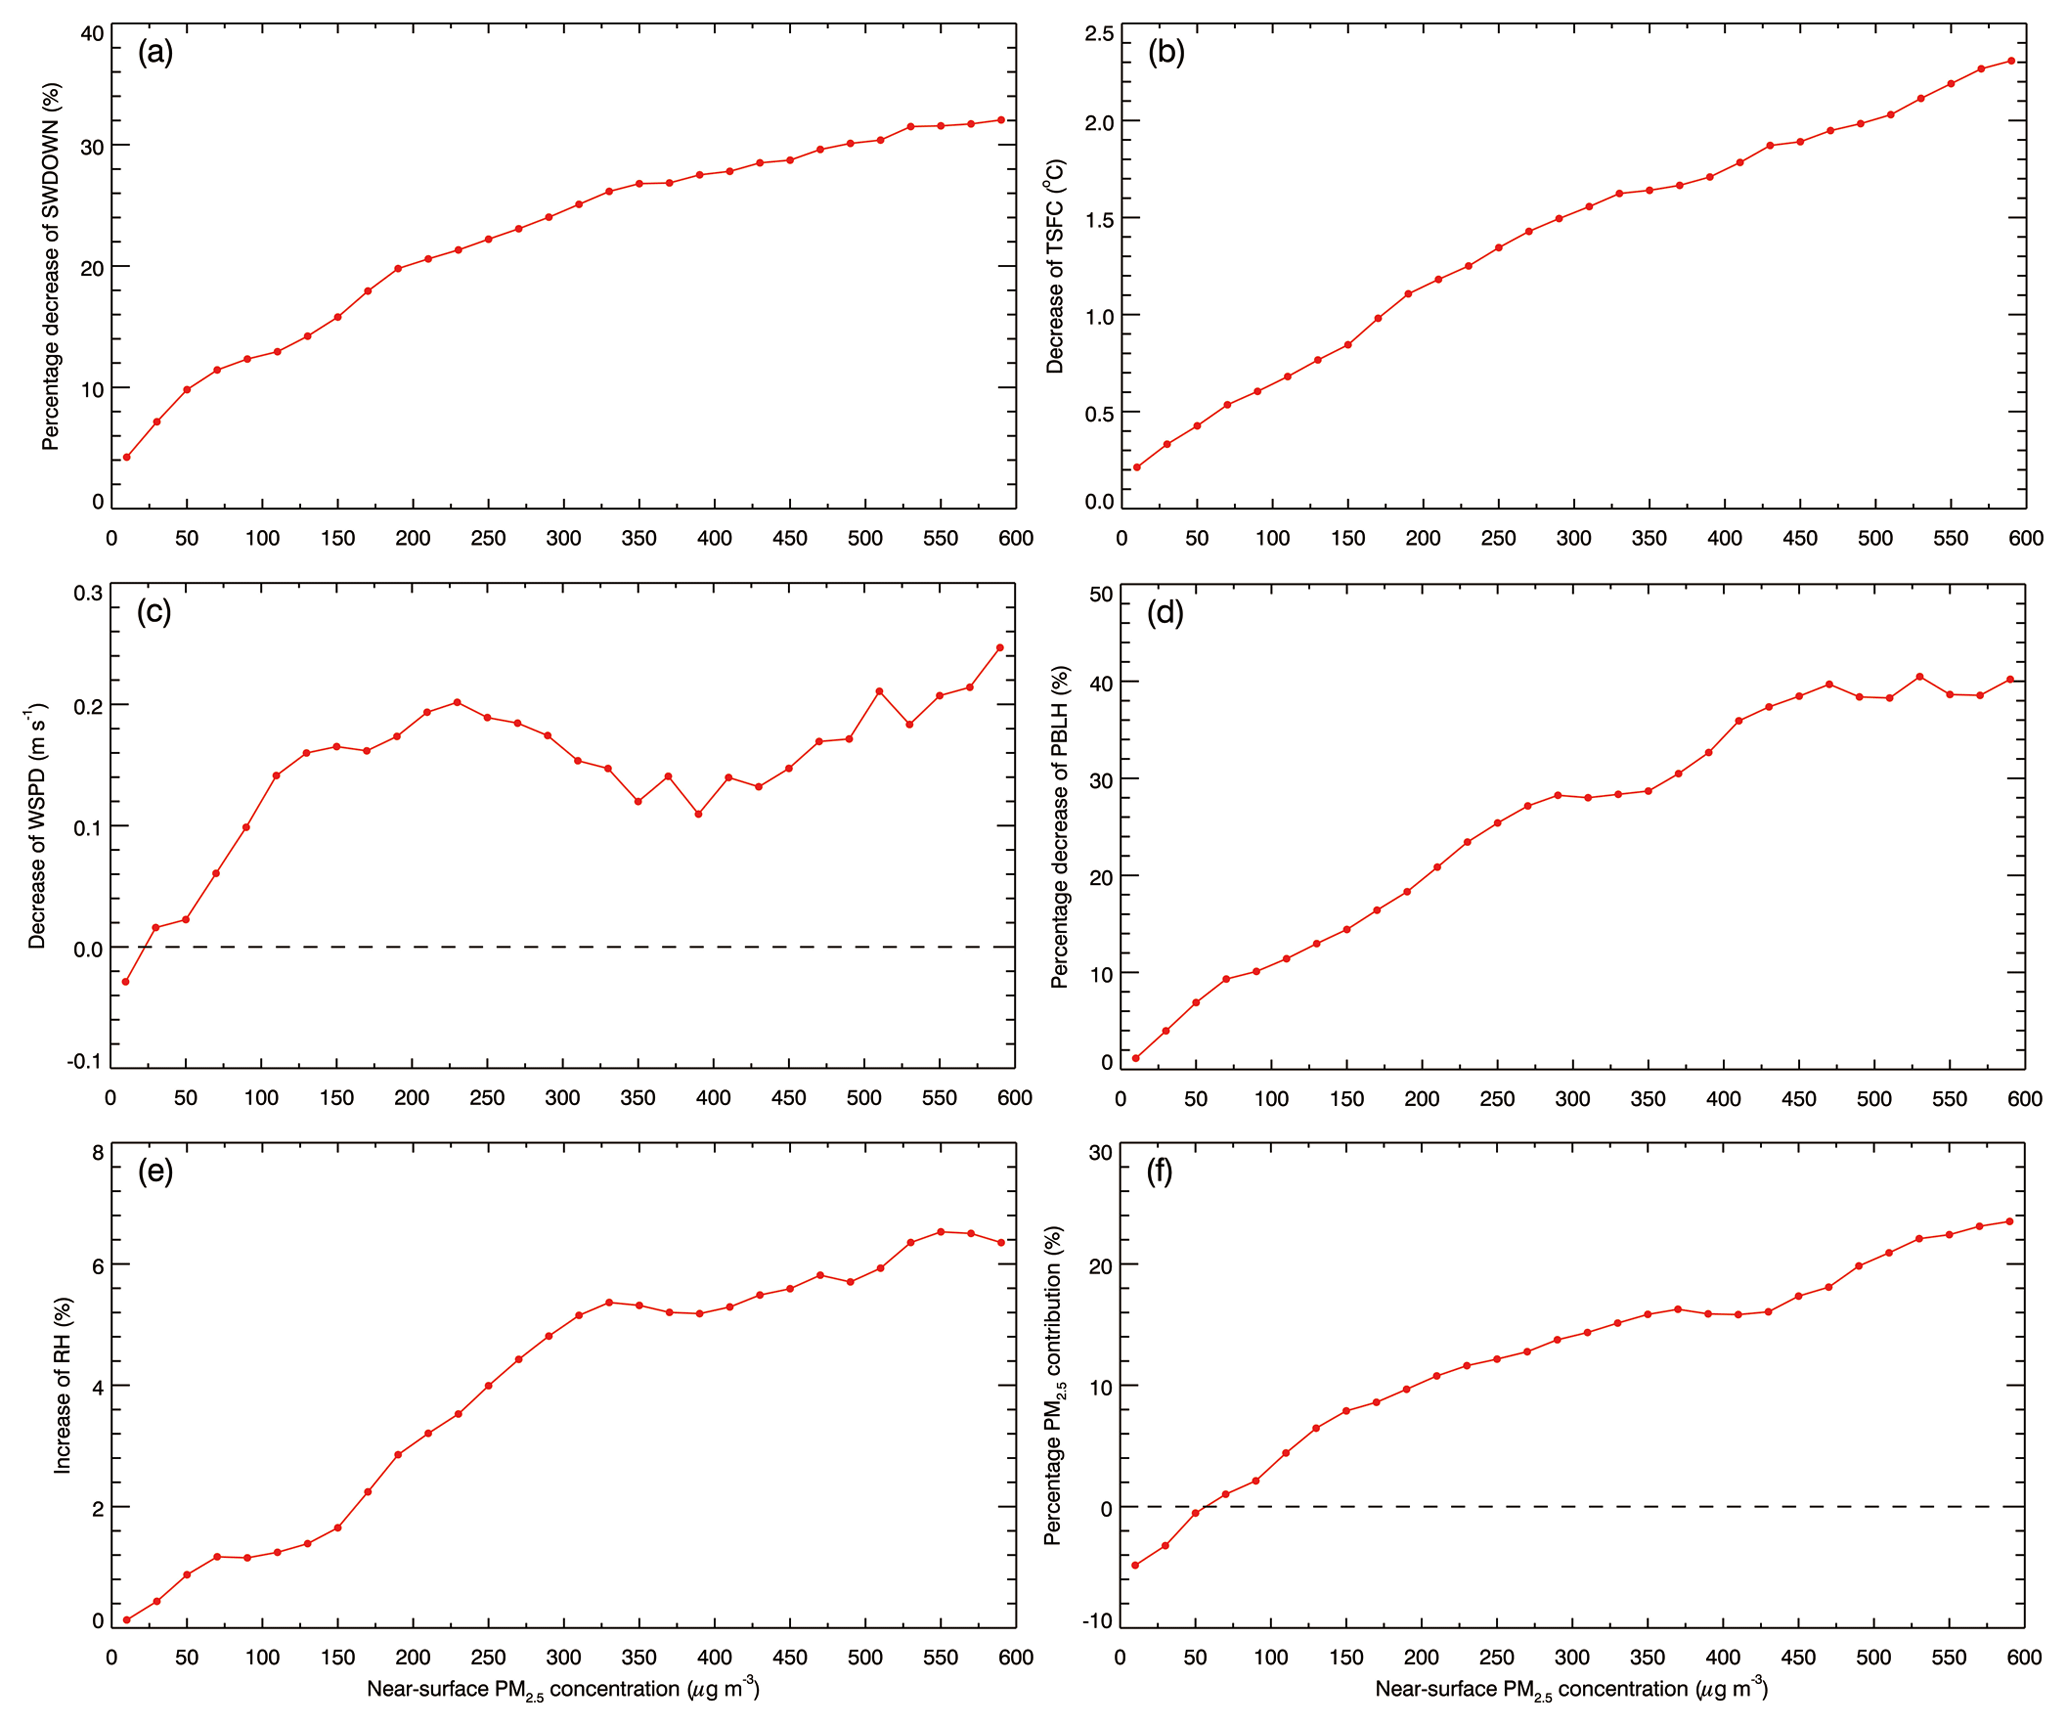
Figure 10Average (a) percentage decrease in SWDOWN at the ground surface, (b) decrease in TSFC, (c) decrease in WSPD, (d) percentage decrease in PBLH, (e) increase of RH, and (f) percentage contribution of near-surface [PM2.5] caused by ARF, as a function of the near-surface [PM2.5] in the NCP during daytime from 5 December 2015 to 4 January 2016.
In order to quantitatively evaluate effects of ARF on near-surface [PM2.5], which cannot be reflected by the temporal variation of near-surface [PM2.5], TSFC, PBLH, and RH, an ensemble method is used in this study. The daytime near-surface [PM2.5] in the NCP during the episode in fbase are first subdivided into 30 bins with an interval of 20 µg m−3. The SWDOWN, TSFC, PBLH, the near-surface WSPD, RH, and [PM2.5] in fbase and frad0 in the same grid cell are assembled as the bin [PM2.5], respectively, and an average of these variables in each bin is calculated. Figure 10 shows the decrease in SWDOWN (%), TSFC (∘C), PBLH (%), WSPD (m s−2) and the increase of RH (%, not percentage change) and near-surface [PM2.5] contribution (%) caused by ARF as a function of bin [PM2.5]. The SWDOWN reaching the ground surface almost decreases linearly with the enhancement of near-surface [PM2.5]. When ARF is considered, aerosols in the atmosphere absorb or scatter the incoming solar radiation, directly attenuating the radiation reaching the ground surface. When near-surface [PM2.5] exceed 200 µg m−3, the SWDOWN at ground surfaces decreases by more than 20 % (Fig. 10a). Moreover, the decrease in the SWDOWN correspondingly lowers the TSFC, and the decrease in the TSFC is generally proportional to near-surface [PM2.5], about 0.35 ∘C per 100 µg m−3 PM2.5 (Fig. 10b). Interestingly, ARF also decreases near-surface WSPD by about 0.1–0.2 m s−1 with near-surface [PM2.5] exceeding 80 µg m−3 (Fig. 10c). When severe air pollution occurs in the NCP during wintertime, atmospheric convergence occurs in the PBL (Liao et al., 2015; Ding et al., 2017). However, the ARF-induced cooling in the low-level air generates a divergence in the NCP, causing the decrease in near-surface WSPD.
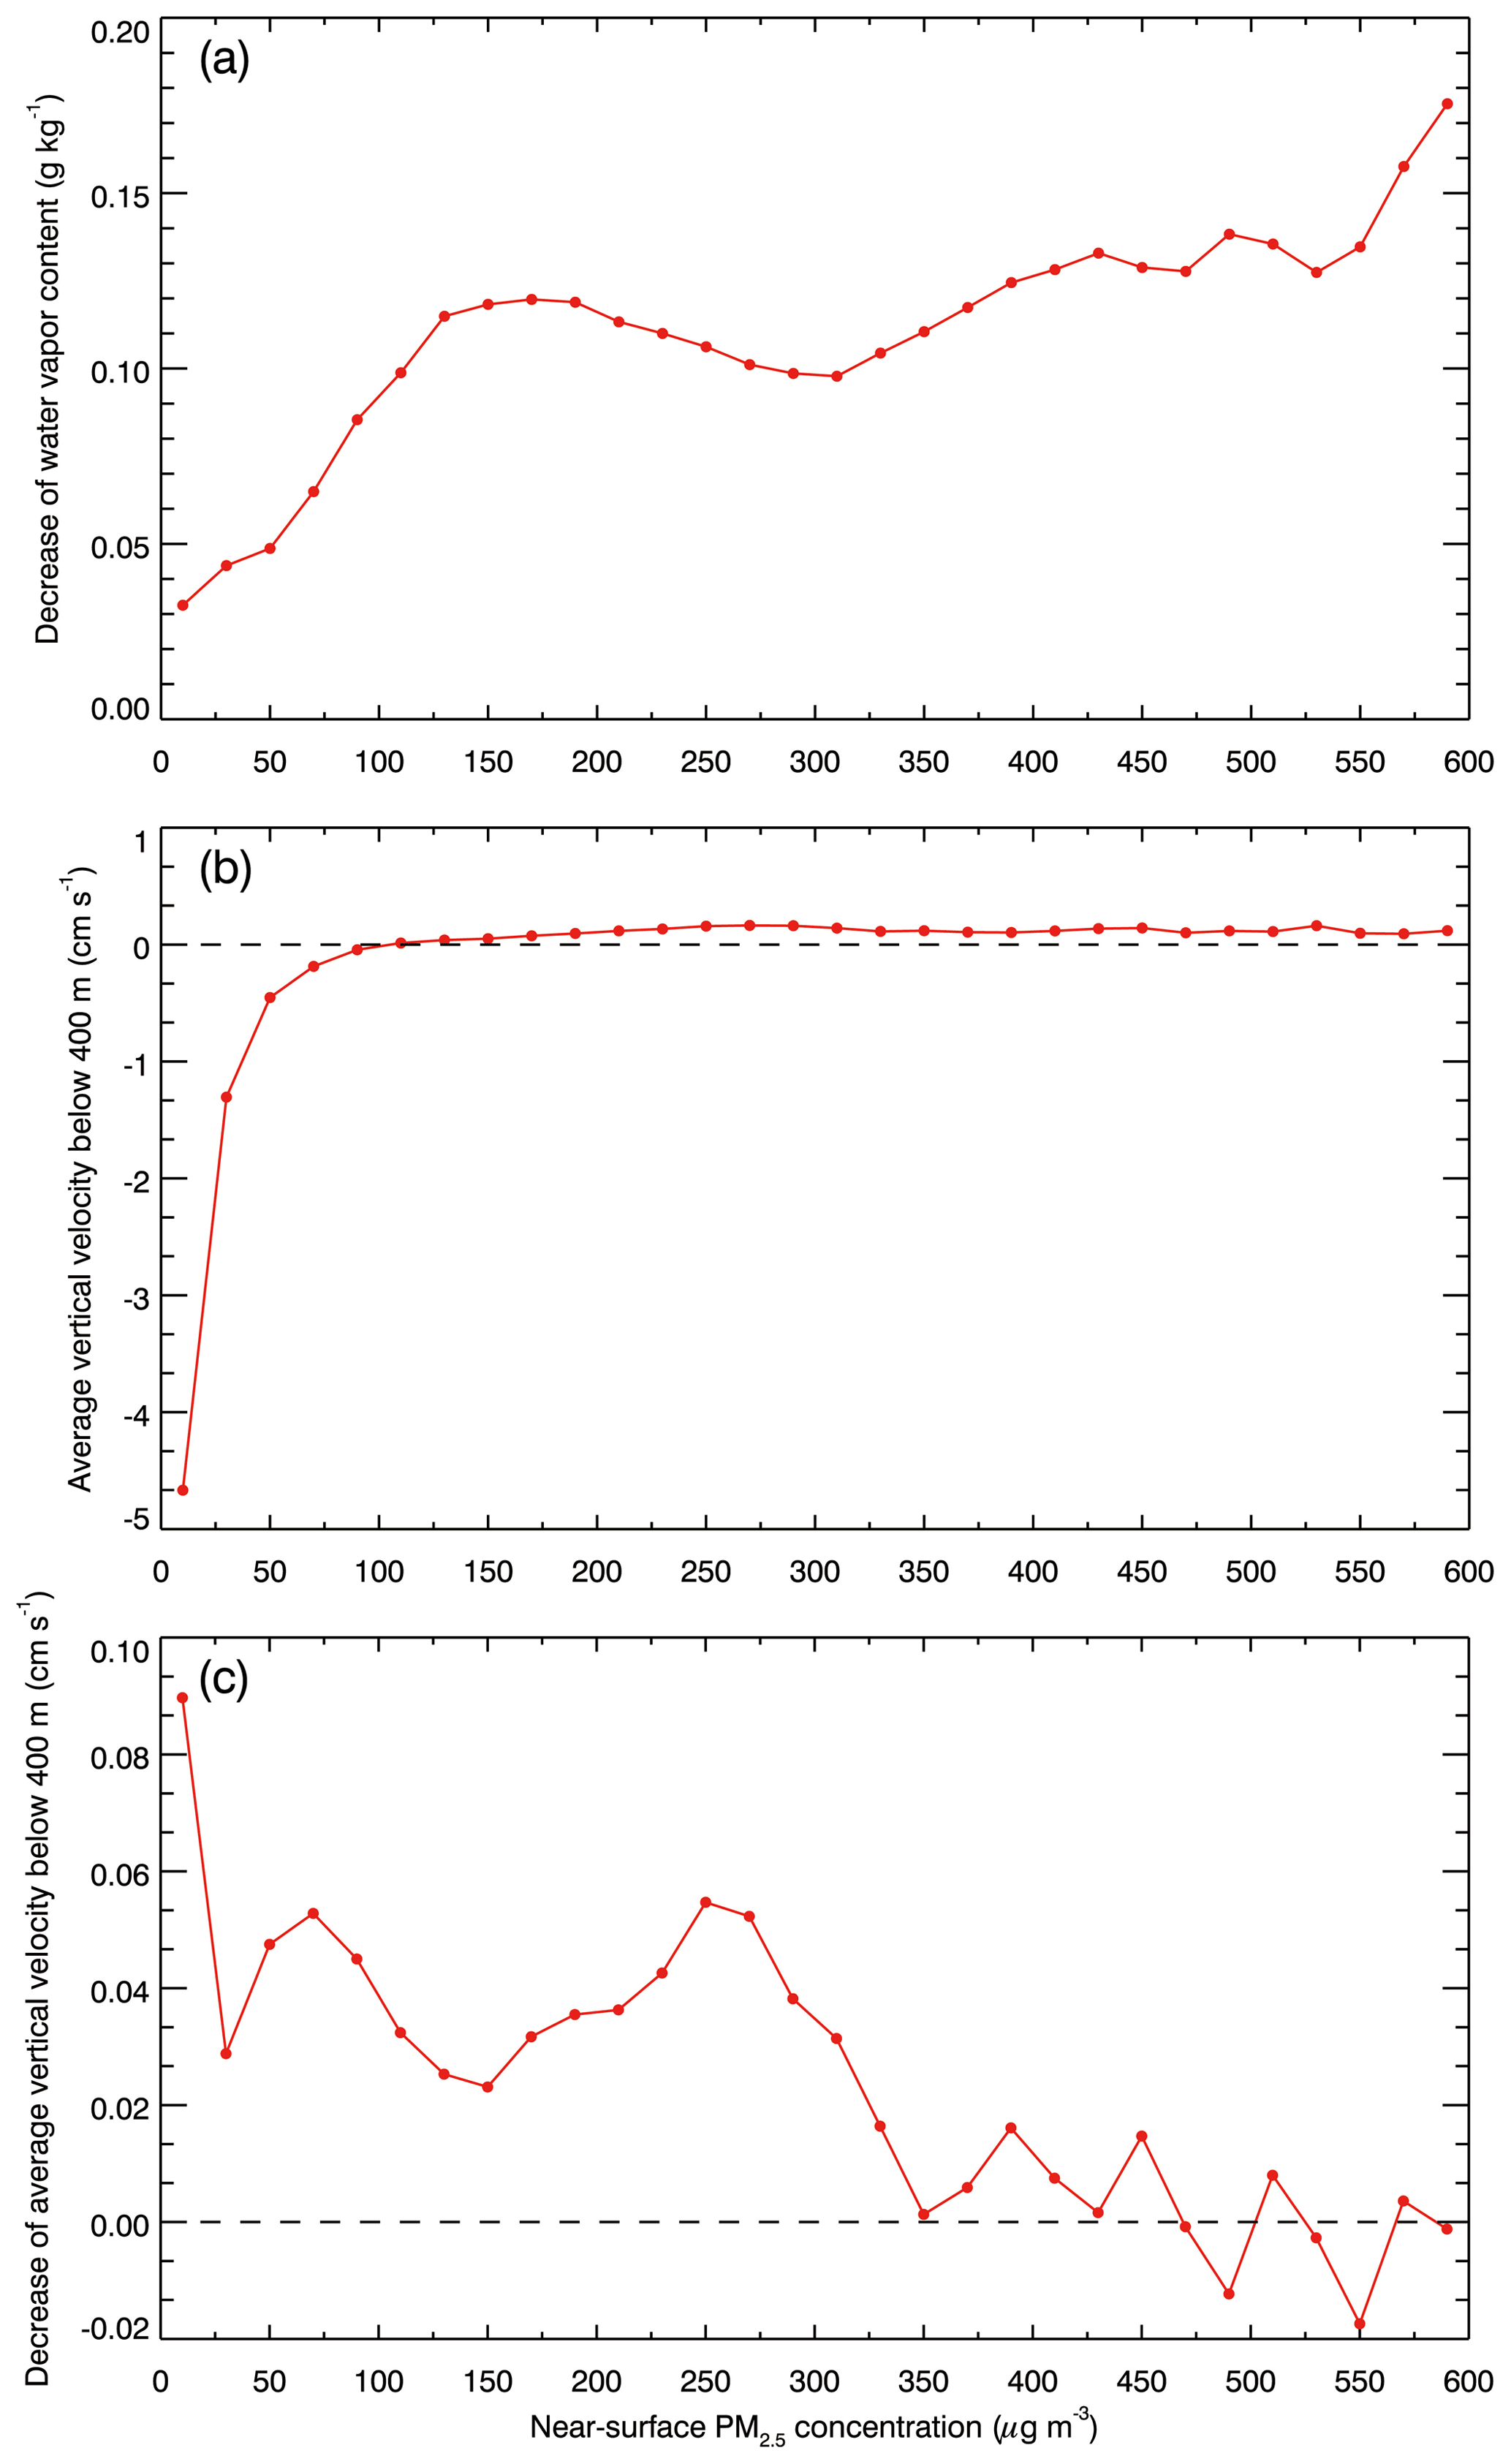
Figure 11Average decrease in (a) near-surface water vapor content and (c) vertical velocity below 400 m caused by ARF, and (b) average vertical velocity below 400 m in frad0 as a function of the near-surface [PM2.5] in the NCP during daytime from 5 December 2015 to 4 January 2016.
The PBLH is primarily determined by the atmospheric dynamic and thermal condition of ground surfaces. Therefore, the decrease in WSPD and TSFC due to ARF subsequently suppresses the PBL development and diminishes the PBLH (Fig. 10d). When near-surface [PM2.5] are less than 250 µg m−3, the PBLH decreases rapidly with increasing [PM2.5]. When the near-surface [PM2.5] are between 250 and 350 µg m−3, the decrease in PBLH is around 28 %. With near-surface [PM2.5] more than 350 µg m−3, the decrease in PBLH exceeds 30 %. As for the ARF effect on water vapor in the PBL, the conceptual model has proposed that the decreased PBL induced by ARF weakens the vertical exchange of water vapor or the dispersion of water vapor is constrained by the shallow PBL (Tie et al., 2017; Liu et al., 2018). However, Fig. 11a shows that ARF decreases the near-surface water vapor content slightly, by more than 0.1 g kg−1 with near-surface [PM2.5] exceeding 100 µg m−3. During the haze episode in the NCP, the abundant moisture in the PBL is mainly transported from the south. The divergence due to cooling caused by ARF weakens the prevailing southerly wind and decreases the moisture transport from the south, reducing the water vapor content in the NCP. Considering that the RH is sensitive to the temperature with a constant water vapor content, the ARF-induced cooling still increases the near-surface RH (Fig. 10e). When near-surface [PM2.5] exceed 300 µg m−3, the RH is increased by more than 5 %, so the heavy haze generally causes the air to be more humid.

Figure 12Near-surface [PM2.5] contribution caused by ARF, averaged from 5 December 2015 to 4 January 2016 in the NCP.
More PM2.5 emitted or formed is trapped by a shallow PBL caused by ARF, and increased RH promotes the aerosol hygroscopic growth and further multiphase reactions, progressively enhancing near-surface [PM2.5] (Fig. 10f). When near-surface [PM2.5] are more than 50 µg m−3, the contribution of ARF to near-surface [PM2.5] consistently increases with the haze deterioration. When the severe haze occurs, i.e., near-surface [PM2.5] exceed 250 µg m−3, more than 12 % or 30 µg m−3 PM2.5 is contributed by ARF. The simulated ARF effects on near-surface [PM2.5] are generally comparable to those reported by previous studies. Z. F. Wang et al. (2014) have shown that ARF increases the monthly PM2.5 concentration by 10 %–30 % in Beijing–Tianjin–Hebei in January 2013. Using the WRF-Chem model, Gao et al. (2015) have indicated that ARF increases the PM2.5 concentration by 10–50 µg m−3 (2 %–30 %) over Beijing, Tianjin, and south Hebei from 10 to 15 January 2013, a period with the simulated maximum hourly surface PM2.5 concentration of more than 600 µg m−3. X. Zhang et al. (2018a) have also quantified the aerosol–meteorology interaction effect on PM2.5 concentrations in China in 2014 using the WRF-Chem model, showing that the increase of PM2.5 concentrations associated with ARF is up to 16 % in China. Other previous studies have also confirmed the ARF effect during the heavy haze pollution episode (Wang et al., 2015; Zhang et al., 2015; Gao et al., 2016). However, when near-surface [PM2.5] are less than 50 µg m−3, the contribution of ARF to near-surface [PM2.5] is negative, although ARF decreases PBLH and increases RH. One of the possible reasons for the negative contribution of ARF is perturbations of wind fields caused by the ARF-induced cooling. Figure 11b presents the average vertical velocity (the net velocity by combining updrafts and downdrafts) below about 400 m in frad0 as a function of near-surface [PM2.5]. Apparently, when ARF is not considered, the area with near-surface [PM2.5] less than 100 µg m−3 is generally controlled by downward airflow, and vice versa, for the area with near-surface [PM2.5] more than 100 µg m−3. The ARF-induced cooling generally causes a downward motion in the PBL (Fig. 11c), which suppresses the upward motion in the area with near-surface [PM2.5] more than 100 µg m−3 to enhance near-surface [PM2.5], but accelerates the downward motion in the area with near-surface [PM2.5] less than 100 µg m−3 to strengthen the divergence intensity, further decreasing near-surface [PM2.5]. Countered by the decrease in PBLH and increase of RH, the ARF contribution becomes positive with near-surface [PM2.5] exceeding 50 µg m−3.
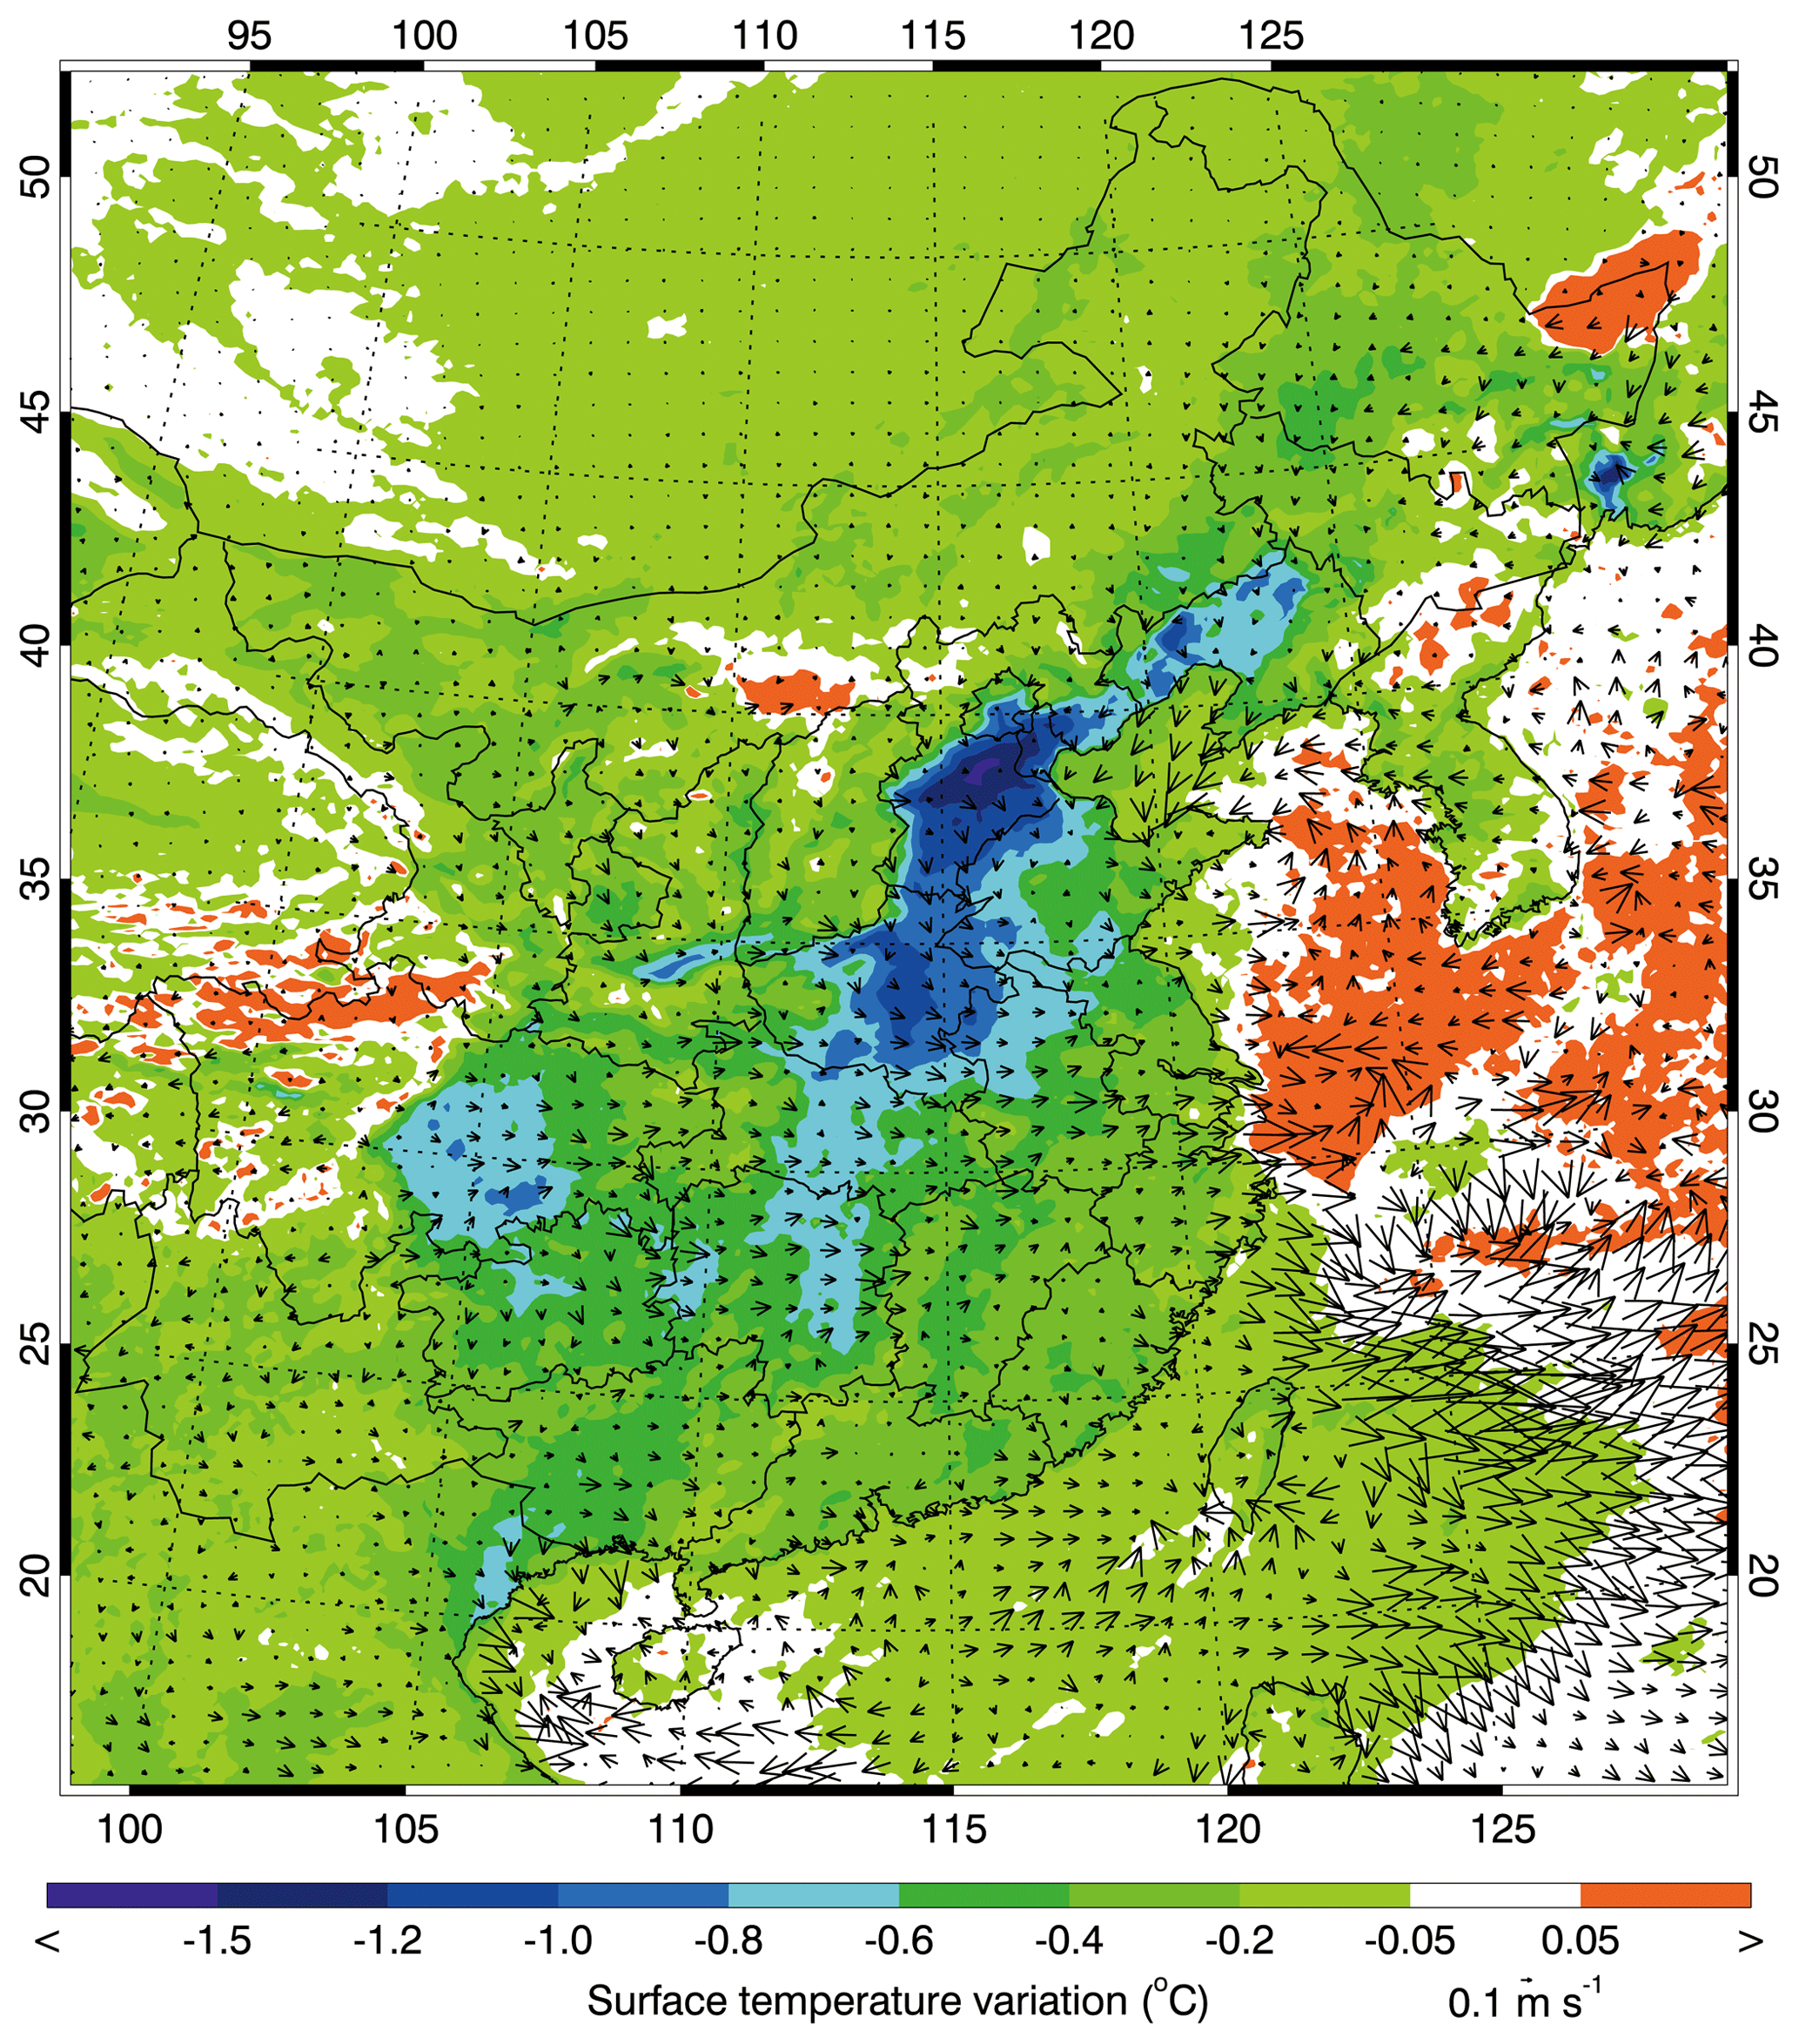
Figure 13TSFC and wind filed variations caused by ARF, averaged from 5 December 2015 to 4 January 2016 in the NCP.
Figure 12 presents spatial distributions of the average near-surface PM2.5 contribution due to ARF during the episode. The average near-surface PM2.5 contribution caused by ARF in the NCP is 10.2 µg m−3 or 7.8 %, with the maximum exceeding 40 µg m−3 in the south of Hebei. On average, the ARF contribution to near-surface [PM2.5] is the most significant in Tianjin, about 17.6 µg m−3 or 10.3 %, followed by Hebei (11.6 µg m−3 or 9.3 %), Shandong (11.5 µg m−3 or 7.3 %), Henan (11.2 µg m−3 or 7.7 %), Anhui (7.7 µg m−3 or 7.4 %), Beijing (7.3 µg m−3 or 6.9 %), and Jiangsu (7.0 µg m−3 or 6.2 %). It is noteworthy that the ARF contribution during the episode in North China is generally positive, but in its surrounding area the contribution becomes negative. At a large scale, when the air pollution occurs during wintertime in North China, the vertical motion over the polluted area generally shows an ascending–descending–ascending distribution from the surface to the middle level of the troposphere, and wind directions present a structure of convergence–divergence–convergence accordingly (Liao et al., 2015; Wu et al., 2017; Ding et al., 2017). ARF cools the low-level atmosphere and induces a downward motion, which suppresses the upward motion in the convergence area in North China to increase near-surface [PM2.5], but accelerates the downward motion in the divergence area to decrease [PM2.5].
Furthermore, when ARF is considered, near-surface [PM2.5] over the East and South China Sea are also increased, with an enhancement less than 5 µg m−3 (about 3 % to more than 15 %). Considering the low near-surface [PM2.5] over sea, the [PM2.5] enhancement might be caused by the PM2.5 transport from the continent. Figure 13 shows the spatial distribution of the TSFC and wind field variation caused by ARF averaged during the episode. Apparently, ARF causes a widespread cooling effect in East China, and the cooling is the most significant in the NCP, with the maximum TSFC decrease exceeding 1.5 ∘C. The cooling effect in the NCP induces a weak northerly wind, decreasing the prevailing southerly wind during the haze episode (Fig. 13). Additionally, the cooling effect over the continent also intensifies the temperature contrast between land and sea, producing a secondary circulation to transport the PM2.5 from the continent to the East and South China Sea.
In the study, a persistent haze pollution episode in the NCP from 5 December 2015 to 4 January 2016 is simulated using the WRF-Chem model to verify the ARF contribution to the haze formation. Generally, the model reproduces the spatial distributions and temporal variations of PM2.5, O3, NO2, SO2, and CO mass concentrations against observations in the NCP well. The calculated temporal variations of aerosol species are also consistent with the ACSM measurement in Beijing, particularly with regard to the simulation of sulfate, nitrate, and ammonium. Moreover, the model simulates the variation of SWDOWN, PBLH, and aerosol radiative properties during the episode reasonably well, compared to the measurement.
Previous studies have established that a positive feedback induced by ARF causes the heavy haze formation by modulating the PBL and RH. However, model results demonstrate that, during the haze development stage in the NCP, ARF does not dominate the accumulation of near-surface [PM2.5], while ARF considerably enhances near-surface [PM2.5] during the haze mature stage.
Ensemble analyses of model results show that, during daytime, ARF attenuates SWDOWN reaching ground surfaces efficiently, and correspondingly the TSFC progressively decreases with increasing near-surface [PM2.5] in the NCP. The ARF-induced cooling generates a divergence in the low-level atmosphere in the NCP, lowering the near-surface WSPD and decreasing the water vapor transport from the south. The decreased WSPD and TSFC caused by ARF hinder the PBL development and the PBLH decreases rapidly with increasing near-surface [PM2.5]. Although the water content in the NCP is decreased slightly, the RH is still increased due to the ARF-induced cooling. A shallow PBL and more humid air caused by ARF accelerate the PM2.5 accumulation and secondary pollutant formation, facilitating heavy haze formation. The contribution of ARF to near-surface [PM2.5] increases from 12 % to 20 % when near-surface [PM2.5] increase from 250 to 500 µg m−3. However, ARF decreases the PM2.5 level with near-surface [PM2.5] less than 50 µg m−3.
The average near-surface PM2.5 contribution of ARF during the episode in the NCP is 10.2 µg m−3 or 7.8 %. ARF aggravates the heavy haze formation in North China, but in its surrounding area ARF slightly mitigates the haze pollution. Generally, there is a structure of convergence–divergence–convergence over the polluted area of North China from the surface to the middle level of the troposphere. A downward motion is induced due to the widespread cooling effect of the low-level atmosphere caused by ARF, impeding the upward motion in the convergence area in North China to increase near-surface [PM2.5] but accelerating the downward motion in the divergence area to decrease [PM2.5].
Although the model performs generally well in simulating air pollutants, aerosol species and radiative properties, SWDOWN, and PBLH, the uncertainties from meteorological fields and the emission inventory still have the potential to influence ARF evaluation. In particular, further studies need to be conducted to improve the AOD simulations. In this study, ARF only considers the aerosol effect on the solar radiation, and the influence of longwave radiation also needs to be included. It is worth noting that modification of photolysis by aerosol scattering or absorbing solar radiation ultimately alters the atmospheric oxidizing capacity to influence the secondary aerosol formation, which potentially offsets the ARF effect on the haze pollution. Hence, further studies need to be performed to evaluate the effect of aerosol photolysis interaction on the haze pollution. In addition, aerosols play an important role in the cloud process serving as cloud condensation nuclei (CCN) and ice nuclei (IN). Therefore, aerosol–cloud interactions (aerosol indirect effect) modify temperature and moisture profiles and further influence precipitation, leading to potential effects on the atmospheric chemistry (Wang et al., 2011). Future studies should be performed to investigate the feedbacks of the aerosol indirect effect on the air pollutants.
The real-time PM2.5, O3, NO2, SO2, and CO observations are accessible for the public on the website http://106.37.208.233:20035/ (last access: 18 October 2018) (China MEP, 2013a). One can also access the historic profile of observed ambient pollutants by visiting http://www.aqistudy.cn/ (last access: 18 October 2018) (China MEP, 2013b).
The supplement related to this article is available online at: https://doi.org/10.5194/acp-19-8703-2019-supplement.
GL, as the contact author, provided the ideas and financial support, developed the model code, verified the conclusions, and revised the paper. JW conducted research, designed the experiments, carried out the methodology, performed the simulation, processed the data, prepared the data visualization, and prepared the manuscript with contributions from all authors. NB provided the treatment of meteorological data, analyzed the study data, validated the model performance, and reviewed the manuscript. BH provided the observation data used in the study, synthesized the observation, and reviewed the paper. SL, MZ, QW, ZL, and YW provided the data and the primary data process and reviewed the manuscript. XL, LL, and TF analyzed the initial simulation data, visualized the model results, and reviewed the paper. JC, XT, and JW provided critical reviews pre-publication stage. LTM provided a critical preview and financial support and revised the manuscript.
The authors declare that they have no conflict of interest.
This article is part of the special issue “Regional transport and transformation of air pollution in eastern China”. It is not associated with a conference.
This work is financially supported by the National Key R&D Plan (Quantitative Relationship and Regulation Principle between Regional Oxidation Capacity of Atmospheric and Air Quality, 2017YFC0210000) and the National Research Program for Key Issues in Air Pollution Control (DQGG0105). Luisa T. Molina acknowledges support from US NSF award 1560494.
This research has been supported by the National Key R&D Plan (Quantitative Relationship and Regulation Principle between Regional Oxidation Capacity of Atmospheric and Air Quality) (grant no. 2017YFC0210000) and the U.S. National Science Foundation (grant no. 1560494).
This paper was edited by Renyi Zhang and reviewed by two anonymous referees.
Ackerman, T. P.: Model of effect of aerosols on urban climates with particular applications to Los-Angeles basin, J. Atmos. Sci., 34, 531–547, https://doi.org/10.1175/1520-0469(1977)034<0531:amoteo>2.0.co;2, 1977.
Binkowski, F. S. and Roselle S. J.: Models-3 Community Multiscale Air Quality (CMAQ) model aerosol component: 1. Model description, J. Geophys. Res., 108, 4183, https://doi.org/10.1029/2001JD001409, 2003.
Boucher, O., Randall, D., Artaxo, P., Bretherton, C., Feingold, G., Forster, P., Kerminen, V. M., Kondo, Y., Liao, H., Lohmann, U., Rasch, P., Satheesh, S. K., Sherwood, S., Stevens, B., and Zhang, X. Y.: Clouds and aerosols, in: Climate Change 2013: The Physical Science Basis. Contribution of Working Group I to the Fifth Assessment Report of the Intergovernmental Panel on Climate Change, Cambridge University Press, Cambridge, UK and New York, NY, USA, 2013.
Chand, D., Wood, R., Ghan, S. J., Wang, M. H., Ovchinnikov, M., Rasch, P. J., Miller, S., Schichtel, B., and Moore, T.: Aerosol optical depth increase in partly cloudy conditions, J. Geophys. Res.-Atmos., 117, D17207, https://doi.org/10.1029/2012jd017894, 2012.
Chen, F. and Dudhia, J.: Coupling an advanced land surface-hydrology model with the Penn State-NCAR MM5 modeling system. Part I: Model implementation and sensitivity, Mon. Weather Rev., 129, 569–585, 2001.
Chou, M.-D. and Suarez, M. J.: A solar radiation parameterization for atmospheric studies, NASA Tech. Rep. NASA/TM-1999-10460, Vol. 15, 38 pp., 1999.
Chou, M.-D. and Suarez, M. J.: A thermal infrared radiation parameterization for atmospheric studies, NASA/TM-2001-104606, Vol. 19, 55 pp., 2001.
d'Almeida, G. A., Koepke, P., and Shettle, E. P.: Atmospheric aerosols: global climatology and radiative Characteristics, 261 pp., A. Deepak, Hampton, Va., 1991.
Ding, A. J., Fu, C. B., Yang, X. Q., Sun, J. N., Petäjä, T., Kerminen, V.-M., Wang, T., Xie, Y., Herrmann, E., Zheng, L. F., Nie, W., Liu, Q., Wei, X. L., and Kulmala, M.: Intense atmospheric pollution modifies weather: a case of mixed biomass burning with fossil fuel combustion pollution in eastern China, Atmos. Chem. Phys., 13, 10545–10554, https://doi.org/10.5194/acp-13-10545-2013, 2013.
Ding, A. J., Huang, X., Nie, W., Sun, J. N., Kerminen, V. M., Petäjä, T., Su, H., Cheng, Y. F., Yang, X. Q., and Wang, M. H.: Enhanced haze pollution by black carbon in megacities in China, Geophys. Res. Lett., 43, 2873–2879, https://doi.org/10.1002/2016GL067745, 2016.
Ding, Y. H., Wu, P., Liu, Y. J., and Song, Y. F.: Environmental and Dynamic Conditions for the Occurrence of Persistent Haze Events in North China, Engineering, 3, 266–271, https://doi.org/10.1016/j.eng.2017.01.009, 2017.
Engstrom, A. and Ekman, A. M. L.: Impact of meteorological factors on the correlation between aerosol optical depth and cloud fraction, Geophys. Res. Lett., 37, L18814, https://doi.org/10.1029/2010gl044361, 2010.
Fast, J. D., Gustafson, W. I., Easter, R. C., Zaveri, R. A., Barnard, J. C., Chapman, E. G., Grell, G., and Peckham, S. E.: Evolution of Ozone, Particulates, and Aerosol Direct Radiative Forcing in the Vicinity of Houston Using a Fully Coupled Meteorology-Chemistry-Aerosol Model, J. Geophys. Res.-Atmos., 111, D21305, https://doi.org/10.1029/2005jd006721, 2006.
Feng, T., Bei, N., Huang, R.-J., Cao, J., Zhang, Q., Zhou, W., Tie, X., Liu, S., Zhang, T., Su, X., Lei, W., Molina, L. T., and Li, G.: Summertime ozone formation in Xi'an and surrounding areas, China, Atmos. Chem. Phys., 16, 4323–4342, https://doi.org/10.5194/acp-16-4323-2016, 2016.
Forkel, R., Werhahn, J., Hansen, A.B., Mckeen, S., Peckham, S., Grell, G., Suppan, P.: Effect of aerosol-radiation feedback on regional air quality – A case study with WRF/Chem, Atmos. Environ., 53, 202–211, 2012.
Fountoukis, C., Nenes, A., Sullivan, A., Weber, R., Van Reken, T., Fischer, M., Matías, E., Moya, M., Farmer, D., and Cohen, R. C.: Thermodynamic characterization of Mexico City aerosol during MILAGRO 2006, Atmos. Chem. Phys., 9, 2141–2156, https://doi.org/10.5194/acp-9-2141-2009, 2009.
Fu, J. S., Hsu, N. C., Gao, Y., Huang, K., Li, C., Lin, N.-H., and Tsay, S.-C.: Evaluating the influences of biomass burning during 2006 BASE-ASIA: a regional chemical transport modeling, Atmos. Chem. Phys., 12, 3837–3855, https://doi.org/10.5194/acp-12-3837-2012, 2012.
Gao, M., Carmichael, G. R., Wang, Y., Saide, P. E., Yu, M., Xin, J., Liu, Z., and Wang, Z.: Modeling study of the 2010 regional haze event in the North China Plain, Atmos. Chem. Phys., 16, 1673–1691, https://doi.org/10.5194/acp-16-1673-2016, 2016.
Gao, Y., Zhang, M., Liu, Z., Wang, L., Wang, P., Xia, X., Tao, M., and Zhu, L.: Modeling the feedback between aerosol and meteorological variables in the atmospheric boundary layer during a severe fog-haze event over the North China Plain, Atmos. Chem. Phys., 15, 4279–4295, https://doi.org/10.5194/acp-15-4279-2015, 2015.
Guo, S., Hu, M., Zamora, M. L., Peng, J. F., Shang, D. J., Zheng, J., Du, Z. F., Wu, Z., Shao, M., Zeng, L. M., Molina, M. J., and Zhang, R. Y.: Elucidating severe urban haze formation in China, P. Natl. Acad. Sci. USA., 111, 17373–17378, https://doi.org/10.1073/pnas.1419604111, 2014.
Grandey, B. S., Stier, P., and Wagner, T. M.: Investigating relationships between aerosol optical depth and cloud fraction using satellite, aerosol reanalysis and general circulation model data, Atmos. Chem. Phys., 13, 3177–3184, https://doi.org/10.5194/acp-13-3177-2013, 2013.
Grell, G. A. and Devenyi, D.: A generalized approach to parameterizing convection combining ensemble and data assimilation techniques, Geophys. Res. Lett., 29, 38-1–38-4, https://doi.org/10.1029/2002GL015311, 2002.
Grell, G. A., Peckham, S. E., Schmitz, R., McKeen, S. A., Frost, G., Skamarock, W. C., and Eder, B.: Fully coupled “online” chemistry within the WRF model, Atmos. Environ., 39, 6957–6975, https://doi.org/10.1016/j.atmosenv.2005.04.027, 2005.
Grell, G., Freitas, S. R., Stuefer, M., and Fast, J.: Inclusion of biomass burning in WRF-Chem: impact of wildfires on weather forecasts, Atmos. Chem. Phys., 11, 5289–5303, https://doi.org/10.5194/acp-11-5289-2011, 2011.
Guenther, A., Karl, T., Harley, P., Wiedinmyer, C., Palmer, P. I., and Geron, C.: Estimates of global terrestrial isoprene emissions using MEGAN (Model of Emissions of Gases and Aerosols from Nature), Atmos. Chem. Phys., 6, 3181–3210, https://doi.org/10.5194/acp-6-3181-2006, 2006.
Hong, S.-Y. and Lim, J.-O. J.: The WRF Single-Moment 6-Class Microphysics Scheme (WSM6), Asia-Pac. J. Atmos. Sci., 42, 129–151, 2006.
Horowitz, L. W., Walters, S., Mauzerall, D. L., Emmons, L. K., Rasch, P. J., Granier, C., Tie, X. X., Lamarque, J. F., Schultz, M. G., Tyndall, G. S., Orlando, J. J., and Brasseur, G. P.: A global simulation of tropospheric ozone and related tracers: Description and evaluation of MOZART, version 2, J. Geophys. Res.-Atmos., 108, 4784, https://doi.org/10.1029/2002jd002853, 2003.
IPCC (Intergovernmental Panel on Climate Change): The Physical Science Basis of Climate Change: Changes in Atmospheric Constituents and in Radiative Forcing, Cambridge University Press, New York, 26–27, 2007.
Jacobson, M. Z.: Studying the effects of aerosols on vertical photolysis rate coefficient and temperature profiles over an urban airshed, J. Geophys. Res.-Atmos., 103, 10593–10604, https://doi.org/10.1029/98jd00287, 1998.
Jacobson, M. Z.: Analysis of aerosol interactions with numerical techniques for solving coagulation, nucleation, condensation, dissolution, and reversible chemistry among multiple size distributions, J. Geophys. Res.-Atmos., 107, AAC 2-1–AAC 2-23, https://doi.org/10.1029/2001jd002044, 2002.
Janjić, Z. I.: Nonsingular Implementation of the Mellor-Yamada Level 2.5 Scheme in the NCEP Meso Model, Ncep Office Note, 436, 2002.
Kawamoto, K., Hayasaka, T., Uno, I., and Ohara, T.: A correlative study on the relationship between modeled anthro- pogenic aerosol concentration and satellite-observed cloud properties over east Asia, J. Geophys. Res.-Atmos., 111, D19201, https://doi.org/10.1029/2005jd006919, 2006.
Koch, D. and Del Genio, A. D.: Black carbon semi-direct effects on cloud cover: review and synthesis, Atmos. Chem. Phys., 10, 7685–7696, https://doi.org/10.5194/acp-10-7685-2010, 2010.
Li, G., Zhang, R., Fan, J., and Tie, X.: Impacts of black carbon aerosol on photolysis and ozone, J. Geophys. Res., 110, D23206, https://doi.org/10.1029/2005jd005898, 2005.
Li, G., Wang, Y., and Zhang, R.: Implementation of a two-moment bulk microphysics scheme to the WRF model to investigate aerosol-cloud interaction, J. Geophys. Res., 113, D15211, https://doi.org/10.1029/2007JD009361, 2008a.
Li, G., Wang, Y., Lee, K.-H., Diao, Y., and, Zhang, R.: Increased winter precipitation over the North Pacific from 1984–1994 to 1995–2005 inferred from the Global Precipitation Climatology Project, Geophys. Res. Lett., 35, L13821, https://doi.org/10.1029/2008GL034668, 2008b.
Li, G., Wang, Y., Lee, K.-H., Diao, Y., and Zhang, R.: Impacts of aerosols on the development and precipitation of a mesoscale squall line, J. Geophys. Res., 114, D17205, https://doi.org/10.1029/2008JD011581, 2009.
Li, G., Lei, W., Zavala, M., Volkamer, R., Dusanter, S., Stevens, P., and Molina, L. T.: Impacts of HONO sources on the photochemistry in Mexico City during the MCMA-2006/MILAGO Campaign, Atmos. Chem. Phys., 10, 6551–6567, https://doi.org/10.5194/acp-10-6551-2010, 2010.
Li, G., Bei, N., Tie, X., and Molina, L. T.: Aerosol effects on the photochemistry in Mexico City during MCMA-2006/MILAGRO campaign, Atmos. Chem. Phys., 11, 5169–5182, https://doi.org/10.5194/acp-11-5169-2011, 2011a.
Li, G., Zavala, M., Lei, W., Tsimpidi, A. P., Karydis, V. A., Pandis, S. N., Canagaratna, M. R., and Molina, L. T.: Simulations of organic aerosol concentrations in Mexico City using the WRF-CHEM model during the MCMA-2006/MILAGRO campaign, Atmos. Chem. Phys., 11, 3789–3809, https://doi.org/10.5194/acp-11-3789-2011, 2011b.
Li, G., Lei, W., Bei, N., and Molina, L. T.: Contribution of garbage burning to chloride and PM2.5 in Mexico City, Atmos. Chem. Phys., 12, 8751–8761, https://doi.org/10.5194/acp-12-8751-2012, 2012.
Li, G., Bei, N., Cao, J., Huang, R., Wu, J., Feng, T., Wang, Y., Liu, S., Zhang, Q., Tie, X., and Molina, L. T.: A possible pathway for rapid growth of sulfate during haze days in China, Atmos. Chem. Phys., 17, 3301–3316, https://doi.org/10.5194/acp-17-3301-2017, 2017a.
Li, G., Bei, N., Cao, J., Wu, J., Long, X., Feng, T., Dai, W., Liu, S., Zhang, Q., and Tie, X.: Widespread and persistent ozone pollution in eastern China during the non-winter season of 2015: observations and source attributions, Atmos. Chem. Phys., 17, 2759–2774, https://doi.org/10.5194/acp-17-2759-2017, 2017b.
Liao, X., Sun, Z., Tang, Y., Pu, W., Li, Z., and Lu, B.: Meteorological mechanism for the formation of a serious pollution case in Beijing in the background of northerly flow at upper levels, Environm. Sci., 36, 801–808, 2015 (in Chinese).
Liggio, J., Li, S. M., and McLaren, R.: Reactive uptake of glyoxal by particulate matter, J. Geophys. Res.-Atmos., 110, D10304, https://doi.org/10.1029/2004jd005113, 2005.
Liu, H., Hu, B., Zhang, L., Wang, Y. S., and Tian, P. F.: Spatiotemporal characteristics of ultraviolet radiation in recent 54 years from measurements and reconstructions over the Tibetan Plateau, J. Geophys. Res.-Atmos., 121, 7673–7690, https://doi.org/10.1002/2015jd024378, 2016.
Liu, Q., Jia, X. C., Quan, J. N., Li, J. Y., Li, X., Wu, Y. X., Chen, D., Wang, Z. F., and Liu, Y. G.: New positive feedback mechanism between boundary layer meteorology and secondary aerosol formation during severe haze events, Sci. Rep.-UK, 8, 6095, https://doi.org/10.1038/s41598-018-24366-3, 2018.
Ministry of Environmental Protection, China (China MEP): Air Quality Observation Real-time Release Platform of MEP Data Center, available at: http://106.37.208.233:20035/ (last access: 18 October 2018), 2013a.
Ministry of Environmental Protection, China (China MEP): Online Monitoring and Analysis Platform of China Air Quality, available at: http://www.aqistudy.cn/ (last access: 18 October 2018), 2013b.
Nakajima, T., Higurashi, A., Kawamoto, K., and Penner, J. E.: A possible correlation between satellite-derived cloud and aerosol microphysical parameters, Geophys. Res. Lett., 28, 1171–1174, https://doi.org/10.1029/2000gl012186, 2001.
Nenes, A., Pandis, S. N., and Pilinis, C.: ISORROPIA: A new thermodynamic equilibrium model for multiphase multicomponent inorganic aerosols, Aquat. Geochem., 4, 123–152, https://doi.org/10.1023/a:1009604003981, 1998.
Penner, J. E., Xu, L., Liousse, C., Assamoi, E., Flanner, M. G., Edwards, R., and McConnell, J.: Atmospheric absorption: Can observations constrain the direct and indirect effect of organic and BC aerosols on climate, American Geophysical Union, AGU Fall Meeting Abstract, 2010.
Perez, C., Nickovic, S., Pejanovic, G., Baldasano, J. M., and Ozsoy, E.: Interactive dust-radiation modeling: A step to improve weather forecasts, J. Geophys. Res.-Atmos., 111, D16206, https://doi.org/10.1029/2005jd006717, 2006.
Petäjä, T., Järvi, L., Kerminen, V. M., Ding, A. J., Sun, J. N., Nie, W., Kujansuu, J., Virkkula, A., Yang, X., and Fu, C. B.: Enhanced air pollution via aerosol-boundary layer feedback in China, Sci. Rep.-UK, 6, 18998, https://doi.org/10.1038/srep18998, 2016.
Pui, D. Y. H., Chen, S. C., and Zuo, Z. L.: PM2.5 in China: Measurements, sources, visibility and health effects, and mitigation, Particuology, 13, 1–26, https://doi.org/10.1016/j.partic.2013.11.001, 2014.
Quan, J., Gao, Y., Zhang, Q., Tie, X., Cao, J., Han, S., Meng, J., Chen, P., and Zhao, D.: Evolution of planetary boundary layer under different weather conditions, and its impact on aerosol concentrations, Particuology, 11, 34–40, https://doi.org/10.1016/j.partic.2012.04.005, 2013.
Robinson, A. L., Donahue, N. M., Shrivastava, M. K., Weitkamp, E. A., Sage, A. M., Grieshop, A. P., Lane, T. E., Pandis, S. N., and Pierce, J. R.: Rethinking organic aerosols: semivolatile emissions and photochemical aging, Science, 315, 1259–1262, 2007.
Santese, M., Perrone, M. R., Zakey, A. S., De Tomasi, F., and Giorgi, F.: Modeling of Saharan dust outbreaks over the Mediterranean by RegCM3: case studies, Atmos. Chem. Phys., 10, 133–156, https://doi.org/10.5194/acp-10-133-2010, 2010.
Satheesh, S. K., Vinoj, V., and Krishnamoorthy, K.: Assessment of Aerosol Radiative Impact over Oceanic Regions Adjacent to Indian Subcontinent Using Multisatellite Analysis, Adv. Meteorol., 13, 139186, https://doi.org/10.1155/2010/139186, 2010.
Shrivastava, M. K., Lane, T. E., Donahue, N. M., Pandis, S. N., and Robinson, A. L.: Effects of gas particle partitioning and aging of primary emissions on urban and regional organic aerosol concentrations, J. Geophys. Res.-Atmos., 113, D18301, https://doi.org/10.1029/2007jd009735, 2008.
Sivaraman, C., McFarlane, S., and Chapman E.: Planetary boundary layer (PBL) height value added product (VAP): Radiosonde retrievals [J/OL], U.S. DOE, Office of Science, Office of Biological and Environment Research, DOE/SC-ARM/TR-132, available at: http://www.doc88.com/p-9032320085477.html (last access: 25 October 2018), 2013.
Taylor, K.: Summarizing multiple aspects of model performance in single diagram, J. Geophys. Res., 106, 7183–7192, 2001.
Tie, X., Huang, R. J., Cao, J., Zhang, Q., Cheng, Y., Su, H., Chang, D., Pöschl, U., Hoffmann, T., and Dusek, U.: Severe Pollution in China Amplified by Atmospheric Moisture, Sci. Rep.-UK, 7, 15760, https://doi.org/10.1038/s41598-017-15909-1, 2017.
Vogel, B., Vogel, H., Bäumer, D., Bangert, M., Lundgren, K., Rinke, R., and Stanelle, T.: The comprehensive model system COSMO-ART – Radiative impact of aerosol on the state of the atmosphere on the regional scale, Atmos. Chem. Phys., 9, 8661–8680, https://doi.org/10.5194/acp-9-8661-2009, 2009.
Volkamer, R., Martini, F. S., Molina, L. T., Salcedo, D., Jimenez, J. L., and Molina, M. J.: A missing sink for gas-phase glyoxal in Mexico City: Formation of secondary organic aerosol, Geophys. Res. Lett., 34, L19807, https://doi.org/10.1029/2007gl030752, 2007.
Wang, H., Shi, G. Y., Zhang, X. Y., Gong, S. L., Tan, S. C., Chen, B., Che, H. Z., and Li, T.: Mesoscale modelling study of the interactions between aerosols and PBL meteorology during a haze episode in China Jing-Jin-Ji and its near surrounding region – Part 2: Aerosols' radiative feedback effects, Atmos. Chem. Phys., 15, 3277–3287, https://doi.org/10.5194/acp-15-3277-2015, 2015.
Wang, J., Wang, S., Jiang, J., Ding, A., Zheng, M., Zhao, B., Wong, D. C., Zhou, W., Zheng, G., and Wang, L.: Impact of aerosol-meteorology interactions on fine particle pollution during China's severe haze episode in January 2013, Environ. Res. Lett., 9, 094002, https://doi.org/10.1088/1748-9326/9/9/094002, 2014.
Wang, Y., Wan, Q., Meng, W., Liao, F., Tan, H., and Zhang, R.: Long-term impacts of aerosols on precipitation and lightning over the Pearl River Delta megacity area in China, Atmos. Chem. Phys., 11, 12421–12436, https://doi.org/10.5194/acp-11-12421-2011, 2011.
Wang, Z. F., Li, J., Wang, Z., Yang, W. Y., Tang, X., Ge, B. Z., Yan, P. Z., Zhu, L. L., Chen, X. S., Chen, H. S., Wand, W., Li, J. J., Liu, B., Wang, X. Y., Wand, W., Zhao, Y. L., Lu, N., and Su, D. B.: Modeling study of regional severe hazes over mid-eastern China in January 2013 and its implications on pollution prevention and control, Sci. China Earth Sci., 57, 3–13, https://doi.org/10.1007/s11430-013-4793-0, 2014.
Wesely, M. L.: Parameterization of surface resistances to gaseous dry deposition in regional-scale numerical models, Atmos. Environ., 23, 1293–1304, https://doi.org/10.1016/0004-6981(89)90153-4, 1989.
Wong, D. C., Pleim, J., Mathur, R., Binkowski, F., Otte, T., Gilliam, R., Pouliot, G., Xiu, A., Young, J. O., and Kang, D.: WRF-CMAQ two-way coupled system with aerosol feedback: software development and preliminary results, Geosci. Model Dev., 5, 299–312, https://doi.org/10.5194/gmd-5-299-2012, 2012.
Wu, P., Ding, Y. H., and Liu, Y. J.: Atmospheric circulation and dynamic mechanism for persistent haze events in the Beijing-Tianjin-Hebei region, Adv. Atmos. Sci., 34, 429–440, https://doi.org/10.1007/s00376-016-6158-z, 2017.
Yang, X., Zhao, C., Guo, J., and Wang, Y.: Intensification of aerosol pollution associated with its feedback with surface solar radiation and winds in Beijing, J. Geophys. Res.-Atmos., 121, 4093–4099, 2016.
Zhang, B., Wang, Y., and Hao, J.: Simulating aerosol-radiation-cloud feedbacks on meteorology and air quality over eastern China under severe haze conditionsin winter, Atmos. Chem. Phys., 15, 2387–2404, https://doi.org/10.5194/acp-15-2387-2015, 2015.
Zhang, D. F., Zakey, A. S., Gao, X. J., Giorgi, F., and Solmon, F.: Simulation of dust aerosol and its regional feedbacks over East Asia using a regional climate model, Atmos. Chem. Phys., 9, 1095–1110, https://doi.org/10.5194/acp-9-1095-2009, 2009.
Zhang, Q., Streets, D. G., Carmichael, G. R., He, K. B., Huo, H., Kannari, A., Klimont, Z., Park, I. S., Reddy, S., Fu, J. S., Chen, D., Duan, L., Lei, Y., Wang, L. T., and Yao, Z. L.: Asian emissions in 2006 for the NASA INTEX-B mission, Atmos. Chem. Phys., 9, 5131–5153, https://doi.org/10.5194/acp-9-5131-2009, 2009.
Zhang, R., Suh, I., Zhao, J., Zhang, D., Fortner, E. C., Tie, X., Molina, L. T., and Molina, M. J.: Atmospheric new particle formation enhanced by organic acids, Science, 304, 1487–1490, 2004.
Zhang, R., Jing, J., Tao, J., Hsu, S.-C., Wang, G., Cao, J., Lee, C. S. L., Zhu, L., Chen, Z., Zhao, Y., and Shen, Z.: Chemical characterization and source apportionment of PM2.5 in Beijing: seasonal perspective, Atmos. Chem. Phys., 13, 7053–7074, https://doi.org/10.5194/acp-13-7053-2013, 2013.
Zhang, R. Y., Li, G. H., Fan, J. W., Wu, D. L., and Molina, M. J.: Intensification of Pacific storm track linked to Asian pollution, P. Natl. Acad. Sci. USA, 104, 5295–5299, https://doi.org/10.1073/pnas.0700618104, 2007.
Zhang, X., Zhang, Q., Hong, C. P., Zheng, Y. X., Geng, G. N., Tong, D., Zhang, Y. X., and Zhang, X. Y.: Enhancement of PM2.5 Concentrations by Aerosol-Meteorology Interactions Over China, J. Geophys. Res.-Atmos., 123, 1179–1194, https://doi.org/10.1002/2017jd027524, 2018a.
Zhang, X., Zhong, J., Wang, J., Wang, Y., and Liu, Y.: The interdecadal worsening of weather conditions affecting aerosol pollution in the Beijing area in relation to climate warming, Atmos. Chem. Phys., 18, 5991–5999, https://doi.org/10.5194/acp-18-5991-2018, 2018b.
Zhang, Y., Wen, X. Y., and Jang, C. J.: Simulating chemistry-aerosol-cloud-radiation-climate feedbacks over the continental U.S. using the online-coupled weather research forecasting model with chemistry (WRF/Chem), Atmos. Environ., 44, 3568–3582, 2010.
Zhao, C. S., Ishizaka, Y., and Peng, D. Y.: Numerical study on impacts of multi-component aerosols on marine cloud microphysical properties, J. Meteorol. Soc. Jpn., 83, 977–986, https://doi.org/10.2151/jmsj.83.977, 2005.
Zhao, J., Levitt, N. P., Zhang, R., and Chen, J.: Heterogeneous reactions of methylglyoxal in acidic media: implications for secondary organic aerosol formation, Environ. Sci. Technol., 40, 7682–7687, 2006.
Zhong, J., Zhang, X., Dong, Y., Wang, Y., Liu, C., Wang, J., Zhang, Y., and Che, H.: Feedback effects of boundary-layer meteorological factors on cumulative explosive growth of PM2.5 during winter heavy pollution episodes in Beijing from 2013 to 2016, Atmos. Chem. Phys., 18, 247–258, https://doi.org/10.5194/acp-18-247-2018, 2018.