the Creative Commons Attribution 4.0 License.
the Creative Commons Attribution 4.0 License.
 | 03 Jul 2019
Land cover and its transformation in the backward trajectory footprint region of the Amazon Tall Tower Observatory
David Walter
Hauke Paulsen
Tobias Könemann
Emilio Rodríguez-Caballero
Daniel Moran-Zuloaga
Joel Brito
Samara Carbone
Céline Degrendele
Viviane R. Després
Florian Ditas
Bruna A. Holanda
Johannes W. Kaiser
Gerhard Lammel
Jošt V. Lavrič
Jing Ming
Daniel Pickersgill
Mira L. Pöhlker
Maria Praß
Nina Löbs
Jorge Saturno
Matthias Sörgel
Qiaoqiao Wang
Bettina Weber
Stefan Wolff
Paulo Artaxo
Ulrich Pöschl
Meinrat O. Andreae
The Amazon rain forest experiences the combined pressures from human-made deforestation and progressing climate change, causing severe and potentially disruptive perturbations of the ecosystem's integrity and stability. To intensify research on critical aspects of Amazonian biosphere–atmosphere exchange, the Amazon Tall Tower Observatory (ATTO) has been established in the central Amazon Basin. Here we present a multi-year analysis of backward trajectories to derive an effective footprint region of the observatory, which spans large parts of the particularly vulnerable eastern basin. Further, we characterize geospatial properties of the footprint regions, such as climatic conditions, distribution of ecoregions, land cover categories, deforestation dynamics, agricultural expansion, fire regimes, infrastructural development, protected areas, and future deforestation scenarios. This study is meant to be a resource and reference work, helping to embed the ATTO observations into the larger context of human-caused transformations of Amazonia. We conclude that the chances to observe an unperturbed rain forest–atmosphere exchange at the ATTO site will likely decrease in the future, whereas the atmospheric signals from human-made and climate-change-related forest perturbations will increase in frequency and intensity.
- Article
(50600 KB) - Full-text XML
-
Supplement
(14152 KB) - BibTeX
- EndNote


The Earth is increasingly shaped by human activities (Crutzen, 2002; Song et al., 2018). Concerning the atmosphere, global climate change and air quality impacts on human health are two of the most important recent consequences (e.g., Stocker et al., 2013; Lelieveld et al., 2015; Cheng et al., 2016; Reinmuth-Selzle et al., 2017). The Amazon rain forest and its atmosphere are particularly vulnerable since they are experiencing the combined pressures from human-made deforestation and progressing climate change (Lenton et al., 2008; Malhi et al., 2008). Davidson et al. (2012) presented comprehensive perspectives on the ecological and atmospheric “transition” of the Amazon biome due to continuous land use change and a cascade of related perturbations and feedbacks. Particularly, the hydrological cycle with its large amounts of recycled water and energy represents an Achilles' heel in the ecosystem's integrity and stability (e.g., Andreae et al., 2004; Rosenfeld et al., 2008; Hilker et al., 2014; Machado et al., 2018). The Amazon is defined by a pronounced continental gradient in climatic conditions, socioeconomic activities, and land use change. Climatically, the northwestern part is characterized by high precipitation rates with comparatively weak seasonal amplitudes, whereas the southeastern part experiences a much stronger seasonality, associated with dry season drought stress for the vegetation (e.g., Malhi et al., 2008, 2009). Socioeconomically, the northwestern part is protected by its remoteness and, therefore, still mostly unperturbed, whereas the southeast is heavily influenced by infrastructure development, logging, and agro-industrial expansion (e.g., Soares-Filho et al., 2006; Nepstad et al., 2008; Silva et al., 2013). The regional and global consequences of the Amazon's transition process for the Earth's climate system, water resources, biodiversity, and human health are still widely unknown.
To address the mechanisms and consequences of the anthropogenic perturbation of the Earth atmosphere, a sound understanding of the starting point – the background state – of this transition process is required. However, regions of definable background state conditions are becoming increasingly rare worldwide (Andreae, 2007; Hamilton et al., 2014). To some extent, the Amazon Basin still represents one of the last continental exceptions and, thus, a unique outdoor laboratory for atmospheric science. Certain – although short – episodes in its clean wet season still open a window into the preindustrial and unpolluted past, while the dry season is influenced by heavy pollution from numerous deforestation and land management fires (Martin et al., 2010b; Andreae et al., 2015; Pöhlker et al., 2018). The Amazon Tall Tower Observatory (ATTO) has been established in the Amazon Basin for two main reasons: first, it supports a better understanding of key processes in biosphere–atmosphere exchange and, therefore, helps to assess the global relevance of the Amazon's ecosystem services. For this task, the frequent occurrence of very clean episodes provides crucially important baseline data to approximate the era before globally pervasive anthropogenic pollution. Referring to Andreae et al. (2015) it is “urgent to obtain baseline data now, to document the present […] conditions before upcoming changes, especially in the eastern part of the basin, will forever change the face of Amazonia”. Second, the ATTO research documents the progressing change in the Amazon and, thus, provides essential knowledge to try to avoid irreversible damage to this unique ecosystem. The extent and complexity of meteorological, trace gas, aerosol, and ecological studies at the ATTO site are steadily increasing, promising more and more insights into the manifold facets of biogeochemical and hydrological cycles in this unique ecosystem (e.g., Nölscher et al., 2016; Rizzolo et al., 2016; Wang et al., 2016a, b; Chor et al., 2017; Oliveira et al., 2018; Yáñez-Serrano et al., 2018).
Detailed knowledge on the spatial and temporal variability of the site's footprint region and, thus, the effectively probed land cover mosaic is a prerequisite to embed atmospheric observations at ATTO into a broader Amazonian context. In the course of our recent studies, the analysis of backward trajectories (BTs) and geographic information system (GIS) data helped substantially to explore air mass history and the variability of atmospheric composition (e.g., Moran-Zuloaga et al., 2018; Pöhlker et al., 2018; Saturno et al., 2018a, b). Along these lines, the current study presents a systematic BT and GIS data analysis, providing a robust characterization of spatiotemporal patterns in the advection of air masses towards ATTO, relevant hydrological regimes, and current land use patterns and future trends in the ATTO footprint region. We envision that this work may serve as a helpful resource and look-up reference for the interpretation of current and future observations in the region. Furthermore, we conclude with a discussion on anticipated future developments within the ATTO footprint region in response to progressing climate and land use change, which are influences of crucial importance for future ATTO research.
2.1 The ATTO site in the central Amazon Basin
The remote ATTO site (position of 325 m tall tower, operational since 2017: 2.1459∘ S, 59.0056∘ W, 130 m a.s.l.) is located about 150 km northeast of Manaus, Brazil. It was established in 2010/11 as a long-term research station for aerosol, trace gas, meteorological, and ecological studies in the Amazon forest. For detailed information we refer the reader to Andreae et al. (2015). In addition to ATTO, the ZF2 site (2.59454∘ S, 60.20929∘ W, 90 m a.s.l.), which is located 60 km north-northwest of Manaus, has served as a key research station for atmospheric and ecological studies in the central Amazon Basin since 2008. Details regarding the ZF2 site can be found in Martin et al. (2010a). During the GoAmazon2014/5 field campaign, both sites served as background stations (called T0a and T0z), providing comprehensive data on the atmospheric state upwind of the Manaus city plume (Martin et al., 2016a, b).
2.2 HYSPLIT backward trajectories
The systematic backward trajectory (BT) analysis is based on the Hybrid Single-Particle Lagrangian Integrated Trajectory model (HYSPLIT, NOAA-ARL) with meteorological input data from the Global Data Assimilation System (GDAS1, 1∘ resolution) (Draxler and Hess, 1998; Stein et al., 2015). The HYSPLIT model is a hybrid between Eulerian and Lagrangian approaches (Draxler and Hess, 1998). In an Eulerian model, air concentrations are calculated by the integration of mass fluxes in each grid cell, based on their diffusion, advection, and local processes. In a Lagrangian model, air concentrations are computed by summing virtual air parcels of zero volume (so-called “particles”), which are advected through a grid cell along its trajectory (e.g., Escudero et al., 2006). For the HYSPLIT BT analysis presented here it is important to note that the meteorological analysis in GDAS, which serves as input for the trajectory model, relies on comparatively few radiosonde stations in the Amazon region and that several of the radiosonde stations upwind of ATTO are located at the coast and, therefore, likely will not adequately represent the boundary layer height in the basin. However, GDAS also uses a global data set of surface observations, wind profiler data, aircraft reports, buoy observations, radar observations, and satellite observations in its 3-D model assimilation, which mitigates the scarcity of available radiosondes. The associated uncertainties have to be considered carefully in the interpretation of the BT results.
As a basic data set, 14 d BTs were calculated every 1 h for different starting heights at ATTO for a multi-year period, namely 1 January 2008 until 30 June 2016.1 The BTs were calculated including selected meteorological parameters (i.e., air pressure, relative humidity, sun flux, and potential temperature, as well as rainfall and mixing depth) by using the HYSPLIT download package (version 4, Revision 664, October 2014). This resulted in an ensemble of 74 496 individual BTs, which were archived as ASCII files. The further processing of these “raw” BT files was conducted in IGOR Pro (version 6.3.7, Wavemetrics, Inc., Portland, OR, USA).
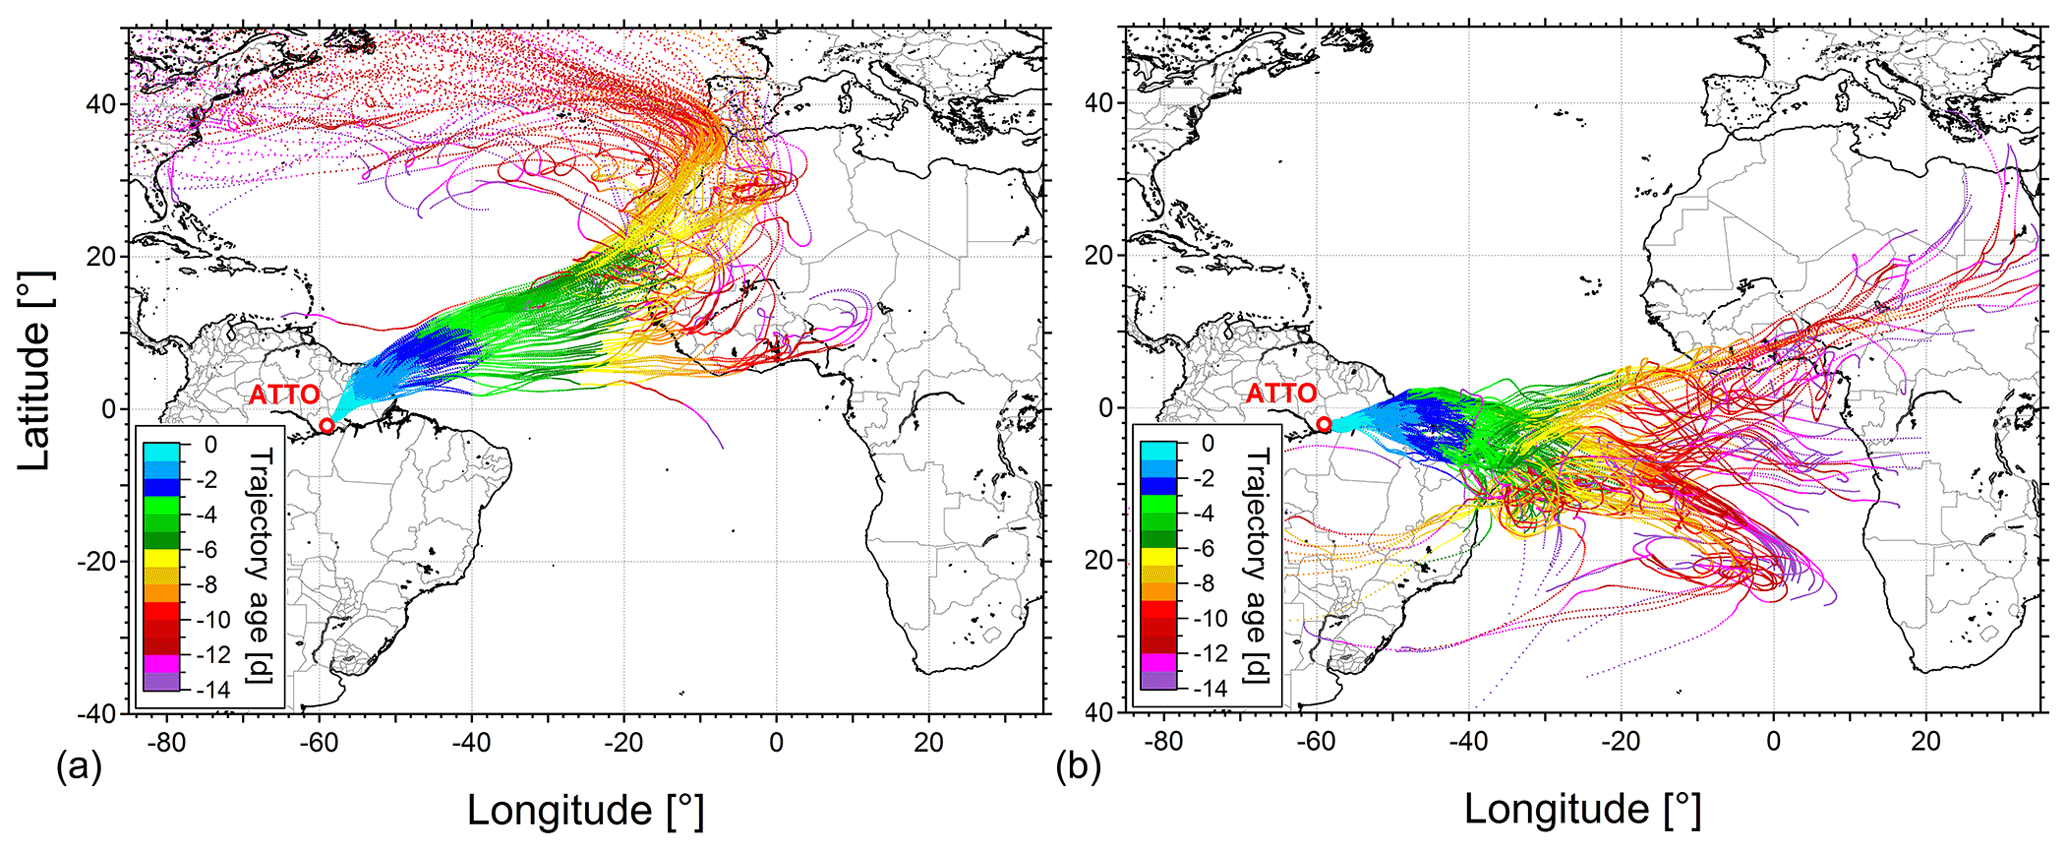
Figure 1The 14 d HYSPLIT backward trajectory (BT) ensembles (starting height 1000 m a.g.l.) with color coding representing BT transport times: (a) northeast tracks of BTs from 1 to 31 March 2014, characteristic for the Amazonian wet season conditions, and (b) southeast tracks of BTs from 1 to 30 September 2014, characteristic for the Amazonian dry season conditions. The transport times indicate that the BTs spend about 2–3 d over the South American continent. Moreover, transport time from the African coast to ATTO takes about 6–7 d.
Figure 1 shows two exemplary 14 d BT ensembles for selected wet and dry season months. In the context of the present study, we focused on 3 and 9 d BTs, which are shortened versions of the initially calculated 14 d files. The 3 d BTs cover the air mass movements over the South American continent and, therefore, represent the continental sources that are presumably most relevant for the ATTO site. Figure 1 illustrates that 3 d BTs in the wet and dry seasons typically span from ATTO to the Brazilian coastal regions and, in some cases, even onto the Atlantic Ocean. The 9 d BTs cover the entire Atlantic region. On these timescales, they provide (at least some) information on potential source regions of long-range transport (LRT) aerosol from the African continent. However, the relative error of the BT model scales with the absolute length of the BTs. The uncertainty of the location of the trajectory center of gravity of the contributing air masses is estimated to be 15 %–30 % of the travel distance (https://www.arl.noaa.gov/hysplit/hysplit-frequently-asked-questions-faqs/faq-hg11/, last access: 25 February 2018). In terms of transport time, Fig. 1 indicates 6–7 d from the African coast to ATTO.
The 14 d BTs were calculated for starting heights of 80, 200, 1000, 2000, and 4000 m a.g.l. (above ground level). The overall BT variability of all starting heights has been compared and summarized in Sect. 3.1 and 3.2. However, only the BTs started at 1000 m a.g.l. were used systematically throughout this study and particularly for the GIS analysis in Sect. 3.3. As a result of the rather simple terrain upwind and because of the boundary layer (BL) height variability, this arrival height is representative for sampling heights at ATTO. A comparison of BT ensembles at 200 m vs. 1000 m a.g.l. gave similar results, indicating that the analysis was not very sensitive to varying start heights within the lower 1000 m of the troposphere (for further details see Sects. 2.4 and 3.2). Ensembles of BTs were converted into maps of relative trajectory densities by IGOR Pro routines as illustrated in Fig. S1 in the Supplement. Slightly modified, this procedure was also used to obtain averaged trajectory heights. The BT density maps are called “air mass residence time maps” throughout this study.
Precipitation was available through GDAS (HYSPLIT model) for every hourly data point of the individual BTs. Based on these data, cumulative precipitation, PBT, for every individual 3 d BT (started at 1000 m a.g.l.) was obtained by integrating the precipitation data along the BT track. The resulting PBT value represents the amount of rain that the corresponding air parcel experienced during its last 3 d of transport towards ATTO. Accordingly, the PBT time series reflects the variability of cumulative rain and, thus, also the extent of rain-related aerosol scavenging of the arriving air masses. The HYSPLIT precipitation output does not depend on BT transport height (see Moran-Zuloaga et al., 2018).
2.3 Comparison of HYSPLIT and FLEXPART backward trajectories
Trajectory models have been constantly improved, while gridded meteorological data became more sophisticated (Gebhart et al., 2005). In addition to the HYSPLIT model, the FLEXible PARTicle dispersion (FLEXPART) model is frequently used in the atmospheric sciences. The FLEXPART model is a Lagrangian transport and dispersion model to simulate long-range and mesoscale transport, diffusion, and dry and wet deposition. A detailed description can be found elsewhere (Stohl et al., 1998, 2005; Stohl and Thomson, 1999).
The present study is mostly based on HYSPLIT BT data. The HYSPLIT BT ensembles combine the trajectories representing the center of gravity (“lines”). We conducted a comparison with FLEXPART for two periods, March 2014 and September 2014. The FLEXPART model accounts for lateral mixing (or dispersion in forward mode), provides distributions of residence times of air masses, and, hence, reflects the relative importance of potential source areas. The same starting heights and time frames were applied in both models. The purpose of this comparison was to validate the results of line trajectories (HYSPLIT model) compared to backward modeling accounting for dispersion. The HYSPLIT BT ensembles for the case study periods comprise 9 d BTs, started every 1 h at ATTO at altitudes of 200 and 1000 m a.g.l. during the months March and September 2014. Similarly, the FLEXPART BTs were started at ATTO at altitudes of 200 and 1000 m a.g.l. with a backward integration time of 9 d, spanning the months March and September 2014.
2.4 Cluster analysis of backward trajectories
Based on the entire set of 74 496 3 d BTs (1 January 2008–30 June 2016) we conducted a k means cluster analysis (CA, with Euclidian distances) – the most commonly used partitioning clustering approach – which provides a (non-supervised) classification of the trajectories' spatiotemporal variability (MacQueen, 1967; Kassambara, 2017). The 3 d BTs were selected as input data for the clustering to retrieve the BT's spatiotemporal variability over the South American continent and, particularly, over the NE Amazon Basin. The clustering was performed with the statistical software package PASW Statistics (version 18.0.0, IBM, Armonk, NY, USA). The 74 496 BTs, each with 72 pairs of latitude and longitude coordinates, represented the input data for the clustering. Further information, such as the altitude of BTs, was not included here. The cluster centers as well as the cluster membership of every BT represented the output data of the CA. The subsequent analysis steps of the CA output were conducted in IGOR Pro. Note that for k means clustering the number of clusters, k, has to be predefined prior to the analysis. Certain criteria, such as the total within-cluster sum of squares and the silhouette coefficient, have been introduced to select an appropriate k for the CA (e.g., Rousseeuw, 1987; Steinley, 2006). The total within-cluster sum of squares is supposed to be as small as possible and represents a measure for the “compactness” of the clustering (Kassambara, 2017).
An analysis of the total within-cluster sum of squares as a function of k shows its bend (i.e., the “elbow”) in the range between k=5 and k=10 (Fig. S2). The elbow is typically considered an indication for an “appropriate” k; however, no “hard” criterion for the choice of k exists. Here, we tested different numbers of clusters (i.e., k=5, 10, and 15) to identify the most suitable k within the scope of this study. The clusters of the k=5 case (before the elbow is reached) capture the overall spatiotemporal BT variability and result in four major BT directions: northeast (NE), east-northeast (ENE), east (E), and east-southeast (ESE) (Fig. S3a). The clusters of the k=10 case (after the elbow if reached) similarly classify the individual BTs in the main directions of advection (i.e., NE, ENE, E, and ESE); however, they start separating the BTs into different wind speed regimes – for example, two clusters represent different wind speeds in the NE direction (Fig. S3b). Upon further increase in k (i.e., k=15) an even finer wind speed classification is obtained (Fig. S3c). Here, three to four wind speed regimes are separated for the main directions of air mass advection (i.e., three for NE, four for ENE, four for E, and four for ESE). Furthermore, the k=15 case results in a separate cluster towards the southwest (SW).
In this study, we have chosen k=15, which represents a relatively high k with a correspondingly high resolution of spatiotemporal BT details, for the following reasons: the separation into different wind speed regimes appears to provide useful further information beyond the general geographic direction of air mass advection. Specifically, the separated wind speed regimes reflect different residence times of the air masses. Accordingly, the contrast between slow vs. fast BTs may correspond to concentration variations in the ATTO observations (e.g., Pöhlker et al., 2018). Furthermore, the contrasting wind speed regimes reflect differences in cumulative precipitation and, therefore, in the extent of rain-related scavenging. Specifically, the slower BTs such as NE1, ENE1, E1, and ESE1 receive on average significantly more precipitation than the faster ones (Fig. S4). Such proxies for the extent of scavenging are valuable for the analysis of the ATTO aerosol observations (e.g., Moran-Zuloaga et al., 2018). Furthermore, for k≥15, a separate cluster towards the city of Manaus in the southwestern (SW) direction is resolved. The frequency of occurrence of the SW1 cluster helps to estimate how often the Manaus city plume may have impacted the ATTO region, which is an important aspect in the data analysis.
2.5 Definition of the backward trajectory-based ATTO footprint region
The footprint concept has been introduced for atmospheric measurement sites to quantify the distribution and extent of biosphere–atmosphere exchange in their surroundings, which contributes to the variability of observed trace compound concentrations (Gloor et al., 2001). Schmid (2002) formally defined the footprint (sometimes also called airshed or effective upwind fetch) of a measurement as “the transfer function between the measured value and a set of forcings on the surface–atmosphere interface” as a general description of various footprint modeling frameworks. Footprints have been mostly used in the context of long-term trace gas observations (e.g., greenhouse gases) (e.g., Thompson et al., 2009; Winderlich et al., 2010). The size of a footprint largely depends on the height of the measurement, and tall tower sites are known to cover large footprint regions, which makes them particularly valuable for representative regional monitoring (Gloor et al., 2001). The geographic distribution of a footprint is defined by the distribution of relevant sources and the predominant wind directions.
The modeling of specific footprints for the ATTO observations based on specific source–receptor relationships (i.e., for specific compounds and observational conditions) is beyond the scope of this work and will presumably be the subject of dedicated future studies. Here, we use the term footprint in a more simplistic and general sense as the area on the South American continent that is covered by the air mass residence time maps, which are based on multiple years of 3 d HYSPLIT BTs. In order to discriminate our approach from footprint modeling attempts according to Schmid (2002), we use the term “BT footprint” in this study. The choice of 3 d for this analysis is justified, for example, by a study by Lammel et al. (2003), reporting the characteristic formation times of secondary aerosols of about 48–72 h as well as the fact that coarse-mode particles “were derived from emissions <36 h back”. With this approach, we aim to map the history of the air masses that were advected towards ATTO on the South American continent. Since primary aerosol and trace gas emissions mostly occur at ground level, only those BTs effectively pick up emissions that reach into the so-called footprint layer, a “vertical layer adjacent to the ground in which surface emissions are present and assumed to affect passing air tracer particles” (e.g., Hüser et al., 2017). Accordingly, only the HYSPLIT BTs being transported at lower altitudes reach into the footprint layer and, thus, identify effective source regions. In order to analyze specific relationships between pollution sources and the receptor site (ATTO), assumptions on the vertical depth of the footprint layer and the BT mixing depth have to be taken into account.
Table 1Filters applied to the multi-year BT ensemble. Height filter crops segments along individual BTs if values exceed the height threshold (e.g., height of 1000 m; named “H1000”). En route convection filter crops segments along individual BTs if sun flux values are below threshold (named “Cer”). Convection filter at ATTO removed entire BTs from analysis if sun flux upon arrival (i.e., in the ATTO pixel) is below threshold (named “Catto”).
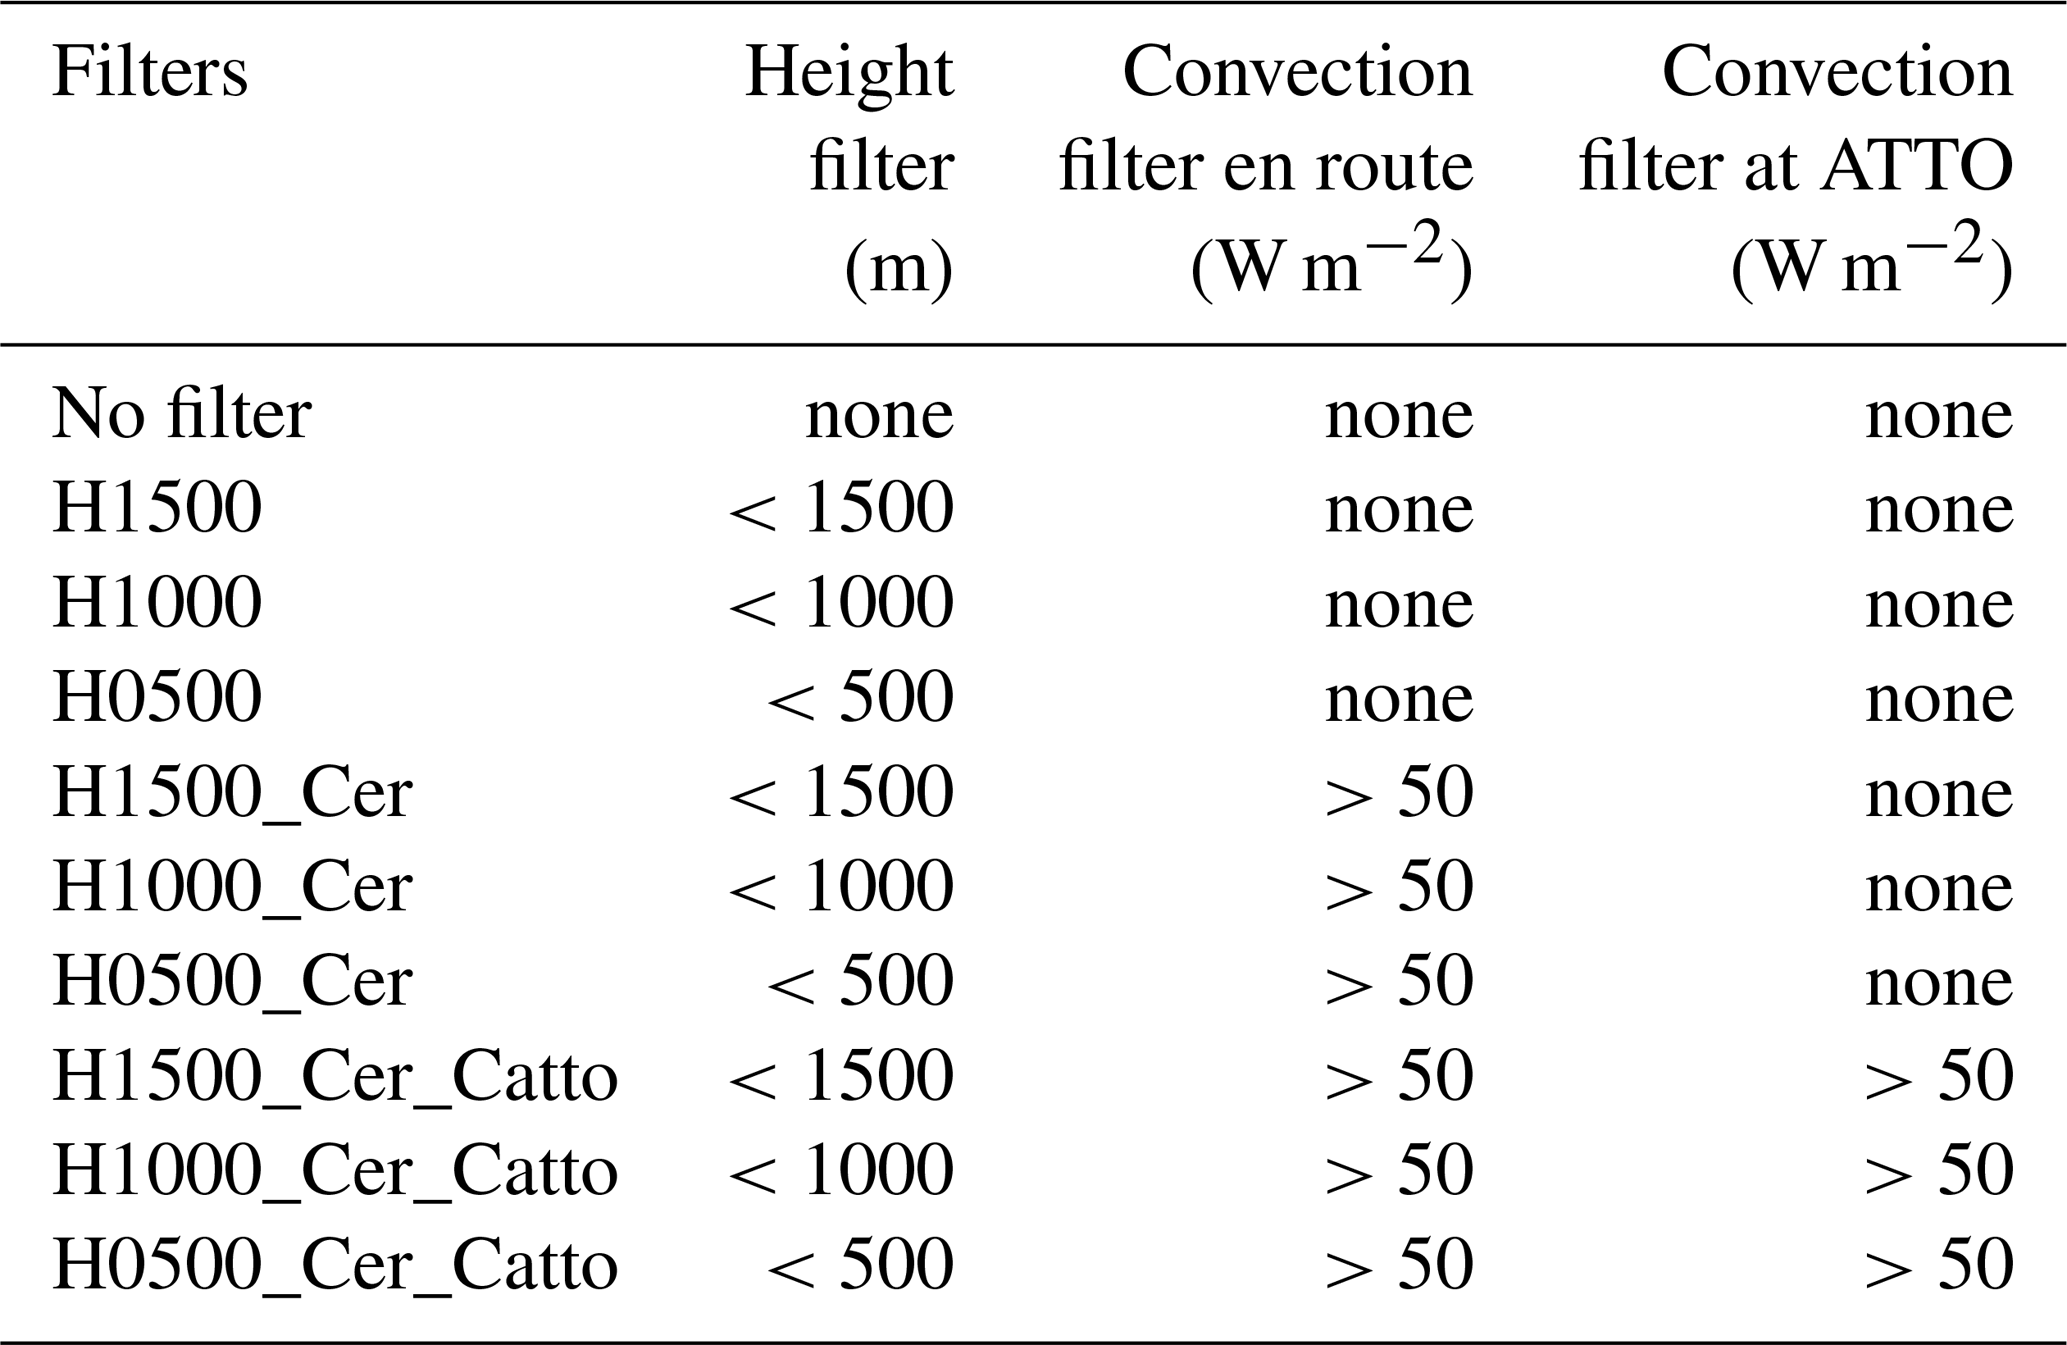
The sensitivity of the geographic extent of the BT footprint region towards different BL heights and convective mixing inside the BL has been tested by applying dedicated filters to the BT data. We calculated different versions of the BT footprint region on the basis of multi-year BT ensembles with settings as specified in Table 1. Three types of filters were applied, which introduce increasingly strict conditions into the approach:
Height filter. The BT height is an output parameter of the HYSPLIT model. Height thresholds of 1500, 1000, and 500 m were defined as proxies for BL heights in the Amazon. Typical daytime BL heights at ATTO range from 1000 to 2000 m (Fisch et al., 2004). Accordingly, the thresholds at 1500 and 1000 m are realistic, whereas the threshold at 500 m is based on more extreme assumptions and, thus, primarily serves as a sensitivity test. The filter excludes all sections of the individual BTs from the analysis with heights exceeding the defined threshold. The remaining sections (with heights below the threshold) are assumed to be located within the convectively mixed BL.
En-route convection filter. The sun flux along the BTs is a meteorological output parameter of the HYSPLIT model ranging from 0 to ∼900 W m−2. The sun flux of the BTs upon arrival (i.e., in the ATTO pixel) has been compared with local meteorological measurements and shows a reasonably good agreement. A sun flux threshold of 50 W m−2 has been chosen as a precondition for a possible onset and end of convective mixing along the individual BTs. The filter excludes all BT segments with a sun flux below the threshold from the analysis (i.e., the nighttime segments). The underlying assumption is that only the BT segments that are in convective connection with the surface are relevant for the footprint analysis.
Convection filter at ATTO. Assuming that only those BTs are relevant that arrive at ATTO during convective hours (i.e., excluding conditions with decoupled layers during nighttime), we further applied a filter that keeps only those BTs in the analysis whose sun flux upon arrival (i.e., in the ATTO pixel) exceeds a threshold of 50 W m−2.
Based on these differently filtered BT ensembles defined in Table 1, corresponding footprints were calculated statistically as outlined below. The original 1 h trajectory points were interpolated to minute-wise steps and then counted within a 0.1∘ by 0.1∘ grid according to Sect. 2.2. Within the distribution of pixel values, which represent air mass residence times, contour lines for the upper 1 %, the upper 5 %, the upper 10 %, the upper 25 %, and the median level were calculated. The continental part of the area, which includes the 25 % of highest air mass residence time levels, has been defined as the ATTO BT footprint region. The different BT footprints based on the filtered BT ensembles as specified in Table 1 are shown in Fig. S5.
With the same statistical approach, the BT cluster footprints of the 15 clusters from the k means clustering have been defined. For certain aspects of the geographic analysis in Sect. 3.3, land cover properties have been weighted by the air mass residence time (see Sect. 2.7). In these cases, we refer to the “weighted BT footprint”. In order to create GIS maps, which includes the most relevant regions, we define a rectangular region of interest (ROI) that includes the ATTO site BT footprint region (ROIfoot: 62, 40∘ W, 8∘ S, 6∘ N).
2.6 Geographic analysis by means of selected GIS data sets
We conducted a detailed analysis of the land cover type and/or change in the ATTO BT footprint region using a number of different GIS data sets processed using the QGIS software package (“Las Palmas” version 2.18.2, QGIS development team). The QGIS software (formally known as Quantum GIS) is freely available under http://www.qgis.org (last access: 25 February 2018). All GIS data sets were handled using the coordinate reference system WGS84 (world geodetic system from 1984). A detailed list of all GIS data sets used in this study, together with a short summary of relevant information, web links, and references, can be found in the Supplement Sect. S1.1.
The classification of land cover types as well as the quantification of land cover changes and dynamics is a complex task for various reasons: GIS data sets are often based on different spacecraft instruments and data acquisition methods (e.g., satellite grid resolution, spectral retrievals and sensitivity, image processing, and categorization), which could restrict their comparability. Artifacts such as cloud and/or smoke cover as well as terrain-related shadow effects have to be considered. GIS layers typically differ with respect to their acquisition time frames, which mostly represent states in the past (e.g., GlobCover 2009 representing land cover in the year 2009). Moreover, land cover is subject to dynamic seasonal and phenological changes (e.g., in agricultural lands), which is not covered by all GIS data sets (e.g., Ju and Roy, 2008; Jin et al., 2023; Tyukavina et al., 2017). Thus, all corresponding GIS maps are subject to limitations and uncertainties. In this work, mostly well-established GIS products have been used, which have been documented and discussed in previous studies. In Sect. S1.1, we also point out major uncertainties and restrictions with respect to the comparability of different GIS maps; however, for more detailed information we refer the reader to the referenced studies.
2.7 Analysis of backward trajectory footprint region in relation to geographic data
Using scripts written in Python 2.7, an analysis weighted by air mass residence time of several GIS data sets was conducted to assess the relative significance of land cover categories, forest cover, and loss as well as fire events for the ATTO observations. Each data set was weighted using rasterized BT density maps. The rasterized BT density maps were calculated with cell sizes of 0.09∘ by 0.09∘ resolution. For each raster cell, the total length of intersecting trajectories within the cell was calculated. The sum of path lengths was then set in relation to the highest sum found at the ATTO site, where all trajectories crossed the same cell. To calculate values for the cluster footprints, the GIS raster maps for land cover, forest cover, and forest loss were combined with the air mass residence time map. In the case of the land cover maps, the relative area of each land cover category within each cell of the BT density maps was multiplied by the corresponding relative density value. In the case of the forest cover map, the relative forest cover within each BT density map cell was also multiplied by the corresponding relative density value. For the forest loss maps, the same weighting was applied, yielding the relative forest loss in relation to the whole BT footprint region. The relative forest loss was further set in relation to the previously calculated weighted forest cover of the footprint region in the year 2000. For the fire maps, before processing the fire events, the fire map was overlaid onto the land cover raster maps, thus assigning land cover categories, which were used to characterize the fire events. The weighting of the number of fires was performed analogously to the forest cover data. Therefore, for each BT cluster footprint, we calculated the following output:
- i.
the air mass residence time-weighted part of each land cover category and forest cover in all 15 BT cluster footprints.
- ii.
the air mass residence time-weighted forest loss for each BT footprint in relation to the forest cover in 2000, per year.
- iii.
the air mass residence time-weighted fire counts for each BT footprint, per year and land cover category.
2.8 Precipitation, sea surface temperature, and anomalies
The precipitation data used in this study are based on the Precipitation Estimation from Remotely Sensed Information using Artificial Neural Networks for Climate Data Record (PERSIANN-CDR) data product (Ashouri et al., 2015), which has been obtained from Google Earth Engine via https://code.earthengine.google.com/ (last access: 4 March 2018) (Gorelick et al., 2017). The PERSIANN-CDR data have been analyzed for selected regions: (i) a relatively small area around the ATTO site (59.1, 58.6∘ W, 2.25, 1.75∘ S), (ii) the continental part of the ROIfoot (see Sect. 2.5), (iii) the Amazon watershed region, and (iv) the combined areas of the Brazilian states Acre and Rondônia.
The following anomaly indices for the Pacific and Atlantic sea surface temperatures (SST), which were obtained from https://stateoftheocean.osmc.noaa.gov/sur/ (last access: 4 March 2018), were used: (i) the Oceanic Niño Index (ONI) within the Pacific Ocean area 170–120∘ W, 5∘ S–5∘ N, as a measure for the strength and phase of the El Niño–Southern Oscillation (ENSO); (ii) the Tropical Northern Atlantic (TNA) index, within the Atlantic Ocean area 55–5∘ W, 5–25∘ N; and (iii) the Tropical Southern Atlantic (TSA) index, within the Atlantic Ocean area 30∘ W–10∘ E, 20–0∘ S. Furthermore, the Atlantic Multidecadal Oscillation (AMO) index was obtained from https://www.esrl.noaa.gov/psd/data/timeseries/AMO/ (last access: 4 March 2018).
Anomalies in precipitation for the aforementioned regions as well as for the BT frequency of occurrence have been calculated as the relative differences of the monthly averaged values to a multi-year monthly mean. For PERSIANN-CDR precipitation anomalies, the reference time frame spans from January 1983 to December 2016. For BT frequency of occurrence anomalies, the reference time frame spans from January 2008 to June 2016.
The results and discussion section of this paper consists of two main parts:
-
Sect. 3.1 and 3.2 summarize the large-scale geographic patters and seasonal variability of the ATTO BT ensembles as well as their links to precipitation regimes and selected teleconnections.
-
Sect. 3.3 defines a BT-based footprint region of the ATTO site and relates it to the current state and anticipated future change of the covered land use mosaic.
In particular, Sect. 3.3 is meant to be a resource and look-up reference summarizing ATTO-relevant land cover information subdivided into the following categories:
-
Sect. 3.3.1: climatic conditions, biomes, ecoregions, and the “last-of-the-wild”;
-
Sect. 3.3.2: land cover;
-
Sect. 3.3.3: deforestation and agro-industrial expansion;
-
Sect. 3.3.4: fires;
-
Sect. 3.3.5: infrastructure, cities, traffic, and mining;
-
Sect. 3.3.6: protected areas;
-
Sect. 3.3.7: deforestation and climate change scenarios.
All seven subsubsections, Sect. 3.3.1 to 3.3.7, begin with a concise literature synthesis section and then relate the discussion to its specific relevance for the ATTO research. Due to its length, the entire Sect. 3.3 has been structured and written in a way that facilitates nonlinear reading.
All BT and GIS results obtained for the ATTO site also generally apply to the nearby ZF2 site, due to the fact that both sites are located close enough to each other (straight-line distance 144 km) to be influenced by similar (large-scale) circulation patterns (Fig. S6). During wet and dry season conditions, the air masses first pass ATTO before reaching the ZF2 region after ∼8 h on average (see also Saturno et al., 2018b). This aligned geographic configuration of two broadly equipped atmospheric measurement stations in the Amazon has opened interesting opportunities to study the temporal evolution and the geographic extent of atmospheric phenomena.

Figure 2HYSPLIT backward trajectory (BT) ensembles showing the large-scale trade wind circulation in the Atlantic region and the pronounced seasonal oscillation between northern and southern hemispheric influence at ATTO by means of air mass residence time maps (a, c, and e) and average BT height maps (b, d, and f). The BT ensembles comprise all 74 496 individual 9 d BTs, spanning a multi-year time period from 1 January 2008 until 30 June 2016. The BT analysis was conducted for the start heights 200, 1000, and 2000 m a.g.l. The contour lines in (b), (d), and (f) were adopted from (a), (c), and (e) to visualize the patterns in relative BT density on top of the average BT height map. Corresponding data for the BT start heights 80 and 4000 m can be found in Fig. S7.
3.1 General backward trajectory circulation towards the ATTO site
The annual north–south oscillation of the intertropical convergence zone (ITCZ) defines the large-scale trade wind circulation patterns in the Atlantic region, which govern the atmospheric seasonality in the central Amazon (compare Martin et al., 2010b; Andreae et al., 2012, 2015; Moran-Zuloaga et al., 2018). Here we conducted a multi-year HYSPLIT BT analysis (for five different starting heights: 80, 200, 1000, 2000, and 4000 m) to visualize the large-scale trends in the ITCZ-related air mass advection towards ATTO with respect to BT geographic patterns and transport altitudes (Figs. 2 and S7). For the lower starting heights (i.e., 80, 200, and 1000 m), the overall circulation pattern is predominantly defined by the seasonal ITCZ oscillation and shows two comparatively narrow paths: a northeasterly path during the wet season (February–May) and a southeasterly path during the dry season (August–November). The center of the northeasterly path spans straight from ATTO to the Cabo Verde Islands and the northwest African coast (area of Mauritania and Western Sahara). The air mass transport from the western African coast towards ATTO takes approximately 6–7 d (Fig. 1). The center of the southeasterly trajectory track represents a curved circulation pattern, which is directed eastwards over the mouth of the Amazon River and then curves towards the southeast along the Brazilian coast. For increasing start heights, the separation into distinct northeast and southeast paths becomes more and more smeared out. While the northeast and southeast paths are still somewhat resolved for the 2000 m case, the separation mostly disappears for 4000 m. The observation of the tightest BT bundles close to the ground and their divergence with increasing altitude results from the Hadley cell circulation. Its low-level trade winds feed boundary layer air into the deep-convective ITCZ belt as confluence between northeast and southeast trades (Talbot et al., 1990; Shpund et al., 2011; Dudley et al., 2012; Makowski Giannoni et al., 2016).
Transport within the northeast and southeast BT paths generally occurs at comparatively low altitudes for all start heights (Figs. 2 and S7). This is clearest for the northeasterly circulation during the wet season with its low-level trades. The average transport height of the southeasterly trades tends to be somewhat higher than the northeasterly trades, which can be seen for all starting height cases. For example, at a BT starting height at 200 m (Fig. 2b), the northeast trades are mostly located below 300 m over the Atlantic Ocean, whereas the southeast trades range mostly up to 800 m. At a BT starting height of 1000 m (Fig. 2d), the northeast trades are mostly below 800 m, whereas the southeast trades are mostly below 1400 m. A side aspect in the context of the low-level air mass circulation is that the HYSPLIT BT results (for starting heights 80 and 200 m) indicate a topography effect over the northeast basin. On their way to ATTO, the air masses tend to rather closely follow the Amazon River valley (Fig. S8), underlining the relative importance of trace gas and aerosol sources along the river as discussed in more detail in Sect. 3.3. A potential major uncertainty to keep in mind is the influence of local breeze circulations at the large rivers in the region that could significantly alter BTs in lower atmospheric layers. However, in a previous study we found that HYSPLIT performed quite well in reproducing the river breeze circulation over the Amazon River near Manaus (Trebs et al., 2012)
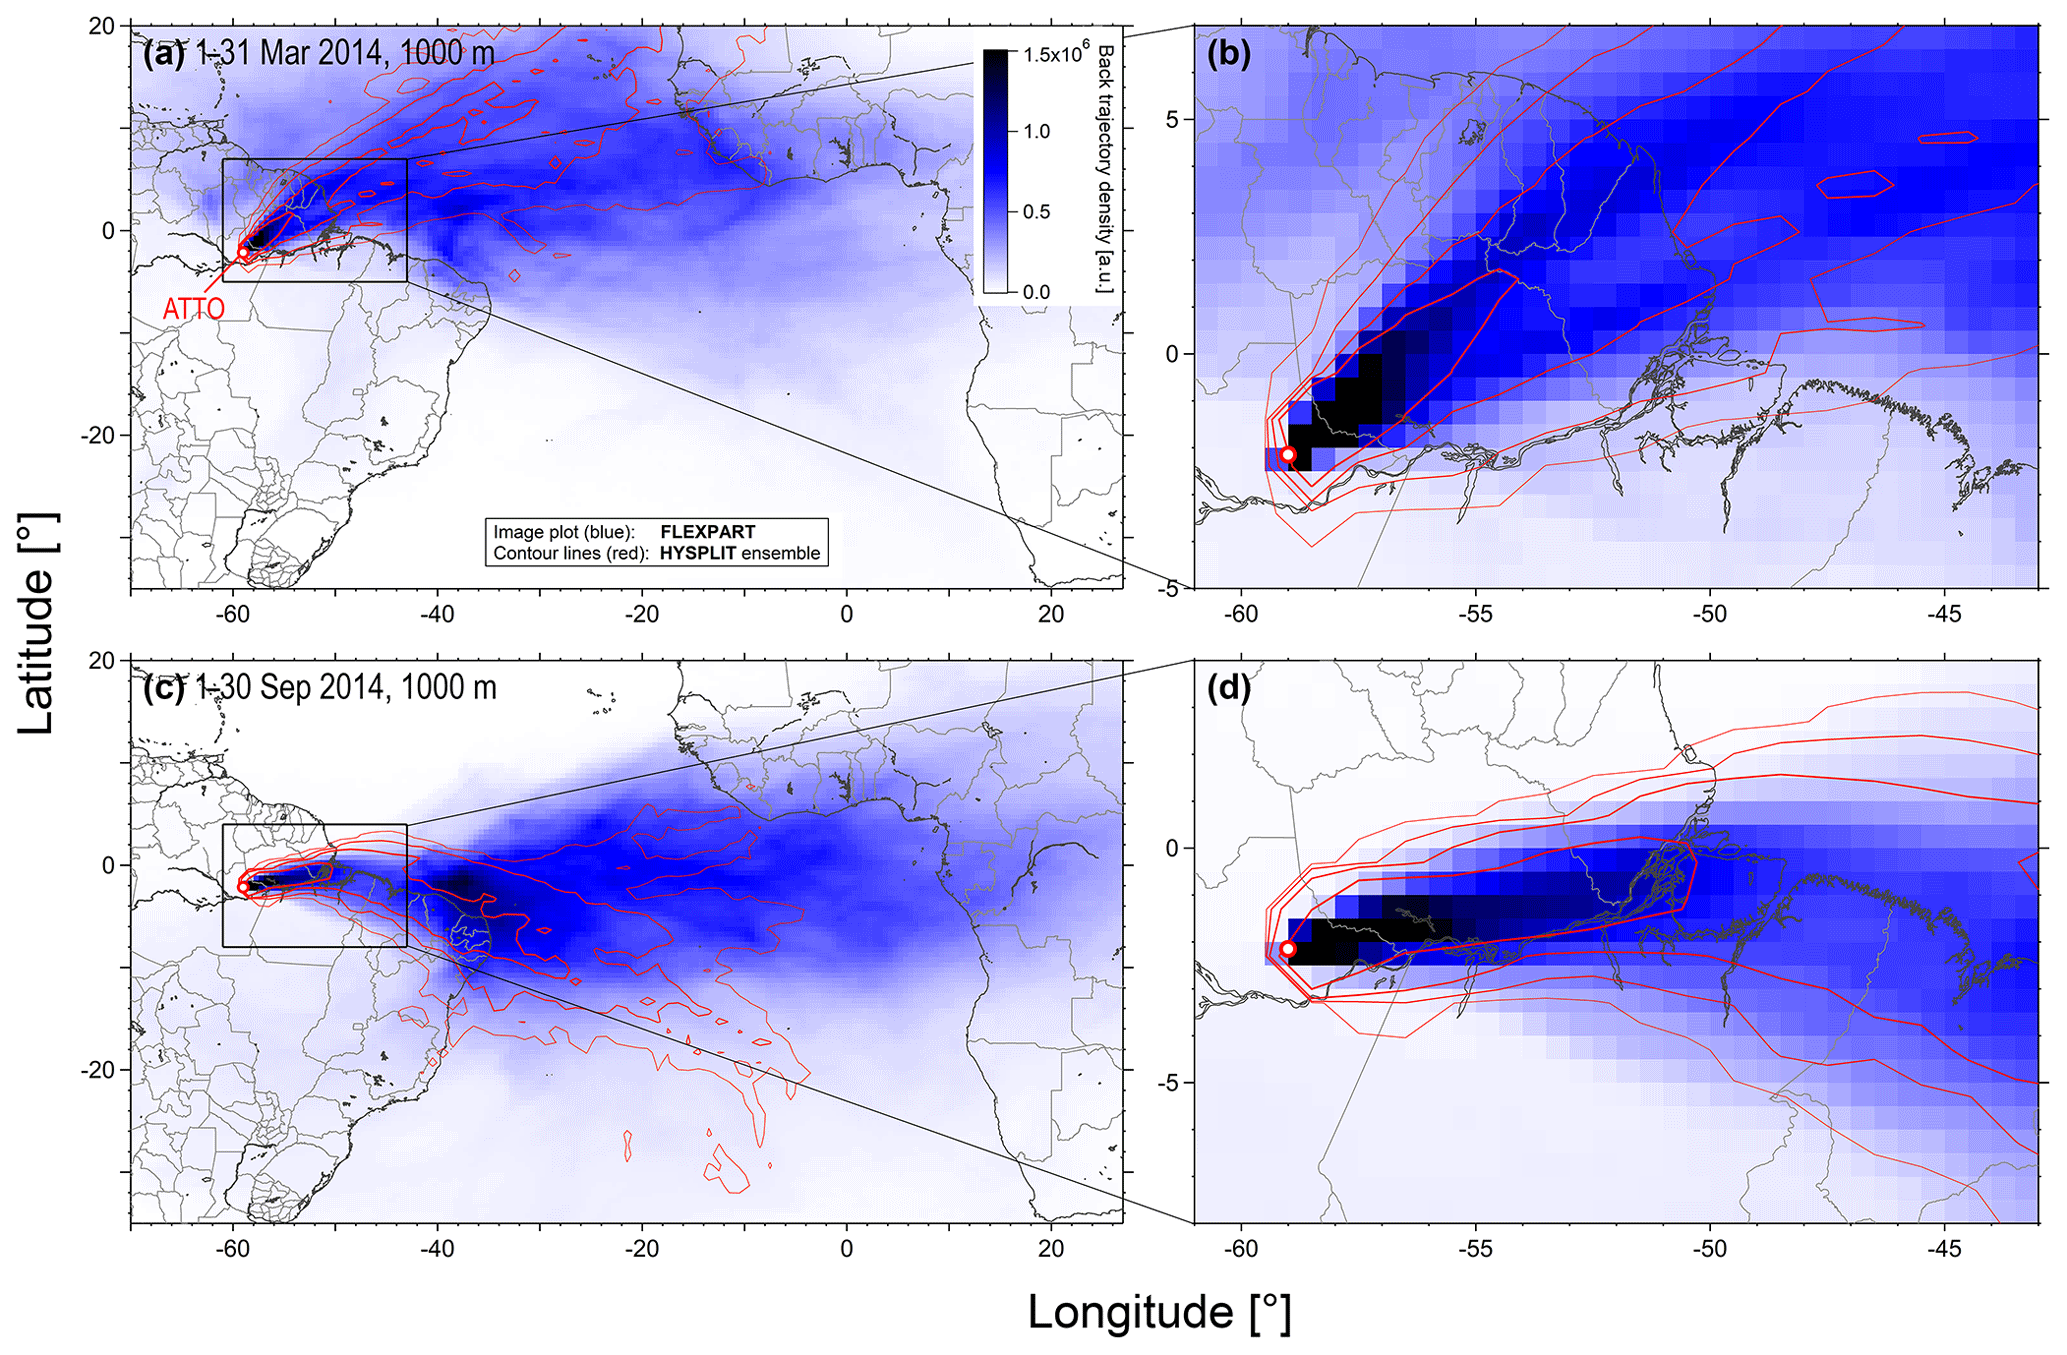
Figure 3Comparison of FLEXPART (blue) and HYSPLIT (red) back trajectory results for wet season (1–31 March 2014, BT start height 1000 m a.g.l., a and b) and dry season (1–30 September 2014, BT start height 1000 m a.g.l., c and d) conditions. Both models were run under comparable configuration settings (see Sect. 2.3). FLEXPART results are shown as image plot (color code represents relative BT density). HYSPLIT results are shown as contour lines (similar to Fig. 2), representing BT ensembles. An alternative representation of the results can be found in Fig. S9.
The HYSPLIT BTs were found to be a useful tool in the context of this study to analyze temporal and spatial trends of atmospheric circulation patterns. However, it has to be kept in mind that the individual BTs represent a simplified picture by providing center of gravity lines of the transported air parcels, not accounting for dispersion. To assess the relative importance of dispersion for the large-scale circulation patterns, we compared the HYSPLIT BTs with corresponding FLEXPART results (accounting for dispersion) for wet and dry season periods. Selected results are shown in Fig. 3 and illustrate that dispersion yields substantial differences between the HYSPLIT and FLEXPART outputs. Generally, the FLEXPART BTs cover a much larger area than the HYSPLIT BT ensembles, which is particularly obvious over the Atlantic region. The comparison further illustrates that deviations become larger the further the BTs reach into the past, as lateral mixing (i.e., dispersion in forward mode) becomes more significant. With respect to air mass transport over the northeast basin (i.e., from ATTO to the Brazilian coast), however, the main BT paths of both model outputs appear to be relatively similar.
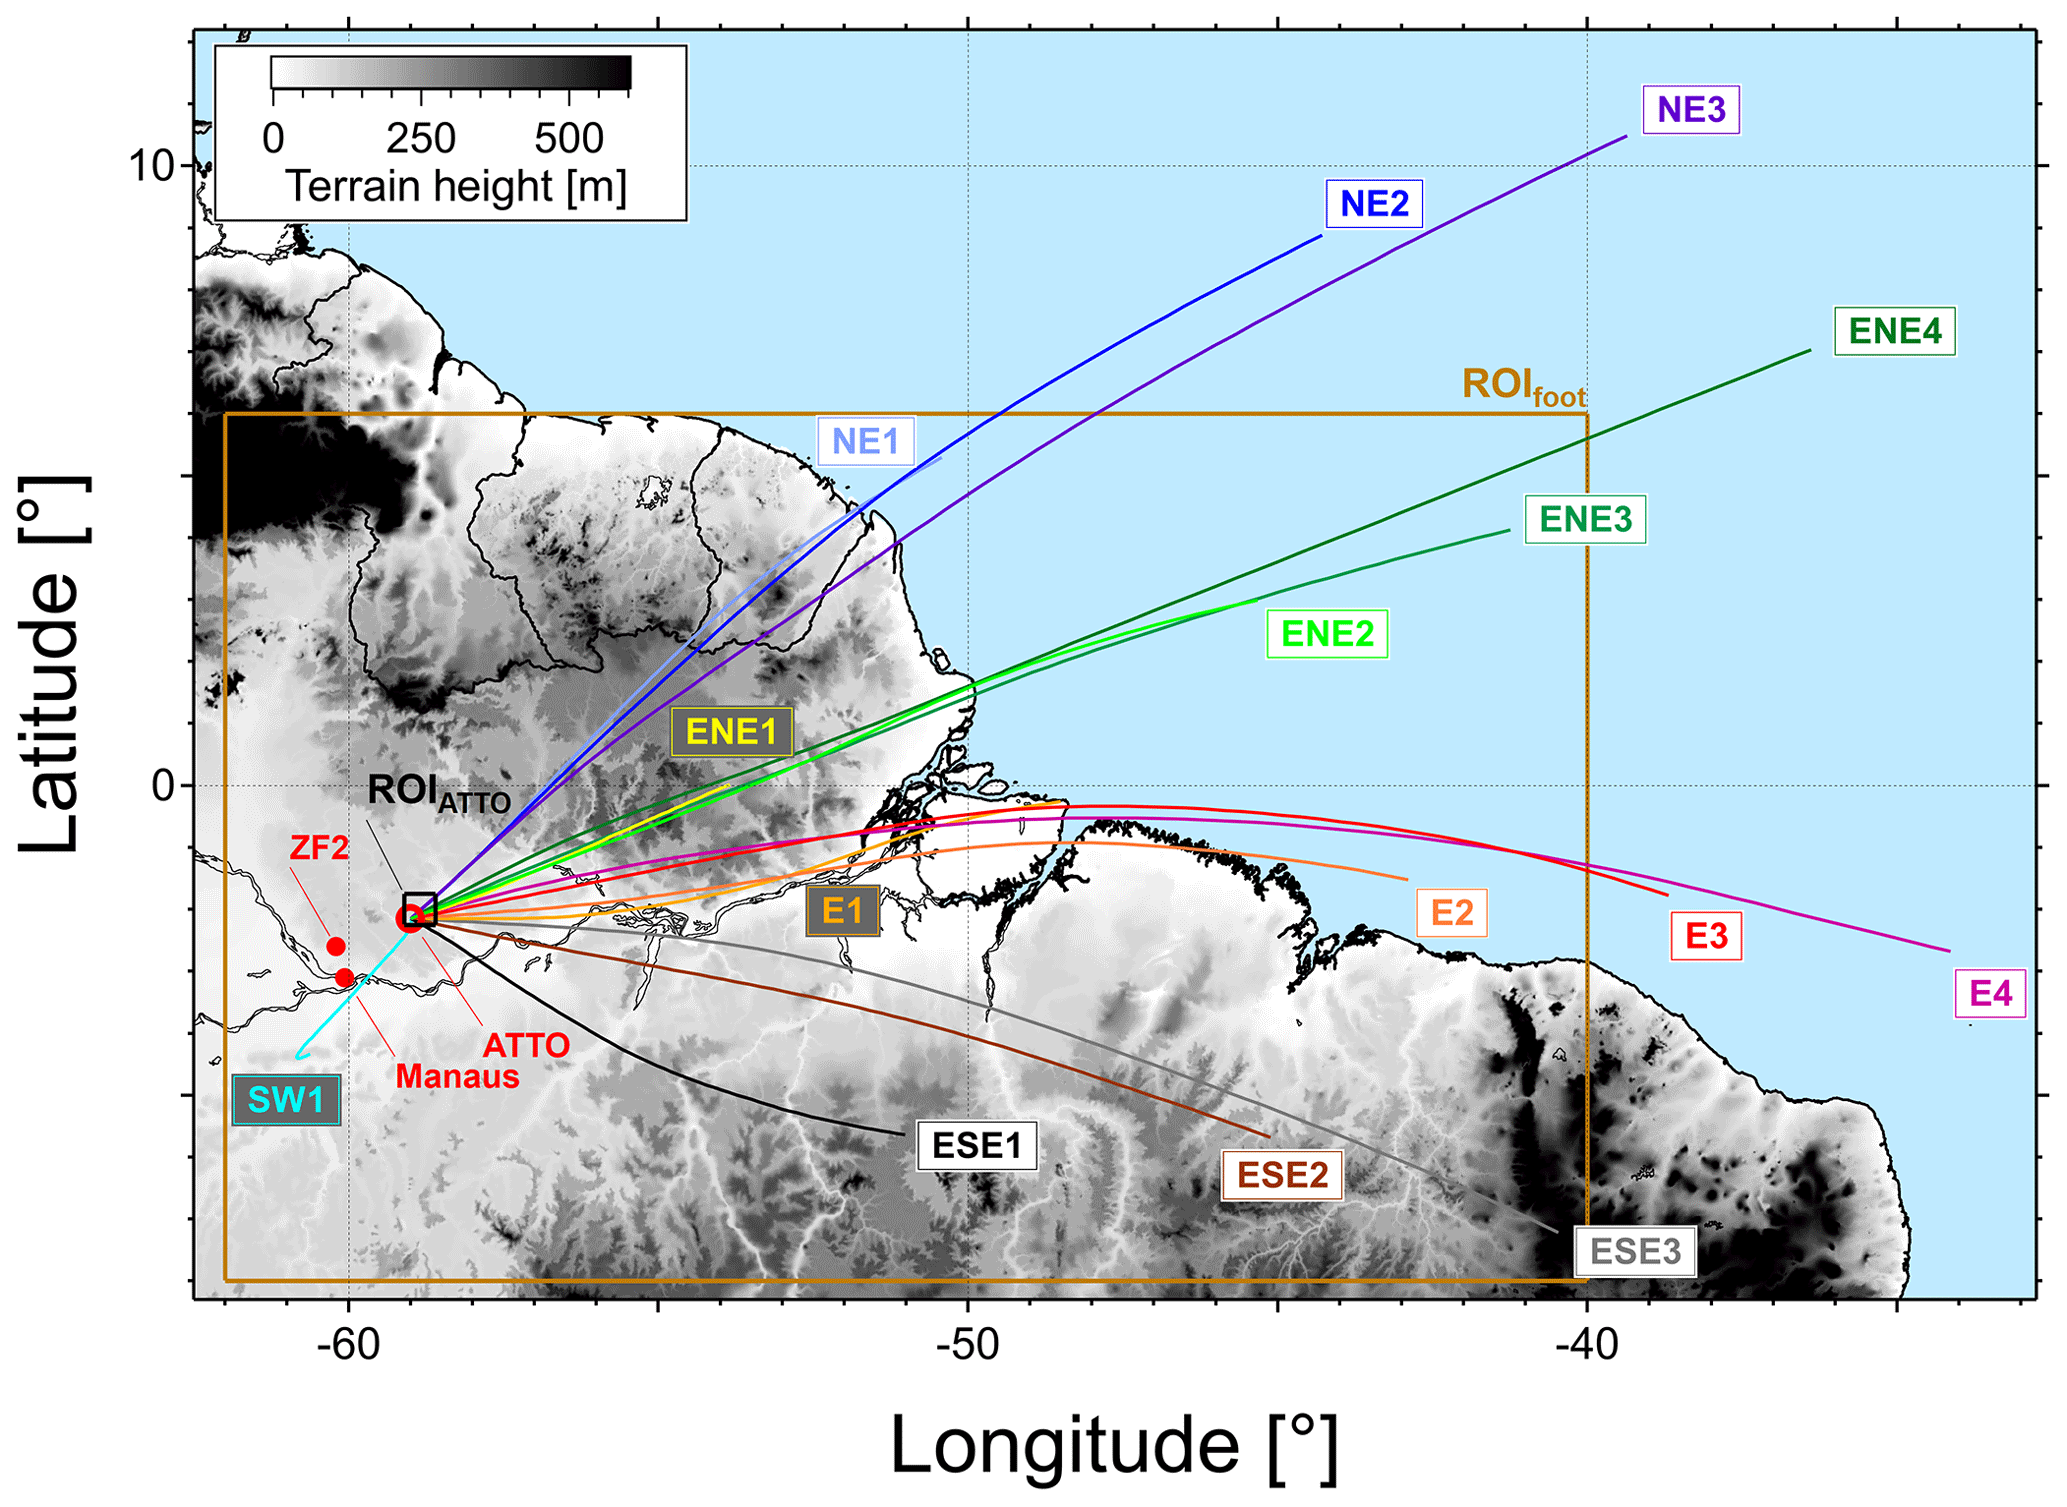
Figure 4Map of northeast Amazon Basin with 15 clusters from systematic k means back trajectory (BT) cluster analysis based on an entire HYSPLIT data set (3 d BTs, 1 January 2008–30 June 2016, start height 1000 m). Back trajectory clusters show that air masses arrive at the ATTO site almost exclusively from the northeastern to southeastern directions. Four major wind directions can be discriminated: (i) northeastern (NE) clusters NE1, NE2, and NE3; (ii) east-northeastern (ENE) clusters ENE1, ENE2, ENE3, and ENE4; (iii) eastern (E) clusters E1, E2, E3, and E4; (iv) east-southeastern (ESE) clusters ESE1, ESE2, and ESE3. A topographic map is represented by a grey scale, which is capped at 600 m. The regions of interest are shown: relatively small ROIs around ATTO (59.1, 58.6∘ W; 2.25, 1.75∘ S) and ROIfoot (62, 40∘ W; 8∘ S; 6∘ N) are shown as frames. For comparison, an analogous cluster analysis for BTs at a start height of 200 m can be found in Fig. S10.
3.2 Seasonality in backward trajectory advection and precipitation regimes
The k means cluster analysis (CA) partitions the BT's spatiotemporal variability into dominant circulation patterns. It further provides information on the (daily) frequency of occurrence of the clusters and, thus, a time-resolved view on the circulation patterns and corresponding seasonality. Figure 4 shows the 15 BT clusters on a map of the northeast Amazon Basin for a BT starting height of 1000 m a.g.l. (for details regarding the choice of k and starting height see Sect. 2.2 and 2.4). The clustering partitions the spatiotemporal variability of the BTs by geographic directions and wind speed regimes. Accordingly, northeasterly (NE), east-northeasterly (ENE), easterly (E), and east-southeasterly (ESE) BTs were separated. In addition, shorter trajectories (low-wind-speed regimes) and longer trajectories (high-wind-speed regimes) were also separated from each other. Figure 4 shows that the air masses arrived almost exclusively from a rather narrow easterly wind sector (between 45∘ and 120∘) for the 1000 m BT ensemble, which can be subdivided into the four major wind directions and subsequently into different wind speed regimes.
The first group includes three NE trajectory clusters (i.e., NE1, NE2, and NE3), which intersect the coastline in the region of French Guiana and then pass over forest areas towards ATTO. All three trajectory clusters follow roughly the same geographic track; however, they represent different wind speed regimes: the longest – and therefore on average fastest – cluster NE3 spans a distance of ∼2600 km and, thus, represents an average air mass velocity of ∼870 km d−1, while the shortest – and therefore slowest – cluster NE1 spans only ∼1300 km, representing an average air mass velocity of ∼430 km d−1.
The second group includes four ENE BT clusters (i.e., ENE1, ENE2, ENE3, and ENE4), which intersect the Atlantic coast north of the Amazon River delta (over the Brazilian state of Amapá). These clusters also represent different wind velocities, with cluster ENE1 being, on average, the slowest (∼140 km d−1) and cluster ENE4 being the fastest (∼900 km d−1).
The third group includes four E BT clusters (i.e., E1, E2, E3, and E4), which follow the Amazon River valley. The BT clusters meet the Atlantic Ocean in the area of the Amazon River delta. In this group, cluster E1 represents the slowest (∼400 km d−1), whereas cluster E4 represents the fastest air mass movement (∼930 km d−1).
The fourth group includes four inland BT clusters in the ESE and southwesterly (SW) directions. The east-southeasterly clusters ESE1, ESE2, and ESE3 cross the states of Pará and Maranhão and (on average) do not reach the Atlantic Ocean during the analyzed 3 d period. Cluster SW1 points from ATTO in the direction of the city of Manaus.
For comparison, Fig. S10b shows the clustering results for the 200 m BT ensemble with a partitioning into 15 clusters that is comparable to Fig. 4. Generally, the clusters for the 200 m starting height are shorter, which can be explained by a higher surface shear and friction as well as topography effects. Overall, the comparison of Figs. 4 and S10b underlines that the observed trends do not vary substantially within the chosen starting height range.
Table 2Absolute numbers of individual backward trajectories (BTs) and their frequency of occurrence, resolved by main directions of BT advections (i.e., NE, ENE, E, and ESE) as well as for all 15 BT clusters from k means cluster analysis (see Fig. 4).
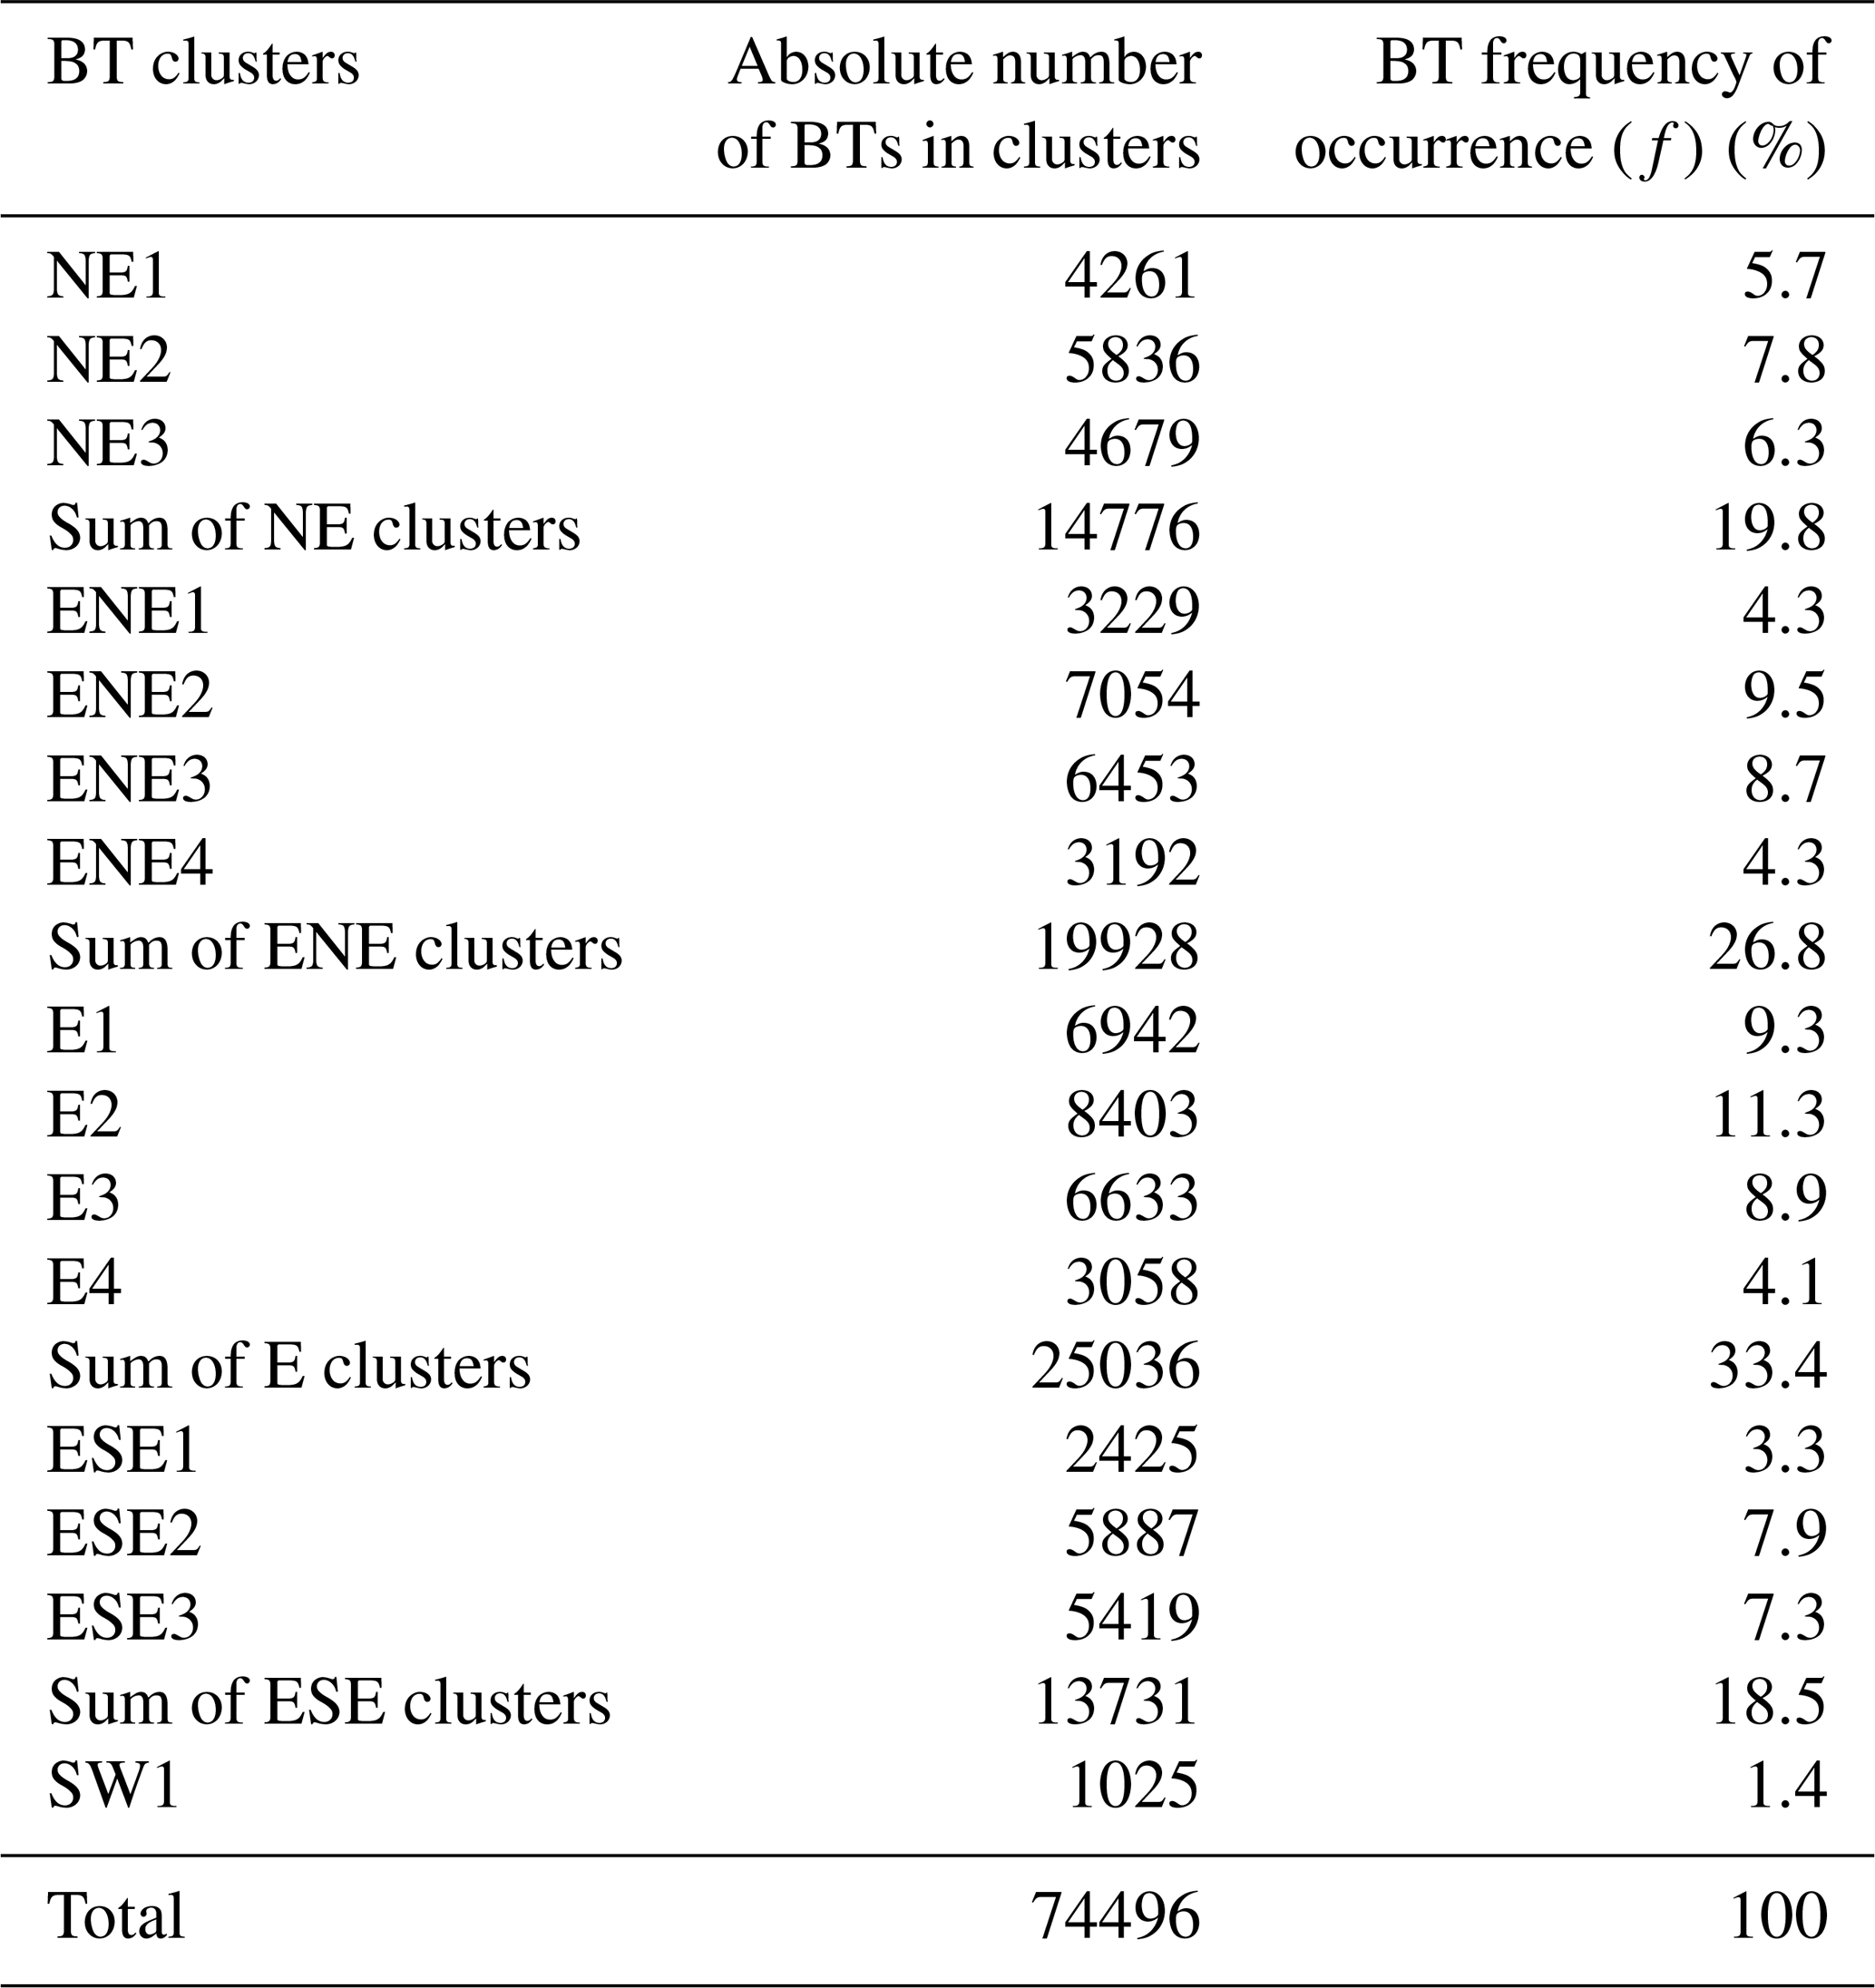
The absolute numbers of individual BTs in the 15 clusters as well as their frequency of occurrence, f, are summarized in Table 2. Overall, the group of E clusters was most abundant with fE=33.4 %, followed by ENE with fENE=26.8 %, NE with fNE=19.8 %, and finally ESE with fESE=18.5 %. The SW1 cluster BTs, which may transport urban emissions from the city of Manaus to ATTO, were rather rare. Analogous to Fig. 2, air mass residence time maps were calculated for the individual 15 BT clusters and can be regarded as cluster-specific BT footprints (shown in Fig. S11). Note that the shapes of these cluster BT footprints are rather diverse. For example, the clusters ENE3, NE2, and NE3 are all characterized by high-wind-speed regimes and, thus, by narrow, long, and “directed” BT footprints. In contrast, the low-wind-speed regime clusters SW1, ESE1, and ENE1 are characterized by broader and short BT footprints with air mass advection from different directions. The different BT footprint shapes determine the mix of land cover types that are covered by them, as discussed in detail in Sect. 3.3.
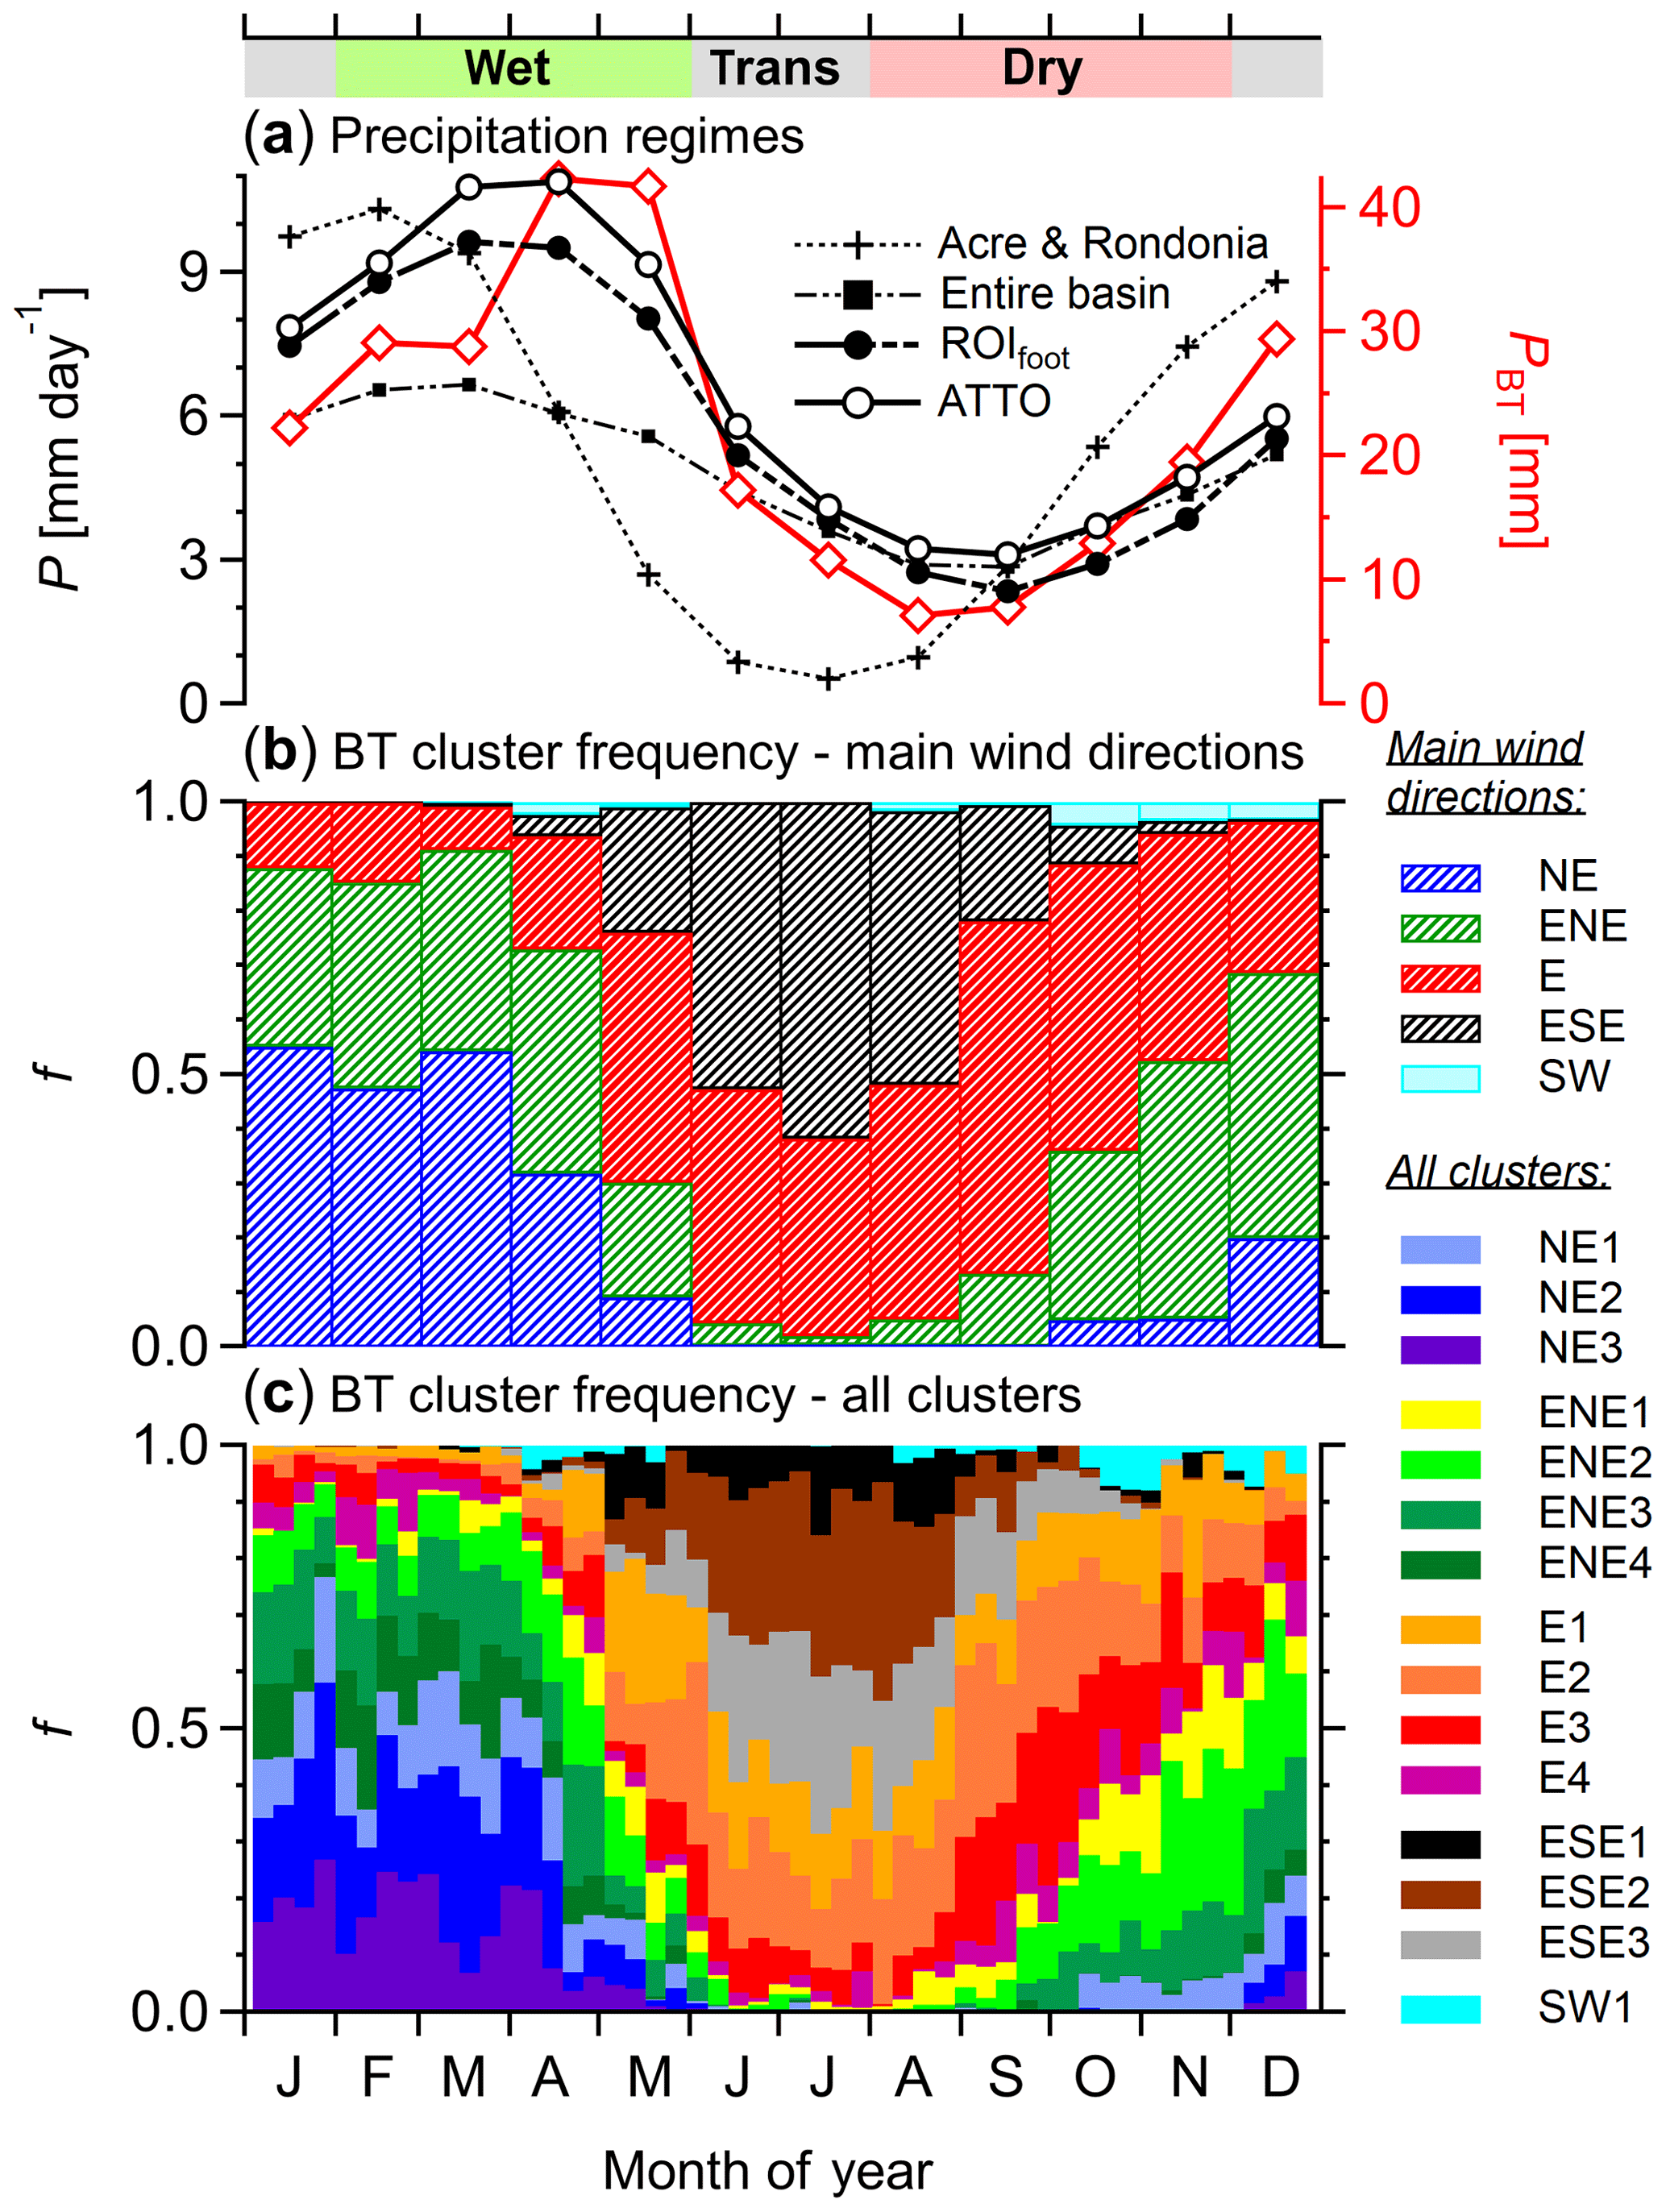
Figure 5Seasonality in precipitation regimes and ATTO-relevant backward trajectory advection. (a) Area-averaged precipitation rates, P, for the ATTO region (see Fig. 4), the ROIfoot (continental part only; see Fig. 4), the entire basin (see Amazon watershed region in Fig. 7), and the states Acre and Rondônia (see Fig. 7). Furthermore, cumulative precipitation along 3 d BT tracks, PBT, is shown. All precipitation data are shown as monthly means. (b) Frequency of occurrence, f, of main directions of BT advection from NE, ENE, E, ESE, and SW. Data are shown as monthly means. (c) Frequency of occurrence, f, of all 15 BT clusters (see Fig. 4). Data are shown as weekly means. The colored bar above panel (a) represents aerosol-related definition of seasonality in the ATTO region according to Pöhlker et al. (2016).
The clustering further provides time-resolved information on the frequency of occurrence and, thus, seasonality of the individual BT clusters, as shown in Fig. 5 along with the seasonal cycles of selected precipitation products. In terms of rainfall, the Amazon region shows heterogeneous patterns with different precipitation regimes. Figure 5a compares the characteristic seasonality in precipitation rates P within the ATTO proximity, the rather large continental part of the ROIfoot, the southwestern states Acre and Rondônia, and the entire Amazon Basin. The following similarities and differences in P amplitude and phase stand out: the phase of the average P within the ROIfoot and at ATTO resembles the phase within the entire basin (maximum around March–April vs. minimum around September). The P amplitude within the ROIfoot ranges above the level for the entire basin and below the level at ATTO. The precipitation regime within the ROIfoot, which represents the northeast basin, is clearly different from the regime in the southwest basin, here represented by Acre and Rondônia, showing a P maximum in February and a minimum in July. The seasonality (color bar above Fig. 5a), which has been defined in Pöhlker et al. (2016) primarily with respect to the aerosol pollution levels, agrees well with the precipitation regime within the ROIfoot.
For further comparison, we added the cumulative precipitation along the BT tracks, PBT, according to the HYSPLIT model. Note that the PBT time series reflects the amount of rain that the air parcels received en route and, therefore, provides a measure for the rain-related aerosol scavenging. Moran-Zuloaga et al. (2018) showed that the PBT is a valuable parameter to explain parts of the aerosol variability at ATTO (e.g., the LRT from Africa). The seasonal cycle in PBT – and thus rain-related scavenging – has its minimum around August and September, which implies that the abundant biomass burning smoke emitted at that time is effectively distributed over the entire basin. The PBT maximum occurs around April and May, which represents (in addition to the minimum in pollution emission in Africa and South America at that time) a main reason for the occurrence of very clean episodes within this time window (see Pöhlker et al., 2018).
In relation to the precipitation regimes, the pronounced seasonality in BT frequency of occurrence is summarized for the main wind directions in Fig. 5b as well as for all BT clusters in Fig. 5c. In terms of main wind directions, the following aspects are worth noting. The ATTO site receives rather stable advection from the Northern Hemisphere (fNE+fENE up to 90 %) during the transition period from dry to wet season and in the first half of the wet season. However, a certain level of fE∼10 % also prevails during this period. During the second half of the wet season, the BT advection migrates southwards. During the transition period from wet to dry season and the first half of the dry season, BTs from the Southern Hemisphere predominate (fE+fESE up to 100 % in July). Note that the E BTs occur throughout the year with varying f, whereas ESE BTs, which cover the southeastern Brazilian states, occur only during a comparatively narrow time window (i.e., May to September with a maximum in July). The (rather rare) SW BTs mostly occur during the late dry season.
Beyond the separation into main wind directions, the representation of f for the individual BT clusters in Fig. 5c resolves further details. As an example, the classification into wind speed regimes by means of the individual BT clusters illustrates that the rather fast NE2 and NE3 BTs reach their highest frequency from January to April (fNE2+fNE3 up to 50 %), which corresponds with the most frequent arrival of Saharan dust plumes in the ATTO region, due to the fact that the fast NE advection tends to bypass strong precipitation in the ITCZ belt (see details in Moran-Zuloaga et al., 2018). A further remarkable observation is the relatively fast north-to-south swing of the BTs, spanning over ∼3 months (i.e., April to June), in contrast to the rather gradual south-to-north swing, extending over ∼6 months (i.e., August to January). Overall, the BT seasonal cycle (i.e., northernmost circulation around February vs. southernmost circulation around July) is phase-shifted relative to the P seasonality. Along these lines, knowledge on the characteristic seasonal patterns in BT advection has proven to be valuable in explaining central aspects of the aerosol variability at ATTO (see Moran-Zuloaga et al., 2018; Pöhlker et al., 2018; Saturno et al., 2018b).
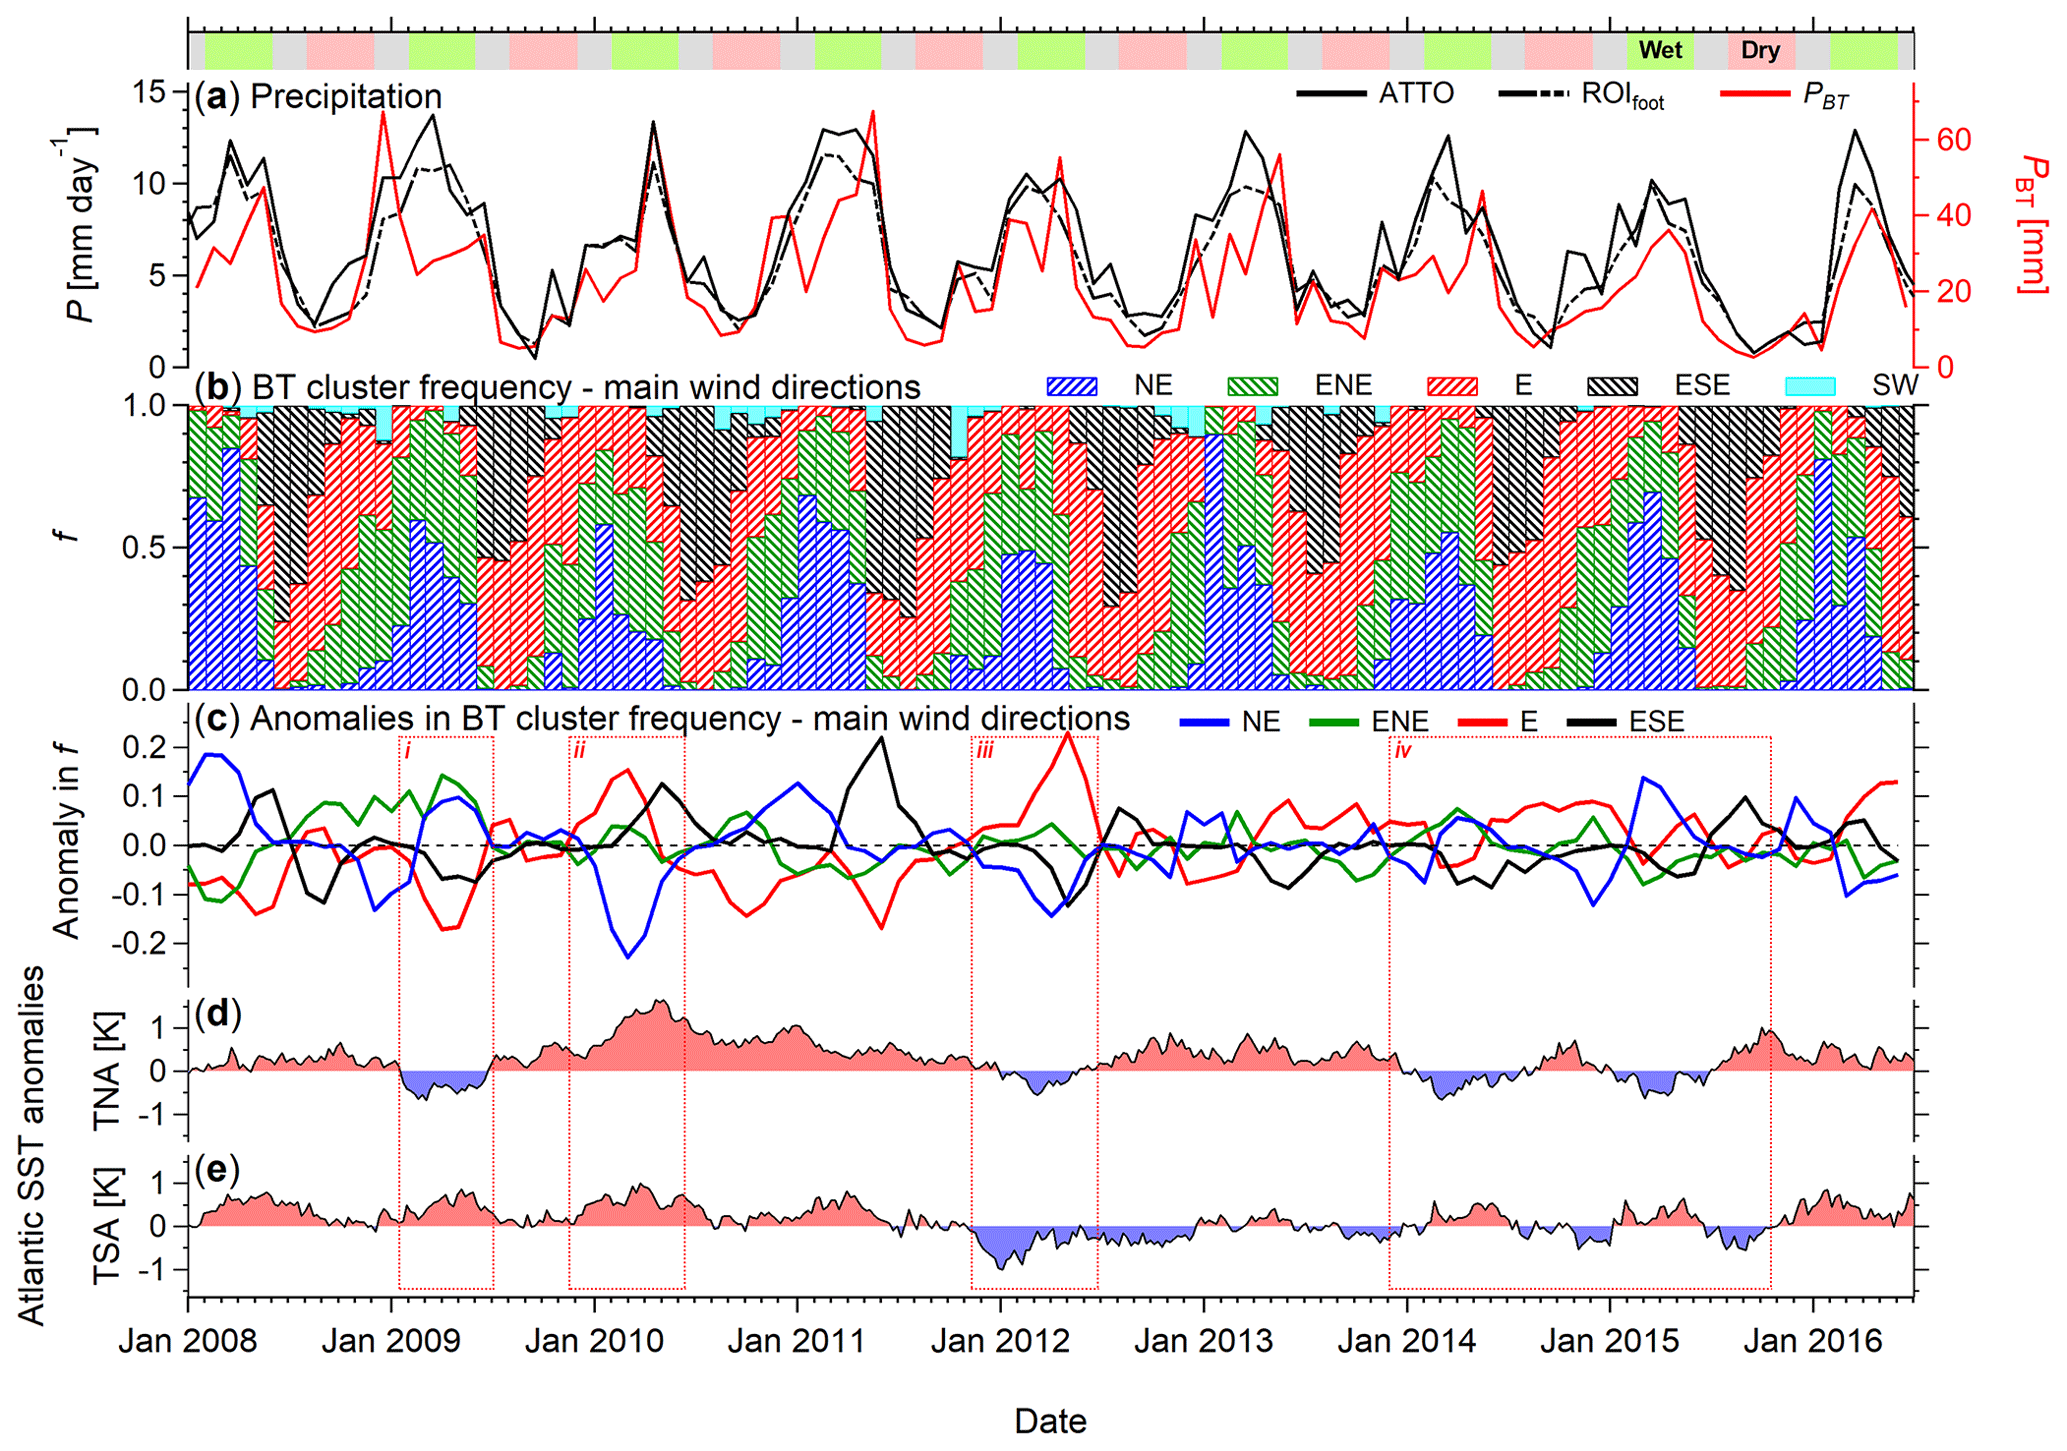
Figure 6Multi-year variability and anomalies in BT advection in relation to Atlantic sea surface temperatures. (a) Area-averaged precipitation rates, P, for the ROIATTO and continental part of the ROIfoot (for both, see Fig. 4). Furthermore, cumulative precipitation along 3 d BT tracks, PBT, is shown. All precipitation data are shown as monthly means. (b) Frequency of occurrence, f, of main directions of BT advection from NE, ENE, E, ESE, and SW. Data are shown as monthly means. (c) Anomalies in frequency, f, of main directions in BT advection. Data are shown as monthly means. Red boxes (i), (ii), (iii), and (iv) highlight examples of pronounced anomalies in f. (d and e) Anomalies in sea surface temperature of tropical north Atlantic (TNA) and tropical south Atlantic (TSA). The colored bar above panel (a) represents aerosol-related definition of seasonality in ATTO region according to Pöhlker et al. (2016).
Figure 6 shows the inter-annual variation and anomalies in BT advection. It is well known that atmospheric circulation, moisture transport, and precipitation patterns over Amazonia are linked through teleconnections to the variability of the tropical Pacific and Atlantic sea surface temperatures (SSTs) (e.g., Good et al., 2008; Fernandes et al., 2015; Tyaquiçã et al., 2017). In particular, the tropical Atlantic meridional gradient has a direct influence on the position of the ITCZ and trade wind patterns towards and over the basin (e.g., Chiang et al., 2002). Specifically, a warming of the tropical north Atlantic (TNA) relative to the tropical south Atlantic (TSA) is associated with a northwards shift of the ITCZ and corresponding weakening of the northeasterly trades, whereas an anomalously warm TSA relative to the TNA tends to cause a southwards shift of the ITCZ and a weakening of the southeasterly trades (e.g., Cox et al., 2008; Espinoza et al., 2014; Marengo and Espinoza, 2016; Erfanian et al., 2017). Figure 6 confirms these trends by comparing the anomalies in BT frequency (i.e., fNE, fENE, fE, and fESE) with the anomalies in TNA and TSA SSTs. For several episodes, diametral patterns with an anomalous increase (decrease) in fNE and corresponding decrease (increase) in fE and/or fESE can be seen. Four characteristic examples are highlighted in Fig. 6c–e as cases (i), (ii), (iii), and (iv). For instance, case (i) in 2009 shows a cooling in the TNA and a simultaneous warming in the TSA, associated with anomalously high fNE and low fE levels. In case (iii), a cooling of the TNA occurs with an even stronger cooling of the TSA, which is associated with a strong positive anomaly in fE. The aforementioned results indicate that the air mass advection and, thus, the atmospheric state at ATTO is teleconnected to the Atlantic SSTs. However, the statistical basis for the present analysis is only 8 years of BT data and future studies may be needed to explore the role of teleconnections in more detail.
Closely linked to their influence on atmospheric circulation in the basin, teleconnections to Pacific and Atlantic SSTs play a crucial role in the occurrence of droughts and floods in Amazonia (e.g., Fu et al., 2001; Zeng et al., 2008; Fernandes et al., 2015; Marengo and Espinoza, 2016). The Pacific SST variability, which is represented by the Oceanic Niño Index (ONI), plays a central role in the El Niño–Southern Oscillation (ENSO) and has a pronounced influence on the Amazonian hydrological cycle (e.g., Asner et al., 2000; Ronchail et al., 2002). Periods with a high ONI indicate El Niño conditions and are typically associated with dry or even drought years in the central Amazon (e.g., Lewis et al., 2011; Marengo et al., 2011). A negative ONI indicates La Niña conditions, which are typically associated with rain-rich years. The Atlantic SST further modulates the hydrological conditions and can intensify ENSO-related anomalies or even cause hydrological extremes itself (i.e., anomalously high TNA can cause droughts, whereas anomalously high TSA can cause floods) (Zeng et al., 2008; Lewis et al., 2011; Marengo and Espinoza, 2016). The ATTO-relevant long-term rainfall anomalies for the ROIfoot are shown in Fig. S12 along with the Pacific and Atlantic SST variability. This comparison clearly shows that ENSO has a significant influence on hydrological extremes within the ROIfoot. For example, El Niño periods caused severe droughts in the years 1983, 1993, 1997/98, 2003/04, 2009/10, and 2015/16, whereas La Niña episodes caused large positive rainfall anomalies in the years 1988/89, 1996, 1999/2000, and 2011. The drought periods 2009/10 and 2015/6 and an associated increase in fire activity, which also strongly impacted the atmospheric state at the ATTO and ZF2 sites, have been documented in previous studies (e.g., Saturno et al., 2018b; Tyukavina et al., 2017).
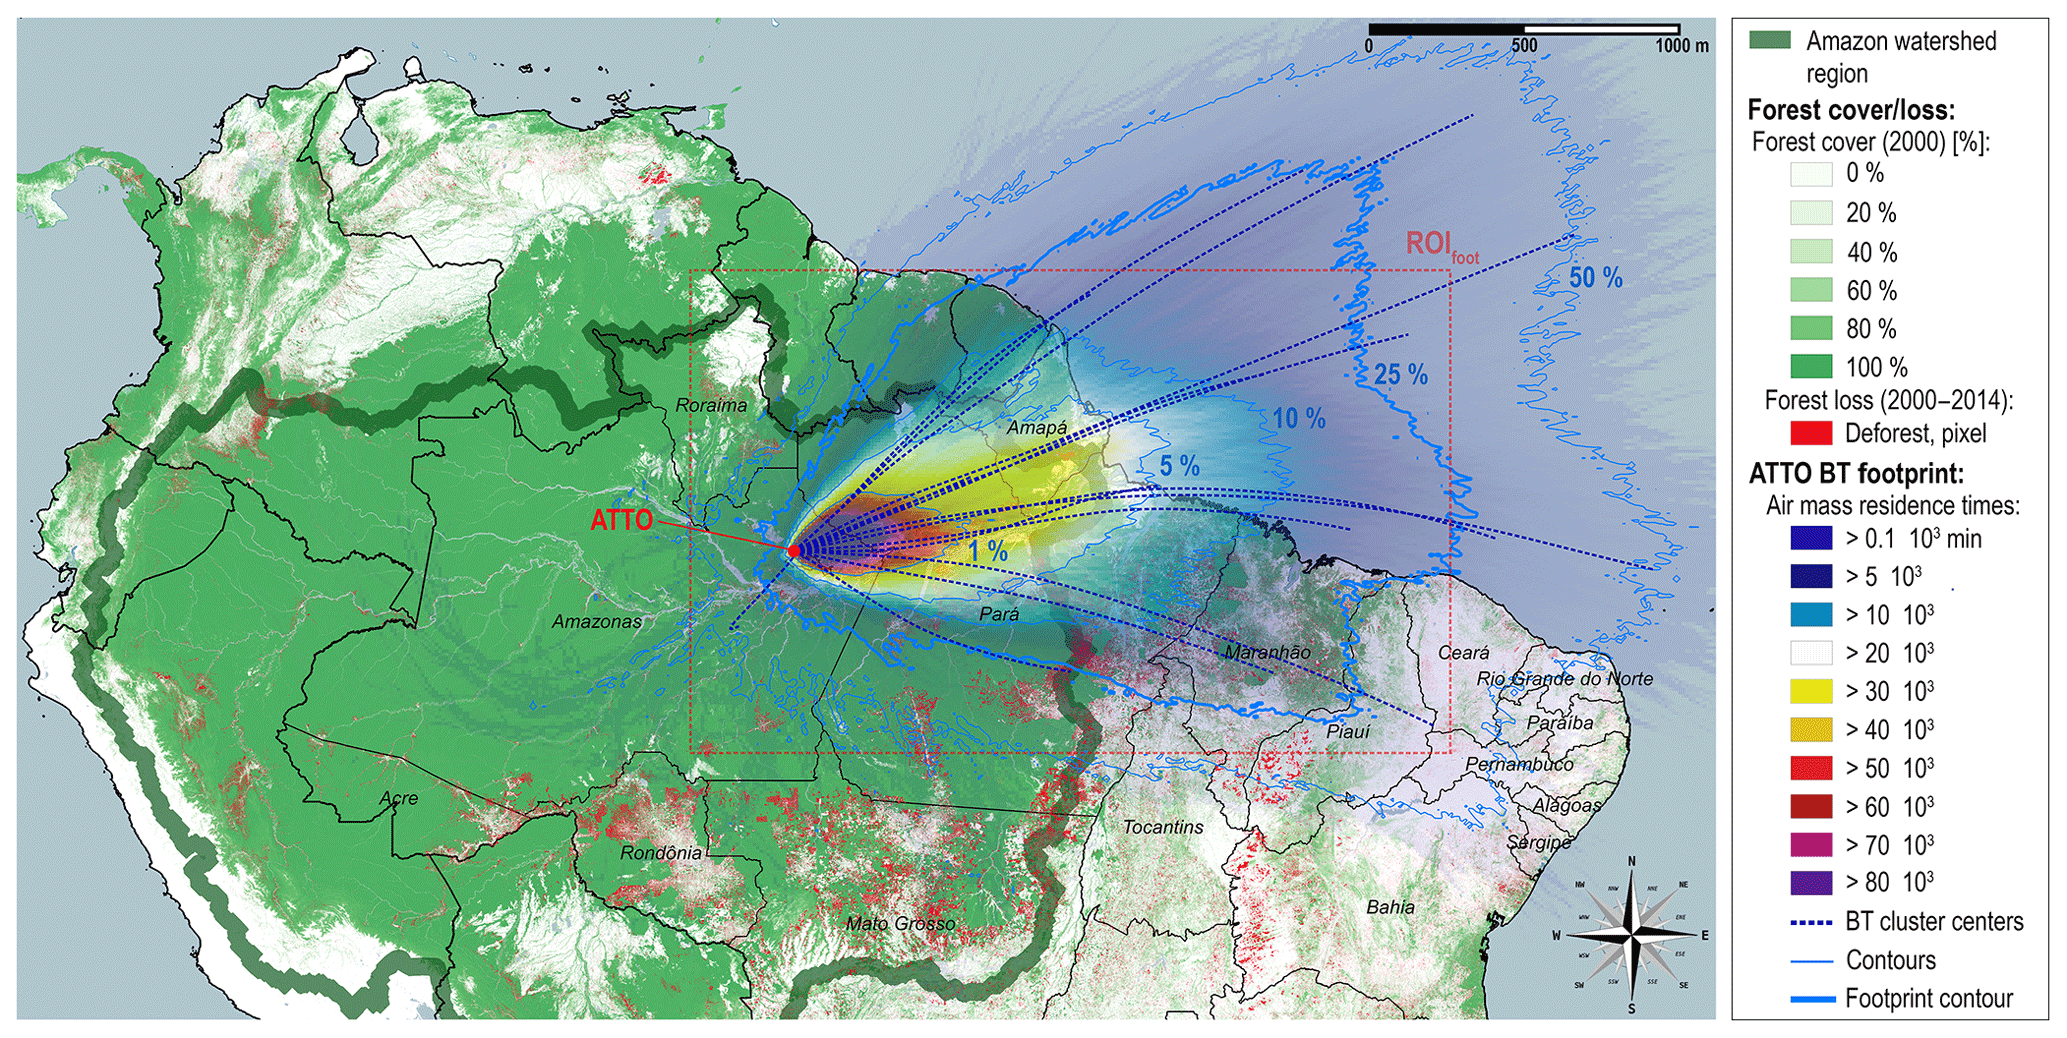
Figure 7Overview map of the Amazon Basin – here represented by the watershed region of the Amazon River and its tributaries – showing the location of the ATTO site and the geographic extent of its footprint. The footprint is represented by (i) an air mass residence time map based on the entire BT ensemble (color code), (ii) contour lines representing the largest 1 %, 5 %, 10 %, 25 %, and 50 % of air mass residence times, and (iii) 15 cluster center lines from BT cluster analysis (blue dashed lines; see Fig. 4). For comparison, versions of footprint region based on filtered BT ensembles are shown in Figs. 8 and S5. Green areas represent forest cover map (status 2000) according to Hansen et al. (2013). Red areas represent total forest loss from 2000 to 2014 according to Hansen et al. (2013). The green thick line represents Amazon Basin watershed region. The red rectangular shape highlights the region of interest ROIfoot (62 to 40∘ W; 8∘ S to 6∘ N).
3.3 Land cover analysis within ATTO site backward trajectory footprint region
The BT analysis defines the areas in the northeastern Amazon Basin that can be regarded as the ATTO site BT footprint region. Its land cover status and anticipated future land cover change are the subject of the analysis in the subsequent sections. As a general overview, Fig. 7 shows the geographic extent of the Amazon Basin in combination with the air mass residence time map. The distribution of air mass residence times shows steeply decreasing values with increasing distance from the ATTO site. The upper 1 % of air mass residence times cover an area of 0.10×10⁶ km2 towards the east of ATTO, including regions in the Brazilian states Amazonas and Pará. The upper 5 % (continental area 0.48×10⁶ km2) as well as the upper 10 % (continental area 0.81×10⁶ km2) include the northeastern parts of the state of Amazonas, the northern half of the state of Pará, and the state of Amapá. Accordingly, this region to the north of the Amazon River – including the Amazon River valley itself – appears to be an important source region for the ATTO observations. The land cover, recent dynamics of land cover change, and any ongoing or planned human-made perturbation (e.g., expanding agriculture, large-scale infrastructure, and mining) in this region are of particular relevance for the (future) ATTO research. The region of the upper 25 % of air mass residence times, which has been defined as the ATTO BT footprint region in the context of this work, covers a continental area of km2 and also includes French Guiana and parts of Suriname as well as the eastern Brazilian state of Maranhão.
The forest cover and forest loss map in Fig. 7 illustrates the pronounced northwest-to-southeast gradient, with the northwest being mostly unperturbed and the southeast being subject to intense, large-scale deforestation and land use change (Davidson et al., 2012). Within this gradient, the forest loss data emphasize the geographic extent of the so-called arc of deforestation at the southern and southeastern margins of the Amazon forest, which has been an active frontier of total forest loss (Morton et al., 2006). The arc of deforestation spans from southern Pará and Maranhão in the southeast over Mato Grosso and Rondônia in the south to Acre in the southwest of the basin. The majority of forest clearance has been concentrated here over the last decades, mainly driven by agricultural expansion (Malhi et al., 2008). The following sections will zoom into the ROIfoot, as shown in Fig. 7, and analyze the ATTO-relevant land cover properties and trends by means of selected GIS data layers. As general background information, an elevation map, which characterizes the terrain topography in the ROIfoot, can be found in Fig. S13.
The footprint shown in Fig. 7 takes the entire BT ensemble into account and serves as the base case footprint throughout the subsequent land cover analysis. It is worth noting, however, that mostly those segments of the individual BTs, which were in convective contact to the ground through BL mixing, matter most to identify regions of particular relevance for the ATTO observations. The same is true for those BTs that arrive at ATTO during convective hours (i.e., excluding conditions with decoupled layers during nighttime) and, thus, may introduce emissions from sources in the footprint region into the ATTO BL through vertical mixing. To estimate the impact of such a “diurnally intermittent mixing” on the ATTO BT footprint, we conducted a sensitivity analysis by applying a sequence of filters to the base case BT ensemble (for details see Sect. 2.5). Overall, the filtering does not substantially alter the geographic extent of the footprint's easterly core regions. Only minor variations in the outer parts of the 25 % contour lines were observed (Fig. S5). This underlines that the base case BT footprint is generally suited to identify regions and land cover types that are of relevance for the ATTO research.
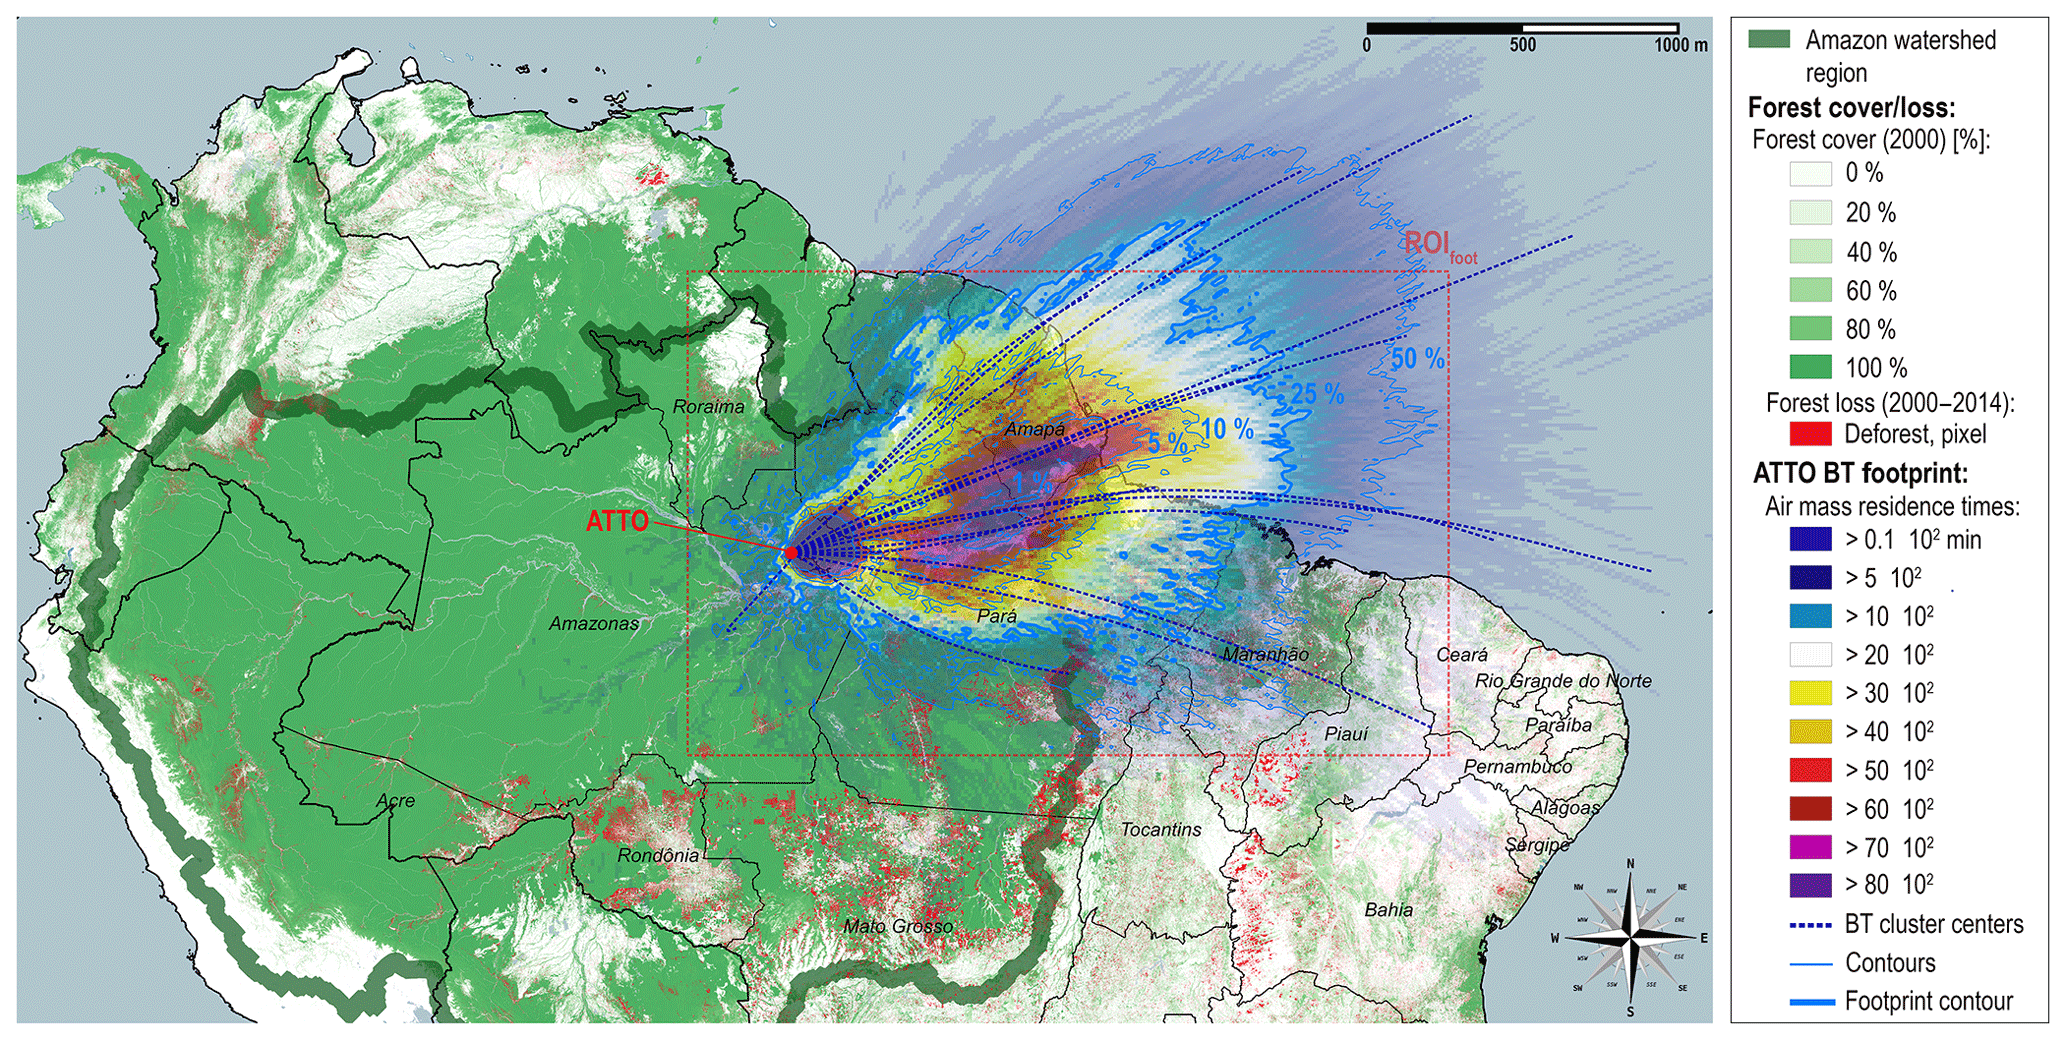
Figure 8Overview map of the Amazon Basin – mostly identical to Fig. 7 – with refined air mass residence time map based on filtered BT ensemble (color code). The BT filtering was conducted according to case H1000_Cer_Catto as shown in Fig. S5 and outlined in Sect. 2.5. Contour lines represent the largest 1 %, 5 %, 10 %, 25 %, and 50 % of air mass residence times, based on the filtered BT ensemble.
Beyond the general consistency between the footprint regions with and without the convection filters being applied, some characteristic patterns emerge in the corresponding map in Fig. 8, if diurnally intermittent mixing is taken into account. In fact, this BT refinement suggests that certain footprint regions tend to be more relevant for the ATTO observations than others. Specifically, the geographic locations of the convective segments of those BTs that arrive at ATTO during daytime are more relevant than the non-convective (nighttime) segments of the same BTs. Due to the comparatively constant wind directions and velocities, the resulting dashed lines (convective vs. non-convective) of the large number of BTs result in repeating geographic patterns. Figure 8 suggests that the region directly east of ATTO as well as the easterly valley of the Amazon River are frequently and convectively linked to the overpassing air masses and, thus, most relevant for the ATTO observations.
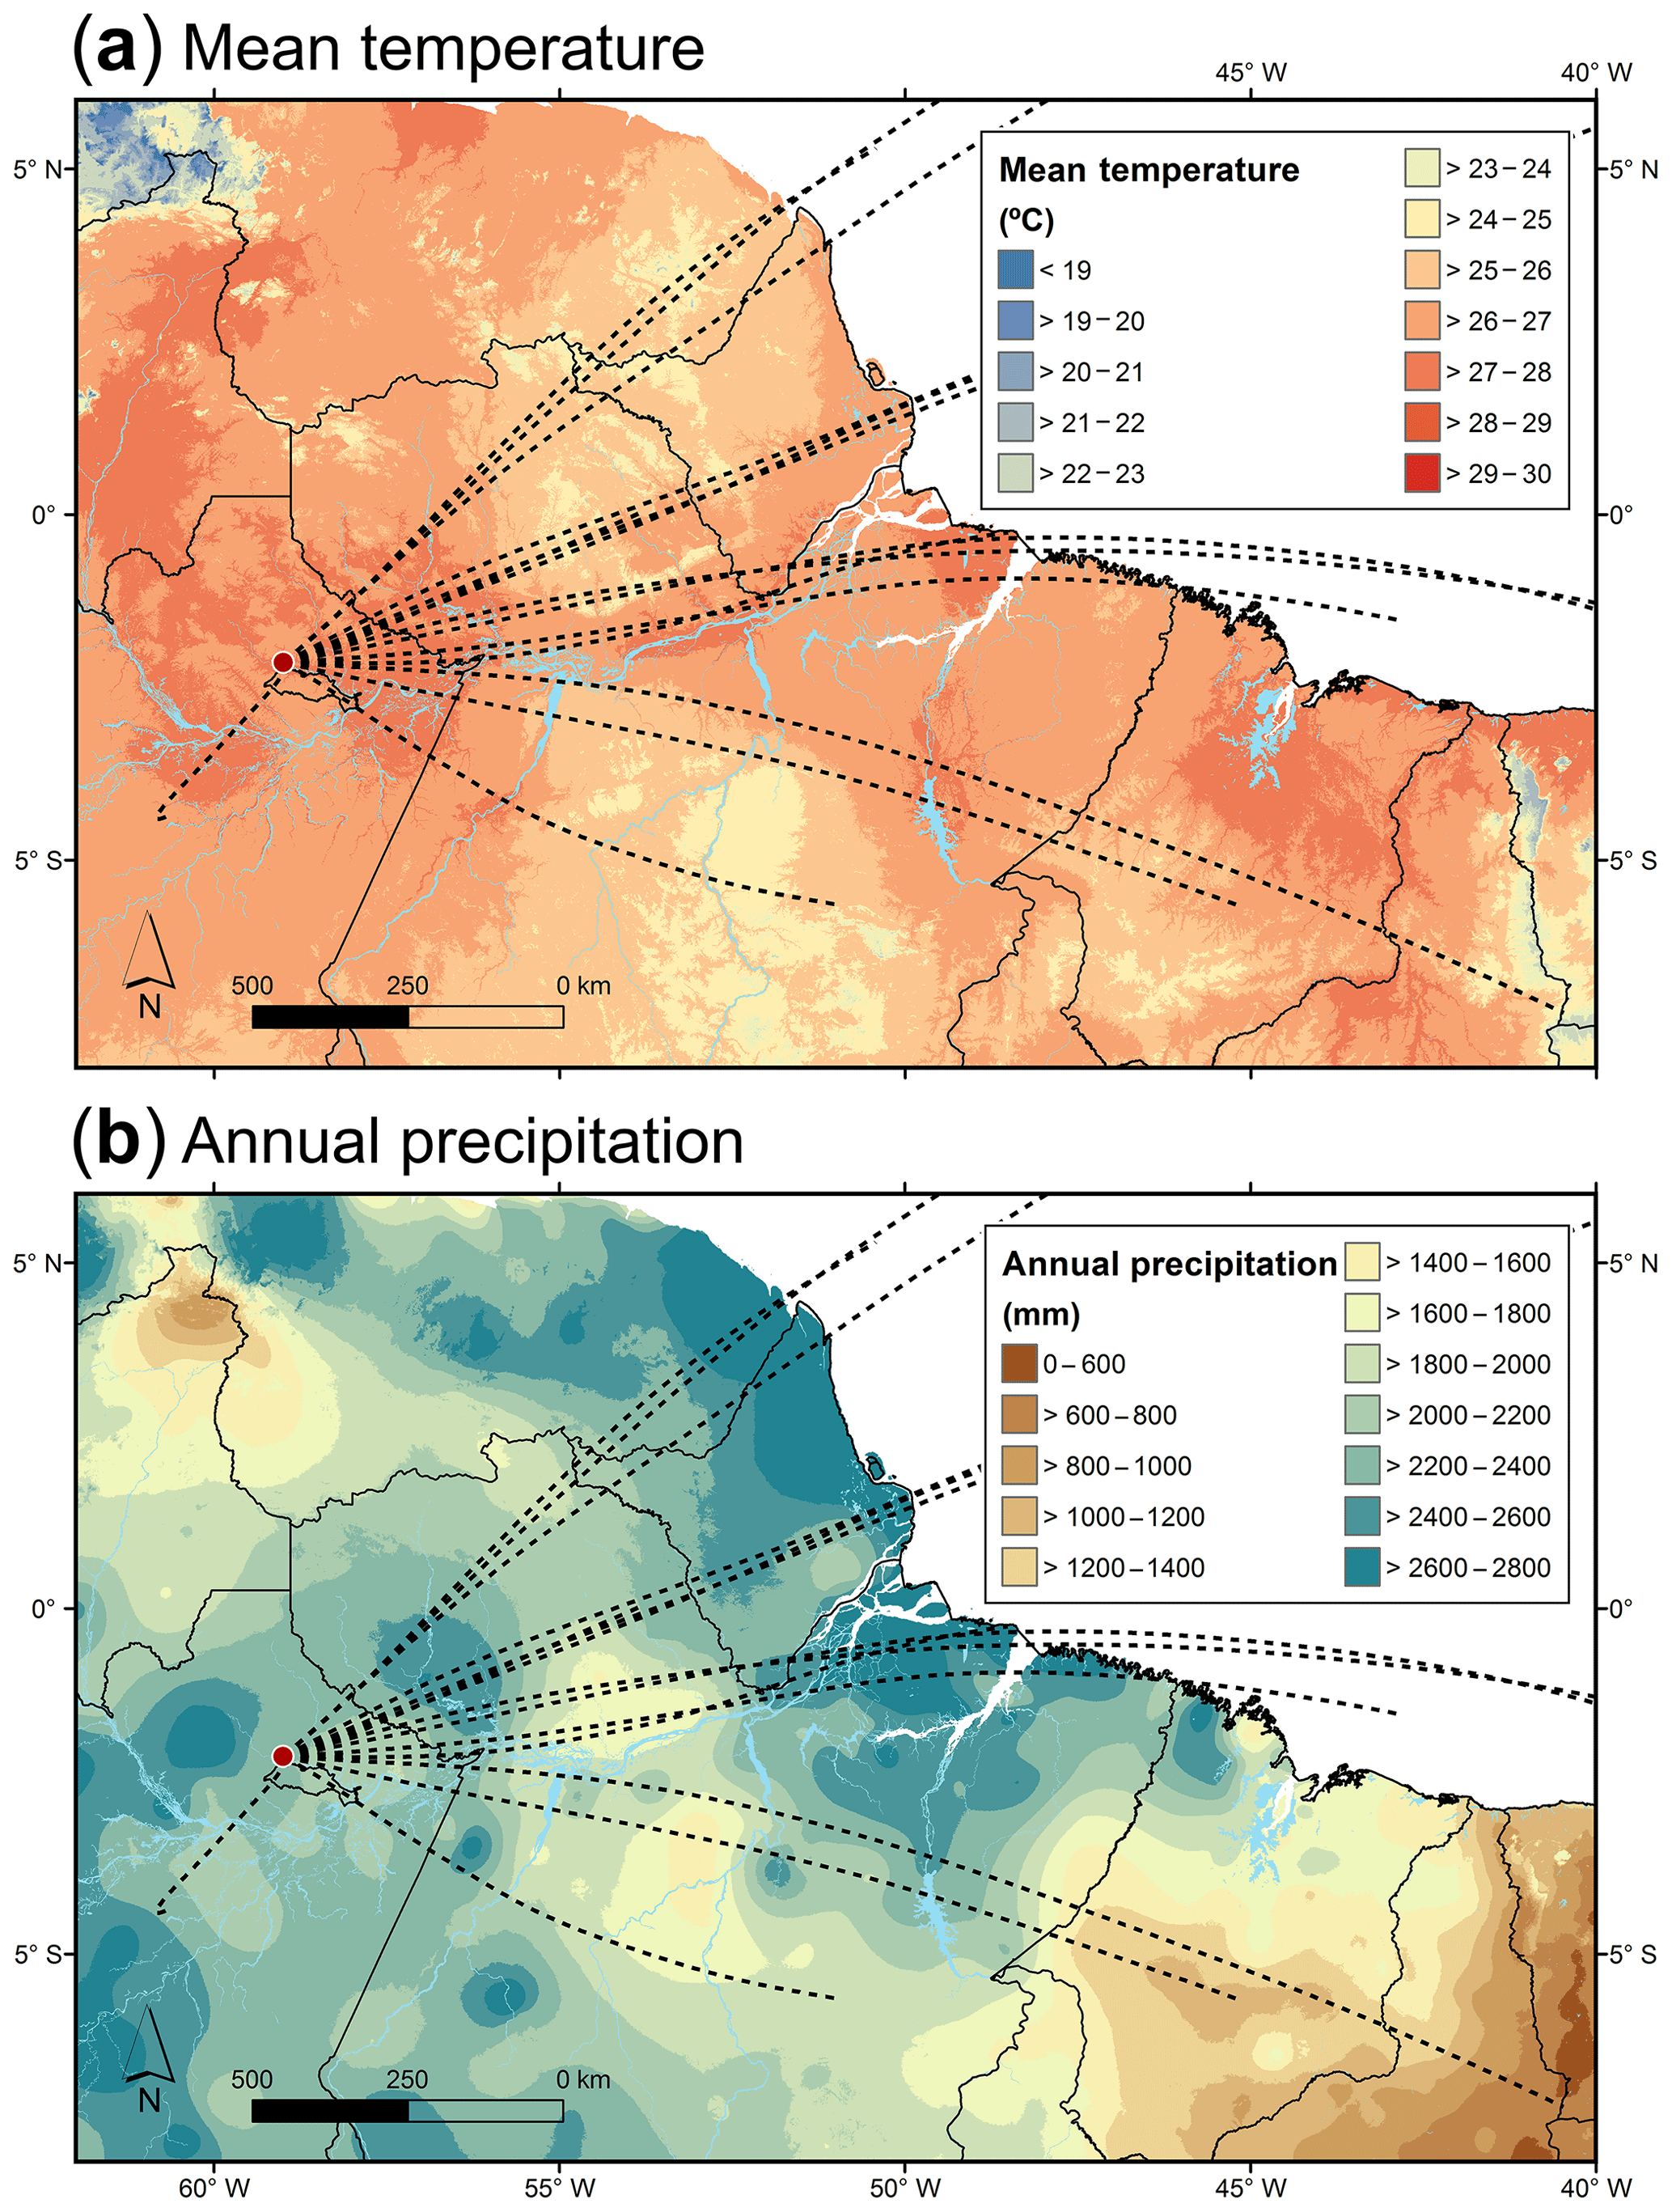
Figure 9Map of the ATTO-relevant eastern Amazon Basin (ROIfoot) combining the backward trajectory (BT) data with GIS data layers of (a) mean temperature and (b) annual precipitation, both obtained from the WorldClim database (Hijmans et al., 2005; http://worldclim.org/, last access: 19 May 2019). The BT data are represented as center lines of the 15 BT clusters (black dashed lines; see Fig. 4).
3.3.1 Climatic conditions, biomes, ecoregions, and the last-of-the-wild
This section provides a characterization of the BT footprint region from a climatic and ecological perspective. Figure 9 shows maps of the mean temperature and annual precipitation in the ROIfoot, underlining the (mostly) moist and warm tropical conditions. However, precipitation patterns are relatively heterogeneous: comparatively dry regions (i.e., annual precipitation <1500 mm) can be found toward the southeast as well as in northern Roraima, whereas the highest annual precipitation occurs along the Guianan coast, over the Amazon River delta, and towards the southwest of ATTO. In this context, an annual precipitation above the threshold of ∼1500 mm is considered to be required for the existence of moist tropical forests, whereas an annual precipitation <1500 mm tends to support savanna-like vegetation types (Malhi et al., 2009). The heterogeneous precipitation patterns are consistent with four different Köppen–Geiger climate classes being included in the ROIfoot: the rain-rich regions correspond with tropical rain forest (Af) and tropical monsoon areas (Am), whereas the regions with comparatively low precipitation correspond with tropical savannah (Aw) and hot arid steppe (Bsh) areas (compare Figs. 9b and S14) (Kottek et al., 2006; Peel et al., 2007; Rubel and Kottek, 2010).
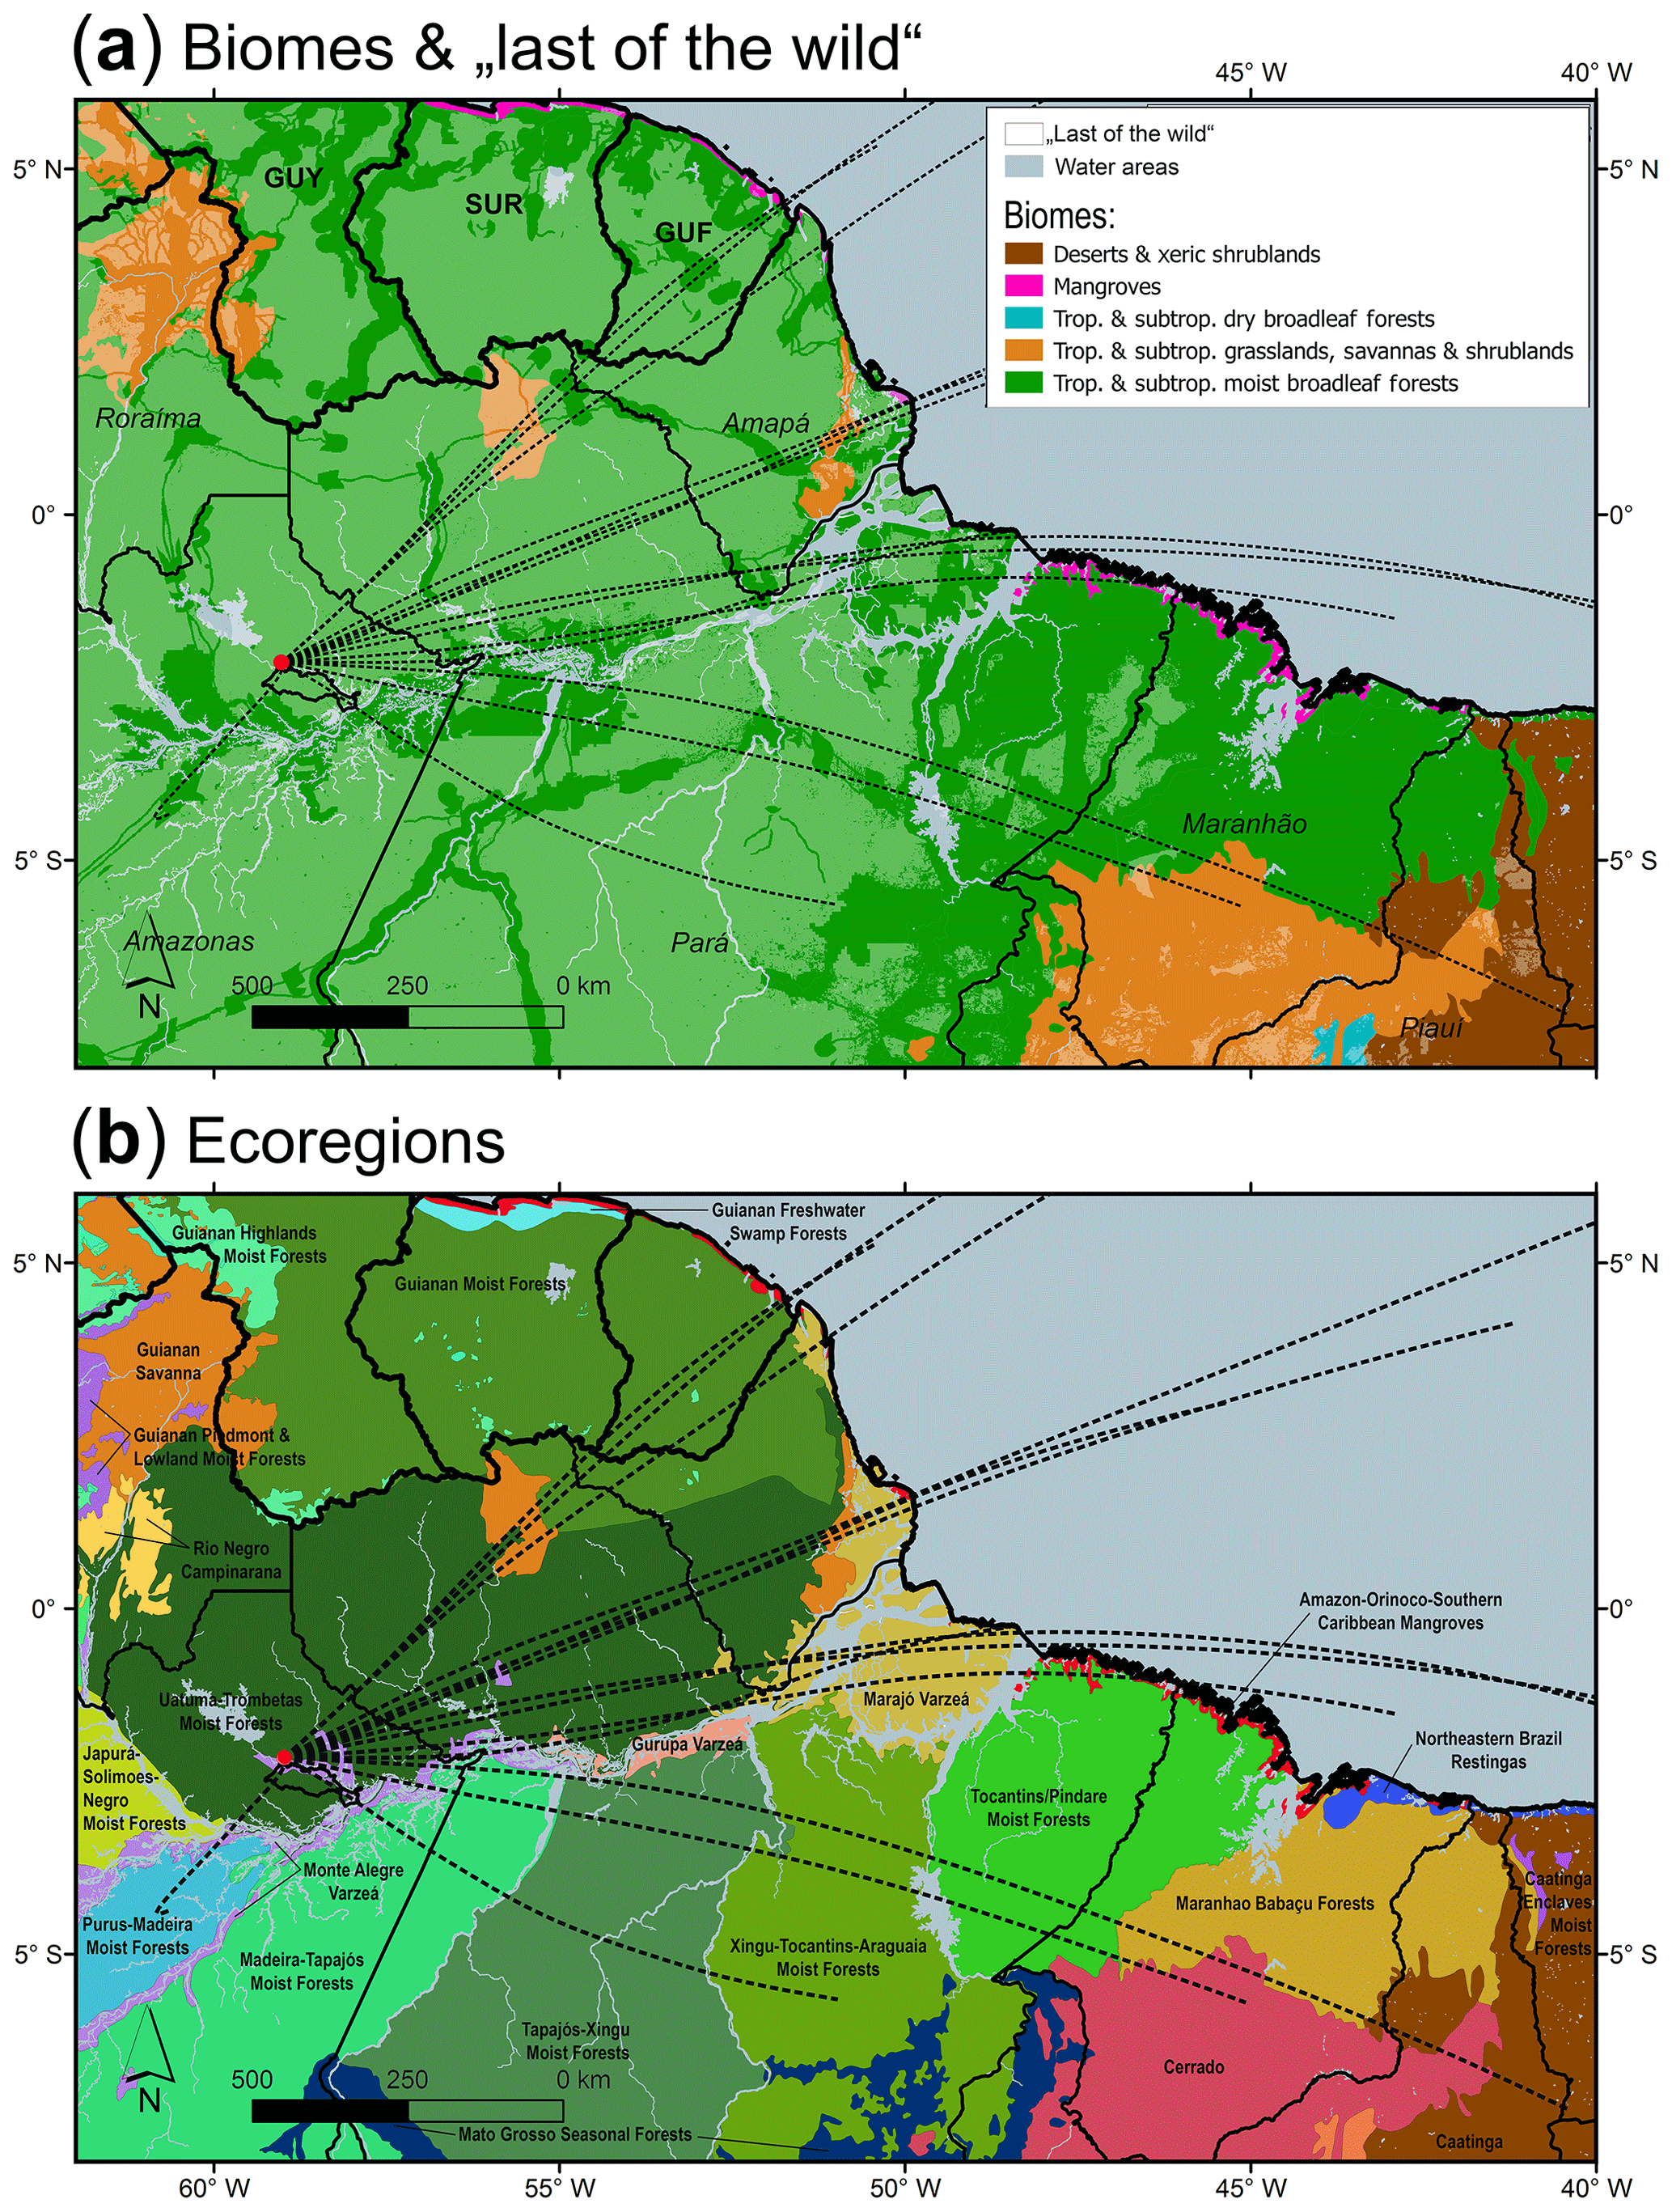
Figure 10Map of the ATTO-relevant eastern Amazon Basin (ROIfoot) combining the backward trajectory (BT) data with GIS data layers of (a) a biome classification according to Olson et al. (2001) and a map of the wildest/most unperturbed areas in the corresponding biomes (last of the wild, shaded in grey on top of the biome classification map) according to Sanderson et al. (2002) as well as (b) ecoregions according to Olson et al. (2001). The BT data are represented as center lines of the 15 BT clusters (black dashed lines; see Fig. 4).
Figure 10a presents a geographic biome classification according to Olson et al. (2001), with the following five biomes being included in the ROIfoot: (i) tropical and subtropical moist broadleaf forests, which occupy most of the area (89.9 % of the continental part of the BT footprint region and 84.4 % of the continental ROIfoot), (ii) tropical and subtropical grasslands, savannas, and shrublands (8.2 % of footprint and 10.1 % of ROIfoot), (iii) deserts and xeric shrublands, which occur in the southeast of the ROIfoot (0.6 % of footprint and 4.4 % of ROIfoot), (iv) mangrove forests at the Brazilian and Guianan coasts (1.3 % of the ATTO BT footprint and 0.9 % of the ROIfoot), and (v) tropical and subtropical dry broadleaf forests in the SE, which are merely of marginal extent in the ROIfoot. The Olson biome classification and the Köppen–Geiger climate classification generally show consistent geographic features on large scales. The Olson classification represents a hierarchical approach with 867 ecoregions being nested within the larger biome regions. Olson et al. (2001) defined the ecoregions as “relatively large units of land containing distinct assemblage of natural communities and species, with boundaries that approximate the original extent of natural communities prior to major land-use change”. In other words, the Olson ecoregion classification takes into account that “Amazonia is not a single biogeographic entity”, but rather “a mosaic of distinct areas of endemism separated by the major rivers, each with their own evolutionary relationships and biotic assemblages” (Da Silva et al., 2005). These areas of endemism have been defined rather differently, depending on the specific biogeographic distributions of the groups of organisms (e.g., birds, reptiles) that constitute the basis for the resulting cartography (e.g., Cracraft, 1985; Naka, 2011; Oliveira et al., 2017). However, any classification of ecoregions and/or areas of endemism shows a generalized picture. Irrespective of this uncertainty, our rationale to show the ecoregions by Olson et al. (2011) here is to provide an impression of the biogeographic diversity within the ROIfoot.
Most of these ecoregions within the BT footprint belong to the biome category of tropical and subtropical moist broadleaf forests (Fig. 10b). The ecoregion with the highest overlap with the ATTO footprint is the Uatumã-Trombetas moist forest. Moreover, regions with so-called várzea forest (i.e., the Monte Alegre, Gurupá, and Marajó várzea forests) are located within the footprint, which represents frequently flooded Amazonian white-water forests along the rivers Solimões, Madeira, and others (e.g., Wittmann et al., 2004; Junk et al., 2012, 2015; Myster, 2016). As the várzea forests are frequently flooded, they comprise vegetation with special adaptations. Due to the frequent flooding, the soil in these forest regions experiences periodically anoxic conditions, which have been reported to generate significant methane flux to the atmosphere (e.g., Engle and Melack, 2000). Accordingly, the location of frequently flooded areas – such as the várzea forests in the core region of the footprint – are potentially of high relevance for the methane observations at ATTO (see Andreae et al., 2015). In addition to the forests, tropical savanna ecoregions with shrub- and/or grassland vegetation (i.e., the Guianan savannas and the Cerrado region) are also covered by the footprint (Dixon et al., 2014). For comparison, Fig. S15 shows the potential natural vegetation in the absence of human alterations, which illustrates that the overall distribution of forests, savannas, and shrublands (i.e., Cerrado region and Guianan savannas) corresponds with the patterns in climatic conditions (i.e., annual precipitation; see Fig. 9b) rather than human influences. Overall, this general characterization of different/contrasting biomes and ecoregions in the ROIfoot may be of value – for instance – for future bioaerosol studies at ATTO as the different ecoregions are presumably associated with varying bioaerosol populations and emission patterns (Després et al., 2012).
An additional GIS layer in Fig. 10a visualizes areas with the lowest anthropogenic influence – so-called last-of-the-wild areas – as an approximation of the biosphere in a pristine state (Sanderson et al., 2002).2 The last-of-the-wild map suggests that comparatively large parts of the ATTO footprint region – particularly in the northeast – could be considered mostly untouched regions (∼54 % of the BT footprint). However, it also visualizes that the last-of-the-wild regions are fragmented by rather broad corridors of human-made perturbation along the rivers and highways, as discussed in greater detail in the subsequent Sect. 3.3.3 and 3.3.6. In this context, a lively discussion on the distribution and extent of human settlements and landscape transformations in the pre-Columbian era has arisen (e.g., Piperno et al., 2015). This debate has refuted the perception that the entirety of the Amazon Basin was a “virgin forest” in a pristine state before European arrival in 1491 CE (Bush et al., 2015). Instead archaeological, paleoecological, and ethnographic research has collected evidence for complex regional settlements, cultural forests, agricultural areas, infrastructure, and, thus, large-scale landscape transformations (e.g., Heckenberger et al., 2003; Clement et al., 2015). These ancient human activities were spatially and temporally heterogeneous with certain areas being highly reshaped and others remaining mostly untouched. Specifically, it has been found that ancient activities were mostly concentrated in riverine settings, such as the várzea floodplain forests, along the major rivers in the central and eastern basin, as well as in savanna and seasonally flooded forest environments (McMichael et al., 2014). Although rapid forest regrowth occurred in abandoned settlements – particularly after the collapse of the native civilization starting in 1491 CE – it is debated whether the ancient human activities have had enduring consequences for the present forest structure and diversity, due to burning, hunting, and the enrichment/depletion of useful/unwanted plants (e.g., Bush et al., 2015; McMichael et al., 2017). The studies by McMichael et al. (2014, 2017) suggest that rather high levels of ancient human activities (e.g., slash and burn agriculture) were concentrated along the major river corridors in the ROIfoot. This could be of relevance for the contemporary forest structure and biodiversity in the ATTO footprint and has to be considered in future studies.
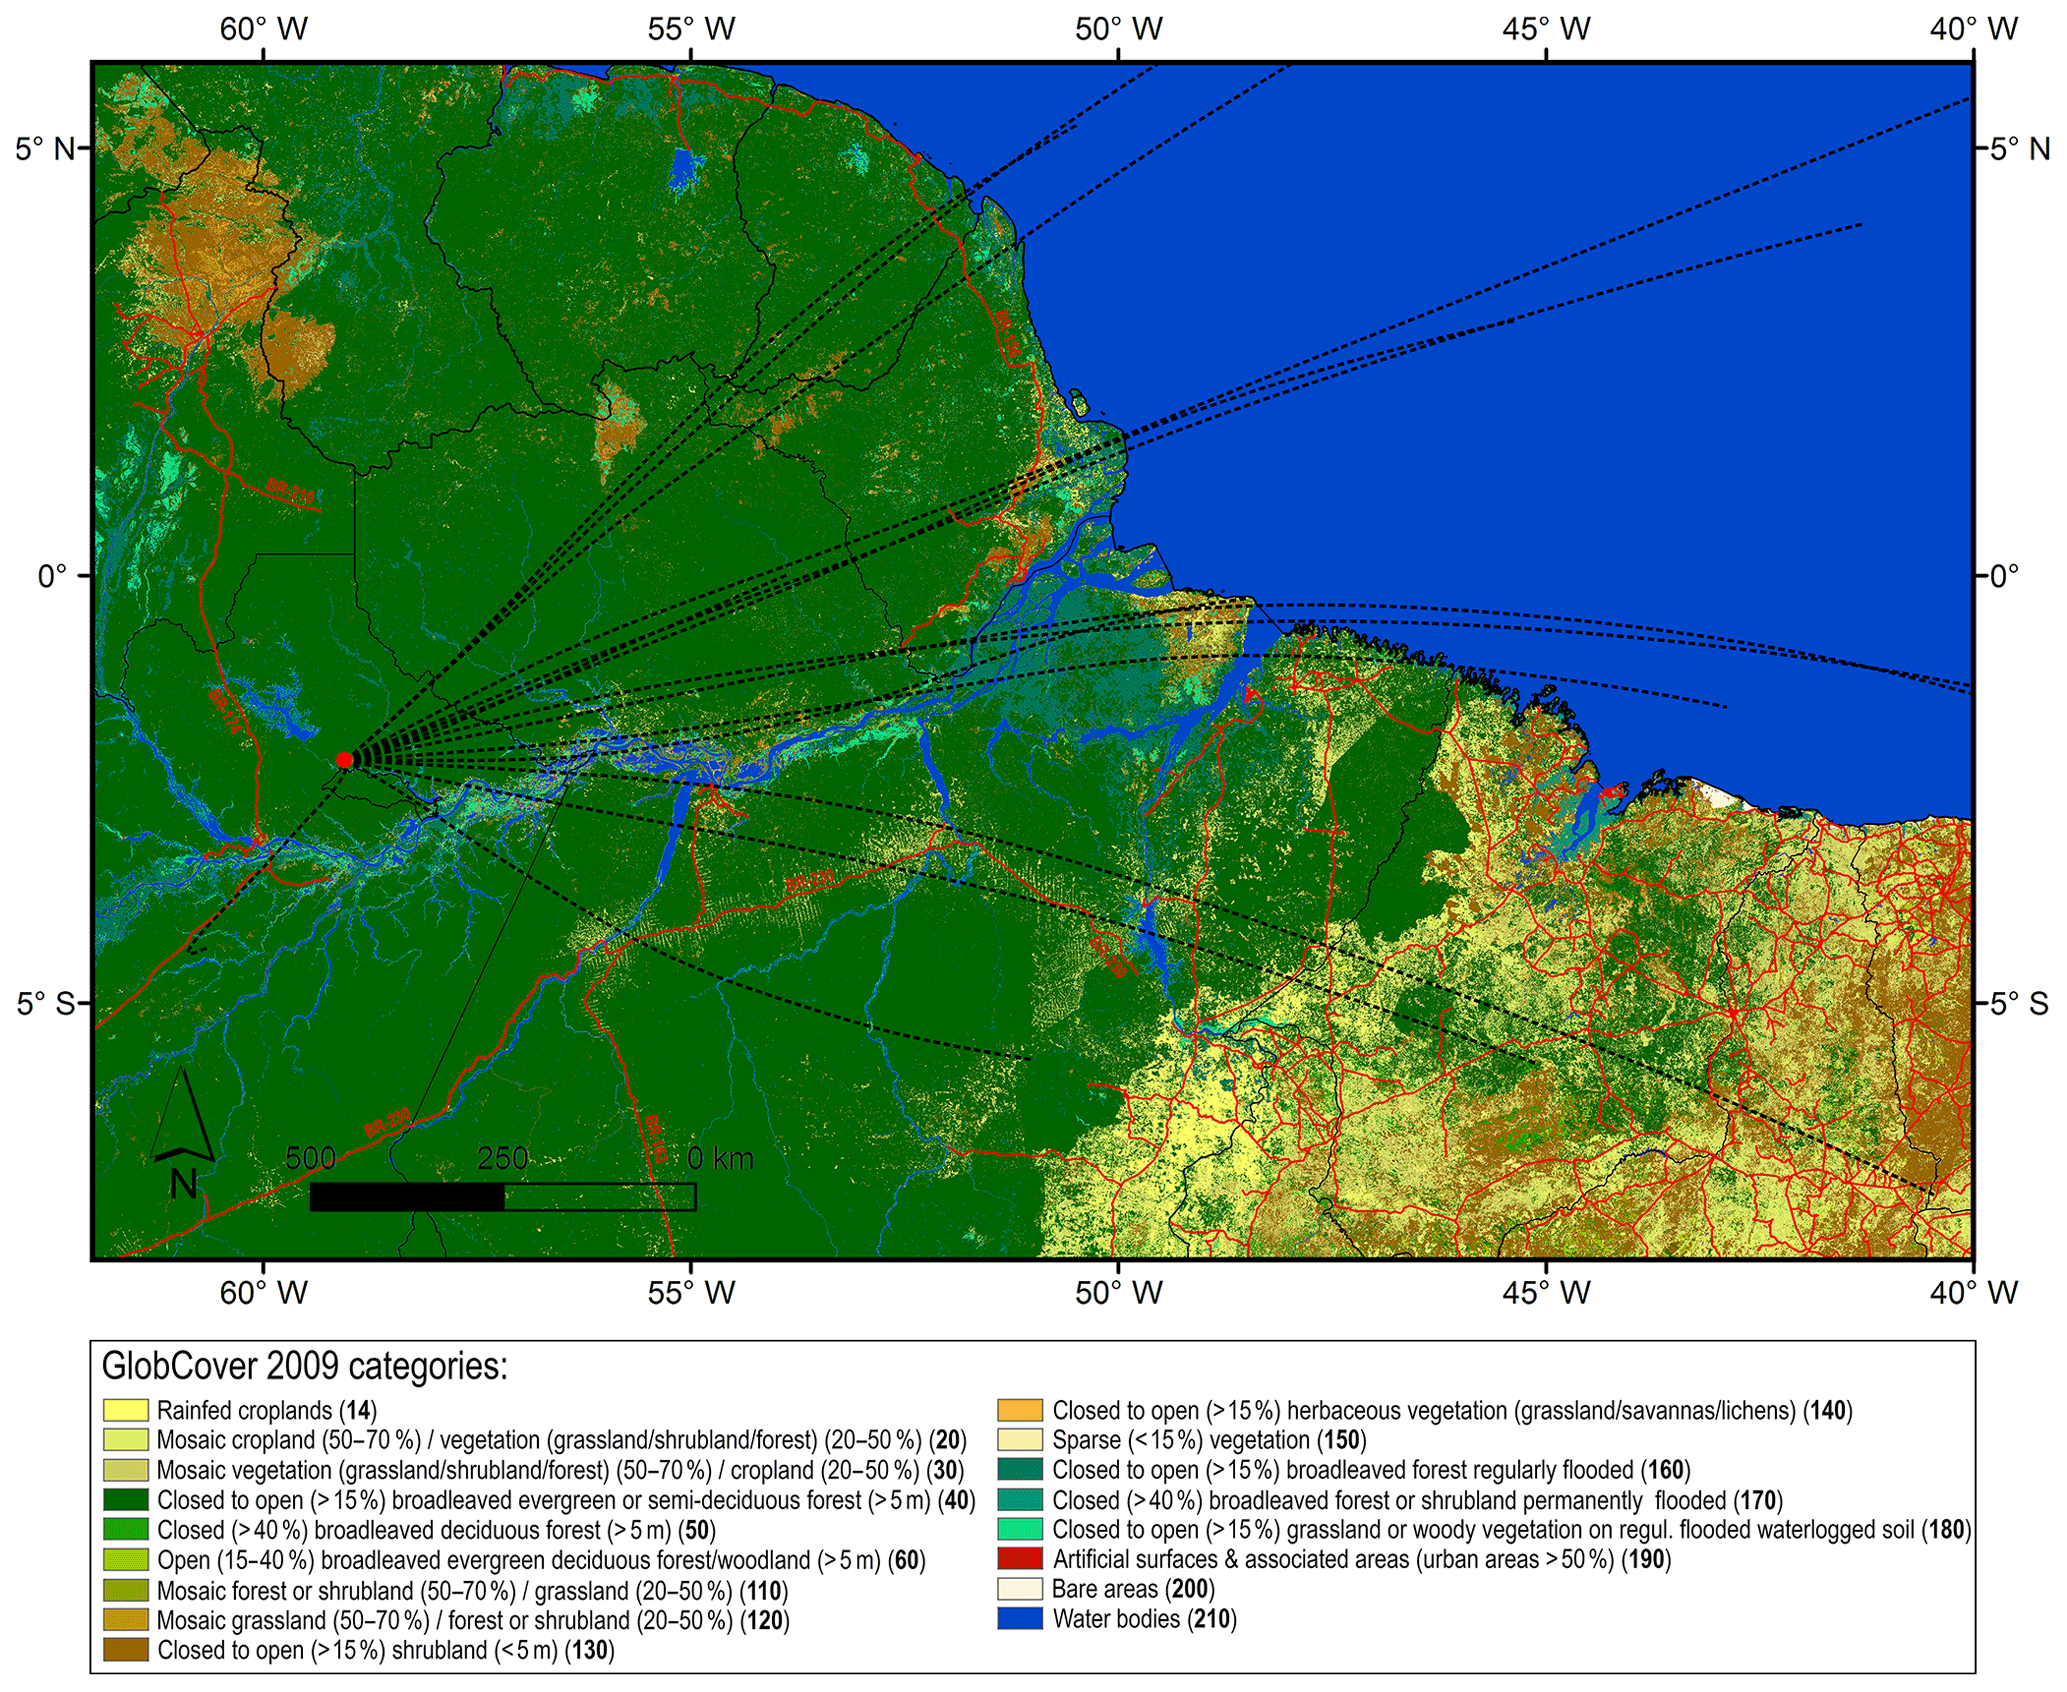
Figure 11Map of the ATTO-relevant eastern Amazon Basin (ROIfoot) combining the backward trajectory (BT) data with GIS layers of a land cover map based on the GlobCover 2009 data (Arino et al., 2008) and a map of major roads. The BT data are represented as center lines of the 15 BT clusters (black dashed lines; see Fig. 4).
3.3.2 Land cover
Figure 11 shows the land cover classification according to the GlobCover 2009 data set within the ROIfoot (Arino et al., 2008; Congalton et al., 2014). The location of the arc of deforestation with its extended agricultural areas (represented by the land cover categories 14, 20, and 30) is clearly visible in the SE of the ROIfoot. Major roads were added as an additional GIS layer to Fig. 11, underlining their role as starting points for forest fragmentation and clearing (e.g., Fearnside and Graca, 2006, and references therein). This effect can clearly be seen for the Trans-Amazonian Highway (BR-230). Furthermore, some of the aforementioned ecoregions can be identified in the land cover categorization. A prominent example are the grass- and shrublands (categories 120, 130, and 140) of the Guianan savanna regions, which represent “islands” in the extended moist forests (category 40) (de Carvalho and Mustin, 2017). Moreover, the land cover classes representing frequently or permanently flooded areas such as the aforementioned várzea forests (categories 160, 170, and 180) can be recognized along the major (white-water) rivers (e.g., Junk, 2013).

Figure 12Quantitative characterization of land cover types (see Fig. 11) in all 15 backward trajectory (BT) cluster footprints (see Fig. S11). The land cover contributions have been weighted with the relative BT density and, thus, represent an ATTO-relevant “land cover mix”. A comprehensive summary on the land cover mix within the ATTO BT footprint can be found in Table S1 in the Supplement.
Table 3Summary of GlobCover 2009 categories that account for 99.9 % of land cover variability within the weighted ATTO BT footprint with specification of relative contributions of individual categories. A comprehensive summary of the land cover mix for ATTO BT footprint is available in Table S1.

Beyond the qualitative analysis, we quantified the “land cover mix” within the BT cluster footprints (Fig. 12). For this analysis, the land cover analysis has been weighted by the air mass residence time in the clusters (see Sect. 2.7). Accordingly, regions within the footprint that are located close to the ATTO site were crossed more frequently by BTs and, thus, are weighted more strongly than regions in the periphery of the footprint. As a result, 11 GlobCover 2009 categories account for 99.9 % of the land cover variability within the BT footprint region as summarized in Table 3. The categories 40 (broadleaved evergreen or semi-deciduous forest) and 210 (water bodies, mostly part of the Atlantic Ocean) expectedly dominate the results (i.e., accounting for 87.3 %). Agricultural areas (i.e., categories 14, 20, and 30, accounting for 4.2 %), wetlands (i.e., 160 and 180, accounting for 4.7 %), and shrub- and grasslands (i.e., 110, 130, and 140, accounting for 3.4 %) represent minor fractions of the land cover mix.
For the footprints of the individual BT clusters, the land cover categorization is summarized in Fig. 12. The following trends can be observed: (i) agricultural lands contribute negligibly to the NE and ENE clusters (sum of categories 14, 20, and 30: ≤1 %), whereas their contribution is noticeable for the E clusters (∼3–5 %) and strongest for the ESE clusters (6 %–20 %). The highest relative fraction was observed for cluster ESE3 (∼20 %), which reaches directly into some hot spots of intense agriculture in southern Pará and Maranhão (compare Sect. 3.3.3). (ii) The categories 160 and 180 are associated with regularly flooded areas. These categories are rather rare in the NE cluster (sum of 160 and 180: ≤2 %), show variable contributions to the ENE clusters (2 %–5 %), and are comparatively abundant in the E and ESE clusters (4 %–11 %). The comparison of Figs. 11 and 12 shows that particularly those BT clusters that have a rather high residence time over the Amazon River (i.e., ENE1, E1-4, SW1) show the strongest floodplain contribution, with the aforementioned potential relevance for methane observations. (iii) The categories 110, 130, and 140 represent areas with grass, shrub, and/or moss/lichen coverage. They are comparatively rare in the NE and ENE clusters (<3 %), whereas larger contributions are found for the E and ESE clusters (2 %–12 %).
Based on the land cover characterization, we further conducted an analysis of the forest phenology within the ROIfoot by means of normalized difference vegetation index (NDVI) data. The NDVI targets specific spectral properties of the plants' chlorophyll absorption and, thus, represents a measure for vegetation “greenness” or net primary productivity (e.g., Pettorelli et al., 2011; Wu et al., 2016). In numerous previous studies, the response of Amazonian phenological cycles to climatic, environmental, and biological factors has been investigated, which helps to assess the Amazon's vulnerability towards climate change (e.g., Atkinson et al., 2001; Schucknecht et al., 2013; Silva et al., 2013; Hilker et al., 2014). It has been shown that vegetation phenology responds primarily – and typically with time lags – to rainfall and radiation as well as, with somewhat less relevance, temperature variations (Zhao et al., 2017). Generally, phenological cycles in the Amazon are highly complex (e.g., Bradley et al., 2011; Zhao et al., 2017). Accordingly, the phenological aspects discussed here focus only on the overall trends for the ROIfoot-relevant land cover categories in Table 3.
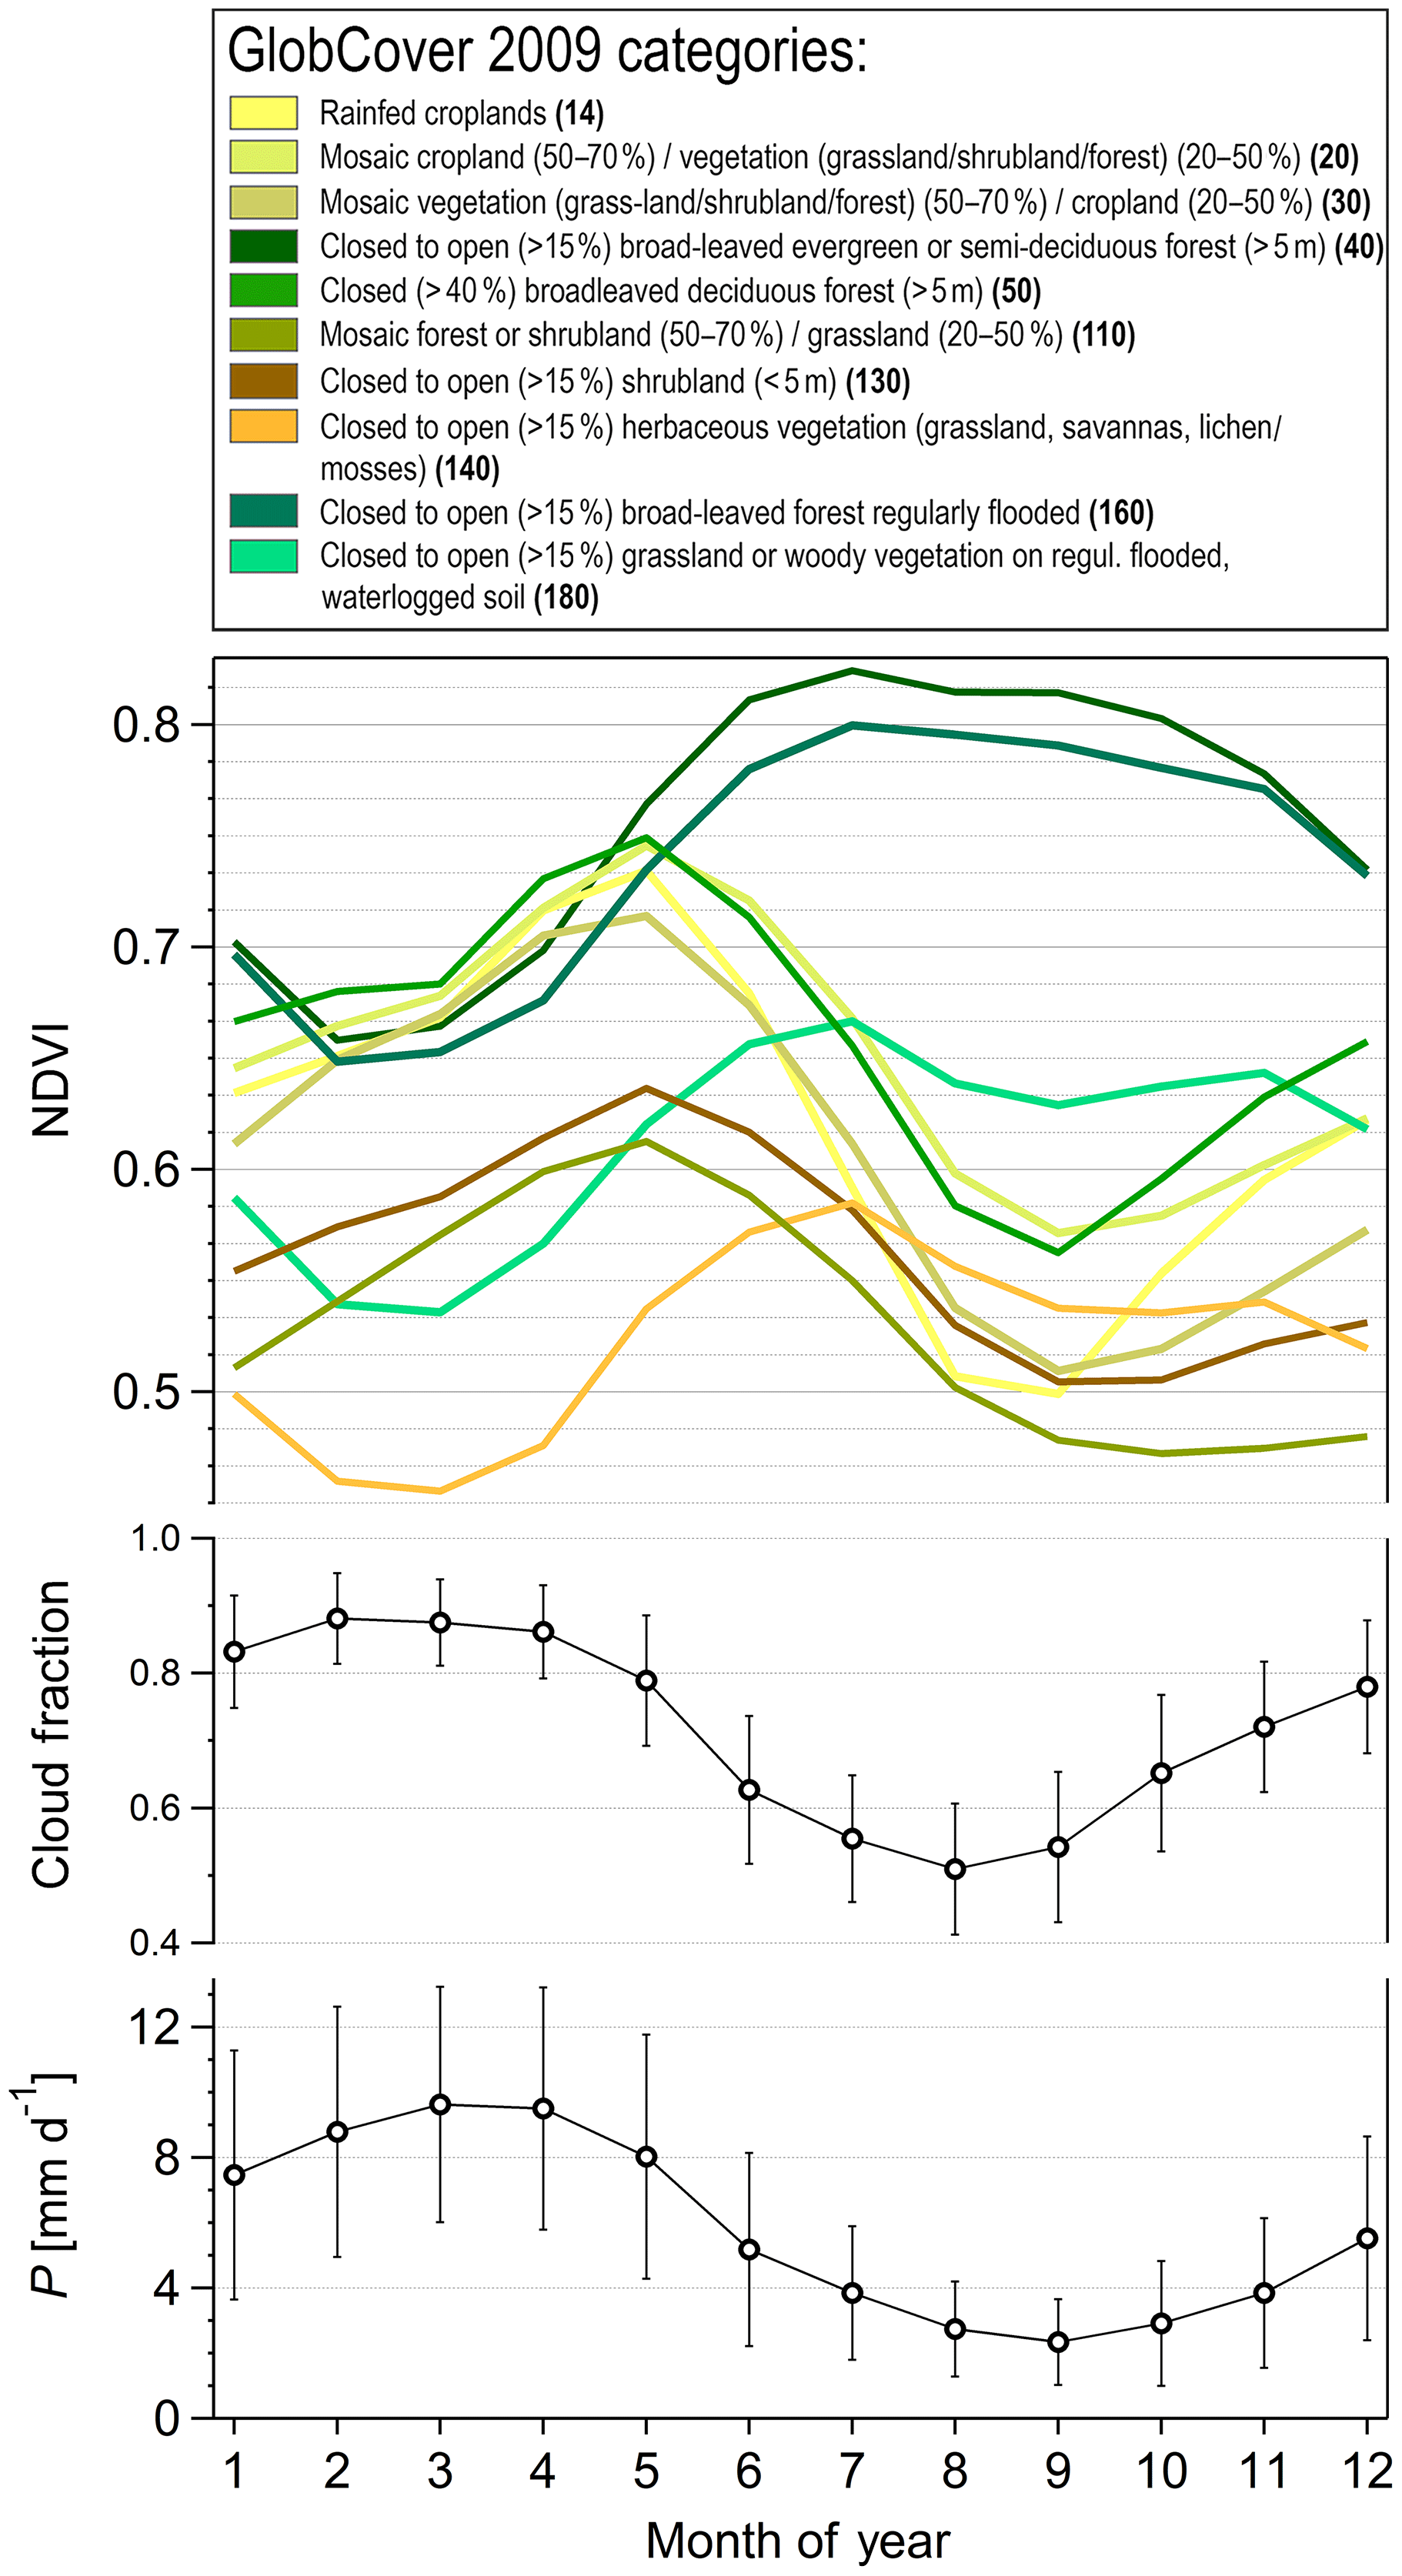
Figure 13Seasonal cycles in normalized difference vegetation index (NDVI) for the ROIfoot-relevant GlobCover 2009 categories as specified in Table 3. The NDVI data are provided as monthly means. Seasonal cycles for precipitation and cloud cover, which indirectly represents solar radiation, have been added and are shown as monthly means with error bars representing 1 standard deviation.
The results in Fig. 13 show a pronounced NDVI seasonality for all relevant land cover classes. Specifically, the seasonal cycles follow two contrasting patterns in relation to rainfall and cloud fraction with the latter one being an indirect proxy for incoming solar radiation (e.g., Hilker et al., 2014). The NDVI results for the evergreen moist forest categories (i.e., 40 and 160) show a minimum around February and a maximum around July. Thus, the seasonality is generally in phase with solar radiation and suggests sunlight-enhanced growth upon decreasing cloud cover in the dry season, in combination with a time lag of greening after the rain-rich wet season (Hilker et al., 2014, and references therein). Presumably, the increasing drought stress in the dry season is buffered by the comparatively deep-rooted trees in the moist soils and, therefore, does not (significantly) affect the NDVI (Nepstad et al., 2008). In contrast, land cover categories representing agricultural lands (i.e., 14, 20, and 30), shrub- and grasslands (i.e., 110 and 130), and deciduous forests (i.e., 50) show a NDVI maximum in May (∼2 months after the rain maximum) and a minimum around September to October. Thus, the seasonality is in phase with precipitation (although with a certain time lag) and suggests a rainfall-constrained growth (Atkinson et al., 2011). Apparently, the dry season drought stress affects the greenness of these “low/sparse vegetation” categories severely. The land cover categories 140 and 180 show an NDVI seasonality that resembles an intermediate state including elements of both aforementioned cases, generally showing an in-phase relationship with radiation, however, with a secondary minimum in September to October upon dry season drought stress. The presented seasonal patterns within the ROIfoot are generally consistent with previous studies, which have analyzed the heterogeneous distributions of phenoregions in the Amazon region as well as their diverse seasonality in growing seasons and the associated NDVI patterns (Bradley et al., 2011; Silva et al., 2013).
3.3.3 Deforestation and agro-industrial expansion
Amazonian deforestation and further forest degradation activities (e.g., ecosystem fragmentation, fires, selective logging, illegal mining, overhunting) as a function of biophysical, climatic, socioeconomic, and cultural factors have been addressed by a large number of previous studies (e.g., Nepstad et al., 1999; Laurance et al., 2002; Asner et al., 2005; Malhi et al., 2008; Godar et al., 2012a; Cisneros et al., 2015). Here, we discuss the ATTO-relevant deforestation trends and drivers.
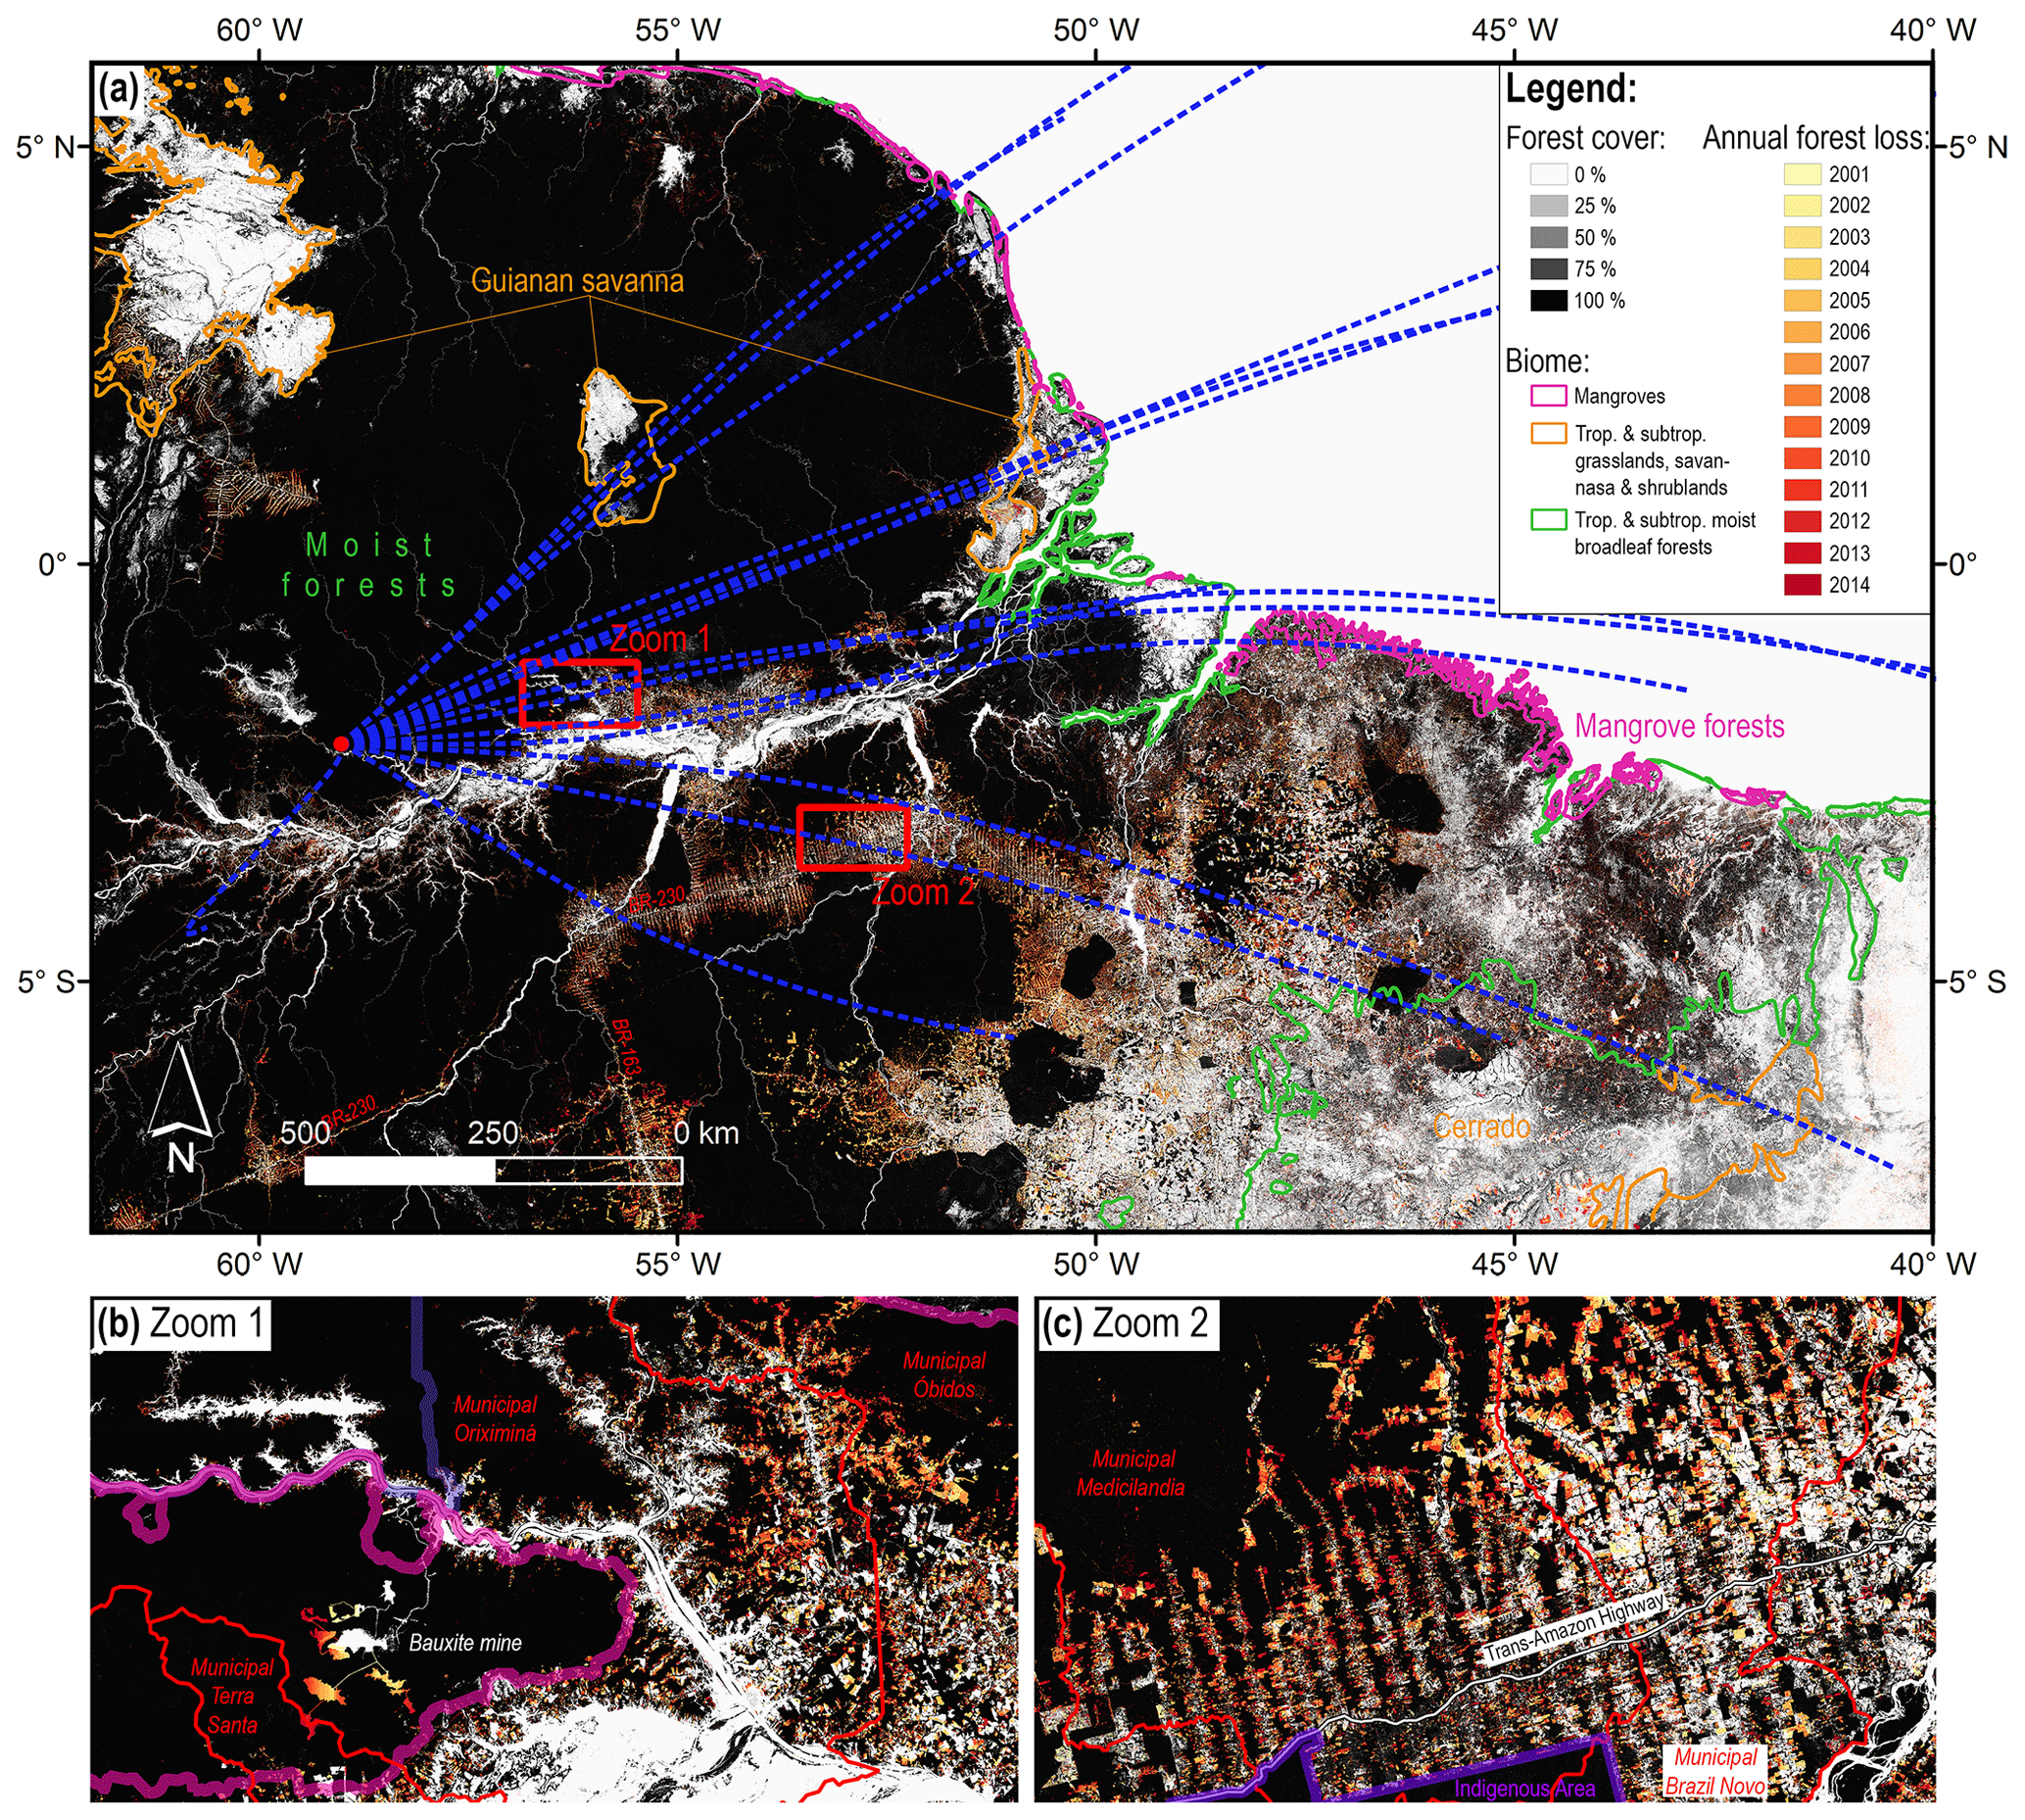
Figure 14Map of the ATTO-relevant eastern Amazon Basin (ROIfoot) combining the backward trajectory (BT) data with GIS layers of (i) a forest cover map of the year 2000, according to Hansen et al. (2013), (ii) a map on annual forest loss within the period 2001–2014 (Hansen et al., 2013), and (iii) contour lines representing the dominant biomes (see Fig. 10a). The BT data are represented as center lines of the 15 BT clusters (blue dashed lines; see Fig. 4). A map of the ROIfoot with aforementioned GIS layers is shown in (a), whereas (b) and (c) zoom into two smaller regions of interest.
Figure 14a provides an overview of the deforestation patterns within the ROIfoot by showing forest cover and forest loss maps according to Hansen et al. (2013) in comparison with the biome classification from Fig. 10a. The geographic extent of the tropical and subtropical moist broadleaf forest biome provides an estimate of the area that was originally covered by primary moist forests within the ROIfoot (compare also ter Steege et al., 2015). For the Amazon Basin, the total cumulative deforested area by 2017 equals about 800 000 km2, which is ∼20 % of the original Brazilian rain forest area (Fearnside, 2005).3 Further note that the satellite-based deforestation monitoring used here does not detect selective logging and surface fires in standing forests, which have a significant forest degrading effect (Nepstad et al., 1999; Cochrane and Laurance, 2008). Souza et al. (2013) estimated that the area of degraded forest is equivalent to 30 % of the area deforested at the same time. The map in Fig. 14a underlines the northwest-to-southeast gradient indicated by an increasing extent of forest fragmentation or complete forest loss towards the southeast. With respect to the ATTO site BT clusters, the following three regions with different deforestation states along this gradient can be defined.
The ESE clusters cover the areas with the strongest forest fragmentation and perturbation within the ROIfoot. This region – particularly in southern Pará and Maranhão – has been a very active frontier within the arc of deforestation (e.g., Soares-Filho et al., 2013). In fact, Pará is one of the two Brazilian states (the second one is Mato Grosso) with the largest tree cover loss in recent years (Tyukavina et al., 2017). The clusters overpass formerly forested areas that have been cleared and converted (almost) completely into agricultural lands (i.e., extended regions in southern Pará), on the one hand, and active hot spots with currently progressing deforestation (also in southern Pará), on the other hand.
The Amazon River and its shores are covered by the E clusters. Here, some deforestation hot spots (i.e., at the northern shore, about halfway between the ATTO region and the river delta) have emerged and could potentially develop into large-scale forest destruction in the future, depending on overall socioeconomic trends and conservation efforts (Fearnside, 2007). Accordingly, these clusters represent a semi-perturbed area of the basin and, thus, an “intermediate state in the Amazon's transition” (Davidson et al., 2012).
The ENE and NE clusters cover areas where deforestation activities are comparatively low (i.e., northern Pará, Amapá, and French Guiana). Therefore, the ENE and NE clusters still represent a mostly unperturbed state of the forest.
The so-called “fish bones” along the major highways represent a typical deforestation pattern, which consist of perpendicular smaller and mostly illegal access roads, penetrating (deeply) into the surrounding forest (Laurance et al., 2009). In Fig. 14, these patterns can be recognized, for example along the highways BR-163 (the so-called “soybean corridor” connecting the international port in Santarém with the soybean production in the southern states) and BR-230 (Trans-Amazonian highway) (Soares et al., 2004). The deforestation is typically associated with a strong fragmentation of the remaining forest areas. The fragmentation creates so-called edge effects, which perturb the humid, dark, and stable microclimate in the forest's canopy and understory with impacts on forest structure, tree mortality, and biodiversity (e.g., Wirth et al., 2007; Broadbent et al., 2008; Dohm et al., 2011; Laurance et al., 2011).
The main socioeconomic drivers of Amazonian deforestation can be grouped into two categories. The first category comprises subsistence and family agriculture, including some extractive activities, such as logging and hunting. These individual actions typically occur on rather small scales, but they are practiced by a rather large number of smallholders and colonists, which ultimately sums up to a substantial level of deforestation pressure (Godar et al., 2012a). The second category comprises deforestation on larger scales, which has been mostly driven by international economic interests, market demands, and government policies/subsidies (e.g., Soares et al., 2014). It is conducted by a comparatively small number of largeholders4, involving industrial logging to create soy plantations, cattle ranches, large-scale timber production, and mining. In the Amazon, cattle ranching has clearly been the dominating factor, accounting for about 70 % of deforestation (Souza, 2006; Malhi et al., 2008; Barona et al., 2010). Note that the relative contributions of small- vs. largeholders as a function of socioeconomic conditions is still a subject of active and controversial debate (e.g., Ludewigs et al., 2009; Pacheco, 2012; Pereira et al., 2016).
Figure 14b and c zoom into two selected areas within the ROIfoot that illustrate the typical deforestation trends, on the one hand, and represent regions of particular relevance for the ATTO site, on the other hand. Figure 14b covers part of the region along the northern shore of the Amazon River that represents a recent deforestation hot spot (i.e., in the municipalities Oriximiná, Óbidos, Curuá, Alenquer, and Monte Alegre) in the center of the ATTO footprint (within 1 % contour of highest residence times, Fig. 7). Due to a northwards migration of investors and colonists, the extent of cattle ranching, soy farming, and related deforestation has increased over the last years in this region (Fearnside, 2007; Bowman et al., 2012; Cisneros et al., 2015). Figure 14b highlights one of the expanding fish bone branches in this area. In addition to the agriculture-related forest loss, mining activities represent an additional perturbation of the forest. As one example, Fig. 14b shows the extent and growth of a large-scale bauxite mine in the municipality of Oriximiná, which is discussed in further detail in Sect. 3.3.5.
Figure 14c zooms into a region in central Pará along the Trans-Amazonian highway (BR-230), which has been a corridor of continuous and active deforestation during the last decades. This region has been selected for three reasons: (i) the characteristic fish bone deforestation patterns are particularly pronounced here, (ii) the region represents a deforestation hot spot that is comparatively close to ATTO (within 10 % contour of highest residence times, Fig. 7) and, thus, presumably has noticeable influence on the atmospheric observations, and (iii) its deforestation dynamics have been well documented previously by Godar et al. (2012a, b). Specifically, the municipalities of Medicilândia and Novo Brazil in Fig. 14c are characterized by contrasting socioeconomic deforestation trends: in Medicilândia, smallholder (family) agriculture has been predominant, which corresponds with a comparatively low degree of deforestation, rather short “fine bones”, small deforested patches that are rather close to the BR-230, as well as declining deforestation rates (Godar et al., 2012a). In contrast, in Novo Brazil, largeholder agriculture with extensive cattle ranching and industrialized soy farming has had a much more pronounced influence, which corresponds to a stronger degree of fragmentation, longer “fish bones”, many large rectangular patches (mostly for cattle ranching with several hundreds of hectares) that are located rather far from the BR-230, and increasing deforestation rates (Godar et al., 2012a; Cisneros et al., 2015).

Figure 15Quantitative characterization of forest loss trends in cluster BT footprints for main wind directions NE, ENE, E, and ESE, based on Fig. 14. The annual forest loss has been calculated relative to the forest cover in the year 2000. The forest loss data in the cluster BT footprints have been weighted by the air mass residence time. The corresponding trends for all BT clusters are shown in Fig. S16.
Based on the annual forest loss data in Fig. 14, we conducted a quantitative analysis of the deforestation levels and dynamics within the weighted footprints of the individual BT clusters (Fig. 15 and Table S2). Figure 15 shows that the overall annual forest loss levels span from ∼0.01 to ∼1 % a−1. For comparison, the basin-wide forest loss levels range between ∼0.1 % a−1 (for 2012) and ∼0.5 % a−1 (for 2004).5 The highest deforestation rates in the basin reach up to about 3 % a−1 and have been observed in hot spots such as the BR-163 corridor (Müller et al., 2016). Furthermore, the cluster-resolved forest loss data in Fig. 15 reflect the northwest–southeast gradient with the highest forest loss levels in the south of the ROIfoot and lowest levels in the north (i.e., NE < ENE < E < ESE). In terms of forest loss temporal trends within the period 2001 to 2014, we found a (slightly) decreasing trend for the ESE clusters (on average −0.0013 % a−1), which can probably be explained by political efforts to reduce forest destruction in the arc of deforestation (i.e., blacklisting) (e.g., Cisneros et al., 2015). In the most recent years, the basin-wide deforestation rates have increased again after a minimum in 2012 in response to a relaxation of environmental laws (Tollefson, 2016). In contrast to the ESE trend, the forest loss rates in the NE, ENE, and E clusters tend to increase (0.0013 % a−1 for NE and ENE vs. 0.0032 % a−1 for E). The increasing forest loss trends in the NE, ENE, and particularly in the E clusters reflect the northwards migration of colonists and investors with the associated increasing pressure on the forest ecosystem in the affected areas. In addition to the overall trends, we also observed a rather strong year-to-year variability of the forest loss rates, which is related to regionally heterogeneous biomass burning activities with strong interannual variations as discussed in the following section.
3.3.4 Fires
This section presents the spatiotemporal patterns of fire occurrence within the ROIfoot. Fires are of significant importance for the ATTO observations since they are highly destructive or transformative for the rain forest ecosystem (Cochrane and Laurance, 2008) and represent the primary pollution source with fundamental consequences for atmospheric composition and processes (e.g., Andreae et al., 2004; Lin et al., 2006; Aragao et al., 2008; Artaxo et al., 2013; Saturno et al., 2018b). In an unperturbed state, the humid, dense, and high-canopy Amazonian forests are mostly nonflammable, which has made wild fires rare events (Cochrane, 2003; Nepstad et al., 2008). Accordingly, the Amazonian vegetation is evolutionary ill-adapted to the occurrence of (even low-intensity surface) fires and typically reacts highly vulnerably to it (e.g., Uhl and Kauffman, 1990; Cochrane and Schulze, 1999). However, fires have become ubiquitous in the basin over the last decades due to human-made activities: numerous agriculture-related fires are ignited on purpose. Moreover, the progressing forest fragmentation and degradation perturbs the moist forest climate and, thus, tends to increase the forest's flammability, which makes the uncontrolled escape of fires more likely (Morton et al., 2011; Alencar et al., 2015). During El Niño years and the associated drought conditions, the flammability can be even further enhanced (e.g., Nepstad et al., 2001; Fernandes et al., 2011; Cano-Crespo et al., 2015). In this context, further changes in the Amazon fire regime may play critical roles in positive feedback mechanisms and, thus, foster and accelerate large-scale rain forest dieback, as projected by modeling studies (e.g., Nepstad et al., 2008; Cochrane and Barber, 2009).
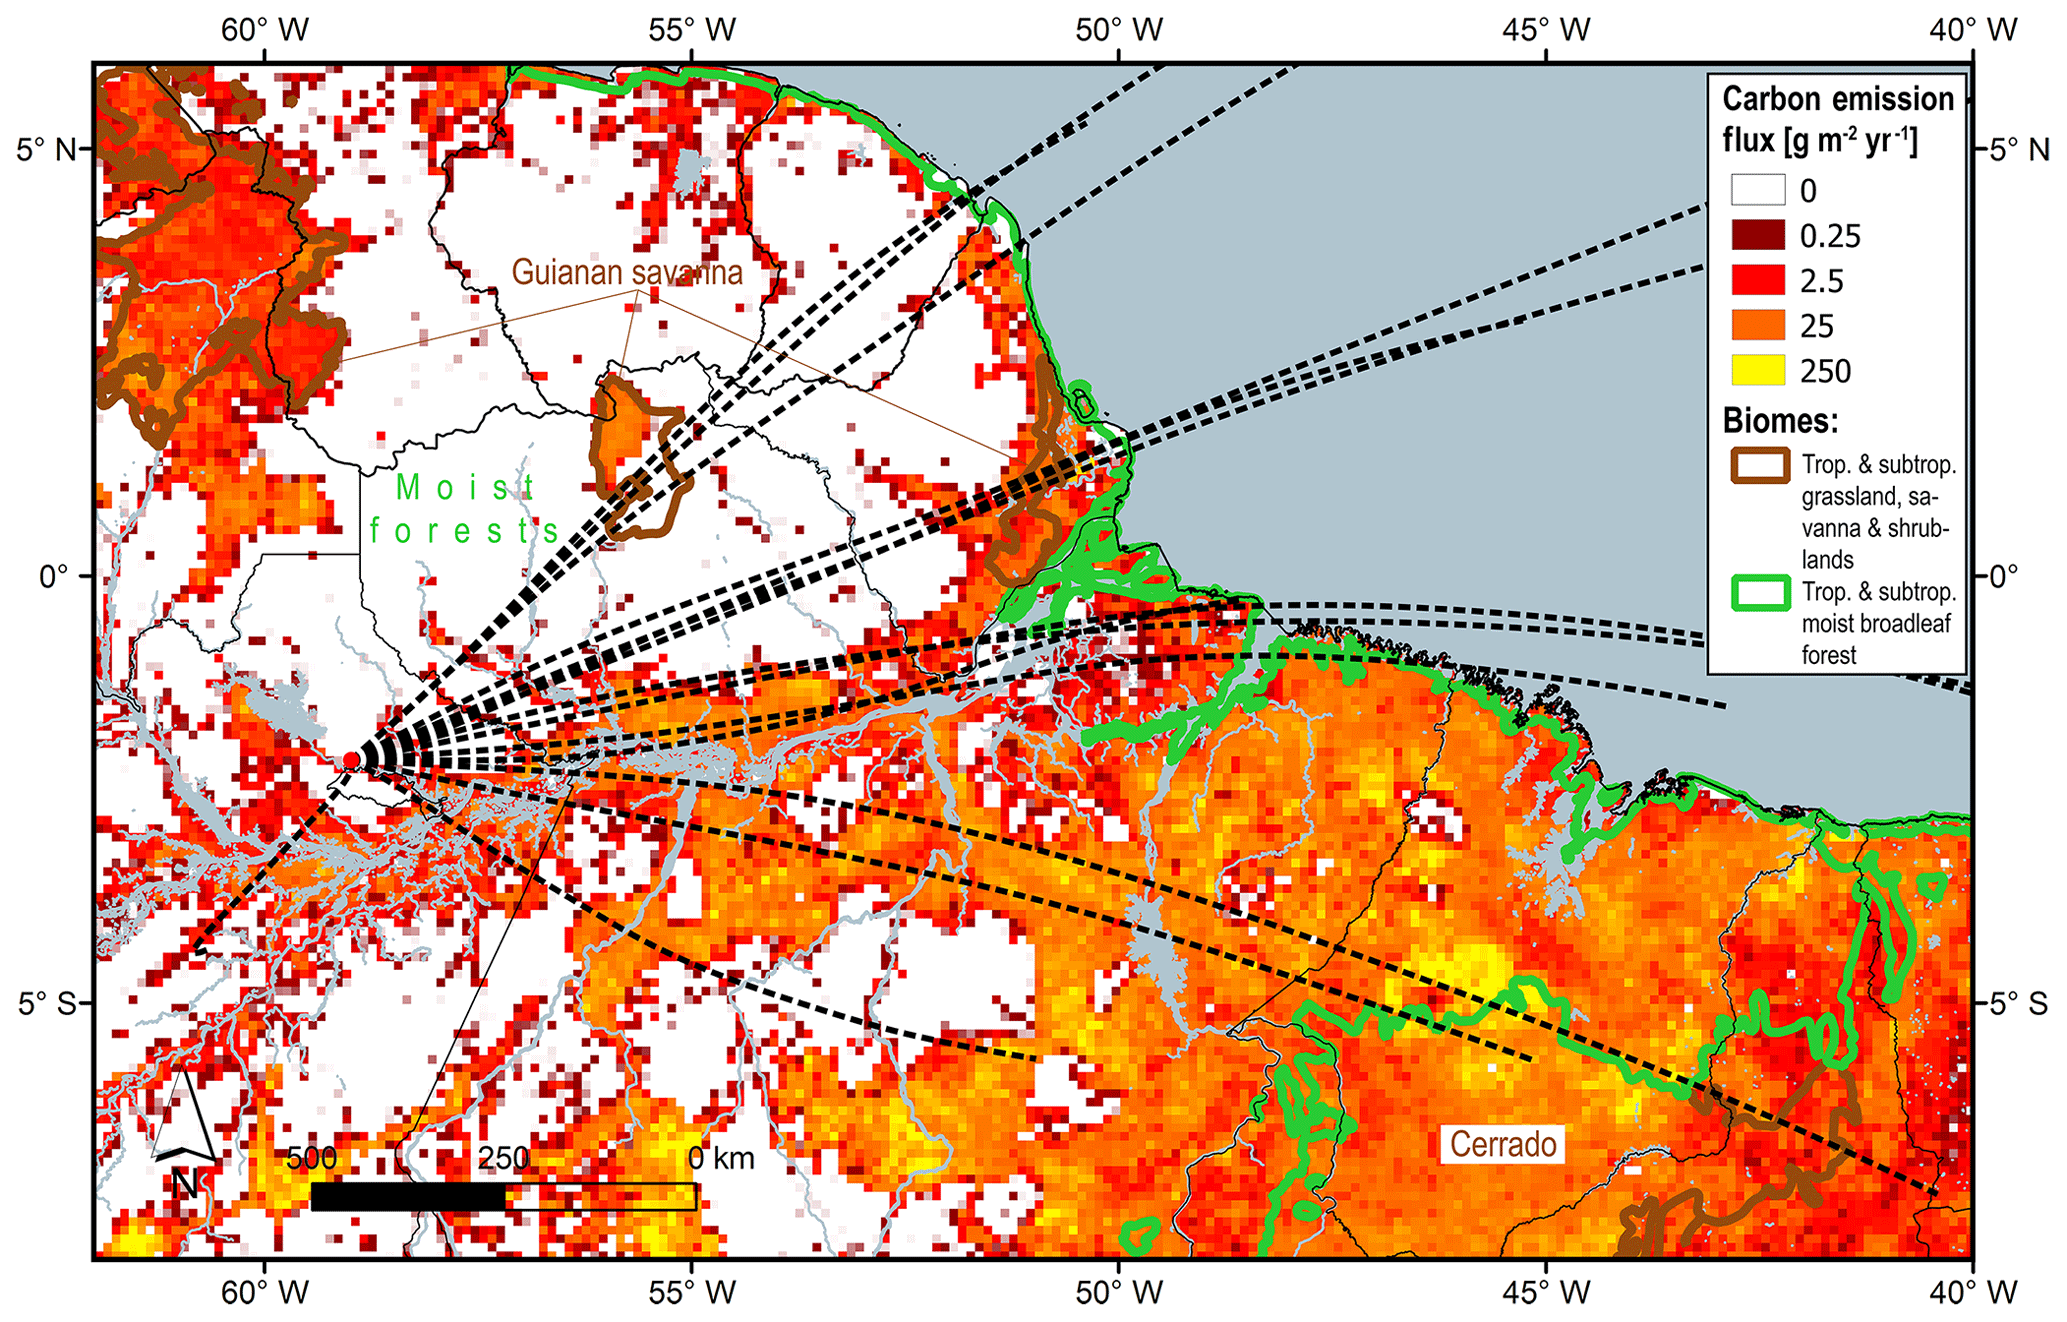
Figure 16Map of the ATTO-relevant eastern Amazon Basin (ROIfoot) combining the backward trajectory (BT) data with (i) a map derived from the Global Fire Assimilation System (GFAS) of the average fire-related carbon emission flux within the time period from 2003 to 2017 according to Kaiser et al. (2011) and (ii) a biome classification according to Olson et al. (2001) (see Fig. 10a). The pixel size of the fire map equals ∼11 km. The BT data are represented as center lines of the 15 BT clusters (black dashed lines; see Fig. 4). For comparison, Fig. S17 shows a fire map with higher spatial resolution (∼1 km resolution), which shows the same geospatial patterns.
Figure 16 shows a fire map within the ROIfoot, representing the average fire-related carbon emission flux from 2000 to 2016, according to Kaiser et al. (2012). Generally, a rather heterogeneous distribution of fires can be observed. On large scales, a northwest-to-southeast gradient, with significantly higher fire abundance towards the southeast, characterizes the ROIfoot. This gradient is closely linked to the agro-industrial expansion and associated deforestation, since fires are the primary tool for land clearing, which typically occurs as slash-and-burn conversion of forest into fields and/or pasture and, furthermore, produces ash as a valuable fertilizer for the acidic, infertile soils (e.g., Nepstad et al., 2001; Cochrane and Laurance, 2008). Moreover, fires represent an efficient land management tool for maintenance and improvement of fields and pastures. In the ROIfoot, the highest fire activities have been observed in the state of Maranhão, which has a dense coverage of cropland and pasture. Furthermore, several fire hot spots are located in southern Pará, along the major highways and rivers, representing the expanding agricultural frontiers. Many of these regions are covered by the footprint of the ESE clusters and are, therefore, within the scope of the ATTO observations. In contrast, the ATTO-relevant NE BTs cover extended unperturbed areas that have maintained their “fire-immune” moist climate and thus showed no fire activity.
In addition to the agriculture-related fire patterns, Fig. 16 further shows substantial fire densities in the savanna ecoregions (i.e., high activity in the Cerrado and modest activity in the Guianan savanna regions), which are characterized by lower precipitation, a different vegetation type, and a tendency to higher flammability. In contrast to the fires in moist forested regions, which are the result of human-made ignition or the consequence of human-made forest degradation and increased flammability, the low precipitation levels in the savanna regions makes them more prone to the occurrence of fires. Accordingly, the savanna vegetation is more adapted to an (infrequent) occurrence of natural fires as well as more frequent use of fire by indigenous people since pre-Columbian times (de Carvalho and Mustin, 2017). Parts of both ecoregions, the Cerrado and Guianan savannas, with their characteristic fire regimes are ATTO-relevant as they are located within the BT footprint. On a year-to-year basis, our analysis showed comparable geospatial patterns in fire occurrence within the ROIfoot, however, with an annual variability in fire intensities on regional scales (see fire anomaly maps in Fig. S19). For instance, the warm and dry years 2005, 2007, and 2010 showed a basin-wide increase in fire activity (Alencar et al., 2015). The El Niño years 2009 and 2015 showed intense fires along the ATTO-relevant part of the Amazon River valley, corresponding directly with strongly increasing aerosol concentrations at ZF2 and ATTO (Saturno et al., 2018b).
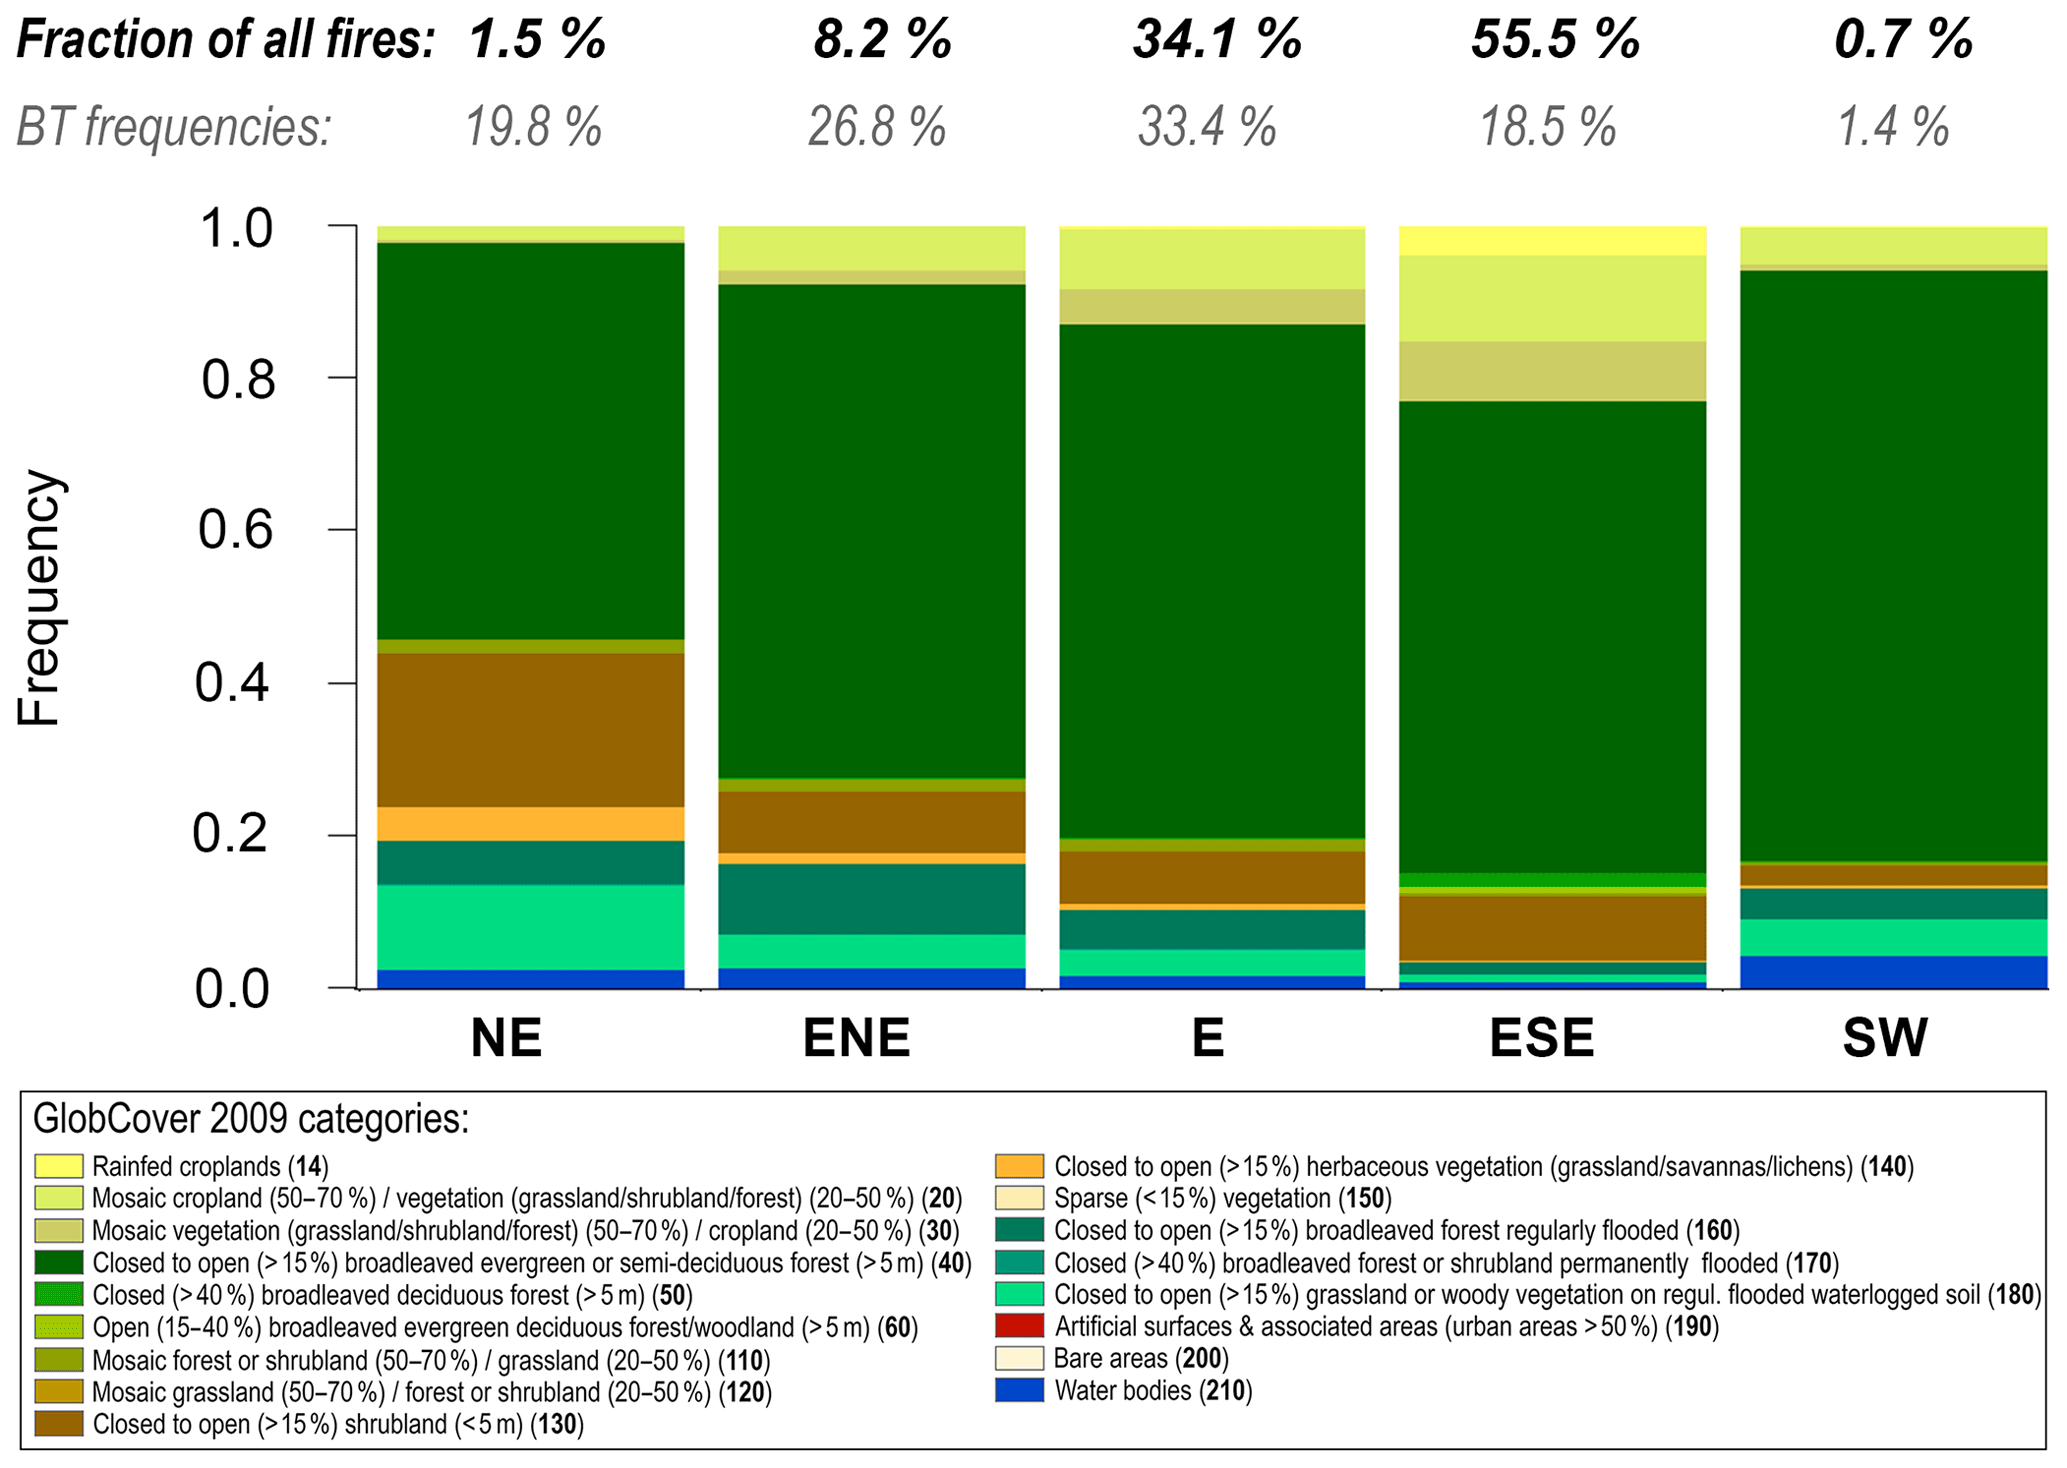
Figure 17Relative fractions of ATTO-relevant fires (weighted with air mass residence times) within the different land cover categories, discriminated by major BT directions: NE, ENE, E, ESE, and SW. Fire analysis is based on the INPE database (see Sect. S1.1). Results shown here are averages of corresponding year-to-year data (2000–2016) as shown in Fig. S18. Fractions of all counted fires in this analysis are provided along with BT frequencies for comparison (see Table 2).
Beyond the fire map in Fig. 16, we conducted a quantitative classification of the detected fires by two metrics: the weighted BT cluster footprints and the land cover type in which they were detected. Figure 17 shows the resulting relative fractions of fires per land cover type and grouped into the four main BT directions, NE, ENE, E, and ESE. Note that this analysis has been weighted by BT residence time and, thus, provides an estimate for the ATTO-relevant “mix of fires” (e.g., forest fires vs. savanna fires vs. agricultural management fires). This is relevant for the ATTO observations since the fuel types (e.g., forest vs. agricultural waste) and corresponding combustion modes (i.e., flaming vs. smoldering) typically emit gases and aerosol particles of different composition and properties (e.g., Andreae and Merlet, 2001; Janhäll et al., 2010). For example, breakout understory fires (escaping from ignited land-clearing fires) are typically associated with less efficient smoldering combustion, whereas pasture burning and high-intensity deforestation fires (after clear-cutting and drying of the vegetation) tend to be predominantly flaming combustion (e.g., Tang and Arellano, 2017). Figure 17 shows different fire mixes for the NE, ENE, E, and ESE clusters. The dominant contribution in all cases are fires in rain forest areas (land cover category 40), which account for 60 %–63 % in the NE, ENE, and E directions and for 54 % in the ESE direction. Fires in shrub and grassland categories (i.e., 110, 130, 140) account for a comparable fraction (10 %–16 %) for all directions. Fires associated with agricultural categories (i.e., 14, 20, 30) show a pronounced gradient from NE (11 %) over ENE (13 %) and E (17 %) towards ESE (28 %). This is consistent with the properties of absorbing aerosols measured at ATTO (e.g., the relative fractions of black vs. brown carbon), which have been related to the air mass origin by means of BT directions (Saturno et al., 2018b). Finally, we analyzed the seasonal cycle in fire occurrence for the entire BT footprint, resolved by land cover categories, and found a rather uniform seasonality with its minimum around April and its maximum around September (see Fig. S20). These trends, particularly the onset of the biomass burning season, are consistent with the observed atmospheric composition and variability at ATTO (e.g., Andreae et al., 2015; Pöhlker et al., 2016; Saturno et al., 2018b).
3.3.5 Infrastructure, cities, traffic, and mining
Biomass burning represents the predominant forest perturbation and source of atmospheric pollution in the Amazon Basin. However, several further categories of human-made activities and infrastructure also impact the biosphere–atmosphere exchange to a significant extent. Accordingly, this section addresses the following infrastructure classes: (i) population density and urban centers with their related emissions, (ii) thermoelectric power plants as major fossil fuel burning sources, (iii) major dams and reservoirs with their significant environmental impacts, (iv) major highways as drivers for forest fragmentation and degradation, and (v) (cargo) ship traffic as a further pollution source.
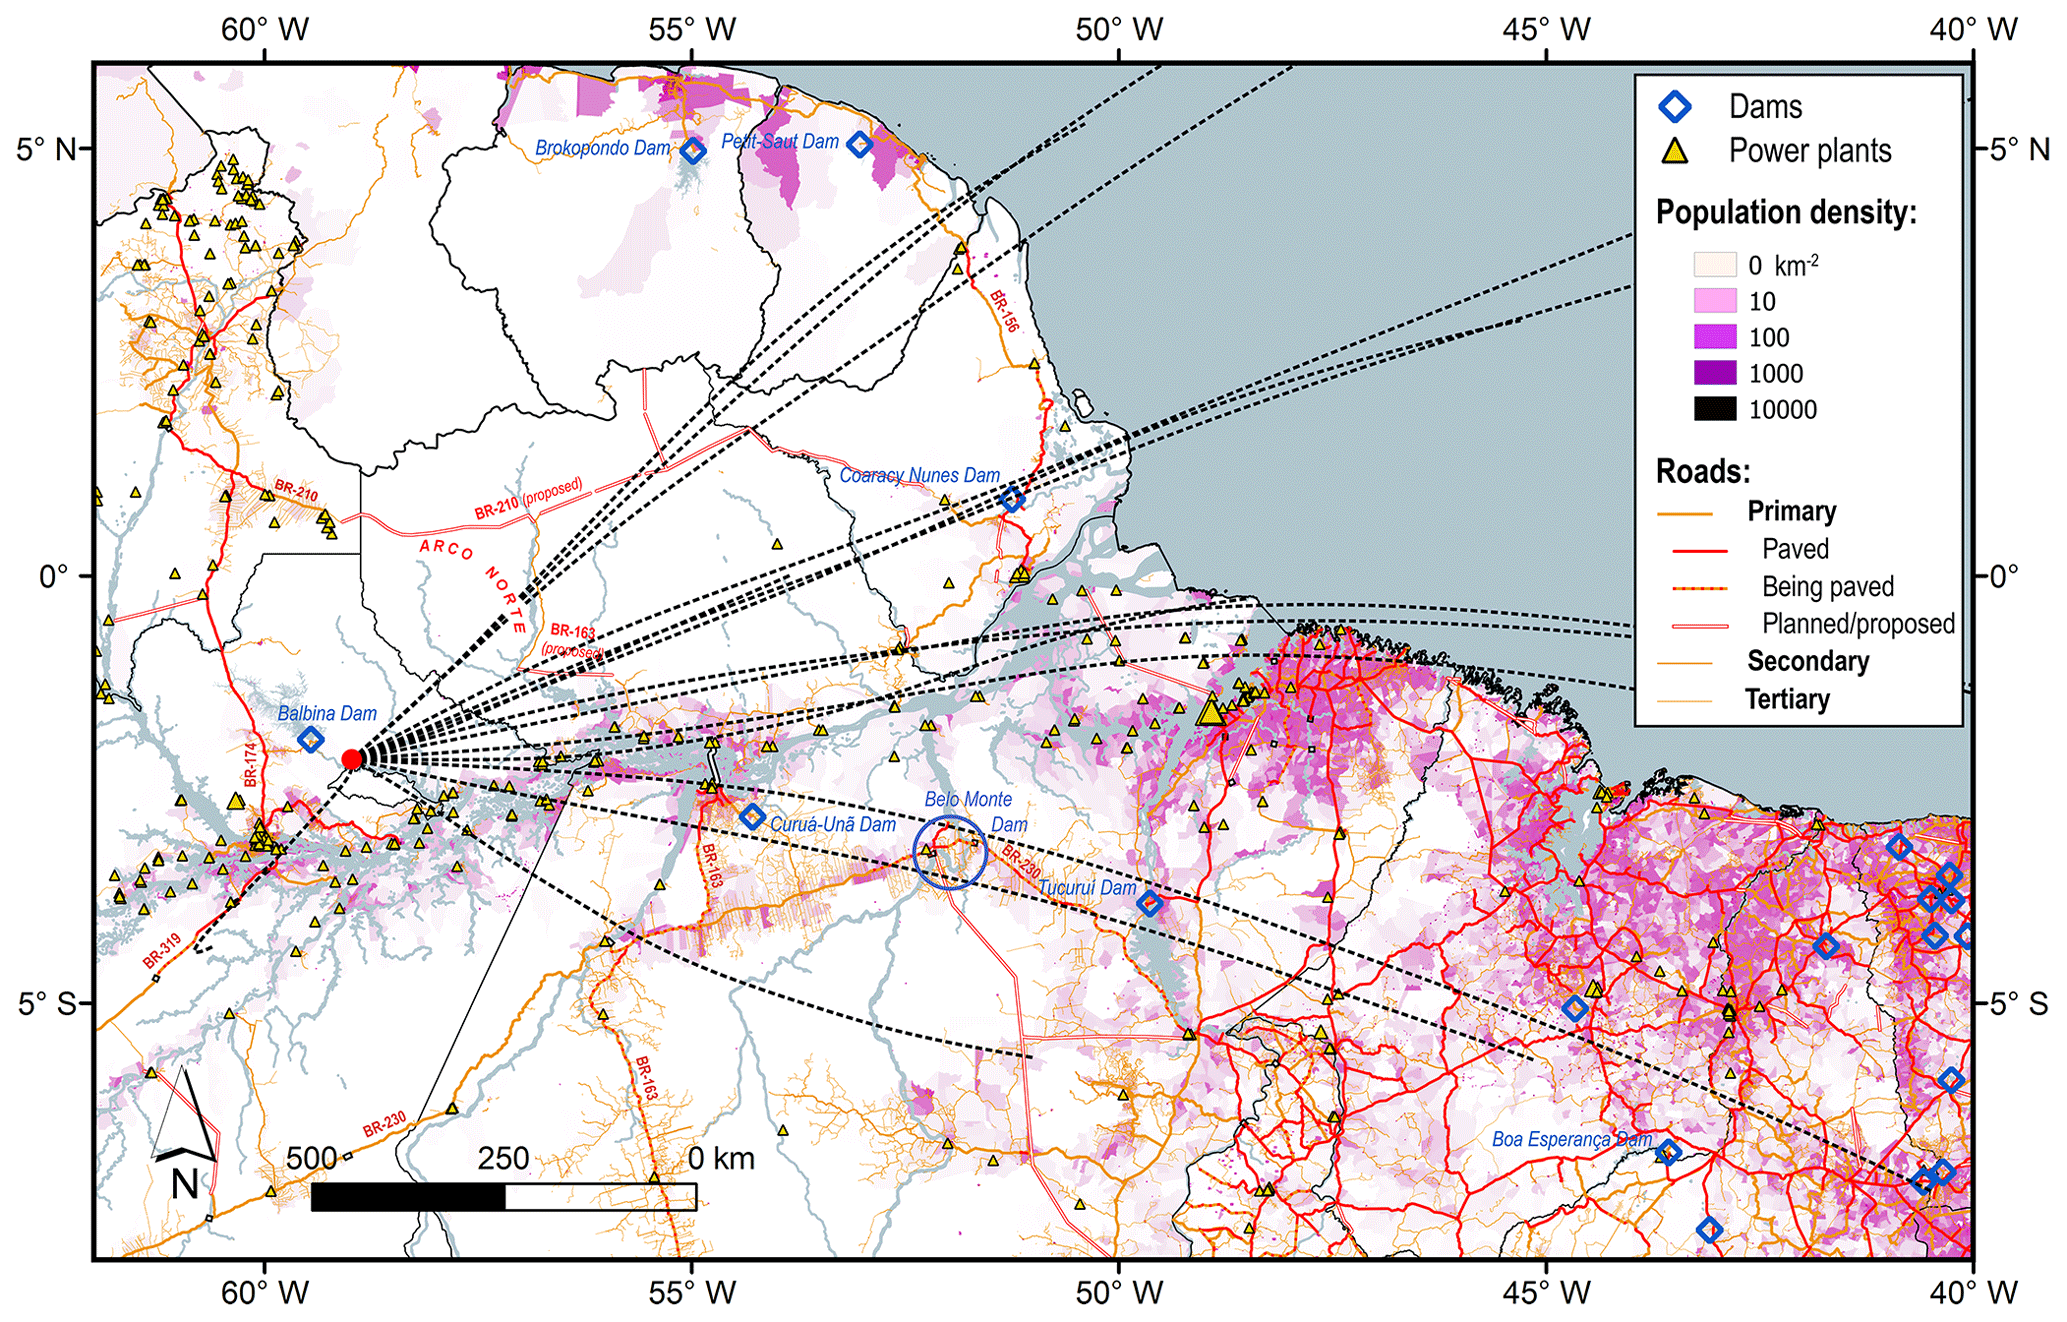
Figure 18Map of the ATTO-relevant eastern Amazon Basin (ROIfoot) combining the backward trajectory (BT) data with GIS data layers on (i) population density, (ii) thermoelectric power plants (marker size represents capacity), (iii) major dams and reservoirs, and (iv) the road network. The BT data are represented as center lines of the 15 BT clusters (black dashed lines; see Fig. 4).
The population density map in Fig. 18 shows that most settlements and cities are located along the Atlantic coast in the southeast of the ROIfoot (see also Andreae et al., 2015). The associated emissions from these densely populated regions comprise a complex mixture of primary and secondary pollutants from traffic, heating, cooking, industry, waste, landfills, etc. (e.g., Gentner et al., 2017). Specifically, fossil-fuel-fired power plants represent one of the dominant sources of pollution aerosols and gases in this context (Kuhn et al., 2010). Figure 18 shows that thermoelectric power plants within the ROIfoot are collocated with the densely populated areas: a comparatively large number of (relatively small) power plants can be found along the Amazon River as well as close to the urban centers at the Atlantic coast. Two major natural-gas-fired power plants are located close to Belém in the Amazon River delta and, thus, within the ATTO footprint. A yet unquantified fraction of the urban pollution mixture (i.e., from power plants, traffic, industry) is likely being transported towards ATTO with the E and ESE BTs. The significance of these emissions in comparison to biomass burning for the ATTO site observations is subject of currently ongoing analysis (e.g., Carbone et al., 2019; Saturno et al., 2018b).
Dams and reservoirs worldwide have a substantial impact on rivers and their ecology for a variety of reasons (Lehner et al., 2011). An increase in methane (also carbon dioxide) emissions from reservoirs due to anoxic microbial decomposition of flooded biomass has been one particular impact on the biosphere–atmosphere exchange – presumably also with direct relevance for the ATTO site observations (e.g., Abril et al., 2005; Kemenes et al., 2007; Fearnside and Pueyo, 2012). Figure 18 shows that several major dams are located within the ROIfoot. Examples are the Curuá-Unã Dam on the Curuá-Unã River in central Pará (flooded area ∼120 km2; ∼4 km2 MW−1), the Tucuruí Dam on the Tocantins River in the SE of Pará (flooded area: ∼3010 km2; ∼0.4 km2 MW−1), the Coaracy Nunes Dam on the Araguari River in Apamá (flooded area: ∼30 km2; ∼0.3 km2 MW−1), the Petit-Saut Dam on the Sinnamary River in French Guiana (flooded area: ∼350 km2; ∼3 km2 MW−1), and the Boa Esperança Dam on the Parnaíba River in Piauí (flooded area: ∼88 km2) (Lehner et al., 2011). The Balbina Dam on the Uatumã River in northeast Amazonas (flooded area: ∼4450 km2; ∼18 km2 MW−1) is located ∼60 km northwest of ATTO and thus represents the closest dam and moreover one of the largest in the basin. It is located downwind according to the main BT directions; however it may be a relevant source during prevailing southwestern air mass advection. Parts of the Balbina Dam are located within the 25 % contour of highest residence times. Furthermore, localized air flow along the Uatumã River, which receives water from the turbines that are fed from the hypolimnion, might also have the potential to bring methane-rich air to the ATTO site. A detailed analysis of the potential influence of the Balbina Dam on the ATTO observations requires a dedicated future study. Further smaller dams are located in the SE of the ROIfoot, which are not explicitly mentioned here. A number of additional (major) dams in the basin are planned or already under construction. The most prominent and controversial example is the Belo Monte Dam on the Xingu River in central Pará (planned capacity: ∼11 000 MW; estimated lake area: ∼670 km2) (also marked in Fig. 18). The construction of the Belo Monte Dam is associated with severe environmental destruction, such as flooding of large areas and destruction of the Xingu Rivers hydrological regimes (Fearnside, 2017). Furthermore, the dam is located directly within the SE segment of the BT footprint (i.e., included by the 10 % contour of highest residence times) and, thus, may bring a large-scale anthropogenic impact for future ATTO observations. Specifically, the flooding of large forested areas upon filling of the dam and the associated anoxic degradation of the biomass will release large amounts of trace gases (i.e., methane, ammonia), which will likely impact the ATTO measurements.
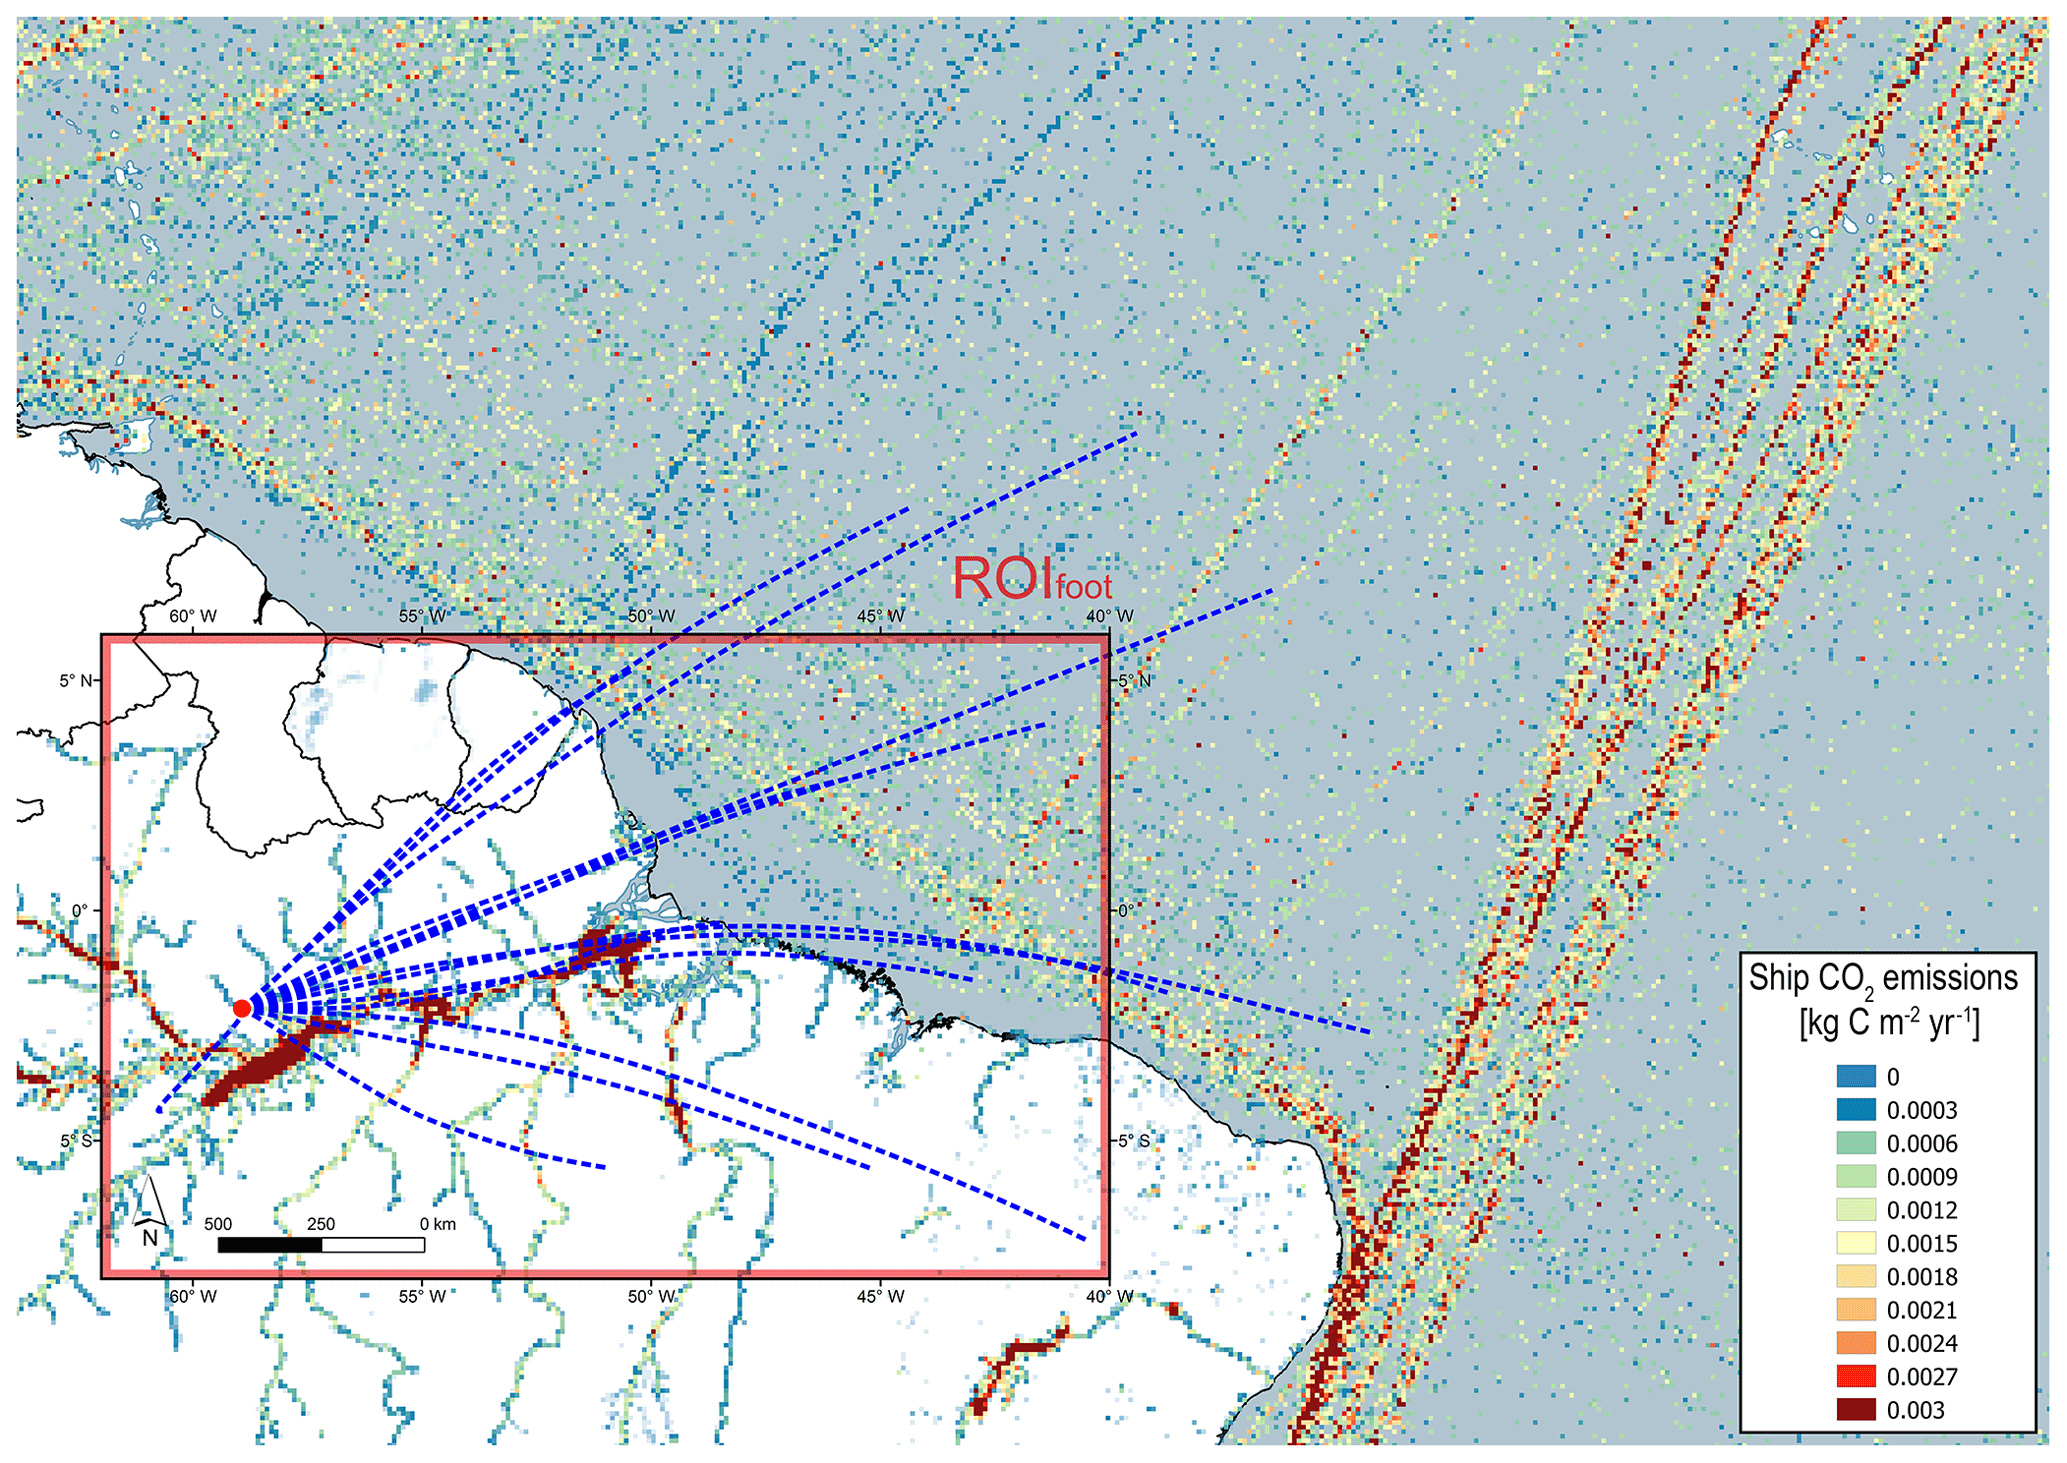
Figure 19Map of eastern Amazon Basin, including ROIfoot, and western Atlantic Ocean in combination with ship tracks. Ship tracks are represented by modeled shipping-related CO2 emission according to Asefi-Najafabady et al. (2014). The BT data are represented as center lines of the 15 BT clusters (blue dashed lines; see Fig. 4).
In the previous sections, we have noted that highways in the Amazon Basin “have a keystone role in deforestation” and “stimulate the influx of population and investment” (Fearnside and Graca, 2006). However, it is still being debated to what extent roads have acted as main deforestation controls. Figure 18 displays the currently existing road network in the ROIfoot as well as some major highways that have been proposed. In addition, an unofficial network of smaller roads has been developing in parallel, which is only partly shown in Fig. 18 (Barber et al., 2014). Figure 14 emphasizes how the existing major highways, such as the BR-230, BR-163, and BR-319, have initiated and fostered extensive deforestation. A particularly severe threat for the Amazon biome is the construction of “all-weather highways into the core of the Basin”, which is currently being realized by paving the highways BR-319 (connecting Manaus with the south) and BR-163 (connecting Santarém with the south) (Soares-Filho et al., 2006; Barni et al., 2015). Also within the yet untouched northeastern segment of the ATTO footprint, major road constructions are being planned. Specifically, plans exist to build the ∼1100 km long BR-210, connecting Boa Vista in Roraima and Macapá in Amapá (de Carvalho and Mustin, 2017). Currently, two initial segments of the BR-210 exist (i.e., ∼130 km in Roraima and ∼250 km in Amapá). A further project, which is currently being debated, is the construction of the so-called Arco Norte (the north arc)6 – a connection between Boa Vista and Santarém via an eastern segment of the BR-210 and a southern segment of the BR-163 (see Fig. 17). A potential construction of the BR-210 and BR-163 would cut through the extended and mostly untouched forest areas in northern Pará and Amapá, which currently constitute the “pristine” NE and ENE clusters of the ATTO footprint. The shortest distance between ATTO and BR-163 would be about 250 km and, thus, parts of the highway would reach into the 1 % contour of highest residence times (Fig. 7). In light of the destructive potential of roads and the proximity to the ATTO site, the outcome of these infrastructure projects is of fundamental importance for future ATTO research. Note that the existing section of the BR-210 in Roraima has initiated the growth of a major deforestation hot spot (see Figs. 14 and 16) and, thus, provides an outlook on the potential destruction associated with the construction plans (Barni et al., 2015).
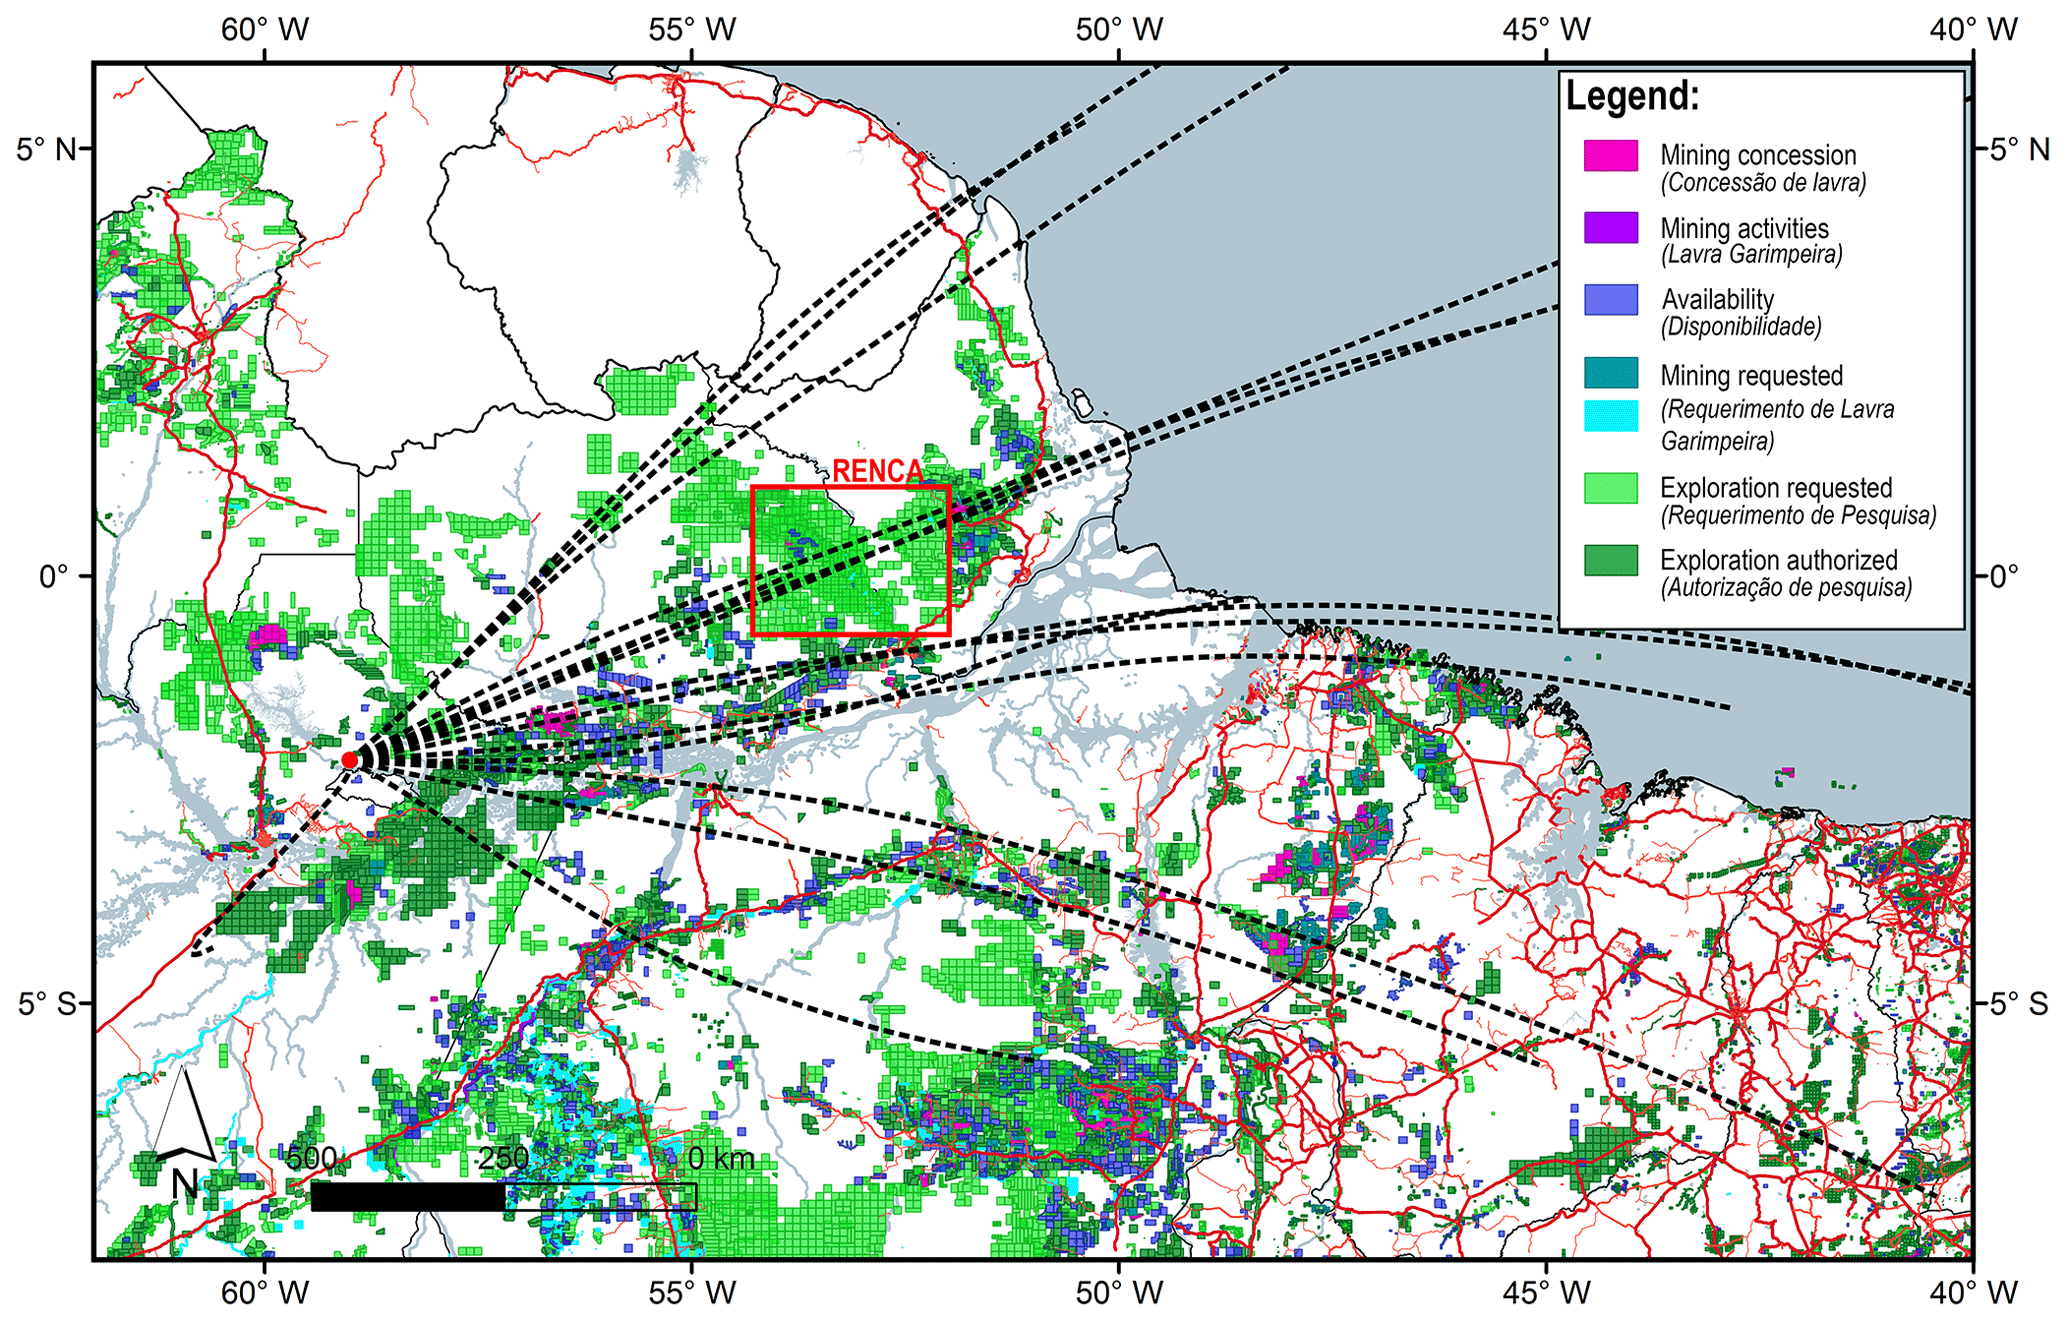
Figure 20Map of the ATTO-relevant eastern Amazon Basin (ROIfoot) combining the backward trajectory (BT) data with GIS data on mining activities. The legend specifies several categories of mining activities according to SIGMINE (see Sect. S1.1). The BT data are represented as center lines of the 15 BT clusters (black dashed lines; see Fig. 4).
Figure 19 displays a map, which zooms out from ROIfoot and combines the ATTO BT footprint with ship tracks on the Atlantic Ocean as well as on the South American inland waters. Worldwide, ship traffic is known as a strong source of atmospheric pollution due to the fact that heavy, sulfur-rich oils serve as fuels. Accordingly, ship emissions comprise comparatively high loads of sulfate aerosols in addition to large quantities of further pollutants (e.g., Aulinger et al., 2016). Figure 19 illustrates the major ship routes along the eastern South American coast, which are covered by the footprint. In addition to offshore shipping, a significant amount of vessel traffic also occurs on the major rivers and inland waters in the Amazon Basin. In particular, the Amazon River itself represents the predominant route for cargo transportation with major harbors along its shores (e.g., Manaus, Itacoatiara, Santarém, Belém). Inland water shipping represents a potentially important source as it occurs comparatively close to the ATTO site and uses dirty fuels with few emission controls.
Figure 20 presents a map highlighting the ATTO BT footprint in combination with a GIS layer on mining activities in the basin. Generally, mining – particularly large-scale pit mines – has caused strong perturbations of the forest ecosystem in affected areas (e.g., Potapov et al., 2017). Moreover, large mines are potential sources of industrial air pollution as well as soil dust suspension (i.e., coarse-mode aerosol particles) (e.g., Huertas et al., 2012). Both of these factors make mining relevant for the ATTO research. Figure 20 emphasizes that comparatively large bauxite mines already exist within the ATTO BT footprint. The largest of those mines, which is shown in Fig. 14b, is located within the 1 % contour of the highest air mass residence times according to Fig. 7 and is, thus, a potentially relevant source for the ATTO observations. It further caused substantial forest loss rates over the last years (∼400 ha yr−1)7. Moreover, mining-related exploration and registration activities are being conducted in the entire ROIfoot, which reflects the strong economic interests in resource extraction in this area. To highlight another relevant example, in August 2017, the Brazilian federal government abolished the protection status in major parts of the national reserve of copper and associates (RENCA), located in northern Pará and Amapá, to open these areas for the extraction of gold, copper, and further minerals.8 The RENCA area is located within the 5 % contour of the highest air mass residence times according to Fig. 7 and, thus, of major relevance for the ATTO observations (see Fig. 20). The RENCA area is further located in the center of the still untouched forests. In the meantime, this initiative has been stopped judicially. However, this case emphasizes that political and judicial decisions can change the protection and land use status in the ATTO footprint rapidly and profoundly. According to the refined BT footprint in Fig. 8, which takes diurnally intermittent mixing along the BTs into account, the RENCA area is located within a region of very effective convective coupling between the ground and overpassing air masses, whereas the aforementioned bauxite mine is located in an area with much less effective coupling. This observation emphasizes that potential future mining in the RENCA area may be of significant relevance to the ATTO observations with potentially even higher impacts than those caused by the much closer bauxite mine.
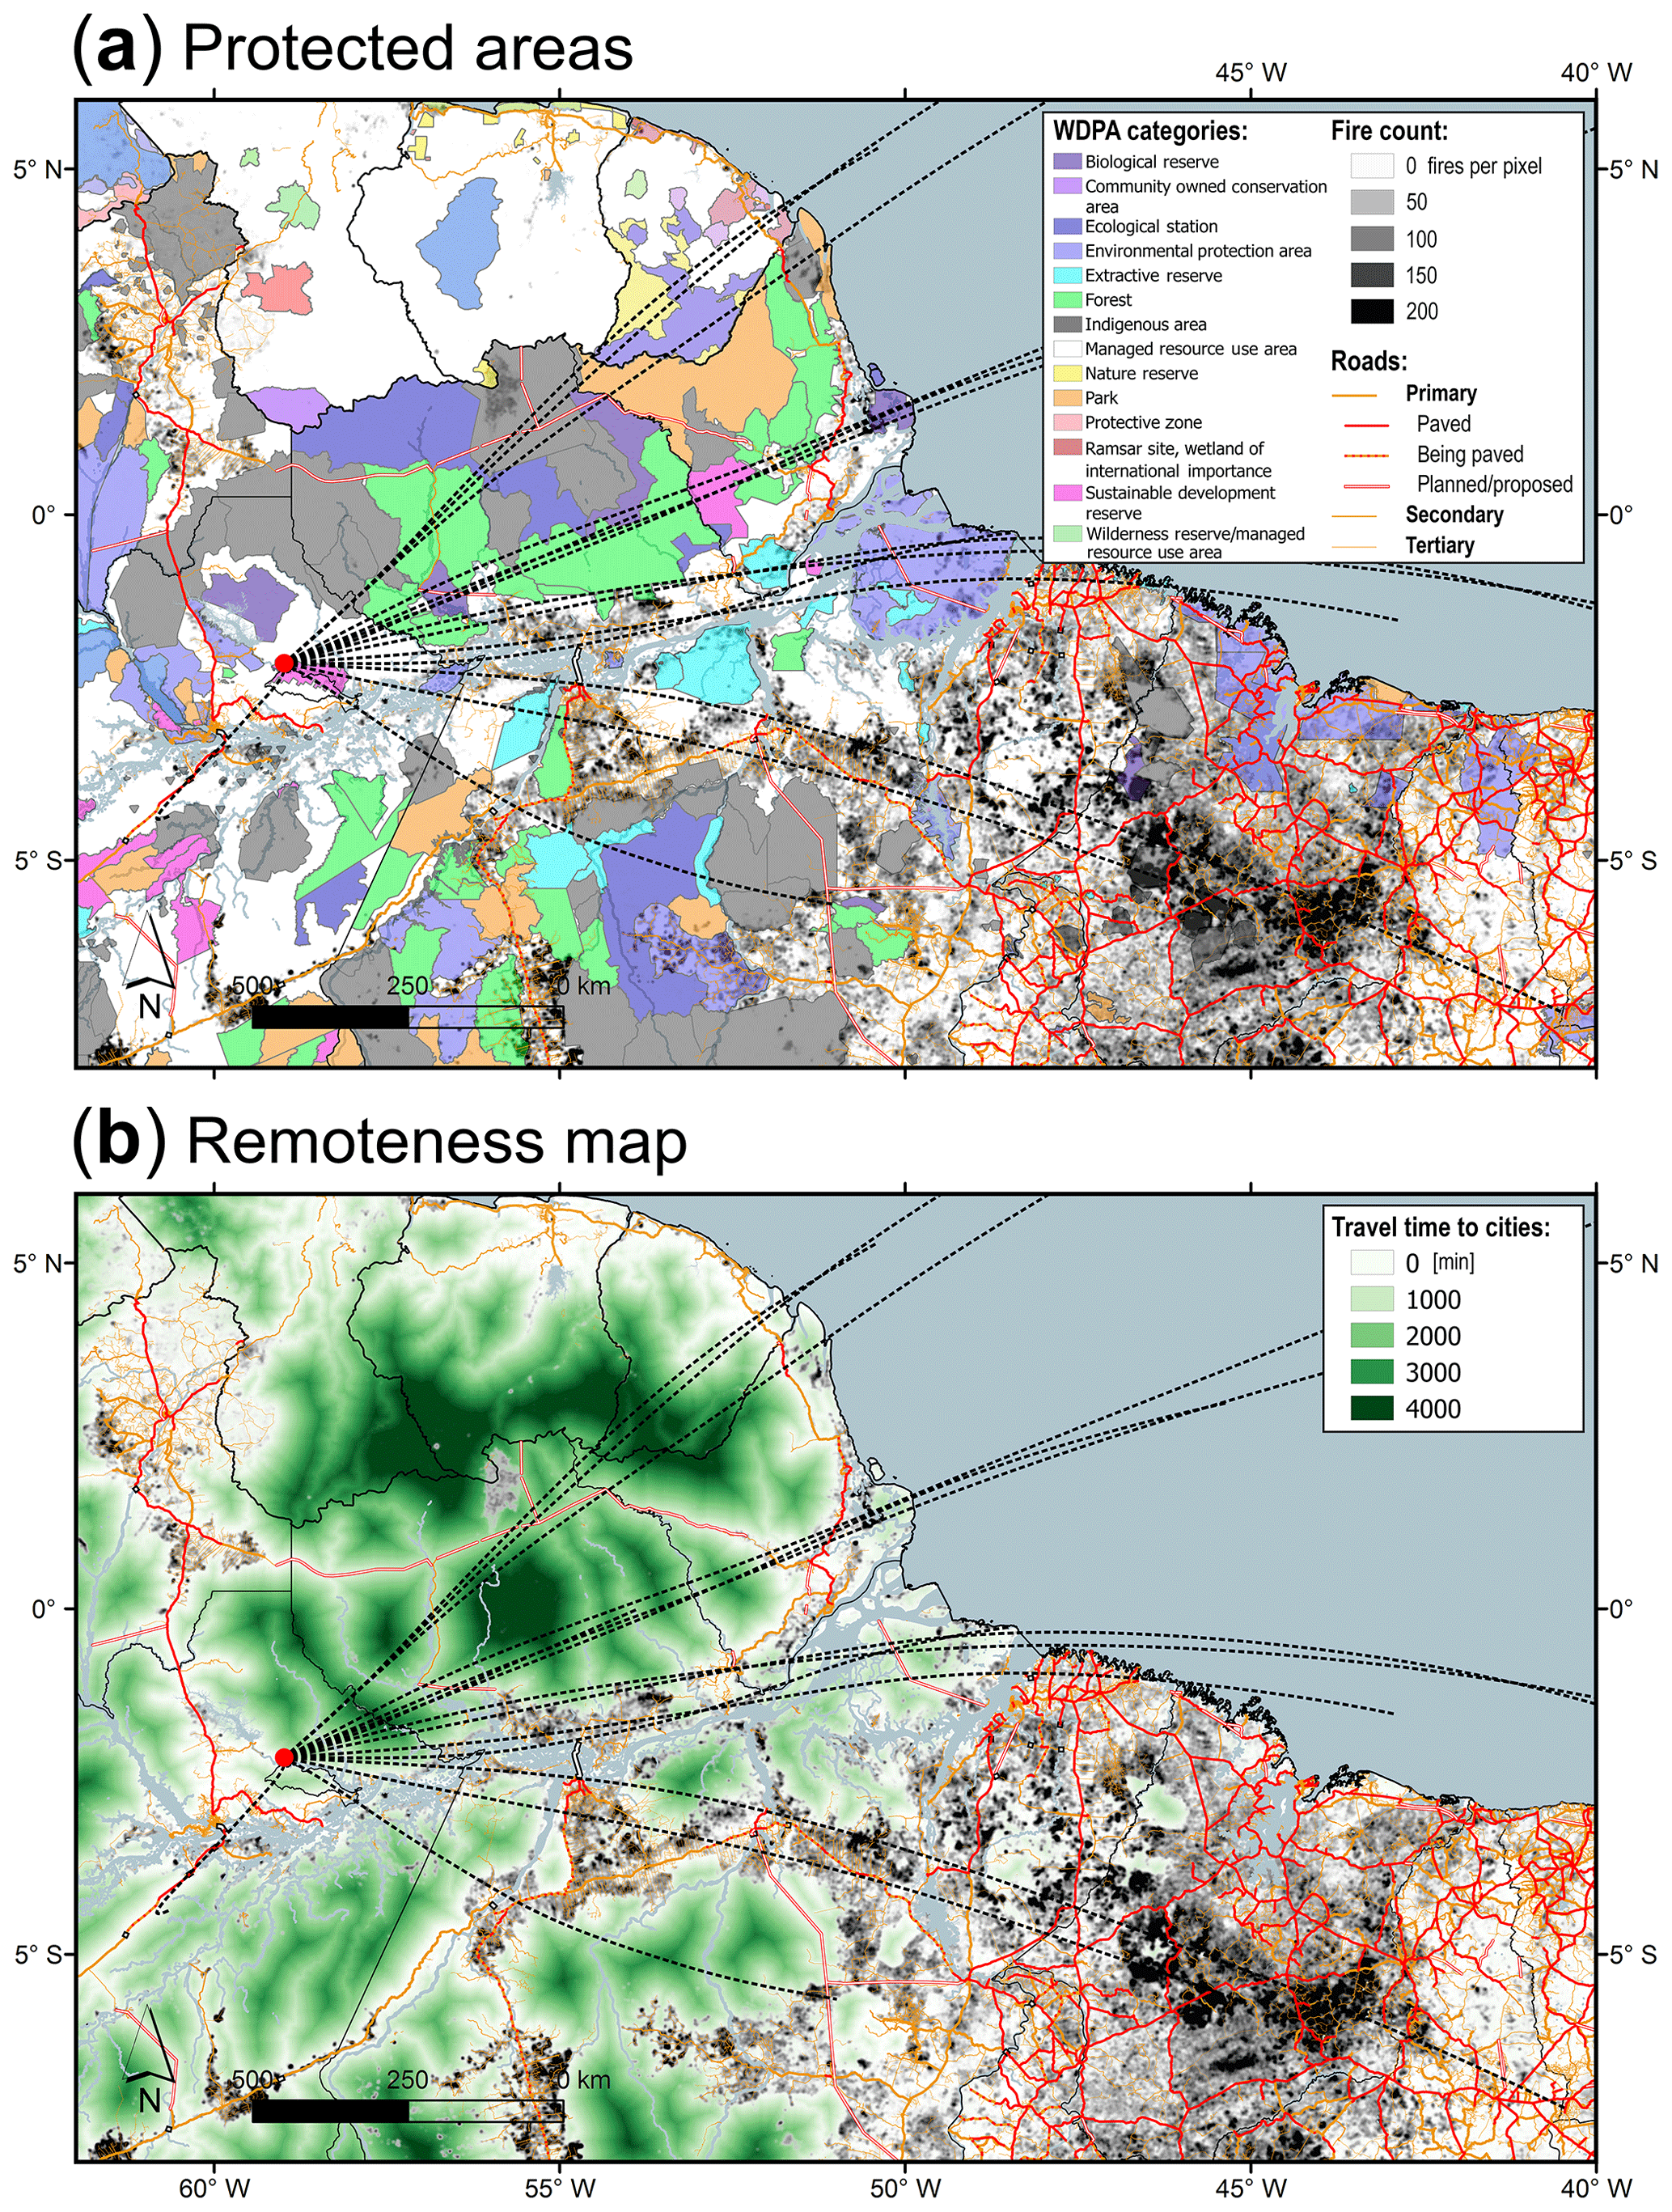
Figure 21Map of the ATTO-relevant eastern Amazon Basin (ROIfoot) combining the backward trajectory (BT) data with GIS data layers of (a) protected areas according to the WDPA categorization as well as (b) a global accessibility map with land-based travel times to the nearest densely populated area according to Weiss et al. (2018) (called “remoteness map” here). In both maps, the road network from Fig. 18 and the INPE data-derived fire map from Fig. S17 have been adapted. The BT data are represented as center lines of the 15 BT clusters (black dashed lines; see Fig. 4).
3.3.6 Protected areas
The conservation efforts to protect the Amazonian forests are manifold. Often, protection is initiated as a response to deforestation frontier expansion (Nepstad et al., 2006). Worldwide, a large variety of different types of conserved areas (e.g., in terms of their legal, control, and habitation status) exists. According to the world database on protected areas (WDPA) classification, about 14 types are relevant in the ROIfoot (Fig. 21a). About 41 % of the actual footprint region is protected. Basin-wide, about half of the forest area has some protection status, whereas only 10 %–20 % is considered strictly protected (Barber et al., 2014; ter Steege et al., 2015). The establishment of protected and controlled areas, such as parks, reserves, and indigenous lands, can be an effective tool to reduce or even inhibit deforestation and fire occurrence (e.g., Nepstad et al., 2006). However, contrasting examples have also been reported, where protection has been less effective (e.g., Nolte et al., 2013).
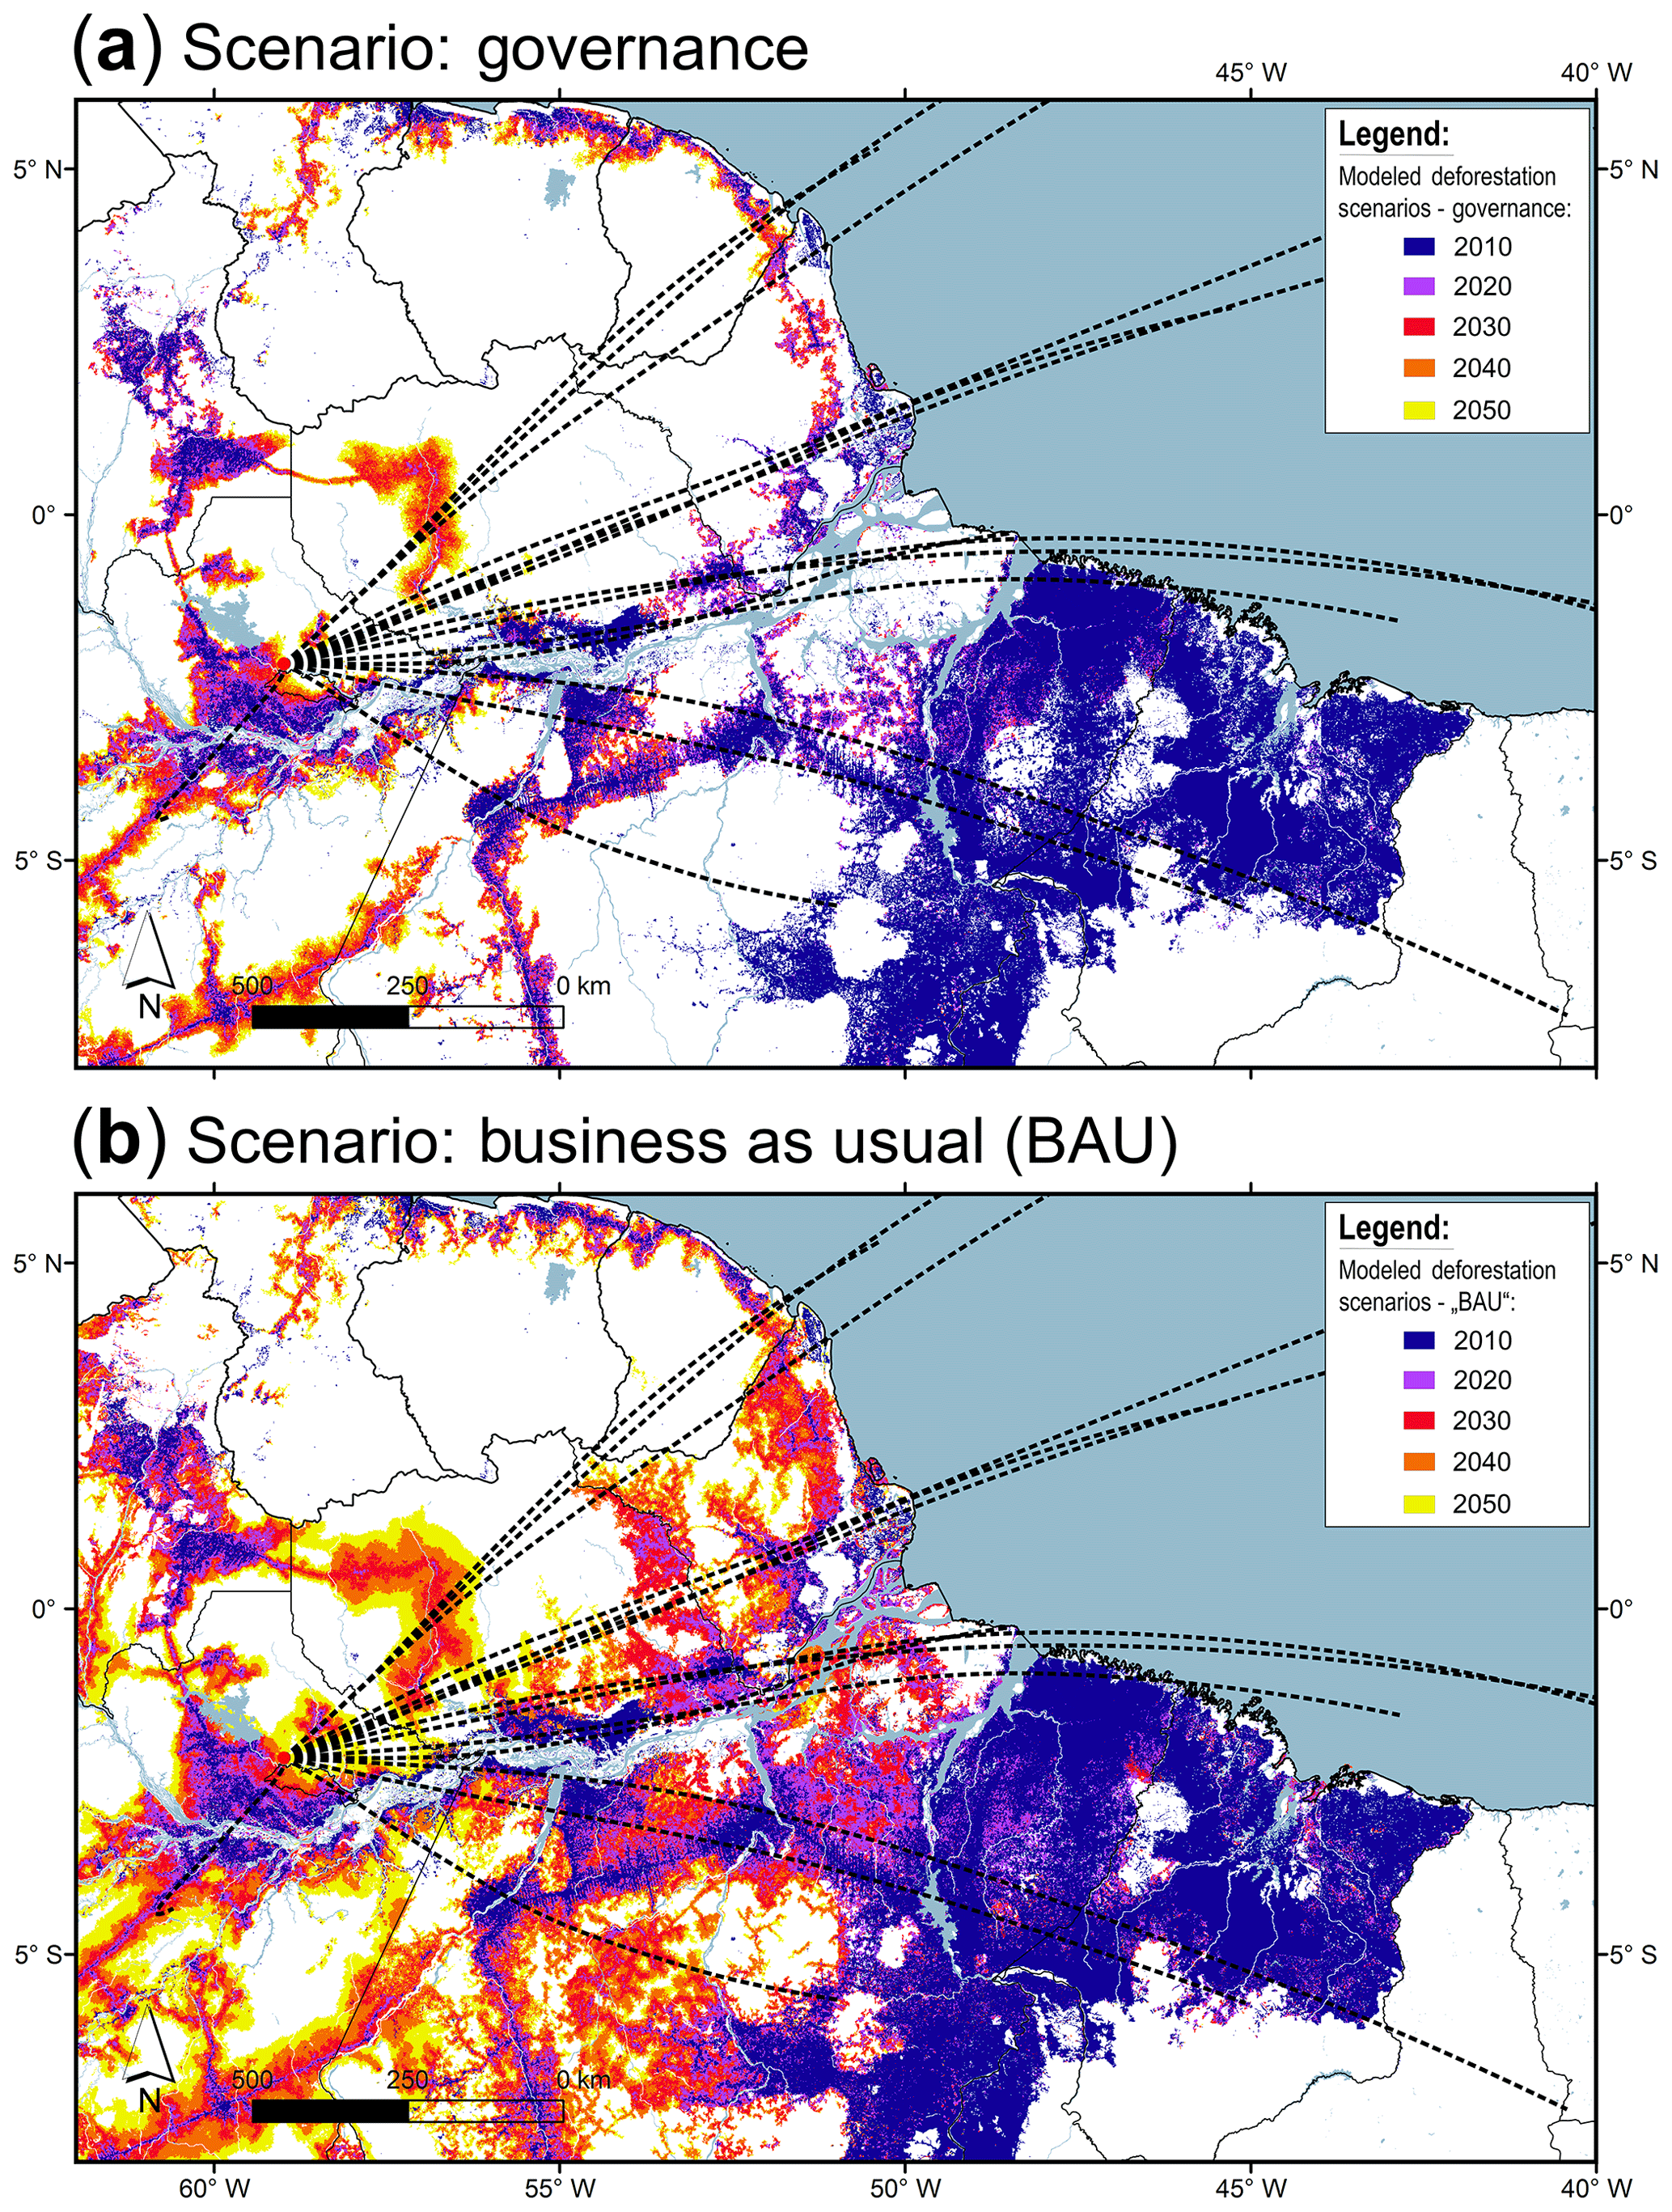
Figure 22Map of the ATTO-relevant eastern Amazon Basin (ROIfoot) combining the backward trajectory (BT) data with the GIS data layer on modeled deforestation scenarios, discriminating (a) governance and (b) business-as-usual cases according to Soares-Filho et al. (2006). The BT data are represented as center lines of the 15 BT clusters (black dashed lines; see Fig. 4).
The ATTO site itself is located in a sustainable development reserve (i.e., Reserva de Desenvolvimento Sustentável do Uatumã). Such sustainable development reserves allow a certain level of resource use and extraction, in contrast to strictly protected areas. Figure 21a further shows that the ATTO site footprint is to various degrees covered by protected areas. Specifically, almost the entire northern half of the BT footprint with the NE and ENE clusters (i.e., in northern Pará and Amapá as well as in French Guiana) consists of protected lands. In contrast, the southern half, which overlaps with the arc of deforestation and the ESE clusters (i.e., ESE2 and ESE3), comprises only few and rather small conservation areas. The part of the Amazon River valley that is covered by the E clusters contains few protected areas, and, therefore, plays an intermediate role in this overall conservation picture. In Fig. 21a, a comparison of the protected areas and the patterns in fire occurrence highlights examples for both successful and less successful conservation efforts. For example, most of the indigenous areas have been very effective in preventing deforestation and, thus, do not overlap with the major fire hot spots (see also Ricketts et al., 2010). Note also the sharp edges between fire hot spots and indigenous areas in certain cases. In contrast, the formally protected areas along the highway BR-163 have not prevented the continuous forest fragmentation in this area. The future effectiveness of the protected areas in the ROIfoot is hard to predict, as conservation efforts depend on (dynamic) contextual factors, such as economic development, accessibility, regional climate, and political willingness/capability to enforce conservation regulations (e.g., Schwartzman et al., 2000; Soares-Filho et al., 2006, 2013; Nolte et al., 2013). The RENCA case shows that a conservation status can change rapidly in response to socioeconomic interests.
In addition to the institutionalized network of protected areas, the conservation of the Amazon forest can be discussed as a passive de facto protection due to the remoteness of yet unperturbed regions (Soares-Filho et al., 2006). Figure 21b visualizes a “remoteness map” of the ROIfoot, based on a global study by Weiss et al. (2018) on the land-based travel times to the nearest densely populated area. The map illustrates the close relation between accessibility and fire occurrence along major highways and certain rivers. Again, the critical role of highways in forest destruction clearly stands out in this comparison. The still remotest regions in the ROIfoot are located in northern Pará, Amapá, French Guiana, and Suriname, and are covered by the NE BT clusters. Note here that the Arco Norte and BR-210 highways have already been considered in the remoteness map, although they do not exist yet.
3.3.7 Deforestation and climate change scenarios
The construction of new roads – in particular paved all-weather highways – has a keystone role in future deforestation as it opens large areas for colonization and resource exploitation (e.g., Fearnside and Graca, 2006; de Carvalho and Mustin, 2017). For the ATTO observations, the currently discussed construction of the Arco Norte with the extensions of the BR-210 and BR-163 would be by all means the most severe impact with a profound perturbation of the currently still untouched NE segment of the ATTO footprint. Soares-Filho et al. (2006) conducted a policy-sensitive simulation of future deforestation scenarios. Within the ROIfoot, the corresponding results for a governance (Fig. 22a) and business-as-usual (Fig. 22b) scenario show large differences and, thus, define the range of possible future deforestation trajectories. Overall, the business-as-usual scenario predicts massive deforestation that would impact the entire ATTO footprint region. However, even the governance scenario predicts substantial further deforestation, mostly along the major highways BR-230 and BR-319 southwest of Manaus as well as along the Arco Norte northeast of ATTO. In both scenarios, the construction of the Arco Norte has been considered and acts as a starting point for massive deforestation in the core of the ATTO BT footprint. The varying degrees of predicted deforestation along the Arco Norte relate to differences in effectiveness of existing protected areas (compare Fig. 21a). It has to be kept in mind that many policy-related input parameters for the modeling approach are subject to high uncertainty. Nevertheless, the modeling results are valuable to assess potential future developments within the ATTO footprint. The most striking result is the prediction that the construction of the Arco Norte would initiate massive deforestation under both scenarios.
In addition to the infrastructural perturbations, climate change tends to further increase the pressure on the Amazon ecosystem. In extreme scenarios, a large-scale rain forest dieback – i.e., a climate-driven substitution of moist forests by semiarid and/or savanna vegetation – due to changing hydrological and seasonal regimes has been predicted, although these predictions still comprise large uncertainties (e.g., Cochrane and Laurance, 2008; Nepstad et al., 2008; Cochrane and Barber, 2009). Furthermore, it has been reported that these effects will likely be most severe in the eastern basin as large parts of its forest are already close to the lower rainfall limit that sustains moist tropical vegetation (Zelazowski et al., 2011). Even minor changes in precipitation patterns could exceed thresholds that irreversibly push the system beyond a tipping point towards seasonal and savanna forests with strong fire feedback cycles (Malhi et al., 2009; Alencar et al., 2015). Accordingly, any changes in dry-season water supply (i.e., precipitation or stored soil moisture) are of critical importance for the rain forest ecosystem (Boisier et al., 2015). Since climate models are known to differ substantially with respect to regional rainfall patterns in Amazonia, future spatially resolved projections are highly uncertain (Cox et al., 2008; Xie et al., 2015). However, a general drying trend towards more seasonal bioclimatic conditions as well as an increase in frequency and severity of droughts is being observed already and will likely intensify, particularly in the eastern basin (Good et al., 2008; Lewis et al., 2011; Silva et al., 2013; Hilker et al., 2014). Accordingly, it appears to be a likely scenario that the ongoing ATTO observations will witness further substantial, maybe disruptive transformations within the eastern basin through the synergistic effects of human-made perturbations and climate change.
This study presents a backward trajectory (BT) and geographic data analysis for the ATTO site in the central Amazon Basin. It extracts spatiotemporal BT patterns in relation to the current state and anticipated future change of the land cover within the ATTO footprint. The overall aim of this work is to provide a robust characterization of the effectively probed land cover mosaic in the footprint region to embed atmospheric observations at ATTO into a broader Amazonian context. Since the footprint regions of the ATTO site and the nearby ZF2 site are similar, the present work may further act as a resource for the interpretation of ZF2 results. We envision that this work may serve as a resource and look-up reference for the interpretation of current and future observations in the ATTO-relevant and vulnerable eastern basin, in which the progressing climate and land use changes are influences of crucial importance.
The multi-year BT analysis (2008–2016) shows the characteristic central Amazonian air mass advection as the confluence of northeasterly and southeasterly trade winds, feeding boundary layer air into the ITCZ. In response to the annual north–south ITCZ migration, the ATTO-relevant BTs follow a seasonal swing between a NE path during the wet season and a SE path during the dry season. The northernmost BT advection occurs around February and the southernmost around July with a north-to-south swing lasting ∼3 months and a south-to-north swing lasting ∼6 months. The BT seasonality is phase-shifted relative to the rainfall seasonality at ATTO (with a peak in March vs. a minimum in September) as well as to the seasonality in pollution abundance (with a peak ∼ September vs. a minimum ∼ April/May). Air mass advection towards ATTO generally occurs at relatively low altitudes. The BT variability can be further classified in four main wind directions: NE (accounting for ∼20 % of all BTs), ENE (∼27 %), E (∼33 %), and ESE (∼19 %), as well as faster- vs. slower-wind-speed regimes. Overall, 15 clusters obtained from a k means cluster analysis appropriately resolve the variability and show a good agreement with the atmospheric observations at ATTO. Anomalies in the BT seasonality have been found to be related to teleconnections with ocean sea surface temperatures.
The BT-derived ATTO footprint defined here includes a continental area of km2. Climatically, the footprint is characterized by tropically warm and moist conditions with heterogeneous precipitation patterns, spanning from moist forest to dry savanna regions. Large parts of the forests in the footprint have been described as highly vulnerable towards a further drying of the eastern basin. Ecologically, the footprint includes four major biomes: (i) tropical and subtropical moist broadleaf forests (∼90 % of the continental area), (ii) tropical and subtropical grasslands, savannas, and shrublands in the Guianan savanna and Cerrado regions (∼8 %), (iii) deserts and xeric shrublands in the Caatinga region, (∼1 %), and (iv) mangrove forests along the Atlantic coast (∼1 %). About 54 % of the continental footprint area is considered to be in an untouched state. The effective land cover mix in the footprint consists of ∼60 % rain forest, ∼30 % water bodies, ∼5 % wetlands and flooded forests, ∼4 % agricultural areas, and ∼3 % shrub- and grasslands. It shows a strong NW-to-SE gradient. Classified by land cover categories, two different seasonal patterns in net primary productivity were observed: (i) a seasonal cycle in phase with solar radiation (sunlight-enhanced growth) in moist and relatively deep-rooted forests vs. (ii) a seasonal cycle in phase with precipitation (rainfall-constrained growth) occurring in low/sparse vegetation.
In terms of deforestation and agricultural expansion, the ATTO site covers the full range of deforestation dynamics spanning from major forest fragmentation and clearing hot spots in the SE (deforestation rates ∼1 % a−1) to mostly untouched forests in the NE (deforestation rates ∼0.01 % a−1). Several major highways (i.e., the “soybean corridor” BR-163 and the Trans-Amazonian highway BR-230), which have initiated strong deforestation in previously inaccessible regions, are located in the footprint. The agro-industrial expansion can be linked to the observed patterns in the fire maps: towards the ESE of the footprint, large fire activities are observed, due to human-made ignition and increased forest flammability as a function of forest fragmentation and degradation. Towards the NE, no/low fire activities show that the forests maintained their fire-immune moist climate. A land cover-categorized and BT-weighted fire mix within the footprint indicates 54 %–63 % of fires in rain forest areas, 10 %–16 % fires in shrub and grassland categories, and 11 %–28 % fires in agricultural areas. Existing or planned infrastructure in the footprint region is of significant relevance for the ATTO observations as it perturbs the natural biosphere–atmosphere exchange and/or represents sources of primary and secondary pollutants. The ATTO-relevant infrastructure categories are (i) extended urban areas and power plants, (ii) at least six major dams with largely flooded areas (including the new Belo Monte Dam), (iii) ship traffic, particularly on inland rivers, and (iv) active mining spots as major forest destruction and industrial pollution sources. In particular, the realization of further planned (all-weather) highways in the footprint, such as the Arco Norte by extending the BR-210 and BR-163, would be a severe threat for the currently unperturbed footprint regions. About 41 % of the ATTO footprint is conserved areas with protection categories of varying effectiveness in deforestation mitigation. Beyond this institutionalized network of protected areas, large parts of the northern footprint region are at this time passively protected by their remoteness.
The following data from this study have been deposited under https://doi.org/10.17617/3.2g (Pöhlker et al., 2019) for use in follow-up studies: (i) a time series, with the cluster membership numbers resulting from the k-means cluster analysis of the HYSPLIT backward trajectories (see Sect. 2.2 and 2.4) in NASA Ames format (named “ClustMemb.dat”); (ii) the center lines of the 15 k-means backward trajectory clusters (as plotted in Figs. 4, 7, and several further maps), provided as ASCII and shapefile formats (named “ClustCent.dat” and “ClustCent_Shape.zip”); (iii) high-resolution versions of all figures, as well as selected supplement figures; (iv) the air mass residence time maps and contour lines of the BT ensembles in Figs. 7 and 8, provided as shapefile format (named “BTContour_Shape.zip”). The GIS data used in this study are freely available from sources and websites as specified in the Supplement Sect. S1.1. For data requests beyond the available data, please refer to the corresponding author.
| Acronym | Description |
| a.g.l. | above ground level |
| AMAZE-08 | Amazonian Aerosol Characterization Experiment 2008 |
| AMO | Atlantic multidecadal oscillation |
| ATTO | Amazon Tall Tower Observatory |
| BL | boundary layer |
| BT | back trajectory |
| CA | cluster analysis |
| CIAT | International Center for Tropical Agriculture |
| E | BT clusters towards east |
| ENE | BT clusters towards east-northeast |
| ENSO | El Niño–Southern Oscillation |
| ESA | European Space Agency |
| ESE | BT clusters towards east-southeast |
| f | frequency of occurrence of BTs |
| FAO | Food and Agriculture Organization |
| FFDAS | Fossil Fuel Data Assimilation System |
| FLEXPART | FLEXible PARTicle dispersion model |
| FoO | frequency of occurrence |
| GFAS | Global Fire Assimilation System |
| GHCN | Global Historical Climatology Network |
| GIS | geographic information system |
| GUF | French Guiana |
| GUY | Guyana |
| HYSPLIT | Hybrid Single-Particle Lagrangian Trajectory Model |
| INPE | Instituto Nacional de Pesquisas Espaciais |
| IPCC | Intergovernmental Panel on Climate Change |
| ISLSCP II | International Satellite Land-Surface Climatology Project, Initiative II |
| ITCZ | intertropical convergence zone |
| IUCN | International Union for Conservation of Nature |
| LBA | Large-Scale Biosphere-Atmosphere Experiment in Amazonia |
| LRT | long-range transport |
| MODIS | Moderate Resolution Imaging Spectroradiometer |
| NASA | National Aeronautics and Space Administration |
| NCAR | National Center for Atmospheric Research |
| NDVI | normalized difference vegetation index |
| NE | BT clusters towards northeast |
| NOAA | National Oceanic and Atmospheric Administration |
| ONI | Oceanic Niño Index |
| OSM | OpenStreetMap |
| P | precipitation rate |
| PBT | cumulative precipitation along 3 d BTs |
| Acronym | Description |
| PERSIANN-CDR | Precipitation Estimation from Remotely Sensed Information |
| using Artificial Neural Networks for Climate Data Record | |
| RENCA | national reserve of copper and associates |
| ROI | region of interest |
| ROIfoot | region of interest covering the continental part of the ATTO BT |
| footprint (62, 40∘ W, 8∘ S, 6∘ N) | |
| SEDAC | Socioeconomic Data and Applications Center |
| SPOT | Satellite Pour l'Observation de la Terre |
| SRTM | Shuttle Radar Topography Mission |
| SST | sea surface temperature |
| SUR | Suriname |
| SW | BT cluster towards southwest |
| TNA | tropical northern Atlantic |
| TSA | tropical southern Atlantic |
| UNLC | UN land cover classification |
| UNEP | United Nations Environment Program |
| UTC | coordinated universal time |
| WDPA | World Database on Protected Areas |
| WGS 84 | World Geodetic System from 1984 |
| WWF | World Wildlife Fund |
| WMO | World Meteorological Organization |
The supplement related to this article is available online at: https://doi.org/10.5194/acp-19-8425-2019-supplement.
CP and DW conducted the HYSPLIT backward trajectory analyses. CP, HP, TK, and ERC conducted the GIS analyses. CD conducted the FLEXPART analysis. CP wrote the paper. DMZ, JWK, GL, DP, MLP, NL, JS, and SW supported the backward trajectory and GIS analyses. JB, SC, VRD, BAH, JVL, JM, MP, MS, QW, BW, PA, UP, and MOA contributed to the data analysis and paper writing through fruitful discussions and by providing valuable comments and ideas. All authors contributed to data discussions and paper finalization.
The authors declare that they have no conflict of interest.
This article is part of the special issue “Amazon Tall Tower Observatory (ATTO) Special Issue”. It is not associated with a conference.
This work has been supported by the Max Planck Society (MPG). For the operation of the ATTO site, we acknowledge the support by the German Federal Ministry of Education and Research (BMBF contract nos. 01LB1001A and 01LK1602B) and the Brazilian Ministério da Ciência, Tecnologia e Inovação (MCTI/FINEP contract 01.11.01248.00) as well as the Amazon State University (UEA), FAPEAM, LBA/INPA, and SDS/CEUC/RDS-Uatumã. This paper contains results of research conducted under the Technical/Scientific Cooperation Agreement between the National Institute for Amazonian Research, the State University of Amazonas, and the Max-Planck-Gesellschaft e.V.; the opinions expressed are the entire responsibility of the authors and not of the participating institutions. Céline Degrendele was funded by the core facilities of the RECETOX Research Infrastructure, project LM2015051, and by Actris-CZ RI project CZ.02.1.01/0.0/0.0/16_013/0001315, funded by the Ministry of Education, Youth and Sports of the Czech Republic under the activity “Projects of major infrastructures for research, development and innovations”. We acknowledge the support by the Instituto Nacional de Pesquisas da Amazônia (INPA). We would like to thank Reiner Ditz, Jürgen Kesselmeier, Susan Trumbore, Alberto Quesada, Thomas Disper, Thomas Klimach, Andrew Crozier, Björn Nillius, Uwe Schulz, Steffen Schmidt, Niro Higuchi, Antonio Ocimar Manzi, Alcides Camargo Ribeiro, Hermes Braga Xavier, Elton Mendes da Silva, Nagib Alberto de Castro Souza, Adir Vasconcelos Brandão, Amauri Rodriguês Perreira, Antonio Huxley Melo Nascimento, Thiago de Lima Xavier, Josué Ferreira de Souza, Roberta Pereira de Souza, Bruno Takeshi, and Wallace Rabelo Costa for technical, logistical, and scientific support within the ATTO project. Moreover, we thank Britaldo Soares-Filho, Florian Wittmann, Henrique Barbosa, Scot T. Martin, Xuguang Chi, Hang Su, Isabella Hrabě de Angelis, and Ovid Krüger for scientific support and stimulating discussions. The authors gratefully acknowledge the NOAA Air Resources Laboratory (ARL) for the provision of the HYSPLIT transport and dispersion model and/or READY website (http://www.ready.noaa.gov) used in this publication. The authors further gratefully acknowledge the European Space Agency (ESA) GlobCover 2009 project for providing the global land cover maps. The authors acknowledge the critical and constructive reviews by David Fitzjarrald and Bart Kruijt, which helped to improve the quality of the paper.
The article processing charges for this
open-access
publication were covered by the Max Planck Society.
This paper was edited by Laurens Ganzeveld and reviewed by David Fitzjarrald and Bart Kruijt.
Abril, G., Guerin, F., Richard, S., Delmas, R., Galy-Lacaux, C., Gosse, P., Tremblay, A., Varfalvy, L., Dos Santos, M. A., and Matvienko, B.: Carbon dioxide and methane emissions and the carbon budget of a 10-year old tropical reservoir (Petit Saut, French Guiana), Global Biogeochem. Cy., 19, GB4007, https://doi.org/10.1029/2005gb002457, 2005.
Alencar, A. A., Brando, P. M., Asner, G. P., and Putz, F. E.: Landscape fragmentation, severe drought, and the new Amazon forest fire regime, Ecol. Appl., 25, 1493–1505, https://doi.org/10.1890/14-1528.1, 2015.
Andreae, M. O.: Aerosols before pollution, Science, 315, 50–51, https://doi.org/10.1126/science.1136529, 2007.
Andreae, M. O. and Merlet, P.: Emission of trace gases and aerosols from biomass burning, Global Biogeochem. Cy., 15, 955–966, https://doi.org/10.1029/2000gb001382, 2001.
Andreae, M. O., Rosenfeld, D., Artaxo, P., Costa, A. A., Frank, G. P., Longo, K. M., and Silva-Dias, M. A. F.: Smoking rain clouds over the Amazon, Science, 303, 1337–1342, https://doi.org/10.1126/science.1092779, 2004.
Andreae, M. O., Artaxo, P., Beck, V., Bela, M., Freitas, S., Gerbig, C., Longo, K., Munger, J. W., Wiedemann, K. T., and Wofsy, S. C.: Carbon monoxide and related trace gases and aerosols over the Amazon Basin during the wet and dry seasons, Atmos. Chem. Phys., 12, 6041–6065, https://doi.org/10.5194/acp-12-6041-2012, 2012.
Andreae, M. O., Acevedo, O. C., Araùjo, A., Artaxo, P., Barbosa, C. G. G., Barbosa, H. M. J., Brito, J., Carbone, S., Chi, X., Cintra, B. B. L., da Silva, N. F., Dias, N. L., Dias-Júnior, C. Q., Ditas, F., Ditz, R., Godoi, A. F. L., Godoi, R. H. M., Heimann, M., Hoffmann, T., Kesselmeier, J., Könemann, T., Krüger, M. L., Lavric, J. V., Manzi, A. O., Lopes, A. P., Martins, D. L., Mikhailov, E. F., Moran-Zuloaga, D., Nelson, B. W., Nölscher, A. C., Santos Nogueira, D., Piedade, M. T. F., Pöhlker, C., Pöschl, U., Quesada, C. A., Rizzo, L. V., Ro, C.-U., Ruckteschler, N., Sá, L. D. A., de Oliveira Sá, M., Sales, C. B., dos Santos, R. M. N., Saturno, J., Schöngart, J., Sörgel, M., de Souza, C. M., de Souza, R. A. F., Su, H., Targhetta, N., Tóta, J., Trebs, I., Trumbore, S., van Eijck, A., Walter, D., Wang, Z., Weber, B., Williams, J., Winderlich, J., Wittmann, F., Wolff, S., and Yáñez-Serrano, A. M.: The Amazon Tall Tower Observatory (ATTO): overview of pilot measurements on ecosystem ecology, meteorology, trace gases, and aerosols, Atmos. Chem. Phys., 15, 10723–10776, https://doi.org/10.5194/acp-15-10723-2015, 2015.
Aragao, L., Malhi, Y., Barbier, N., Lima, A., Shimabukuro, Y., Anderson, L., and Saatchi, S.: Interactions between rainfall, deforestation and fires during recent years in the Brazilian Amazonia, Philos. T. Roy. Soc. B, 363, 1779–1785, https://doi.org/10.1098/rstb.2007.0026, 2008.
Arino, O., Bicheron, P., Achard, F., Latham, J., Witt, R., and Weber, J.-L.: GLOBCOVER The most detailed portrait of Earth, Esa Bull.-Eur. Space, 136, 24–31, 2008.
Artaxo, P., Rizzo, L. V., Brito, J. F., Barbosa, H. M. J., Arana, A., Sena, E. T., Cirino, G. G., Bastos, W., Martin, S. T., and Andreae, M. O.: Atmospheric aerosols in Amazonia and land use change: from natural biogenic to biomass burning conditions, Faraday Discuss., 165, 203–235, https://doi.org/10.1039/c3fd00052d, 2013.
Ashouri, H., Hsu, K.-L., Sorooshian, S., Braithwaite, D. K., Knapp, K. R., Cecil, L. D., Nelson, B. R., and Prat, O. P.: PERSIANN-CDR Daily Precipitation Climate Data Record from Multisatellite Observations for Hydrological and Climate Studies, B. Am. Meteorol. Soc., 96, 69–84, https://doi.org/10.1175/bams-d-13-00068.1, 2015.
Asner, G. P., Townsend, A. R., and Braswell, B. H.: Satellite observation of El Nino effects on Amazon forest phenology and productivity, Geophys. Res. Lett., 27, 981–984, https://doi.org/10.1029/1999gl011113, 2000.
Asner, G. P., Knapp, D. E., Broadbent, E. N., Oliveira, P. J. C., Keller, M., and Silva, J. N.: Selective logging in the Brazilian Amazon, Science, 310, 480–482, https://doi.org/10.1126/science.1118051, 2005.
Atkinson, P. M., Dash, J., and Jeganathan, C.: Amazon vegetation greenness as measured by satellite sensors over the last decade, Geophys. Res. Lett., 38, L19105, https://doi.org/10.1029/2011gl049118, 2011.
Aulinger, A., Matthias, V., Zeretzke, M., Bieser, J., Quante, M., and Backes, A.: The impact of shipping emissions on air pollution in the greater North Sea region – Part 1: Current emissions and concentrations, Atmos. Chem. Phys., 16, 739–758, https://doi.org/10.5194/acp-16-739-2016, 2016.
Barber, C. P., Cochrane, M. A., Souza, C. M., and Laurance, W. F.: Roads, deforestation, and the mitigating effect of protected areas in the Amazon, Biol. Conserv., 177, 203–209, https://doi.org/10.1016/j.biocon.2014.07.004, 2014.
Barni, P. E., Fearnside, P. M., and Graca, P.: Simulating Deforestation and Carbon Loss in Amazonia: Impacts in Brazil's Roraima State from Reconstructing Highway BR-319 (Manaus-Porto Velho), Environ. Manage., 55, 259–278, https://doi.org/10.1007/s00267-014-0408-6, 2015.
Barona, E., Ramankutty, N., Hyman, G., and Coomes, O. T.: The role of pasture and soybean in deforestation of the Brazilian Amazon, Environ. Res. Lett., 5, 024002, https://doi.org/10.1088/1748-9326/5/2/024002, 2010.
Boisier, J. P., Ciais, P., Ducharne, A., and Guimberteau, M.: Projected strengthening of Amazonian dry season by constrained climate model simulations, Nat. Clim. Change, 5, 656-+, https://doi.org/10.1038/nclimate2658, 2015.
Bowman, M. S., Soares, B. S., Merry, F. D., Nepstad, D. C., Rodrigues, H., and Almeida, O. T.: Persistence of cattle ranching in the Brazilian Amazon: A spatial analysis of the rationale for beef production, Land Use Pol., 29, 558–568, https://doi.org/10.1016/j.landusepol.2011.09.009, 2012.
Bradley, A. V., Gerard, F. F., Barbier, N., Weedon, G. P., Anderson, L. O., Huntingford, C., Aragao, L. E. O. C., Zelazowski, P., and Arai, E.: Relationships between phenology, radiation and precipitation in the Amazon region, Global Change Biol., 17, 2245–2260, https://doi.org/10.1111/j.1365-2486.2011.02405.x, 2011.
Broadbent, E. N., Asner, G. P., Keller, M., Knapp, D. E., Oliveira, P. J. C., and Silva, J. N.: Forest fragmentation and edge effects from deforestation and selective logging in the Brazilian Amazon, Biol. Conserv., 141, 1745–1757, https://doi.org/10.1016/j.biocon.2008.04.024, 2008.
Bush, M. B., McMichael, C. H., Piperno, D. R., Silman, M. R., Barlow, J., Peres, C. A., Power, M., and Palace, M. W.: Anthropogenic influence on Amazonian forests in pre-history: An ecological perspective, J. Biogeogr., 42, 2277–2288, https://doi.org/10.1111/jbi.12638, 2015.
Cano-Crespo, A., Oliveira, P. J. C., Boit, A., Cardoso, M., and Thonicke, K.: Forest edge burning in the Brazilian Amazon promoted by escaping fires from managed pastures, J. Geophys. Res.-Biogeo., 120, 2095–2107, https://doi.org/10.1002/2015jg002914, 2015.
Carbone, S., Brito, J. F., Xu, L., Ng, N. L., Rizzo, L., Holanda, B. A., Wolff, S., Saturno, J., Chi, X., Souza, R. A. F., Pöhlker, M. L., Andreae, M. O., Pöhlker, C., Barbosa, H. M. J., and Artaxo, P.: Long-term chemical composition and source apportionment of submicron aerosol particles in the central Amazon basin (ATTO), Atmos. Chem. Phys., in preparation, 2017.
Chiang, J. C. H., Kushnir, Y., and Giannini, A.: Deconstructing Atlantic Intertropical Convergence Zone variability: Influence of the local cross-equatorial sea surface temperature gradient and remote forcing from the eastern equatorial Pacific, J. Geophys. Res.-Atmos., 107, 4004, https://doi.org/10.1029/2000jd000307, 2002.
Cheng, Y. F., Zheng, G. J., Wei, C., Mu, Q., Zheng, B., Wang, Z. B., Gao, M., Zhang, Q., He, K. B., Carmichael, G., Pöschl, U., and Su, H.: Reactive nitrogen chemistry in aerosol water as a source of sulfate during haze events in China, Science Advances, 2, e1601530, https://doi.org/10.1126/sciadv.1601530, 2016.
Chor, T. L., Dias, N. L., Araujo, A., Wolff, S., Zahn, E., Manzi, A., Trebs, I., Sa, M. O., Teixeira, P. R., and Sörgel, M.: Flux-variance and flux-gradient relationships in the roughness sublayer over the Amazon forest, Agr. Forest Meteorol., 239, 213–222, https://doi.org/10.1016/j.agrformet.2017.03.009, 2017.
Cisneros, E., Zhou, S. L., and Borner, J.: Naming and Shaming for Conservation: Evidence from the Brazilian Amazon, Plos One, 10, 1–24, https://doi.org/10.1371/journal.pone.0136402, 2015.
Clement, C. R., Denevan, W. M., Heckenberger, M. J., Junqueira, A. B., Neves, E. G., Teixeira, W. G., and Woods, W. I.: The domestication of Amazonia before European conquest, P. Roy. Soc. B-Biol. Sci., 282, 32–40, https://doi.org/10.1098/rspb.2015.0813, 2015.
Cochrane, M. A.: Fire science for rainforests, Nature, 421, 913–919, https://doi.org/10.1038/nature01437, 2003.
Cochrane, M. A. and Schulze, M. D.: Fire as a recurrent event in tropical forests of the eastern Amazon: Effects on forest structure, biomass, and species composition, Biotropica, 31, 2–16, https://doi.org/10.1111/j.1744-7429.1999.tb00112.x, 1999.
Cochrane, M. A. and Laurance, W. F.: Synergisms among Fire, Land Use, and Climate Change in the Amazon, Ambio, 37, 522–527, https://doi.org/10.1579/0044-7447-37.7.522, 2008.
Cochrane, M. A. and Barber, C. P.: Climate change, human land use and future fires in the Amazon, Global Change Biol., 15, 601–612, https://doi.org/10.1111/j.1365-2486.2008.01786.x, 2009.
Congalton, R. G., Gu, J. Y., Yadav, K., Thenkabail, P., and Ozdogan, M.: Global Land Cover Mapping: A Review and Uncertainty Analysis, Remote Sens., 6, 12070–12093, https://doi.org/10.3390/rs61212070, 2014.
Cox, P. M., Harris, P. P., Huntingford, C., Betts, R. A., Collins, M., Jones, C. D., Jupp, T. E., Marengo, J. A., and Nobre, C. A.: Increasing risk of Amazonian drought due to decreasing aerosol pollution, Nature, 453, 212, https://doi.org/10.1038/nature06960, 2008.
Cracraft, J.: Historical biogeography and patterns of differentiation within the South American avifauna: areas of endemism, Ornithological Monographs, 36, 49–84, 1985.
Crutzen, P. J.: Geology of mankind, Nature, 415, 23–23, https://doi.org/10.1038/415023a, 2002.
Da Silva, J. M. C., Rylands, A. B., and Da Fonseca, G. A. B.: The fate of the Amazonian areas of endemism, Conserv. Biol., 19, 689–694, https://doi.org/10.1111/j.1523-1739.2005.00705.x, 2005.
Davidson, E. A., de Araujo, A. C., Artaxo, P., Balch, J. K., Brown, I. F., Bustamante, M. M. C., Coe, M. T., DeFries, R. S., Keller, M., Longo, M., Munger, J. W., Schroeder, W., Soares-Filho, B. S., Souza, C. M., and Wofsy, S. C.: The Amazon basin in transition, Nature, 481, 321–328, https://doi.org/10.1038/nature10717, 2012.
de Carvalho, W. D. and Mustin, K.: The highly threatened and little known Amazonian savannahs, Nature Ecology & Evolution, 1, 0100, https://doi.org/10.1038/s41559-017-0100, 2017.
Després, V. R., Huffman, J. A., Burrows, S. M., Hoose, C., Safatov, A. S., Buryak, G., Fröhlich-Nowoisky, J., Elbert, W., Andreae, M. O., Pöschl, U., and Jaenicke, R.: Primary biological aerosol particles in the atmosphere: a review, Tellus B, 64, 1–58, https://doi.org/10.3402/tellusb.v64i0.15598, 2012.
Dixon, A. P., Faber-Langendoen, D., Josse, C., Morrison, J., and Loucks, C. J.: Distribution mapping of world grassland types, J. Biogeogr., 41, 2003–2019, https://doi.org/10.1111/jbi.12381, 2014.
Dohm, C., Leal, I. R., Tabarelli, M., Meyer, S. T., and Wirth, R.: Leaf-cutting ants proliferate in the Amazon: an expected response to forest edge?, J. Trop. Ecol., 27, 645–649, https://doi.org/10.1017/s0266467411000447, 2011.
Draxler, R. R. and Hess, G. D.: An overview of the HYSPLIT_4 modelling system for trajectories, dispersion and deposition, Aust. Meteorol. Mag., 47, 295–308, 1998.
Dudley, R., Kaspari, M., and Yanoviak, S. P.: Lust for Salt in the Western Amazon, Biotropica, 44, 6–9, https://doi.org/10.1111/j.1744-7429.2011.00818.x, 2012.
Engle, D. and Melack, J. M.: Methane emissions from an Amazon floodplain lake: Enhanced release during episodic mixing and during falling water, Biogeochemistry, 51, 71–90, https://doi.org/10.1023/a:1006389124823, 2000.
Erfanian, A., Wang, G. L., and Fomenko, L.: Unprecedented drought over tropical South America in 2016: significantly under-predicted by tropical SST, Sci Rep, 7, 5811, https://doi.org/10.1038/s41598-017-05373-2, 2017.
Escudero, M., Stein, A., Draxler, R. R., Querol, X., Alastuey, A., Castillo, S., and Avila, A.: Determination of the contribution of northern Africa dust source areas to PM10 concentrations over the central Iberian Peninsula using the Hybrid Single-Particle Lagrangian Integrated Trajectory model (HYSPLIT) model, J. Geophys. Res.-Atmos., 111, D06210, https://doi.org/10.1029/2005jd006395, 2006.
Espinoza, J. C., Marengo, J. A., Ronchail, J., Carpio, J. M., Flores, L. N., and Guyot, J. L.: The extreme 2014 flood in south-western Amazon basin: the role of tropical-subtropical South Atlantic SST gradient, Environ. Res. Lett., 9, 124007, https://doi.org/10.1088/1748-9326/9/12/124007, 2014.
Fearnside, P. M.: Deforestation in Brazilian Amazonia: History, rates, and consequences, Conserv. Biol., 19, 680–688, https://doi.org/10.1111/j.1523-1739.2005.00697.x, 2005.
Fearnside, P. M. and Graca, P.: BR-319: Brazil's Manaus-Porto Velho highway and the potential impact of linking the arc of deforestation to central Amazonia, Environ. Manage., 38, 705–716, https://doi.org/10.1007/s00267-005-0295-y, 2006.
Fearnside, P. M.: Brazil's Cuiaba-Santarem (BR-163) Highway: The environmental cost of paving a soybean corridor through the amazon, Environ. Manage., 39, 601–614, https://doi.org/10.1007/s00267-006-0149-2, 2007.
Fearnside, P. M. and Pueyo, S., Greenhouse-gas emissions from tropical dams, Nat. Clim. Change, 2, 382–384, 2012.
Fearnside, P. M.: Belo Monte: Actors and arguments in the struggle over Brazil's most controversial Amazonian dam, Erde, 148, 14–26, https://doi.org/10.12854/erde-148-27, 2017.
Fernandes, K., Baethgen, W., Bernardes, S., DeFries, R., DeWitt, D. G., Goddard, L., Lavado, W., Lee, D. E., Padoch, C., Pinedo-Vasquez, M., and Uriarte, M.: North Tropical Atlantic influence on western Amazon fire season variability, Geophys. Res. Lett., 38, L12701, https://doi.org/10.1029/2011gl047392, 2011.
Fernandes, K., Giannini, A., Verchot, L., Baethgen, W., and Pinedo-Vasquez, M.: Decadal covariability of Atlantic SSTs and western Amazon dry-season hydroclimate in observations and CMIP5 simulations, Geophys. Res. Lett., 42, 6793–6801, https://doi.org/10.1002/2015gl063911, 2015.
Fisch, G., Tota, J., Machado, L. A. T., Dias, M., Lyra, R. F. D., Nobre, C. A., Dolman, A. J., and Gash, J. H. C.: The convective boundary layer over pasture and forest in Amazonia, Theor. Appl. Climatol., 78, 47–59, https://doi.org/10.1007/s00704-004-0043-x, 2004.
Fu, R., Dickinson, R. E., Chen, M. X., and Wang, H.: How do tropical sea surface temperatures influence the seasonal distribution of precipitation in the equatorial Amazon?, J. Climate, 14, 4003–4026, 2001.
Gebhart, K. A., Schichtel, B. A., and Barna, M. G.: Directional biases in back trajectories caused by model and input data, J. Air Waste Manage., 55, 1649–1662, 2005.
Gentner, D. R., Jathar, S. H., Gordon, T. D., Bahreini, R., Day, D. A., El Haddad, I., Hayes, P. L., Pieber, S. M., Platt, S. M., de Gouw, J., Goldstein, A. H., Harley, R. A., Jimenez, J. L., Prevot, A. S. H., and Robinson, A. L.: Review of Urban Secondary Organic Aerosol Formation from Gasoline and Diesel Motor Vehicle Emissions, Environ. Sci. Technol., 51, 1074–1093, https://doi.org/10.1021/acs.est.6b04509, 2017.
Gloor, M., Bakwin, P., Hurst, D., Lock, L., Draxler, R., and Tans, P.: What is the concentration footprint of a tall tower?, J. Geophys. Res.-Atmos., 106, 17831–17840, https://doi.org/10.1029/2001jd900021, 2001.
Godar, J., Tizado, E. J., and Pokorny, B.: Who is responsible for deforestation in the Amazon? A spatially explicit analysis along the Transamazon Highway in Brazil, Forest Ecol. Manag., 267, 58–73, https://doi.org/10.1016/j.foreco.2011.11.046, 2012a.
Godar, J., Tizado, E. J., Pokorny, B., and Johnson, J.: Typology and Characterization of Amazon Colonists: A Case Study Along the Transamazon Highway, Hum. Ecol., 40, 251–267, https://doi.org/10.1007/s10745-012-9457-8, 2012b.
Good, P., Lowe, J. A., Collins, M., and Moufouma-Okia, W.: An objective tropical Atlantic sea surface temperature gradient index for studies of south Amazon dry-season climate variability and change, Philos. T. Roy. Soc. B, 363, 1761–1766, https://doi.org/10.1098/rstb.2007.0024, 2008.
Goulding, M., Barthem, R. B., and Duenas, R.: The Smithsonian Atlas of the Amazon, Washington, DC, Smithsonian Books, 253 pp., 2003.
Gorelick, N., Hancher, M., Dixon, M., Ilyushchenko, S., Thau, D., and Moore, R.: Google Earth Engine: Planetary-scale geospatial analysis for everyone, Remote Sens. Environ., 202, 18–27, https://doi.org/10.1016/j.rse.2017.06.031, 2017.
Hamilton, D. S., Lee, L. A., Pringle, K. J., Reddington, C. L., Spracklen, D. V., and Carslaw, K. S.: Occurrence of pristine aerosol environments on a polluted planet, P. Natl. Acad. Sci. USA, 111, 18466–18471, https://doi.org/10.1073/pnas.1415440111, 2014.
Hansen, M. C., Potapov, P. V., Moore, R., Hancher, M., Turubanova, S. A., Tyukavina, A., Thau, D., Stehman, S. V., Goetz, S. J., Loveland, T. R., Kommareddy, A., Egorov, A., Chini, L., Justice, C. O., and Townshend, J. R. G.: High-Resolution Global Maps of 21st-Century Forest Cover Change, Science, 342, 850–853, https://doi.org/10.1126/science.1244693, 2013.
Heckenberger, M. J., Kuikuro, A., Kuikuro, U. T., Russell, J. C., Schmidt, M., Fausto, C., and Franchetto, B.: Amazonia 1492: Pristine forest or cultural parkland?, Science, 301, 1710–1714, https://doi.org/10.1126/science.1086112, 2003.
Hilker, T., Lyapustin, A. I., Tucker, C. J., Hall, F. G., Myneni, R. B., Wang, Y. J., Bi, J., de Moura, Y. M., and Sellers, P. J.: Vegetation dynamics and rainfall sensitivity of the Amazon, P. Natl. Acad. Sci. USA, 111, 16041–16046, https://doi.org/10.1073/pnas.1404870111, 2014.
Huertas, J. I., Huertas, M. E., and Solis, D. A.: Characterization of airborne particles in an open pit mining region, Sci. Total Environ., 423, 39–46, https://doi.org/10.1016/j.scitotenv.2012.01.065, 2012.
Hüser, I., Harder, H., Heil, A., and Kaiser, J. W.: Assumptions about footprint layer heights influence the quantification of emission sources: a case study for Cyprus, Atmos. Chem. Phys., 17, 10955–10967, https://doi.org/10.5194/acp-17-10955-2017, 2017.
Janhäll, S., Andreae, M. O., and Pöschl, U.: Biomass burning aerosol emissions from vegetation fires: particle number and mass emission factors and size distributions, Atmos. Chem. Phys., 10, 1427–1439, https://doi.org/10.5194/acp-10-1427-2010, 2010.
Jin, S., Yang, L., Danielson, P., Homer, C., Fry, J., and Xian, G.: A comprehensive change detection method for updating the National Land Cover Database to circa 2011, Remote Sens. Environ., 132, 159–175, 2013.
Ju, J. and Roy, D. P.: The availability of cloud-free Landsat ETM+ data over the conterminous United States and globally, Remote Sens. Environ., 112, 1196–1211, 2008.
Junk, W. J.: Current state of knowledge regarding South America wetlands and their future under global climate change, Aquat. Sci., 75, 113–131, https://doi.org/10.1007/s00027-012-0253-8, 2013.
Junk, W. J., Fernandez Piedade, M. T., Schoengart, J., and Wittmann, F.: A classification of major natural habitats of Amazonian white-water river floodplains (varzeas), Wetl. Ecol. Manag., 20, 461–475, https://doi.org/10.1007/s11273-012-9268-0, 2012.
Junk, W. J., Wittmann, F., Schoengart, J., and Piedade, M. T. F.: A classification of the major habitats of Amazonian black-water river floodplains and a comparison with their white-water counterparts, Wetl. Ecol. Manag., 23, 677–693, https://doi.org/10.1007/s11273-015-9412-8, 2015.
Kaiser, J. W., Heil, A., Andreae, M. O., Benedetti, A., Chubarova, N., Jones, L., Morcrette, J.-J., Razinger, M., Schultz, M. G., Suttie, M., and van der Werf, G. R.: Biomass burning emissions estimated with a global fire assimilation system based on observed fire radiative power, Biogeosciences, 9, 527–554, https://doi.org/10.5194/bg-9-527-2012, 2012.
Kassambara, A.: Practical Guide to Cluster Analysis in R: Unsupervised Machine Learning, Create Space Independent Publishing Platform, 1–147, 2017.
Kemenes, A., Forsberg, B. R., and Melack, J. M.: Methane release below a tropical hydroelectric dam, Geophys. Res. Lett., 34, L12809, https://doi.org/10.1029/2007gl029479, 2007.
Kottek, M., Grieser, J., Beck, C., Rudolf, B., and Rubel, F.: World map of the Koppen-Geiger climate classification updated, Meteorol. Z., 15, 259–263, https://doi.org/10.1127/0941-2948/2006/0130, 2006.
Kuhn, U., Ganzeveld, L., Thielmann, A., Dindorf, T., Schebeske, G., Welling, M., Sciare, J., Roberts, G., Meixner, F. X., Kesselmeier, J., Lelieveld, J., Kolle, O., Ciccioli, P., Lloyd, J., Trentmann, J., Artaxo, P., and Andreae, M. O.: Impact of Manaus City on the Amazon Green Ocean atmosphere: ozone production, precursor sensitivity and aerosol load, Atmos. Chem. Phys., 10, 9251–9282, https://doi.org/10.5194/acp-10-9251-2010, 2010.
Lammel, G., Bruggermann, E., Gnauk, T., Muller, K., Neususs, C., and Rohrl, A.: A new method to study aerosol source contributions along the tracks of air parcels and its application to the near-ground level aerosol chemical composition in central Europe, J. Aerosol Sci., 34, 1–25, https://doi.org/10.1016/s0021-8502(02)00134-9, 2003.
Laurance, W. F., Albernaz, A. K. M., Schroth, G., Fearnside, P. M., Bergen, S., Venticinque, E. M., and Da Costa, C.: Predictors of deforestation in the Brazilian Amazon, J. Biogeogr., 29, 737–748, https://doi.org/10.1046/j.1365-2699.2002.00721.x, 2002.
Laurance, W. F., Goosem, M., and Laurance, S. G. W.: Impacts of roads and linear clearings on tropical forests, Trends Ecol. Evol., 24, 659–669, https://doi.org/10.1016/j.tree.2009.06.009, 2009.
Laurance, W. F., Camargo, J. L. C., Luizao, R. C. C., Laurance, S. G., Pimm, S. L., Bruna, E. M., Stouffer, P. C., Williamson, G. B., Benitez-Malvido, J., Vasconcelos, H. L., Van Houtan, K. S., Zartman, C. E., Boyle, S. A., Didham, R. K., Andrade, A., and Lovejoy, T. E.: The fate of Amazonian forest fragments: A 32-year investigation, Biol. Conserv., 144, 56–67, https://doi.org/10.1016/j.biocon.2010.09.021, 2011.
Lehner, B., Liermann, C. R., Revenga, C., Vorosmarty, C., Fekete, B., Crouzet, P., Doll, P., Endejan, M., Frenken, K., Magome, J., Nilsson, C., Robertson, J. C., Rodel, R., Sindorf, N., and Wisser, D.: High-resolution mapping of the world's reservoirs and dams for sustainable river-flow management, Front. Ecol. Environ., 9, 494–502, https://doi.org/10.1890/100125, 2011.
Lelieveld, J., Evans, J. S., Fnais, M., Giannadaki, D., and Pozzer, A.: The contribution of outdoor air pollution sources to premature mortality on a global scale, Nature, 525, 367–371, https://doi.org/10.1038/nature15371, 2015.
Lenton, T. M., Held, H., Kriegler, E., Hall, J. W., Lucht, W., Rahmstorf, S., and Schellnhuber, H. J.: Tipping elements in the Earth's climate system, P. Natl. Acad. Sci. USA, 105, 1786–1793, https://doi.org/10.1073/pnas.0705414105, 2008.
Lewis, S. L., Brando, P. M., Phillips, O. L., van der Heijden, G. M. F., and Nepstad, D.: The 2010 Amazon Drought, Science, 331, 554–554, https://doi.org/10.1126/science.1200807, 2011.
Lin, J. C., Matsui, T., Pielke, R. A., and Kummerow, C.: Effects of biomass-burning-derived aerosols on precipitation and clouds in the Amazon Basin: a satellite-based empirical study, J. Geophys. Res.-Atmos., 111, D19204, https://doi.org/10.1029/2005jd006884, 2006.
Ludewigs, T., D'Antona, A. D., Brondizio, E. S., and Hetrick, S.: Agrarian Structure and Land-cover Change Along the Lifespan of Three Colonization Areas in the Brazilian Amazon, World Dev., 37, 1348–1359, https://doi.org/10.1016/j.worlddev.2008.08.018, 2009.
Machado, L. A. T., Calheiros, A. J. P., Biscaro, T., Giangrande, S., Silva Dias, M. A. F., Cecchini, M. A., Albrecht, R., Andreae, M. O., Araujo, W. F., Artaxo, P., Borrmann, S., Braga, R., Burleyson, C., Eichholz, C. W., Fan, J., Feng, Z., Fisch, G. F., Jensen, M. P., Martin, S. T., Pöschl, U., Pöhlker, C., Pöhlker, M. L., Ribaud, J.-F., Rosenfeld, D., Saraiva, J. M. B., Schumacher, C., Thalman, R., Walter, D., and Wendisch, M.: Overview: Precipitation characteristics and sensitivities to environmental conditions during GoAmazon2014/5 and ACRIDICON-CHUVA, Atmos. Chem. Phys., 18, 6461–6482, https://doi.org/10.5194/acp-18-6461-2018, 2018.
MacQueen, J.: Some methods for classification and analysis of multivariate observations, in: Proceedings of the Fifth Berkeley Symposium on Mathematical Statistics and Probability, edited by: Le Cam, L. M. and Neyman, J., University of California Press, Berkeley, 281–297, 1967.
Makowski Giannoni, S., Trachte, K., Rollenbeck, R., Lehnert, L., Fuchs, J., and Bendix, J.: Atmospheric salt deposition in a tropical mountain rainforest at the eastern Andean slopes of south Ecuador – Pacific or Atlantic origin?, Atmos. Chem. Phys., 16, 10241–10261, https://doi.org/10.5194/acp-16-10241-2016, 2016.
Malhi, Y., Roberts, J. T., Betts, R. A., Killeen, T. J., Li, W., and Nobre, C. A.: Climate change, deforestation, and the fate of the Amazon, Science, 319, 169–172, https://doi.org/10.1126/science.1146961, 2008.
Malhi, Y., Aragao, L. E. O. C., Galbraith, D., Huntingford, C., Fisher, R., Zelazowski, P., Sitch, S., McSweeney, C., and Meir, P.: Exploring the likelihood and mechanism of a climate-change-induced dieback of the Amazon rainforest, P. Natl. Acad. Sci. USA, 106, 20610–20615, https://doi.org/10.1073/pnas.0804619106, 2009.
Marengo, J. A., Tomasella, J., Alves, L. M., Soares, W. R., and Rodriguez, D. A.: The drought of 2010 in the context of historical droughts in the Amazon region, Geophys. Res. Lett., 38, L12703, https://doi.org/10.1029/2011gl047436, 2011.
Marengo, J. A. and Espinoza, J. C.: Extreme seasonal droughts and floods in Amazonia: causes, trends and impacts, Int. J. Climatol., 36, 1033–1050, https://doi.org/10.1002/joc.4420, 2016.
Martin, S. T., Andreae, M. O., Althausen, D., Artaxo, P., Baars, H., Borrmann, S., Chen, Q., Farmer, D. K., Guenther, A., Gunthe, S. S., Jimenez, J. L., Karl, T., Longo, K., Manzi, A., Müller, T., Pauliquevis, T., Petters, M. D., Prenni, A. J., Pöschl, U., Rizzo, L. V., Schneider, J., Smith, J. N., Swietlicki, E., Tota, J., Wang, J., Wiedensohler, A., and Zorn, S. R.: An overview of the Amazonian Aerosol Characterization Experiment 2008 (AMAZE-08), Atmos. Chem. Phys., 10, 11415–11438, https://doi.org/10.5194/acp-10-11415-2010, 2010a.
Martin, S. T., Andreae, M. O., Artaxo, P., Baumgardner, D., Chen, Q., Goldstein, A. H., Guenther, A., Heald, C. L., Mayol-Bracero, O. L., McMurry, P. H., Pauliquevis, T., Pöschl, U., Prather, K. A., Roberts, G. C., Saleska, S. R., Dias, M. A. S., Spracklen, D. V., Swietlicki, E., and Trebs, I.: Sources and properties of Amazonian aerosol particles, Rev. Geophys., 48, RG2002, https://doi.org/10.1029/2008rg000280, 2010b.
Martin, S. T., Artaxo, P., Machado, L., Manzi, A. O., Souza, R. A. F., Schumacher, C., Wang, J., Biscaro, T., Brito, J., Calheiros, A., Jardine, K., Medeiros, A., Portela, B., Sá, S. S. d., Adachi, K., Aiken, A. C., Albrecht, R., Alexander, L., Andreae, M. O., Barbosa, H. M. J., Buseck, P., Chand, D., Comstock, J. M., Day, D. A., Dubey, M., Fan, J., Fast, J., Fisch, G., Fortner, E., Giangrande, S., Gilles, M., Goldstein, A. H., Guenther, A., Hubbe, J., Jensen, M., Jimenez, J. L., Keutsch, F. N., Kim, S., Kuang, C., Laskin, A., McKinney, K., Mei, F., Miller, M., Nascimento, R., Pauliquevis, T., Pekour, M., Peres, J., Petäjä, T., Pöhlker, C., Pöschl, U., Rizzo, L., Schmid, B., Shilling, J. E., Dias, M. A. S., Smith, J. N., Tomlinson, J. M., Tóta, J., and Wendisch, M.: The Green Ocean Amazon Experiment (GoAmazon2014/5) Observes Pollution Affecting Gases, Aerosols, Clouds, and Rainfall over the Rain Forest, B. Am. Meteorol. Soc., 981–998, https://doi.org/10.1175/bams-d-15-00221.1, 2016a.
Martin, S. T., Artaxo, P., Machado, L. A. T., Manzi, A. O., Souza, R. A. F., Schumacher, C., Wang, J., Andreae, M. O., Barbosa, H. M. J., Fan, J., Fisch, G., Goldstein, A. H., Guenther, A., Jimenez, J. L., Pöschl, U., Silva Dias, M. A., Smith, J. N., and Wendisch, M.: Introduction: Observations and Modeling of the Green Ocean Amazon (GoAmazon2014/5), Atmos. Chem. Phys., 16, 4785–4797, https://doi.org/10.5194/acp-16-4785-2016, 2016b.
McMichael, C. H., Palace, M. W., Bush, M. B., Braswell, B., Hagen, S., Neves, E. G., Silman, M. R., Tamanaha, E. K., and Czarnecki, C.: Predicting pre-Columbian anthropogenic soils in Amazonia, P. Roy. Soc. B-Biol. Sci., 281, https://doi.org/10.1098/rspb.2013.2475, 2014.
McMichael, C. N. H., Matthews-Bird, F., Farfan-Rios, W., and Feeley, K. J.: Ancient human disturbances may be skewing our understanding of Amazonian forests, P. Natl. Acad. Sci. USA, 114, 522–527, https://doi.org/10.1073/pnas.1614577114, 2017.
Moran-Zuloaga, D., Ditas, F., Walter, D., Saturno, J., Brito, J., Carbone, S., Chi, X., Hrabe de Angelis, I., Baars, H., Godoi, R. H. M., Heese, B., Holanda, B. A., Lavric, J. V., Martin, S. T., Ming, J., Pöhlker, M. L., Ruckteschler, N., Su, H., Wang, Y., Wang, Q., Wang, Z., Weber, B., Wolff, S., Artaxo, P., Pöschl, U., Andreae, M. O., and Pöhlker, C.: Long-term study on coarse mode aerosols in the Amazon rain forest with the frequent intrusion of Saharan dust plumes, Atmos. Chem. Phys., 18, 10055–10088, https://doi.org/10.5194/acp-18-10055-2018, 2018.
Morton, D. C., DeFries, R. S., Shimabukuro, Y. E., Anderson, L. O., Arai, E., Espirito-Santo, F. D. B., Freitas, R., and Morisette, J.: Cropland expansion changes deforestation dynamics in the southern Brazilian Amazon, P. Natl. Acad. Sci. USA, 103, 14637–14641, https://doi.org/10.1073/pnas.0606377103, 2006.
Morton, D. C., DeFries, R. S., Nagol, J., Souza, C. M., Kasischke, E. S., Hurtt, G. C., and Dubayah, R.: Mapping canopy damage from understory fires in Amazon forests using annual time series of Landsat and MODIS data, Remote Sens. Environ., 115, 1706–1720, https://doi.org/10.1016/j.rse.2011.03.002, 2011.
Müller, H., Griffiths, P., and Hostert, P.: Long-term deforestation dynamics in the Brazilian Amazon-Uncovering historic frontier development along the Cuiaba-Santarem highway, Int. J. Appl. Earth Obs., 44, 61–69, https://doi.org/10.1016/j.jag.2015.07.005, 2016.
Myster, R. W.: The Physical Structure of Forests in the Amazon Basin: a Review, Bot. Rev., 82, 407–427, https://doi.org/10.1007/s12229-016-9174-x, 2016.
Naka, L. N.: Avian distribution patterns in the Guiana Shield: implications for the delimitation of Amazonian areas of endemism, J. Biogeogr., 38, 681–696, https://doi.org/10.1111/j.1365-2699.2010.02443.x, 2011.
Nepstad, D. C., Verissimo, A., Alencar, A., Nobre, C., Lima, E., Lefebvre, P., Schlesinger, P., Potter, C., Moutinho, P., Mendoza, E., Cochrane, M., and Brooks, V.: Large-scale impoverishment of Amazonian forests by logging and fire, Nature, 398, 505–508, https://doi.org/10.1038/19066, 1999.
Nepstad, D., Carvalho, G., Barros, A. C., Alencar, A., Capobianco, J. P., Bishop, J., Moutinho, P., Lefebvre, P., Silva, U. L., and Prins, E.: Road paving, fire regime feedbacks, and the future of Amazon forests, Forest Ecol. Manage., 154, 395–407, https://doi.org/10.1016/s0378-1127(01)00511-4, 2001.
Nepstad, D., Schwartzman, S., Bamberger, B., Santilli, M., Ray, D., Schlesinger, P., Lefebvre, P., Alencar, A., Prinz, E., Fiske, G., and Rolla, A.: Inhibition of Amazon deforestation and fire by parks and indigenous lands, Conserv. Biol., 20, 65–73, https://doi.org/10.1111/j.1523-1739.2006.00351.x, 2006.
Nepstad, D. C., Stickler, C. M., Soares, B., and Merry, F.: Interactions among Amazon land use, forests and climate: prospects for a near-term forest tipping point, Philos. T. Roy. Soc. B, 363, 1737–1746, https://doi.org/10.1098/rstb.2007.0036, 2008.
Nölscher, A. C., Yáñez-Serrano, A. M., Wolff, S., de Araujo, A. C., Lavric, J. V., Kesselmeier, J., and Williams, J.: Unexpected seasonality in quantity and composition of Amazon rainforest air reactivity, Nat. Commun., 7, 10383, https://doi.org/10.1038/ncomms10383, 2016.
Nolte, C., Agrawal, A., Silvius, K. M., and Soares, B. S.: Governance regime and location influence avoided deforestation success of protected areas in the Brazilian Amazon, P. Natl. Acad. Sci. USA, 110, 4956–4961, https://doi.org/10.1073/pnas.1214786110, 2013.
Oliveira, U., Vasconcelos, M. F., and Santos, A. J.: Biogeography of Amazon birds: rivers limit species composition, but not areas of endemism, Sci. Rep., 7, 2992, https://doi.org/10.1038/s41598-017-03098-w, 2017.
Oliveira, P. E. S., Acevedo, O. C., Sörgel, M., Tsokankunku, A., Wolff, S., Araújo, A. C., Souza, R. A. F., Sá, M. O., Manzi, A. O., and Andreae, M. O.: Nighttime wind and scalar variability within and above an Amazonian canopy, Atmos. Chem. Phys., 18, 3083–3099, https://doi.org/10.5194/acp-18-3083-2018, 2018.
Olson, D. M., Dinerstein, E., Wikramanayake, E. D., Burgess, N. D., Powell, G. V. N., Underwood, E. C., D'amico, J. A., Itoua, I., Strand, H. E., Morrison, J. C., Loucks, C. J., Allnutt, T. F., Ricketts, T. H., Kura, Y., Lamoreux, J. F., Wettengel, W. W., Hedao, P., and Kassem, K. R.: Terrestrial Ecoregions of the World: A New Map of Life on Earth, Bioscience, 51, 933–938, https://doi.org/10.1641/0006-3568(2001)051[0933:teotwa]2.0.co;2, 2001.
Pacheco, P.: Actor and frontier types in the Brazilian Amazon: Assessing interactions and outcomes associated with frontier expansion, Geoforum, 43, 864–874, https://doi.org/10.1016/j.geoforum.2012.02.003, 2012.
Peel, M. C., Finlayson, B. L., and McMahon, T. A.: Updated world map of the Köppen-Geiger climate classification, Hydrol. Earth Syst. Sci., 11, 1633–1644, https://doi.org/10.5194/hess-11-1633-2007, 2007.
Pereira, R., Simmons, C. S., and Walker, R.: Smallholders, Agrarian Reform, and Globalization in the Brazilian Amazon: Cattle versus the Environment, Land, 5, 1–15, https://doi.org/10.3390/land5030024, 2016.
Pettorelli, N., Ryan, S., Mueller, T., Bunnefeld, N., Jedrzejewska, B., Lima, M., and Kausrud, K.: The Normalized Difference Vegetation Index (NDVI): unforeseen successes in animal ecology, Clim. Res., 46, 15–27, https://doi.org/10.3354/cr00936, 2011.
Piperno, D. R., McMichael, C., and Bush, M. B.: Amazonia and the Anthropocene: What was the spatial extent and intensity of human landscape modification in the Amazon Basin at the end of prehistory?, Holocene, 25, 1588–1597, https://doi.org/10.1177/0959683615588374, 2015.
Pöhlker, M. L., Pöhlker, C., Ditas, F., Klimach, T., Hrabe de Angelis, I., Araújo, A., Brito, J., Carbone, S., Cheng, Y., Chi, X., Ditz, R., Gunthe, S. S., Kesselmeier, J., Könemann, T., Lavric, J. V., Martin, S. T., Mikhailov, E., Moran-Zuloaga, D., Rose, D., Saturno, J., Su, H., Thalman, R., Walter, D., Wang, J., Wolff, S., Barbosa, H. M. J., Artaxo, P., Andreae, M. O., and Pöschl, U.: Long-term observations of cloud condensation nuclei in the Amazon rain forest – Part 1: Aerosol size distribution, hygroscopicity, and new model parametrizations for CCN prediction, Atmos. Chem. Phys., 16, 15709–15740, https://doi.org/10.5194/acp-16-15709-2016, 2016.
Pöhlker, M. L., Ditas, F., Saturno, J., Klimach, T., Hrabe de Angelis, I., Araùjo, A. C., Brito, J., Carbone, S., Cheng, Y., Chi, X., Ditz, R., Gunthe, S. S., Holanda, B. A., Kandler, K., Kesselmeier, J., Könemann, T., Krüger, O. O., Lavric, J. V., Martin, S. T., Mikhailov, E., Moran-Zuloaga, D., Rizzo, L. V., Rose, D., Su, H., Thalman, R., Walter, D., Wang, J., Wolff, S., Barbosa, H. M. J., Artaxo, P., Andreae, M. O., Pöschl, U., and Pöhlker, C.: Long-term observations of cloud condensation nuclei over the Amazon rain forest – Part 2: Variability and characteristics of biomass burning, long-range transport, and pristine rain forest aerosols, Atmos. Chem. Phys., 18, 10289–10331, https://doi.org/10.5194/acp-18-10289-2018, 2018.
Pöhlker, C.: Available data for ATTO backward trajectory and landcover study, available at: https://doi.org/10.17617/3.2g, last access: 27 June 2019.
Potapov, P., Hansen, M. C., Laestadius, L., Turubanova, S., Yaroshenko, A., Thies, C., Smith, W., Zhuravleva, I., Komarova, A., Minnemeyer, S., and Esipova, E.: The last frontiers of wilderness: Tracking loss of intact forest landscapes from 2000 to 2013, Science Advances, 3, https://doi.org/10.1126/sciadv.1600821, 2017.
Reinmuth-Selzle, K., Kampf, C. J., Lucas, K., Lang-Yona, N., Frohlich-Nowoisky, J., Shiraiwa, M., Lakey, P. S. J., Lai, S. C., Liu, F. B., Kunert, A. T., Ziegler, K., Shen, F. X., Sgarbanti, R., Weber, B., Bellinghausen, I., Saloga, J., Weller, M. G., Duschl, A., Schuppan, D., and Pöschl, U.: Air Pollution and Climate Change Effects on Allergies in the Anthropocene: Abundance, Interaction, and Modification of Allergens and Adjuvants, Environ. Sci. Technol., 51, 4119–4141, https://doi.org/10.1021/acs.est.6b04908, 2017.
Ricketts, T. H., Soares-Filho, B., da Fonseca, G. A. B., Nepstad, D., Pfaff, A., Petsonk, A., Anderson, A., Boucher, D., Cattaneo, A., Conte, M., Creighton, K., Linden, L., Maretti, C., Moutinho, P., Ullman, R., and Victurine, R.: Indigenous Lands, Protected Areas, and Slowing Climate Change, Plos Biol., 8, e1000331, https://doi.org/10.1371/journal.pbio.1000331, 2010.
Rizzolo, J. A., Barbosa, C. G. G., Borillo, G. C., Godoi, A. F. L., Souza, R. A. F., Andreoli, R. V., Manzi, A. O., Sá, M. O., Alves, E. G., Pöhlker, C., Angelis, I. H., Ditas, F., Saturno, J., Moran-Zuloaga, D., Rizzo, L. V., Rosário, N. E., Pauliquevis, T., Santos, R. M. N., Yamamoto, C. I., Andreae, M. O., Artaxo, P., Taylor, P. E., and Godoi, R. H. M.: Soluble iron nutrients in Saharan dust over the central Amazon rainforest, Atmos. Chem. Phys., 17, 2673–2687, https://doi.org/10.5194/acp-17-2673-2017, 2017.
Ronchail, J., Cochonneau, G., Molinier, M., Guyot, J. L., Chaves, A. G. D., Guimaraes, V., and de Oliveira, E.: Interannual rainfall variability in the Amazon basin and sea-surface temperatures in the equatorial Pacific and the tropical Atlantic Oceans, Int. J. Climatol., 22, 1663–1686, https://doi.org/10.1002/joc.815, 2002.
Rosenfeld, D., Lohmann, U., Raga, G. B., O'Dowd, C. D., Kulmala, M., Fuzzi, S., Reissell, A., and Andreae, M. O.: Flood or drought: How do aerosols affect precipitation?, Science, 321, 1309–1313, https://doi.org/10.1126/science.1160606, 2008.
Rousseeuw, P. J.: Silhouettes – A Graphical aid to the interpretation and validation of cluster-analysis, J. Comput. Appl. Math., 20, 53–65, https://doi.org/10.1016/0377-0427(87)90125-7, 1987.
Rubel, F. and Kottek, M.: Observed and projected climate shifts 1901–2100 depicted by world maps of the Koppen-Geiger climate classification, Meteorol. Z., 19, 135–141, https://doi.org/10.1127/0941-2948/2010/0430, 2010.
Sanderson, E. W., Jaiteh, M., Levy, M. A., Redford, K. H., Wannebo, A. V., and Woolmer, G.: The human footprint and the last of the wild, Bioscience, 52, 891-904, https://doi.org/10.1641/0006-3568(2002)052[0891:thfatl]2.0.co;2, 2002.
Saturno, J., Ditas, F., Penning de Vries, M., Holanda, B. A., Pöhlker, M. L., Carbone, S., Walter, D., Bobrowski, N., Brito, J., Chi, X., Gutmann, A., Hrabe de Angelis, I., Machado, L. A. T., Moran-Zuloaga, D., Rüdiger, J., Schneider, J., Schulz, C., Wang, Q., Wendisch, M., Artaxo, P., Wagner, T., Pöschl, U., Andreae, M. O., and Pöhlker, C.: African volcanic emissions influencing atmospheric aerosols over the Amazon rain forest, Atmos. Chem. Phys., 18, 10391–10405, https://doi.org/10.5194/acp-18-10391-2018, 2018a.
Saturno, J., Holanda, B. A., Pöhlker, C., Ditas, F., Wang, Q., Moran-Zuloaga, D., Brito, J., Carbone, S., Cheng, Y., Chi, X., Ditas, J., Hoffmann, T., Hrabe de Angelis, I., Könemann, T., Lavric, J. V., Ma, N., Ming, J., Paulsen, H., Pöhlker, M. L., Rizzo, L. V., Schlag, P., Su, H., Walter, D., Wolff, S., Zhang, Y., Artaxo, P., Pöschl, U., and Andreae, M. O.: Black and brown carbon over central Amazonia: long-term aerosol measurements at the ATTO site, Atmos. Chem. Phys., 18, 12817–12843, https://doi.org/10.5194/acp-18-12817-2018, 2018b.
Schmid, H. P.: Footprint modeling for vegetation atmosphere exchange studies: a review and perspective, Agr. Forest Meteorol., 113, 159–183, https://doi.org/10.1016/s0168-1923(02)00107-7, 2002.
Schucknecht, A., Erasmi, S., Niemeyer, I., and Matschullat, J.: Assessing vegetation variability and trends in north-eastern Brazil using AVHRR and MODIS NDVI time series, Eur. J. Remote Sens., 46, 40–59, https://doi.org/10.5721/EuJRS20134603, 2013.
Schwartzman, S., Moreira, A., and Nepstad, D.: Rethinking tropical forest conservation: Perils in parks, Conserv. Biol., 14, 1351–1357, https://doi.org/10.1046/j.1523-1739.2000.99329.x, 2000.
Shpund, J., Pinsky, M., and Khain, A.: Microphysical Structure of the Marine Boundary Layer under Strong Wind and Spray Formation as Seen from Simulations Using a 2-D Explicit Microphysical Model, Part I: The Impact of Large Eddies, J. Atmos. Sci., 68, 2366–2384, https://doi.org/10.1175/2011JAS3652.1, 2011.
Silva, F. B., Shimabukuro, Y. E., Aragao, L., Anderson, L. O., Pereira, G., Cardozo, F., and Arai, E.: Large-scale heterogeneity of Amazonian phenology revealed from 26-year long AVHRR/NDVI time-series, Environ. Res. Lett., 8, 024011, https://doi.org/10.1088/1748-9326/8/2/024011, 2013.
Soares, B., Alencar, A., Nepstad, D., Cerqueira, G., Diaz, M. D. V., Rivero, S., Solorzano, L., and Voll, E.: Simulating the response of land-cover changes to road paving and governance along a major Amazon highway: the Santarem-Cuiaba corridor, Global Change Biol., 10, 745–764, https://doi.org/10.1111/j.1529-8817.2003.00769.x, 2004.
Soares, B., Rajao, R., Macedo, M., Carneiro, A., Costa, W., Coe, M., Rodrigues, H., and Alencar, A.: Land use Cracking Brazil's Forest Code, Science, 344, 363–364, https://doi.org/10.1126/science.1246663, 2014.
Soares-Filho, B. S., Nepstad, D. C., Curran, L. M., Cerqueira, G. C., Garcia, R. A., Ramos, C. A., Voll, E., McDonald, A., Lefebvre, P., and Schlesinger, P.: Modelling conservation in the Amazon basin, Nature, 440, 520–523, https://doi.org/10.1038/nature04389, 2006.
Soares-Filho, B. S., Nepstad, D. C., Curran, L. M., Voll, E., Garcia, R. A., Ramos, C. A., McDonald, A. J., Lefebvre, P. A., and Schlesinger, P.: LBA-ECO LC-14 Modeled Deforestation Scenarios, Amazon Basin: 2002–2050, ORNL DAAC, Oak Ridge, Tennessee, USA, https://doi.org/10.3334/ORNLDAAC/1153, 2013.
Song, X. P., Hansen, M. C., Stehman, S. V., Potapov, P. V., Tyukavina, A., Vermote, E. F., and Townshend, J. R.: Global land change from 1982 to 2016, Nature, 560, 639–643, https://doi.org/10.1038/s41586-018-0411-9, 2018.
Souza, C. M.: Mapping land use of tropical regions from space, P. Natl. Acad. Sci. USA, 103, 14261–14262, https://doi.org/10.1073/pnas.0606804103, 2006.
Souza, C. M., Siqueira, J. V., Sales, M. H., Fonseca, A. V., Ribeiro, J. G., Numata, I., Cochrane, M. A., Barber, C. P., Roberts, D. A., and Barlow, J.: Ten-Year Landsat Classification of Deforestation and Forest Degradation in the Brazilian Amazon, Remote Sens., 5, 5493–5513, https://doi.org/10.3390/rs5115493, 2013.
Stein, A. F., Draxler, R. R., Rolph, G. D., Stunder, B. J. B., Cohen, M. D., and Ngan, F.: NOAA'S HYSPLIT Atmospheric transport and dispersion modeling system, B. Am. Meteorol. Soc., 96, 2059–2077, https://doi.org/10.1175/BAMS-D-14-00110.1, 2015.
Steinley, D.: K-means clustering: A half-century synthesis, Brit. J. Math. Stat. Psy., 59, 1–34, https://doi.org/10.1348/000711005x48266, 2006.
Stocker, T. F., Qin, D., Plattner, G.-K., Tignor, M., Allen, S. K., Boschung, J., Nauels, A., Xia, Y., Bex, V., and Midgley, P. M.: IPCC, 2013: Climate Change 2013: The Physical Science Basis, Contribution of Working Group I to the Fifth Assessment Report of the Intergovernmental Panel on Climate Change, Cambridge University Press, Cambridge, United Kingdom and New York, NY, USA, 1–1308, 2013.
Stohl, A., Hittenberger, M., and Wotawa, G.: Validation of the Lagrangian particle dispersion model FLEXPART against large-scale tracer experiment data, Atmos. Environ., 32, 4245–4264, https://doi.org/10.1016/s1352-2310(98)00184-8, 1998.
Stohl, A. and Thomson, D. J.: A density correction for Lagrangian particle dispersion models, Bound.-Lay. Meteorol., 90, 155–167, https://doi.org/10.1023/a:1001741110696, 1999.
Stohl, A., Forster, C., Frank, A., Seibert, P., and Wotawa, G.: Technical note: The Lagrangian particle dispersion model FLEXPART version 6.2, Atmos. Chem. Phys., 5, 2461–2474, https://doi.org/10.5194/acp-5-2461-2005, 2005.
Talbot, R. W., Andreae, M. O., Berresheim, H., Artaxo, P., Garstang, M., Harriss, R. C., Beecher, K. M., and Li, S. M.: Aerosol chemistry during the wet season in central amazonia – the influence of long-range transport, J. Geophys. Res.-Atmos., 95, 16955–16969, https://doi.org/10.1029/JD095iD10p16955, 1990.
Tang, W. and Arellano, A. F.: Investigating dominant characteristics of fires across the Amazon during 2005–2014 through satellite data synthesis of combustion signatures, J. Geophys. Res.-Atmos., 122, 1224–1245, https://doi.org/10.1002/2016jd025216, 2017.
ter Steege, H., Pitman, N. C. A., Killeen, T. J., Laurance, W. F., Peres, C. A., Guevara, J. E., Salomao, R. P., Castilho, C. V., Amaral, I. L., Matos, F. D. D., Coelho, L. D., Magnusson, W. E., Phillips, O. L., Lima, D. D., Carim, M. D. V., Irume, M. V., Martins, M. P., Molino, J. F., Sabatier, D., Wittmann, F., Lopez, D. C., Guimaraes, J. R. D., Mendoza, A. M., Vargas, P. N., Manzatto, A. G., Reis, N. F. C., Terborgh, J., Casula, K. R., Montero, J. C., Feldpausch, T. R., Coronado, E. N. H., Montoya, A. J. D., Zartman, C. E., Mostacedo, B., Vasquez, R., Assis, R. L., Medeiros, M. B., Simon, M. F., Andrade, A., Camargo, J. L., Laurance, S. G. W., Nascimento, H. E. M., Marimon, B. S., Marimon, B. H., Costa, F., Targhetta, N., Vieira, I. C. G., Brienen, R., Castellanos, H., Duivenvoorden, J. F., Mogollon, H. F., Piedade, M. T. F., Aymard, G. A., Comiskey, J. A., Damasco, G., Davila, N., Garcia-Villacorta, R., Diaz, P. R. S., Vincentini, A., Emilio, T., Levis, C., Schietti, J., Souza, P., Alonso, A., Dallmeier, F., Ferreira, L. V., Neill, D., Araujo-Murakami, A., Arroyo, L., Carvalho, F. A., Souza, F. C., do Amaral, D. D., Gribel, R., Luize, B. G., Pansonato, M. P., Venticinque, E., Fine, P., Toledo, M., Baraloto, C., Ceron, C., Engel, J., Henkel, T. W., Jimenez, E. M., Maas, P., Mora, M. C. P., Petronelli, P., Revilla, J. D. C., Silveira, M., Stropp, J., Thomas-Caesar, R., Baker, T. R., Daly, D., Paredes, M. R., da Silva, N. F., Fuentes, A., Jorgensen, P. M., Schongart, J., Silman, M. R., Arboleda, N. C., Cintra, B. B. L., Valverde, F. C., Di Fiore, A., Phillips, J. F., van Andel, T. R., von Hildebrand, P., Barbosa, E. M., Bonates, L. C. D., de Castro, D., Farias, E. D., Gonzales, T., Guillaumet, J. L., Hoffman, B., Malhi, Y., Miranda, I. P. D., Prieto, A., Rudas, A., Ruschell, A. R., Silva, N., Vela, C. I. A., Vos, V. A., Zent, E. L., Zent, S., Cano, A., Nascimento, M. T., Oliveira, A. A., Ramirez-Angulo, H., Ramos, J. F., Sierra, R., Tirado, M., Medina, M. N. U., van der Heijden, G., Torre, E. V., Vriesendorp, C., Wang, O., Young, K. R., Baider, C., Balslev, H., de Castro, N., Farfan-Rios, W., Ferreira, C., Mendoza, C., Mesones, I., Torres-Lezama, A., Giraldo, L. E. U., Villarroel, D., Zagt, R., Alexiades, M. N., Garcia-Cabrera, K., Hernandez, L., Huamantupa-Chuquimaco, I., Milliken, W., Cuenca, W. P., Pansini, S., Pauletto, D., Arevalo, F. R., Sampaio, A. F., Sandoval, E. H. V., and Gamarra, L. V.: Estimating the global conservation status of more than 15,000 Amazonian tree species, Science Advances, 1, e1500936, https://doi.org/10.1126/sciadv.1500936, 2015.
Thompson, R. L., Manning, A. C., Gloor, E., Schultz, U., Seifert, T., Hänsel, F., Jordan, A., and Heimann, M.: In-situ measurements of oxygen, carbon monoxide and greenhouse gases from Ochsenkopf tall tower in Germany, Atmos. Meas. Tech., 2, 573–591, https://doi.org/10.5194/amt-2-573-2009, 2009.
Tollefson, J.: Deforestation spikes in Brazilian Amazon, Nature, 540, p. 182, https://doi.org/10.1038/nature.2016.21083, 2016.
Trebs, I., Mayol-Bracero, O. L., Pauliquevis, T., Kuhn, U., Sander, R., Ganzeveld, L., Meixner, F. X., Kesselmeier, J., Artaxo, P., and Andreae, M. O.: Impact of the Manaus urban plume on trace gas mixing ratios near the surface in the Amazon Basin: Implications for the NO-NO2-O3 photostationary state and peroxy radical levels, J. Geophys. Res.-Atmos., 117, D05307, https://doi.org/10.1029/2011JD016386, 2012.
Tyaquiçã, P., Veleda, D., Lefèvre, N., Araujo, M., Noriega, C., Caniaux, G., Servain, J., and Silva, T.: Amazon Plume Salinity Response to Ocean Teleconnections, Front. Mar. Sci., 4, 250, https://doi.org/10.3389/fmars.2017.00250, 2017.
Tyukavina, A., Hansen, M. C., Potapov, P. V., Stehman, S. V., Smith-Rodriguez, K., Okpa, C., and Aguilar, R.: Types and rates of forest disturbance in Brazilian Legal Amazon, 2000–2013, Science Advances, 3, 15, https://doi.org/10.1126/sciadv.1601047, 2017.
Uhl, C., and Kauffman, J. B.: Deforestation, fire susceptibility, and potential tree responses to fire in the eastern amazon, Ecology, 71, 437–449, https://doi.org/10.2307/1940299, 1990.
Wang, J., Krejci, R., Giangrande, S., Kuang, C., Barbosa, H. M. J., Brito, J., Carbone, S., Chi, X., Comstock, J., Ditas, F., Lavric, J., Manninen, H. E., Mei, F., Moran-Zuloaga, D., Pöhlker, C., Pöhlker, M. L., Saturno, J., Schmid, B., Souza, R. A. F., Springston, S. R., Tomlinson, J. M., Toto, T., Walter, D., Wimmer, D., Smith, J. N., Kulmala, M., Machado, L. A. T., Artaxo, P., Andreae, M. O., Petäjä, T., and Martin, S. T.: Amazon boundary layer aerosol concentration sustained by vertical transport during rainfall, Nature, 539, 416–419, https://doi.org/10.1038/nature19819, 2016a.
Wang, Q., Saturno, J., Chi, X., Walter, D., Lavric, J. V., Moran-Zuloaga, D., Ditas, F., Pöhlker, C., Brito, J., Carbone, S., Artaxo, P., and Andreae, M. O.: Modeling investigation of light-absorbing aerosols in the Amazon Basin during the wet season, Atmos. Chem. Phys., 16, 14775–14794, https://doi.org/10.5194/acp-16-14775-2016, 2016b.
Weiss, D. J., Nelson, A., Gibson, H. S., Temperley, W., Peedell, S., Lieber, A., Hancher, M., Poyart, E., Belchior, S., Fullman, N., Mappin, B., Dalrymple, U., Rozier, J., Lucas, T. C. D., Howes, R. E., Tusting, L. S., Kang, S. Y., Cameron, E., Bisanzio, D., Battle, K. E., Bhatt, S., and Gething, P. W.: A global map of travel time to cities to assess inequalities in accessibility in 2015, Nature, 553, 333–336, https://doi.org/10.1038/nature25181, 2018.
Winderlich, J., Chen, H., Gerbig, C., Seifert, T., Kolle, O., Lavric, J. V., Kaiser, C., Höfer, A., and Heimann, M.: Continuous low-maintenance CO2/CH4/H2O measurements at the Zotino Tall Tower Observatory (ZOTTO) in Central Siberia, Atmos. Meas. Tech., 3, 1113–1128, https://doi.org/10.5194/amt-3-1113-2010, 2010.
Wirth, R., Meyer, S. T., Almeida, W. R., Araujo, M. V., Barbosa, V. S., and Leal, I. R.: Increasing densities of leaf-cutting ants (Atta spp.) with proximity to the edge in a Brazilian Atlantic forest, J. Trop. Ecol., 23, 501–505, https://doi.org/10.1017/s0266467407004221, 2007.
Wittmann, F., Junk, W. J., and Piedade, M. T. F.: The varzea forests in Amazonia: flooding and the highly dynamic geomorphology interact with natural forest succession, Forest Ecol. Manage., 196, 199–212, https://doi.org/10.1016/j.foreco.2004.02.060, 2004.
Wu, J., Albert, L. P., Lopes, A. P., Restrepo-Coupe, N., Hayek, M., Wiedemann, K. T., Guan, K., Stark, S. C., Christoffersen, B., Prohaska, N., Tavares, J. V., Marostica, S., Kobayashi, H., Ferreira, M. L., Campos, K. S., da Silva, R., Brando, P. M., Dye, D. G., Huxman, T. E., Huete, A. R., Nelson, B. W., and Saleska, S. R., Leaf development and demography explain photosynthetic seasonality in Amazon evergreen forests, Science, 351, 972–976, https://doi.org/10.1126/science.aad5068, 2016.
Xie, S. P., Deser, C., Vecchi, G. A., Collins, M., Delworth, T. L., Hall, A., Hawkins, E., Johnson, N. C., Cassou, C., Giannini, A., and Watanabe, M.: Towards predictive understanding of regional climate change, Nat. Clim. Change, 5, 921–930, https://doi.org/10.1038/nclimate2689, 2015.
Yáñez-Serrano, A. M., Nölscher, A. C., Bourtsoukidis, E., Gomes Alves, E., Ganzeveld, L., Bonn, B., Wolff, S., Sa, M., Yamasoe, M., Williams, J., Andreae, M. O., and Kesselmeier, J.: Monoterpene chemical speciation in a tropical rainforest:variation with season, height, and time of dayat the Amazon Tall Tower Observatory (ATTO), Atmos. Chem. Phys., 18, 3403–3418, https://doi.org/10.5194/acp-18-3403-2018, 2018.
Zelazowski, P., Malhi, Y., Huntingford, C., Sitch, S., and Fisher, J. B.: Changes in the potential distribution of humid tropical forests on a warmer planet, Philos. T. Roy. Soc. A, 369, 137–160, https://doi.org/10.1098/rsta.2010.0238, 2011.
Zeng, N., Yoon, J. H., Marengo, J. A., Subramaniam, A., Nobre, C. A., Mariotti, A., and Neelin, J. D.: Causes and impacts of the 2005 Amazon drought, Environ. Res. Lett., 3, 014002, https://doi.org/10.1088/1748-9326/3/1/014002, 2008.
Zhao, W. Q., Zhao, X., Zhou, T., Wu, D. H., Tang, B. J., and Wei, H.: Climatic factors driving vegetation declines in the 2005 and 2010 Amazon droughts, Plos One, 12, 1–19, https://doi.org/10.1371/journal.pone.0175379, 2017.
This time period from January 2008 to June 2016 was chosen for two main reasons: (i) it includes 8.5 years of BT data, which is a comparatively broad statistical basis to retrieve characteristic BT clusters for the ATTO region. (ii) It includes the AMAZE-08 campaign at the ZF2 site (February and March 2008; Martin et al., 2010a), which brought together a comprehensive set of instrumentation and represents the starting point of continuous atmospheric observations in the region, operational since 2008 at the ZF2 site and also since 2011 at the ATTO site.
Sanderson et al. (2002) used selected proxies for contemporary human influence, such as population density, land transformation, and infrastructure as a basis to define the last-of-the-wild areas. Note here that the last-of-the-wild map provides only a very general visualization of biosphere regions in untouched state for the following reasons: (i) the map represents the status prior to the year 2000, which means that since then the geographic extent of the last-of-the-wild regions likely has shrunk substantially, (ii) within regions with human influence the severity of human impact/pressure on the biosphere can be rather variable, and (iii) the specification of regions with human influence does clearly not account of the complexity of human activities and their interaction with the biosphere. A more detailed discussion along these lines can be found in Sanderson et al. (2002).
For this calculation, the following numbers have been used: Fearnside (2005) reported a total deforested area of ∼650 000 km2 by 2003. From 2004 to 2017, a further ∼150 000 km2 has been deforested according to http://www.obt.inpe.br/OBT/assuntos/programas/amazonia/prodes (last access: 23 February 2018). The original rain forest area in Brazil was estimated as ∼4 000 000 km2 (Fearnside, 2005).
The term “largeholder” is frequently used as the opposite of smallholder in the literature on deforestation (e.g., Godar et al., 2012a, b; Pacheco, 2012). We have adopted this notation here.
The calculations are based on the annually deforested area of ∼27 800 km2 for 2004 and 4600 km2 for 2012 according to http://www.obt.inpe.br/OBT/assuntos/programas/amazonia/prodes (last access: 23 February 2018) and a total rain forest area of km2 according to Goulding et al. (2003).
See, for example, Ministros assinam contrato que estuda ligação de RR ao Pará pela BR-210. GLOBO G1 (27 June 2016); http://go.nature.com/2lYa3sa (last access: 25 March 2018).
Annual forest loss of ∼400 ha yr−1 was obtained from http://www.globalforestwatch.org/ (last access: 18 November 2017) and has been documented from 2001 to 2016. The total mine-related deforested area corresponds to about 6200 ha.
Some information on the initiative can be found here: https://wwf.panda.org/?309330/WWF-statement-on-Brazil-governments-decision-to-open-up-a-national-reserve-in-the-Amazon-for-mining (last access: 14 November 2017).
- Abstract
- Introduction
- Methods and data analysis
- Results and discussion
- Summary and conclusions
- Data availability
- Appendix A: List of acronyms, abbreviations, and symbols
- Author contributions
- Competing interests
- Special issue statement
- Acknowledgements
- Financial support
- Review statement
- References
- Supplement