the Creative Commons Attribution 4.0 License.
the Creative Commons Attribution 4.0 License.
 | 05 Jun 2019
2005–2017 ozone trends and potential benefits of local measures as deduced from air quality measurements in the north of the Barcelona metropolitan area
Jordi Massagué
Cristina Carnerero
Miguel Escudero
José María Baldasano
Andrés Alastuey
Xavier Querol
We analyzed 2005–2017 data sets on ozone (O3) concentrations in an area (the Vic Plain) frequently affected by the atmospheric plume northward transport of the Barcelona metropolitan area (BMA), the atmospheric basin of Spain recording the highest number of exceedances of the hourly O3 information threshold (180 µg m−3). We aimed at evaluating the potential benefits of implementing local-BMA short-term measures to abate emissions of precursors. To this end, we analyzed in detail spatial and time variations of concentration of O3 and nitrogen oxides (NO and NO2, including OMI remote sensing data for the latter). Subsequently, a sensitivity analysis is done with the air quality (AQ) data to evaluate potential O3 reductions in the north of the BMA on Sundays compared with weekdays as a consequence of the reduction in regional emissions of precursors.
The results showed a generalized decreasing trend for regional background O3 as well as the well-known increase in urban O3 and higher urban NO decreasing slopes compared with those of NO2. The most intensive O3 episodes in the Vic Plain are caused by (i) a relatively high regional background O3 (due to a mix of continental, hemispheric–tropospheric and stratospheric contributions); by (ii) intensive surface fumigation from mid-troposphere high O3 upper layers arising from the concatenation of the vertical recirculation of air masses; but also by (iii) an important O3 contribution from the northward transport/channeling of the pollution plume from the BMA. The high relevance of the local-daily O3 contribution during the most intense pollution episodes is clearly supported by the O3 (surface concentration) and NO2 (OMI data) data analysis.
A maximum decrease potential (by applying short-term measures to abate emissions of O3 precursors) of 49 µg O3 m−3 (32 %) of the average diurnal concentrations was determined. Structurally implemented measures, instead of episodically, could result in important additional O3 decreases because not only the local O3 coming from the BMA plume would be reduced, but also the recirculated O3 and thus the intensity of O3 fumigation in the plain. Therefore, it is highly probable that both structural and episodic measures to abate NOx and volatile organic compound (VOC) emissions in the BMA would result in evident reductions of O3 in the Vic Plain.
- Article
(8732 KB) - Full-text XML
-
Supplement
(775 KB) - BibTeX
- EndNote


Tropospheric ozone (O3) is a secondary atmospheric pollutant produced by the photooxidation of volatile organic compounds (VOCs) in the presence of nitrogen oxides (NOx = NO+NO2). Its generation is enhanced under high temperature and solar radiation (Monks et al., 2015, and references therein). Thus, O3 maxima occur generally in the afternoon, with the highest levels typically registered in summer, when exceedances of regulatory thresholds are most frequent.
O3 is one of the key air pollutants affecting human health and the environment (WHO, 2006, 2013a, b; GBD, 2016; Fowler et al., 2009; IPCC, 2013). According to EEA (2018), in the period 2013–2015, more than 95 % of the urban population in the EU-28 was exposed to O3 levels exceeding the WHO guidelines set for the protection of the human health (maximum daily 8 h average concentration of 100 µg m−3).
On a global scale, approximately 90 % of the tropospheric O3 is produced photochemically within the troposphere (Stevenson et al., 2006; Young et al., 2013), the remaining part being transported from the stratosphere (McLinden et al., 2000; Olson et al., 2001). The main global sink of tropospheric O3 is photolysis in the presence of water vapor. Dry deposition, mainly by vegetation, is also an important sink in the continental planetary boundary layer (PBL) (Jacob and Winner, 2009).
On a regional scale, O3 levels vary substantially depending on the different chemical environments within the troposphere. O3 chemical destruction is largest where water vapor concentrations are high, mainly in the lower troposphere, and in polluted areas where there is direct O3 destruction by titration. Thus, the hourly, daily and annual variations in O3 levels at a given location are determined by several factors, including the geographical characteristics, the predominant meteorological conditions and the proximity to large sources of O3 precursors (Logan, 1985).
Southern Europe, especially the Mediterranean basin, is the most exposed to O3 pollution in Europe (EEA, 2018) due to the specific prevailing meteorological conditions during warm seasons, regional pollutant emissions, high biogenic VOCs' (BVOCs) emissions in spring and summer and the vertical recirculation of air masses due to the particular orographic features that help stagnation–recirculation episodes (Millán et al., 2000; EC, 2002, 2004; Millán, 2009; Diéguez et al., 2009, 2014; Valverde et al., 2016). Periods with high O3 concentrations often last for several days and can be detected simultaneously in several countries. Lelieveld et al. (2002) reported that during summer, O3 concentrations are 2.5–3 times higher than in the hemispheric background troposphere. High O3 levels are common in the area, not only at the surface, but also throughout the PBL (Millán et al., 1997; Gangoiti et al., 2001; Kalabokas et al., 2007). Photochemical O3 production is favored due to frequent anticyclonic conditions with clear skies during summer, causing high insolation and temperatures and low rainfall. Besides, the emissions from the sources located around the basin, which is highly populated and industrialized, and the long-range transport of O3 contribute to the high concentrations (Millán et al., 2000; Lelieveld et al., 2002; Gerasopoulos, 2005; Safieddine et al., 2014).
In this context, the design of efficient O3 abatement policies is difficult due to the following circumstances.
-
The meteorology driving O3 dynamics is highly influenced by the complex topography surrounding the basin (see the above references for vertical recirculation of air masses and Mantilla et al., 1997, Salvador et al., 1997, Jiménez and Baldasano, 2004, and Stein et al., 2004)
-
The complex nonlinear chemical reactions between NOx and VOCs (Finlayson-Pitts and Pitts, 1993; Pusede et al., 2015), in addition to the vast variety of the VOC precursors involved and the involvement of BVOCs in O3 formation and destruction (Hewitt et al., 2011)
-
The transboundary transport of air masses containing significant concentrations of O3 and its precursors, which contribute to increased O3 levels, mainly background concentrations (UNECE, 2010)
-
The contribution from stratospheric intrusions (Kalabokas et al., 2007)
-
The fact that O3 concentrations tend to be higher in rural areas (EEA, 2018), where local mitigation plans are frequently inefficient, because the emission of precursors takes place mostly in distant urban and industrial agglomerations
Sicard et al. (2013) analyzed O3 time trends during 2000–2010 in the Mediterranean and observed a slight decrease in annual O3 averages (−0.4 % yr−1) at rural sites and an increase at urban and suburban stations (+0.6 % and +0.4 %, respectively). They attributed the reduction at rural sites to the abatement of NOx and VOC emissions in the EU. Paradoxically, this led to an increase in O3 at urban sites due to a reduction in the titration by NO. Their results also suggested a tendency to converge at remote and urban sites. Paoletti et al. (2014) also reported convergence in the EU and the US in the period 1990–2010, but found increasing annual averages at both rural and urban sites, with a faster increase in urban areas. Querol et al. (2016) determined that O3 levels in Spain remained constant at rural sites and increased at urban sites in the period 2000–2015. This was suggested to be a result of the preferential reduction of NO versus NO2, supported by the lack of a clear trend in Ox (O3+NO2). They also found that the target value was constantly exceeded in large areas of the Spanish territory, while most of the exceedances of the information threshold took place in July, mainly downwind of urban areas and industrial sites, and were highly influenced by summer heatwaves. The Vic Plain (located north of Barcelona) was the area registering the most annual exceedances of the information threshold in Spain, with an average of 15 exceedances per year per site.
In this study, we analyze NO, NO2 and O3 surface data around the Barcelona metropolitan area (BMA) and the Vic Plain, as well as NO2 satellite observations, in the period 2005–2017, with the aim of better understanding the occurrence of high O3 episodes in the area on a long-term basis. Previous studies in this region focused on specific episodes, whereas we aim at assessing the spatial distribution, time trends and temporal patterns of O3 and its precursors, and exceedances of the information threshold on a long time series. After better understanding the 2005–2017 O3 episodes, we aim to evaluate, as a first approximation using air quality monitoring and OMI remote sensing data, the effect that episodic mitigation measures of O3 precursors would have on the Ox concentrations in the Vic Plain.
We recognize that the O3 problem has to be studied with executable models with dispersion and photochemical modules, which allow one to perform sensitivity analyses. It is also well recognized that there is a complex O3 phenomenology in the study area and that although models have greatly improved in the last 10 years, there are still problems in reproducing some of the processes in detail, such as the channeling of O3 plumes in narrow valleys or the vertical recirculation patterns. Our study intends to obtain a sensitivity analysis for O3 concentrations using air quality data. Ongoing collaboration is being established with modelers to try to validate model outputs with this experimental sensitivity analysis and then to implement a prediction system for efficiently abating O3 precursors to reduce O3 concentrations, for which executable models are the sole tool available.
2.1 The area of study
The study is set in central Catalonia (Spain), in the northeastern corner of the Iberian Peninsula (Fig. 1). Characterized by a Mediterranean climate, summers are hot and dry with clear skies. In the 21st century, heatwaves have occurred frequently in the area, often associated with high O3 levels (Vautard et al., 2007; Guerova and Jones, 2007; Querol et al., 2016; Guo et al., 2017).

The capital city, Barcelona, is located on the shoreline of the Mediterranean Sea. Two sets of mountain chains lie parallel to the coastline (SW–NE orientation) and enclose the Pre-coastal Depression: the Coastal (250–500 m above sea level (a.s.l.)) and Pre-Coastal (1000–1500 m a.s.l.) mountain ranges. The Vic Plain, situated 45–70 km north of Barcelona (500 m a.s.l.), is a 230 km2 plateau that stretches along a S–N direction and is surrounded by high mountains (over 1000 m a.s.l.). The complex topography of the area protects it from Atlantic advections and continental air masses, but also hinders the dispersion of pollutants (Baldasano et al., 1994). The two main rivers in the area (Llobregat and Besòs) flow perpendicularly to the sea and frame the city of Barcelona. Both rivers' valleys play an important role in the creation of air-flow patterns. The Congost River is a tributary to the Besòs River and its valley connects the Vic Plain with the Pre-coastal Depression.
The BMA stretches across the Pre-Coastal and Coastal depressions and is a densely populated (> 1500 people per km2, MFom, 2017) and highly industrialized area with large emissions originating from road traffic, aircraft, shipping, industries, biomass burning, power generation and livestock.
During summer, the coupling of daily upslope winds and sea breezes may cause the penetration of polluted air masses up to 160 km inland, channeled from the BMA northward by the complex orography of the area. These air masses are injected at high altitudes (2000–3000 m a.s.l.) by the Pyrenean mountain ranges. At night time, the land breeze prevails, and winds flow toward the sea followed by subsidence sinking of the air mass, which can be transported again by the sea breeze of the following day (Millán et al., 1997, 2000, 2002; Toll and Baldasano, 2000; Gangoiti, 2001; Gonçalves et al., 2009; Millán, 2014; Valverde et al., 2016). Under conditions of a lack of large-scale forcing and the development of a thermal low over the Iberian Peninsula that forces the confluence of surface winds from coastal areas toward the central plateau, this vertical recirculation of the air masses results in regional summer O3 episodes in the western Mediterranean. In addition, there might be external O3 contributions, such as hemispheric transport or stratospheric intrusions (Kalabokas et al., 2007, 2008, 2017; Querol et al., 2017, 2018).
2.2 Air quality and meteorological and remote sensing data
We evaluated O3 and NOx AQ data together with meteorological variables and satellite observations of background NO2.
The regional government of Catalonia (Generalitat de Catalunya, GC) has a monitoring network of stations that provides average hourly data of air pollutants (XVPCA, GC, 2017a, b). We selected a total of 25 stations (see Fig. 2). To study the O3 phenomenology in the Vic Plain, we selected the eight stations marked in green which met the following constraints: (i) location along the S–N axis (Barcelona–Vic Plain–Pre-Pyrenean range); (ii) availability of O3 measurements; and (iii) availability of at least 9 years of data in the period 2005–2017, with at least 75 % data coverage from April to September. The remaining selected stations (used only as reference ones for interpreting data from the main Vic–BMA axis stations) met the following criteria: (i) location across the Catalan territory and (ii) availability of a minimum of 5 years of valid O3 data in the period 2005–2017. We chose this period due to the poor data coverage of most of the AQ sites in the regional network of AQ monitoring stations before 2005.
In addition, we selected wind and temperature data from five meteorological stations from the Network of Automatic Meteorological Stations (XEMA, Meteocat, 2017) closely located to the previously selected AQ stations, as well as solar radiation data from two solar radiation sites from the Catalan Network of Solar Radiation Measurement Stations (ICAEN-UPC, 2018) located in the cities of Girona and Barcelona.
We also used daily tropospheric NO2 column satellite measurements using the Ozone Monitoring Instrument (OMI) spectrometer aboard NASA's Earth Observing System (EOS) Aura satellite (see OMI, 2012; Krotkov and Veefkind, 2016). The measurements are suitable for all atmospheric conditions and for sky conditions where cloud fraction is less than 30 % binned and averaged into global grids.
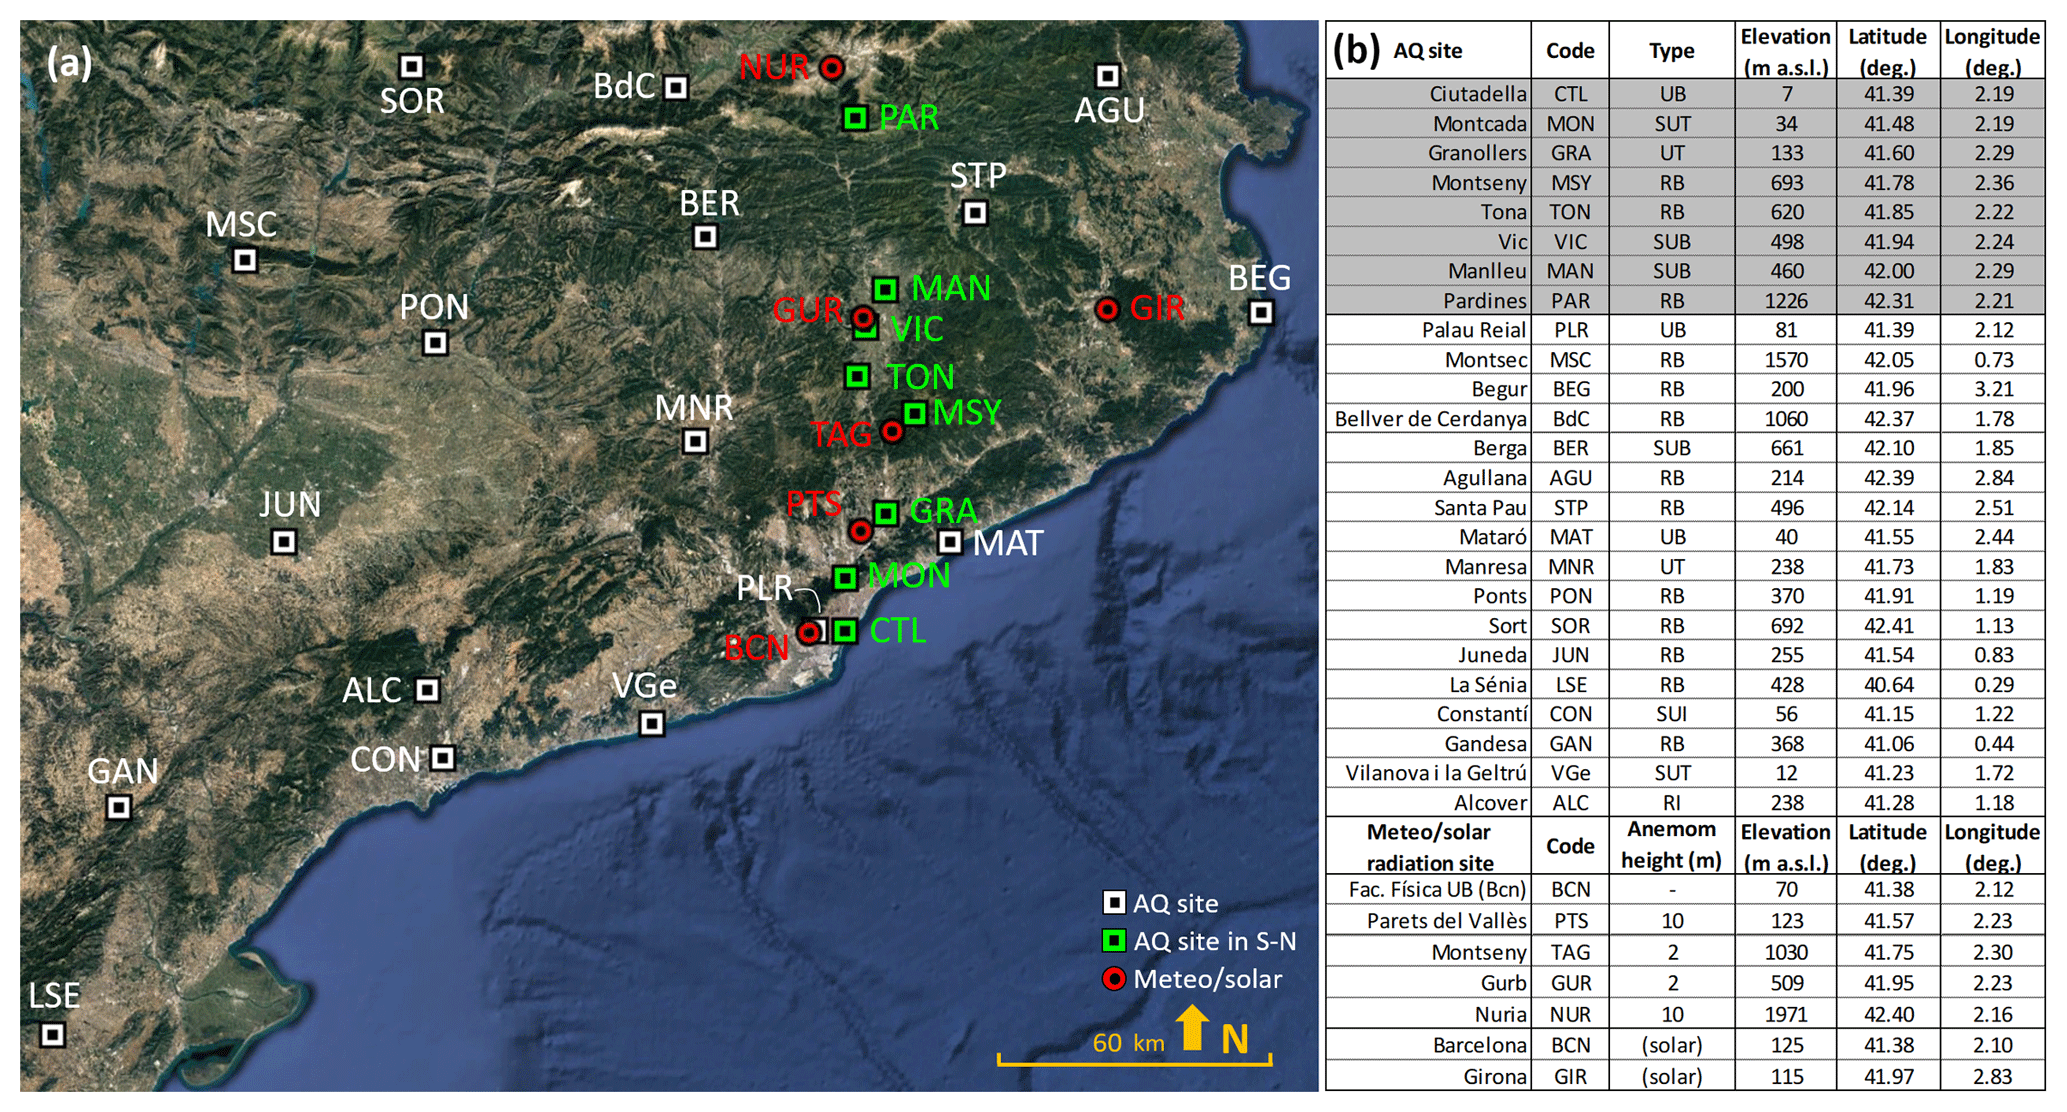
Figure 2Location (a) and main characteristics (b) of the selected air quality monitoring sites (S–N axis: green squares on the map and shaded gray on the table; rest of the stations: white squares) and meteorological/solar radiation stations (red circles) selected for this study. Types of air quality monitoring sites are urban (traffic or background: UT, UB), suburban (traffic, industrial or background: SUT, SUI, SUB) and rural (background or industrial: RB, RI). PLR (Palau Reial air quality monitoring site) and BCN (Barcelona) meteorological and solar radiation sites are closely located.
2.3 Data analysis
2.3.1 Ox calculations
We calculated Ox concentrations to better interpret O3 dynamics. Kley and Gleiss (1994) proposed the concept of Ox to improve the spatial and temporal variability analysis by decreasing the effect of titration of O3 by NO with the subsequent consumption of O3 in areas where NO concentrations are high. Concentrations were transformed to ppb units using the conversion factors at 20 ∘C and 1 atm (DEFRA, 2014).
Ox concentrations were only calculated if there were at least six simultaneous hourly recordings of O3 and NO2 from 12:00 to 19:00 local time (LT; see Sect. 2.3.6), June–August, in the period 2005–2017. The stations used for these calculations were those located along the S–N axis (Barcelona–Vic Plain–Pre-Pyrenean Range).
2.3.2 Variability of concentrations across the air quality monitoring network
To study the variability of concentrations of NO, NO2, O3 and Ox across the air quality monitoring network, we calculated June–August averages (months recording the highest concentrations of O3 in the area) from hourly concentrations provided by all the selected AQ sites. For each of them, we calculated daily averages and daytime high averages (12:00 to 19:00 LT).
2.3.3 Time trends
By means of the Mann–Kendall method, we analyzed time trends for NO, NO2 and O3 for the period 2005–2017. In addition, we used the Theil–Sen statistical estimator (Theil, 1950a–c; Sen, 1968) implemented in R package Openair (Carslaw and Ropkins, 2012) to obtain the regression parameters of the trends (slope, uncertainty and p value) estimated via bootstrap resampling. We examined the annual time trends of seasonal averages (April–September) for each pollutant. Data used for these calculations were selected according to the recommendations in EMEP-CCC (2016): the stations considered have at least 10 years of data (75 % of the total period considered, 2005–2017), and at least 75 % of the data are available within each season. In addition, we analyzed annual time trends of tropospheric NO2 measured by satellite along the S–N axis and of greenhouse gases (GHGs) emitted in Catalonia and the average number of vehicles entering the city of Barcelona.
2.3.4 Assessment of O3 objectives according to air quality standards
We identified the maximum daily 8 h average concentrations by examining 8 h running averages using hourly data in the period 2005–2017. Each 8 h average was assigned to the day on which it ended (i.e., the first average of one day starts at 17:00 LT on the previous day), as determined by EC (2008).
To assess the time trends and patterns of the Exceedances of Hourly Information Thresholds (EHITs) established by EC (2008) (hourly mean of O3 concentration greater than 180 µg m−3), we used all the data independently of the percentage of data availability.
2.3.5 Tropospheric NO2 column
We analyzed daily average tropospheric column NO2 measurements from 2005 to 2017 aiming at two different goals: on the one hand, to quantify the tropospheric NO2 in the area along the S–N axis and obtain annual time trends and monthly/weekly patterns; and on the other hand, to assess qualitatively the tropospheric NO2 across a regional scale (western Mediterranean Europe) in two different scenarios, by means of visually finding patterns that might provide a better understanding of O3 dynamics in our area of study. The scenarios were days with the maximum 8 h O3 average above the 75th percentile at the Vic Plain stations and days with the maximum below the 25th percentile. See selected regions for retrieval of NO2 satellite measurements in Fig. S1.
2.3.6 Time conventions
When expressing average concentrations, the times shown indicate the start time of the average. For example, 12:00–19:00 LT averages take into account data registered from 12:00 to 19:59 LT. All times are expressed as local time (UTC+1 during winter and UTC+2 during summer) and the 24 h time clock convention is used.
3.1 Variability of concentration of pollutants across the air quality monitoring network
We analyzed the mean NO, NO2, O3 and Ox concentrations (June to August) in the study area in the period 2005–2017.
As expected, the highest NO and NO2 concentrations are registered in urban/suburban (U/SU) traffic sites in and around Barcelona (MON, GRA, MNR and CTL, 7–10 µg NO m−3, and CTL and MON, 30–36 µg NO2 m−3). Also, as expected, the remote high-altitude rural background (RB) sites (MSY and MSC) register the lowest NO (< 1 µg m−3) and NO2 (2–4 µg m−3) concentrations; see Fig. S2.
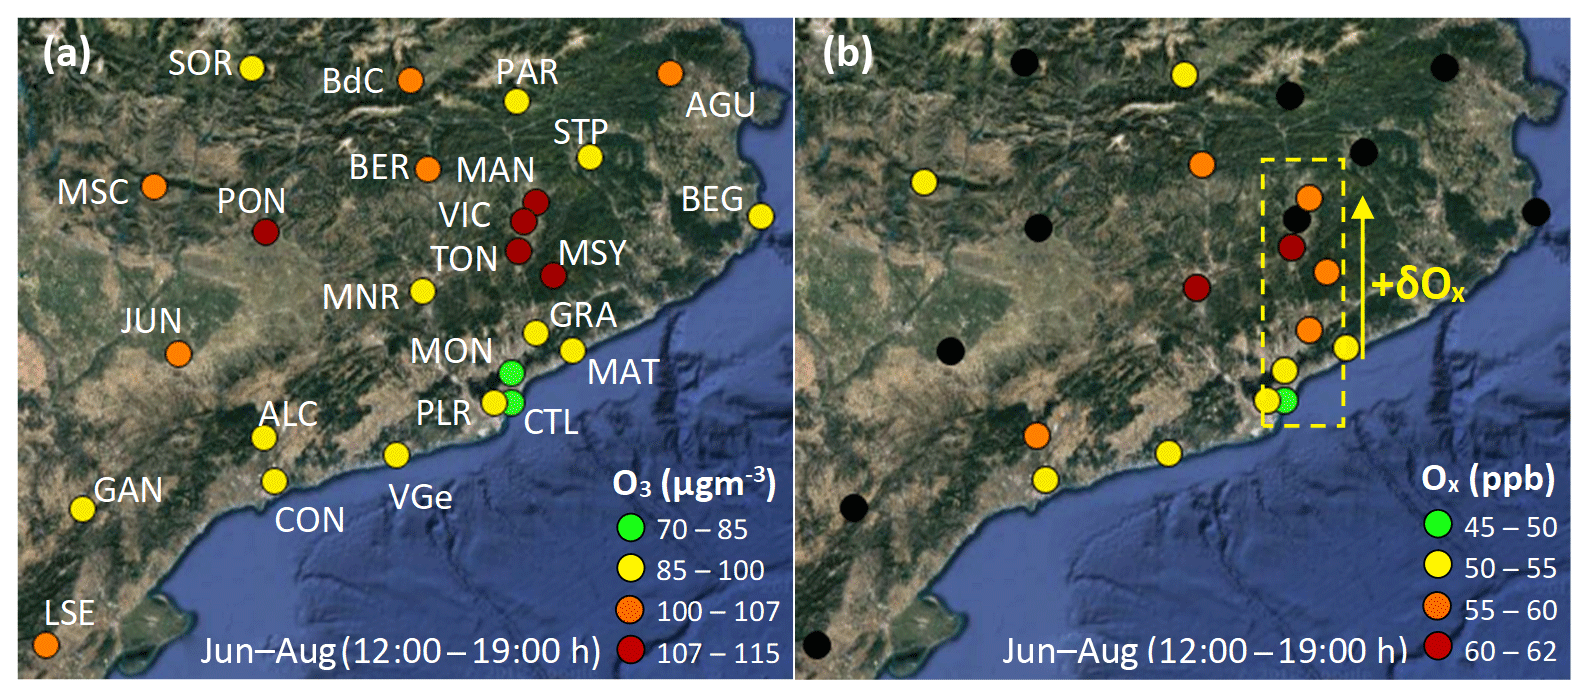
Figure 3Spatial variability of mean June–August O3 (a) and Ox (b) concentrations from 12:00 to 19:00 LT observed in selected air quality monitoring sites. Data from Ciutadella (CTL), Palau Reial (PLR), Montcada (MON), Granollers (GRA), Montseny (MSY), Tona (TON), Vic (VIC), Manlleu (MAN), Pardines (PAR), Montsec (MSC), Begur (BEG), Bellver de Cerdanya (BdC), Berga (BER), Agullana (AGU), Santa Pau (STP), Mataró (MAT), Manresa (MNR), Ponts (PON), Sort (SOR), Juneda (JUN), La Sénia (LSE), Constantí (CON), Gandesa (GAN), Vilanova i la Geltrú (VGe) and Alcover (ALC) air quality monitoring stations.
The lowest June–August average O3 concentrations (45–60 µg m−3) are recorded in the same U/SU traffic sites (MON, GRA, MNR and CTL) where titration by NO is notable, while the highest ones (> 85 µg m−3) are recorded at the RB sites, MSC being the station recording the highest June–August O3 levels (102 µg m−3). These spatial patterns are significantly different when we consider the 8 h daily averages of O3 concentrations for June–August 12:00–19:00 LT (Fig. 3a). Thus, these concentrations are repeatedly high (85–115 µg m−3) in the whole area of study. The highest O3 concentrations (> 107 µg m−3) were recorded at the four sites located downwind of the BMA along the S–N corridor (MSY, TON, VIC and MAN), and downwind of Tarragona (PON, RB station). Figure 3a also shows a positive O3 gradient along the S–N axis (O3 levels increase farther north) following the BMA plume transport and probably an increase in the mixing layer height (MLH). The higher O3 production and/or fumigation in the northern areas are further supported by the parallel northward increasing Ox gradient (δOx, Fig. 3b). Time series show that in 85 % of the valid data in June–August (849 out of 1001 days in 2005–2017), this positive gradient is evident between CTL and TON (). The average Ox increase between CTL in Barcelona and TON is 15 ppb. Taking into account the low NO2 concentrations registered at this station, this is equivalent to approximately 29 µg m−3 of O3 (+30 % Ox in TON compared with CTL).
Thus, TON in the Vic Plain records the highest 12:00–19:00 LT, June–August Ox and O3 concentrations in the study area. The MNR site also exhibits very high Ox levels (Fig. 3b), but these are mainly caused by primary NO2 associated with traffic emissions.
3.2 Time patterns
3.2.1 Annual trends
Figure 4 shows the results of the trend analysis of NO, NO2, O3 and Ox averages (April to September, the O3 season according to the European AQ Directive) by means of the Mann–Kendall test.
NOx levels exhibit a generalized and progressive decrease during the time period across Catalonia. In particular, NO2 tended to decrease along the S–N axis during the period (U/SU sites CTL, MON and MAN registered −1.6 % yr−1, −2.0 % yr−1 and −1.3 % yr−1, respectively, with statistical significance in all cases). A similar trend was found for NO in these stations, with higher negative slopes (−2.2 % yr−1, −4.3 % yr−1 and −1.1 % yr−1, the latter without statistical significance).

Figure 4Results of the time trend assessment carried out for annual season averages (April–September) of NO (a), NO2 (b), O3 (c, d) and Ox (e) levels using the Theil–Sen statistical estimator shown graphically. Only the trends with statistical significance are shown. (d) Numerical results; the symbols shown for the p values relate to how statistically significant the trend estimate is: (highest statistical significance), (mid), (moderate), and (low). No symbol means lack of a significant trend. Units are µg m−3. Shaded air quality monitoring sites belong to the S–N axis. Types of air quality monitoring sites are urban (traffic or background: UT, UB), suburban (traffic, industrial or background: SUT, SUI, SUB) and rural (background: RB). Data from AQ stations with at least 10 years of valid data within the period.
The annual averages of tropospheric NO2 across the S–N axis decreased by 35 % from 2005 to 2017 (−3.4 % yr−1 with statistical significance). The marked drop in NO2 from 2007 to 2008 can be attributed to the reduction in emissions associated with the financial crisis starting in 2008. The time trends of average traffic (number of vehicles) entering Barcelona on working days from 2005 to 2016 (Ajuntament de Barcelona, 2010, 2017) and the GHGs emitted in Catalonia attributed to industry and power generation sectors calculated from the Emissions Inventories published by the Regional Government of Catalonia from 2005 to 2016 (GC, 2017c) (Fig. 5a) support this hypothesis. We found both decreasing trends to be statistically significant, but the GHG emissions decreasing trend is significantly higher (−3.8 % yr−1) than the traffic (−1.2 % yr−1), which suggests that the crisis had a more severe effect on industry and power generation than on road traffic. This is also supported by a larger decrease in GHG emissions and OMI-NO2 from 2005–2007 (pre-crisis) to 2008 (start of the crisis) than BMA traffic counting and urban NOx levels (without a 2007–2008 steep change and a more progressive decrease, Fig. 5b). Thus, in the BMA, the financial crisis caused a more progressive decrease (without a 2007–2008 steep change) in the circulating vehicles and therefore its associated emissions.
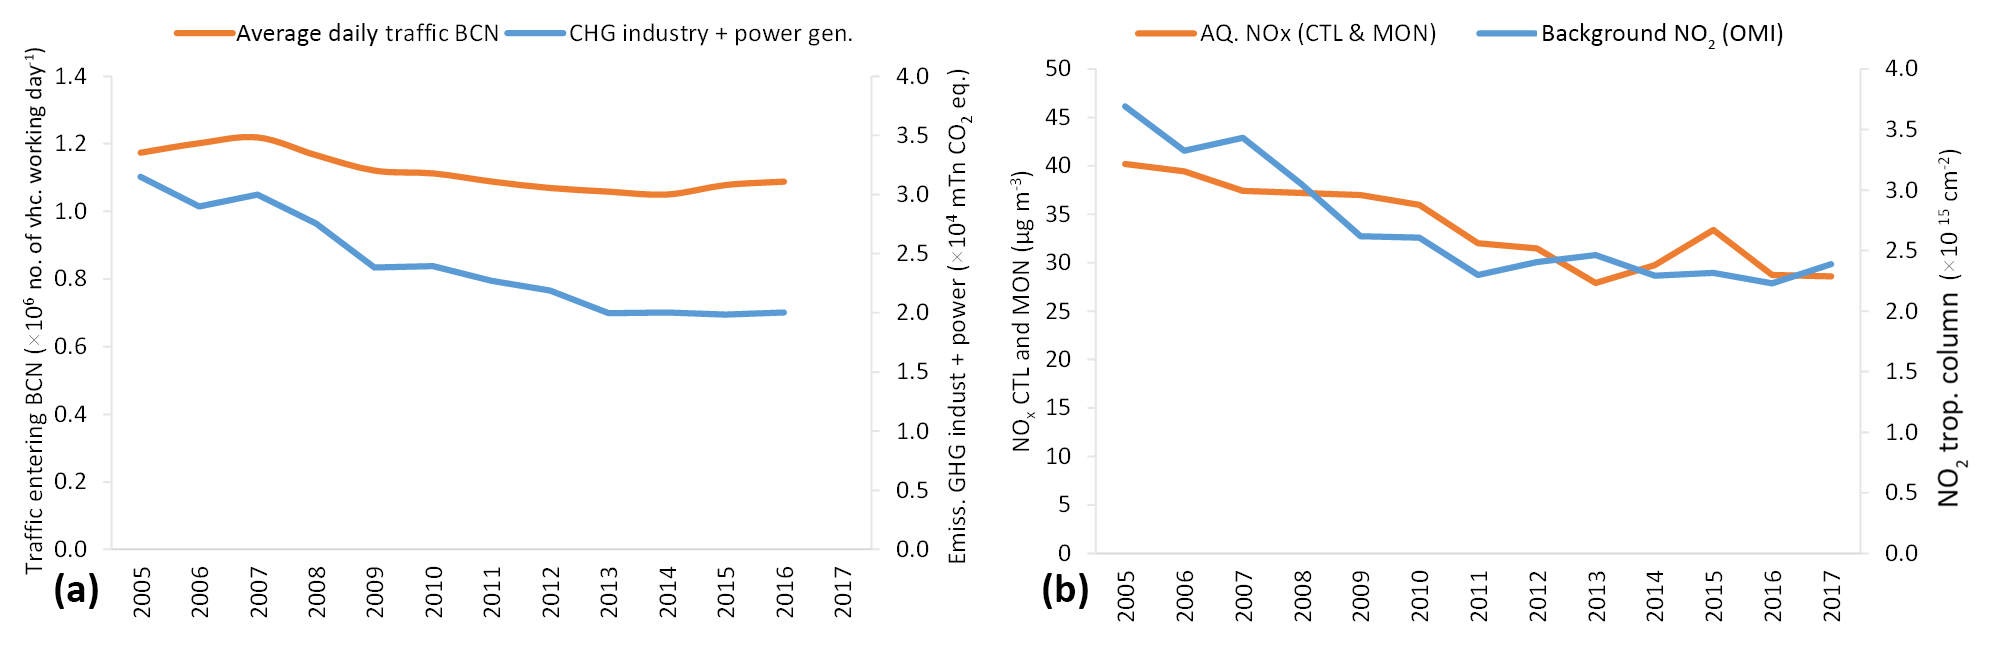
Figure 5(a) Annual average traffic entering Barcelona during weekdays (weekends not considered) during 2005–2016 versus GHG emissions (attributed to industry and power generation sectors) in Catalonia during 2005–2016. (b) Annual NOx measured at CTL (Ciutadella) and MON (Montcada) air quality monitoring sites versus annual OMI-NASA measured background NO2 during 2005–2017.
April–September O3 and Ox mean concentration trends are shown in Fig. 4. The data show that seven out of the eight RB sites registered slight decreases in O3 concentrations during the period (BdC, AGU and STP; −1.6 % yr−1, −1.1 % yr−1 and −1.4 % yr−1, respectively, in all cases with statistical significance), while in BEG, PON, LSE and GAN the trends were not significant (not shown). As in several regions of Spain and Europe (Sicard et al., 2013; Paoletti et al., 2014; EEA, 2016; Querol et al., 2016; EMEP, 2016), the opposite trends are found for U/SU sites, with increases in O3 concentrations during the period at some stations (CTL, MON, MAN, MAT, MNR and ALC; +0.4 % yr−1 to +3.2 % yr−1, all with statistical significance). When considering Ox, the increasing trends in U/SU sites are neutralized in some cases (CTL, MON, MAN, MAT and ALC). This, and the higher NO decreasing slopes compared with those of NO2, support the hypothesis that the U/SU O3 increasing trends are probably caused by less O3 titration (due to decrements in NO levels) instead of a higher O3 generation. The marked decrease in the vehicle diesel emissions of NO∕NO2 time trends (Carslaw et al., 2016) might have caused these differential NO and NO2 trends, although other causes cannot be rejected.

Figure 6Monthly hourly average concentrations of O3 (a) and Ox (b) along the S–N axis during 2005–2017. Data from Ciutadella (CTL), Montcada (MON), Granollers (GRA), Montseny (MSY), Tona (TON), Vic (VIC), Manlleu (MAN) and Pardines (PAR) air quality monitoring stations.
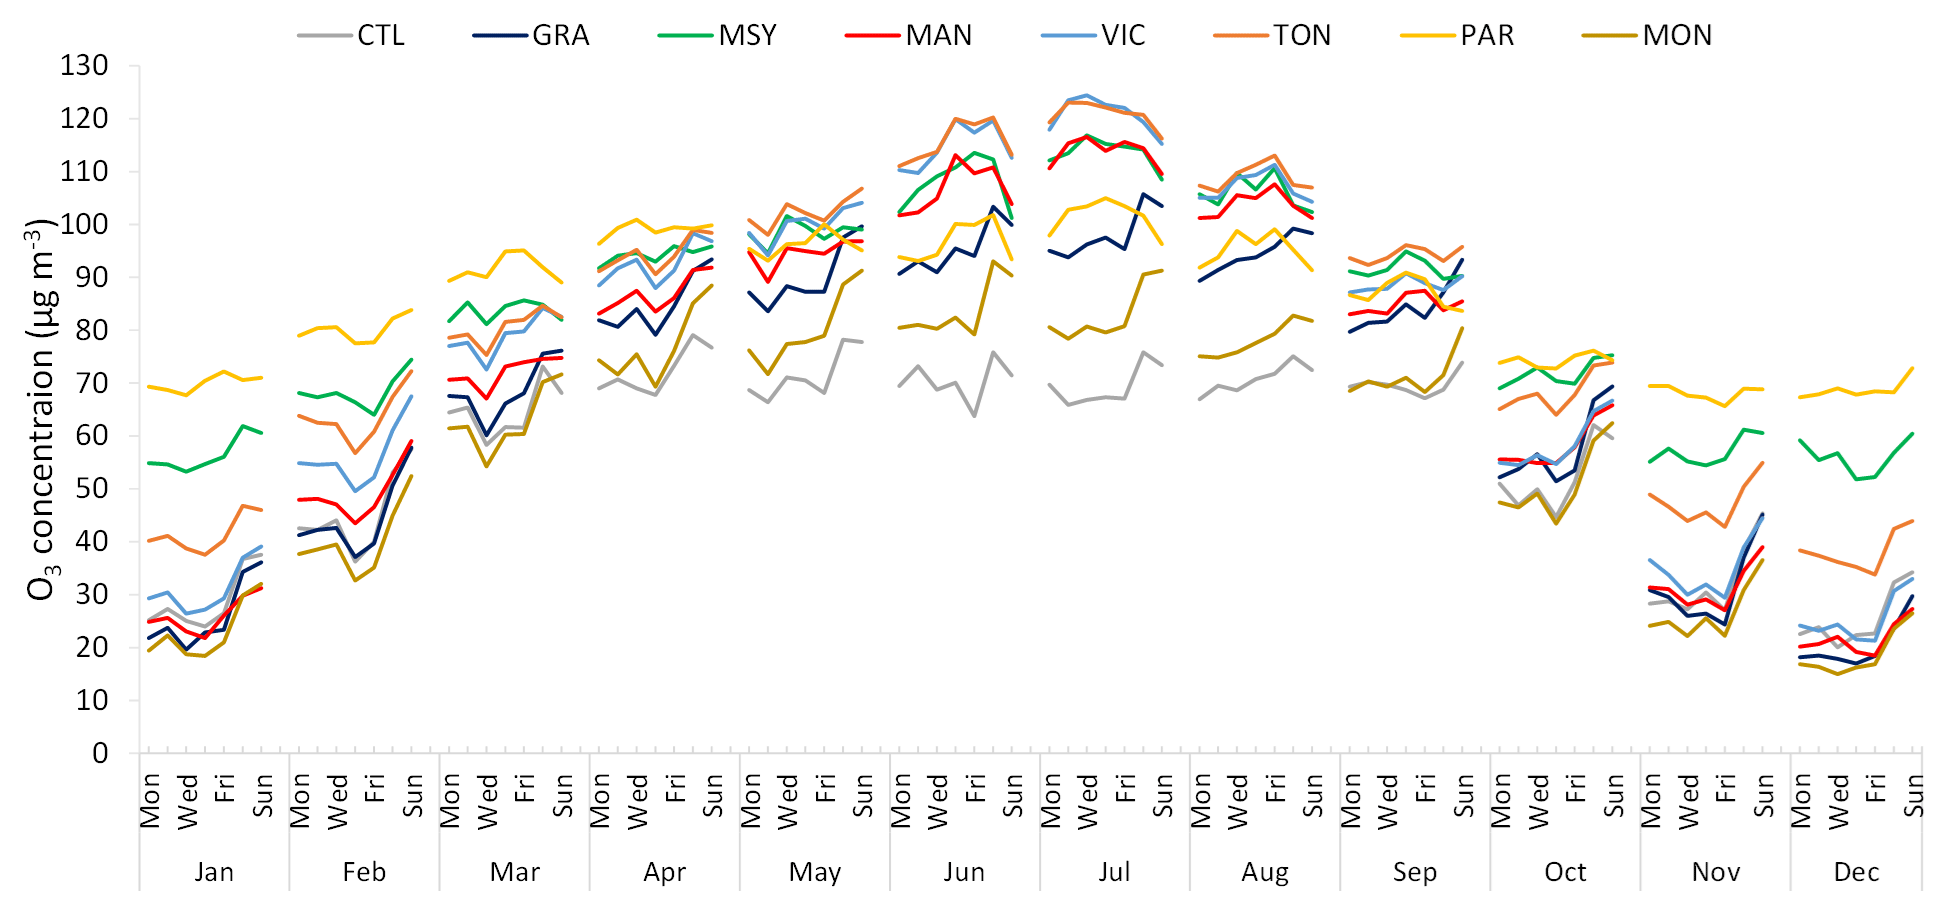
Figure 7Monthly weekday average concentrations of O3 concentrations calculated between 12:00 and 19:00 LT along the S–N axis during 2005–2017. Data from Ciutadella (CTL), Montcada (MON), Granollers (GRA), Montseny (MSY), Tona (TON), Vic (VIC), Manlleu (MAN) and Pardines (PAR) air quality monitoring stations.
3.2.2 Monthly and daily patterns
Figure 6a shows 2005–2017 monthly average hourly O3 concentrations measured at sites along the S–N axis, showing the occurrence of chronic-type episodes with repeated high O3 concentrations (90–135 µg m−3) in the afternoons of April–September days at the Vic Plain sites (TON, VIC, MAN) and the remote RB sites (MSY and PAR).
Typically, at the remote RB stations, O3 concentrations are high during the whole day throughout the year and daily O3 variations are narrower than at the other stations, with high average levels even during October–February (MSY: 50–70 µg m−3 and PAR: 50–80 µg m−3). During the night these mountain sites are less affected by NO titration, leading to high daily O3 average concentrations. However, in summer, midday–afternoon concentrations are relatively lower than at the stations located in the S–N valley (TON, VIC, MAN).
Regarding monthly average daily Ox (Fig. 6b), the profiles of RB sites TON and MSY are very similar to the respective O3 profiles. In the case of the BMA U/SU sites (CTL, MON, GRA), the nocturnal Ox concentrations increase with respect to O3 due to the addition of secondary NO2 from titration. Midday–afternoon Ox levels are much lower at the BMA U/SU stations than those in the S–N valley (MAN, TON), similarly to O3 levels, supporting the contribution of local–regional O3 from the BMA plume and/or from the fumigation of high-altitude reserve strata as MLH grows (Millán et al., 1997, 2000; Gangoiti et al., 2001; Querol et al., 2017) as well as production of new O3.
3.2.3 Weekly patterns
Accordingly, Fig. 7 shows the O3 weekly patterns for these O3 average concentrations. As expected, the variation of intra-annual concentration values is pronounced in the Vic Plain sites (TON, VIC, MAN; 20–45 µg m−3 in December–January versus 110–125 µg m−3 in July), due to the higher summer photochemistry, the more frequent summer BMA plume transport (due to intense sea breezing) and fumigation from upper atmospheric reservoirs across the S–N axis, and the high O3 titration in the populated valleys in winter. However, at the remote mountain sites of MSY and PAR, the intra-annual variability is much reduced (70–80 µg m−3 in December versus 100–120 µg m−3 in July), probably due to the reduced effect of NO titration at these higher-altitude sites and the influence of high-altitude O3 regional reservoirs.
During the year, CTL, MON and GRA (U/SU sites around the BMA) register very similar weekly patterns of the 8 h maxima, with a marked and typical high O3 weekend effect, i.e., higher O3 levels than during the week due to lower NO concentrations. From April to September, CTL O3 8 h concentrations are lower than MON's and GRA's (the latter located north of the BMA following the sea breeze air mass transport), despite being very similar from October to March (when sea breezes are weaker). An O3 weekend effect is also clearly evident during the winter months in the Vic Plain sites (TON, VIC, MAN) and MSY. However, from June to August, a marked inverse weekend effect is clearly evident at these same sites, with higher O3 levels during weekdays. This points again to the clear influence of the emission of precursors from the BMA on the O3 concentrations recorded at these inland sites.
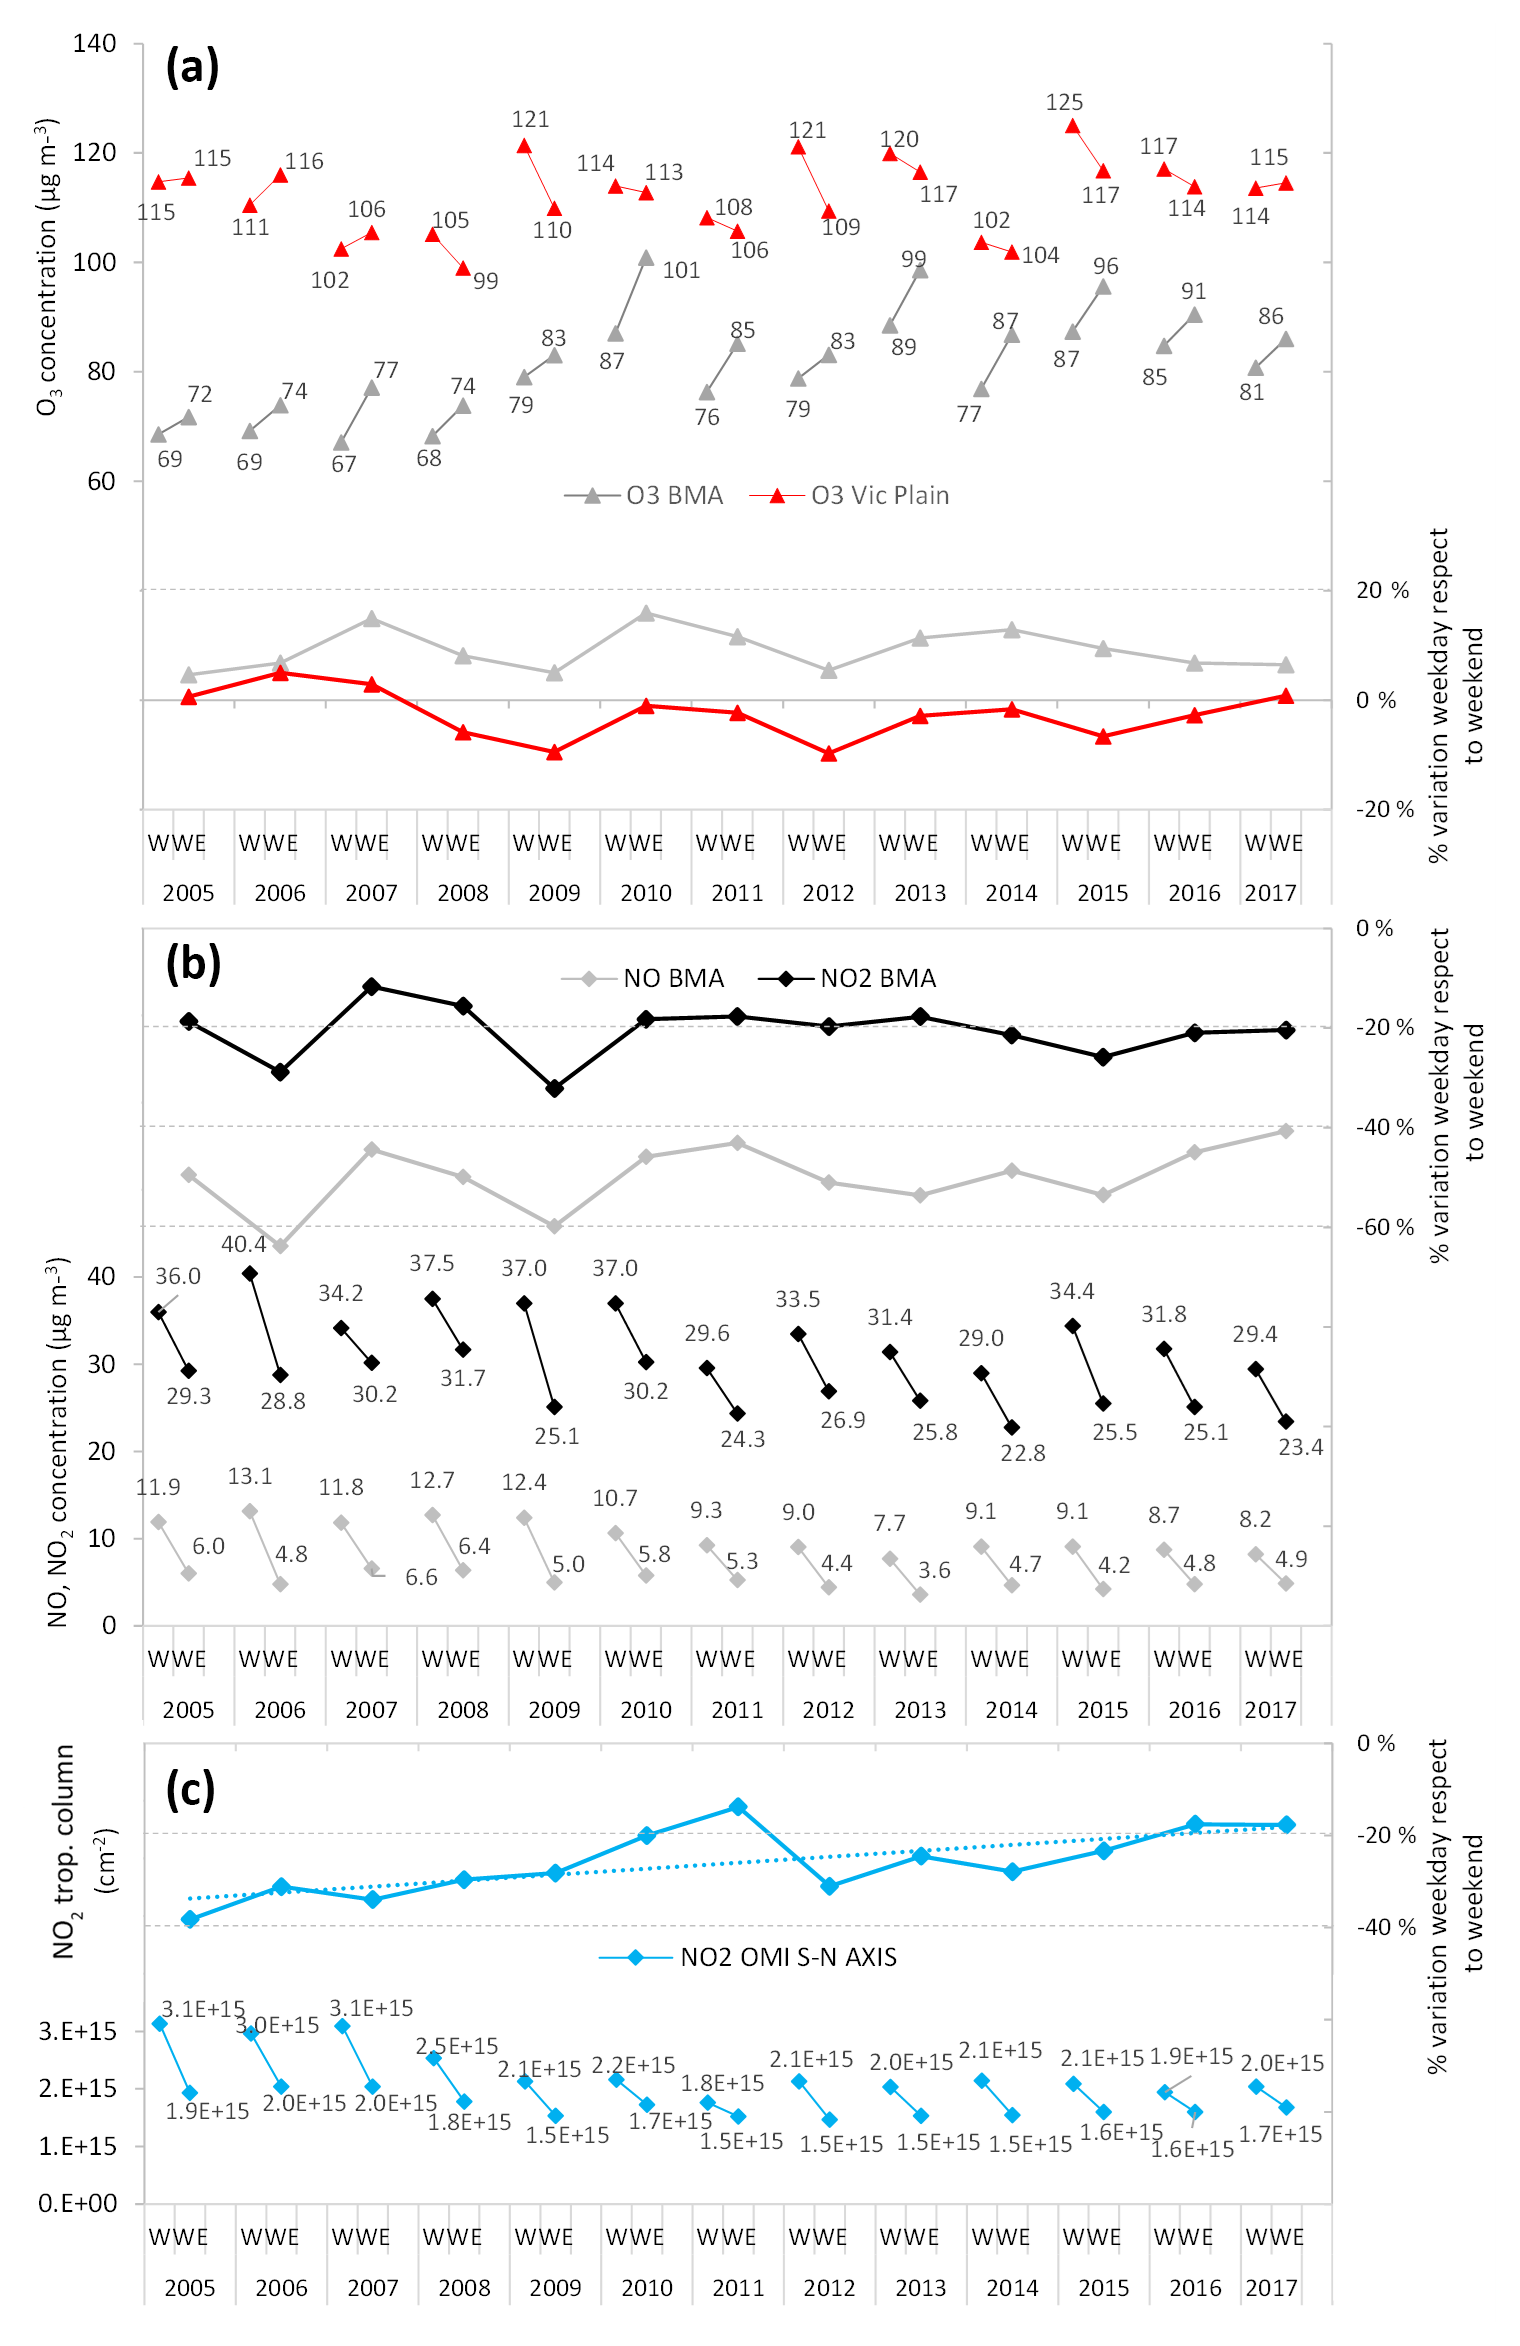
Figure 8Weekday (W) (Monday to Friday in the BMA and Tuesday to Friday in the Vic Plain) to weekend (WE) pollutant concentrations (O3, NO and NO2) measured at AQ sites and background NO2 (remote sensing OMI) for June to August, per year along the period 2005–2017. O3 concentrations (a) are averaged from 12:00 to 19:00 LT hourly concentrations, and NO and NO2 concentrations are calculated from daily averages, including OMI-NO2. Each short line depicts the increasing or decreasing tendency of weekday concentrations (left side of each short line) with respect to weekend levels (right side of the short lines). Thus, a horizontal line would represent same pollutant levels along the week (concentration in W = concentration in WE). We consider BMA AQ sites CTL, MON and GRA, and Vic Plain AQ sites TON and MAN. The continuous lines show the percentage of variation of pollutant levels during weekends with respect to weekdays: increasing (> 0) or decreasing (< 0), i.e., a quantification of the inclination of each short line.
We carried out a trend analysis of NO, NO2 and O3 levels measured at AQ sites and background NO2 from remote sensing (OMI) for week (W) and weekend (WE) days independently. To this end we averaged the concentrations for three sites in the BMA (CTL, MON and GRA) and three receptor sites at the Vic Plain (TON, VIC and MAN), and considering WE to be Saturday, Sunday and Monday for the Vic AQ sites data (adding Mondays to account for the “clean Sunday effect”) and Saturday and Sunday for the BMA sites data.
We estimated time trends of W and WE concentrations separately by the Mann–Kendall method along the study period. For O3 (12:00 to 19:00 LT) we found statistically significant increases in both the BMA and the Vic Plain. Increases in O3 in the BMA double the ones in the Vic Plain, and trends of W and WE are very similar per area (O3 BMA W: +2.0 % yr−1, O3 BMA WE: +2.2 % yr−1, O3 Vic Plain W: +0.8 % yr−1, O3 Vic Plain WE: +1.0 % yr−1). As seen before, both NO and NO2 levels (daily averages) in the BMA decrease in a statistically significant way where NO decrements are larger than NO2. We found that the decrease in W NO levels is higher than the WE ones (NO BMA W: −3.4 % yr−1, NO BMA WE: −2.7 % yr−1) because emissions are higher during W days, and these decreased along the period. Regarding NO2, W and WE decreases remain similar (NO2 BMA W: −1.9 % yr−1, NO2 BMA WE: −1.7 % yr−1) but lower than NO in both cases, thus reducing the O3 titration effects and increasing O3 levels on both WE and W days. Regarding NO2-OMI levels, only W levels show a statistically significant decreasing trend (−3.4 % yr−1), and not the WE levels.
We then assessed the variations of WE concentrations with respect to Ws per year and plotted them by short tilted lines in Fig. 8, where the left- and right-hand sides of each tilted line represent W and WE concentrations, respectively. These W to WE variations are then plotted in percentage by continuous lines (> 0 depicts increasing and < 0 decreasing W to WE). Panel (a) shows O3 data averaged from 12:00 to 19:00 LT from the BMA and the Vic Plain, panel (b) daily averages of NO and NO2 concentrations in the BMA, and panel (c) daily NO2-OMI levels along the S–N axis. The results show again a constant drop in W to WE NOx levels in the BMA along the period (negative percentages in panel b), with the subsequent O3 weekend effect in the BMA (positive percentages in panel a). In the Vic Plain sites, O3 concentrations remain constantly high along the study period, showing an inverse weekend effect almost during the whole period (negative percentages in the plot, except for 2005 to 2007 and 2017). Using the Mann–Kendall test to estimate trends for the W to WE variations, we found a clear statistically significant decreasing trend along the period (reduction of the difference between W to WE levels: from −38 % in 2005 to −17 % in 2017, Fig. 8c). We attribute this to the decrease in W–NOx levels described before for the annual averages.
Furthermore we found a pattern of nearly parallel O3 W to WE variation cycles between the Vic Plain and the BMA sites (Fig. 8a). Due to the inverse W to WE O3 at Vic and in the BMA, this parallel trend means in fact that maximum W to WE variations in the Vic Plain and the BMA tend to follow a reverse behavior; i.e., maximum W to WE variations in the BMA tend to occur when W to WE variations in the Vic Plain are minimum (for example 2007, 2010, or 2014). NOx W to WE variations tend to follow a similar behavior to O3 W to WE variations in the Vic Plain sites (mostly from 2008 to 2016) where years with high W to WE variations of NOx in the BMA tend to correspond to years with maximum O3 W to WE variations in the Vic Plain (2009 and 2015). This behavior is probably associated with differences in air mass circulation patterns along the period (such as higher or lower breeze development). In those years with lower breeze development, the transport of the BMA plume is weaker; then NOx would tend to accumulate at the BMA (low W to WE NOx variation), which would generate more O3; thus, W to WE variation would be higher in the BMA and lower in the Vic Plain. By contrast, in years with stronger breeze development and thus increased transport of the BMA plume, W to WE variations of NOx in the BMA are higher, W to WE variations of O3 in the BMA are lower (less O3 is generated during WE) and higher W to WE O3 variations are recorded in the Vic Plain sites.
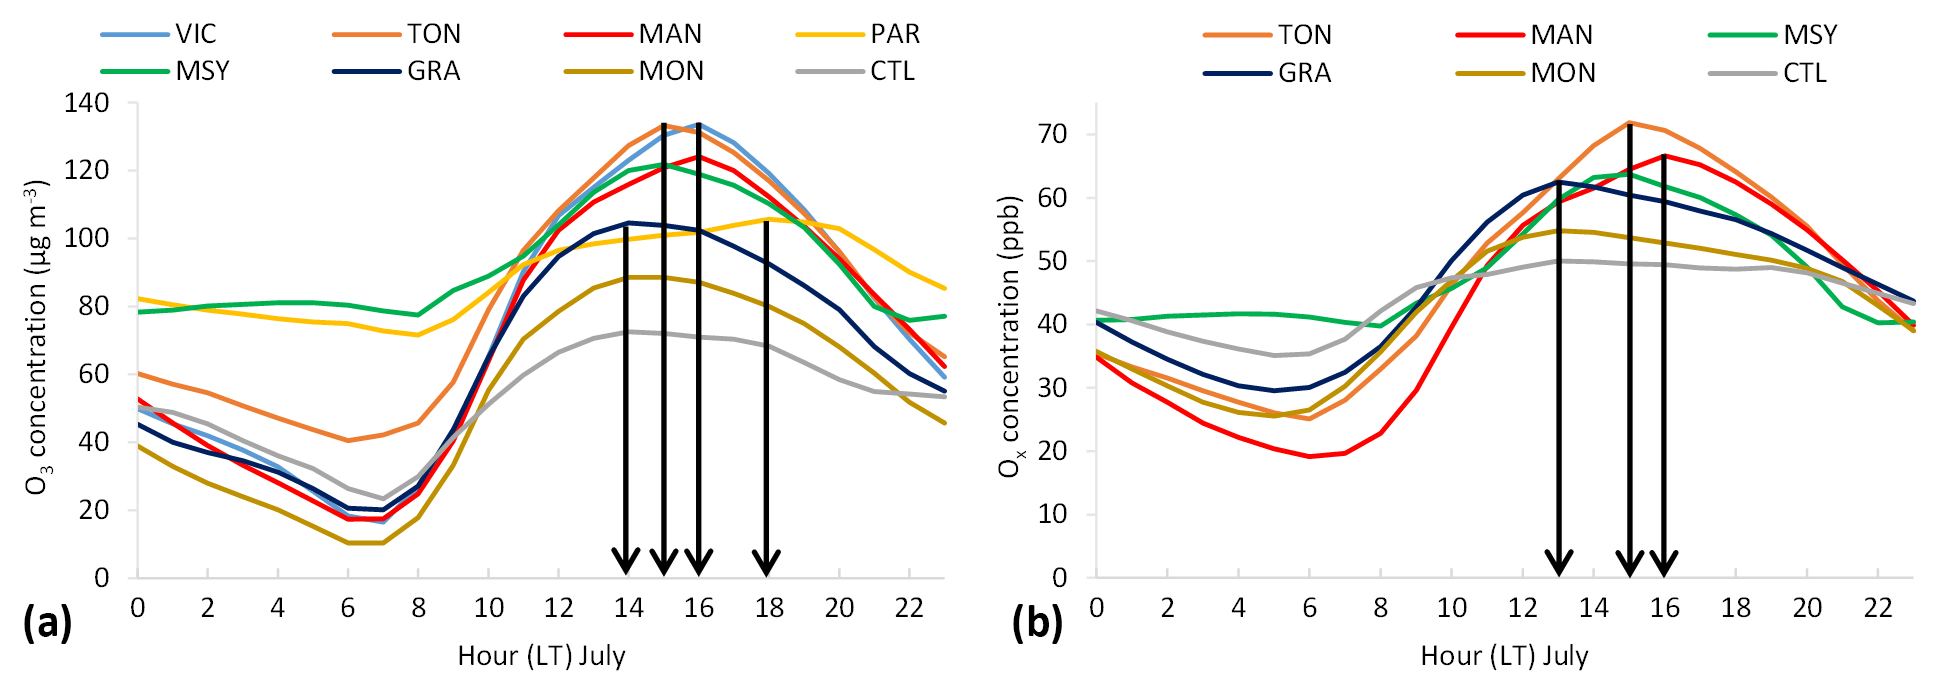
Figure 9(a) July O3 and (b) Ox daily cycles plotted from mean hourly concentrations measured in air quality monitoring sites located along the S–N axis during 2005–2017. The black arrows point to the O3 and Ox maxima time of the day. Data from Ciutadella (CTL), Montcada (MON), Granollers (GRA), Montseny (MSY), Tona (TON), Vic (VIC), Manlleu (MAN) and Pardines (PAR) air quality monitoring stations.
3.3 Peak O3 concentration patterns along the S–N axis
July is the month of the year when most of the annual exceedances of the O3 EHITs are recorded in Spain (Querol et al., 2016), including our area of study. Figure 9 shows the average O3 and Ox July hourly concentrations along the S–N axis during 2005–2017. A progressive time shift and a marked positive northward gradient of O3 and Ox maxima are shown, pointing again to the gradual increase in O3 and Ox due to the plume transport, new O3 formation and fumigation from upper reservoirs as MLH grows.
Figure 10a shows the 2005–2017 trends of the EHITs from the European AQ Directive (> 180 µg m−3 h−1 mean; EC, 2008) registered at the selected sites in the S–N valley, as well as the average temperatures measured during July in the early afternoon near Vic (at Gurb meteorological site), the background NO2 measured by OMI (June–August) and the average solar radiation measured in Girona and Barcelona (June–August). In 2005, 2006, 2010, 2013, 2015 and 2017, the highest EHITs at almost all the sites were recorded. Temperature and insolation seem to have a major role in the occurrence of EHITs in 2006, 2010, 2015 and 2017. The effect of heatwaves on O3 episodes is widely known (Solberg et al., 2008; Meehl et al., 2018; Pyrgou et al., 2018). However, because the emissions of precursors have clearly decreased (−30 % decrease in June to August OMI-NO2 levels across the S–N axis from 2005 to 2017; −2.7 % yr−1 with statistical significance), the number of EHITs recorded in the warmest years has probably decreased with respect to a scenario where emissions would have been maintained. In any case, some years (for example 2009 and 2016) seem to be out of line for temperature and insolation being the driving forces, and other major causes also have to be relevant, with further research needed to interpret fully interannual trends. Otero et al. (2016) found that temperature is not the main driver of O3 in the southwestern Mediterranean, as it is in central Europe, but the O3 levels recorded the day before (a statistical proxy for the occurrence of Millán et al. (1997)'s vertical recirculation of air masses). Again, the Vic Plain sites (TON, VIC, MAN) recorded most (75 %) of the EHITs reported by the AQ monitoring stations in Catalonia (25 %, 34 % and 16 %, respectively). The higher urban pattern of MAN, as shown by the higher NO concentrations, with respect to TON, might account for both the lower exceedances and the different interannual patterns.

Figure 10For the period 2005–2017, trends of the EHITs measured by air quality monitoring stations along the S–N axis. (a) Annual trends of the EHITs, average temperatures measured in Vic (Gurb) (July during 13:00 to 16:00 LT), background NO2 measured by OMI-NASA (June to August) and average solar radiation measured at Girona and Barcelona (June to August). (b) Monthly patterns of the EHITs, average temperatures measured in Vic, background NO2 measured by OMI and solar radiation measured at Girona and Barcelona. (c) Weekly patterns of the EHITs and background NO2 measured by OMI. (d) Hourly patterns of the EHITs. Despite the incomplete data availability in MAN 2005, almost 20 EHITs were recorded. AQ data from Ciutadella (CTL), Montcada (MON), Granollers (GRA), Montseny (MSY), Tona (TON), Vic (VIC), Manlleu (MAN) and Pardines (PAR) monitoring stations.
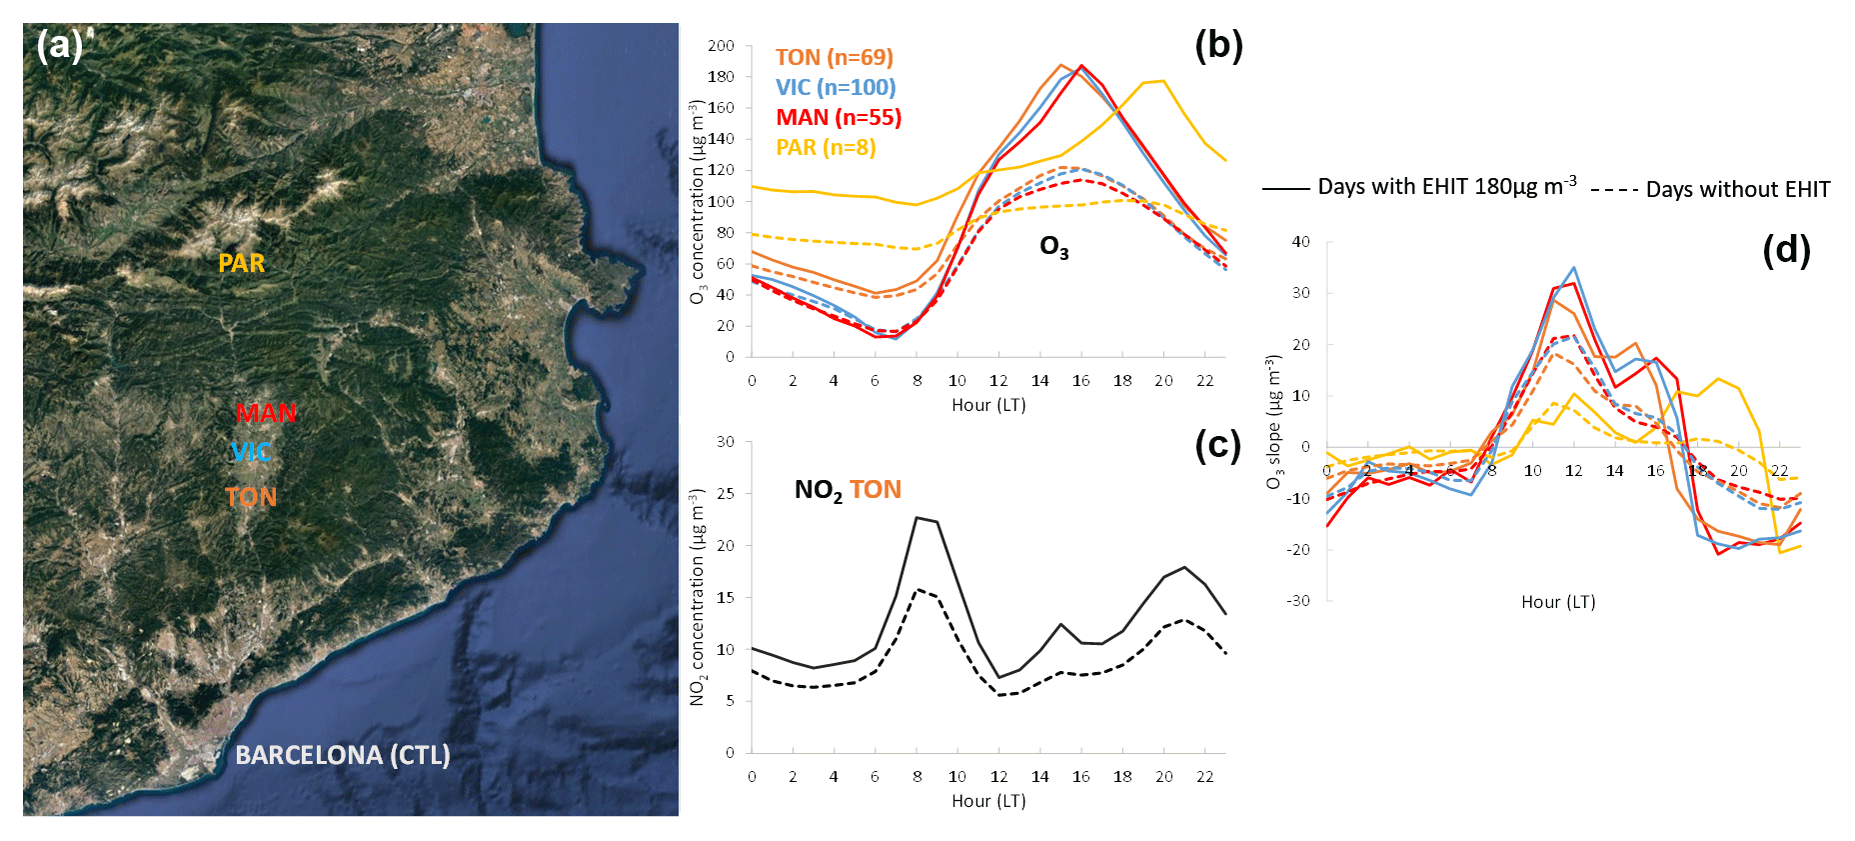
Figure 11Average hourly O3 concentrations for all days with EHIT records and those without for Tona (TON), Vic (VIC), Manlleu (MAN) and Pardines (PAR) air quality monitoring stations, (b) as well as for the NO2 levels at TON (c). Average hourly increments of O3 concentrations for all days with and without EHIT records (d); in all cases for June–August 2005–2017.
Figure 10b shows that most EHITs occurred in June and July (30 % and 57 %, respectively), with much less frequency in May, August and September (6 %, 8 % and <1 %, respectively). Although temperatures are higher in August than in June, the latter registers significantly more EHITs, probably due to both the stronger solar radiation and the higher concentrations of precursors (such as NO2; see OMI-NO2 and solar radiation in Fig. 10b).
Figure 10c shows that EHITs occurred mainly between Tuesday and Friday (average of 19 % of occurrences per day). On weekends and Mondays, EHITs were clearly lower (average of 9 % of occurrences per day) than during the rest of the week, probably due to (i) the lower emissions of anthropogenic O3 precursors (such as NOx; see OMI-NO2) during weekends and (ii) the effect of the lower Sunday emissions in the case of the lower exceedances recorded during Mondays. During weekends and in August, OMI-NO2 along the S–N axis is relatively lower (−29 % weekday average and −43 % in August with respect to March) following the emissions patterns associated with industrial and traffic activity that drop during vacations and weekends (Fig. 10). NOx data from AQ monitoring sites follow similar patterns (not shown here).
Figure 10d shows that the frequency of occurrence of the EHITs at MSY (45 km north of Barcelona) is lower and earlier (maxima at 14:00 LT) than at Vic Plain sites (TON, VIC, MAN). The EHITs occurred mostly at 15:00, 16:00, 16:00 and 19:00 LT at TON, VIC, MAN and PAR (53, 63, 72 and 105 km north of Barcelona), respectively. PAR registered not only much later EHITs, but a much lower number than TON–VIC–MAN sites, again confirming the progressive O3 maxima time shift northward of Barcelona.
The results in Fig. 11b clearly show that during non-EHIT days, the daily O3 patterns are governed by the morning–midday concentration growth driven to fumigation and photochemical production, while on EHIT days there is a later abrupt increase, with maxima being delayed as we increase the distance from Barcelona along the S–N axis. This maximal second increase in O3 is clearly attributable to the influence of the transport of the plume of the BMA (horizontal transport), as the secondary NO2 peak at 15:00 LT (Fig. 11c) and the wind patterns (see Fig. S3) seem to confirm. The differences in the late hourly O3 concentration increases in EHIT versus non-EHIT days are even more evident when calculating hourly O3 slopes (hourly increments or decrements of concentrations); see Fig. 11d. The first increment (fumigation and photochemistry) makes O3 levels scale up to 120 µg m−3 during EHIT episodes and to nearly 100 µg m−3 during non-EHIT days. On EHIT days, the later peak (transport from the BMA and causing most of the 180 µg m−3 exceedances) in the O3 slope occurs again between 14:00 and 20:00 LT, depending on the distance to BMA, but this feature is not observed on non-EHIT days.
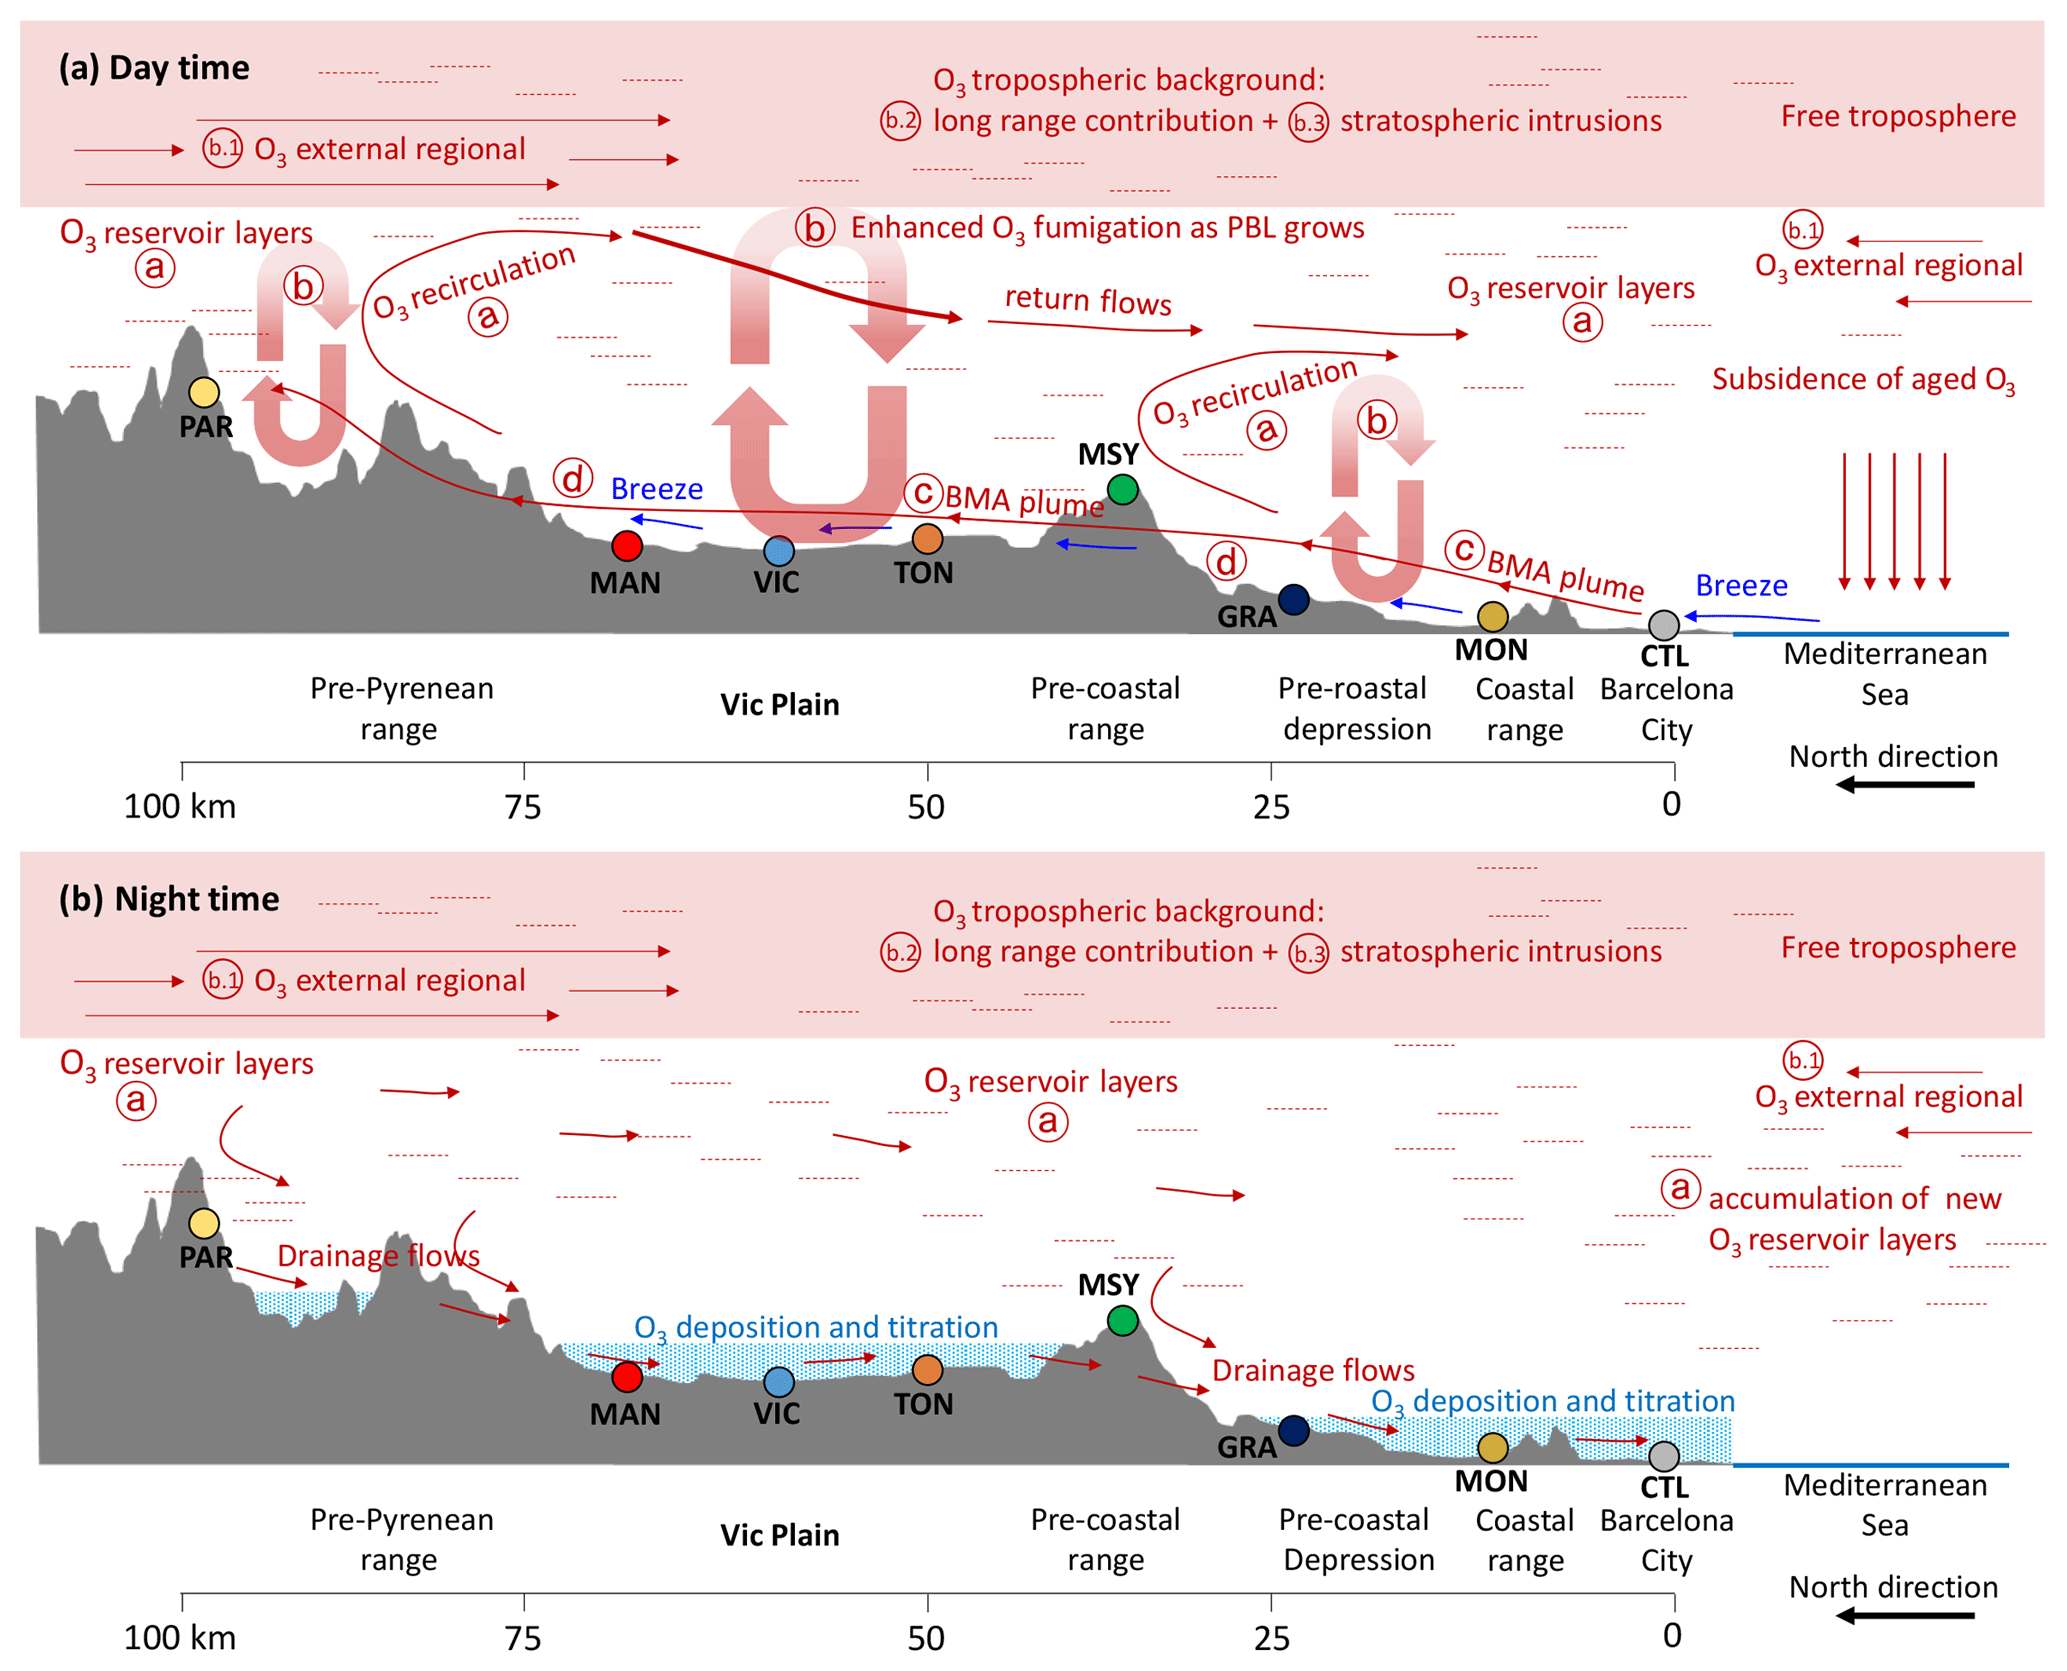
Figure 12Idealized two-dimensional section of O3 circulations in the coastal region of Barcelona to the Pre-Pyrenees on a typical summer day (a) and night (b). The gray shaded shape represents a topographic profile in the south-to-north direction from the Mediterranean Sea to the southern slopes of the Pre-Pyrenean ranges (i.e., along the S–N axis). The colored dots and abbreviations depict the air quality monitoring stations located along the S–N axis: Ciutadella (CTL), Montcada (MON), Granollers (GRA), Montseny (MSY), Tona (TON), Vic (VIC), Manlleu (MAN) and Pardines (PAR). Modified and adapted to the S–N axis from Millán et al. (1997, 2000) and Querol et al. (2017, 2018).
3.4 Relevance of local/regional pollution plumes in high O3 episodes in northeastern Spain
Figure 12 depicts the basic atmospheric dynamics in the study area during a typical summer day, when the atmospheric conditions are dominated by mesoscale circulations. According to the previous references, indicated in Fig. 12 with enclosed numbering (coinciding with the numbering below), the following O3 contributions to surface concentrations in the study area can be differentiated.
- a.
Vertical recirculation of O3-rich air masses, which create reservoir layers of aged pollutants.
- b.
Vertical fumigation of O3 from the above reservoirs and the following sources aloft if the MLH growth is large enough.
- b1.
Regional external O3 layers (from other regions of southern Europe, such as southern France, Italy, Portugal and Tarragona)
- b2.
High free tropospheric O3 background due to hemispheric long-range transport
- b3.
High free tropospheric O3 background due to stratospheric intrusions
- b1.
- c.
Horizontal transport of O3. Diurnal BMA plume northward transported and channeled into the Besòs–Congost valleys.
- d.
Local production of O3 from precursors.
During summer, the intense land heating due to strong solar radiation begins early in the morning. The associated convective activity produces morning fumigation processes (letter b in Fig. 12) that bring down O3 from the reservoir layers aloft, creating sharp increases in O3 concentrations in the morning (see Figs. 11 and S3). The breeze transports air masses from the sea inland and creates a compensatory subsidence of aged pollutants (including O3) previously retained in reservoir and external layers and high free troposphere background aloft (Millán et al., 1997, 2000; Gangoiti et al., 2001). This subsided O3 then affects the marine boundary layer and reaches the city the following day with the sea breeze, producing nearly constant O3 concentrations in the city during the day (Figs. S3 and 9). As the breeze develops, coastal emissions and their photochemical products are transported inland, generating the BMA plume (letter c in Fig. 12) that, in addition to the daily generated O3, also contains recirculated O3 from the marine air masses. Furthermore, during the transport to the Vic Plain, new O3 is produced (letter d in Fig. 12) by the intense solar radiation and the O3 precursors emitted along the way (e.g., BVOCs from vegetation, NOx from industrial and urban areas and highways).
This new O3 gets mixed with the BMA plume and channeled northward to the S–N valleys until it reaches the Vic Plain and the southern slopes of the Pre-Pyrenees. As the BMA plume (loaded with O3 and precursors) travels northward, a second increase in O3 concentrations can be observed in the daily cycles of O3 at these sites (see Figs. 11 and S3). This was described as the second O3 peak by Millán et al. (2000).
The marked MLH increase in the Vic Plain compared with the BMA (Soriano et al., 2001; Querol et al., 2017) may produce a preferential and intensive top-down O3 transport (letter b in Fig. 12) from upper O3 layers (letters a, b.1, b.2 and b.3 in Fig. 12), contributing to high O3 surface concentrations. During the sea's/mountain breezes' development, some air masses are injected upward to the N and NW return flows (controlled by the synoptic circulations dominated by the high-pressure system over the Azores) aloft helped by the orography (e.g., southern slopes of mountains) and again transported back to the coastal areas where at late evening/night it can accumulate at certain altitudes in stably stratified layers.
Later, at night, land breezes returning to the coastal areas develop. Depending on the orography, these drainage flows of colder air traveling to the coastal areas can accumulate on the surface or keep flowing to the sea. The transported O3 is consumed along the course of the drainage flows by deposition and titration. Next day, the cycle starts anew, producing almost closed loops enhancing O3 concentrations throughout the days in the area. When the loop is active for several days, multiple O3 EHITs occur over the Vic Plain.
The main complexity of this system arises from the fact that all these vertical/horizontal and local/regional/hemispheric/stratospheric contributions are mixed and that all contribute to surface O3 concentrations with different proportions that may largely vary with time and space across the study area. However, for the most intense O3 episodes, the local–regional contribution might be very relevant to cause EHITs in the region. Furthermore, the intensity and frequency of O3 episodes are partially driven by the occurrence of heatwaves in summer and spring (Vautard et al., 2007; Gerova et al., 2007; Querol et al., 2016; Guo et al., 2017). If local and regional emissions of precursors are high, the intensity of the episodes will also be high. Thus, even though heatwave occurrences increase the severity of O3 episodes, an effort to reduce precursors should be undertaken to decrease their intensity.
The generation of the O3 episodes in 2005–2017 for the S–N corridor BMA–Vic Plain–Pre-Pyrenees occurs in atmospheric scenarios described in detail by Millán et al. (1997, 2000, 2002), Gangoiti et al. (2001), Kalabokas et al. (2007, 2008, 2017), Millán (2014) and Querol et al. (2018) for other regions of the Mediterranean basin, including Spain, or described in the same area for specific episodes (Toll and Baldasano, 2000; Gonçalves et al., 2009; Valverde et al., 2016; Querol et al., 2017). However, results from our study show a higher role of the local–regional emissions in the occurrence of O3 EHITs. Thus, our results demonstrate an increase in the EHITs northward from Barcelona to around 70 km and a decrease from there to 100 km from Barcelona following the same direction. There is also a higher frequency of occurrence of these in July (and June) and from Tuesday to Friday and a time shift in the frequency of occurrence of EHITs from 45 to 100 km. The mountain site of MSY (located at 700 m a.s.l.) registered many fewer EHITs than the sites in the valleys (TON–VIC–MAN, 460–600 m a.s.l.) during the period, showing the key role of the valley in channeling the high O3 and precursor BMA plume in July (when sea breeze and insolation are more intense). Furthermore, in the Vic Plain, we detected an inverse O3 weekend effect, suggesting that local–regional anthropogenic emissions of precursors play a key role in increasing the number of EHITs on working days, with a Friday/Sunday rate of 5 for VIC for 2005–2017. Despite this clear influence of the BMA plume on EHIT occurrence, Querol et al. (2017) demonstrated that at high atmospheric altitudes (2000–3000 m a.s.l.) high O3 concentrations are recorded, in many cases reaching 150 µg m−3 due to the frequent occurrence of reservoir strata. As also described above, the higher growth of the MLH in TON–VIC–MAN as compared with the coastal area accounts also for higher top-down O3 contributions. On the other side, close to the Pyrenees (PAR station), large forested and more humid areas give rise to a thinner MLH, hindering O3 fumigation too. Furthermore, in these more distant northern regions O3 consumption by ozonolysis of BVOCs might prevail over production due to weaker solar radiation during the later afternoon.

Figure 13Daily average background NO2 levels in western Europe (a, b) and Catalonia (c, d), July 2005–2017, in two different scenarios. (a, c) P25: days when the maximum daily 8 h mean O3 concentrations in the Vic Plain are below percentile 25 (< 105 µg m−3) and (b, d) P75: same but with concentrations above percentile 75 (> 139.5 µg m−3).
Figure 13 shows the distribution of average background OMI-NO2 levels across the Western Mediterranean Basin in two different scenarios: when the O3 levels in the Vic Plain are low (left) or high (right). To this end, we averaged the values from VIC and TON (in the Vic Plain) from all the maximum daily 8 h mean O3 concentrations calculated for all the days in July within 2005–2017, and we calculated the 25th (93 out of 370 days, 105 µg m−3) and 75th (93 days, 139.5 µg m−3) percentiles of all the data (P25 and P75, respectively). For both scenarios, NO2 concentrations are highest around large urban and industrial areas, including Madrid, Porto, Lisbon, Barcelona, Valencia, Paris, Frankfurt, Marseille and especially the Po Valley. The shipping routes toward the Gibraltar Strait and around the Mediterranean can be observed, as well as important highways such as those connecting Barcelona to France and Lyon to Marseille. As expected, the mountain regions (the Pyrenees and the Alps) are the areas with lower NO2. Regional levels of background OMI-NO2 in the P75 scenario are markedly higher, with hotspots intensified and spanning over broader areas. Over Spain, new hotspots (marked in yellow), such as the coal-fired power plants in Asturias (a), ceramic industries in Castelló (c) and the coal-fired power plant in Andorra, Teruel (b), appear, in the latter case, with the pollution plume being channeled along the Ebro Valley with a NW transport. Furthermore, it is important to highlight that the maxima background NO2 along the eastern coastline in Spain, including the BMA, tends to exhibit some northerly–northwesterly displacement, when compared with the P25 scenario, thus pointing to the relevance of the local emissions in causing inland O3 episodes.
These qualitative results suggest in general less synoptic forcing in western Europe in the P75 scenario; hence, in these conditions NO2 is accumulated across the region, and especially around its sources. On the eastern coast of the Iberian Peninsula, mesoscale circulations tend to dominate, hence the northwestern displacement (taking the coastal regions as a reference) of the background NO2. The bottom part of Fig. 13 zooms our study area and shows the maximum daily 8 h mean O3 concentrations in all the selected AQ sites averaged for both scenarios. As shown in the P75 scenario, NO2 is significantly intensified across Catalonia, especially north of the BMA spreading to the Vic Plain. Comparing O3 in both scenarios, in the P75 the O3 levels are much higher (mostly > 105 µg m−3) across the region except for the urban sites in Barcelona (due to NO titration), reaching up to 154 µg m−3 in the Vic Plain.
Conversely, in the P25 scenario, background NO2 concentrations are lower, and the BMA NO2 spot is significantly smaller and spreads along the coastline rather than being displaced to the north–northwest. In this case, synoptic flows seem to weaken sea breeze circulations and vertical recirculation, thus reducing the amount of background NO2 and the inland transport from the coast. In these conditions, O3 levels are markedly lower across the territory, the RB PON site (downwind of the city/industrial area of Tarragona) being the one recording the maximum daily 8 h mean O3 concentration (99 µg m−3).
3.5 Sensitivity analysis for Ox using air quality monitoring data
We demonstrated above that the lower anthropogenic emissions of O3 precursors in the BMA during weekends cause lower O3 and Ox levels in the Vic Plain than during working days (inverse O3 weekend effect). To apply a sensitivity analysis using air quality monitoring data for the O3 levels in the Vic Plain if the BMA's emissions were reduced, we compared weekend O3 and Ox patterns with weekdays considering only data from June and July (August OMI-NO2 levels are markedly lower, Fig. 10b; therefore, this month was not included).
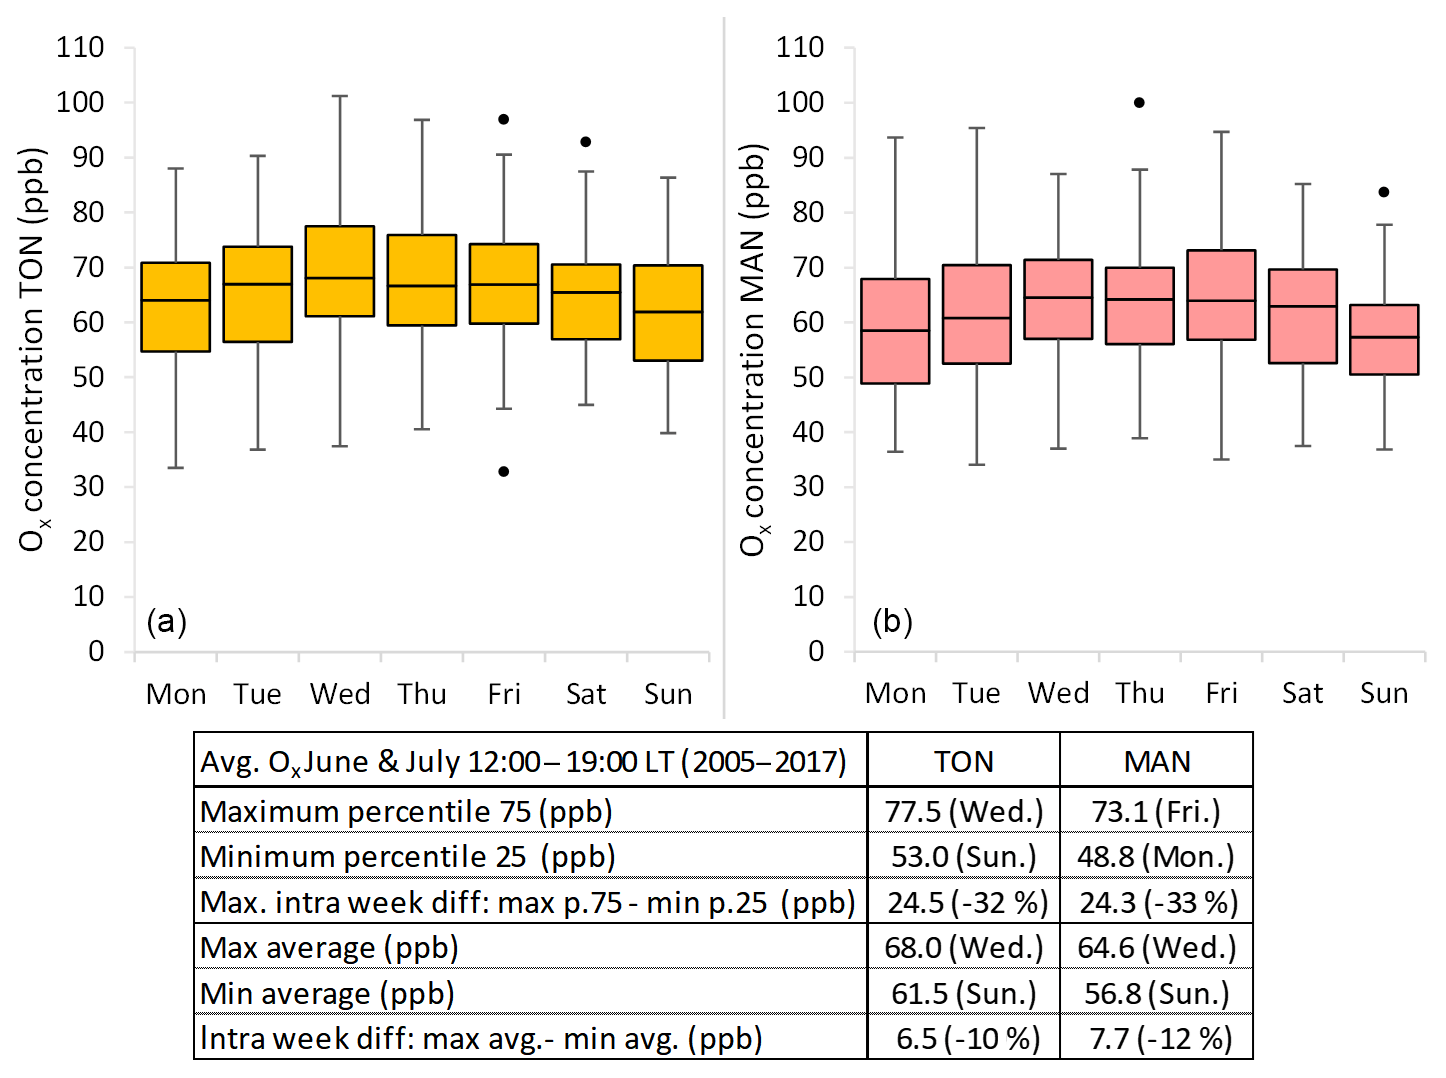
Figure 14Box plots of Ox measured in TON (a) and MAN (b) (12:00 to 19:00 LT) per weekday June and July 2005–2017 for those days with (n=545 for TON and n=479 for MAN of valid data). Each box represents the central half of the data between the lower quartile (P25) and the upper quartile (P75). The line across the box displays the median values. The whiskers that extend from the bottom and the top of the box represent the extent of the main body of data. The outliers are represented by black points.
Figure 14 shows the average Ox concentrations (12:00 to 19:00 LT) in TON (Fig. 14a) and MAN (Fig. 14b) (both AQ sites in the Vic Plain) according to the day of the week for the period considered. Data in VIC cannot be used for Ox calculations due to the lack of NO2 measurements. Despite the large variability in extreme values (i.e., maximum values with respect to minimum values, represented by whiskers), the interquartile range is quite constant on all the weekdays (between 13.6 and 17.3 ppb in TON and between 12.7 and 19.1 in MAN). The average Ox decrease between the days with the highest Ox levels (Wednesday in TON and Friday in MAN) and the days with the lowest Ox levels (Sunday in TON and Monday in MAN) is between 6.5 (TON) and 7.7 ppb (MAN), approximately 13 and 15 µg O3 m−3, a 10 %–12 % decrease. The observed decrements on Ox levels downwind of the BMA due to the reduction in O3 precursors' emissions in the BMA during weekends can give us a first approximation of the effect that episodic mitigation measures could have on the Ox or O3 levels in the Vic Plain. Thus, we considered feasible a scenario with a maximum potential of Ox reduction of 24.5 ppb (approximately 49 µg O3 m−3, 32 % decrease) when applying episodic mitigation measures (lasting 1–2 days equivalent to a weekend when, on average, NO and NO2 are reduced by 51 % and 21 %, respectively, compared with week days in the BMA monitoring sites). This was calculated as the difference between the P75 of Ox values observed on Wednesdays minus the P25 of Ox values on Sundays. Obviously, if these mitigation measures would be implemented structurally, instead of episodically, Ox and O3 decreases would probably be larger because not only would the local O3 coming from the BMA plume be reduced, but also the recirculated O3 and thus the intensity of O3 fumigation in the plain. Therefore, it is probable that both structural and episodic measures to abate VOCs and NOx emissions in the BMA would result in evident reductions of O3 in the Vic Plain, as evidenced by modeling tools by Valverde et al. (2016).
We analyzed 2005–2017 data sets on ozone (O3) concentrations in an area frequently affected by the northward atmospheric plume transport of the Barcelona metropolitan area (BMA) to the Vic Plain, the area of Spain recording the highest number of exceedances of the hourly O3 information threshold (EHIT, 180 µg m−3). We aimed at evaluating the potential benefits of implementing local short-term measures to abate emissions of precursors. To this end, we analyzed in detail spatial and time (interannual, weekly, daily and hourly) variations of the concentration of O3 and nitrogen oxides (including remote sensing data for the latter) in April–September and built a conceptual model for the occurrence of high O3 episodes. Finally, a sensitivity analysis is done with the AQ data to evaluate potential O3 reductions in the north of the BMA on Sundays, compared with weekdays, as a consequence of the reduction of emissions of precursors.
Results showed a generalized decrease trend for regional background O3 ranging from −1.1 % yr−1 to −1.6 % yr−1, as well as the well-known increase in urban O3 (+0.4 % yr−1 to +3.2 % yr−1) and higher urban NO decreasing slopes than those of NO2 (−2.2 % yr−1 to −4.3 % yr−1 and −1.3 % yr−1 to −2.0 % yr−1, respectively), which might account in part for the urban O3 increase.
The most intensive O3 episodes in the north of the BMA have O3 contributions from relatively high regional background O3 (due to a mix of continental, hemispheric–tropospheric and stratospheric contributions) as well as O3 surface fumigation from the mid-troposphere high-O3 upper layers arising from the concatenation of the vertical recirculation of air masses (as a result of the interaction of a complex topography with intensive spring–summer sea and mountain breeze circulations (Millán et al., 1997, 2000; Gangoiti et al., 2001; Valverde et al., 2016; Querol et al., 2017). However, we noticed that for most EHIT days in the Vic Plain, the exceedance occurs when an additional contribution is added to the previous two: O3 supply by the channeling of the BMA pollution plume along the S–N valley connecting the BMA and Vic. Thus, despite the large external O3 contributions, structural and short-time local measures to abate emissions of precursors might clearly influence spring–summer O3 in the Vic Plain. This is supported by (i) the reduced hourly exceedances of the O3 information threshold recorded on Sundays at the Vic AQ monitoring site (9 in 2005–2017) compared with those on Fridays (47), as well as by (ii) the occurrence of a typical and marked Sunday O3 pattern at the BMA AQ monitoring sites and an also marked but opposite one in the sites of the Vic Plain, and by (iii) a marked increase in remote sensing OMI-NO2 concentrations over the BMA and northern regions during days of the P75 diurnal O3 concentrations compared with those of the P25.
Finally, we calculated the difference between the P75 of Ox diurnal concentrations recorded at two of the Vic Plain AQ monitoring stations for Wednesdays minus those of the P25 percentile of Ox for Sundays, equivalent to 1–2 days of emissions reductions in the BMA. A maximum decrease potential by applying short-term measures of 24.5 ppb (approximately 49 µg O3 m−3, 32 % decrease) of the diurnal concentrations was calculated. Obviously, structurally implemented measures, instead of episodic ones, would result probably in important additional Ox and O3 abatements because not only the local O3 coming from the BMA plume would be reduced, but also the recirculated O3 and thus the intensity of O3 fumigation on the plain. Therefore, it is highly probable that both structural and episodic measures to abate NOx and VOC emissions in the BMA would result in evident reductions in O3 in the Vic Plain.
All data used in this study can be accessed here: https://doi.org/10.17632/7bjyfwzh7z.3 (Massagué, 2019).
The supplement related to this article is available online at: https://doi.org/10.5194/acp-19-7445-2019-supplement.
JM performed the data compilation, treatment and analysis with the aid of XQ, CC and ME. JM, CC, ME, JB, AA and XQ contributed to the discussion and interpretation of the results. JM and XQ wrote the manuscript. JM, CC, ME, JB, AA and XQ commented on the manuscript.
The authors declare that they have no conflict of interest.
We would like to thank the Department of Territory and Sustainability of the Generalitat de Catalunya for providing us with air quality data, and the Met Office from Catalonia (Meteocat) for providing meteorological data, as well as to NASA for providing OMI-NO2 data and the ICAEN-UPC for providing solar radiation measurements.
This research has been supported by the Agencia Estatal de Investigación from the Spanish Ministry of Science, Innovation and Universities and FEDER funds under the HOUSE project (CGL2016-78594-R), by the Spanish Ministerio para la Transición Ecológica (17CAES010/Encargo), by the Generalitat de Catalunya (AGAUR 2017 SGR41) and by the Agencia Estatal de Investigación for the PhD grant (FPI BES-2017-080027) awarded to Cristina Carnerero.
This paper was edited by Delphine Farmer and reviewed by two anonymous referees.
Ajuntament de Barcelona: Statistical yearbook of Barcelona City, Year 2010, Statistics department, Barcelona City Council, available at: https://bcnroc.ajuntament.barcelona.cat/jspui/handle/11703/91953 (last access: 13 April 2018), 2010.
Ajuntament de Barcelona: Statistical yearbook of Barcelona City, Year 2017, Statistics department, Barcelona City Council, available at: https://bcnroc.ajuntament.barcelona.cat/jspui/handle/11703/106244 (last access: 13 April 2018), 2017.
Baldasano, J. M., Cremades, L., and Soriano, C.: Circulation of Air Pollutants over the Barcelona Geographical Area in Summertime, in: Proceedings of the Sixth European Symposium on Physico-Chemical Behavior of Atmospheric Pollutants, Environmental Research Program of the European Community, edited by: Angeletti, G. and Restelli, G., Air Pollution Research Report EUR 15609/1, 474–479, 1994.
Carslaw, D. C. and Ropkins, K.: Openair – an R package for air quality data analysis, Environ. Model. Softw., 27–28, 52–61, 2012.
Carslaw, D. C., Murrells, T. P., Andersson, J., and Keenan, M.: Have vehicle emissions of primary NO2 peaked?, Faraday Discuss., 189, 439–454, https://doi.org/10.1039/C5FD00162E, 2016.
DEFRA: Department for Environment Food & Rural Affaris, Conversion Factors Between ppb and µg m−3 and ppm and mg m−3, available at: https://uk-air.defra.gov.uk/assets/documents/reports/cat06/0502160851_Conversion_Factors_Between_ppb_and.pdf (last access: 11 February 2018), 2014.
Dieguez, J. J., Millán, M., Padilla, L., and Palau, J. L.: Estudio y evaluación de la contaminación atmosférica por ozono troposférico en España, CEAM Report for the Ministry of Agriculture, Food and Environment, INF FIN/O3/2009, 372 pp., 2009.
Dieguez, J. J., Calatayud, V., and Mantilla, E.: CEAM Report for the Ministry of Agriculture, Food and Environment, Fundación Biodiversidad, Informe Final, Memoria Técnica Proyecto CONOZE, CONtaminación por OZono en España, 137 pp., 2014.
EC: Ozone dynamics in the Mediterranean Basin: A collection of scientific papers resulting from the MECAPIP, RECAPMA and SECAP Projects, Air Pollution Report 78, DG RTD I.2, LX 46 2/82, Brussels, 2002.
EC: European Commission Decision of 19 March 2004 “Concerning guidance for implementation of Directive 2002/3/EC of the European Parliament and the Council relating to ozone in ambient air (2004/279/EC), Official Journal of the European Union, L87/50, 2004.
EC: Directive 2008/50/EC of 21 May 2008, On ambient air quality and cleaner air for Europe, Off. J. Eur. Union, L152/1, available at: http://eur-lex.europa.eu/legal-content/ES/TXT/?uri= CELEX:32008L0050 (last access: 14 December 2017), 2008.
EEA: Air quality in Europe – 2015 report, EEA Report, No 5/2015, ISSN 1977-8449, 57 pp., 2015.
EEA: Air quality in Europe – 2016 report, EEA Report, No 28/2016, ISSN 1977-8449, 83 pp., 2016.
EEA: Air quality in Europe – 2018 report, EEA Report, No 12/2018, ISSN 1977-8449, 88 pp., 2018.
EMEP-CCC: Air pollution trends in the EMEP region between 1990 and 2012, EMEPCCC-Report 2016/1, 102 pp., available at: https://www.unece.org/fileadmin/DAM/env/documents/2016/AIR/Publications/Air_pollution_trends_in_the_EMEP_region.pdf (last access: 23 January 2018), 2016.
Finlayson-Pitts, B. J. and Pitts Jr., J. N.: Atmospheric chemistry of tropospheric ozone formation: scientific and regulatory implications, Air Waste, 43, 1091–1100, https://doi.org/10.1080/1073161X.1993.10467187, 1993.
Fowler, D., Pilegaard, K., Sutton, M. A., Ambus, P., Raivonen, M., Duyzer, J., Simpson, D., Fagerli, H., Fuzzi, S., Schjoerring, J. K., Granier, C., Neftel, A., Isaksen, I. S. A., Laj, P., Maione, M., Monks, P. S., Burkhardt, J., Daemmgen, U., Neirynck, J., Personne, E., Wichink-Kruit, R., Butterbach-Bahl, K., Flechard, C., Tuovinen, J. P., Coyle, M., Gerosa, G., Loubet, B., Altimir, N., Gruenhage, L., Ammann, C., Cieslik, S., Paoletti, E., Mikkelsen, T. N., Ro-Poulsen, H., Cellier, P., Cape, J. N., Horvath, L., Loreto, F., Niinemets, U., Palmer, P. I., Rinne, J., Misztal, P., Nemitz, E., Nilsson, D., Pryor, S., Gallagher, M. W., Vesala, T., Skiba, U., Brueggemann, N., Zechmeister-Boltenstern, S., Williams, J., O'Dowd, C., Facchini, M. C., de Leeuw, G., Flossman, A., Chaumerliac, N., and Erisman, J. W.: Atmospheric composition change: Ecosystems-Atmosphere interactions, Atmos. Environ., 43, 5193–5267, https://doi.org/10.1016/j.atmosenv.2009.07.068, 2009.
Gangoiti, G., Millán, M. M., Salvador, R., and Mantilla, E.: Long-range transport and re-circulation of pollutants in the western Mediterranean during the project Regional Cycles of Air Pollution in the West-Central Mediterranean Area, Atmos. Environ., 35, 6267–6276, https://doi.org/10.1016/S1352-2310(01)00440-X, 2001.
GBD: Global Burden of Disease Study 2016 Cause-Specific Mortality 1980–2016, Seattle, United States: Institute for Health Metrics and Evaluation (IHME), 2016.
GC: Geoinformation Air Quality information, Departament de Territori I sostenibilitat, Generalitat de Catalunya, available at: https://analisi.transparenciacatalunya.cat/en/Medi-Ambient/Dades-d-immissi-dels-punts-de-mesurament-de-la-Xar/uy6k-2s8r (last access: 23 February 2018), 2017a.
GC: Zones de qualitat de l'aire (ZQA), Departament de Territori I sostenibilitat, Generalitat de Catalunya, available at: http://mediambient.gencat.cat/web/.content/home/ambits_dactuacio/atmosfera/qualitat_de_laire/avaluacio/xarxa_de_vigilancia_i_previsio_de_la_contaminacio_atmosferica__xvpca/ZQA/Llista-de-relacio-de-municipis-i-ZQA.PDF (last access: 23 January 2018), 2017b.
GC: Catalonia GHG Emissions. Catalan Office of Climate Change, Generalitat de Catalunya, available at: http://canviclimatic.gencat.cat/ca/politiques/inventaris_d_emissions_de_geh/emissions_de_geh_a_catalunya/ (last access: 13 February 2018), 2017c.
Gerasopoulos, E., Kouvarakis, G., Vrekoussis, M., Kanakidou, M., and Mihalopoulos, N.: Ozone variability in the marine boundary layer of the Eastern Mediterranean based on 7-year observations, J. Geophys. Res., 110, D15309, https://doi.org/10.1029/2005JD005991, 2005.
Gonçalves, M., Jiménez-Guerrero, P., and Baldasano, J. M.: Contribution of atmospheric processes affecting the dynamics of air pollution in South-Western Europe during a typical summertime photochemical episode, Atmos. Chem. Phys., 9, 849–864, https://doi.org/10.5194/acp-9-849-2009, 2009.
Guerova, G. and Jones, N.: A global model study of ozone distributions during the August 2003 heat wave in Europe, Environ. Chem., 4, 285–292, 2007.
Guo, Y., Gasparrini, A., Armstrong, B. G., Tawatsupa, B., Tobias, A., Lavigne, E., de Sousa Zanotti Stagliorio Coelho, M., Pan, X., Kim, H., Hashizume, M., Honda, Y., Guo, Y.-L. L., Wu, Ch.-F., Zanobetti, A., Schwartz, J. D., Bell, M. L., Scortichini, M., Michelozzi, P., Punnasiri, K., Li, S., Tian, L., Osorio Garcia, S. D., Seposo, X., Overcenco, A., Zeka, A., Goodman, P., Dang, T. N., Dung, D. V., Mayvaneh, F., Saldiva, P. H. N., Williams, G., and Tong, S.: Temperature variability and mortality: a multi-country study, Environ. Health Persp., 124, 1554–1559, 2016.
Hewitt, C. N., Ashworth, K., Boynard, A., Guenther, A., Langford, B., MacKenzie, A. R., Misztal, P. K., Nemitz, E., Owen, S. M., Possell, M., Pugh, T. A. M., Ryan, A. C., and Wild, O.: Groundlevel ozone influenced by circadian control of isoprene emissions, Nat. Geosci., 4, 671–674, https://doi.org/10.1038/ngeo1271, 2011.
ICAEN-UPC: Xarxa de Mesura de la Irradiància Solar a Catalunya, available at: http://icaen.gencat.cat/ca/detalls/publicacio/Atlas-de-radiacio-solar-a-Catalunya-00003 (last access: 3 June 2019), 2018.
IPCC: Climate Change 2013, The Physical Science Basis, Working Group I Contribution to the Fifth Assessment Report of the Intergovernmental Panel on Climate Change, edited by: Stocker, T. F., Qin, D., Plattner, G.-K., Tignor, M. M. B., Allen, S. K., Boschung, J., Nauels, A., Xia, Y., Bex, V., and Midgley, P. M., Cambridge University Press, Cambridge, UK, New York, NY, USA, 2013.
Jacob, D. and Winner, D.: Effect of climate change on air quality, Atmos. Environ., 43, 51–63, 2009.
Jiménez, P. and Baldasano, J. M.: Ozone response to precursor controls in very complex terrains: use of photochemical indicators to assess O3-NOx-VOC sensitivity in the northeastern Iberian Peninsula, J. Geophys. Res., 109, D20309, https://doi.org/10.1029/2004JD00498, 2004.
Kalabokas, P. D., Volz-Thomas, A., Brioude, J., Thouret, V., Cammas, J.-P., and Repapis, C. C.: Vertical ozone measurements in the troposphere over the Eastern Mediterranean and comparison with Central Europe, Atmos. Chem. Phys., 7, 3783–3790, https://doi.org/10.5194/acp-7-3783-2007, 2007.
Kalabokas, P. D., Mihalopoulos, N., Ellul, R., Kleanthous, S., and Repapis, C. C.: An investigation of the meteorological and photochemical factors influencing the background rural and marine surface ozone levels in the Central and Eastern Mediterranean, Atmos. Environ., 42, 7894–7906, 2008.
Kalabokas, P., Hjorth, J., Foret, G., Dufour, G., Eremenko, M., Siour, G., Cuesta, J., and Beekmann, M.: An investigation on the origin of regional springtime ozone episodes in the western Mediterranean, Atmos. Chem. Phys., 17, 3905–3928, https://doi.org/10.5194/acp-17-3905-2017, 2017.
Kley, D. and Geiss, H.: Tropospheric ozone at elevated sites and precursor emissions in the United States and Europe, Atmos. Environ., 8, 149–158, 1994.
Krotkov, N. and Veefkind, P.: OMI/Aura Nitrogen Dioxide (NO2) Total and Tropospheric Column 1-orbit L2 Swath 13×24 km V003, Greenbelt, MD, USA, Goddard Earth Sciences Data and Information Services Center (GES DISC), https://doi.org/10.5067/Aura/OMI/DATA2017, 2016.
Lelieveld, J., Berresheim, H., Borrmann, S., Crutzen, P. J., Dentener, F. J., Fischer, H., Feichter, J., Flatau, P. J., Heland, J., Holzinger, R., Korrmann, R., Lawrence, M. G., Levin, Z., Markowicz, K. M., Mihalopoulos, N., Minikin, A., Ramanathan, V., de Reus, M., Roelofs, G. J., Scheeren, H. A., Sciare, J., Schlager, H., Schultz, M., Siegmund, P., Steil, B., Stephanou, E. G., Stier, P., Traub, M., Warneke, C., Williams, J., and Ziereis, H.: Global air pollution crossroads over the Mediterranean, Science, 298, 794–799, 2002.
Logan, J. A.: Tropospheric ozone – seasonal behaviour, trends, and anthropogenic influence, J. Geophys. Res.-Atmos., 90, 10463–10482, 1985.
Mantilla, E., Millán, M. M., Sanz, M. J., Salvador, R., and Carratalá, A.: Influence of mesometeorological processes on the evolution of ozone levels registered in the Valencian Community, in: I Technical workshop on ozone pollution in southern Europe, Valencia, 1997.
Massagué, J.: Air Quality, Solar radiation, Meteorological and OMI data Catalonia and northern Barcelona, 2005–2017, Mendeley Data, v3 https://doi.org/10.17632/7bjyfwzh7z.3, 2019.
McLinden, C. A., Olsen, S. C., Hannegan, B., Wild, O., Prather, M. J., and Sundet, J.: Stratospheric ozone in 3-D models: A simple chemistry and the cross-tropopause flux, J. Geophys. Res.-Atmos., 105, 14653–14665, https://doi.org/10.1029/2000jd900124, 2000.
Meehl, G. A., Tebaldi, C., Tilmes, S., Lamarque, J. F., and Bates, S.: Future heat waves and surface ozone, Environ. Res. Lett., 13, 064004, https://doi.org/10.1088/1748-9326/aabcdc, 2018.
Meteocat: Meteorological Office of Catalonia, Request of meteoro- logical data reports, available at: http://www.meteo.cat/wpweb/serveis/formularis/peticio-dinformes-i-dades-meteorologiques/, (last access: 20 May 2019), 2017.
MFom: Ministerio de Fomento: Áreas urbanas en España 2017, Dirección General de Arquitectura, Vivienda y Suelo, available at: http://atlasau.fomento.gob.es, last access: 6 December 2017.
Millán, M. M.: El ozono troposférico en el sur de Europa: aspectos dinámicos documentados en proyectos europeos, CEAM Report for the Ministry of Agriculture, Food and Environment, INF FIN/O3/2009(annex), 156 pp., available at: http://www.mapama.gob.es/es/calidad-y-evaluacion-ambiental/temas/atmosfera-y-calidad-del-aire/Ozono Troposf\'{e}rico en el sur de Europa-Actualizacion-2009_ tcm30-187999.pdf (last access: 13 February 2018), 2009.
Millán, M. M.: Extreme hydrometeorological events and climate change predictions in Europe, J. Hydrol., 518, 206–224, 2014.
Millán, M. M., Salvador, R., Mantilla, E., and Kallos, G.: Photooxidant dynamics in the Mediterranean basin in summer: Results from European research projects, J. Geophys. Res., 102, 8811–8823, 1997.
Millán, M. M., Mantilla, E., Salvador, R., Carratalá, A., Sanz, M. J., Alonso, L., Gangoiti, G., and Navazo, M.: Ozone Cycles in the Western Mediterranean Basin: Interpretation of Monitoring Data in Complex Coastal Terrain, J. Appl. Meteorol., 39, 487–508, 2000.
Millán, M. M., Sanz, M. J., Salvador, R., and Mantilla, E.: Atmospheric dynamics and ozone cycles related to nitrogen deposition in the western Mediterranean, Environ. Pollut., 118, 167–186, 2002.
Monks, P. S., Archibald, A. T., Colette, A., Cooper, O., Coyle, M., Derwent, R., Fowler, D., Granier, C., Law, K. S., Mills, G. E., Stevenson, D. S., Tarasova, O., Thouret, V., von Schneidemesser, E., Sommariva, R., Wild, O., and Williams, M. L.: Tropospheric ozone and its precursors from the urban to the global scale from air quality to short-lived climate forcer, Atmos. Chem. Phys., 15, 8889–8973, https://doi.org/10.5194/acp-15-8889-2015, 2015.
Olson, J. R., Crawford, J. H., Davis, D. D., Chen, G., Avery, M. A., Barrick, J. D. W., Sachse, G. W., Vay, S. A., Sandholm, S. T., Tan, D., Brune, W. H., Faloona, I. C., Heikes, B. G., Shetter, R. E., Lefer, B. L., Singh, H. B., Talbot, R. W., and Blake, D. R.: Seasonal differences in the photochemistry of the South Pacific: A comparison of observations and model results from PEM-Tropics A and B, J. Geophys. Res., 106, 32749–32766, 2001.
OMI Team: Ozone Monitoring Instrument (OMI) Data User's Guide, available at: https://docserver.gesdisc.eosdis.nasa.gov/repository/Mission/OMI/3.3_ScienceDataProductDocumentation/3.3.2_ProductRequirements_Designs/README.OMI_DUG.pdf (last access: 2 January 2018), 2012.
Otero, N., Sillmann, J., Schnell, J. L., Rust, H. W., and Butler, T.: Synoptic and meteorological drivers of extreme ozone concentrations over Europe, Environ. Res. Lett., 11, 24005, https://doi.org/10.1088/1748-9326/11/2/024005, 2016.
Paoletti, E., De Marco, A., Beddows, D. C. S., Harrison, R. M., and Manning, W. J.: Ozone levels in European and USA cities are increasing more than at rural sites, while peak values are decreasing, Environ. Pollut., 192, 295–299, https://doi.org/10.1016/j.envpol.2014.04.040, 2014.
Pay, M. T., Gangoiti, G., Guevara, M., Napelenok, S., Querol, X., Jorba, O., and Pérez García-Pando, C.: Ozone source apportionment during peak summer events over southwestern Europe, Atmos. Chem. Phys., 19, 5467–5494, https://doi.org/10.5194/acp-19-5467-2019, 2019.
Pusede, S. E., Steiner, A. L., and Cohen, R. C.: Temperature and recent trends in the chemistry of continental surface ozone, Chem. Rev., 115, 3898–3918, 2015.
Pyrgou, A., Hadjinicolaou, P., and Santamouris, M.: Enhanced near-surface ozone under heatwave conditions in a Mediterranean island, Sci. Rep., 8, 9191, https://doi.org/10.1038/s41598-018-27590-z, 2018.
Querol, X., Alastuey, A., Orio, A., Pallares, M., Reina, F., Dieguez, J. J., Mantilla, E., Escudero, M., Alonso, L., Gangoiti, G., and Millán, M.: On the origin of the highest ozone episodes in Spain, Sci. Total Environ., 572, 379–389, 2016.
Querol, X., Gangoiti, G., Mantilla, E., Alastuey, A., Minguillón, M. C., Amato, F., Reche, C., Viana, M., Moreno, T., Karanasiou, A., Rivas, I., Pérez, N., Ripoll, A., Brines, M., Ealo, M., Pandolfi, M., Lee, H.-K., Eun, H.-R., Park, Y.-H., Escudero, M., Beddows, D., Harrison, R. M., Bertrand, A., Marchand, N., Lyasota, A., Codina, B., Olid, M., Udina, M., Jiménez-Esteve, B., Soler, M. R., Alonso, L., Millán, M., and Ahn, K.-H.: Phenomenology of high-ozone episodes in NE Spain, Atmos. Chem. Phys., 17, 2817–2838, https://doi.org/10.5194/acp-17-2817-2017, 2017.
Querol, X., Alastuey, A., Gangoiti, G., Perez, N., Lee, H. K., Eun, H. R., Park, Y., Mantilla, E., Escudero, M., Titos, G., Alonso, L., Temime-Roussel, B., Marchand, N., Moreta, J. R., Revuelta, M. A., Salvador, P., Artíñano, B., García dos Santos, S., Anguas, M., Notario, A., Saiz-Lopez, A., Harrison, R. M., Millán, M., and Ahn, K.-H.: Phenomenology of summer ozone episodes over the Madrid Metropolitan Area, central Spain, Atmos. Chem. Phys., 18, 6511–6533, https://doi.org/10.5194/acp-18-6511-2018, 2018.
Safieddine, S., Boynard, A., Coheur, P.-F., Hurtmans, D., Pfister, G., Quennehen, B., Thomas, J. L., Raut, J.-C., Law, K. S., Klimont, Z., Hadji-Lazaro, J., George, M., and Clerbaux, C.: Summertime tropospheric ozone assessment over the Mediterranean region using the thermal infrared IASI/MetOp sounder and the WRF-Chem model, Atmos. Chem. Phys., 14, 10119–10131, https://doi.org/10.5194/acp-14-10119-2014, 2014.
Salvador, R., Millán, M. M., Mantilla, E., and Baldasano, J. M.: Mesoscale modelling of atmospheric processes over the western Mediterranean area during summer, Int. J. Environ. Pollut., 8, 513–528, 1997.
Sen, P. K.: Estimates of regression coefficient based on Kendall's tau, J. Am. Stat. Assoc., 63, 1379–1389, https://doi.org/10.2307/2285891, 1968.
Sicard, P., De Marco, A., Troussier, F., Renou, C., Vas, N., and Paoletti, E.: Decrease in surface ozone concentrations at Mediterranean remote sites and increase in the cities, Atmos. Environ., 79, 705–715, 2013.
Solberg, S., Hov, Ø., Søvde, A., Isaksen, I. S. A., Coddeville, P., De Backer, H., Forster, C., Orsolini, Y., and Uhse, K.: European surface ozone in the extreme summer 2003, J. Geophys. Res., 113, D07307, https://doi.org/10.1029/2007JD009098, 2008.
Soriano, C., Baldasano, J. M., Buttler, W. T., and Moore, K.: Circulatory patterns of air pollutants within the Barcelona air basin in a summertime situation: lidar and numerical approaches, Bound.-Lay. Meteorol., 98, 33–55, 2001.
Stein, A. F., Mantilla, E., and Millán, M. M.: Ozone formation downwind an industrial complex in the western Mediterranean, in: 13th World Clean Air and Environmental Protection, London, UK, 22–27 August 2004.
Stevenson, D. S., Dentener, F. J., Schultz, M. G., Ellingsen, K., van Noije, T. P. C., Wild, O., Zeng, G., Amann, M., Atherton, C. S., Bell, N., Bergmann, D. J., Bey, I., Butler, T., Cofala, J., Collins, W. J., Derwent, R. G., Doherty, R. M., Drevet, J., Eskes, H. J., Fiore, A. M., Gauss, M., Hauglustaine, D. A., Horowitz, L. W., Isaksen, I. S. A., Krol, M. C., Lamarque, J. F., Lawrence, M. G., Montanaro, V., Muller, J. F., Pitari, G., Prather, M. J., Pyle, J. A., Rast, S., Rodriguez, J. M., Sanderson, M. G., Savage, N. H., Shindell, D. T., Strahan, S. E., Sudo, K., and Szopa, S.: Multimodel ensemble simulations of present-day and near-future tropospheric ozone, J. Geophys. Res.-Atmos., 111, D08301, https://doi.org/10.1029/2005jd006338, 2006.
Theil, H.: A rank invariant method of linear and polynomial regression analysis – Part I, P. K. Ned. Akad. A Math., 53, 386–392, 1950a.
Theil, H.: A rank invariant method of linear and polynomial regression analysis – Part II, P. K. Ned. Akad. A Math., 53, 521–525, 1950b.
Theil, H.: A rank invariant method of linear and polynomial regression analysis – Part III, P. K. Ned. Akad. A Math., 53, 1397–1412, 1950c.
Toll, I. and Baldasano, J. M.: Modeling of photochemical air pollution in the Barcelona area with highly disaggregated anthropogenic and biogenic emissions, Atmos. Environ., 34, 3069–3084, https://doi.org/10.1016/S1352-2310(99)00498-7, 2000.
UNECE: Hemispheric transport of air pollution 2010, Part A: ozone and particulate matter, Air pollution studies, 17, UNECE, LRTAP, Task Force on Hemispheric Transport of Pollutants HTAP 2010: Part A. Ozone and Particulate Matter, 278 pp., ECE/EB.AIR/100, available at: http://www.htap.org/publications/2010_report/2010_Final_Report/HTAP 2010 Part A 110407.pdf (last access: 3 November 2017), 2010.
Valverde, V., Pay M. T., and Baldasano, J. M.: Ozone attributed to Madrid and Barcelona on-road transport emissions: Characterization of plume dynamics over the Iberian Peninsula, Sci. Total Environ., 543, 670–682, 2016.
Vautard, R., Beekmann, M., Desplat, J., Hodzic, A., and Morel, S.: Air quality in Europe during the summer of 2003 as a prototype of air quality in a warmer climate, CR Geosci., 339, 747–763, https://doi.org/10.1016/j.crte.2007.08.003, 2007.
WHO: Air Quality Guidelines: Global Update 2005, Particulate matter, ozone, nitrogen dioxide and sulfur dioxide, World Health Organisation, Copenhagen, 484 pp., available at: http://www.euro.who.int/__data/assets/pdf_ file/0005/78638/E90038.pdf (last access: 23 November 2017), 2006.
WHO Regional Office for Europe: Review of evidence on health aspects of air pollution–REVIHAAP project: technical report, WHO Regional Office for Europe, Copenhagen, 302 pp., available at: http://www.euro.who.int/__data/assets/pdf_file/0004/193108/REVIHAAP-Final-technical-report-final-version.pdf?ua=1 (last access: 23 January 2018), 2013a.
WHO Regional Office for Europe: Health Risks of Air Pollution in Europe–HRAPIE Project: Recommendations for Concentration-Response Functions for Cost–Benefit Analysis of Particulate Matter, Ozone and Nitrogen Dioxide, Copenhagen, 65 pp., available at: http://www.euro.who.int/__data/assets/pdf_file/0017/234026/e96933.pdf?ua=1 (last access: 23 January 2018), 2013b.
Young, P. J., Archibald, A. T., Bowman, K. W., Lamarque, J.-F., Naik, V., Stevenson, D. S., Tilmes, S., Voulgarakis, A., Wild, O., Bergmann, D., Cameron-Smith, P., Cionni, I., Collins, W. J., Dalsøren, S. B., Doherty, R. M., Eyring, V., Faluvegi, G., Horowitz, L. W., Josse, B., Lee, Y. H., MacKenzie, I. A., Nagashima, T., Plummer, D. A., Righi, M., Rumbold, S. T., Skeie, R. B., Shindell, D. T., Strode, S. A., Sudo, K., Szopa, S., and Zeng, G.: Pre-industrial to end 21st century projections of tropospheric ozone from the Atmospheric Chemistry and Climate Model Intercomparison Project (ACCMIP), Atmos. Chem. Phys., 13, 2063–2090, https://doi.org/10.5194/acp-13-2063-2013, 2013.