the Creative Commons Attribution 4.0 License.
the Creative Commons Attribution 4.0 License.
 | 23 May 2019
Evaluating the “2+26” regional strategy for air quality improvement during two air pollution alerts in Beijing: variations in PM2.5 concentrations, source apportionment, and the relative contribution of local emission and regional transport
Ziyue Chen
Danlu Chen
Wei Wen
Yan Zhuang
Mei-Po Kwan
Bin Chen
Bo Zhao
Bingbo Gao
Ruiyuan Li
Bing Xu
To comprehensively evaluate the effects of the recent “2+26” regional strategy for air quality improvement, we compared the variations in PM2.5 concentrations in Beijing during four pollution episodes with different emission-reduction strategies. The 2+26 strategy implemented in March 2018 led to a mean PM2.5 concentration 16.43 % lower than that during the pollution episode in March 2013, when no specific emission-reduction measures were in place. The same 2+26 strategy implemented in November 2017 led to a mean PM2.5 concentration 32.70 % lower than that during the pollution episode in November 2016, when local emission-reduction measures were implemented. The results suggested that the effects of the 2+26 regional emission-reduction measures on PM2.5 reductions were influenced by a diversity of factors and could differ significantly during specific pollution episodes. Furthermore, we found the proportions of sulfate ions decreased significantly, and nitrate ions were the dominant PM2.5 components during the two 2+26 orange alert periods. Meanwhile, the relative contribution of coal combustion to PM2.5 concentrations in Beijing during the pollution episodes in March 2013, November 2016, November 2017 and March 2018 was 40 %, 34 %, 28 % and 11 %, respectively, indicating that the recent “Coal to Gas” project and the contingent 2+26 strategy led to a dramatic decrease in coal combustion in the Beijing–Tianjin–Hebei region. On the other hand, the relative contribution of vehicle exhaust during the 2+26 orange alert periods in November 2017 and March 2018 reached 40 % and 54 %, respectively. The relative contribution of local emissions to PM2.5 concentrations in Beijing also varied significantly and ranged from 49.46 % to 89.35 % during the four pollution episodes. These results suggested that the 2+26 regional emission-reduction strategy should be implemented with red air pollution alerts during heavy pollution episodes to intentionally reduce the dominant contribution of vehicle exhausts to PM2.5 concentrations in Beijing, while specific emission-reduction measures should be implemented accordingly for different cities within the 2+26 framework.
- Article
(6012 KB) - Full-text XML
- BibTeX
- EndNote


In January 2013, a severe haze episode with the highest ever concentration of hourly fine particulate matter with a diameter of less than 2.5 µm (PM2.5) occurred in Beijing (886 µg m−3), which attracted worldwide attention. Since 2013, Beijing, located in the Beijing–Tianjin–Hebei region, has been a heavily polluted area in China that suffers from continuous haze episodes associated with high concentrations of PM2.5, especially in winter. Given the significant negative influence of PM2.5 on public health (Garrett and Casimiro, 2011; Guaita et al., 2011; Pasca et al., 2014; Y. Li et al., 2015), the air quality management authority in Beijing has put growing emphasis on long-term environmental protection policies, including shutting down polluting factories and limiting vehicle use through license plate rules. However, total emissions of airborne pollutants remain at very high levels in Beijing, leading to frequent heavy pollution episodes (Guo et al., 2012). To mitigate this problem, contingent emission-reduction measures, in addition to regular environmental policies, are necessary in Beijing in order to improve local air quality during pollution episodes.
In 2013, the Beijing Municipal Government published the “Heavy Air Pollution Contingency Plan” and revised this plan in 2015 to better manage air quality during pollution episodes. According to the predicted concentrations of different airborne pollutants and the duration of pollution episodes, there are four levels of air pollution alerts for Beijing, which are blue, yellow, orange and red alerts. Specific emission-reduction measures are implemented when each type of air pollution alert is in effect. The red alert is the most stringent level of air pollution alerts and predicts severe air pollution episodes (air quality index, AQI, > 300) that will last for more than 3 d. Emission-reduction measures during red alerts mainly include the implementation of the odd–even license plate policy (only about half of all of the cars in Beijing are allowed to run within the fifth ring district each day), the suspension of all outdoor construction work and temporary shutdown of listed polluting factories. The orange alert predicts heavy air pollution episodes (AQI>200) that will last for more than 3 d. Emission-reduction measures during orange alerts mainly include forbidding vehicles that cannot meet the Environmental Standard Level I and II, the suspension of specific outdoor work (e.g., painting) and temporary shutdown of listed polluting factories (the list for red alerts includes more factories than that for orange alerts). The blue and yellow alerts predict heavy air pollution episodes that will last for more than 1 and 2 d, respectively. There are very few compulsory emission-reduction measures for blue and yellow alerts and most emission-reduction measures are suggestive. The characteristics and effects of these emission-reduction measures during alert periods have been massively studied (Zhong et al., 2017; Zhang et al., 2017; Wang et al., 2017; Zen et al., 2018; Shang et al., 2018). However, previous emission-reduction measures during orange and red alerts were solely conducted in a specific city (e.g., Beijing), while regional emission-reduction measures implemented simultaneously in many adjacent cities have rarely been implemented and evaluated.
Although the peak PM2.5 concentrations in Beijing could be reduced by 20 % through strict emission-reduction measures (Cheng et al., 2017), PM2.5 concentrations remained at very high levels during red alert periods. In addition to local emissions, regional transport of airborne pollutants between neighboring cities also contributed to the high PM2.5 concentrations in Beijing (Chen et al., 2016). Therefore, regional integration has become one of the major solutions for further reducing PM2.5 concentrations in Beijing during heavy pollution episodes. To promote this strategy, the Ministry of Environmental Protection of the People's Republic of China released the “2017 Air Pollution Prevention and Management Plan for the Beijing–Tianjin–Hebei region and its Surrounding Areas” (MEP, 2017). This plan suggests that Beijing, Tianjin, eight cities in Hebei Province, four cities in Shanxi Province, seven cities in Shandong Province and seven cities in Henan Province (2+26) constitute the regional network involved in the long-distance transport of airborne pollutants surrounding Beijing. Therefore, during heavy pollution episodes, unified emission-reduction measures should be carried out in these cities simultaneously to reduce extremely high PM2.5 concentrations in Beijing.
Since the launch of the “2+26” plan, Beijing experienced two pollution episodes in November 2017 and March 2018, when MEP released two orange alerts and implemented corresponding emission-reduction measures in all 28 cities simultaneously. The two orange alerts were the first two attempts of the 2+26 plan to reduce PM2.5 concentrations in Beijing during pollution episodes. To better evaluate this 2+26 regional strategy and for a comprehensive comparison, we also included two other pollution episodes in Beijing in this study: November 2016 (with local emission-reduction measures) and March 2013 (with no emission-reduction measure). We firstly analyzed the variations in PM2.5 concentrations in Beijing during the four pollution episodes. Following this, we quantified the component and sources of the PM2.5 for each episode. Based on source apportionment, we further quantified the relative contribution of local emissions and regional transport to PM2.5 concentrations in Beijing during these four pollution episodes. The methodology and findings of this research not only hold practical significance for further improving the 2+26 regional strategy but also shed some light on the regional integration of air quality management in other parts of China.
2.1 Study sites
Beijing is located at the northwestern edge of the North China Plain. It is surrounded by mountains on three sides, resulting in a geographical condition unfavorable for the dispersion of airborne pollutants. Therefore, air pollution episodes have been frequently witnessed in Beijing since 2013, especially in winter. Based on large-scale field-experiments and model simulation, MEP (2017) pointed out that 28 cities formed a regional transport network of airborne pollutants, which influenced local PM2.5 concentrations in Beijing significantly. These 28 cities include two municipalities directly under the central government, Beijing and Tianjin, and another 26 neighboring cities surrounding Beijing, which are Shijiazhuang, Tangshan, Langfang, Baoding, Cangzhou, Hengshui, Xingtai, and Handan in Hebei Province; Taiyuan, Yangquan, Changzhi, and Jincheng in Shanxi Province; Jinan, Zibo, Jining, Dezhou, Liaocheng, Binzhou, and Heze in Shandong Province; and Zhengzhou, Kaifeng, Anyang, Hebi, Xinxiang, Jiaozuo, and Puyang in Henan Province. The locations of these cities are shown in Fig. 1. These 26 cities, especially those cities located in Hebei province, are mainly industrial cities that consume a large amount of coal and produce massive amounts of airborne pollutants. To comprehensively understand the effects of the 2+26 regional strategy for air quality improvement in Beijing, all 28 cities were selected as study sites for this research.
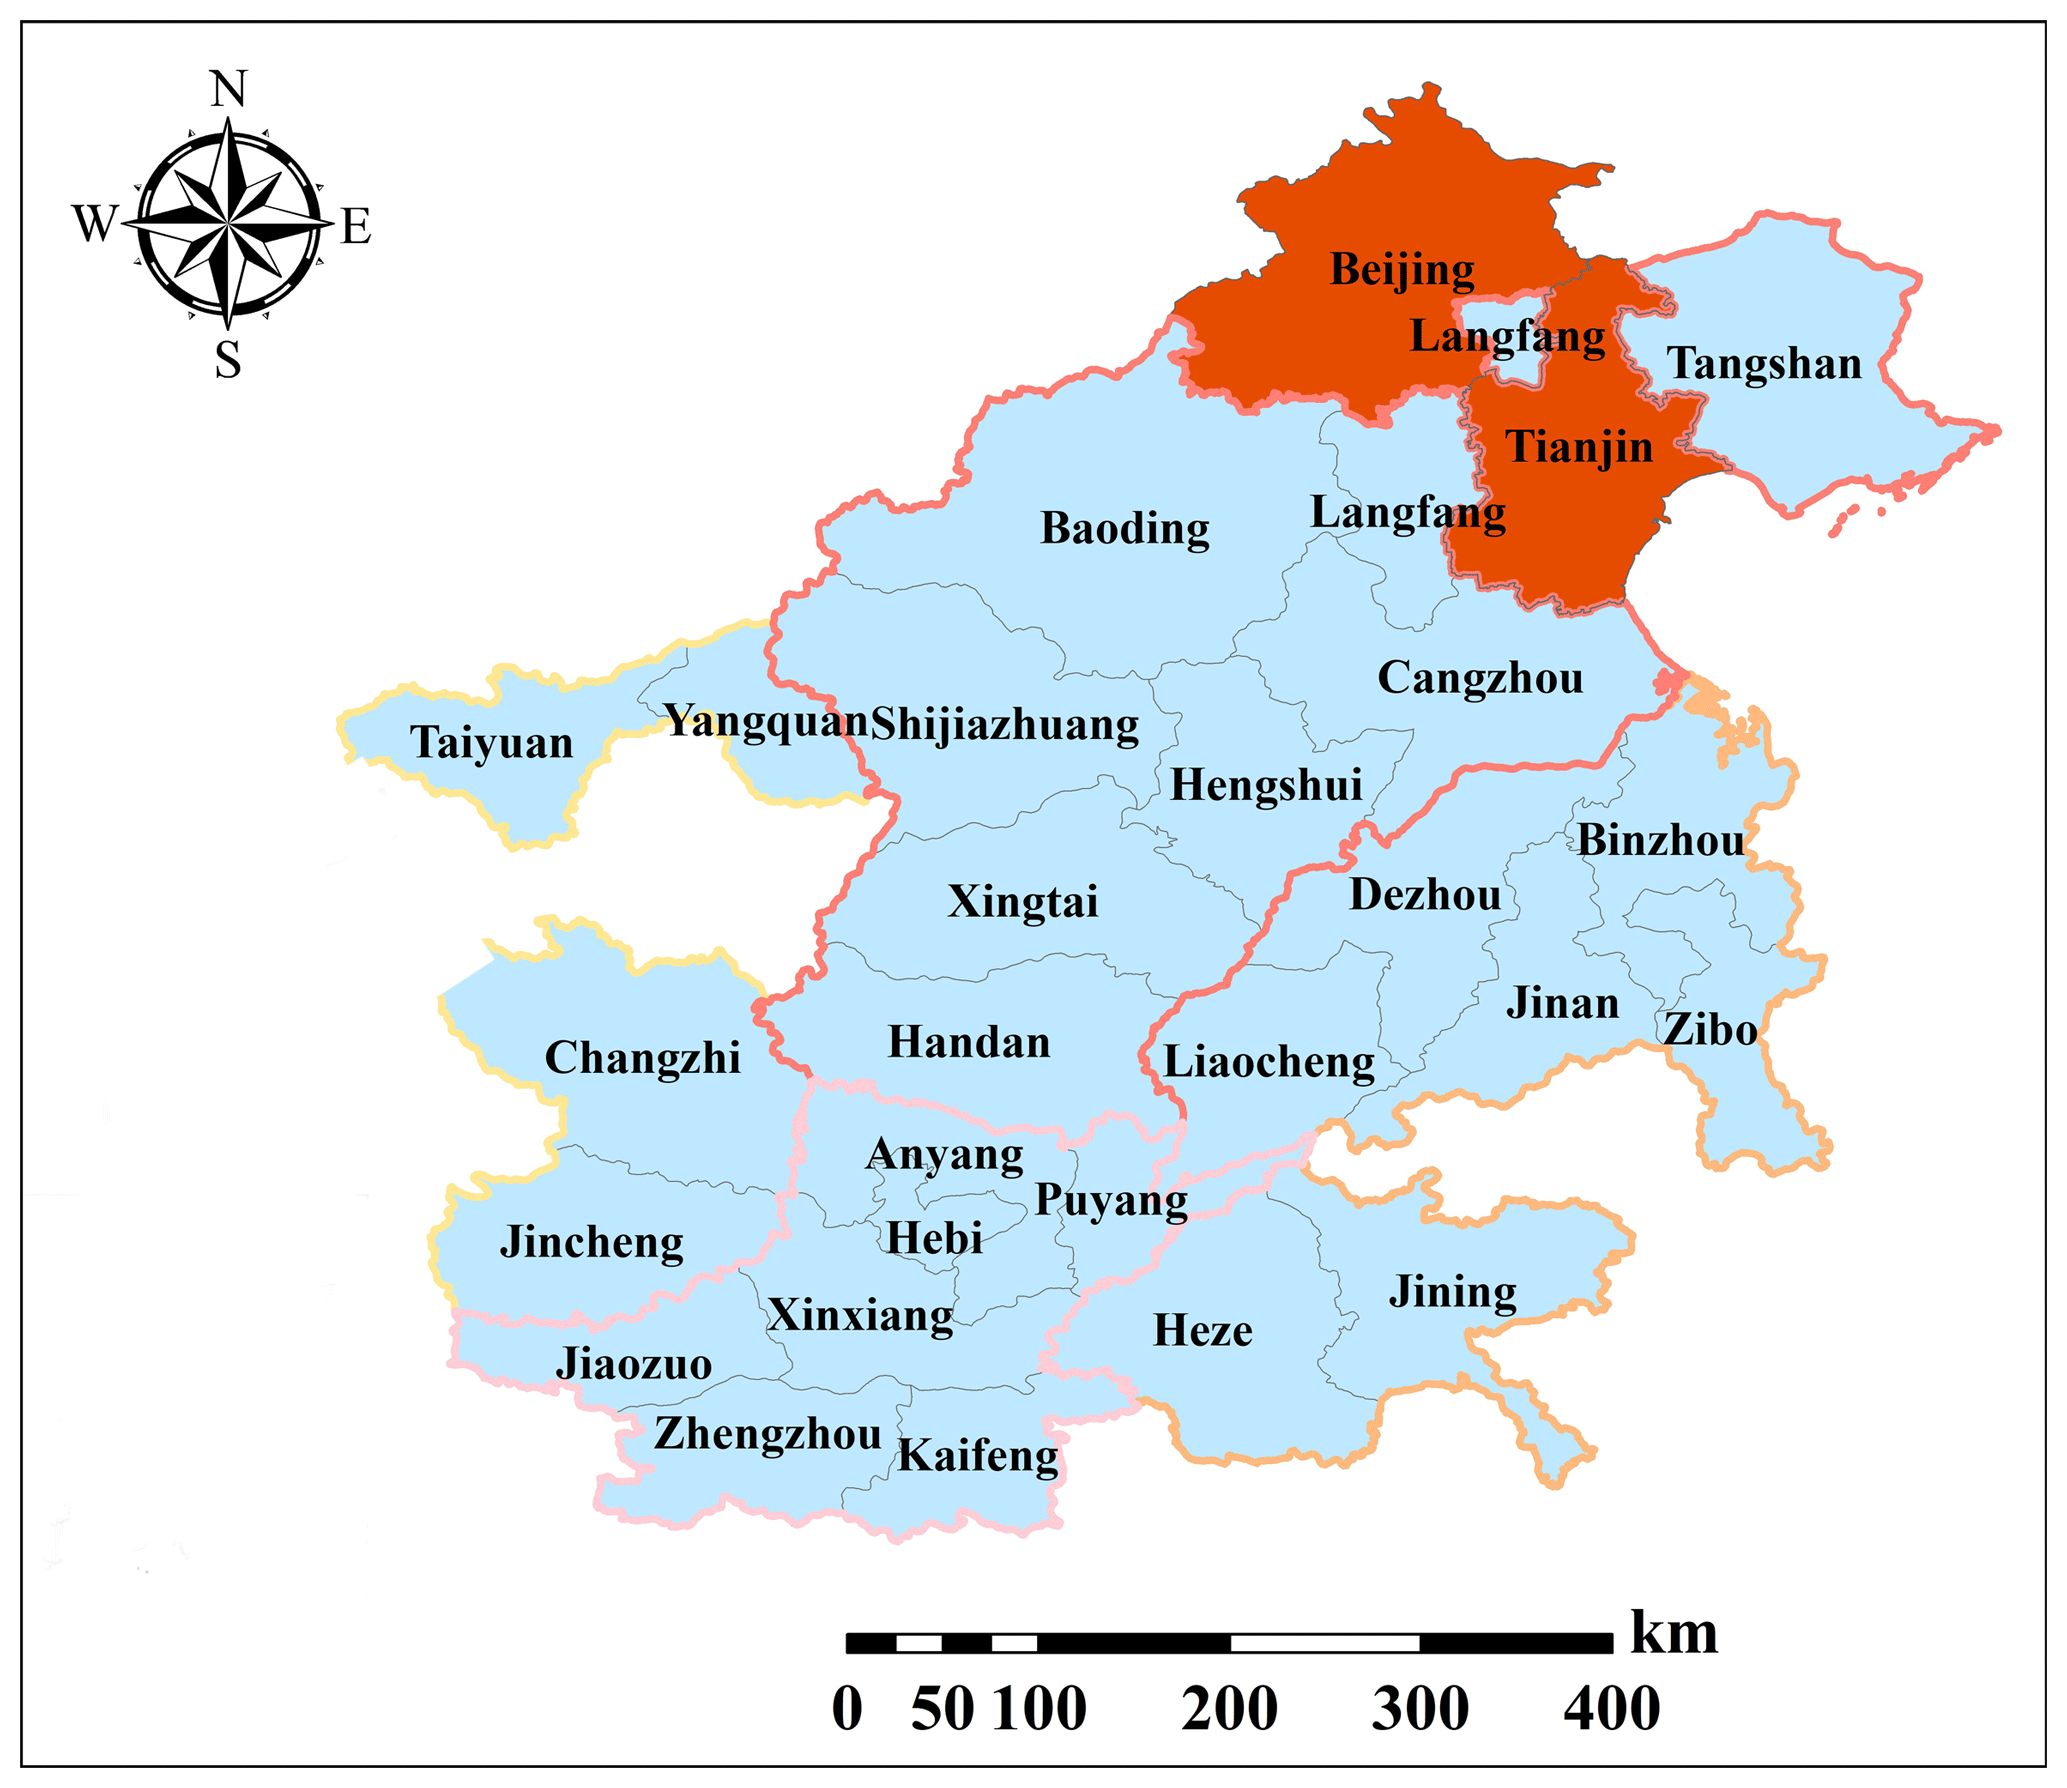
Figure 1Geographical locations of the 28 cities within the 2+26 regional integration framework.
2.2 Data sources
2.2.1 Ground PM2.5 and meteorological observation data
The data of major airborne pollutants for this research were collected from the website PM25.in (http://www.pm25.in/, last access: 18 August 2018). This website assembles official data of major airborne pollutants provided by the China National Environmental Monitoring Centre (CNEMC) and publishes hourly air quality information for 367 monitored cities in China, including all of the 28 cities in the 2+26 framework. By using a specific API (application programming interface) provided by PM25.in, we collected hourly pollutant data (e.g., PM2.5, CO, NO2, O3) for these 28 cities. The hourly average concentration of each pollutant for one city is calculated by averaging the hourly value measured at all available observation stations within the city. For the following analysis, we employed time series air quality data covering all four pollution periods: from 00:00, 24 November to 24:00, 27 November 2016; from 00:00, 4 November 2017 to 24:00, 7 November 2017; from 00:00, 14 March to 24:00, 17 March 2013; from 00:00 11 March to 24:00, 14 March 2018.
In addition to large-scale meteorological data for the following simulation, we also employed ground observation data to compare meteorological conditions during these four pollution episodes. Meteorological data for this research were collected at the Guanxiangtai Station in Beijing and were downloaded from the Department of Atmospheric Science of the University of Wyoming (http://weather.uwyo.edu/upperair/sounding.html, last access: 18 August 2018). Based on the comparison of the meteorological data, we could ascertain whether large variations in meteorological conditions existed between the four pollution episodes, as a potential influencing factor of the variations in PM2.5 concentrations.
2.2.2 PM2.5 component data
To comprehensively understand the component of PM2.5 during the four pollution episodes, we collected PM2.5 sample data at the Dongsi Station for further analysis. These PM2.5 sample data were collected during the pollution episodes in March 2013, November 2016, November 2017 and March 2018. We employed an URG-9000B Ambient Ion Monitor (Thermo Fisher Scientific), which includes two Dionex ICS-90 ion chromatography systems (DIONEX, US), to detect water soluble ion Na+, Mg2+, Ca2+, K+, , Cl−, , and . The URG-9000B Ambient Ion Monitor employs denuder membrane to separate particulate matter and gas by absorbing gas using liquid. The original temporal resolution for ion detection was 15 min and, for comparison with other components, the temporal resolution for water-soluble ion detection was averaged to an hour. The organic carbon concentration of PM2.5 was analyzed using the OC/EC analyzer (Sunset Lab model 5l) and the temporal resolution for carbon detection was an hour. The in-depth analysis of PM2.5 component provides significant reference for understanding the evolution and sources of PM2.5 during the pollution episodes.
2.3 Method
2.3.1 Simulation models
We employed the WRF-CAMx model for simulating the effects of emission-reduction measures on the reduction of major airborne pollutants. The WRF-CAMx includes three models: the middle-scale meteorology model (WRF), the source emission model (SMOKE) (https://www.cmascenter.org/cmaq/, last access: 16 February 2019) and air quality model (CAMx) (http://www.camx.com/, last access: 16 February 2019). The WRF model provided the meteorological field for the analysis. The CAMx model has been widely used for simulating the evolution of air pollution episodes (An et al., 2007; Liu et al., 2010; ENVIRON, 2013). In this research, the central point for the CAMx was set at the coordinate (35∘ N, 110∘ E) and bi-directional nested technology was employed, producing two layers of grids with a horizontal resolution of 36 and 12 km, respectively. The first layer of the grids has a 36 km resolution, covering most areas of East Asia (including Japan, South Korea, China, North Korea and other countries). The second layer of the grids has a 12 km resolution, covering the North China Plain, which includes the Beijing–Tianjin–Hebei region, Shandong and Henan Provinces. The vertical layer was divided into 20 unequal layers. The initial and boundary conditions for simulating airborne pollutants were set using the default CAMx profiles. For better simulating the pollution process with longer time series, the simulation period was set as the entirety of March 2013, November 2016, November 2017 and March 2018. For the first running of this model, a spin-up period of 5 d was set to simulate the initial field and the following initial field was decided by the output of previous simulations. Hence, the accumulation effects of emission sources have been comprehensively considered and the influence of uncertain initial conditions has been reduced significantly.
We employed ARW-WRF3.2 to simulate the meteorological field. The setting of the center and the bi-directional nest for the WRF was similar to that of the CAMx, as mentioned above. There were 35 vertical layers for the WRF and the outer layer provided boundary conditions of the inner layer. The meteorological background field and boundary information with a Global Forecast System (GFS) resolution of 1∘ × 1∘ and temporal resolution of 6 h were acquired from NCAR (National Center for Atmospheric Research, https://ncar.ucar.edu/, last access: 16 February 2019) and NCEP (National Centers for Environmental Prediction), respectively. The terrain and underlying surface information was obtained from the USGS 30 s global digital elevation model (https://earthquake.usgs.gov/, last access: 16 February 2019). The output from the WRF model was interpolated to the region and grid for the CAMx model using the Meteorology-Chemistry Interface Processor (MCIP, https://www.cmascenter.org/mcip, last access: 16 February 2019). The meteorological factors used for this model include temperature, air pressure, humidity, geopotential height, zonal wind, meridional wind, precipitation, boundary layer heights and so on. An estimation model for terrestrial ecosystem MEGAN (http://ab.inf.uni-tuebingen.de/software/megan/, last access: 16 February 2019) was employed to process the natural emissions. For this research, we employed the camx2WRF module to transfer NETCDF data from WRF to readable data for CAMx. Anthropogenic emission data were from the Multi-resolution Emission Inventory for China (MEIC) 0.5∘ × 0.5∘ emission inventory (http://www.meicmodel.org/, last access: 16 February 2019) and the Beijing emission inventory (http://www.cee.cn/, last access: 16 February 2019) (as shown in Table 1). These emission inventories were updated annually and we employed specific inventories for the corresponding year when these pollution episodes occurred. For the pollution episode in March 2018, since the emission inventory in 2018 has yet to be made available, we updated the 2017 emission inventories by considering the 2018 emission-reduction scenarios (e.g., the target of coal combustion reduction) required by the local government. We input the processed natural and anthropogenic emission data into the SMOKE model and acquired comprehensive emission source files.
2.3.2 Source apportionment
PSAT (Particulate Matter Source Apportionment Technology) is one major extension of the CAMx model. PSAT was developed from the related ozone source apportionment method and provided PM source apportionment for specific geographic regions and source categories (Huang et al., 2012). Furthermore, PSAT can be used to analyze the source–acceptor relationship of PM2.5 pollutants and trace SO2, , , , secondary organic aerosol, Hg, elemental carbon, dust particles, and other primary and secondary particles. As a species tagging method, PSAT tracks the regional source and industry source of environmental receptor PM2.5 and its main chemical components, and then evaluates the contribution of initial conditions and boundary conditions to PM generation. By identifying and tracking the transport, diffusion, transformation and decomposition of pollutants emitted from various sources, PSAT estimates the relative contribution of different emission sources to the spatial distribution of PM concentrations based on the analysis of mass balance. PSAT-based source apportionment is conducted using reactive tracers that simulate the nonlinear transformation between primary PM and secondary PM and are highly efficient and flexible for source apportionment from the perspective of geographical source regions, emissions source categories and individual sources (Burr et al., 2011). PSAT effectively avoids the concentration biases caused by brute-force-based source-closure methods that ignore nonlinear chemical processes and has been widely used in previous studies (Xing et al., 2011; Huang et al., 2012; Wu et al., 2013; X. Li et al., 2015; Y. Li et al., 2015). For this research, we established a regional transport matrix between pollution sources and environmental receptors. According to the provincial administrative division, the national grid is divided into 17 divisions, each of which represents a provincial unit, and all other cells outside the national boundary are classified as Class I, including the ocean and other areas. According to the scope of the Beijing–Tianjin–Hebei region and the 2+26 network, we further divided the study area into 13 subdivisions, including Beijing, Tianjin, eight cities in Hebei Province, Henan Province, Shandong Province and Shanxi Province, for quantifying the influence of local emission and regional transport on the variations in PM2.5 concentrations in Beijing during the four pollution episodes.
2.4 Model verification
To comprehensively evaluate the simulation performance of WRF-CAMx, we compared the observed and model estimated value of PM2.5 concentrations, major meteorological factors (temperature, relative humidity and wind speed) and the major PM2.5 component (, and ) for each pollution episode, and the result is presented as Table 2. Generally, since emission inventories could not include all actual emission sources and fully consider complicated chemical reaction mechanisms that may deteriorate PM2.5 pollution, WRF-CAMx slightly underestimated PM2.5 concentrations. According to Table 2, the normalized mean bias (NMB) and normalized mean error (NME) between observed and simulated data indicated a satisfactory simulation output (Boylan et al., 2006).
Table 2The verification of WRF-CAMx performance in terms of meteorological factors, PM2.5 concentrations and PM2.5 components.

3.1 Temporal variations in PM2.5 concentrations during the four pollution episodes
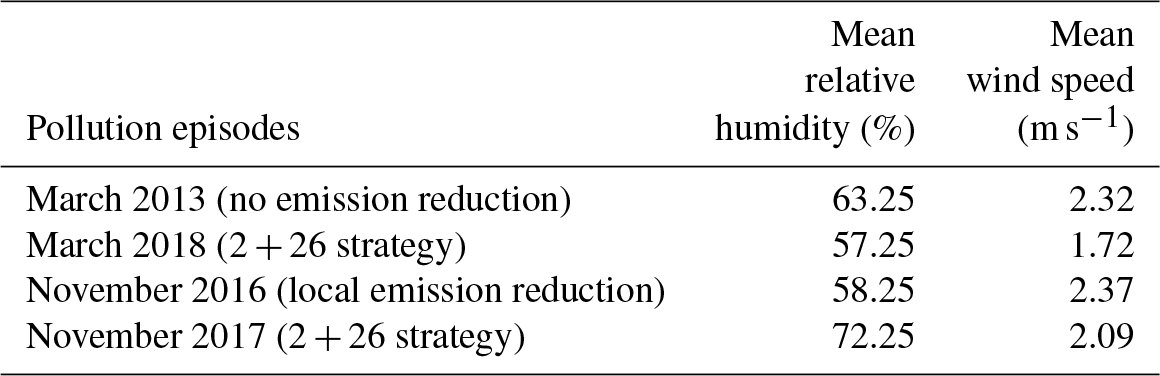
Chen et al. (2017, 2018) suggested that wind speed and relative humidity were major meteorological factors that influence wintertime PM2.5 concentrations in Beijing. Similarly, an official report based on a systematic study of PM2.5 pollution in Beijing (https://m.21jingji.com/article/20190311/herald/263828cd8f4cf3986ee1c39378c64881.html?from=groupmessage &isappinstalled=0, last access: 16 February 2019) suggested that high humidity and weak wind (especially wind speed less than 2 m s−1 and relative humidity larger than 60 %) were unfavorable conditions for PM2.5 dispersion and might easily lead to PM2.5 pollution episodes. As shown in Table 3, based on the ground observation data, we found that the two meteorological factors during the pollution episode in November 2016 were fairly similar to those during the orange alert period in November 2017, while the meteorological condition during the pollution episode in March 2013 was fairly similar to that during the orange alert period in March 2018 (as shown in Table 3). According to Table 3, all of the four pollution episodes experienced a high-humidity and weak-wind condition. Specifically, the fairly high relative humidity for the 2+26 orange alert period in November 2017 and the fairly low wind speed for the 2+26 orange alert period in March 2018 led to extremely unfavorable conditions for the dispersion of airborne pollutants.
Table 3Major meteorological conditions during the four pollution episodes.
When the meteorological influences on the variations in PM2.5 concentrations were limited, a comparison between the PM2.5 concentrations during these two orange alert periods and that during the two corresponding pollution episodes provides a useful reference for evaluating the effects of 2+26 strategy on PM2.5 reductions during the pollution episodes, which are usually observed under stagnant atmospheric conditions, with high relative humidity and low wind speed. The temporal variations in PM2.5 concentrations during the two 2+26 orange alerts and the two corresponding pollution episodes are shown in Table 4 and Fig. 2.
Table 4Characteristics of PM2.5 concentrations during four pollution episodes.
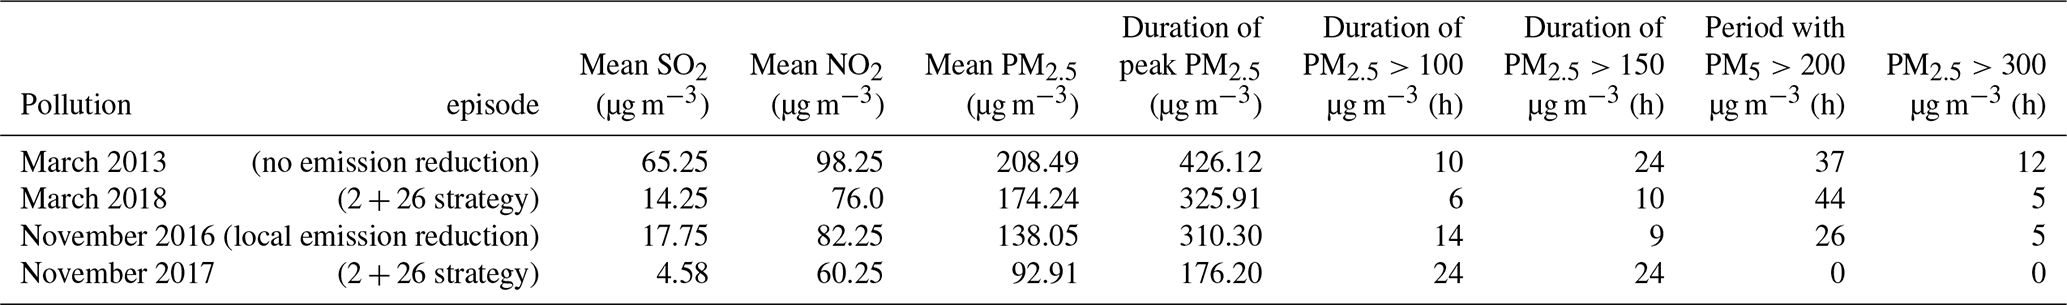
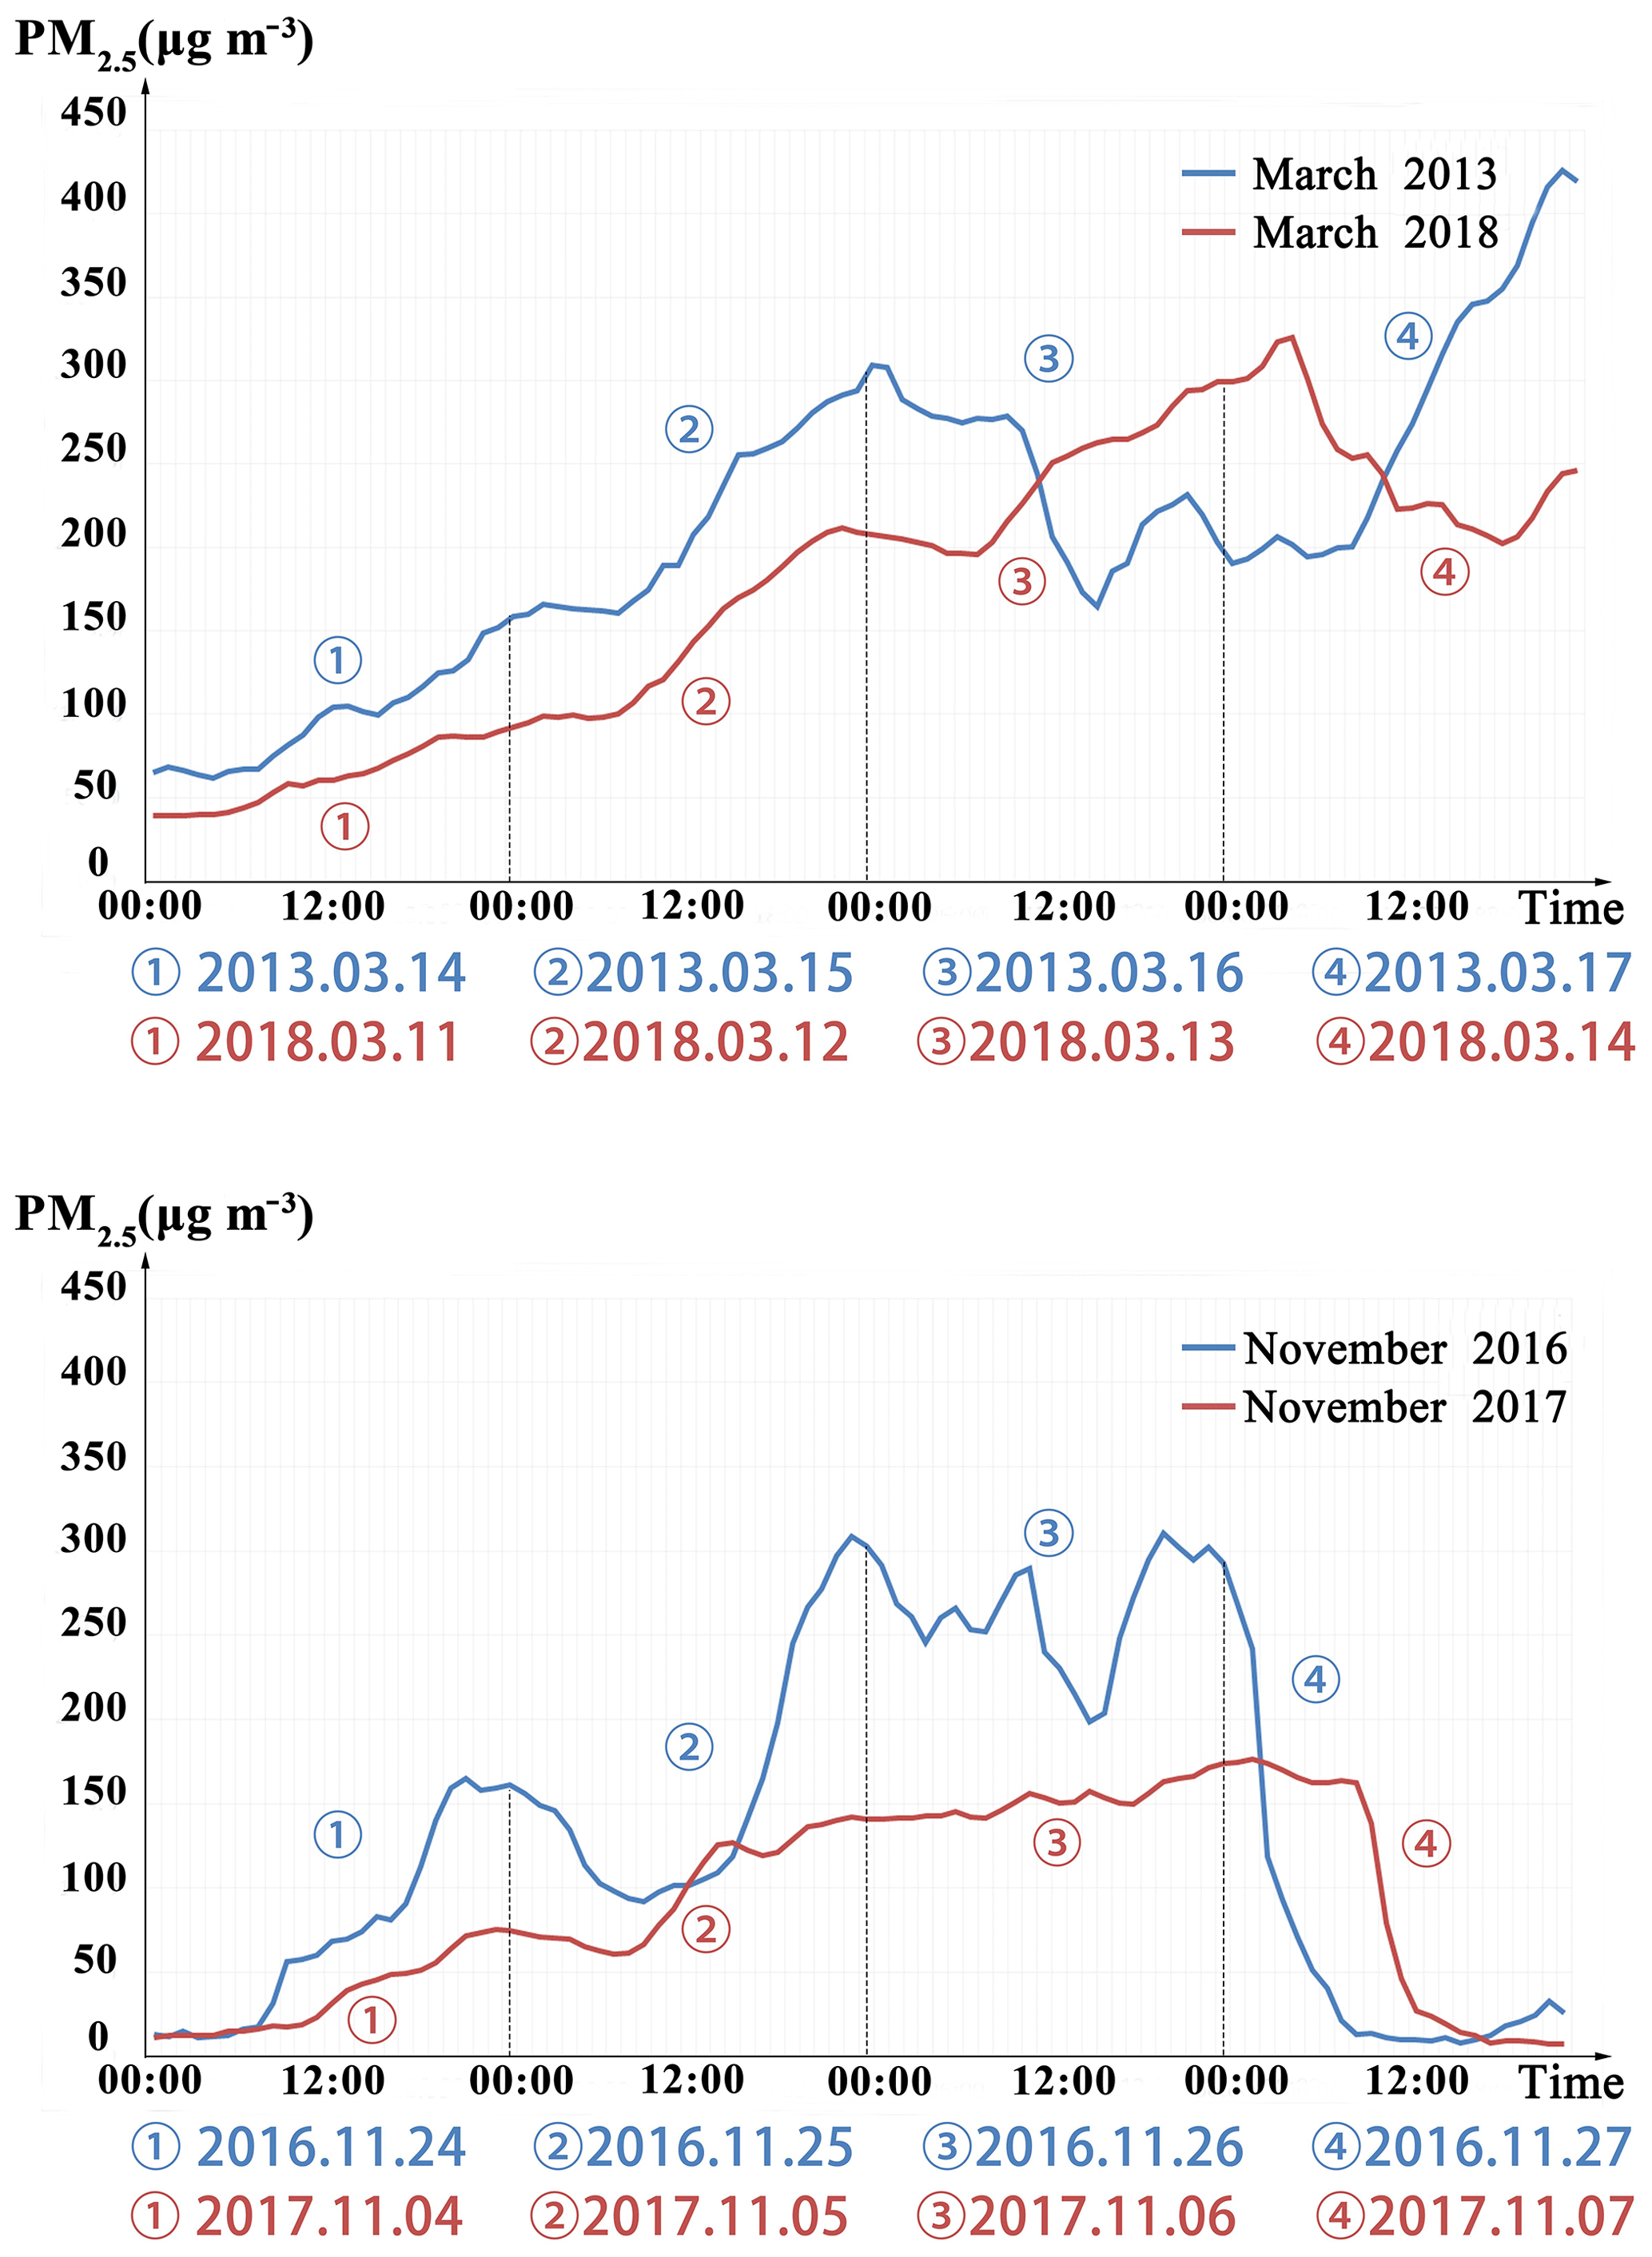
Figure 2Variations in PM2.5 concentrations during four pollution episodes with different emission-reduction measures in Beijing.
As shown in Table 4 and Fig. 2, the long-term emission-reduction policies and contingent emission-reduction measures during 2+26 period led to a dramatic decrease in SO2 and notable decrease in NO2. Consequently, both the peak and average PM2.5 concentrations during the two orange alert periods were remarkably lower than those during the two corresponding pollution episodes with similar initial PM2.5 levels and meteorological conditions. For the pollution episode in March 2013 and March 2018, the initial PM2.5 concentrations were both around 50 µg m−3. Similarly, for the pollution episode in November 2016 and November 2017, the initial PM2.5 concentrations were both around 15 µg m−3. Following the similar initial PM2.5 concentrations, it is noted that PM2.5 concentrations increased at a much lower rate and further led to a lower peak and average PM2.5 concentrations during the two 2+26 orange alert periods.
According to Table 4, the mean and peak PM2.5 concentrations during the 2+26 orange alert period in March 2018 were 16.43 % and 23.52 % lower than those during the pollution episode in March 2013, respectively. Meanwhile, the duration with extremely high PM2.5 concentrations was notably shorter during the orange alert period. The 2+26 strategy implemented during the orange alert period in November 2017 led to even better effects on PM2.5 reduction. The mean and peak PM2.5 concentrations during this period were 32.70 % and 43.22 % lower than those during the pollution episode in November 2016, respectively. More importantly, during the entire orange alert period, PM2.5 concentrations were constantly lower than 200 µg m−3, indicating a highly efficient control of high PM2.5 concentrations.
3.2 PM2.5 component analysis during four pollution episodes
The temporal variations in different PM2.5 components during the four pollution episodes are shown in Fig. 3. As the figure indicates, the components of PM2.5 in Beijing during the four pollution episodes had notable variations.
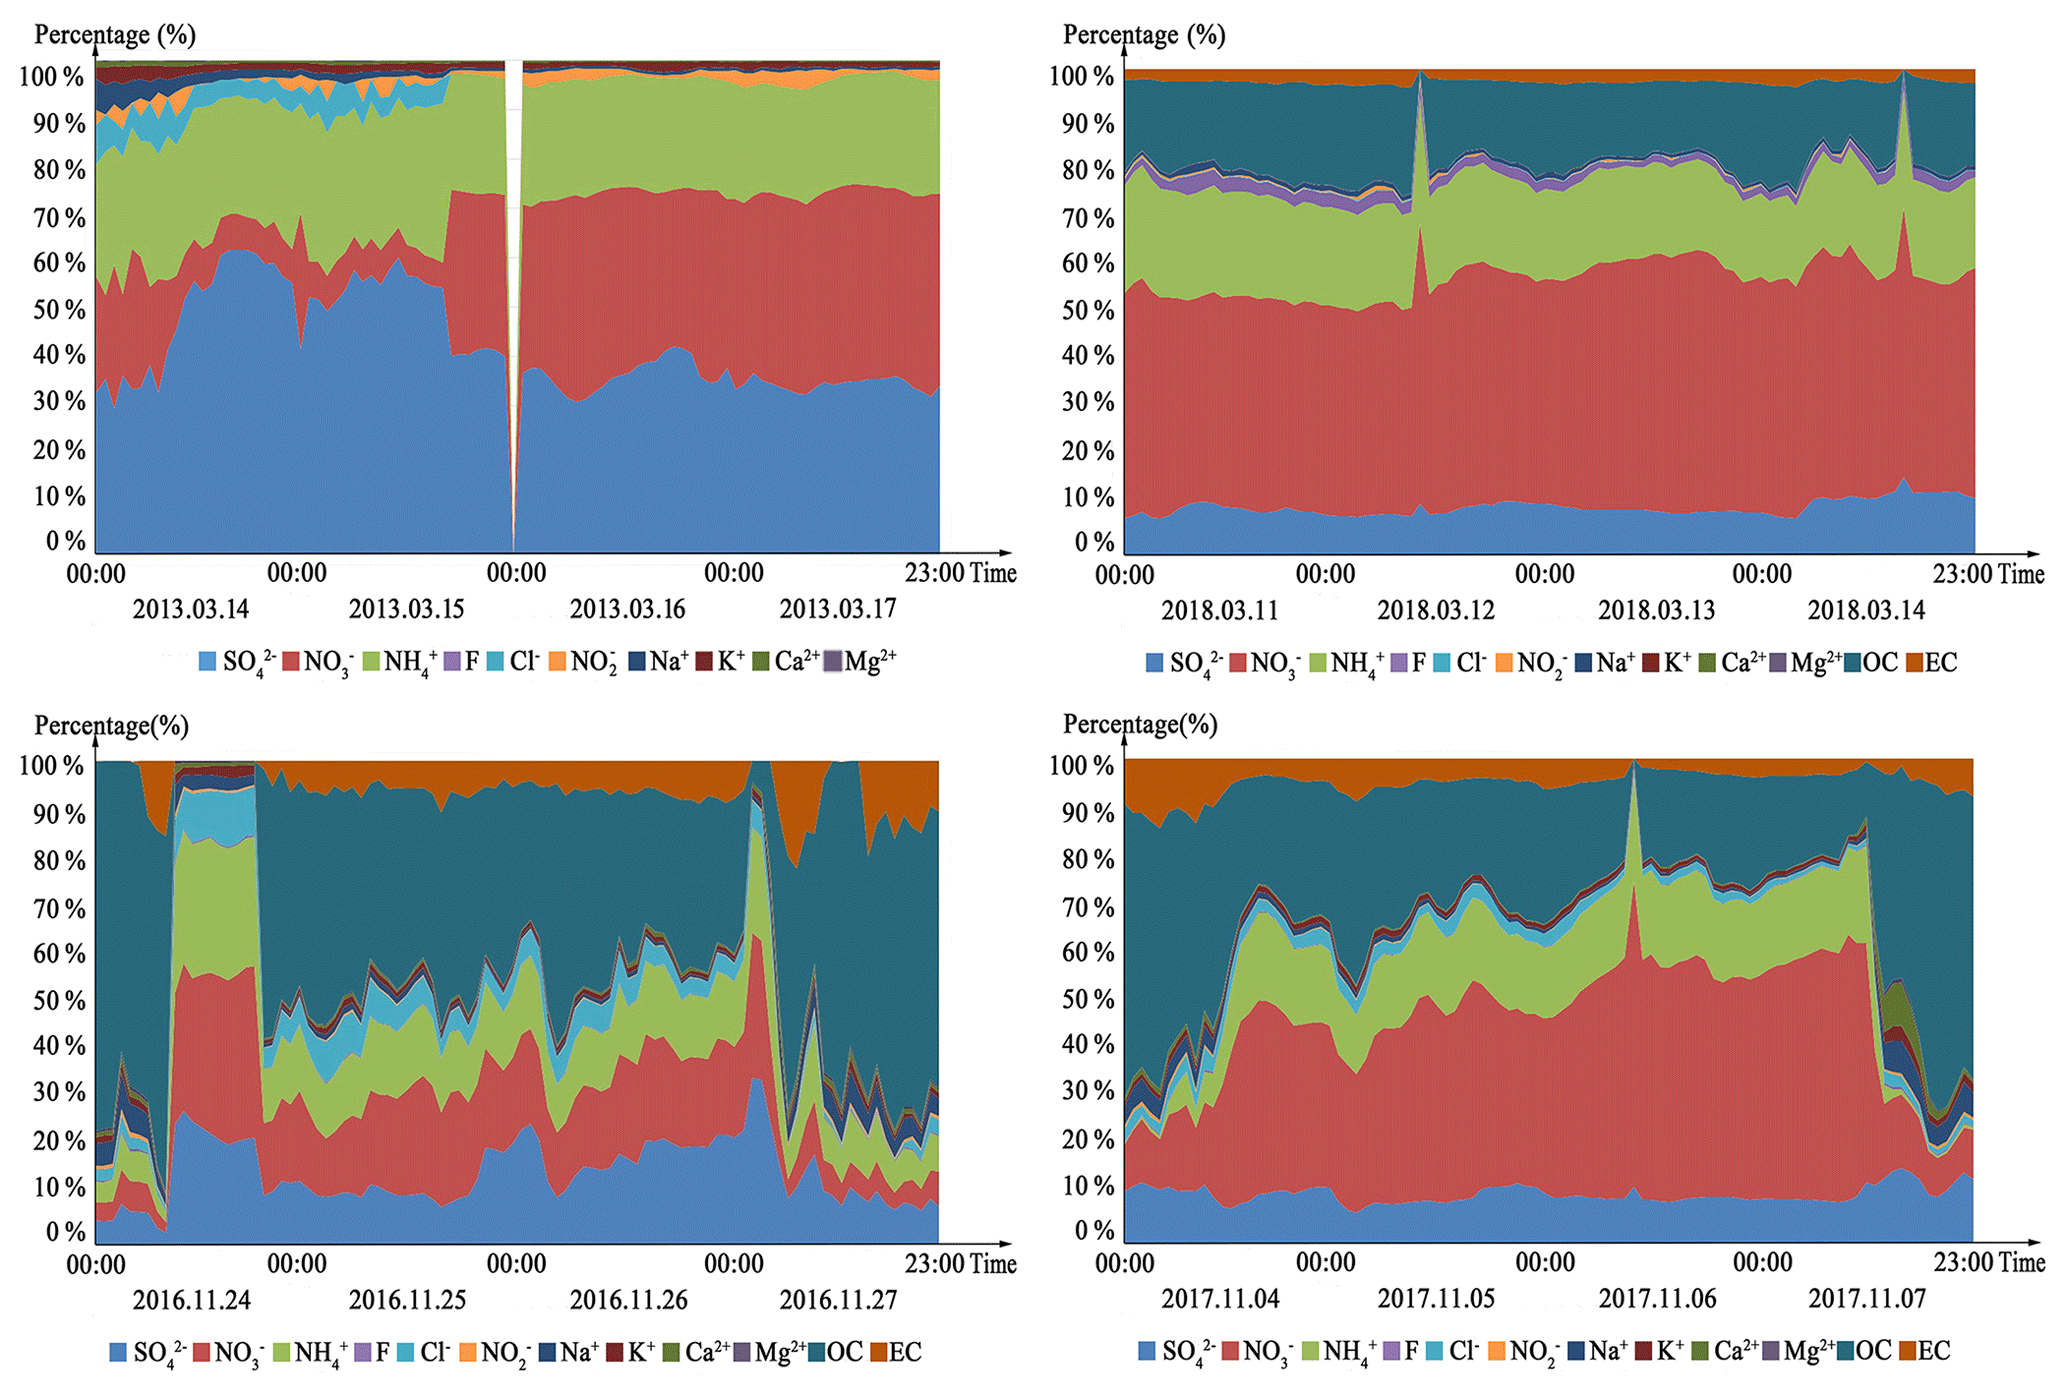
Figure 3The variation in PM2.5 components in Beijing during four pollution episodes. The blank area for the pollution episode in March 2013 resulted from missing data caused by equipment error. Organic carbon and elemental carbon component were not measured during the pollution episode in March 2013.
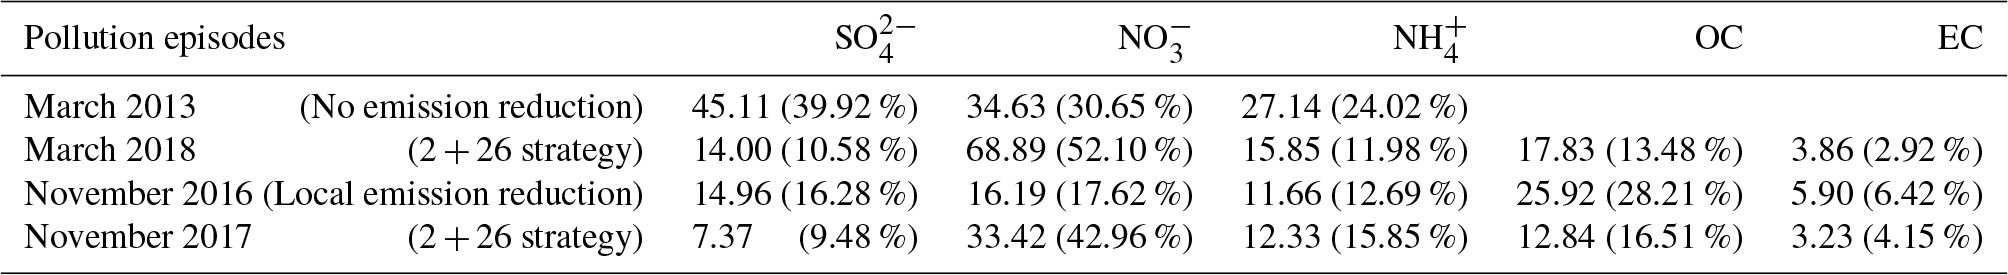
For the four pollution episodes with different emission-reduction measures, the main components for PM2.5 were , and . However, some major differences existed. With no or only local emission-reduction measures implemented, the dominant PM2.5 component was for the pollution episode in March 2013 and November 2016. During two 2+26 orange alert periods, became the dominant PM2.5 component. Except for the pollution episode in March 2013, the proportion of was generally consistent during the other three pollution episodes. The mean mass concentrations and proportions of , and during the four pollution episodes are shown in Table 5.
Table 5The mean mass concentration and percent of major PM2.5 components during four pollution episodes (µg m−3).
Through comparison, we found a dramatic decrease in and a notable increase in during two orange alert periods. The main source for is the combustion of fossil fuels (Shimano et al., 2006; Kuenen et al., 2013), especially the intensive burning of sulfur coals for wintertime central heating, manufacturing and household use. The main source for is vehicle exhaust (Rodríguez et al., 2004; Watson et al., 2007; Han et al., 2007; Zeng et al., 2010). is the secondary pollutant of urban NH3, the main source of which is the decomposition of organic elements (Frank and Ponticello, 1980; Watson et al., 2007) and the combustion of fossil fuels (Frank and Ponticello, 1980; Watson et al., 2007; Pan et al., 2016). Through a novel approach, Pan et al. (2016) quantified that more than 90 % of NH3 in the Beijing–Tianjin–Hebei region during heavy pollution episodes resulted from the combustion of fossil fuels. The large variation in PM2.5 components during these episodes was mainly attributed to long-term environmental policies and contingent emission-reduction measures. A large number of small, polluting factories in Beijing and its surrounding areas have been shut down, and the use of household coal, especially coarse coal that produces large amounts of sulfate-related pollutants, has been restricted significantly. In addition to long-term environmental protection policies, contingent emission-reduction measures, including the temporal shutdown of many factories that consumes a large amount of coal, were implemented during air pollution alert periods. Furthermore, the recently launched 2+26 plan requires that areas surrounding Beijing, including many cities in Hebei Province (e.g., Tangshan) well-known for their coal-based iron industries, should take simultaneous emission-reduction actions during regional pollution episodes. These long-term and contingent strategies led to a notable decrease in through local emission-reduction measures and a further decrease in through 2+26 regional emission-reduction measures. Conversely, during the four pollution episodes, no strict regulation was placed on the control of vehicle exhaust. Hence, the notable decrease in and generally constant mass concentration of led to a rapidly rising proportion of among the PM2.5 components during the two orange alerts.
3.3 Source apportionment during the four pollution episodes
Based on PM2.5 component analysis and PSAT-based source apportionment, we further quantified the relative contribution of different sources to PM2.5 concentrations in Beijing during the four pollution episodes (Fig. 4). A major difference between the pollution episode in March 2013 and in March 2018 was the dramatic decrease in the relative contribution of coal combustion from 40 % to 11 %. Meanwhile, the relative contribution of vehicle exhaust increased significantly from 19 % to 54 %, indicating that vehicle exhaust became the dominant source for the pollution episode in March 2018 with the 2+26 regional emission-reduction measures. On the other hand, the difference in the relative contribution of different sources between the two pollution episodes in November 2016 (with local emission-reduction measures) and November 2017 (with 2+26 regional emission-reduction measures) was much smaller. The major differences lay in the notable increase in the relative contribution of vehicle exhaust from 29 % to 40 % and the decrease in the relative contribution of coal combustion from 34 % to 28 %.
As described above, the continuous decrease in the relative contribution of coal combustion from the pollution episodes in 2013 to the episode in 2018 resulted from the combination of long-term and contingent local and regional emission-reduction measures. Note that despite a similar 2+26 strategy implemented, the relative contribution of coal combustion during the orange alert period in November 2017 was much higher than in March 2018. A major reason for this dramatic change over a short period was the implementation of a large-scale environmental project. Before November 2017, the starting point of central heating in Beijing, a regional project called Coal to Gas had finished replacing coal-based central heating systems by gas-based systems for 1.9 million households in the Beijing–Tianjin–Hebei region, leading to a 2 million ton decrease in coal consumption in the region. As a result, the relative contribution of coal combustion, which was the dominant emission source for PM2.5 in Beijing during the central heating season from November to March, decreased to a fairly low level during the orange alert period in March 2018.
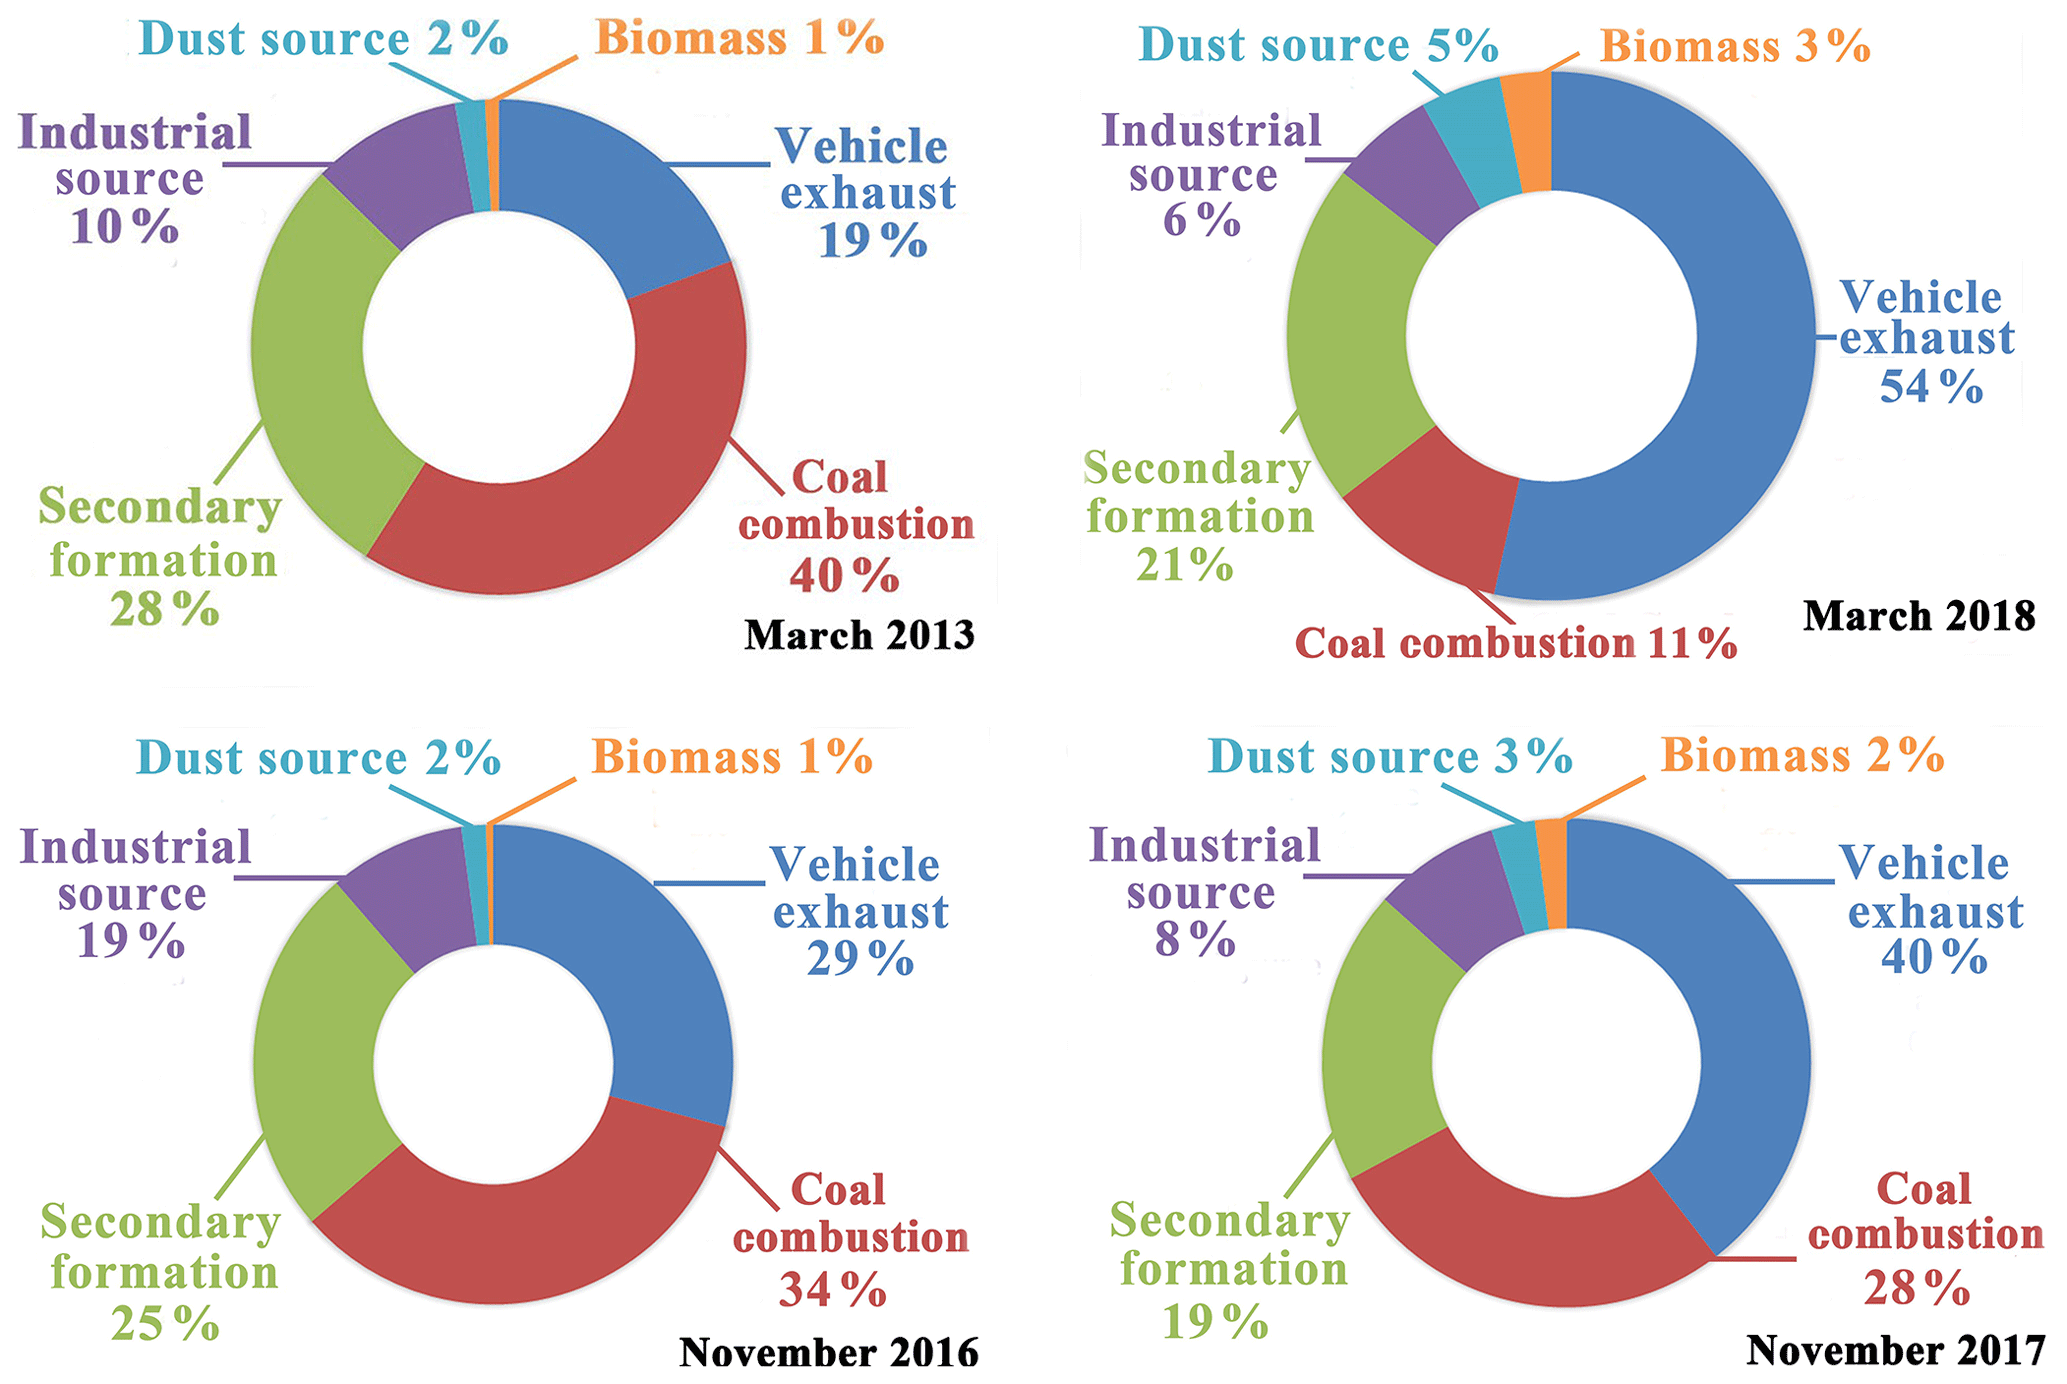
Figure 4The relative contribution of different sources to PM2.5 concentrations in Beijing during four pollution episodes.
3.4 The relative contribution of local emission and regional transport to PM2.5 concentrations in Beijing during the four pollution episodes
Through the simulation of the WRF-CAMx model based on local and regional emission inventories, we quantified the relative contributions of local emission and regional transport of airborne pollutants to the variations in PM2.5 concentrations in Beijing during four pollution episodes (Fig. 5). According to Fig. 5, the relative contribution of local emission and regional transport to PM2.5 concentrations in Beijing varied notably. For the pollution episode in March 2013 with no emission-reduction measures, the relative contribution of local emissions was 69.27 %, much lower than the 88.35 % for the 2+26 orange alert period in March 2018. On the other hand, for the pollution episode in November 2016 with local emission-reduction measures, the relative contribution of local emissions was 76.83 %, much higher than the 49.46 % for the 2+26 orange alert period in November 2017. Meanwhile, the relative contribution to PM2.5 concentrations in Beijing from specific areas also differed significantly during these pollution episodes. We found that different emission-reduction strategies did not lead to a clear pattern for the relative contribution of local emissions and regional transport. One major reason for this is that the regional transport of airborne pollutants from neighboring areas to Beijing is influenced significantly by meteorological conditions, the intensity of regional emission sources and the regional distribution of PM2.5 concentrations, which demonstrated remarkable seasonal variations and synoptic-scale uncertainties. From this perspective, we attempted to explain the underlying drivers for the variations in local and regional contributions to PM2.5 concentrations during the four pollution episodes.
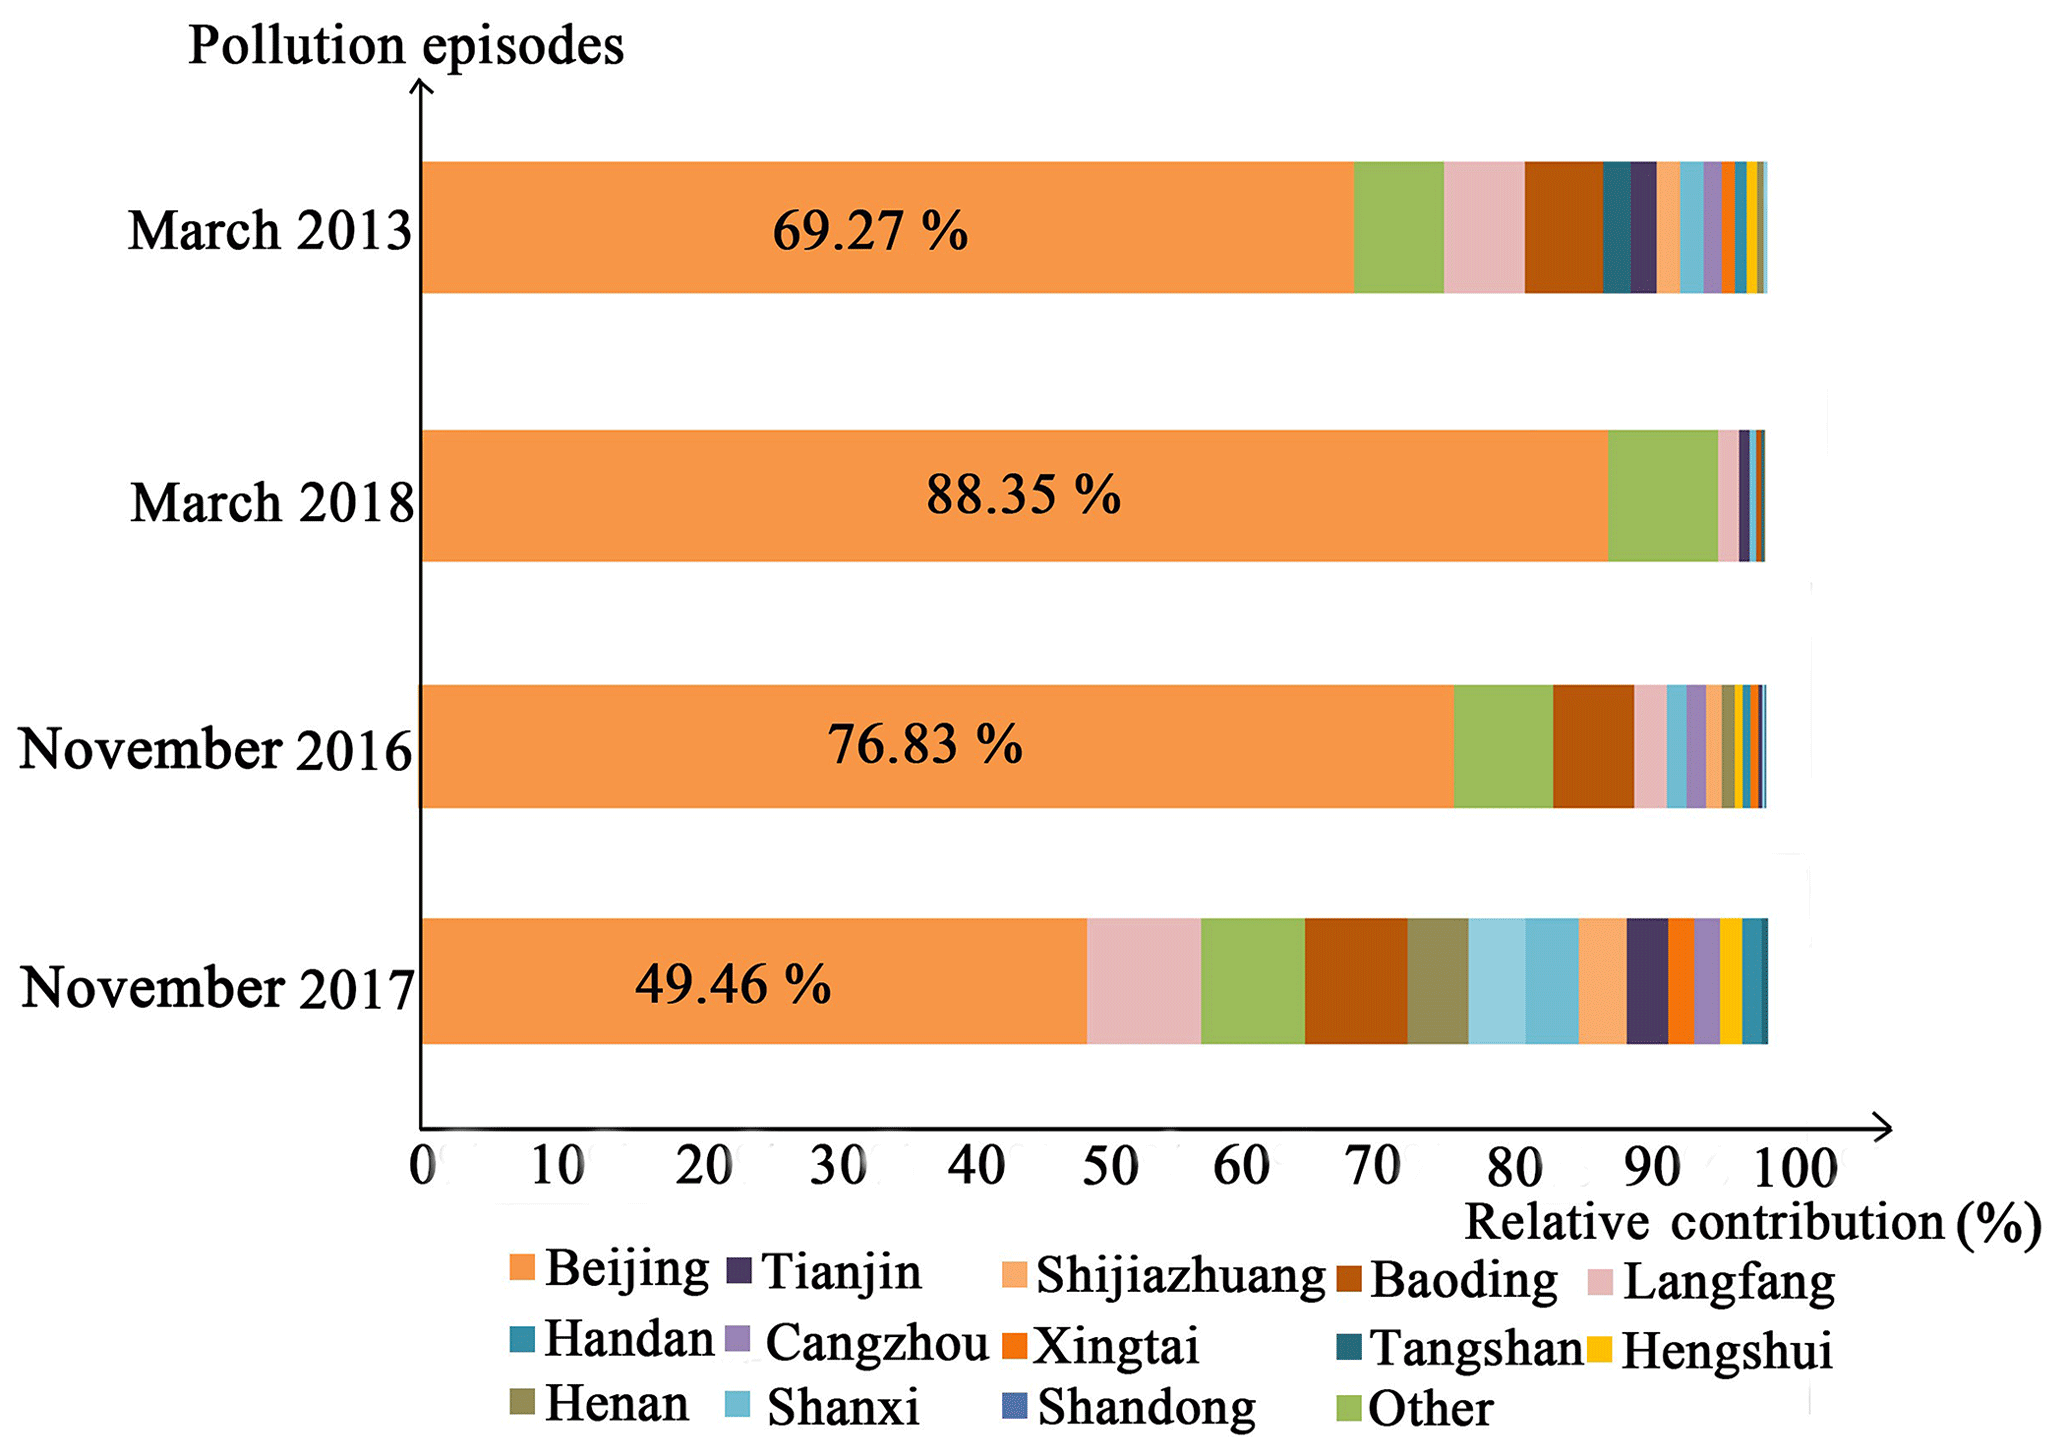
Figure 5The relative contributions of local emission and regional transport to PM2.5 concentrations in Beijing during the four pollution episodes.
For the pollution episode in March 2013, without long-term and contingent emission-reduction measures, the large amount of combusted coal fuels in the neighboring areas of Beijing led to a relatively large regional contribution. For the pollution episode in March 2018, with the implementation of the large-scale Coal to Gas project and 2+26 strategy, the rapidly reduced coal consumption in cities surrounding Beijing, and the limited restriction on the emission of local vehicles led to a fairly high local contribution. For the pollution episode in November 2016, an inversed temperature layer was observed with high relative humidity, which was a favorable environment for the production of secondary PM2.5 and a relatively large local contribution. Despite the implementation of the 2+26 strategy, the abnormally high regional contribution for the pollution episode in November 2017 could be attributed to the prevailing southerly winds that brought in a large amount of air from neighboring cities (e.g., Shijiazhuang). Therefore, although this pollution episode occurred in winter, it had more similarities to a summertime pollution episode, which was characterized by prevailing southerly winds, thoroughly mixed pollutants within the Beijing–Tianjin–Hebei region and notable regional transport.
Through the comparison of the components of PM2.5 during the pollution episode in 2013 and those in 2016, 2017, and 2018, we found that the proportion of sulfate ions decreased significantly, while nitrite ions became the dominant component of PM2.5 during the pollution episodes. This result is consistent with findings from some recent studies (Fromme et al., 2008; Tan et al., 2016; Shang et al., 2018). As revealed by previous studies (Zhang et al., 2013; Liu et al., 2018; Shang et al., 2018) and the source apportionment from this research, the use of coal fuels has been the dominant source for the formation and mass concentration of PM2.5 in Beijing since 2013. However, the remarkable decrease in coal combustion since the winter of 2017 has greatly reduced the contribution of coal combustion to local PM2.5 concentrations, which directly improved the wintertime air quality and led to the cleanest winter in Beijing since 2013. The mean wintertime (the winter for Beijing here refers to the central heating season from 15 November to 15 March) PM2.5 concentration in Beijing for 2013, 2014, 2015, 2016 and 2017 was 88.19,84.41, 89.39, 92.39 and 47.31 µg m−3, respectively.
The implementation of the 2+26 strategy led to different effects on PM2.5 reductions during specific pollution episodes. In addition to different emission-reduction strategies, the improvement of air quality in Beijing is controlled by a diversity of factors. Firstly, meteorological conditions exert a strong influence on the accumulation and dispersion of local airborne pollutants in Beijing and the long-distance transport of airborne pollutants from neighboring areas. Secondly, the distribution of PM2.5 concentrations in the 2+26 region determines whether the air brought into Beijing from neighboring areas increases or decreases PM2.5 concentrations there. As shown in Fig. 6, the spatial distribution of PM2.5 concentrations in the 2+26 region may vary significantly during different pollution episodes. Therefore, the influence of regional long-term transport of PM2.5 concentrations on PM2.5 concentrations was controlled by the direction and intensity of PM2.5 transport and the comparison between PM2.5 concentrations in Beijing and upwind areas.

Figure 6The distribution of PM2.5 concentrations in the 2+26 region during four pollution episodes.
Thirdly, the PM2.5 level during pollution episodes influences the relative contribution of local and regional contributions. The mean PM2.5 concentration during the 2+26 orange alert period in March 2018 was 170.67 µg m−3. High-concentration PM2.5 during pollution episodes led to a stagnant condition with high humidity and low wind speed (Chen et al., 2017, 2018), which was an unfavorable condition for the regional transport of airborne pollutants. Therefore, the relative contribution of local emissions to this extremely high PM2.5 concentration was 88.35 %, while the relative contribution of regional transport was 11.65 %. In this case, although unified emission-reduction measures were implemented in its neighboring areas, the significantly restricted regional transport did not fully project the effects of the 2+26 strategy to the local PM2.5 concentrations in Beijing. Conversely, the mean PM2.5 concentration during the 2+26 orange alert period in November 2017 was 92.91 µg m−3, which was not high enough to significantly prevent the regional transport of airborne pollutants. Therefore, the 2+26 strategy led to a simultaneous reduction in PM2.5 concentrations in this region and a large amount of clean air from its neighboring cities that significantly diluted the local PM2.5 in Beijing. Consequently, the relative contribution of regional transport was larger than 50 % and thus the 2+26 strategy achieved a much better effect on PM2.5 reductions than that in March 2018.
Another dominant factor that influences the effects of the 2+26 strategy is the level of air pollution alert and its corresponding emission-reduction measures. With the launch of orange air pollution alerts, a series of restrictions are placed on the temporary shutdown of polluting factories and the emission of fossil fuels can be reduced significantly. However, during orange alert periods, only the use of a small proportion of vehicles that cannot meet Environmental Standards Level I and II are forbidden, while no additional regulation is implemented on the use of more than 5 million private cars in Beijing. As a result, the relative contribution of vehicle exhaust increased rapidly during two of the 2+26 orange alert periods. For the orange alert period in March 2018, vehicle exhaust contributed to more than 50 % of the high PM2.5 concentrations that were higher than 174.24 µg m−3. With dramatically reduced use of coal fuels in the Beijing–Tianjin–Hebei region, due to the recent completion of the Coal to Gas project, control of vehicle exhaust is increasingly crucial for managing PM2.5 concentrations during pollution episodes. In this light, red air pollution alerts, which have stricter regulations on the use of vehicles, should be employed with the 2+26 regional emission-reduction strategy during heavy pollution episodes. For instance, during the heavy pollution episode in March 2018, if a red alert instead of the orange alert was issued, the implementation of odd–even license plate policy would instantly cut the daily use of private cars in Beijing by 50 percent and significantly reduce the contribution of vehicle exhaust to PM2.5 concentrations. Given the growing contribution of vehicle exhaust to PM2.5 pollutions in Beijing, in addition to the contingent regulations during pollution episodes, long-term policies, including the improvement of the public transit system, the enhancement of petrol quality and promotion of electric cars, should be properly implemented for further reducing vehicle-exhaust-induced PM2.5 pollutions.
Although the regional transport network for air pollution in Beijing has been identified, this research suggested that only those cities adjacent to Beijing, such as Baoding, Shijiazhuang and Langfang, made a relatively large contribution to the PM2.5 concentrations in Beijing, while the relative contribution of some other areas within the 2+26 framework was very limited. Considering the substantial social and economic loss induced by the implementation of air pollution alerts, city-specific, rather than region-wide unified emission-reduction strategies, should be conducted for promoting air quality in Beijing during pollution episodes. Tight measures can be implemented in cities that make a large contribution, while lenient measures can be implemented in cities that make a limited contribution to PM2.5 concentrations in Beijing. To this end, future studies should place more emphasis on quantifying the relative contribution from different cities to local PM2.5 concentrations in Beijing and setting city-specific emission-reduction measures for each city within the 2+26 region.
We compared the variations in PM2.5 concentrations in Beijing during four recent pollution episodes with different emission-reduction strategies. Based on this comparison, we found that the 2+26 regional emission-reduction strategy implemented in March 2018 led to a mean PM2.5 concentration only 16.43 % lower than that during the pollution episode in March 2013, when no emission-reduction measure was in place. On the other hand, the same 2+26 strategy implemented in November 2017 led to a mean PM2.5 concentrations 32.70 % lower than that during the pollution episode in November 2016 with local emission-reduction measures. The result suggested that the effects of the 2+26 regional emission-reduction measures on PM2.5 reductions were influenced by meteorological conditions, regional distribution of PM2.5 concentrations, and local PM2.5 level, and they could differ significantly during specific pollution episodes. Based on our PM2.5 component analysis, we found that the proportion of sulfate ions decreased significantly and nitrate ions were the dominant PM2.5 components during the two 2+26 orange alert periods. The source apportionment revealed that the relative contribution of coal combustion to PM2.5 concentrations during the pollution period in March 2013, November 2016, November 2017 and March 2018 was 40 %, 34 %, 28 % and 11 %, respectively, indicating that the recent completion of the large-scale Coal to Gas project and contingent 2+26 regional emission-reduction measures led to a dramatic decrease in coal combustion in the Beijing–Tianjin–Hebei region. Meanwhile, with no specific regulation on the use of private cars, the relative contribution of vehicle exhaust during the 2+26 orange alert periods in November 2017 and March 2018, was 40 % and 54 %, respectively. The relative contribution of local emissions to PM2.5 concentrations in Beijing varied significantly and ranged from 49.46 % to 89.35 % during the four pollution episodes. With gradually reduced coal consumption in the Beijing–Tianjin–Hebei region, this research suggested that the 2+26 regional emission-reduction strategy should be implemented with red air pollution alerts to intentionally reduce the dominant contribution of vehicle exhausts to PM2.5 concentrations in Beijing during heavy pollution episodes. Meanwhile, emission-reduction policies should be designed and implemented accordingly for different cities within the 2+26 regional framework. The methodology and findings from this research provided useful reference for comprehensively understanding the effects of the 2+26 strategy and for better designing and implementing of future long-term and contingent emission-reduction measures.
The PM2.5 data used for this research are available at the website (http://pm25.in/, China National Environmental Monitoring Center, 2017.), whilst meteorological data are available at the website (http://www.cma.gov.cn/2011qxfw/2011qsjgx/, China Meteorological Data Sharing Service System, 2017.). Realtime hourly PM2.5 data can be collected, whilst historical PM 2.5 data can be obtained upon request.
ZC, BX and LY designed this research. ZC wrote this paper. DC, YZ, WW, BG, RL and BZ conducted data analysis. DC and YZ produced the figures. MK, LY and BC helped revise this paper.
The authors declare that they have no conflict of interest.
This article is part of the special issue “Regional transport and transformation of air pollution in eastern China”. It is not associated with a conference.
Sincere gratitude goes to Tsinghua University, which produced the Multi-resolution Emission Inventory for China (http://meicmodel.org/, last access: 16 February 2019) and the Research Center for Air Quality Simulation and Forecast, Chinese Research Academy of Environmental Sciences (http://106.38.83.6/, last access: 16 February 2019), which supported the model simulation in this research. This research is supported by National Natural Science Foundation of China (grant no. 41601447), the National Key Research and Development Program of China (no. 2016YFA0600104), and the State Key Laboratory of Earth Surface Processes and Resource Ecology (2017-KF-22).
This research has been supported by the National Natural Science Foundation of China(grant no. 41601447), the National Key Research and Development Program of China (no. 2016YFA0600104), and the State Key Laboratory of Earth Surface Processes and Resource Ecology (2017-KF-22).
This paper was edited by Jianmin Chen and reviewed by two anonymous referees.
An, X., Zhu, T., Wang, Z., Li, C., and Wang, Y.: A modeling analysis of a heavy air pollution episode occurred in Beijing, Atmos. Chem. Phys., 7, 3103–3114, https://doi.org/10.5194/acp-7-3103-2007, 2007.
Boylan, J. W. and Russell, A. G.: PM and light extinction model performance metrics, goals, and criteria for three-dimensional air quality models, Atmos. Environ., 40, 4946–4959, 2006.
Burr, M. J. and Zhang, Y.: Source apportionment of fine particulate matter over the Eastern U.S. Part II: Source apportionment simulations using CAMx/PSAT and comparisons with CMAQ, source sensitivity simulations, Atmos. Pollut. Res., 2, 318–336, 2011.
Chen, Z. Y., Xu, B., Cai, J., and Gao, B. B.: Understanding temporal patterns and characteristics of air quality in Beijing: A local and regional perspective, Atmos Environ., 127, 303–315, 2016.
Chen, Z. Y., Cai, J., Gao, B. B., Xu, B., Dai, S., He, B., and Xie, X. M.: Detecting the causality influence of individual meteorological factors on local PM2.5 concentrations in the Jing-Jin-Ji region, Sci. Reports, 7, 40735, https://doi.org/10.1038/srep40735, 2017.
Chen, Z., Xie, X., Cai, J., Chen, D., Gao, B., He, B., Cheng, N., and Xu, B.: Understanding meteorological influences on PM2.5 concentrations across China: a temporal and spatial perspective, Atmos. Chem. Phys., 18, 5343–5358, https://doi.org/10.5194/acp-18-5343-2018, 2018.
Cheng, N., Zhang, D., Li, Y., Xie, X., Chen, Z., M, F., Gao, B. B., and He, B.: Spatio-temporal variations of PM2.5 concentrations and the evaluation of emission reduction measures during two red air pollution alerts in Beijing, Sci. Rep., 7, 8220, https://doi.org/10.1038/s41598-017-08895-x, 2017.
ENVIRON: User Guide for Comprehensive Air Quality Model with Extensions Version 6.0., ENVIRON International Corporation, Novato, California[EB/OL], 2013.
Frank, D. S. and Ponticello, I. S.: Method, composition and elements for the detecting of nitrogen-containing compounds: US, US4194063, 1980.
Fromme, H., Diemer, J., and Dietrich, S.: Chemical and morphological properties of particulate matter (PM, PM2.5) in school classrooms and outdoor air, Atmos. Environ., 42, 6597–6605, 2008.
Garrett, P. and Casimiro, E.: Short-term effect of fine particulate matter (PM2.5) and ozone on daily mortality in Lisbon, Portugal, Environ. Sci. Pollut. Res., 18, 1585–1592, 2011.
Guaita, R., Pichiule, M., Maté, T., Linares, C., and Díaz, J.: Short-term impact of particulate matter (PM2.5) on respiratory mortality in Madrid, Int. J. Environ. Health Res., 21, 260–274, 2011.
Guo, S., Hu, M., Guo, Q., Zhang, X., Zheng, M., and Zheng, J.: Primary sources and secondary formation of organic aerosols in Beijing, china, Environ. Sci. Technol., 46., 9846–9853, 2012.
Han, L., Zhuang, G., Cheng, S., Wang, Y., and Li, J.: Characteristics of re-suspended road dust and its impact on the atmospheric environment in beijing, Atmos. Environ., 41, 7485–7499, 2007.
Huang, Q., Cheng, S., and Perozzi, R. E.: Use of a MM5–CAMx–PSAT Modeling System to Study SO2, Source Apportionment in the Beijing Metropolitan Region, Environ. Model. Assess., 17, 527–538, 2012.
Kuenen, J., Gschwind, B., and Drebszok, K. M.: Estimating particulate matter health impact related to the combustion of different fossil fuels, Conference on Environmental Informatics – Informatics for Environmental Protection, Sustain. Develop. Risk Manage., 171, https://hal-mines-paristech.archives-ouvertes.fr/hal-00858231 (last access: 18 August 2018), 2013.
Li, X., Zhang, Q., and Zhang, Y.: Source contributions of urban PM2.5 in the Beijing–Tianjin–Hebei region: Changes between 2006 and 2013 and relative impacts of emissions and meteorology, Atmos. Environ., 123, 229–239, 2015.
Li, Y., Ma, Z., Zheng, C., and Shang, Y.: Ambient temperature enhanced acute cardiovascular-respiratory mortality effects of PM2.5 in Beijing, China, Int. J. Biometeorol., 59, 1761–1770, https://doi.org/10.1007/s00484-015-0984-z ,2015.
Liu, X. H., Zhang, Y., Cheng, S. H., Xing, J., Zhang, Q., Streets, D. G., Jang, C., Wang, W. X., and Hao, J. M.: Understanding of regional air pollution over China using CMAQ part I performance evaluation and seasonal variation, Atmos. Environ., 44, 2415–2426, 2010.
Liu, Y., Yan, C., and Zheng, M.: Source apportionment of black carbon during winter in Beijing, Sci. Total Environ., 618, 531–541, 2018.
MEP: 2017 air pollution prevention and management plan for the Beijing-Tianjin-Hebei region and its surrounding areas, http://dqhj.mee.gov.cn/dtxx/201703/t20170323_408663.shtml (last access: 18 August 2018), 2017.
Pan, Y., Tian, S., Liu, D., Fang, Y., Zhu, X., and Zhang, Q.: Fossil fuel combustion-related emissions dominate atmospheric ammonia sources during severe haze episodes: evidence from 15n-stable isotope in size-resolved aerosol ammonium, Environ. Sci. Technol., 50, 8049–8056, https://doi.org/10.1021/acs.est.6b00634,2016, 2016.
Pascal, M., Falq, G., Wagner, V., Chatignoux, E., Corso, M., Blanchard, M., Host, S., Pascal, L., and Larrieu, S.: Short-term impacts of particulate matter (PM10, PM10−2.5, PM2.5) on mortality in nine French cities, Atmos. Environ., 95, 175–184, 2014.
Rodríguez, S., Querol, X., and Alastuey, A.: Comparative PM10-PM2.5 source contribution study at rural, urban and industrial sites during PM episodes in Eastern Spain, Sci. Total Environ., 328, 95–113, 2004.
Shang, X., Zhang, K., Meng, F., Wang, S., Lee, M., Suh, I., Kim, D., Jeon, K., Park, H., Wang, X., and Zhao, Y.: Characteristics and source apportionment of fine haze aerosol in Beijing during the winter of 2013, Atmos. Chem. Phys., 18, 2573–2584, https://doi.org/10.5194/acp-18-2573-2018, 2018.
Shimano, S. and Asakura, S.: The redox combustion of carbon monoxide for recovering pure carbon dioxide by using molten (Na+, K+) 2(, ) mixtures, Chemosphere, 63, 1641–1647, https://doi.org/10.1016/j.chemosphere.2005.10.019, 2006.
Tan, J., Duan, J., and Zhen, N.: Chemical characteristics and source of size-fractionated atmospheric particle in haze episode in Beijing, Atmos. Res., 167, 24–33, 2016.
Wang, X., Wei, W., and Cheng, S.: Characteristics and classification of PM2.5, pollution episodes in Beijing from 2013 to 2015, Sci. Total Environ., 612, 170–179, 2017.
Watson, J. G., Barber, P. W., and Chang, M. C. O.: Southern Nevada Air Quality Study – Final Report, Diesel Engine Exhaust Gases, 7, 279–312, 2007.
Wu, D., Fung, J. C. H., and Yao, T.: A study of control policy in the Pearl River Delta region by using the particulate matter source apportionment method, Atmos. Environ., 76, 147–161, 2013.
Xing, J., Wang, S. X., Jang, C., Zhu, Y., and Hao, J. M.: Nonlinear response of ozone to precursor emission changes in China: a modeling study using response surface methodology, Atmos. Chem. Phys., 11, 5027–5044, https://doi.org/10.5194/acp-11-5027-2011, 2011.
Zeng, F., Shi, G. L., and Li, X.: Application of a Combined Model to Study the Source Apportionment of PM10 in Taiyuan, China, Aerosol Air Qual. Res., 10, 177–184, 2010.
Zeng, W., Lang, L., and Li, Y.: Estimating the Excess Mortality Risk during Two Red Alert Periods in Beijing, China, Int. J. Environ. Res. Pub. Health, 15, 50, https://doi.org/10.3390/ijerph15010050, 2018.
Zhang, R., Jing, J., Tao, J., Hsu, S.-C., Wang, G., Cao, J., Lee, C. S. L., Zhu, L., Chen, Z., Zhao, Y., and Shen, Z.: Chemical characterization and source apportionment of PM2.5 in Beijing: seasonal perspective, Atmos. Chem. Phys., 13, 7053–7074, https://doi.org/10.5194/acp-13-7053-2013, 2013.
Zhang, Z., Gong, D., and Kim, S. J.: Cause and predictability for the severe haze pollutions in downtown Beijing during November–December 2015, Sci. Total Environ., 592, 627–638, https://doi.org/10.1016/j.scitotenv.2017.03.009, 2017.
Zhong, J., Zhang, X., and Wang, Y.: Relative contributions of boundary-layer meteorological factors to the explosive growth of PM2.5, during the red-alert heavy pollution episodes in Beijing in December 2016, J. Meteorol. Res., 31, 809–819, 2017.
2+26strategy for air quality improvement in Beijing. We additionally considered two corresponding pollution episodes with different emission-reduction strategies to comprehensively understand the effects of
2+26strategy. The findings suggested that red alerts be employed in heavy pollution episodes to intentionally reduce vehicle exhaust, which has become the dominant source for high PM2.5 concentrations in Beijing.
2+26strategy for air...