the Creative Commons Attribution 4.0 License.
the Creative Commons Attribution 4.0 License.
Anthropogenic aerosol forcing – insights from multiple estimates from aerosol-climate models with reduced complexity
Stephanie Fiedler
Stefan Kinne
Wan Ting Katty Huang
Petri Räisänen
Declan O'Donnell
Nicolas Bellouin
Philip Stier
Joonas Merikanto
Twan van Noije
Risto Makkonen
Ulrike Lohmann
This study assesses the change in anthropogenic aerosol forcing from the mid-1970s to the mid-2000s. Both decades had similar global-mean anthropogenic aerosol optical depths but substantially different global distributions. For both years, we quantify (i) the forcing spread due to model-internal variability and (ii) the forcing spread among models. Our assessment is based on new ensembles of atmosphere-only simulations with five state-of-the-art Earth system models. Four of these models will be used in the sixth Coupled Model Intercomparison Project (CMIP6; Eyring et al., 2016). Here, the complexity of the anthropogenic aerosol has been reduced in the participating models. In all our simulations, we prescribe the same patterns of the anthropogenic aerosol optical properties and associated effects on the cloud droplet number concentration. We calculate the instantaneous radiative forcing (RF) and the effective radiative forcing (ERF). Their difference defines the net contribution from rapid adjustments. Our simulations show a model spread in ERF from −0.4 to −0.9 W m−2. The standard deviation in annual ERF is 0.3 W m−2, based on 180 individual estimates from each participating model. This result implies that identifying the model spread in ERF due to systematic differences requires averaging over a sufficiently large number of years. Moreover, we find almost identical ERFs for the mid-1970s and mid-2000s for individual models, although there are major model differences in natural aerosols and clouds. The model-ensemble mean ERF is −0.54 W m−2 for the pre-industrial era to the mid-1970s and −0.59 W m−2 for the pre-industrial era to the mid-2000s. Our result suggests that comparing ERF changes between two observable periods rather than absolute magnitudes relative to a poorly constrained pre-industrial state might provide a better test for a model's ability to represent transient climate changes.
- Article
(14579 KB) - Full-text XML
- BibTeX
- EndNote
Despite decades of research on the radiative forcing of anthropogenic aerosol, quantifying the present-day magnitude and reconstructing the historical change of the forcing remains challenging. Figure 1 shows the anthropogenic aerosol optical depth for the mid-1970s and mid-2000s that we use in this study (Fiedler et al., 2017; Stevens et al., 2017). The anthropogenic aerosol pollution in the mid-1970s was larger in Europe and North America than in eastern Asia, whereas the opposite is the case in the mid-2000s. In addition to these regional changes in aerosol pollution, differences in the surface albedo, insolation and cloud regimes between the aerosol transport regions of the Pacific and continental Europe may result in temporal changes in the global effective radiative forcing (ERF). Based on a single state-of-the-art climate model, the long-term and global ERF does not change despite the substantial spatial changes in anthropogenic aerosol optical depth (τa) between the mid-1970s and mid-2000s (Fiedler et al., 2017). Internal model variability, however, strongly affects annual estimates of the global-mean effective radiative forcing.
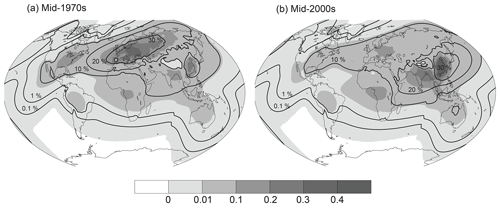
Figure 1Mean anthropogenic aerosol optical depth (τa; shaded) and fractional increase in cloud droplet number (ηN; contours) associated with anthropogenic aerosol. Shown are annual means of τa at 550 nm and ηN for the (a) mid-1970s and (b) mid-2000s from MACv2-SP, which prescribes annually repeating monthly maps of τa in the participating models. Note the non-linear scale.
In light of model uncertainties (e.g. Kinne et al., 2006; Quaas et al., 2009; Lohmann and Ferrachat, 2010; Lacagnina et al., 2015; Koffi et al., 2016), the use of a single model does not necessarily represent the full spectrum of possible anthropogenic aerosol forcings. In the present study, we therefore revisit the question of Fiedler et al. (2017): “Does the substantial spatial change of the anthropogenic aerosol between the mid-1970s and mid-2000s affect the global magnitude of ERF?”. This is based on ensembles of simulations from five global aerosol-climate models, all using identical anthropogenic aerosol perturbations of reduced complexity. In this context, we additionally ask the following: “What is the relative contribution of internal model variability to the ERF spread?”. We document the model diversity for the pre-industrial aerosol as well as cloud characteristics and the surface albedo that are relevant to the ERF of anthropogenic aerosol. Such model differences have previously been identified for other climate models (e.g. Stier et al., 2007; Nam et al., 2012; Fiedler et al., 2016; Crueger et al., 2018).
Previously a reduction in the model complexity has been accomplished by prescribing idealized aerosol radiative properties, e.g. within the framework of Aerosol Comparisons between Observations and Models (AeroCom; e.g. Randles et al., 2013; Stier et al., 2013). Here, we prescribe observationally constrained optical properties of anthropogenic aerosol and an associated effect on the cloud droplet number concentration with the simple plume parameterization (MACv2-SP; Fiedler et al., 2017; Stevens et al., 2017) but keep the full model diversity in all other aspects. The approach eliminates uncertainties in process modelling of anthropogenic aerosol such that our study represents uncertainties associated with other processes influencing the radiative forcing. In other words, by using MACv2-SP in the participating models, the model inter-comparison allows us to investigate those sources of uncertainty that remain if we pretend to know the spatial distribution of anthropogenic aerosol. This work can be seen as a pilot study for the Radiative Forcing Model Inter-comparison Project (RFMIP; Pincus et al., 2016), endorsed by the sixth Coupled Model Intercomparison Project (CMIP6; Eyring et al., 2016), using the same experiment set-up with MACv2-SP.
Throughout our model inter-comparison, we consider the effect of model-internal variability on estimates of ERF. We do so by producing equally sized ensembles of simulations for all participating models. Model-internal variability in this context is defined as the year-to-year changes in model parameters associated with inter-annual variations of the meteorological state. The results of the climate models are compared with satellite data and a stand-alone radiative transfer model. The following section introduces the models and the experiment strategy in more detail, followed by our discussion of the results in Sect. 3 and conclusions in Sect. 4.
2.1 Participating models
This work uses five Earth system models and one stand-alone radiative transfer code. The participating climate models, which are run here in an atmosphere-only mode, are the atmosphere component ECHAM6.3 of the Earth system model MPI-ESM1.2 (Mauritsen et al., 2019) of the Max Planck Institute for Meteorology (MPI-M), ECHAM6.3-HAM2.3 from ETH Zürich (Neubauer et al., 2019; Tegen et al., 2019), EC-Earth (e.g. Hazeleger et al., 2010; Döscher et al., 2019) run at the Royal Netherlands Meteorological Institute, NorESM (Bentsen et al., 2013; Iversen et al., 2013; Kirkevåg et al., 2013) run at the Finnish Meteorological Institute and HadGEM3 (Walters et al., 2017) developed at the UK Met Office. All models except ECHAM6.3 can treat aerosols and their interaction with meteorological processes with complex process-based parameterization schemes linking aerosols to radiation and clouds. In this study, all physics packages except the parameterization of anthropogenic aerosols are model-dependent, e.g. the treatment of the pre-industrial aerosols and clouds differ. Appendix A summarizes differences in radiation, cloud and aerosol physics packages of the participating models.
In the present study, we prescribe the distributions of anthropogenic aerosols in all models, following the MACv2-SP approach (Fiedler et al., 2017; Stevens et al., 2017). MACv2-SP mimics the spatio-temporal distribution and wavelength dependence of the optical properties of anthropogenic aerosols as well as a change in the cloud droplet number concentration (N) to induce radiative effects associated with the physical processes of aerosol–radiation interactions (Fari) and aerosol–cloud interactions (Faci) in a consistent manner. To do so, MACv2-SP uses analytical functions for approximating the monthly distribution of the present-day anthropogenic aerosol optical depth and the vertical profile of the aerosol extinction from the updated MPI-M aerosol climatology (MACv2; Kinne et al., 2013, 2019). Figure 1 shows the annual mean patterns of the anthropogenic aerosol optical depth (τa) and the fractional increase in the cloud droplet number concentration (ηN) relative to the pre-industrial level of 1850 from MACv2-SP. By design, MACv2-SP does not simulate sub-monthly variability in anthropogenic aerosol. Absorption of anthropogenic aerosol is prescribed with a mid-visible single scattering albedo of 0.93 for industrial plumes and 0.87 for plumes with seasonally active biomass burning. The anthropogenic aerosols are assumed to be small in size, with an Ångström parameter of 2 and an asymmetry parameter of 0.63. Here, we use MACv2-SP with the CMIP6 reconstructed changes of anthropogenic aerosol emissions, identical to the settings used by Fiedler et al. (2017). Stevens et al. (2017) describe the technical details of MACv2-SP.
The use of the optical properties from MACv2-SP yields a consistent description of Fari, including both direct radiative and semi-direct effects, across the models. All models account for the first indirect or Twomey effect by multiplying their cloud droplet number concentrations, calculated for pre-industrial aerosol conditions, by ηN prior to the radiative transfer calculation. Since ηN is larger than 1 in the presence of anthropogenic aerosols, the effective radius of cloud droplets is reduced, which enhances the cloud reflectivity of short-wave radiation. Note that ηN is only available for regions with τa>0 (see Fig. 1). In addition, the EC-Earth model also includes a second indirect or cloud-lifetime effect by using the modified cloud droplet number concentrations in the cloud microphysics scheme (Döscher et al., 2019).
We neither prescribe the same natural aerosol nor interfere with any other model components than prescribing the optical properties of anthropogenic aerosols and ηN. For instance, the pre-industrial aerosol optical depth (τp) depends on the model (Figs. 2 and 3), which only affects Fari and not Faci, as the prescription of ηN is identical in the participating models. Regional differences in τp occur primarily over oceans and deserts, where observations are typically sparse. It is noteworthy that ECHAM-HAM runs with interactive parameterizations for dust and sea-salt aerosol, resulting in different spatio-temporal variability in τp (Fig. 3), while in ECHAM the monthly climatology from MACv1 is prescribed. In the interactive parameterizations, the natural aerosol emissions, transport and deposition rely on meteorological processes that are difficult to represent in coarse-resolution climate models; e.g. desert-dust emissions strongly depend on the model representation of near-surface winds (e.g. Fiedler et al., 2016) such that constraining the desert-dust burden remains challenging in aerosol modelling (e.g. Räisänen et al., 2013; Evan et al., 2014; Huneeus et al., 2016). The aerosol-climate models also contain some anthropogenic aerosol in τp, but the majority of the pre-industrial aerosol optical depth is of natural origin. For instance, the 1850s global-mean τp in NorESM is 0.096, to which anthropogenic fossil-fuel aerosols contribute 0.002. For comparison, the global-mean τa prescribed here is 0.029 for 2005.
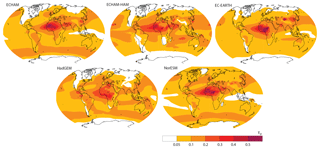
Figure 2Mean pre-industrial aerosol optical depth (τp). Shown are annual means of τp of the radiation band at around 550 nm for each model.
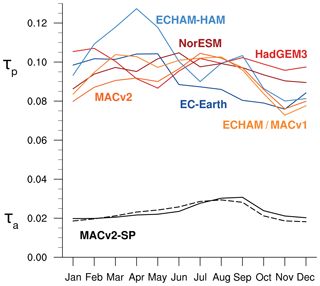
Figure 3Annual cycle of the global-mean aerosol optical depth at 550 nm. Shown are monthly means of τp (colours) from the models and τa (black) for the mid-1970s (dashed) and mid-2000s (solid) from MACv2-SP.
In addition to the complex climate models listed above, we use the offline radiative-transfer model of Kinne et al. (2013) for an assessment of the instantaneous radiative forcing. This model has 8 solar and 12 infrared bands and reads monthly maps of the atmospheric and surface properties. These are, for instance, monthly means for the cloud properties from the International Satellite Cloud Climatology Project (ISCCP) and the surface albedo from the satellite product MODIS-SSM/I described in Kinne et al. (2013). The radiative-transfer calculation considers nine different sun elevations and eight randomly chosen combinations of cloud heights and overlap. The aerosol column properties at 550 nm are defined by the MPI-M Aerosol Climatology (MAC). The aerosol vertical distribution and the fine-mode anthropogenic fraction of aerosol optical depth for the mid-2000s are derived from global models participating in AeroCom (e.g. Myhre et al., 2013). We calculate the radiation transfer with both MAC version one (MACv1; Kinne et al., 2013) and two (MACv2; Kinne, 2019). The latter considers more recent observational data, e.g. from the Maritime Aerosol Network (MAN; Smirnov et al., 2009), and a smaller anthropogenic aerosol fraction. MACv2 is also based on more recent emission data relative to 1850 (Lamarque et al., 2010), while MACv1 used emission data relative to 1750 (Dentener et al., 2006). The two climatologies therefore make different assumptions on the pre-industrial background, shown in Fig. 3. The temporal scaling of anthropogenic aerosol optical depth in MACv1 and MACv2 is from the same transient ECHAM simulation (Stier et al., 2006). The parameterization form of the Twomey effect for MACv1 and MACv2 is identical to MACv2-SP here, but the assumptions for τp and τa differ.
2.2 Experiment strategy
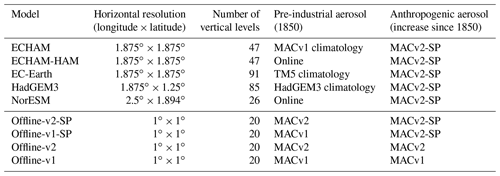
All climate model simulations are carried out with the atmosphere-only configurations using prescribed monthly mean sea-surface temperatures and sea ice. Table 1 summarizes the major characteristics of the model simulations. The modelling groups were free to set up all model components other than MACv2-SP and choose their own boundary and initialization data. Specifically, the modelling groups use their own representation of pre-industrial aerosol for 1850 such that the present work includes both models with prescribed monthly climatologies and interactive parameterization schemes for natural aerosol species (Appendix A). Moreover, the physical parameterizations of radiation and clouds are different across the models (Appendix A).
Motivated by the effect of natural variability in ERF estimates in ECHAM (Fiedler et al., 2017), each model was run to produce a number of simulation ensembles: a reference ensemble consisting of six simulations with only pre-industrial aerosols representative of 1850 and two additional ensembles consisting of three simulations each with aerosols representative of 1975 and 2005. For each model, we perform a total of 12 experiments for the years 2000–2010. These are six experiments with τp for the year 1850, three experiments with τp and anthropogenic aerosol from MACv2-SP for the year 1975, and three experiments with τp and anthropogenic aerosol from MACv2-SP for the year 2005. The six pre-industrial simulations serve as the reference for the experiments with anthropogenic aerosol and therefore efficiently increase the number of forcing estimates for anthropogenic aerosol. The first year of each run is considered to be a spin-up period and is excluded from the analysis. A 10-year period was chosen to account for variability in the boundary conditions.
The instantaneous radiative forcing (RF) of anthropogenic aerosols in clear- and all-sky conditions is estimated from double radiation calls in the models having this functionality, namely ECHAM, ECHAM-HAM and NorESM. Aerosol radiative effects predominantly occur for short-wave radiation. We therefore calculate the atmospheric transfer of short-wave radiation once with and once without the contribution from anthropogenic aerosols to the aerosol optical properties and their effect on the cloud droplet number concentration. For each model, this gives us in total 30 annual estimates of RF for each of the two τa patterns shown in Fig. 1, which is sufficient to estimate the mean RF and can be directly compared to the offline radiation-transfer calculations. We calculate RF at the top of the atmosphere (TOA) and at the surface (SFC) and list the global means in Table 2.
Table 2Ensemble averages of the short-wave instantaneous radiative forcing (RF) and effective radiative forcing (ERF), and net contribution from rapid adjustments (ADJs) at the surface (SFC) and the top of the atmosphere (TOA) for all sky (clear sky) in W m−2 for the period 1850 to 2005. The first block shows aerosol-climate models with MACv2-SP, and the second block shows estimates of the offline radiative-transfer model.
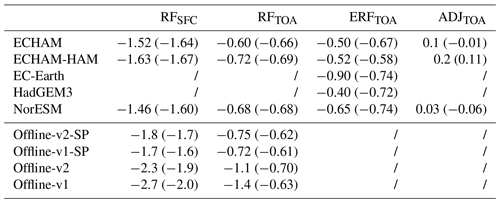
The ERF is calculated as the difference in the short-wave radiative flux at the top of the atmosphere between the simulations with and without anthropogenic aerosols. For illustrating the effect of year-to-year variability, we calculate annual ERF estimates for each of the 10 simulation years. Combining the six pre-industrial experiments with each of the three experiments with additional anthropogenic aerosol thus yields 6×3 annual ERF estimates for each year of the simulation, i.e. 180 annual estimates per model and τa pattern in total. We calculate the standard deviation from these 180 annual ERF values and use it as a measure of the natural variability in ERF internal to the models. The means of these 180 values are used for identifying systematic model differences in ERF. It was shown in an earlier study using ECHAM (Fiedler et al., 2017) that the combination of ensemble size and simulation length adopted here is sufficient for precisely estimating the ERF of a model. For comparison, the RFMIP protocol recommends a 30-year average for diagnosing the ERF of a model (Pincus et al., 2016). Finally, we calculate the net contribution of rapid adjustments (ADJs) to ERF by subtracting RF from ERF for each model. Our rapid adjustments are associated with atmospheric temperature changes, i.e. semi-direct effects, except for EC-Earth, accounting also for adjustments in cloud microphysics. A discussion of the rapid adjustments and the choice for the Twomey effect in ECHAM is given by Fiedler et al. (2017).
3.1 Spread in present-day ERF
We characterize the spread in the short-wave effective radiative forcing (ERF) at the top of the atmosphere in our model ensemble for the present-day (mid-2000s). For doing so, we first calculate the multi-model mean as a reference value. The all-sky top-of-atmosphere ERF for the entire multi-model, multi-member ensemble is −0.59 W m−2, with an inter-annual standard deviation of 0.3 W m−2, corresponding to a relative variability of roughly 50 %. The inter-annual variability in ERF is illustrated by Gaussian distributions fitted to the frequency histogram in Fig. 4a. The entire range in annual ERFs from the models including inter-annual variability is −1.5 to +0.5 W m−2.

Figure 4Variability in annual ERF estimates for the mid-2000s. (a) shows Gaussian distributions of annual ERF estimates for present-day from individual model ensembles (colours) and the entire multi-model, multi-member ensemble (black). The bars are the frequency histogram of 1-year ERF estimates from all models, and the legend indicates the means and standard deviations of the ERF estimates. (b) shows the regional standard deviation of annual contributions to ERF from the entire multi-model, multi-member ensemble as measure for the inter-annual variability inherent in the model ensemble. (c) shows the range in the long-term averaged ERFs of the models as measure for the spread in ERF associated with model differences. ERF is for the short-wave (SW) spectrum at the top of atmosphere (TOA) for all-sky conditions.
The all-sky ERFs from the models are 10 %–50 % less negative than the clear-sky ERF in all models, except in EC-Earth, because clouds mask the ERF of low-level anthropogenic aerosol (Table 2). That masking by clouds is most pronounced in HadGEM3. In EC-Earth, the all-sky ERF is more negative than in clear-sky conditions because EC-Earth includes cloud-lifetime effects of anthropogenic aerosols, thus simulating a stronger Faci than all other participating models. The long-term averaged ERFs of ECHAM and ECHAM-HAM are similar, despite ECHAM using a prescribed climatology of τp and ECHAM-HAM simulating τp interactively (Sect. 2.1). This similarity suggests that the sub-monthly variability in natural aerosol does not substantially affect the mean ERF of anthropogenic aerosol as long as Faci is treated consistently in the two models. Using different parameterizations for Faci can change this result because of non-linear processes. The magnitude of Faci, however, remains uncertain (Bellouin et al., 2019). One contributing uncertainty is the poor quantitative understanding of the pre-industrial aerosols (e.g. Carslaw et al., 2013).
The multi-model spread in the ensemble mean all-sky ERF of individual models is rather small, with a range of −0.40 to −0.9 W m−2, compared to the internal variability in the entire multi-model ensemble (Fig. 4a). This multi-model spread corresponds to a range of deviations from the multi-model mean of just −0.31 to +0.19 W m−2 and is even smaller when the ERF of EC-Earth, which includes cloud-lifetime effects, is excluded. One could expect less model diversity in all-sky ERF from our study than from previous inter-comparison projects (e.g. Myhre et al., 2013; Shindell et al., 2013) because we prescribe the same aerosol optical properties and the associated change in cloud droplet numbers. However, our model diversity in clear-sky ERF is smaller than for our all-sky ERF (Table 2). This points to the influence of model differences in representing clouds (Appendix B) on the all-sky ERF. Our results therefore indicate that model differences in meteorological parameters contribute to the model diversity in all-sky ERF. This is also the case for the ERF uncertainty in a complex aerosol-climate model (Regayre et al., 2018).
The large inter-annual variability implies that it is essential to estimate ERF of individual models from a sufficiently large number of simulated years to quantify model differences in ERF. Otherwise the modelled ERF estimates may not be representative of the long-term average. This could be done either from sufficiently long simulations with annually repeating aerosol or a sufficiently large ensemble of simulations with transient changes. Given the similar year-to-year variability in ERF in the models, the confidence estimates from ECHAM (Fiedler et al., 2017) are a reasonable approximation for the whole ensemble of models in the present study.

Figure 5Multi-model, multi-member ensemble mean of the anthropogenic aerosol radiative effects for the mid-2000s. Shown are the (a) instantaneous and (b) effective radiative forcing as well as (c) the net contribution from rapid adjustments for the SW spectrum at the TOA in all-sky conditions. Hatching in (b, c) indicates non-significant values at a 10 % significance level. The numbers in the lower left corner are the spatial averages. The ensemble-mean RF is averaged over three climate models, the ensemble-mean ERF is averaged over five climate models and the ensemble-mean adjustment is their difference.
3.2 Regional contributions to ERF
The distributions of ERF for 2005 are shown as ensemble averages in Fig. 5 and are shown for each model in Fig. 6. Eastern Asia is the largest contributor to globally averaged ERF, as expected from the regional maximum in τa prescribed there (Fig. 5b). The mean pattern of regional contributions to ERF is in general similar in the models, but differences in its magnitude and detectability appear in some regions. For example, the contributions to the global ERF modelled over central Africa range from positive to negative, averaging to a small value in this region (Fig. 5).
Another interesting example for where regional contributions to globally averaged ERF differ is the North Atlantic. In this region, the variability in the multi-model ensemble is relatively large, 3–6 W m−2 (Fig. 4b), but the small multi-model mean radiative effects are nevertheless detectable (Fig. 5), although ECHAM and the Hadley Centre Global Environment Model (HadGEM) by themselves have regional signals over the North Atlantic that are not statistically significant.
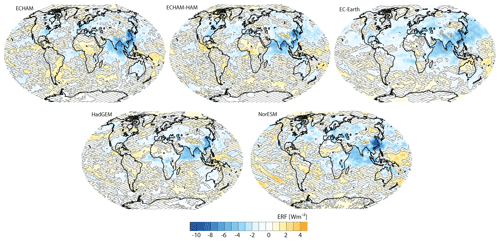
Figure 6Multi-member ensemble mean of effective radiative effects of anthropogenic aerosol for the mid-2000s. Shown is the effective radiative forcing for the SW spectrum at the TOA in all-sky conditions for each model. Hatching indicates non-significant values at a 10 % significance level.
Taken together, the size of year-to-year variability and regional model differences in contributions to the global ERF imply that an ensemble of simulations with more than one model, as done here, is needed for constraining the radiative effect of anthropogenic aerosol regionally. The spread in modelled regional contributions to ERF is typically smaller than the differences associated with natural variability in the model ensemble (Fig. 4b–c). Irrespective of whether we compute the regional standard deviations for the aerosol pattern of the mid-1970s or the mid-2000s, the pattern and strength of the regional natural variability in contributions to ERF are robust (not shown). In regions where the anthropogenic aerosol burden was relatively large in 2005, like eastern Asia, the models disagree on the magnitude of the regional contributions to ERF (Fig. 4c), which means that even for a relatively large anthropogenic aerosol optical depth, natural variability in the atmosphere remains a hurdle against constraining the regional radiative effect.
3.3 Contributions from RF and adjustments
The modelled ERF is decomposed into the contributions of rapid adjustments and RF by diagnosing the latter from double calls to the radiation scheme in the models with this functionality (Fig. 5). The RF is considerably less variable from year to year than ERF. Moreover, RF clearly dominates the ERF magnitude in all models that use ηN in the radiation transfer calculation (Table 2). Remember that these models consider Faci from the Twomey effect only. The net contribution of rapid adjustments to the global-mean ERF ranges from 0.03 W m−2 in NorESM to 0.2 W m−2 in ECHAM-HAM at the TOA and acts to weaken the forcing magnitude. The positive net contribution from adjustments is consistent with buffering of perturbations by atmospheric processes.
We compare the climate model estimates of RF with the results of the offline radiation-transfer calculations described in Sect. 2.1. The offline estimates of the all-sky RF with MACv2-SP (Offline-v1-SP and Offline-v2-SP) are in close agreement with the RF of the climate models that represent Faci in the form of the Twomey effect. This agreement is remarkable, since the aerosol-climate models and the offline model differ in many aspects, including again the representation of clouds (see Appendix B).
3.4 Uncertainties in RF
The offline radiation-transfer model is used to assess the role of uncertainty in τp and τa in total RF uncertainty. The aerosol classification of MACv2 (Offline-v2) is used as an alternative representation to MACv1 (Offline-v1). MACv2 classifies more ambiguous cases of fine-mode aerosol as anthropogenic than MACv2-SP. These cases primarily occur in remote uninhabited regions such as the Southern Ocean and the Sahara. These regions are poorly captured by the ground-based observation network, so there the MACv2 product primarily uses global model results for separating anthropogenic from natural aerosols. Classifying additional fine-mode aerosol as anthropogenic increases the all-sky RF to −1.1 W m−2, which primarily arises due to stronger Faci in MACv2. Ambiguous aerosol classifications, which occur especially in regions with a generally low aerosol burden, and poor observational coverage are therefore causes of uncertainty in present-day RF, with the RF becoming more negative with increasing τa.
An even more negative RF is obtained from the offline model, namely an all-sky RF of −1.4 W m−2, when both a larger anthropogenic fraction and the lower background burden of 1750 from MACv1 (Offline-v1) are used. Note that the clear-sky RFs from the offline estimates and the climate models are in good agreement such that most of the uncertainty stems from the uncertain magnitude of Faci. This underlines again the importance of the aerosol background for quantifying the cloudy-sky contribution to all-sky RF in agreement with previous studies (Carslaw et al., 2013; Fiedler et al., 2017). Quantitative changes in the natural aerosol burden between the pre-industrial and present-day eras remain poorly constrained. Since the aerosol of 1750 or 1850 has not been observed, using the present-day natural aerosol as a background could yield a better comparability of observational and model estimates in future inter-comparison studies. By prescribing both the same natural and anthropogenic aerosol across different models, differences in the radiative effects of the aerosol can be attributed to model errors in representing meteorological processes and radiative transfer.
3.5 Impact of spatial change of pollution
Although the global-mean τa is similar for 1975 and 2005, the anthropogenic pollution covers very different regions, with the largest maxima in Europe and the US during the mid-1970s and in eastern Asia during the mid-2000s. The regional differences in clouds, insolation and surface albedo can contribute to changes in radiative effects that can result in a different global ERF. For instance, Figs. B1–B3 show the spatial patterns of cloud properties and the surface albedo, illustrating both the regional differences and the model diversity for their representation (see Appendix B). The different spatial distributions of τa clearly change the pattern of the radiative forcing (Fig. 7). As expected, the maxima in regional contributions to RF and ERF occur over Europe and the US in the mid-1970s and over eastern Asia for the mid-2000s.

Figure 7Multi-model, multi-member ensemble mean of the anthropogenic aerosol radiative effects for the mid-1970s, as in Fig. 5, but with the anthropogenic aerosol pattern of the mid-1970s.
Despite those regional differences in radiative effects and the inter-model spread in ensemble-averaged global-mean RF and ERF, the spatial pattern of τa has little impact on the global-mean RF and ERF in each of the participating models. The model ensemble mean changes from −0.54 W m−2 for the mid-1970s to −0.59 W m−2 for the mid-2000s. The mean monthly contributions to RF are also similar for both τa patterns, irrespective of which model we choose (not shown).
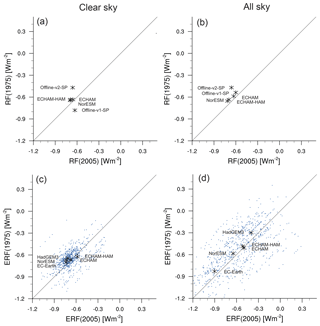
Figure 8Anthropogenic aerosol forcing of the mid-1970s against the mid-2000s. Shown are the (a, b) instantaneous and (c, d) effective radiative forcing for the SW spectrum at the TOA from the pollution of the mid-1970s against the mid-2000s for (a, c) clear- and (b, d) all-sky conditions. Thick asterisks are the ensemble means. Blue dots in (c, d) are the model averages of individual years, representing the year-to-year variability internal to the model ensemble.
The ensemble-averaged change in ERF is small relative to the natural inter-annual variability in modelled ERFs (Fig. 8). Indeed, contrasting 1-year estimates from the two τa patterns results in a large spread in ERF changes ranging from decreases to increases in ERF with τa patterns (Fig. 8c, d). This result is in agreement with previous findings based on ECHAM only (Fiedler et al., 2017). The result underlines again the importance of using a large number of simulated years for determining changes in ERF from free-running climate models. Moreover, it provides evidence that the global-mean ERF does not strongly depend on the regional distribution of anthropogenic aerosol in the Northern Hemisphere.
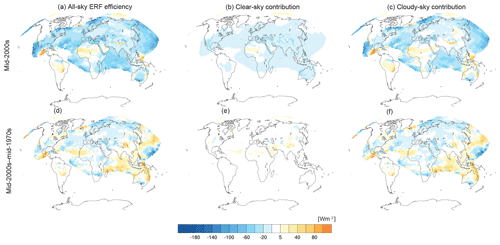
Figure 9Anthropogenic aerosol effective radiative forcing efficiencies (in W m−2 per unit optical depth) for (a, d) all-sky, (b, e) clear-sky and (c, f) cloudy-sky conditions. (a–c) show efficiencies for mid-2000s anthropogenic aerosols. (d–f) show differences made by using the pattern for the mid-1970s.
The cloudy- and clear-sky contributions to the all-sky efficiency of the ERF, in other words the ratio of ERF to τa, helps with better understanding why the two τa patterns yield similar ERFs. All-sky efficiency is the sum of contributions from cloudy and clear-sky conditions:
where f is the total cloud fraction, and ERFcloudy and ERFclear are the ERF in cloudy and clear-sky conditions, respectively.
Figure 9 shows the regional distribution from the multi-model ensemble average of the terms of Eq. (1). The all-sky efficiency often increases with increasing distance to major pollution sources because of the decreasing background aerosol, up to −100 W m−2 per unit of τa. These all-sky efficiencies are primarily explained by the cloudy-sky contributions. Large efficiencies occur typically in remote areas, including some regions at the edges of τa plumes (Fig. 9). No clear saturation of Faci is evident at all edges of the τa plumes. Also the spatial distribution of both the all- and cloudy-sky efficiency is rather inhomogeneous. The inhomogeneity contrasts with the clear-sky efficiency, which has much smaller spatial variability.
Averaged globally, all-sky forcing efficiencies for the two aerosol patterns are similar at −26 W m−2 per unit of τa. The regional all-sky ERF efficiencies, however, change between the mid-1970s and mid-2000s (Fig. 9). This change is almost exclusively explained by the cloudy-sky contribution to the ERF efficiency, reflecting the regional change in ηN from the mid-1970s to mid-2000s. The strong change in the cloudy-sky contribution is in strong contrast to the relatively minor changes in the clear-sky contributions. Differences in regional efficiencies of anthropogenic aerosol effects on clouds thus become balanced in the global mean and result in similar global ERFs for the mid-1970s and mid-2000s.
Of all models, NorESM and EC-Earth have the strongest ERF efficiencies around −30 and −40 W m−2 per unit of τa, respectively; i.e. the same aerosol perturbation in these two models is much more efficient in inducing effective radiative effects than in the other models, consistent with the more negative ERFs (Fig. 8). In EC-Earth, the more negative ERF also arises from perturbing the cloud microphysics with ηN. In NorESM, the more negative ERF arises from a strong negative RF and a small net contribution from adjustments.
We assess the radiative effects of anthropogenic aerosol in ensembles of simulations from five state-of-the-art aerosol-climate models, prescribing identical anthropogenic aerosol properties of reduced complexity. Each of the participating models uses annually repeating patterns of anthropogenic aerosol for obtaining 180 years of radiative forcing estimates. The multi-model multi-ensemble present-day all-sky short-wave effective radiative forcing (ERF) at the top of atmosphere is −0.59 W m−2. The year-to-year standard deviations of around 0.3 W m−2 in the models imply a typical year-to-year variability of 50 %, reflecting a strong contribution of model-internal variability to ERF. We therefore recommend caution for the use of ERF estimates based on single years, as in the standard AeroCom protocol with varying reference years. These are likely affected by model-internal variability such that an apparent ERF spread is not associated with systematic model differences alone. Indeed such studies have shown a substantial spread in ERF estimates (e.g. Shindell et al., 2013), comparable to the magnitude of the model-internal variability quantified in the present work.
We further recommend that model-based assessments of ERF in the future ensure the elimination of the effects of internal variability, either by averaging over longer time periods from single transient climate simulations or from averaging across several ensemble members for shorter time periods. For instance, the protocol of RFMIP requests 30-year averages for estimating the present-day ERF and three-member ensembles with 10-year averages for diagnosing decadal changes in ERF (Pincus et al., 2016). The precision of the estimate can be tested by using confidence estimates (e.g. Fiedler et al., 2017). Note that natural variability is equally an issue in observations. Ensembles of simulations should therefore be used for constraining ERF with the historical record of observations. The inter-annual variability in ERF, and hence the number of years needed to estimate ERF, could be different in nudged model simulations (Zhang et al., 2014). However, nudging a model simulation with reanalysis data can change the climatology and interfere with the rapid adjustments. The resulting ERFs from a nudged simulation are therefore likely different when compared with free-running model simulations. The interference of nudging with adjustments deserves closer attention in future research.
In our study, we obtain an ERF spread of −0.9 to −0.4 W m−2, associated with systematic model differences (Fig. 10). This estimate is not affected by model-internal variability, is based on identical anthropogenic aerosol optical properties and makes use of a consistent perturbation of the cloud droplet number concentrations associated with anthropogenic aerosol. The model with the most negative ERF accounts also for changes in cloud microphysics associated with anthropogenic aerosol, whereas the other participating models account for the Twomey effect only. Based on our model spread, we conclude that models with a strongly negative ERF have particularly strong contributions from anthropogenic aerosol effects on clouds.
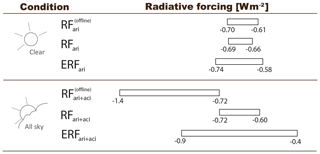
Figure 10Summary of model spread in anthropogenic aerosol forcing for the mid-2000s. Shown are the instantaneous (RF) and effective radiative forcing (ERF) of aerosol–radiation and aerosol–cloud interactions for the short-wave spectrum at the top of the atmosphere for clear- and all-sky conditions from Table 2. The RF from the offline radiation-transfer calculations considers additional uncertainty sources and is shown as separate bars. Refer to Sect. 2.1 for details.
Our results highlight that the participating models consistently show little change in the global ERF of anthropogenic aerosol between the mid-1970s and mid-2000s, despite the substantially different location of anthropogenic pollution maxima and the model diversity in their ERF magnitude relative to the pre-industrial. Model-internal variability, however, produces ERF changes of different signs and magnitude between the two periods. This result gives further evidence that model-internal variability has not been sufficiently considered in past model studies estimating the ERF difference associated with the mid-1970s to mid-2000s change in anthropogenic aerosol, as previously suggested based on ECHAM alone (Fiedler et al., 2017). The small change in global ERF stems from similar global forcing efficiencies of anthropogenic aerosol in the two periods. These are primarily explained by globally compensating differences in regional cloudy-sky contributions to the ERF efficiency. Assuming stronger aerosol–cloud interactions can cause a larger change in ERF from the mid-1970s to mid-2000s, based on simulations with ECHAM (Fiedler et al., 2017). The forcing from aerosol–cloud interaction is a subject of ongoing discussion and research (Bellouin et al., 2019). Given our multi-model spread in absolute ERF relative to the pre-industrial period, inter-comparing the relative ERF changes between observable periods might provide a better test for a model to represent transient climate changes. Our future work will focus on inter-comparing modelled ERF changes associated with other aerosol patterns. One such endeavour is the usage of MACv2-SP in model simulations in the framework of CMIP6 (e.g. Pincus et al., 2016; Fiedler et al., 2019).
The model data of this study will be available on the AeroCom community's data server. Additionally, the model data are archived by the Max Planck Institute for Meteorology and can be made accessible by contacting publications@mpimet.mpg.de.
ECHAM6.3 is the latest version of the atmosphere component of the Earth system model MPI-ESM1.2 of MPI-M, which participates in CMIP6 (Mauritsen et al., 2019). ECHAM6.3 is a global hydrostatic model and includes parameterizations of sub-grid-scale physical processes. The atmospheric radiative transfer is parameterized with the PSrad scheme using the rapid radiative transfer model for general circulation models (RRTMG; Pincus and Stevens, 2013). Surface properties, trace gas concentrations, and natural aerosols are prescribed by climatological datasets. A major change in MPI-ESM1.2 (Mauritsen et al., 2019) compared to previous model versions is the implementation of MACv2-SP (Stevens et al., 2017; Fiedler et al., 2017).
The global aerosol-climate model ECHAM6.3-HAM2.3 is an updated version of the model described by Tegen et al. (2019) and Neubauer et al. (2019). Revisions made in ECHAM6.3-HAM2.3 relate to the atmospheric model and the description of sea-salt emissions, which have been made dependent on the sea-surface temperature. The model uses ECHAM6.3 but is coupled to the aerosol module HAM (Stier et al., 2005; Zhang et al., 2012). An important difference in the atmospheric components is that ECHAM6.3 uses a single-moment cloud microphysics parameterization, while ECHAM6.3-HAM2.3 has a two-moment stratiform cloud scheme (Lohmann and Hoose, 2009) for representing the activation of aerosols as cloud condensation nuclei and ice nuclei in mixed phase clouds. Emission schemes for sea salt (Long et al., 2011; Sofiev et al., 2011), desert dust (Tegen et al., 2002; Cheng et al., 2008) and oceanic dimethyl sulfide (DMS; Nightingale et al., 2000) are run online. Emissions of all other aerosol species are prescribed from external input files (Stier et al., 2005; Lamarque et al., 2010). In the configuration used in this study, we prescribe the pre-industrial background of aerosol components from HAM that are not simulated online. These, in combination with the online-computed natural aerosol emissions, are the only aerosols seen by the two-moment cloud microphysics parameterization in this study.
EC-Earth (Hazeleger et al., 2010; Döscher et al., 2019) uses the Integrated Forecasting System (IFS) of the European Centre for Medium-Range Weather Forecasts (ECMWF) as its atmosphere component. The latest generation of the model, EC-Earth3, is based on the ECMWF seasonal prediction system 4 with the IFS cycle 36r4. The radiation scheme is based on the rapid radiative transfer model (Mlawer and Clough, 1998; Iacono et al., 2008) with 14 bands in the short-wave spectrum and 16 bands in the long-wave spectrum and uses the Monte Carlo independent column approximation (McICA) approach (Pincus and Morcrette, 2003). Many new features have been added to IFS by the EC-Earth consortium. The pre-industrial tropospheric aerosol climatology that is used in combination with MACv2-SP has been constructed from a simulation with the TM5 aerosol-chemistry model (Huijnen et al., 2010; van Noije et al., 2014), driven by meteorological data from ERA-Interim for the early 1980s. This simulation used CMIP6 emissions of aerosol and precursor gases for 1850 and provides the monthly mean aerosol mass and number concentrations as well as the aerosol optical properties. Stratospheric aerosols are prescribed using the CMIP6 dataset of radiative properties. Aerosol–cloud interactions are implemented only for liquid-phase, stratiform clouds. The cloud droplet number concentration, N, is diagnosed using the activation scheme of Abdul-Razzak and Ghan (2000) and is modified here by ηN from MACv2-SP. Cloud microphysics depends on N through autoconversion of cloud droplets to rain. The model used in this study is EC-Earth version 3.2.3. It is close to the CMIP6 version described by Döscher et al. (2019) but does not include the latest revisions that were introduced after the simulations for this study were started. Most relevant to this study is that in the CMIP6 version, the pre-industrial aerosol climatology has been updated by changing the parameterization of the production of sea spray in the underlying TM5 model. Specifically, the whitecap coverage has been made dependent on sea-surface temperature, while its power-law dependence on the 10 m wind speed has been changed from the W10 expression proposed by Salisbury et al. (2013) to the expression proposed by Monahan and Muircheartaigh (1980). The main effect of this revision is an increase in aerosol and cloud droplet number concentrations over the Southern Ocean.
Simulations with the Hadley Centre Global Environment Model (HadGEM) use a modified version of the HadGEM3 Global Atmosphere 7.0 climate model configuration (Walters et al., 2017). HadGEM3 normally uses the Global Model of Aerosol Processes (GLOMAP; Mann et al., 2010) to simulate aerosol mass and number and interactions of aerosols with radiation, clouds and atmospheric chemistry. That scheme is replaced here with prescriptions of the three-dimensional distributions of aerosol extinction and absorption coefficients averaged over HadGEM's six short-wave and nine long-wave wavebands, waveband-averaged aerosol asymmetry, and N. Those prescriptions are made of three components. First, pre-industrial aerosol and N distributions are taken from a HadGEM3–GLOMAP simulation using CMIP6 emission datasets for the year 1850. Second, stratospheric aerosols are taken from the CMIP6 climatologies for the year 1850. Prescribed N values are used in the calculation of cloud albedo (Jones et al., 2001) and autoconversion rates (Khairoutdinov and Kogan, 2000), although the latter do not see the MACv2-SP N scalings, ensuring that anthropogenic aerosols do not exert a secondary indirect effect in the present study. HadGEM3 uses the prognostic cloud fraction and prognostic condensate scheme (PC2; Wilson et al., 2008) that simulates the mass-mixing ratios of water vapour, cloud liquid and ice, as well as the fractional cover of liquid, ice and mixed-phase clouds.
The Norwegian Earth System Model (NorESM; Bentsen et al., 2013; Iversen et al., 2013; Kirkevåg et al., 2013 uses the atmospheric component of the Oslo version of the Community Atmosphere Model (CAM4-Oslo), which differs from the original CAM4 (Neale et al., 2013) through the modified treatment of aerosols and their interaction with clouds (Kirkevåg et al., 2013). The model has a finite-volume dynamical core and the original version 4 of the Community Land Model (CLM4) of CCSM4 (Lawrence et al., 2011). NorESM uses the CAM-RT radiation scheme by Collins et al. (2006). Like ECHAM-HAM and ECHAM, NorESM sets all background aerosol emissions to pre-industrial levels representative of 1850. These background conditions include sulfate from tropospheric volcanoes and from DMS as well as organic matter from land and ocean biogenic processes, mineral dust and sea salt. Sea-salt emissions are parameterized as a function of wind speed and temperature (Struthers et al., 2011), while other pre-industrial aerosol emissions are prescribed following Kirkevåg et al. (2013). These are, in the case of NorESM, sulfate, organic matter and BC aerosols originating from fossil fuel emissions and biomass burning (Lamarque et al., 2010).
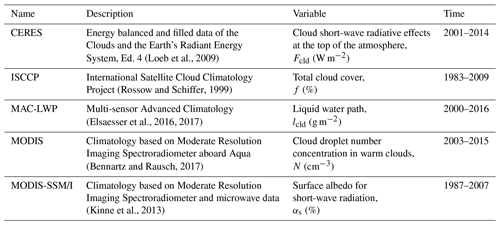
The model diversity in RF and ERF is larger when cloudy skies are considered. We therefore assess the model diversity in cloud properties and compare the model climatologies calculated from the simulations for the mid-2000s against observational climatologies from satellite products, listed in Table B1. The observational products provide an orientation for realistic values, although satellite retrievals also have caveats (e.g. Grosvenor et al., 2018). Moreover, we document the surface albedos used here for illustrating both the regional differences and the model diversity.
(Loeb et al., 2009)(Rossow and Schiffer, 1999)(Elsaesser et al., 2016, 2017)(Bennartz and Rausch, 2017)(Kinne et al., 2013)B1 Macroscopic cloud properties
We first assess the cloud short-wave radiative effect at the top of the atmosphere (Fcld), thus the cloud effect on the planetary albedo. The multi-annual global-mean Fcld for 2001–2010 from the Clouds and the Earth's Radiant Energy System (CERES) Ed. 4 is −45.8 W m−2, i.e. less negative than in most models (Table B2). This behaviour indicates a tendency of the models to have clouds that are too reflective, consistent with other model evaluations (Nam et al., 2012; Crueger et al., 2018, Lohmann and Neubauer, 2019). The spatial patterns of modelled Fcld are generally similar, but regionally the differences can be more distinct (Fig. B1).
Table B2Global-mean statistics for clouds, aerosols and surface albedo. The numbers given for lcld and N are averages over ocean regions, consistent with the satellite data availability (Figs. B1 and B2). Details on the satellite products are listed in Table B1.

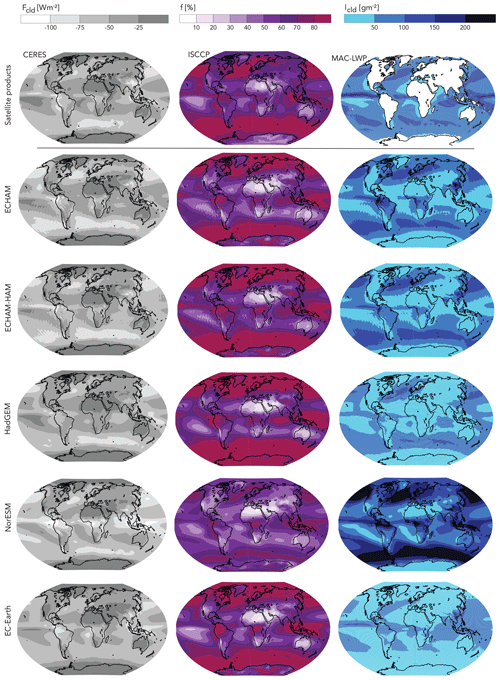
Figure B1Multi-member ensemble means of cloud characteristics for the mid-2000s compared to climatologies derived from satellite observations (Table B1). Shown are the mean SW cloud radiative effect at the TOA, Fcld (left column); total cloud cover, f (middle column); and liquid water path, lcld (right column) from the satellite products (top row) and the models (rows beneath). Areas without available data are shaded white.
To better characterize the model diversity in clouds, we compare the simulated total cloud cover (f) and liquid water path (lcld) to satellite climatologies from the ISCCP and MAC-LWP, respectively (Table B1). Most models underestimate both f and lcld over the oceans compared to the satellite retrievals, but having too few clouds does not necessarily imply too small an amount of liquid or vice versa (Table B2). The spatial patterns (Fig. B1) show a tendency of the models for underestimating f in the stratocumulus decks in the southeastern regions of the Pacific and Atlantic Ocean, where aerosol–cloud interactions are thought to be important. The models, however, disagree on the values for f and lcld in those regions. Moreover, the models show a large diversity in lcld in the extratropical storm tracks. NorESM shows the largest maximum lcld exceeding 200 g m−2. Our findings for lcld are consistent with a similar regional comparison between HadGEM and CAM (Malavelle et al., 2017), the latter of which having a similar atmospheric component to NorESM (see Appendix A).
B2 Cloud microphysical properties
The reported differences in macroscopic cloud properties among the models raise the question of how different the cloud droplet number concentrations (N) are. We find that the models show large diversity in the pattern of N for present-day conditions, as shown in Fig. B2. Note that we show the mean in-cloud droplet number concentration, which means that regions without clouds are not included when averaging N. It is noteworthy that in the models, N is calculated for stratiform cloud types but can additionally include detrained droplets from anvils of deep convection. The spatial pattern of N in ECHAM is not shown due to the simplistic treatment in the model. ECHAM employs statically prescribed values for N, which are constant with height below 800 hPa and exponentially decrease aloft. The near-surface values in ECHAM are N=80 cm−3 over ocean and N=180 cm−3 elsewhere (not shown) and are multiplied with ηN from MACv2-SP like in the other models.
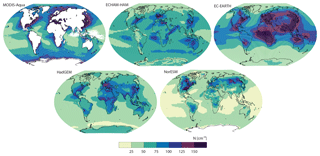
Figure B2In-cloud droplet number concentration for the mid-2000s. Shown are the annually and vertically averaged in-cloud droplet number concentrations (N) from the aerosol-climate models and from the MODIS satellite product by Bennartz and Rausch (2017). Areas without available data are shaded white.
Compared to the satellite product, the models typically underestimate N, for example, in the stratocumulus decks, where f is also underestimated. How much the quantitative differences between the models and the satellite product are due to differences in the methods for diagnosing N in the satellite retrievals and the models remains an open question, but it is unlikely that the methods solely explain the diversity in the patterns of N. It is interesting that, despite these quantitative differences in N, the spatial pattern of Fcld compares reasonably well to observations (Fig. B1), which might be a consequence of compensating differences from tuning the radiation balance at the top of the atmosphere. For instance, the behaviour of NorESM points to too much short-wave reflectivity by clouds that are too thick that overcompensate the missing reflection due to underestimated cloud cover.
B3 Surface albedo
An additional influence on the radiative forcing of anthropogenic aerosol is the surface reflectivity for short-wave radiation. We therefore document the surface albedo for short-wave radiation from the participating models and the satellite product used in the offline radiative-transfer calculations of this study. In the global mean, the models and the satellite product are very similar, with a surface albedo of 14 %–16 %. However, the spatial distributions in Fig. B3 indicate differences. The typical difference between less reflective ocean surfaces compared to land regions is apparent. Moreover, the analysis reveals diversity in the regional surface albedos of the participating models, typically related to areas affected by snow cover. Since such diversity in the surface albedo was already previously reported for aerosol-climate models with implications for the aerosol radiative forcing (e.g. Stier et al., 2007), future efforts are still needed for constraining the surface albedo in climate models.
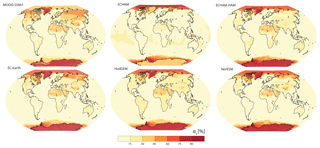
Figure B3Surface albedo for short-wave radiation for the mid-2000s. Shown are the mean surface albedo for short-wave radiation (αs) from the models and the satellite product from Kinne et al. (2013).
SF designed the study, performed the experiments with ECHAM, analysed the data of all models and led the writing of the paper. SK performed the offline radiation-transfer calculations and compiled the surface albedo product MODIS-SSM/I. PR performed the experiments with NorESM, KH performed experiments for ECHAM-HAM, NB performed experiments for HadGEM, and TvN and DO'D performed experiments for EC-Earth. All authors contributed to the discussion of the results and the writing of the paper.
The authors confirm that they have no competing interests.
We thank the editor Hinrich Grothe for handling our paper and the three anonymous reviewers for their comments that helped in improving the discussion article. This work is largely funded by the FP7 project BACCHUS (no. 603445). Stephanie Fiedler further thanks the Max Planck Society for funding. Philip Stier was additionally supported by the European Research Council (ERC) project “constRaining the EffeCts of Aerosols on Precipitation” (RECAP) under the European Union's Horizon 2020 research and innovation programme with grant agreement no. 724602 as well as by the Alexander von Humboldt Foundation. Joonas Merikanto acknowledges the Academy of Finland for funding (no. 287440). We acknowledge the usage of the DKRZ supercomputer for running the simulations with ECHAM6.3. ECHAM6.3-HAM2.3 simulations were performed through a grant from the Swiss National Supercomputing Centre (CSCS) under project ID 652. We also acknowledge the usage of satellite data from the following providers. CERES data were obtained from the NASA Langley Research Center ordering tool (http://ceres.larc.nasa.gov/, last access: 5 May 2019), ISCCP data were obtained from the International Satellite Cloud Climatology Project website (https://isccp.giss.nasa.gov, last access: 5 May 2019) maintained by the ISCCP research group at the NASA Goddard Institute for Space Studies, MAC-LWP data (Elsaesser et al., 2016) were acquired as part of the activities of NASA's Science Mission Directorate and were archived and distributed by the Goddard Earth Sciences (GES) Data and Information Services Center (DISC, https://disc.gsfc.nasa.gov, last access: 5 May 2019), and the cloud droplet number concentration climatology was provided by the Vanderbilt University Institutional Repository (https://ir.vanderbilt.edu/handle/1803/8374, last access: 5 May 2019). We thank Akos Horvath for providing information on MAC-LWP.
This research has been supported by the Seventh Framework
Programme (BACCHUS grant no. 603445).
The
article processing charges for this open-access
publication
were covered by the Max Planck Society.
This paper was edited by Hinrich Grothe and reviewed by three anonymous referees.
Abdul-Razzak, H. and Ghan, S. J.: A parameterization of aerosol activation: 2. Multiple aerosol types, J. Geophys. Res., 105, 6837–6844, https://doi.org/10.1029/1999JD901161, 2000. a
Bellouin, N., Quaas, J., Gryspeerdt, E., Kinne, S., Stier, P., Watson-Parris, D., Boucher, O., Carslaw, K., Christensen, M., Daniau, A.-L., Dufrsene, J.-L., Feingold, G., Fiedler, S., Forster, P., Gettleman, A., Haywood, J., Malavelle, F., Lohmann, U., Mauritsen, T., McCoy, D., Myhre, G., Mülmenstädt, J., Neubauer, D., Possner, A., Rugenstein, M., Sato, Y., Schulz, M., Schwarz, S. E., Sourdeval, O., Storelvmo, T., Toll, V., Winker, D., and Stevens, B.: Bounding aerosol radiative forcing of climate change, Rev. Geophys., submitted, 2019. a, b
Bennartz, R. and Rausch, J.: Global and regional estimates of warm cloud droplet number concentration based on 13 years of AQUA-MODIS observations, Atmos. Chem. Phys., 17, 9815–9836, https://doi.org/10.5194/acp-17-9815-2017, 2017. a, b
Bentsen, M., Bethke, I., Debernard, J. B., Iversen, T., Kirkevåg, A., Seland, Ø., Drange, H., Roelandt, C., Seierstad, I. A., Hoose, C., and Kristjánsson, J. E.: The Norwegian Earth System Model, NorESM1-M – Part 1: Description and basic evaluation of the physical climate, Geosci. Model Dev., 6, 687–720, https://doi.org/10.5194/gmd-6-687-2013, 2013. a, b
Carslaw, K., Lee, L., Reddington, C., Pringle, K., Rap, A., Forster, P., Mann, G., Spracklen, D., Woodhouse, M., Regayre, L., and Pierce, J. R.: Large contribution of natural aerosols to uncertainty in indirect forcing, Nature, 503, 67–71, 2013. a, b
Cheng, T., Peng, Y., Feichter, J., and Tegen, I.: An improvement on the dust emission scheme in the global aerosol-climate model ECHAM5-HAM, Atmos. Chem. Phys., 8, 1105–1117, https://doi.org/10.5194/acp-8-1105-2008, 2008. a
Collins, W. D., Rasch, P. J., Boville, B. A., Hack, J. J., McCaa, J. R., Williamson, D. L., Briegleb, B. P., Bitz, C. M., Lin, S.-J., and Zhang, M.: The Formulation and Atmospheric Simulation of the Community Atmosphere Model Version 3 (CAM3), J. Climate, 19, 2144–2161, https://doi.org/10.1175/JCLI3760.1, 2006. a
Crueger, T., Giorgetta, M. A., Brokopf, R., Esch, M., Fiedler, S., Hohenegger, C., Kornblueh, L., Mauritsen, T., Nam, C., Naumann, A. K., Peters, K., Rast, S., Roeckner, E., Sakradzija, M., Schmidt, H., Vial, J., Vogel, R., and Stevens, B.: ICON-A, the atmosphere component of the ICON Earth System Model, Part II: Model evaluation, J. Adv. Model. Earth Sy., 10, 1638–1662, https://doi.org/10.1029/2017MS001233, 2018. a, b
Dentener, F., Kinne, S., Bond, T., Boucher, O., Cofala, J., Generoso, S., Ginoux, P., Gong, S., Hoelzemann, J. J., Ito, A., Marelli, L., Penner, J. E., Putaud, J.-P., Textor, C., Schulz, M., van der Werf, G. R., and Wilson, J.: Emissions of primary aerosol and precursor gases in the years 2000 and 1750 prescribed data-sets for AeroCom, Atmos. Chem. Phys., 6, 4321–4344, https://doi.org/10.5194/acp-6-4321-2006, 2006. a
Döscher, R., et al.: The community Earth system model EC-Earth for collaborative climate research, in preparation, 2019. a, b, c, d
Elsaesser, G. S., O'Dell, C. W., Lebsock, M. D., and Teixeira, J.: Multisensor Advanced Climatology Mean Liquid Water Path L3 Monthly 1∘ × 1∘ V1, Greenbelt, MD, USA, Goddard Earth Sciences Data and Information Services Center (GES DISC), https://doi.org/10.5067/MEASURES/MACLWPM (last access: March 2018), 2016. a, b
Elsaesser, G. S., O'Dell, C. W., Lebsock, M. D., Bennartz, R., Greenwald, T. J., and Wentz, F. J.: The Multisensor Advanced Climatology of Liquid Water Path (MAC-LWP), J. Climate, 30, 10193–10210, https://doi.org/10.1175/JCLI-D-16-0902.1, 2017. a
Evan, A. T., Flamant, C., Fiedler, S., and Doherty, O.: An analysis of aeolian dust in climate models, Geophys. Res. Lett., 41, 5996–6001, https://doi.org/10.1002/2014GL060545, 2014. a
Eyring, V., Bony, S., Meehl, G. A., Senior, C. A., Stevens, B., Stouffer, R. J., and Taylor, K. E.: Overview of the Coupled Model Intercomparison Project Phase 6 (CMIP6) experimental design and organization, Geosci. Model Dev., 9, 1937–1958, https://doi.org/10.5194/gmd-9-1937-2016, 2016. a, b
Fiedler, S., Knippertz, P., Woodward, S., Martin, G. M., Bellouin, N., Ross, A. N., Heinold, B., Schepanski, K., Birch, C. E., and Tegen, I.: A process-based evaluation of dust-emitting winds in the CMIP5 simulation of HadGEM2-ES, Clim. Dynam., 46, 1107–1130, https://doi.org/10.1007/s00382-015-2635-9, 2016. a, b
Fiedler, S., Stevens, B., and Mauritsen, T.: On the sensitivity of anthropogenic aerosol forcing to model-internal variability and parameterizing a Twomey effect, J. Adv. Model. Earth Sy., 9, 1325–1341, https://doi.org/10.1002/2017MS000932, 2017. a, b, c, d, e, f, g, h, i, j, k, l, m, n, o, p
Fiedler, S., Stevens, B., Gidden, M., Smith, S. J., Riahi, K., and van Vuuren, D.: First forcing estimates from the future CMIP6 scenarios of anthropogenic aerosol optical properties and an associated Twomey effect, Geosci. Model Dev., 12, 989–1007, https://doi.org/10.5194/gmd-12-989-2019, 2019. a
Grosvenor, D. P., Sourdeval, O., Zuidema, P., Ackerman, A., Alexandrov, M. D., Bennartz, R., Boers, R., Cairns, B., Chiu, J. C., Christensen, M., Deneke, H., Diamond, M., Feingold, G., Fridlind, A., Hünerbein, A., Knist, C., Kollias, P., Marshak, A., McCoy, D., Merk, D., Painemal, D., Rausch, J., Rosenfeld, D., Russchenberg, H., Seifert, P., Sinclair, K., Stier, P., van Diedenhoven, B., Wendisch, M., Werner, F., Wood, R., Zhang, Z., and Quaas, J.: Remote Sensing of Droplet Number Concentration in Warm Clouds: A Review of the Current State of Knowledge and Perspectives, Rev. Geophys., 56, 409–453, https://doi.org/10.1029/2017RG000593, 2018. a
Halthore, R. N., Crisp, D., Schwartz, S. E., Anderson, G. P., Berk, A., Bonnel, B., Boucher, O., Chang, F.-L., Chou, M.-D., Clothiaux, E. E., Dubuisson, P., Fomin, B., Fouquart, Y., Freidenreich, S., Gautier, C., Kato, S., Laszlo, I., Li, Z., Mather, J. H., Plana-Fattori, A., Ramaswamy, V., Ricchiazzi, P., Shiren, Y., Trishchenko, A., and Wiscombe, W.: Intercomparison of shortwave radiative transfer codes and measurements, J. Geophys. Res.-Atmos., 110, D11206, https://doi.org/10.1029/2004JD005293, 2005.
Hazeleger, W., Severijns, C., Semmler, T., Stefanescu, S., Yang, S., Wang, X., Wyser, K., Dutra, E., Baldasano, J. M., Bintanja, R., Bougeault, P., Caballero, R., Ekman, A. M. L., Christensen, J. H., van den Hurk, B., Jimenez, P., Jones, C., Kalberg, P., Koenigk, T., McGrath, R., Miranda, P., van Noije, T., Palmer, T., Parodi, J. A., Schmith, T., Selten, F., Storelvmo, T., Sterl, A., Tapamo, H., Vancoppenolle, M., Viterbo, P., and Willen, U.: EC-Earth, B. Am. Meteorol. Soc., 91, 1357–1364, https://doi.org/10.1175/2010BAMS2877.1, 2010. a, b
Huijnen, V., Williams, J., van Weele, M., van Noije, T., Krol, M., Dentener, F., Segers, A., Houweling, S., Peters, W., de Laat, J., Boersma, F., Bergamaschi, P., van Velthoven, P., Le Sager, P., Eskes, H., Alkemade, F., Scheele, R., Nédélec, P., and Pätz, H.-W.: The global chemistry transport model TM5: description and evaluation of the tropospheric chemistry version 3.0, Geosci. Model Dev., 3, 445–473, https://doi.org/10.5194/gmd-3-445-2010, 2010. a
Huneeus, N., Basart, S., Fiedler, S., Morcrette, J.-J., Benedetti, A., Mulcahy, J., Terradellas, E., Pérez García-Pando, C., Pejanovic, G., Nickovic, S., Arsenovic, P., Schulz, M., Cuevas, E., Baldasano, J. M., Pey, J., Remy, S., and Cvetkovic, B.: Forecasting the northern African dust outbreak towards Europe in April 2011: a model intercomparison, Atmos. Chem. Phys., 16, 4967–4986, https://doi.org/10.5194/acp-16-4967-2016, 2016. a
Iacono, M. J., Delamere, J. S., Mlawer, E. J., Shephard, M. W., Clough, S. A., and Collins, W. D.: Radiative forcing by long-lived greenhouse gases: Calculations with the AER radiative transfer models, J. Geophys. Res.-Atmos., 113, D13103, https://doi.org/10.1029/2008JD009944, 2008. a
Iversen, T., Bentsen, M., Bethke, I., Debernard, J. B., Kirkevåg, A., Seland, Ø., Drange, H., Kristjansson, J. E., Medhaug, I., Sand, M., and Seierstad, I. A.: The Norwegian Earth System Model, NorESM1-M – Part 2: Climate response and scenario projections, Geosci. Model Dev., 6, 389–415, https://doi.org/10.5194/gmd-6-389-2013, 2013. a, b
Jones, A., Roberts, D. L., Woodage, M. L., and Johnson, C. E.: Indirect sulphate forcing in a climate model with an interactive sulphur cycle, J. Geophys. Res., 106, 20293–20310, 2001. a
Khairoutdinov, M. F. and Kogan, Y. L.: A new cloud physics parameterization in a large-eddy simulation model of marine stratocumulus, Mon. Weather. Rev., 128, 229–243, 2000. a
Kinne, S.: The MACv2 aerosol climatology, Tellus B, in review, 2019. a
Kinne, S., Schulz, M., Textor, C., Guibert, S., Balkanski, Y., Bauer, S. E., Berntsen, T., Berglen, T. F., Boucher, O., Chin, M., Collins, W., Dentener, F., Diehl, T., Easter, R., Feichter, J., Fillmore, D., Ghan, S., Ginoux, P., Gong, S., Grini, A., Hendricks, J., Herzog, M., Horowitz, L., Isaksen, I., Iversen, T., Kirkevåg, A., Kloster, S., Koch, D., Kristjansson, J. E., Krol, M., Lauer, A., Lamarque, J. F., Lesins, G., Liu, X., Lohmann, U., Montanaro, V., Myhre, G., Penner, J., Pitari, G., Reddy, S., Seland, O., Stier, P., Takemura, T., and Tie, X.: An AeroCom initial assessment – optical properties in aerosol component modules of global models, Atmos. Chem. Phys., 6, 1815–1834, https://doi.org/10.5194/acp-6-1815-2006, 2006. a
Kinne, S., O'Donnel, D., Stier, P., Kloster, S., Zhang, K., Schmidt, H., Rast, S., Giorgetta, M., Eck, T. F., and Stevens, B.: MAC-v1: A new global aerosol climatology for climate studies, J. Adv. Model. Earth Sy., 5, 704–740, https://doi.org/10.1002/jame.20035, 2013. a, b, c, d, e, f
Kirkevåg, A., Iversen, T., Seland, Ø., Hoose, C., Kristjánsson, J. E., Struthers, H., Ekman, A. M. L., Ghan, S., Griesfeller, J., Nilsson, E. D., and Schulz, M.: Aerosol–climate interactions in the Norwegian Earth System Model – NorESM1-M, Geosci. Model Dev., 6, 207–244, https://doi.org/10.5194/gmd-6-207-2013, 2013. a, b, c, d
Koffi, B., Schulz, M., Bréon, F.-M., Dentener, F., Steensen, B. M., Griesfeller, J., Winker, D., Balkanski, Y., Bauer, S. E., Bellouin, N., Berntsen, T., Bian, H., Chin, M., Diehl, T., Easter, R., Ghan, S., Hauglustaine, D. A., Iversen, T., Kirkevåg, A., Liu, X., Lohmann, U., Myhre, G., Rasch, P., Seland, O., Skeie, R. B., Steenrod, S. D., Stier, P., Tackett, J., Takemura, T., Tsigaridis, K., Vuolo, M. R., Yoon, J., and Zhang, K.: Evaluation of the aerosol vertical distribution in global aerosol models through comparison against CALIOP measurements: AeroCom phase II results, J. Geophys. Res.-Atmos., 121, 7254–7283, https://doi.org/10.1002/2015JD024639, 2016. a
Lacagnina, C., Hasekamp, O. P., Bian, H., Curci, G., Myhre, G., van Noije, T., Schulz, M., Skeie, R. B., Takemura, T., and Zhang, K.: Aerosol single-scattering albedo over the global oceans: Comparing PARASOL retrievals with AERONET, OMI, and AeroCom models estimates, J. Geophys. Res.-Atmos., 120, 9814–9836, https://doi.org/10.1002/2015JD023501, 2015. a
Lamarque, J.-F., Bond, T. C., Eyring, V., Granier, C., Heil, A., Klimont, Z., Lee, D., Liousse, C., Mieville, A., Owen, B., Schultz, M. G., Shindell, D., Smith, S. J., Stehfest, E., Van Aardenne, J., Cooper, O. R., Kainuma, M., Mahowald, N., McConnell, J. R., Naik, V., Riahi, K., and van Vuuren, D. P.: Historical (1850–2000) gridded anthropogenic and biomass burning emissions of reactive gases and aerosols: methodology and application, Atmos. Chem. Phys., 10, 7017–7039, https://doi.org/10.5194/acp-10-7017-2010, 2010. a, b, c
Lawrence, D. M., Oleson, K. W., Flanner, M. G., Thornton, P. E., Swenson, S. C., Lawrence, P. J., Zeng, X., Yang, Z.-L., Levis, S., Sakaguchi, K., Bonan, G. B., and Slater, A. G.: Parameterization improvements and functional and structural advances in Version 4 of the Community Land Model, J. Adv. Model. Earth Sy., 3, M03001, https://doi.org/10.1029/2011MS00045, 2011. a
Loeb, N. G., Wielicki, B. A., Doelling, D. R., Smith, G. L., Keyes, D. F., Kato, S., Manalo-Smith, N., and Wong, T.: Toward Optimal Closure of the Earth's Top-of-Atmosphere Radiation Budget, J. Climate, 22, 748–766, https://doi.org/10.1175/2008JCLI2637.1, 2009. a
Lohmann, U. and Ferrachat, S.: Impact of parametric uncertainties on the present-day climate and on the anthropogenic aerosol effect, Atmos. Chem. Phys., 10, 11373–11383, https://doi.org/10.5194/acp-10-11373-2010, 2010. a
Lohmann, U. and Hoose, C.: Sensitivity studies of different aerosol indirect effects in mixed-phase clouds, Atmos. Chem. Phys., 9, 8917–8934, https://doi.org/10.5194/acp-9-8917-2009, 2009. a
Long, M. S., Keene, W. C., Kieber, D. J., Erickson, D. J., and Maring, H.: A sea-state based source function for size- and composition-resolved marine aerosol production, Atmos. Chem. Phys., 11, 1203–1216, https://doi.org/10.5194/acp-11-1203-2011, 2011. a
Mahowald, N. M. and Luo, C.: A less dusty future?, Geophys. Res. Lett., 30, 1903, https://doi.org/10.1029/2003GL017880, 2003.
Malavelle, F. F., Haywood, J. M., Jones, A., Gettelman, A., Clarisse, L., Bauduin, S., Allan, R. P., Karset, I. H. H., Kristjánsson, J. E., Oreopoulos, L., Cho, N., Lee, D., Bellouin, N., Boucher, O., Grosvenor, D. P., Carslaw, K. S., Dhomse, S., Mann, G. W., Schmidt, A., Coe, H., Hartley, M. E., Dalvi, M., Hill, A. A., Johnson, B. T., Johnson, C. E., Knight, J. R., O'Connor, F. M., Partridge, D. G., Stier, P., Myhre, G., Platnick, S., Stephens, G. L., Takahashi, H., and Thordarson, T.: Strong constraints on aerosol–cloud interactions from volcanic eruptions, Nature, 546, 485–491, https://doi.org/10.1038/nature22974, 2017. a
Mann, G. W., Carslaw, K. S., Spracklen, D. V., Ridley, D. A., Manktelow, P. T., Chipperfield, M. P., Pickering, S. J., and Johnson, C. E.: Description and evaluation of GLOMAP-mode: a modal global aerosol microphysics model for the UKCA composition-climate model, Geosci. Model Dev., 3, 519–551, https://doi.org/10.5194/gmd-3-519-2010, 2010. a
Mauritsen, T., Bader, J., Becker, T., Behrens, J., Bittner, M., Brokopf, R., Brovkin, V., Claussen, M., Crueger, T., Esch, M., Fast, I., Fiedler, S., Fläschner, D., Gayler, V., Giorgetta, M., Goll, D. S., Haak, H., Hagemann, S., Hedemann, C., Hohenegger, C., Ilyina, T., Jahns, T., Jimenez de la Cuesta Otero, D., Jungclaus, J., Kleinen, T., Kloster, S., Kracher, D., Kinne, S., Kleberg, D., Lasslop, G., Kornblueh, L., Marotzke, J., Matei, D., Meraner, K., Mikolajewicz, U., Modali, K., Möbis, B., Müller, W. A., Nabel, J. E. M. S., Nam, C. C. W., Notz, D., Nyawira, S.-S., Paulsen, H., Peters, K., Pincus, R., Pohlmann, H., Pongratz, J., Popp, M., Raddatz, T., Rast, S., Redler, R., Reick, C. H., Rohrschneider, T., Schemann, V., Schmidt, H., Schnur, R., Schulzweida, U., Six, K. D., Stein, L., Stemmler, I., Stevens, B., von Storch, J.-S., Tian, F., Voigt, A., de Vrese, P., Wieners, K.-H., Wilkenskjeld, S., Winkler, A., and Roeckner, E.: Developments in the MPI-M Earth System Model version 1.2 (MPI-ESM 1.2) and its response to increasing CO2, J. Adv. Model. Earth Sy., 11, 998–1038, https://doi.org/10.1029/2018MS001400, 2019. a, b, c
Mlawer, E. and Clough, S.: Shortwave and longwave enhancements in the rapid radiative transfer model, in: Proceedings of the 7th Atmospheric Radiation Measurement (ARM) Science Team Meeting, 3–7 March 1997, San Antonio, Texas, USA, 409–413, 1998. a
Monahan, E. C. and Muircheartaigh, I.: Optimal power-law description of oceanic whitecap coverage dependence on wind spee, J. Phys. Oceanogr., 10, 2094–2099, https://doi.org/10.1175/1520-0485(1980)010<2094:OPLDOO>2.0.CO;2, 1980. a
Myhre, G., Samset, B. H., Schulz, M., Balkanski, Y., Bauer, S., Berntsen, T. K., Bian, H., Bellouin, N., Chin, M., Diehl, T., Easter, R. C., Feichter, J., Ghan, S. J., Hauglustaine, D., Iversen, T., Kinne, S., Kirkevåg, A., Lamarque, J.-F., Lin, G., Liu, X., Lund, M. T., Luo, G., Ma, X., van Noije, T., Penner, J. E., Rasch, P. J., Ruiz, A., Seland, Ø., Skeie, R. B., Stier, P., Takemura, T., Tsigaridis, K., Wang, P., Wang, Z., Xu, L., Yu, H., Yu, F., Yoon, J.-H., Zhang, K., Zhang, H., and Zhou, C.: Radiative forcing of the direct aerosol effect from AeroCom Phase II simulations, Atmos. Chem. Phys., 13, 1853–1877, https://doi.org/10.5194/acp-13-1853-2013, 2013. a, b
Nam, C., Bony, S., Dufresne, J.-L., and Chepfer, H.: The “too few, too bright” tropical low-cloud problem in CMIP5 models, Geophys. Res. Lett., 39, L21801, https://doi.org/10.1029/2012GL053421, 2012. a, b
Neale, R. B., Richter, J., Park, S., Lauritzen, P. H., Vavrus, S. J., Rasch, P. J., and Zhang, M.: The Mean Climate of the Community Atmosphere Model (CAM4) in Forced SST and Fully Coupled Experiments, J. Climate, 26, 5150–5168, https://doi.org/10.1175/JCLI-D-12-00236.1, 2013. a
Neubauer, D., Ferrachat, S., Siegenthaler-Le Drian, C., Stier, P., Partridge, D. G., Tegen, I., Bey, I., Stanelle, T., Kokkola, H., and Lohmann, U.: The global aerosol-climate model ECHAM6.3-HAM2.3 – Part 2: Cloud evaluation, aerosol radiative forcing and climate sensitivity, Geosci. Model Dev. Discuss., https://doi.org/10.5194/gmd-2018-307, in review, 2019. a, b
Nightingale, P. D., Malin, G., Law, C. S., Watson, A. J., Liss, P. S., Liddicoat, M. I., Boutin, J., and Upstill-Goddard, R. C.: In situ evaluation of air-sea gas exchange parameterizations using novel conservative and volatile tracers, Global Biogeochem. Cy., 14, 373–387, https://doi.org/10.1029/1999GB900091, 2000. a
Pincus, R and, B. H. W., and Morcrette, J.-J.: A fast, flexible, approximate technique for computing radiative transfer in inhomogeneous cloud fields, J. Geophys. Res., 108, 4376, https://doi.org/10.1029/2002JD003322, 2003. a
Pincus, R. and Stevens, B.: Paths to accuracy for radiation parameterizations in atmospheric models, J. Adv. Model. Earth Sy., 5, 225–233, https://doi.org/10.1002/jame.20027, 2013. a
Pincus, R., Forster, P. M., and Stevens, B.: The Radiative Forcing Model Intercomparison Project (RFMIP): experimental protocol for CMIP6, Geosci. Model Dev., 9, 3447–3460, https://doi.org/10.5194/gmd-9-3447-2016, 2016. a, b, c, d
Quaas, J., Ming, Y., Menon, S., Takemura, T., Wang, M., Penner, J. E., Gettelman, A., Lohmann, U., Bellouin, N., Boucher, O., Sayer, A. M., Thomas, G. E., McComiskey, A., Feingold, G., Hoose, C., Kristjánsson, J. E., Liu, X., Balkanski, Y., Donner, L. J., Ginoux, P. A., Stier, P., Grandey, B., Feichter, J., Sednev, I., Bauer, S. E., Koch, D., Grainger, R. G., Kirkevåg, A., Iversen, T., Seland, Ø., Easter, R., Ghan, S. J., Rasch, P. J., Morrison, H., Lamarque, J.-F., Iacono, M. J., Kinne, S., and Schulz, M.: Aerosol indirect effects – general circulation model intercomparison and evaluation with satellite data, Atmos. Chem. Phys., 9, 8697–8717, https://doi.org/10.5194/acp-9-8697-2009, 2009. a
Räisänen, P., Haapanala, P., Chung, C. E., Kahnert, M., Makkonen, R., Tonttila, J., and Nousiainen, T.: Impact of dust particle non-sphericity on climate simulations, Q. J. Roy. Meteor. Soc., 139, 2222–2232, https://doi.org/10.1002/qj.2084, 2013. a
Randles, C. A., Kinne, S., Myhre, G., Schulz, M., Stier, P., Fischer, J., Doppler, L., Highwood, E., Ryder, C., Harris, B., Huttunen, J., Ma, Y., Pinker, R. T., Mayer, B., Neubauer, D., Hitzenberger, R., Oreopoulos, L., Lee, D., Pitari, G., Di Genova, G., Quaas, J., Rose, F. G., Kato, S., Rumbold, S. T., Vardavas, I., Hatzianastassiou, N., Matsoukas, C., Yu, H., Zhang, F., Zhang, H., and Lu, P.: Intercomparison of shortwave radiative transfer schemes in global aerosol modeling: results from the AeroCom Radiative Transfer Experiment, Atmos. Chem. Phys., 13, 2347–2379, https://doi.org/10.5194/acp-13-2347-2013, 2013. a
Regayre, L. A., Johnson, J. S., Yoshioka, M., Pringle, K. J., Sexton, D. M. H., Booth, B. B. B., Lee, L. A., Bellouin, N., and Carslaw, K. S.: Aerosol and physical atmosphere model parameters are both important sources of uncertainty in aerosol ERF, Atmos. Chem. Phys., 18, 9975–10006, https://doi.org/10.5194/acp-18-9975-2018, 2018. a
Rossow, W. B. and Schiffer, R. A.: Advances in understanding clouds from ISCCP, B. Am. Meteorol. Soc., 80, 2261–2288, https://doi.org/10.1175/1520-0477(1999)080<2261:AIUCFI>2.0.CO;2, 1999. a
Salisbury, D. J., Anguelova, M. D., and Brooks, I. M.: On the variability of whitecap fraction using satellite-based observations, J. Geophys. Res.-Oceans, 118, 6201–6222, https://doi.org/10.1002/2013JC008797, 2013. a
Shindell, D. T., Lamarque, J.-F., Schulz, M., Flanner, M., Jiao, C., Chin, M., Young, P. J., Lee, Y. H., Rotstayn, L., Mahowald, N., Milly, G., Faluvegi, G., Balkanski, Y., Collins, W. J., Conley, A. J., Dalsoren, S., Easter, R., Ghan, S., Horowitz, L., Liu, X., Myhre, G., Nagashima, T., Naik, V., Rumbold, S. T., Skeie, R., Sudo, K., Szopa, S., Takemura, T., Voulgarakis, A., Yoon, J.-H., and Lo, F.: Radiative forcing in the ACCMIP historical and future climate simulations, Atmos. Chem. Phys., 13, 2939–2974, https://doi.org/10.5194/acp-13-2939-2013, 2013. a, b
Smirnov, A., Holben, B. N., Slutsker, I., Giles, D. M., McClain, C. R., Eck, T. F., Sakerin, S. M., Macke, A., Croot, P., Zibordi, G., Quinn, P. K., Sciare, J., Kinne, S., Harvey, M., Smyth, T. J., Piketh, S., Zielinski, T., Proshutinsky, A., Goes, J. I., Nelson, N. B., Larouche, P., Radionov, V. F., Goloub, P., Krishna Moorthy, K., Matarrese, R., Robertson, E. J., and Jourdin, F.: Maritime Aerosol Network as a component of Aerosol Robotic Network, J. Geophys.Res.-Atmos., 114, D06204, https://doi.org/10.1029/2008JD011257, 2009. a
Sofiev, M., Soares, J., Prank, M., de Leeuw, G., and Kukkonen, J.: A regional-to-global model of emission and transport of sea salt particles in the atmosphere, J. Geophys. Res.-Atmos., 116, D21302, https://doi.org/10.1029/2010JD014713, 2011. a
Stevens, B., Giorgetta, M., Esch, M., Mauritsen, T., Crueger, T., Rast, S., Salzmann, M., Schmidt, H., Bader, J., Block, K., Brokopf, R., Fast, I., Kinne, S., Kornblueh, L., Lohmann, U., Pincus, R., Reichler, T., and Roeckner, E.: Atmospheric component of the MPI-M Earth System Model: ECHAM6, J. Adv. Model. Earth Sy., 5, 146–172, https://doi.org/10.1002/jame.20015, 2013.
Stevens, B., Fiedler, S., Kinne, S., Peters, K., Rast, S., Müsse, J., Smith, S. J., and Mauritsen, T.: MACv2-SP: a parameterization of anthropogenic aerosol optical properties and an associated Twomey effect for use in CMIP6, Geosci. Model Dev., 10, 433–452, https://doi.org/10.5194/gmd-10-433-2017, 2017. a, b, c, d, e
Stier, P., Feichter, J., Kinne, S., Kloster, S., Vignati, E., Wilson, J., Ganzeveld, L., Tegen, I., Werner, M., Balkanski, Y., Schulz, M., Boucher, O., Minikin, A., and Petzold, A.: The aerosol-climate model ECHAM5-HAM, Atmos. Chem. Phys., 5, 1125–1156, https://doi.org/10.5194/acp-5-1125-2005, 2005. a, b
Stier, P., Feichter, J., Roeckner, E., Kloster, S., and Esch, M.: The evolution of the global aerosol system in a transient climate simulation from 1860 to 2100, Atmos. Chem. Phys., 6, 3059–3076, https://doi.org/10.5194/acp-6-3059-2006, 2006. a
Stier, P., Seinfeld, J. H., Kinne, S., and Boucher, O.: Aerosol absorption and radiative forcing, Atmos. Chem. Phys., 7, 5237–5261, https://doi.org/10.5194/acp-7-5237-2007, 2007. a, b
Stier, P., Schutgens, N. A. J., Bellouin, N., Bian, H., Boucher, O., Chin, M., Ghan, S., Huneeus, N., Kinne, S., Lin, G., Ma, X., Myhre, G., Penner, J. E., Randles, C. A., Samset, B., Schulz, M., Takemura, T., Yu, F., Yu, H., and Zhou, C.: Host model uncertainties in aerosol radiative forcing estimates: results from the AeroCom Prescribed intercomparison study, Atmos. Chem. Phys., 13, 3245–3270, https://doi.org/10.5194/acp-13-3245-2013, 2013. a
Struthers, H., Ekman, A. M. L., Glantz, P., Iversen, T., Kirkevåg, A., Mårtensson, E. M., Seland, Ø., and Nilsson, E. D.: The effect of sea ice loss on sea salt aerosol concentrations and the radiative balance in the Arctic, Atmos. Chem. Phys., 11, 3459–3477, https://doi.org/10.5194/acp-11-3459-2011, 2011. a
Tegen, I., Harrison, S., Kohfeld, K., Prentice, I., Coe, M., and Heimann, M.: Impact of vegetation and preferential source areas on global dust aerosols: Results from a model study, J. Geophys. Res., 107, 4576, https://doi.org/10.1029/2001JD000963, 2002. a
Tegen, I., Neubauer, D., Ferrachat, S., Siegenthaler-Le Drian, C., Bey, I., Schutgens, N., Stier, P., Watson-Parris, D., Stanelle, T., Schmidt, H., Rast, S., Kokkola, H., Schultz, M., Schroeder, S., Daskalakis, N., Barthel, S., Heinold, B., and Lohmann, U.: The global aerosol–climate model ECHAM6.3–HAM2.3 – Part 1: Aerosol evaluation, Geosci. Model Dev., 12, 1643–1677, https://doi.org/10.5194/gmd-12-1643-2019, 2019. a, b
van Noije, T. P. C., Le Sager, P., Segers, A. J., van Velthoven, P. F. J., Krol, M. C., Hazeleger, W., Williams, A. G., and Chambers, S. D.: Simulation of tropospheric chemistry and aerosols with the climate model EC-Earth, Geosci. Model Dev., 7, 2435–2475, https://doi.org/10.5194/gmd-7-2435-2014, 2014. a
Walters, D., Boutle, I., Brooks, M., Melvin, T., Stratton, R., Vosper, S., Wells, H., Williams, K., Wood, N., Allen, T., Bushell, A., Copsey, D., Earnshaw, P., Edwards, J., Gross, M., Hardiman, S., Harris, C., Heming, J., Klingaman, N., Levine, R., Manners, J., Martin, G., Milton, S., Mittermaier, M., Morcrette, C., Riddick, T., Roberts, M., Sanchez, C., Selwood, P., Stirling, A., Smith, C., Suri, D., Tennant, W., Vidale, P. L., Wilkinson, J., Willett, M., Woolnough, S., and Xavier, P.: The Met Office Unified Model Global Atmosphere 6.0/6.1 and JULES Global Land 6.0/6.1 configurations, Geosci. Model Dev., 10, 1487–1520, https://doi.org/10.5194/gmd-10-1487-2017, 2017. a, b
Wilson, D. R., Bushell, A. C., Kerr-Munslow, A. M., Price, J. D., and Morcrette, C. J.: PC2: A prognostic cloud fraction and condensation scheme. I: Scheme description, Q. J. Roy. Meteor. Soc., 134, 2093–2107, https://doi.org/10.1002/qj.333, 2008. a
Zhang, K., O'Donnell, D., Kazil, J., Stier, P., Kinne, S., Lohmann, U., Ferrachat, S., Croft, B., Quaas, J., Wan, H., Rast, S., and Feichter, J.: The global aerosol-climate model ECHAM-HAM, version 2: sensitivity to improvements in process representations, Atmos. Chem. Phys., 12, 8911–8949, https://doi.org/10.5194/acp-12-8911-2012, 2012. a
Zhang, K., Wan, H., Liu, X., Ghan, S. J., Kooperman, G. J., Ma, P.-L., Rasch, P. J., Neubauer, D., and Lohmann, U.: Technical Note: On the use of nudging for aerosol–climate model intercomparison studies, Atmos. Chem. Phys., 14, 8631–8645, https://doi.org/10.5194/acp-14-8631-2014, 2014. a


