the Creative Commons Attribution 4.0 License.
the Creative Commons Attribution 4.0 License.
Characterization of VOCs and their related atmospheric processes in a central Chinese city during severe ozone pollution periods
Bowei Li
Sunling Gong
Jingwei Ni
Huairui Li
Liyan Han
Yi Yang
Yijin Qi
Dongxu Zhao
A 5-month campaign (from May to September 2017) was conducted to characterize volatile organic compounds (VOCs) for the first time at four sites in Zhengzhou, Henan Province, China, where ground level ozone (O3) concentration has shown an increasing trend in recent years. Canister samples were collected for the measurement of 57 VOCs, which, along with reactive nitrogen oxides (NOx), are the most important O3 precursors. During the same period, O3 and its precursor gases were monitored online simultaneously. The results indicated that the average mixing ratio of total quantified VOCs ( ppbv) in Zhengzhou was lower than that in the other Chinese megacities, while alkyne comprised a higher proportion of ΣVOCs. The abundances, compositions and ratios of typical VOCs showed clear spatial and temporal variations. Cluster analysis indicates that air masses from the south of Zhengzhou were cleaner than from other directions. The molar ratio of VOCs to NOx indicated that, in general, O3 formation was more sensitive to VOCs than NOx formation in Zhengzhou. The source apportionment was conducted with positive matrix factorization (PMF), and it was found that vehicle exhaust, coal and biomass burning and solvent usage were the major sources for ambient VOCs at all four sites. From potential source contribution function (PSCF) analysis, the strong emissions from coal + biomass burning and solvent usage were concentrated in the southwest of Shanxi and Henan provinces. This study gathers scientific evidence on the pollution sources for Zhengzhou, benefiting the government to establish efficient environmental control measures, particularly for O3 pollution.
- Article
(7490 KB) - Full-text XML
-
Supplement
(1439 KB) - BibTeX
- EndNote
Volatile organic compounds (VOCs) are diverse and reactive chemicals. Vehicle exhausts, fuel combustion and evaporation, and solvent usage are the known major anthropogenic sources of VOCs (Fujita, 2001; Fujita et al., 1994; US EPA, 2000; Borbon et al., 2002). VOCs play a crucial role in the ground-level ozone (O3) pollution (Haagen-Smit, 1952; Choek and Heuss, 1987), which has troubled many cities with rapid economy growth (Wang et al., 2017b; Nagashima et al., 2017). Many related studies are thus being conducted globally (Wei et al., 2014; Malley et al., 2015; Ou et al., 2015). In China, the investigations on VOCs including source apportionment, measurement of emission profiles and interpretation of seasonal variations were mainly concentrated in Yangtze River Delta (YRD), Pearl River Delta (PRD) and Beijing–Tianjin (BJT) regions (An et al., 2014; Wang et al., 2014; Chen et al., 2014; Liu et al., 2016; Guo et al., 2017). Limited studies have been conducted in less developed or developing regions (i.e., southwestern and northwestern China), which are prominently impacted by biomass burning and have high abundances of toxic and reactive compounds (Li et al., 2014, 2017a).
A total of 57 VOCs, including C2–C10 alkanes, alkenes, alkynes and aromatics, which greatly contribute to ambient O3 formation, have been identified and are regularly monitored by Photochemical Assessment Monitoring Stations (PAMS) (US EPA, 1990; Oliver et al., 1996). Due to the characteristic structure and reactivity of these compounds, their contributions to O3 production vary (Carter, 1994); it has been reported that aromatics and alkenes were responsible for most of the weighted reactivity of VOCs (59.4 % and 25.8 %, respectively) in the PRD region in China (Ou et al., 2015). Consequently, researchers have deduced that the reduction of alkenes and aromatics is a suitable target for O3 control (Wang et al., 2018). In addition, with the variations in energy structure, industrial construction and meteorological conditions (Shao et al., 2011; Wang et al., 2015), major emission sources of VOCs in each city are unique. In the less developed cities of Heilongjiang and Anhui, biomass combustion showed the highest contribution (40 % and 36 %, respectively) to the O3 formation potential due to a high level of agricultural activities, while in developed cities such as Shanghai, Beijing and Zhejiang, solvent usage has become a more important source (Wu and Xie, 2017). Therefore, identification of the district emission sources of VOCs is necessary to provide scientific-based information for policymakers who establish efficient strategies to alleviate O3 pollution.
In addition to the factors discussed above, nonlinear relationships between ambient VOCs, nitrogen oxide (NOx) and O3 production show that decreasing tropospheric O3 is more complex than expected (Lin et al., 1998; Hidy and Blanchard, 2015; Li et al., 2018). Many modeling and field studies showed that photochemical O3 production in several cities in China, such as Guangzhou, Shanghai and Beijing with high levels of NOx, was highly sensitive to VOCs (Shao et al., 2009; Ou et al., 2016; Gao et al., 2017). The sensitivity regime is always varied with time and geographical locations (Luecken et al., 2018). The percentage of the VOC-limited regime in the North China Plain (NCP) increased from 4 % to 6 % between 2005 and 2013, owing to the rapid increase of NOx emissions (Jin and Holloway, 2015).
Zhengzhou is an important developing city in the mid-west of the Huanghe–Huaihe river floodplain in China. As the capital city of Henan Province, it is densely populated, with more than 7 million residents in 2010 (Geng et al., 2013). With the rapid growth of industrial activities, as well as increased vehicle emissions and fuel combustion, air quality in Zhengzhou has deteriorated. The air quality index (AQI) for 65 % of the days in 2013 exceeded the allowable limit of 100 established by air quality guidelines (Chinese Ministry of Environmental Protection, 2012). Particularly O3 was the major pollutant in summer, and over 50 % of the days in 2015, the mixing ratio of O3 exceeded the Grade I standard (100 µg m−3) of the daily maximum average 8 h (DMA8) in Henan (Shen et al., 2017; Gong et al., 2017; Liu et al., 2018). As one of the major precursors of O3, the study on VOCs is of significance for Zhengzhou, since no related research has been published in peer-reviewed literature. In this work, a comprehensive sampling campaign for VOCs' measurement and characterization has been conducted at four monitoring stations during the time period of May–September 2017. The spatial and temporal variations in VOCs in Zhengzhou were determined. The contributions of major emission sources were quantified, and the relationship among O3–VOCs–NOx was discussed in detail. The results and implications from this study can provide useful guidance for policymakers to alleviate ozone pollution in Zhengzhou, China.
2.1 Sampling site
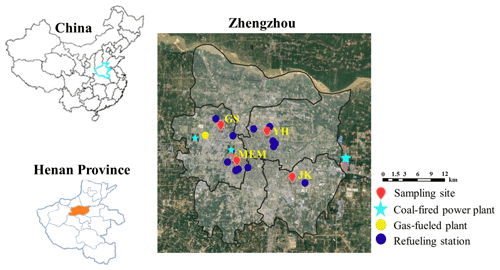
Based on the density of population distribution, locations of industrial facilities and the prevailing winds, four sites have been selected for sample collection: Jingkai community (JK; 113.73∘ E, 34.72∘ N), municipal environmental monitoring station (MEM; 113.61∘ E, 34.75∘ N), Yinhang school (YH; 113.68∘ E, 34.80∘ N) and Gongshui company (GS; 113.57∘ E, 34.81∘ N), which are located in the southeast, southwest, north and northwest of Zhengzhou, respectively (Fig. 1). There is a main airport highway and heavy-traffic ring roads approximately 500 m west of JK. Furthermore, the site is at a distance of 2 km from an industrial area, which includes packaging and printing plants and material distribution factories. It is noteworthy that there are three coal-fired power plants in the urban area of Zhengzhou. One of the power plants with the highest production was 1.6 km northwest of MEM, and MEM was surrounded by a main road with four traffic lanes; the distance between the nearest traffic light and the sampling site was just 200 m. Both the MEM and YH include a mix of commercial and condensed residential areas, and the apartments around YH are older. The GS site is surrounded by several manufacturing plants, including those for pharmaceuticals, materials, foods and machineries.
A total of 10 dry days (i.e., no rainfall recorded) were chosen in every month during the period of May–September 2017 to represent typical air quality conditions in a month. Grab samples were collected using 3.2 L stainless-steel canisters (Entech Instrument, Inc., Simi Valley, CA, USA), which were pre-cleaned with high-purity nitrogen and pressurized to 20 psi. Two samples, one collected at 07:00 with an increase of human activities and another one collected at 14:00 with well-mixed ambient air, were obtained on each sampling day. A total of 400 samples were collected in this study. The chemical analysis was accomplished within 2 weeks after the collection of samples. Real-time data for trace gases, including SO2, CO, NO2∕NOx and O3, and synchronous meteorological data, such as temperature (T), relative humidity (RH), wind direction (WD) and wind speed (WS), were recorded at each air monitoring station. Information detailing relevant equipment is listed in Table S1 in the Supplement.
2.2 Chemical analysis
In this study, the measurement of VOCs was based on Compendium Method TO-15, which was established by the U.S. EPA (US EPA, 1999). Air in the canister was concentrated using liquid nitrogen at −160 ∘C in a cryogenic pre-concentrator (7100A, Entech Instrument, Inc.). Both CO2 and H2O were removed from the transfer line. The air was then thermally desorbed at 120 ∘C and transferred for analysis to a gas chromatograph (GC, 7890A, Agilent Technologies, Santa Clara, CA, USA) coupled with dual detectors, i.e., a mass spectrometric detector (MSD) and a flame ionization detector (FID) (5977E, Agilent Technology). Dual columns were applied for the simultaneous analysis of C2–C11 hydrocarbons. A PLOT column (15 m, internal diameter of 0.32 mm and film thickness of 3.0 µm) was connected to the FID for detection of C2–C5 NMHCs, whereas C5–C10 NMHCs, oxygenated VOCs (OVOCs) and halocarbons were separated using a DB-624 column (30 m ×0.25 mm inner diameter ×3.0 µm film thickness), which was connected to the MSD. Target compounds were identified with retention time and mass spectra, and were quantified with a multipoint calibration curve in this study. The standard gas of PAMS (1 ppm; Spectra Gases Inc, NJ, USA) was used to construct the calibration curves for the 57 target VOCs, including 28 alkanes, 11 alkenes, acetylene and 17 aromatics. Detailed information on the target analyses involved in this study and their corresponding linearity of calibration (r2), measurement relative standard deviation (RSD), method detection limit (MDL) and maximum increment reactivity (MIR; Carter, 2010) is presented in Table S2.
2.3 Positive matrix factorization (PMF)
The U.S. EPA PMF 5.0 software was used for source apportionment (Lau et al., 2010; Abeleira et al., 2017; Xue et al., 2017). Due to the complex chemical reactions, the application of PMF in VOCs has to be based on a couple of principles: eliminating species with mixing ratios below MDL and excluding species with high reactivity, except for the source markers (Guo et al., 2011; Shao et al., 2016). Finally, 31 VOC species and NO2 were chosen for the source apportionment analysis.
In this study, PMF was performed with 50 base runs for each site; results with the minimum Q value (a parameter used to express uncertainties of PMF results) were considered as optimum solutions. In Table S3 the r2 coefficients between observed values and predicted values of selected VOCs and NO2 are presented for the four sites. The r2 coefficients for most species (> 80 %) were higher than 0.6, and compounds with r2 < 0.6 were downweighted when determining factor sources.
During PMF analysis, a bootstrap method was used to evaluate stability and uncertainty of the base run solution, setting the minimum correlation coefficient r2 at 0.6. A total of 100 bootstrap runs were performed, and the results are shown in Table S4. Acceptable results (> 80 %) were gained for all the factors.
Three to nine factors were selected to initiate the running of PMF. The Q∕Q(exp) values for every site at fixed factor size are presented in Table S5. With the increase of factor number, the ratios Q∕Q(exp) declined due to additional factors. When the factor size changed from 3 to 4, 4 to 5 and 5 to 6, the decrement of Q∕Q(exp) was larger (∼18 %–25 %), while the change was lower than 12 % after factors increased to 7. Combined with the field conditions, six factors were defined at each site.
2.4 Potential source contribution function (PSCF)
In this trajectory-based study, the probability of air clusters with source concentration higher than a certain value was estimated (Hopke et al., 1995). Briefly, the PSCF value in the ijth grid was the ratio of the number of endpoints with higher source concentration relative to the total number of endpoints in the ijth grid cell. The criterion value, equal to the 75th percentile of the targeted source concentration in this study, was used to establish whether the value was higher or not. The 48 h back trajectories were calculated using the Hybrid Single-Particle Lagrangian Integrated Trajectory (HYSPLIT) model. Because there are many grid cells with small values, which could result in high uncertainty, a weighted potential source contribution function (WPSCF; Wij) was introduced (Polissar et al., 1999). According to the average values of end points in each cell, in this case, Wij was presented as below.
2.5 Estimation of the initial NOx and VOCs
With the assumption that chemical loss of NOx and VOCs was mainly due to their reactions with hydroxyl radical (⋅ OH), the initial mixing ratio of NOx can be calculated with the equation as follows (Shiu et al., 2007; Shao et al., 2009):
where k stands for the reaction rate between NOx and ⋅ OH. In this study, k was set as the product of the rate constant for NO2 OH multiplied by the observed average ratio of NO2∕NOx during this campaign.
The photochemical age (Δt) can be estimated from the ratio between two compounds, emitted from a common source, but with a different reaction rate with ⋅ OH. For this case, the photochemical age clock was performed with ethylbenzene (E) and m-xylene and p-xylene (X) (Sun et al., 2016).
where kx and kE represent their rate constants with ⋅ OH, CX and CE correspond to the observed mixing ratios; X0 and E0 were their initial concentrations. The X0∕E0 was estimated from the 5th percentile of the observed ratios at 07:00 in this paper.
The initial mixing ratio of VOCs was estimated using the same method as for NOx (Shiu et al., 2007):
where [VOC]t was the observed mixing ratio of ith species and ki was the correspondent rate constant with ⋅ OH.
3.1 Meteorological variations and mixing ratios
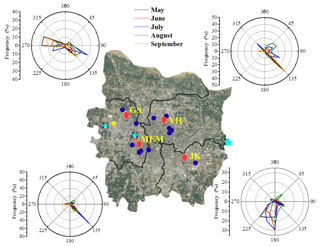
Meteorological conditions are important factors that impact both the compositions and levels of VOCs. During the sampling period, the T varied from 15 to 38∘, RH varied from 38 % to 100 % (Fig. S1 in the Supplement) and the dominant winds were northwestern and southeastern (Fig. 2). The air clusters, analyzed using the HYSPLIT model, showed moderate differences in each month (Fig. 3). In May, clusters arriving at Zhengzhou demonstrated longer paths, and included six clusters in total, while in June, the length of clusters was shorter. However, the concentration levels and compositions of VOCs were similar in the two months. In May, the largest cluster (27.2 %) passed over from Yinchuan, a central city in northwest China, then crossed several non-capital cities (i.e., Yanan, Yuncheng and Luoyang) in Shanxi and Sichuan provinces. Such long-range transport of pollutants has less impact on the air quality of Zhengzhou, as a comparable level and similar compositions of VOCs were obtained during the period of May–June. In June, August and September, approximately half of the air trajectories originated from areas in Henan Province, indicating that the air pollutants in Zhengzhou were impacted by local factors.
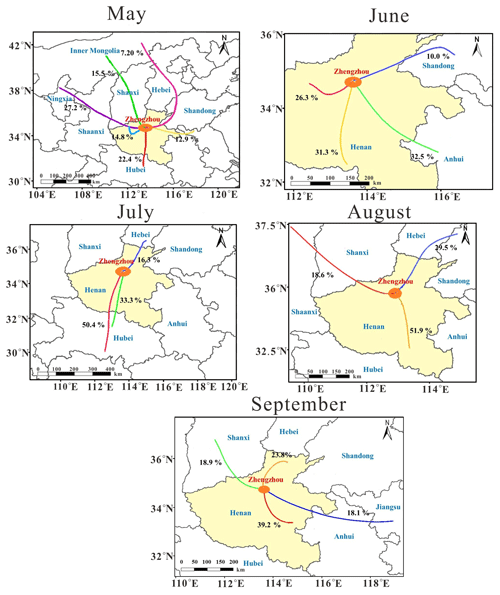
Figure 3Cluster analysis of 48 h backward trajectories for Zhengzhou in each sampling month using the HYSPLIT code, with the start height at 500 m altitude and running interval set as 2 h for each day; the percentage of each cluster and covered areas are presented as well.
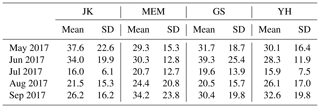
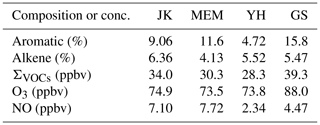
The total concentrations of VOCs (ΣVOCs) are presented in Table 1. The ΣVOCs varied at the four sites; the highest ΣVOCs and their compositions were not identical across the sampling months either. In May 2017, the highest ΣVOCs were reported at JK (37.6±22.6 ppbv), followed by GS (31.7±18.7 ppbv), YH (30.1±16.4 ppbv) and MEM (29.1±15.3 ppbv), while the ΣVOCs for the months of June, July, August and September were found to be in the order of GS > JK > MEM > YH, MEM > GS > JK > YH, YH > MEM > JK > GS and MEM > YH > GS > JK, respectively. This can be attributed to numerous factors that will be explored later in the paper.
Table 2Wind speed (m s−1) measured about 10 m above ground level at every site during the sampling period.
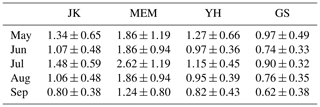
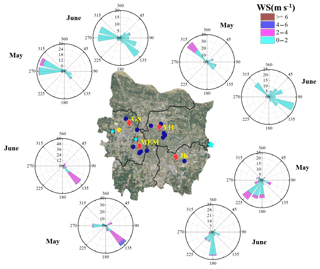
Figure 4Wind rose plot showing wind sector frequency (%) of occurrence and associated wind speed (m s−1) at each site in May and June (the wind distribution of the other three months is illustrated in Fig. S2), which were recorded by the anemometers placed at the same site as other air monitors.
Besides the emission sources (to be discussed in Sect. 2), the impacts controlled by meteorological conditions should not be ignored either. For instance, the prevailing wind in May was northwestern at GS and YH, while southwestern wind was dominant at JK (Fig. 4). The transport of air pollutants from the urban center and industrial plants resulted in the highest level of ΣVOCs at JK. In June 2017, the prevailing wind was southeastern at MEM, YH and GS (Fig. 4). The average wind speed at GS (0.74±0.33 m s−1) was lower than that at MEM (1.84±0.94 m s−1) and YH (0.97±0.36 m s−1) (Table 2), indicating poor dispersion conditions at GS. The air pollutants emitted from MEM and YH were more likely to result in a higher level of ΣVOCs at GS in June. It should be noted that, when ΣVOCs at JK was higher than that of GS, the level at YH was higher than that of MEM, and vice versa. Except for the discriminations between the pollution sources at every site, there may be some other factors (e.g., horizontal and vertical air advection) that contribute to it.
Due to the variations of the planetary boundary layer (PBL) height, solar radiation and emission sources, the concentrations of VOCs displayed obvious differences between morning and afternoon periods (07:00 and 14:00 LT in this study). Compared with the morning period, the aromatic compounds showed lower compositions at 14:00 LT (Fig. 5) because of the increased planetary boundary layer and the active photochemical reactions, while alkenes always peaked at 14:00 LT. According to the dataset, the increases in alkene compositions (∼4.3 % uplift) were mainly due to higher contributions of isoprene (∼1.4 % in the morning and 7.6 % in the afternoon), which was mainly emitted from biogenic sources and increased exponentially with ambient temperature (Guenther et al., 1993, 1995).
The average ΣVOCs in Zhengzhou (28.8±22.1 ppbv) were significantly lower than those in Beijing (65.6 ppbv), Hangzhou (55.9 ppbv), Guangzhou (47.3 ppbv) and Nanjing (43.5 ppbv), and higher than that in Wuhan (23.3±0.5 ppbv) (Table 3). Factors including population density, industrial activity, fuel composition, local stringent regulations for environmental protection, terrain and weather are the potential reasons for the differences in VOC concentrations in those cities. With regard to the weight percentage of major groups (Table 3), the composition of alkanes was the largest in all cities because of their longer lifetimes and widespread sources (Fig. 5), while the composition of aromatics was lower than alkenes in these cities except for Guangzhou. It is well known that aromatics mainly originate from solvent usage and vehicle exhaust in summer. The large number of shoemaking and shipbuilding industries involving large amounts of solvent usage may be the main reason for the higher composition of aromatics in Guangzhou. In comparison with the other four cities, the composition of aromatics in Zhengzhou was the lowest, probably due to solvent usage in manufacturing being less than in Guangzhou, Hangzhou and Nanjing, and a lower number of vehicles than in Beijing. Alkyne contributes least to VOCs in cities listed in Table 3, with a higher level observed in Zhengzhou, which is ranked second after Hangzhou. Alkyne typically originates from combustion sources. Zhu et al. (2016) observed that the composition of alkyne in the biomass-burning period could be double that in the non-biomass-burning period (Zhu et al., 2016). As Henan is the largest agricultural province in China and the sampling duration covered the crop harvest season, the residents often used crop residue as the biofuel for their subsistence; thus a higher alkyne composition in Zhengzhou resulted.
Table 3Concentration levels of VOCs and compositions of major groups in Zhengzhou and other cities in China. TNMHC refers to total non-methane hydrocarbon.
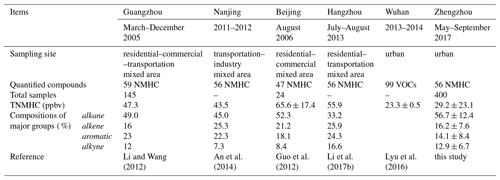
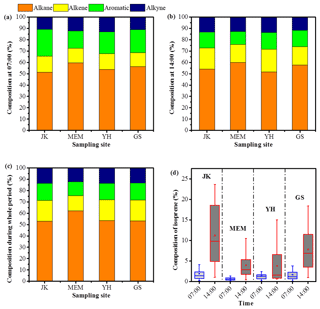
Figure 5Compositions of major organic classes at 07:00 LT (a), 14:00 LT (b) and during the whole sampling period (c) at the four sites, and the box plot for the composition of isoprene at 07:00 and 14:00 LT for each site. The whiskers show the 5–95th percentiles, and the box shows the 25–75th percentiles. The solid dots represent the arithmetic average, and the line in the box shows the median (d).
3.2 Temporal variations
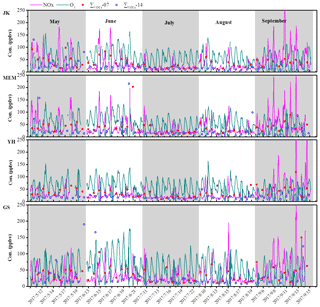
The time series of mixing ratios of NOx, O3 and ΣVOCs at every site are shown in Fig. 6. The results showed distinctive temporal characteristics, whereby lower levels of SO2, CO, NOx, O3 and ΣVOCs were observed in July and August (midsummer) (Table S6). These results were similar to those obtained for other urban areas worldwide (Cheng et al., 1997; Na et al., 2001; Li and Wang, 2012). Changes in PBL height, human activities and abundance of ⋅ OH were the potential causes for this phenomenon. The occurrence of precipitation, which is usually accompanied with better air dispersion conditions, is also frequent in most areas of China during summer, resulting in a decreasing background level of air pollutants. Additionally, a series of effective local policies, such as prohibition of painting and coating in open air and limitations on fuel supply between 10:00 and 17:00 LT during hot summer days assisted in suppressing the emissions of VOCs. Meanwhile, many organizations, such as schools, institutes and scattered private workshops, were closed due to summer vacation. Some large-scale industries also stopped manufacturing processes for 2 weeks during this period. Consequently, the anthropogenic emissions were reduced, which in turn resulted in a decrease in VOCs, SO2 and NOx emissions. The reduction of precursor levels and unfavorable photochemical conditions (such as higher RH) resulted in the lower O3 levels in July and August.
Beside local emissions, the long-range air mass also had some impacts on relatively lower level of ΣVOCs in July. As illustrated in Fig. 3, different from other months, the air current originated, with the largest portion (ca. 88.7 %), from Hubei Province; the average ΣVOCs in its capital city (23.3±0.6 ppbv) (Lyu et al., 2016) were lower than those in Zhengzhou (29.2±23.1 ppbv). In combination with the lower weight percentage of photochemically reactive aromatics (10.3±4.2 %), and the lowest toluene to benzene (T∕B) ratio of 1.15±0.99 around this period, it is possible that the cleaner air mass clusters originating from Hubei also contributed to the reduction of ΣVOCs in July.
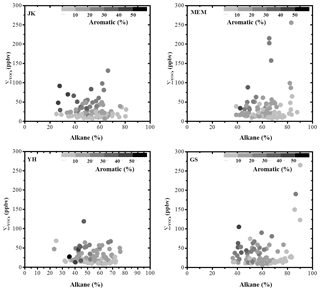
Figure 7The relationship between the mixing ratio of ΣVOCs and the composition of alkane. The data points are color coded according to the composition of aromatic.
As demonstrated in Fig. 6, the observed ΣVOCs at 07:00 LT were often higher than those at 14:00 LT. The accumulation of pollutants during nighttime and the temperature inversion in the morning were the most reasonable explanations for this phenomenon. Stronger photochemical reactions at noon led to the reduction in atmospheric VOCs. It should be noted that pronounced ΣVOCs were occasionally observed at MEM and GS (Fig. 7), which were potentially ascribed to sharp changes in local emissions and meteorological conditions. Specifically, at MEM, the distinctive increment was always accompanied with obvious increases of alkanes or aromatics (Fig. 7). Since the T and RH were often consistent during the sampling period, the direct gas evaporations should be constant as well. Therefore, the simultaneous increased concentrations of SO2, CO and NOx could illustrate the potential impacts from combustion sources, such as emissions from nearby thermal power plants. At GS, the increase of ΣVOCs in June was usually coincident with extremely high levels of aromatics, due to the disturbance from solvent use for building renovations during this period, and the abnormal high levels of ΣVOCs in other months were related to the rising concentrations of C3−C4 alkanes, which were mainly originated from consumptions of compressed natural gas (CNG) or LPG (Huang et al., 2015). The results support the possible impact from a gas-fueled power plant located about 1 km southwest of the site (∼18 % of prevailing western wind at GS during May to September).
It is of interest to note that on the morning of 5 September, acetylene was found in extremely high concentrations (14.7–39.4 ppbv). Its mixing ratio in most of the urban areas was < 10 ppbv (Duan et al., 2008; Guo et al., 2012; Louie et al., 2013). The 5 September is a festival day for people who worship their ancestors. A large number of incense and offerings, made of wood and paper, were burnt during the festival, resulting in an elevation of acetylene all over Zhengzhou (Zhu et al., 2016).
3.3 Spatial variations
The C2–C5 alkanes, acetylene, ethylene, toluene and benzene were the most abundant VOCs detected at all sites (Fig. 8), and the mixing ratios of toluene varied within a wide range at each site because of its universal emission sources (e.g., vehicle exhaust emissions and solvent usage; Barletta et al., 2005; Wang et al., 2014). These chemicals contributed > 60 % of ΣVOCs at each site, illustrating strong combustion-related sources in Zhengzhou.
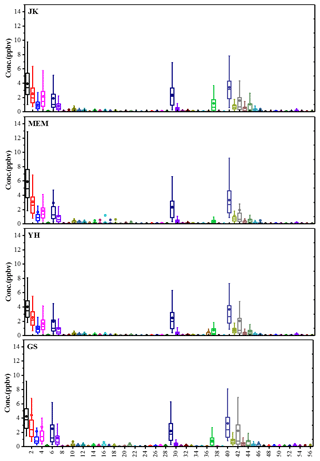
Figure 8Concentrations of 57 VOCs at each site for the whole sampling period. The whiskers show the 5–95th percentiles, and the box shows the 25–75th percentiles. The solid points show the arithmetic average, and the line in the box shows the median. The chemicals are listed in Table S1.
Among the four major organic classes, alkane was the most abundant group as a result of its widespread sources and longevity (Fig. 5), accounting for 52.9 %, 62.5 %, 53.4 % and 53.4 % of the total ΣVOCs at JK, MEM, GS and YH, respectively. The highest composition of alkane was observed at MEM due to the stronger contributions of ethane, isopentane and C6−C8 branched alkanes (Fig. S3), which are emitted from light-duty gasoline vehicles (Wang et al., 2017a).
The average ΣVOCs were slightly higher at the industrially impacted sites of GS (31.7±28.7 ppbv) and JK (28.6±22.0 ppbv) than those at MEM and YH (Fig. 9). Additionally, the air pollutants related to the combustion processes, such as SO2 and CO, were marginally more abundant, in western areas of Zhengzhou (GS and MEM) (Fig. 9). Under high levels of VOCs and sufficient supply of NOx, the highest average mixing ratio of O3 was observed at GS, followed by YH, which had the lowest VOCs and NOx, indicating that there are multiple factors, rather than the absolute concentrations, which contribute to the formation of the secondary pollutant, O3, at YH.
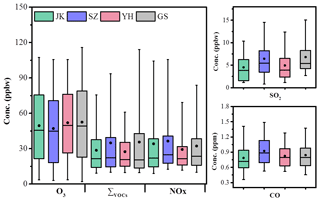
Figure 9The distribution of concentration points on O3, ΣVOCs, NOx, SO2 and CO at each site. The range of the box was 25 %–75 %. The black line in the box stands for median level, and the black dot represents the average level. The range of whiskers was 5 %–95 %.
In June, the O3 concentration often exceeded the national standard level of 80 ppbv; i.e., there was severe air pollution during this period. The average mixing ratio of O3 during daytime (07:00–18:00 LT) in June 2017 at JK, MEM, YH and GS was 74.9±39.6, 73.5±40.6, 73.8±35.7 and 88.0±46.1 ppbv, respectively (Table 4). The higher level of O3 at GS was accompanied by the higher ΣVOCs (39.3±25.4 ppbv). The weight percentage of aromatics (15.6±12.1 %) at GS was higher than that at other sites as well, indicating that the painting and other renovation activities at GS were potentially an important factor for its high O3 level in June. Even though both the ΣVOCs and compounds with high O3 formation potential (such as alkenes and aromatics) at MEM specifically were slightly higher than those at YH (Table 4), the O3 concentration at MEM was not higher. This could be attributed to other critical precursors such as NO. NO at MEM (7.72 ppbv) was significantly higher than that at YH (2.57 ppbv) during daytime, indicating that the titration reaction between O3 and NO was more efficient at MEM.
Because photochemistry producing O3 occurs over several hours to days, O3 episodes are attributable, not only to local sources but also to regional transports. For example, Streets et al. (2007) reported that with continuous southern winds, its neighboring cities in Hebei contributed 20 %–30 % of the O3 level in Beijing. During our study, a typical regional ozone pollution occurred on 10 August at YH (Fig. 6). On that day, the ratios of VOCs∕NOx at the four sites were all less than 6.5 (ppbC ppbv−1) (Fig. S4), indicating the existence of a regional VOC control system and the fact that VOCs are the critical contributors to the formation of O3 in Zhengzhou. The reductions in ΣVOCs in the afternoons (around 14:00 LT) compared to mornings (around 07:00 LT) may have been due, in part, to chemical loss of VOC as O3 is formed. The reduction of ΣVOCs and active compounds (i.e., aromatic + alkene) at 14:00 relative to 07:00, 35 % and 56 % respectively, was the lowest at YH among the four sites (Fig. S4). Based on the wind direction, between 08:00 and 15:00 LT on 10 August, YH was downwind of the other three sites (Fig. S4). All of this confirms that the abnormally high O3 at YH was caused by the transport of air pollutants from other sites on that day.
3.4 VOCs∕NOx ratio
The VOCs∕NOx ratio is often used to distinguish whether a region is VOC limited or NOx limited in O3 formation. Generally, VOC-sensitive regimes occur when VOCs∕NOx ratios are lower than 10 in the morning; NOx-sensitive regimes occur when VOCs∕NOx ratios are greater than 20 (Hanna et al., 1996; Sillman, 1999). In this study, the mean values of VOCs∕NOx (ppbC ppbv−1) were below 5 at all four sites (Fig. 10), and 75 % of the data points were < 6, indicating that the O3 formation was sensitive to VOCs in Zhengzhou, and the reductions of the emissions of VOCs will be a benefit for O3 alleviation.
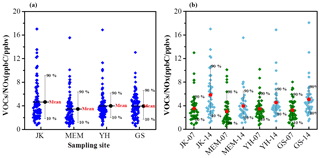
Figure 10The data distribution of VOCs∕NOx (ppbC ppbv−1) at the four sites (a), and the ratio observed at 07:00 and 14:00 LT (b).
The VOCs∕NOx showed differences among the four sites (Fig. 10), with the lowest value at MEM (∼3.8) and the highest value at JK (∼4.7). The production of O3 at MEM is more sensitive to VOCs than at JK due to the presence of strong NOx emissions from a thermal power plant. Approximately 14 % of the measured VOCs∕NOx ratios of > 8.0 were found in the NOx-limited site of JK, resulting from higher VOCs or lower NOx emissions than at other sites. Both of the mixing ratios and the statistical data showed higher levels of VOCs (with lower NOx) at GS, where only ∼4 % of the ratios of > 8.0 were observed, indicating that there must be other factors (unresolved in this study) impacting the variation of O3 formation regimes.
From the daily variations of VOCs∕NOx ratios (Fig. 10), higher values were observed at 14:00 than at 07:00 LT at all four sites, well correlated with less vehicle emissions or more consumption paths for NOx with stronger light intensity. The increment of VOCs∕NOx at 14:00 LT was more obvious at JK and GS, suggesting that there are more emission sources of VOCs at daytime, and resulting the O3 formation system shifting to the transition area in the afternoon.
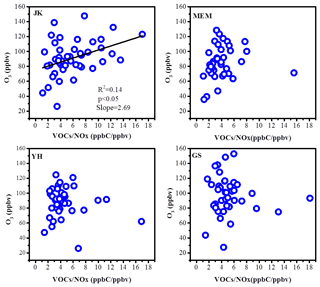
O3 formation depends not only on the abundances of precursors (mainly VOCs and NOx) but also on the VOCs∕NOx ratio (Sillman, 1999; Pollack et al., 2013). In this research, the mixing ratio of O3 at 14:00 LT presented a slightly positive trend (p < 0.05) with the uplift of VOCs∕NOx at JK (Fig. 11), consistent with the results observed in the megacity of Shanghai (Gao et al., 2017), where the O3 formation was more sensitive to NOx when high O3 levels were observed. Without considering the advection of air parcels, this can be attributed to the increased O3 production efficiency at high VOCs∕NOx. There were no discernible trends at other sites, possibly due to the counteraction imposed by other uncertain factors.
3.5 Ratios of specific compounds
Ratios of specific VOCs are useful to identify emission sources (Ho et al., 2009; Liu et al., 2015; Raysoni et al., 2017). In order to characterize the differences in the contribution of various sources at each site, ratios of i-pentane ∕ n-pentane and toluene/benzene (T∕B) are discussed here.
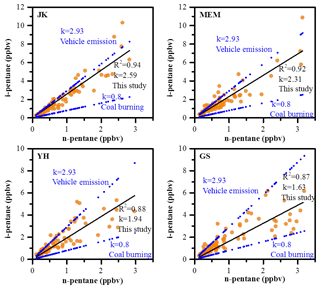
The ratio of i-pentane to n-pentane can be used to differentiate potential sources such as the consumption of natural gas, vehicle emissions and fuel evaporations. In areas heavily impacted by natural gas drilling, the ratios lie in the range of 0.82–0.89 (Gilman et al., 2013; Abeleira et al., 2017). Higher values are often reported for automobiles, in the range of 2.2–3.8 for vehicle emissions and 1.8–4.6 for fuel evaporation (McGaughey et al., 2004; Jobson et al., 2004; Russo et al., 2010; Wang et al., 2013), whereas ratios below unity were found for coal combustion (0.56–0.80) (Yan et al., 2017).
In this study, i-pentane and n-pentane were highly correlated (R2=0.87–0.94) throughout the whole sampling campaign (Fig. 12), indicating constant pollution sources for these two compounds. The highest ratio of i-pentane ∕ n-pentane was found at JK (2.59±0.45), which was comparable to the value of 2.93 reported in a Pearl River tunnel (Liu et al., 2008), thus indicating strong impacts from traffic-related sources. The average ratio at MEM was 2.31±0.68, higher than the characteristic ratios for coal combustion, probably due to the observation site being upwind of the thermal power plant. And frequent idling may cover up the contribution from coal combustion, reflecting the impact of traffic emissions. The average ratios at YH (1.94±0.57) and GS (1.63±0.51) were lower than those at the above two sites, suggesting the comparatively stronger contribution from coal burning.
Tunnel and roadside research indicates that the T∕B ratio varies within the range of 1–2 when the atmosphere is heavily impacted by vehicle emissions (Wang et al., 2002; Tang et al., 2007; Gentner et al., 2013; Huang et al., 2015). The ratio of < 0.6 was ascribed to other sources such as coal combustion and biomass burning (Tsai et al., 2003; Akagi et al., 2011). The industrial activity is more dominant when the T∕B ratio is greater than 3 (Zhang et al., 2015).
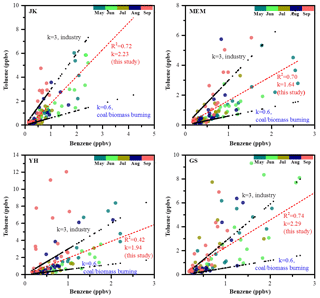
Figure 13T∕B ratios and linear correlation coefficients (r2) between benzene and toluene at every site; the data points are color coded by sampling period.
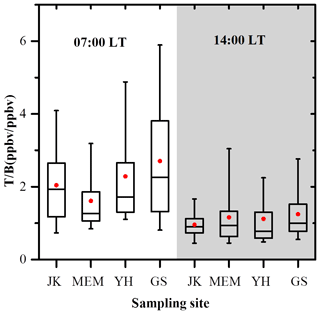
Figure 14The average ratio of T∕B at 07:00 and 14:00 LT for each site during the whole sampling period.
In this study, the correlation between benzene and toluene was fairly good at all the sites (R2=0.70–0.74), except for YH (R2=0.41) (Fig. 14), suggesting similar sources for benzene and toluene at JK, MEM and GS, while they are more complex at YH, including factors such as variable wind direction. The average ratios of T∕B were within the range of 1.64–2.29, and were scattered around the characteristic ratio of 2 for vehicle exhaust, illustrating the significance of vehicle emissions at the four sites. Specifically, at JK, MEM and YH, most T∕B ratios were distributed between 0.6 and 3, which corresponded to characteristic ratios for coal or biomass burning and industrial activities, respectively. These reflected the mixture of impacts from automobiles and coal + biomass burning at these three sites. However, more values were greater than 3 at GS, suggesting more frequent disturbance from industrial activities at this site.
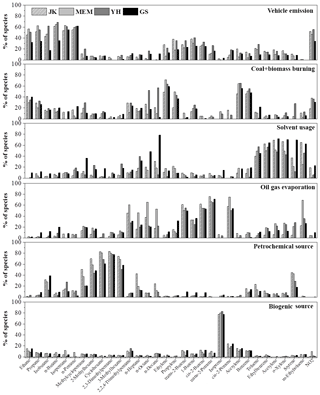
Figure 15Factor profiles of major emission sources, namely vehicle emissions, coal + biomass burning, solvent usage, oil gas evaporation, petrochemical source and biogenic source resolved by positive matrix factorization (PMF) model.
The T∕B ratios at 14:00 LT were lower than at 07:00 LT (Fig. 15). The reaction rate constant of toluene ( cm3 molecule−1 s−1) with ⋅ OH was higher than that for benzene (1 cm3 molecule−1 s−1), indicating a more rapid consumption of toluene from photochemical reactions, thus resulting in lower T∕B ratios at 14:00 LT, all else being equal. The emission strength of automobiles is often weaker at 14:00 LT, while coal + biomass burning are increased due to more human activities. Both chemistry and emissions offer an explanation of the lower T∕B ratios observed at 14:00 LT. In comparison with other months, higher T∕B ratios were found more frequently in September, potentially showing increased industrial activities during this period.
Overall, based on the isopentane (i-pentane) and T∕B ratios, the atmospheric VOCs at every site were impacted by a mix of coal + biomass burning and vehicle emissions, whereas GS was more likely to be impacted by industry-related sources.
3.6 Relative reactivity of VOCs
The reactivity of individual species is different, and in mixtures of VOCs there is competition for reaction partners, leading to variations in reaction pathways and O3 formation yields. Ozone formation potential (OFP) is a useful tool to estimate the maximum O3 production of each compound under optimum conditions, from which the most important species for O3 formation can be identified (Carter, 1994). The calculation of OFP is based on the mixing ratios and maximum incremental reactivity (MIR) of each individual compound, given in Eq. (4):
where Ci represents the concentration level of the ith species and MIR is a constant taken from Carter (2010; Table S2).
In Zhengzhou, alkenes contribute most (55.9±14.2 %) to the sum of OFP, of which ethylene had the largest portion. The results are different with the estimation based on emission inventories by Wu and Xie (2017), in which the largest contributor of total OFP in the NCP, YRD and PRD was aromatics, reflecting the fact that there were relatively fewer surface-coating industries in Zhengzhou.
Table 5Top 10 VOCs ranked according to calculated ozone formation potential (OFP) and their corresponding percentage weighted by mixing ratio.
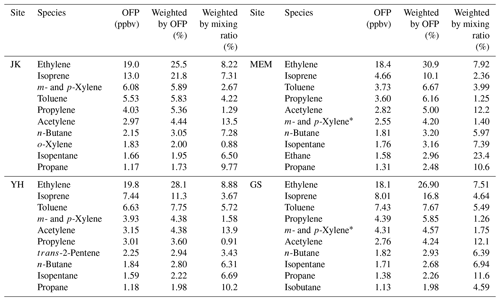
* m-Xylene and p-xylene are co-eluted in the chromatographic separation.
For the individual species, the top 10 highest contributors in OFP included ethylene, isoprene, m-xylene, p-xylene, toluene, propylene, acetylene, n-butane, i-pentane and propane. Their contributions to the sum of OFP were within the range of 69.4 %–77.6 % (Table 5), with 61.3 %–76.5 % of total VOCs weighted by concentration, highlighting the importance of reduction of emissions of these VOCs, whether based on relative reactivity or mixing ratios. Additionally, it is worth noting that the percentage of acetylene (4.51±0.34 %) weighted by OFP was higher than many other areas in China, including Guangzhou (2.20 %) and the YRD (2.37 %) (Li and Wang, 2012; Jia et al., 2016), demonstrating that it is necessary to conduct emission controls on sources related to combustion (i.e., vehicle emissions and biofuel burning) in Zhengzhou.
Zhengzhou suffered from the most severe O3 pollution in June 2017. The relationships between the OFP of each organic group and the ambient concentrations of O3, as well as the corresponding meteorological conditions, are shown in Figs. S5–S6. At 07:00 LT, generally lower WS was seen compared to that at 14:00 LT, showing favorable conditions for local O3 propagation. Under low RHs and high T and OFP (88.1±30.3 ppbv), the O3 level at YH was unexpectedly lower than that at MEM on sunny days. Since the OFP was estimated with the assumption of reactions that proceeded under optimum conditions, the above phenomenon shows that there were unsatisfactory O3 formation conditions at YH. The highest total OFP was seen at JK in June, while the highest O3 levels were observed at GS, located in a downwind position with the lowest WS (0.74±0.33 m s−1). The concentration level of O3 usually increased with wind speed (Fig. S7), particularly when the eastern wind was dominant, illustrating the disturbance from long-distance sources to the urban center.
3.7 Source apportionment
The factor profiles given by PMF for each site are presented in Fig. 15. The six factors were classified as vehicle emissions, coal + biomass burning, solvent use, oil evaporation, petrochemical source and biogenic source (detailed characterization is given in the Supplement) on the basis of the corresponding markers for each source category, which are summarized in Table S7. Meanwhile, the correlation coefficients, expressed as Pearson's r, varied from 0.54 to 0.62 and 0.66 to 0.73 for SO2 with coal + biomass burning and for NO2 with vehicle emissions, respectively (Fig. 16), which prove the precise results gained in this study.
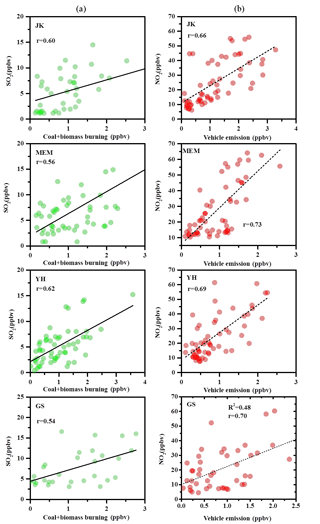
Figure 16Correlation analysis relating source-apportioned VOC contributions of coal + biomass burning (a) and vehicle emissions (b) with co-located measurements of SO2 and NO2 for each site (rows).
The weight percentage of each factor calculated using two criteria (absolute concentrations and OFPs) at the four sites is presented in Fig. 17. At every site, vehicle emissions, coal + biomass burning and solvent use were the top three contributors to VOCs' abundance in ambient air. Compared to JK and YH, even though the distances between the thermal power plant and the observation site were the shortest at MEM, vehicle emissions (36.8 %) showed the largest portion instead. Coal + biomass burning (30.6 %) had the highest contribution at GS, attributed to its downwind position and nearby suburbs that biomass burning occurred more frequently. The contributions from vehicle emissions at the two urban centers of MEM (36.8 %) and YH (37.4 %) were comparable, but higher than those at JK and YH. The consumptions of solvent at GS (18.9 %) and JK (14.9 %) were higher than those at YH (10.1 %) and MEM (11.5 %), due to restriction on development of new industrial enterprises in urban center in recent years. Emissions from oil evaporation, petrochemical sources and biogenic sources were scarce, and their contributions were below 10 % at every site.
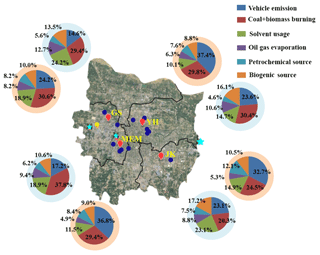
Figure 17Source apportionment results during the whole sampling period. The results weighted by observed concentrations are shaded in pink, and the results estimated based on OFP are shaded in light blue.
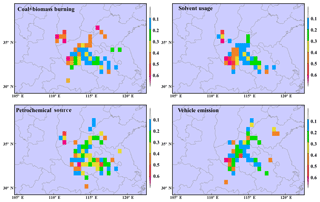
Figure 18Probable source regions apportioned by PSCF in Zhengzhou in summer (June–August 2017) during the sampling period.
On the base of O3 formation impact, coal + biomass burning, solvent use, and vehicle emissions were the three major contributors as well. In contrast to the concentration weighted method, the importance of solvent use estimated with OFP increased 28 %–65 % for each site, and the significance of vehicle emissions decreased 29 %–53 %. At YH and GS, a small discrimination (< 4 %) in the contributions of coal + biomass burning was found between the two methods. On the other hand, the variations in coal + biomass burning at JK (a decline of 17 %) and MEM (an increase of 29 %) were more obvious, due to a low abundance of reactive species with this factor at JK and a high level of alkenes at MEM. The aging index of xylene / ethylbenzene was remarkably high at MEM (2.97) and low at JK (0.01), demonstrating that the emission sources related to coal + biomass burning were fresher at MEM than JK.
Except for oil gas evaporation and biogenic sources, of which major emitted compounds have a shorter life span, potential source regions for the other four identified sources (i.e., coal + biomass burning, vehicle emissions, solvent usage and petrochemical source) apportioned by the PSCF method are presented in Fig. 18. The southwest of Shanxi Province, the west of Shandong Province and the southwest of Henan Province were identified as hotspots for coal + biomass burning. The active emission areas for solvent use were concentrated in Henan Province and were mainly located in the southwest of Zhengzhou. The area with the highest contribution from the petrochemical source was found in the southwest of both Shanxi and Henan, the northwest of Anhui and the southeast of Hubei. For vehicle emissions, the strongest emission point was in the southwest of Henan, while other strong emission points were distributed in Shandong, Anhui and Hubei provinces.
3.8 Consumption of VOCs and correlations with ozone level
The consumption of a VOC in the atmosphere could be presented as the difference between its initial mixing ratio and the observed value following an air parcel. In isolated stagnant air, the rate of change of VOC concentrations will be the sum of emissions, deposition, chemical production and loss processes.
The average value of VOC consumption in the urban center (MEM and YH, 4–6 ppbv) was lower than that in outer areas (JK and GS, 9–11 ppbv), and the average increment of O3 at 14:00 LT was higher than that at 07:00 LT in marginal areas, suggesting more efficient photochemical reactions at JK and GS. Meanwhile, the average values of [⋅ OH]Δt for each site, ranked in the same order as VOCs' consumption, varied in the range of 2.9×10¹⁰ to 4.7×1010 cm−3 s. The values were slightly lower than the results of 4.9×1010 cm−3 s measured at Beijing in August–September 2010 (Yuan et al., 2012), indicating a comparatively lower impact of the aging process in Zhengzhou.
Taking the decrement of VOCs and NOx as independent variables and the increment of O3 as a dependent variable, the multiple regression analysis was performed. The results for JK and GS are presented as follows:
The F values for JK and GS were 16.1 and 10.1, respectively, indicating that the regression results at the two sites were acceptable. However, the relationships among O3, NOx and VOCs could not be expressed in this way at MEM and YH, where there were low values for both r2 (0.12, 0.09) and F (2.7, 2.8). This is potentially attributed to more constant disturbance from fresh emission sources in the urban center.
In this study, VOC samples were collected at four sites in Zhengzhou, Henan (China), for the first time and analyzed for 57 species. It is found that the weighted percentage of aromatics was lower, while the percentage of alkyne was higher in Zhengzhou than in other Chinese cities. C2–C5 alkanes, acetylene, ethylene, toluene and benzene were the most abundant VOCs in the region, suggesting widespread combustion-related sources in the city. Median concentrations for the four sites are almost indistinguishable but, based on monthly averages, the maximum ΣVOCs were observed at the GS site because it is occasionally impacted by emissions from the nearby gas fueled plant, which strongly skew the distribution of measured VOC concentrations. Approximately 75 % of VOCs∕NOx ratios were below 6 at each site, indicating that the O3 formation was driven by VOCs regionally. Different from other megacities, alkenes were the biggest contributors to OFP, and acetylene was particularly critical at each site. In addition, the impact of the aging process is lower in Zhengzhou than in Beijing. Photochemical processing appears to be more efficient at JK and GS, while the relationships among O3, NOx and VOCs at the urban sites of MEM and YH were more complex.
Our analysis of ozone formation does not take into account the important effects of transport and mixing, and should be viewed in this light. Both measured mixing ratios and calculated OFPs demonstrated that the most important contributors to VOCs were vehicle exhaust, coal + biomass burning and solvent use, illustrating the necessity of conducting emission controls on these pollution sources. Vehicle emissions were more dominant in the urban center (YH and MEM), while solvent use was more important at the sites (JK and GS) far away from the urban center of Zhengzhou. It is further shown that the air pollution in Zhengzhou was usually impacted by local emissions, with no more than 50 % of 48 h backward trajectories extending out of Henan Province in June, August and September; southern air clusters from Hubei Province were occasionally cleaner. In addition, strong emissions for coal + biomass burning were concentrated in the southwest of Shanxi, the west of Shandong and the southwest of Henan according to the PSCF analysis. Due to less anthropogenic emissions and more favorable dispersion conditions, most of the air pollutants showed lowest levels in the midsummer month of July. This study provides first-hand information on the characteristics of VOCs and assists in overcoming the O3 pollution issue in Zhengzhou, China.
The data in this study are available from the corresponding authors upon request (stevenho@hkpsrl.org or gongsl@cma.gov.cn).
The supplement related to this article is available online at: https://doi.org/10.5194/acp-19-617-2019-supplement.
JN and HL designed the research. YQ and DZ conducted the measurements. LH and YY analyzed the data. BL wrote the paper. SSHH and SG reviewed and commented on the paper.
The authors declare that they have no conflict of interest.
The authors would like to thank for valuable suggestions, corrections and
discussions from both anonymous referees and the editor, Rob MacKenzie.
Their comments are particularly important and greatly contributed to
the improvement of this work. This research was supported by the Key Program of National Natural
Science Foundation of China (grant no. 91744209 and 91544232).
Edited by: Rob MacKenzie
Reviewed by: two anonymous referees
Abeleira, A., Pollack, I. B., Sive, B., Zhou, Y., Fischer, E. V., and Farmer, D. K.: Source characterization of volatile organic compounds in the Colorado Northern Front Range Metropolitan Area during spring and summer 2015, J. Geophys. Res.-Atmos., 122, 3595–3613, https://doi.org/10.1002/2016jd026227, 2017.
Akagi, S. K., Yokelson, R. J., Wiedinmyer, C., Alvarado, M. J., Reid, J. S., Karl, T., Crounse, J. D., and Wennberg, P. O.: Emission factors for open and domestic biomass burning for use in atmospheric models, Atmos. Chem. Phys., 11, 4039–4072, https://doi.org/10.5194/acp-11-4039-2011, 2011.
An, J., Zhu, B., Wang, H., Li, Y., Lin, X., and Yang, H.: Characteristics and source apportionment of VOCs measured in an industrial area of Nanjing, Yangtze River Delta, China, Atmos. Environ., 97, 206–214, https://doi.org/10.1016/j.atmosenv.2014.08.021, 2014.
Barletta, B., Meinardi, S., Sherwood Rowland, F., Chan, C.-Y., Wang, X., Zou, S., Yin Chan, L., and Blake, D. R.: Volatile organic compounds in 43 Chinese cities, Atmos. Environ., 39, 5979–5990, https://doi.org/10.1016/j.atmosenv.2005.06.029, 2005.
Borbon, A., Locoge, N., Veillerot, M., Galloo, J. C., and Guillermo, R.: Characterisation of NMHCs in a French urban atmosphere: overview of the main sources, Sci. Total Environ., 292, 177–191, 2002.
Carter, W. P. L.: Development of Ozone Reactivity Scales for Volatile Organic Compounds, J. Air Waste Manage. Assoc., 44, 881–899, 1994.
Carter, W. P. L.: Development of the SAPRC-07 Chemical Mechanism and Updated Ozone Reactivity Scales, available at: https://www.cert.ucr.edu/~carter/SAPRC (last access: 13 March 2018), 2010.
Chen, W. T., Shao, M., Lu, S. H., Wang, M., Zeng, L. M., Yuan, B., and Liu, Y.: Understanding primary and secondary sources of ambient carbonyl compounds in Beijing using the PMF model, Atmos. Chem. Phys., 14, 3047–3062, https://doi.org/10.5194/acp-14-3047-2014, 2014.
Cheng, L., Fu, L., Angle, R. P., and Sandhu, H. S.: Seasonal variations of volatile organic compounds in Edmonton, Alberta, Atmos. Environ., 31, 239–246, 1997.
Chinese Ministry of Environmental Protection: Ambient Air Quality Index (AQI) Technical Provisions (Trial), available at: http://kjs.mee.gov.cn/hjbhbz/bzwb/jcffbz/201203/t20120302_224166.shtml (last access: 3 November 2018), 2012.
Choek, D. P. and Heuss, J. M.: Urban ozone and its precursors, Environ. Sci. Technol., 21, 1146–1153, 1987.
Duan, J., Tan, J., Yang, L., Wu, S., and Hao, J.: Concentration, sources and ozone formation potential of volatile organic compounds (VOCs) during ozone episode in Beijing, Atmos. Res., 88, 25–35, https://doi.org/10.1016/j.atmosres.2007.09.004, 2008.
Fujita, E. M.: Hydrocarbon source apportionment for the 1996 Paso del Norte Ozone Study, Sci. Total Environ., 276, 171–184, 2001.
Fujita, E. M., Watson, J. G., Chow, J. C., and Lu, Z.: Validation of the chemical mass balance receptor model applied to hydrocarbon source apportionment in the southern California air quality study, Environ. Sci. Technol., 28, 1633–1649, 1994.
Gao, W., Tie, X., Xu, J., Huang, R., Mao, X., Zhou, G., and Chang, L.: Long-term trend of O3 in a mega City (Shanghai), China: Characteristics, causes, and interactions with precursors, Sci. Total Environ., 603–604, 425–433, https://doi.org/10.1016/j.scitotenv.2017.06.099, 2017.
Geng, N., Wang, J., Xu, Y., Zhang, W., Chen, C., and Zhang, R.: PM2.5 in an industrial district of Zhengzhou, China: Chemical composition and source apportionment, Particuology, 11, 99–109, https://doi.org/10.1016/j.partic.2012.08.004, 2013.
Gentner, D. R., Worton, D. R., Isaacman, G., Davis, L. C., Dallmann, T. R., Wood, E. C., Herndon, S. C., Goldstein, A. H., and Harley, R. A.: Chemical composition of gas-phase organic carbon emissions from motor vehicles and implications for ozone production, Environ. Sci. Technol., 47, 11837–11848, https://doi.org/10.1021/es401470e, 2013.
Gilman, J. B., Lerner, B. M., Kuster, W. C., and de Gouw, J. A.: Source signature of volatile organic compounds from oil and natural gas operations in northeastern Colorado, Environ. Sci. Technol., 47, 1297–1305, https://doi.org/10.1021/es304119a, 2013.
Gong, M., Yin, S., Gu, X., Xu, Y., Jiang, N., and Zhang, R.: Refined 2013-based vehicle emission inventory and its spatial and temporal characteristics in Zhengzhou, China, Sci. Total Environ., 599–600, 1149–1159, https://doi.org/10.1016/j.scitotenv.2017.03.299, 2017.
Guenther, A., Hewitt, C. N., Erickson, D., Fall, R., Geron, C., Graedel, T., Harley, P., Klinger, L., Lerdau, M., McKay, W. A., Pierce, T., Scholes, B., Steinbrecher, R., Tallamraju, R., Taylor, J., and Zimmerman, P.: A global model of natural volatile organic compound emissions, J. Geophys. Res., 100, 8873–8892, 1995.
Guenther, A. B., Zimmerman, P. R., and Harley, P. C.: Isoprene and monoterpene emission rate variability: model evaluations and sensitivity analyses, J. Geophys. Res., 98, 12609–12617, 1993.
Guo, H., Cheng, H. R., Ling, Z. H., Louie, P. K., and Ayoko, G. A.: Which emission sources are responsible for the volatile organic compounds in the atmosphere of Pearl River Delta?, J. Hazard. Mater., 188, 116–124, https://doi.org/10.1016/j.jhazmat.2011.01.081, 2011.
Guo, H., Ling, Z. H., Cheng, H. R., Simpson, I. J., Lyu, X. P., Wang, X. M., Shao, M., Lu, H. X., Ayoko, G., Zhang, Y. L., Saunders, S. M., Lam, S. H. M., Wang, J. L., and Blake, D. R.: Tropospheric volatile organic compounds in China, Sci. Total Environ., 574, 1021–1043, https://doi.org/10.1016/j.scitotenv.2016.09.116, 2017.
Guo, S., Tan, J., Duan, J., Ma, Y., Yang, F., He, K., and Hao, J.: Characteristics of atmospheric non-methane hydrocarbons during haze episode in Beijing, China, Environ. Monit. Assess., 184, 7235–7246, https://doi.org/10.1007/s10661-011-2493-9, 2012.
Haagen-Smit, A. T.: Chemistry and physiology of Los Angeles smog, J. Ind. Eng. Chem., 44, 1342–1346, 1952.
Hanna, S. R., Moore, G. E., and Fernau, M.: Evaluation of photochemical grid models (UAM-IV, UAM-V, and the ROM/UAM-IV couple) using data from the Lake Michigan Ozone Study (LMOS), Atmos. Environ., 30, 3265–3279, 1996.
Hidy, G. M. and Blanchard, C. L.: Precursor reductions and ground-level ozone in the Continental United States, J. Air Waste Manage. Assoc., 65, 1261–1282, https://doi.org/10.1080/10962247.2015.1079564, 2015.
Ho, K. F., Lee, S. C., Ho, W. K., Blake, D. R., Cheng, Y., Li, Y. S., Ho, S. S. H., Fung, K., Louie, P. K. K., and Park, D.: Vehicular emission of volatile organic compounds (VOCs) from a tunnel study in Hong Kong, Atmos. Chem. Phys., 9, 7491–7504, https://doi.org/10.5194/acp-9-7491-2009, 2009.
Hopke, P. K., Barrie, L. A., Li, S.-M., Cheng, M.-D., Li, C., and Xie, Y.: Possible sources and preferred pathways for biogenic and non-sea-salt sulfur for the high Arctic, J. Geophys. Res.-Atmos., 100, 16595–16603, 1995.
Huang, Y., Ling, Z. H., Lee, S. C., Ho, S. S. H., Cao, J. J., Blake, D. R., Cheng, Y., Lai, S. C., Ho, K. F., Gao, Y., Cui, L., and Louie, P. K. K.: Characterization of volatile organic compounds at a roadside environment in Hong Kong: An investigation of influences after air pollution control strategies, Atmos. Environ., 122, 809–818, https://doi.org/10.1016/j.atmosenv.2015.09.036, 2015.
Jia, C., Mao, X., Huang, T., Liang, X., Wang, Y., Shen, Y., Jiang, W., Wang, H., Bai, Z., Ma, M., Yu, Z., Ma, J., and Gao, H.: Non-methane hydrocarbons (NMHCs) and their contribution to ozone formation potential in a petrochemical industrialized city, Northwest China, Atmos. Res., 169, 225–236, https://doi.org/10.1016/j.atmosres.2015.10.006, 2016.
Jin, X. and Holloway, T.: Spatial and temporal variability of ozone sensitivity over China observed from the Ozone Monitoring Instrument, J. Geophys. Res.-Atmos., 120, 7229–7246, https://doi.org/10.1002/2015jd023250, 2015.
Jobson, B. T., Berkowitz, C. M., Kuster, W. C., Goldan, P. D., Williams, E. J., Fesenfeld, F. C., Apel, E. C., Karl, T., Lonneman, W. A., and Riemer, D.: Hydrocarbon source signatures in Houston, Texas: Influence of the petrochemical industry, J. Geophys. Res.-Atmos., 109, D24305, https://doi.org/10.1029/2004jd004887, 2004.
Lau, A. K., Yuan, Z., Yu, J. Z., and Louie, P. K.: Source apportionment of ambient volatile organic compounds in Hong Kong, Sci. Total Environ., 408, 4138–4149, https://doi.org/10.1016/j.scitotenv.2010.05.025, 2010.
Li, B., Ho, S. S. H., Xue, Y., Huang, Y., Wang, L., Cheng, Y., Dai, W., Zhong, H., Cao, J., and Lee, S.: Characterizations of volatile organic compounds (VOCs) from vehicular emissions at roadside environment: The first comprehensive study in Northwestern China, Atmos. Environ., 161, 1–12, https://doi.org/10.1016/j.atmosenv.2017.04.029, 2017a.
Li, K., Chen, L., Ying, F., White, S. J., Jang, C., Wu, X., Gao, X., Hong, S., Shen, J., Azzi, M., and Cen, K.: Meteorological and chemical impacts on ozone formation: A case study in Hangzhou, China, Atmos. Res., 196, 40–52, https://doi.org/10.1016/j.atmosres.2017.06.003, 2017b.
Li, L. and Wang, X.: Seasonal and diurnal variations of atmospheric non-methane hydrocarbons in Guangzhou, China, Inter. J. Env. Res. Pub. Heal., 9, 1859–1873, https://doi.org/10.3390/ijerph9051859, 2012.
Li, L., Chen, Y., Zeng, L., Shao, M., Xie, S., Chen, W., Lu, S., Wu, Y., and Cao, W.: Biomass burning contribution to ambient volatile organic compounds (VOCs) in the Chengdu–Chongqing Region (CCR), China, Atmos. Environ., 99, 403–410, https://doi.org/10.1016/j.atmosenv.2014.09.067, 2014.
Li, Q., Zhang, L., Wang, T., Wang, Z., Fu, X., and Zhang, Q.: “New” Reactive Nitrogen Chemistry Reshapes the Relationship of Ozone to Its Precursors, Environ. Sci. Technol., 52, 2810–2818, https://doi.org/10.1021/acs.est.7b05771, 2018.
Lin, X., Traner, M., and Liu, S. C.: On the Nonlinearity of the Tropospheric Ozone Production, J. Geophys. Res.-Atmos., 93, 15879–15888, 1998.
Liu, B., Liang, D., Yang, J., Dai, Q., Bi, X., Feng, Y., Yuan, J., Xiao, Z., Zhang, Y., and Xu, H.: Characterization and source apportionment of volatile organic compounds based on 1-year of observational data in Tianjin, China, Environ. Pollut., 218, 757–769, https://doi.org/10.1016/j.envpol.2016.07.072, 2016.
Liu, H., Liu, S., Xue, B., Lv, Z., Meng, Z., Yang, X., Xue, T., Yu, Q., and He, K.: Ground-level ozone pollution and its health impacts in China, Atmos. Environ., 173, 223–230, https://doi.org/10.1016/j.atmosenv.2017.11.014, 2018.
Liu, Y., Shao, M., Fu, L., Lu, S., Zeng, L., and Tang, D.: Source profiles of volatile organic compounds (VOCs) measured in China: Part I, Atmos. Environ., 42, 6247–6260, https://doi.org/10.1016/j.atmosenv.2008.01.070, 2008.
Liu, Y., Yuan, B., Li, X., Shao, M., Lu, S., Li, Y., Chang, C.-C., Wang, Z., Hu, W., Huang, X., He, L., Zeng, L., Hu, M., and Zhu, T.: Impact of pollution controls in Beijing on atmospheric oxygenated volatile organic compounds (OVOCs) during the 2008 Olympic Games: observation and modeling implications, Atmos. Chem. Phys., 15, 3045–3062, https://doi.org/10.5194/acp-15-3045-2015, 2015.
Louie, P. K. K., Ho, J. W. K., Tsang, R. C. W., Blake, D. R., Lau, A. K. H., Yu, J. Z., Yuan, Z., Wang, X., Shao, M., and Zhong, L.: VOCs and OVOCs distribution and control policy implications in Pearl River Delta region, China, Atmos. Environ., 76, 125–135, https://doi.org/10.1016/j.atmosenv.2012.08.058, 2013.
Luecken, D. J., Napelenok, S. L., Strum, M., Scheffe, R., and Phillips, S.: Sensitivity of Ambient Atmospheric Formaldehyde and Ozone to Precursor Species and Source Types Across the United States, Environ. Sci. Technol., 52, 4668–4675, https://doi.org/10.1021/acs.est.7b05509, 2018.
Lyu, X. P., Chen, N., Guo, H., Zhang, W. H., Wang, N., Wang, Y., and Liu, M.: Ambient volatile organic compounds and their effect on ozone production in Wuhan, central China, Sci. Total Environ., 541, 200–209, https://doi.org/10.1016/j.scitotenv.2015.09.093, 2016.
Malley, C. S., Braban, C. F., Dumitrean, P., Cape, J. N., and Heal, M. R.: The impact of speciated VOCs on regional ozone increment derived from measurements at the UK EMEP supersites between 1999 and 2012, Atmos. Chem. Phys., 15, 8361–8380, https://doi.org/10.5194/acp-15-8361-2015, 2015.
McGaughey, G. R., Desai, N. R., Allen, D. T., Seila, R. L., Lonneman, W. A., Fraser, M. P., Harley, R. A., Pollack, A. K., Ivy, J. M., and Price, J. H.: Analysis of motor vehicle emissions in a Houston tunnel during the Texas Air Quality Study 2000, Atmos. Environ., 38, 3363–3372, https://doi.org/10.1016/j.atmosenv.2004.03.006, 2004.
Na, K., Kim, Y. P., Moon, K.-C., Moon, I., and Fung, K.: Concentrations of volatile organic compounds in an industrial area of Korea, Atmos. Environ., 35, 2747–2756, 2001.
Nagashima, T., Sudo, K., Akimoto, H., Kurokawa, J., and Ohara, T.: Long-term change in the source contribution to surface ozone over Japan, Atmos. Chem. Phys., 17, 8231–8246, https://doi.org/10.5194/acp-17-8231-2017, 2017.
Oliver, K. D., Adams, J. R., Daughtrey Jr., E. H., Mcclenny, W. A., Yoong, M. J., and Pardee, M. A.: Technique for monitoring ozone precursor hydrocarbons in air at photochemical assessment monitoring stations: sorbent preconcentration, closed-cycle cooler cryofocusing, and GC-FID analysis, Atmos. Environ., 30, 2751–2757, 1996.
Ou, J., Zheng, J., Li, R., Huang, X., Zhong, Z., Zhong, L., and Lin, H.: Speciated OVOC and VOC emission inventories and their implications for reactivity-based ozone control strategy in the Pearl River Delta region, China, Sci. Total Environ., 530–531, 393–402, https://doi.org/10.1016/j.scitotenv.2015.05.062, 2015.
Ou, J., Yuan, Z., Zheng, J., Huang, Z., Shao, M., Li, Z., Huang, X., Guo, H., and Louie, P. K.: Ambient Ozone Control in a Photochemically Active Region: Short-Term Despiking or Long-Term Attainment?, Environ. Sci. Technol., 50, 5720–5728, https://doi.org/10.1021/acs.est.6b00345, 2016.
Polissar, A. V., Hopke, P. K., Paatero, P., Kaufmann, Y. J., Hall, D. K., Bodhaine, B. A., Dutton, E. G., and Harris, J. M.: The aerosol at Barrow, Alaska: long-term trends and source locations, Atmos. Environ., 33, 2441–2458, 1999.
Pollack, I. B., Ryerson, T. B., Trainer, M., Neuman, J. A., Roberts, J. M., and Parrish, D. D.: Trends in ozone, its precursors, and related secondary oxidation products in Los Angeles, California: A synthesis of measurements from 1960 to 2010, J. Geophys. Res.-Atmos., 118, 5893–5911, https://doi.org/10.1002/jgrd.50472, 2013.
Raysoni, A. U., Stock, T. H., Sarnat, J. A., Chavez, M. C., Sarnat, S. E., Montoya, T., Holguin, F., and Li, W. W.: Evaluation of VOC concentrations in indoor and outdoor microenvironments at near-road schools, Environ. Pollut., 231, 681–693, https://doi.org/10.1016/j.envpol.2017.08.065, 2017.
Russo, R. S., Zhou, Y., White, M. L., Mao, H., Talbot, R., and Sive, B. C.: Multi-year (2004–2008) record of nonmethane hydrocarbons and halocarbons in New England: seasonal variations and regional sources, Atmos. Chem. Phys., 10, 4909–4929, https://doi.org/10.5194/acp-10-4909-2010, 2010.
Shao, M., Lu, S., Liu, Y., Xie, X., Chang, C., Huang, S., and Chen, Z.: Volatile organic compounds measured in summer in Beijing and their role in ground-level ozone formation, J. Geophys. Res.-Atmos., 114, 114, D00G06, https://doi.org/10.1029/2008jd010863, 2009.
Shao, M., Wang, B., Lu, S., Yuan, B., and Wang, M.: Effects of Beijing Olympics Control Measures on Reducing Reactive Hydrocarbon Species, Environ. Sci. Technol., 45, 514–519, 2011.
Shao, P., An, J., Xin, J., Wu, F., Wang, J., Ji, D., and Wang, Y.: Source apportionment of VOCs and the contribution to photochemical ozone formation during summer in the typical industrial area in the Yangtze River Delta, China, Atmos. Res., 176–177, 64–74, doi:10.1016/j.atmosres.2016.02.015, 2016.
Shen, F., Ge, X., Hu, J., Nie, D., Tian, L., and Chen, M.: Air pollution characteristics and health risks in Henan Province, China, Environ. Res., 156, 625–634, https://doi.org/10.1016/j.envres.2017.04.026, 2017.
Shiu, C.-J., Liu, S. C., Chang, C.-C., Chen, J.-P., Chou, C. C. K., Lin, C.-Y., and Young, C.-Y.: Photochemical production of ozone and control strategy for Southern Taiwan, Atmos. Environ., 41, 9324–9340, https://doi.org/10.1016/j.atmosenv.2007.09.014, 2007.
Sillman, S.: The relation between ozone, NOx and hydrocarbons in urban and polluted rural environments, Atmos. Environ., 33, 1821–1845, 1999.
Streets, D. G., Fu, J. S., Jang, C. J., Hao, J., He, K., Tang, X., Zhang, Y., Wang, Z., Li, Z., Zhang, Q., Wang, L., Wang, B., and Yu, C.: Air quality during the 2008 Beijing Olympic Games, Atmos. Environ., 41, 480–492, https://doi.org/10.1016/j.atmosenv.2006.08.046, 2007.
Sun, J., Wu, F., Hu, B., Tang, G., Zhang, J., and Wang, Y.: VOC characteristics, emissions and contributions to SOA formation during hazy episodes, Atmos. Environ., 141, 560–570, https://doi.org/10.1016/j.atmosenv.2016.06.060, 2016.
Tang, J. H., Chan, L. Y., Chan, C. Y., Li, Y. S., Chang, C. C., Liu, S. C., Wu, D., and Li, Y. D.: Characteristics and diurnal variations of NMHCs at urban, suburban, and rural sites in the Pearl River Delta and a remote site in South China, Atmos. Environ., 41, 8620–8632, https://doi.org/10.1016/j.atmosenv.2007.07.029, 2007.
Tsai, S. M., Zhang, J. J., Smith, K. R., Ma, Y., Rasmussen, R. A., and Khalil, M. A. K.: Characterization of Non-methane Hydrocarbons Emitted from Various Cookstoves Used in China, Environ. Sci. Technol., 37, 2869–2877, 2003.
US EPA: Photochemical Assessment Monitoring Stations (PAMS), available at: https://www3.epa.gov/ttnamti1/pamsmain.html (last access: 3 December 2018), 1990.
US EPA: Compendium Method TO-15: Determination of volatile organic compounds in air collected in specially prepared canisters and analyzed by gas chromatography/mass spectrometry, 1999.
US EPA: National air pollutant emission trends 1900–1998, Off. Air Qual. Plann. Stand., Research Triangle Park, N. C, Rep. EPA 454/R-00-002, 2000.
Wang, H., Qiao, Y., Chen, C., Lu, J., Qiao, L., and Lou, S.: Source Profiles and Chemical Reactivity of Volatile Organic Compounds from Solvent Use in Shanghai, China, Aerosol Air Qual. Res., 14, 301–310, https://doi.org/10.4209/aaqr.2013.03.0064, 2014.
Wang, H.-L., Jing, S.-A., Lou, S.-R., Hu, Q.-Y., Li, L., Tao, S.-K., Huang, C., Qiao, L.-P., and Chen, C.-H.: Volatile organic compounds (VOCs) source profiles of on-road vehicle emissions in China, Sci. Total Environ., 607–608, 253–261, https://doi.org/10.1016/j.scitotenv.2017.07.001, 2017a.
Wang, M., Shao, M., Lu, S.-H., Yang, Y.-D., and Chen, W.-T.: Evidence of coal combustion contribution to ambient VOCs during winter in Beijing, Chin. Chem. Lett., 24, 829–832, https://doi.org/10.1016/j.cclet.2013.05.029, 2013.
Wang, M., Shao, M., Chen, W., Lu, S., Liu, Y., Yuan, B., Zhang, Q., Zhang, Q., Chang, C.-C., Wang, B., Zeng, L., Hu, M., Yang, Y., and Li, Y.: Trends of non-methane hydrocarbons (NMHC) emissions in Beijing during 2002–2013, Atmos. Chem. Phys., 15, 1489–1502, https://doi.org/10.5194/acp-15-1489-2015, 2015.
Wang, Q., Li, S., Dong, M., Li, W., Gao, X., Ye, R., and Zhang, D.: VOCs emission characteristics and priority control analysis based on VOCs emission inventories and ozone formation potentials in Zhoushan, Atmos. Environ., 182, 234–241, 2018.
Wang, T., Xue, L., Brimblecombe, P., Lam, Y. F., Li, L., and Zhang, L.: Ozone pollution in China: A review of concentrations, meteorological influences, chemical precursors, and effects, Sci. Total Environ., 575, 1582–1596, https://doi.org/10.1016/j.scitotenv.2016.10.081, 2017b.
Wang, X.-M., Sheng, G.-Y., Fu, J.-M., Chan, C.-Y., Lee, S.-C., Chan, L. Y., and Wang, Z.-S.: Urban roadside aromatic hydrocarbons in three cities of the Pearl River Delta, People's Republic of China, Atmos. Environ., 36, 5141–5148, 2002.
Wei, W., Cheng, S., Li, G., Wang, G., and Wang, H.: Characteristics of ozone and ozone precursors (VOCs and NOx) around a petroleum refinery in Beijing, China, J. Environ. Sci.-China, 26, 332–342, https://doi.org/10.1016/s1001-0742(13)60412-x, 2014.
Wu, R. and Xie, S.: Spatial Distribution of Ozone Formation in China Derived from Emissions of Speciated Volatile Organic Compounds, Environ. Sci. Technol., 51, 2574–2583, https://doi.org/10.1021/acs.est.6b03634, 2017.
Xue, Y., Ho, S. S. H., Huang, Y., Li, B., Wang, L., Dai, W., Cao, J., and Lee, S.: Source apportionment of VOCs and their impacts on surface ozone in an industry city of Baoji, Northwestern China, Sci. Rep., 7, 9979, https://doi.org/10.1038/s41598-017-10631-4, 2017.
Yan, Y., Peng, L., Li, R., Li, Y., Li, L., and Bai, H.: Concentration, ozone formation potential and source analysis of volatile organic compounds (VOCs) in a thermal power station centralized area: A study in Shuozhou, China, Environ. Pollut., 223, 295–304, https://doi.org/10.1016/j.envpol.2017.01.026, 2017.
Yuan, B., Shao, M., de Gouw, J., Parrish, D. D., Lu, S., Wang, M., Zeng, L., Zhang, Q., Song, Y., Zhang, J., and Hu, M.: Volatile organic compounds (VOCs) in urban air: How chemistry affects the interpretation of positive matrix factorization (PMF) analysis, J. Geophys. Res.-Atmos., 117, 117, D24302, https://doi.org/10.1029/2012jd018236, 2012.
Zhang, Z., Wang, X., Zhang, Y., Lu, S., Huang, Z., Huang, X., and Wang, Y.: Ambient air benzene at background sites in China's most developed coastal regions: exposure levels, source implications and health risks, Sci. Total Environ., 511, 792–800, https://doi.org/10.1016/j.scitotenv.2015.01.003, 2015.
Zhu, Y., Yang, L., Chen, J., Wang, X., Xue, L., Sui, X., Wen, L., Xu, C., Yao, L., Zhang, J., Shao, M., Lu, S., and Wang, W.: Characteristics of ambient volatile organic compounds and the influence f biomass burning at a rural site in Northern China during summer 2013, Atmos. Environ., 124, 156–165, https://doi.org/10.1016/j.atmosenv.2015.08.097, 2016.


