the Creative Commons Attribution 4.0 License.
the Creative Commons Attribution 4.0 License.
 | 29 Apr 2019
Insights into the morphology of multicomponent organic and inorganic aerosols from molecular dynamics simulations
Katerina S. Karadima
Vlasis G. Mavrantzas
Spyros N. Pandis
We explore the morphologies of multicomponent nanoparticles through atomistic molecular dynamics simulations under atmospherically relevant conditions. The particles investigated consist of both organic (cis-pinonic acid – CPA, 3-methyl-1,2,3-butanetricarboxylic acid – MBTCA, n-C20H42, n-C24H50, n-C30H62 or mixtures thereof) and inorganic (sulfate, ammonium and water) compounds. The effects of relative humidity, organic mass content and type of organic compound present in the nanoparticle are investigated. Phase separation is predicted for almost all simulated nanoparticles either between organics and inorganics or between hydrophobic and hydrophilic constituents. For oxygenated organics, our simulations predict an enrichment of the nanoparticle surface in organics, often in the form of islands depending on the level of humidity and organic mass fraction, giving rise to core–shell structures. In several cases the organics separate from the inorganics, especially from the ions. For particles containing water-insoluble linear alkanes, separate hydrophobic and hydrophilic domains are predicted to develop. The surface partitioning of organics is enhanced as the humidity increases. The presence of organics in the interior of the nanoparticle increases as their overall mass fraction in the nanoparticle increases, but this also depends on the humidity conditions. Apart from the organics–inorganics and hydrophobics–hydrophilics separation, our simulations predict a third type of separation (layering) between CPA and MBTCA molecules under certain conditions.
- Article
(7358 KB) - Full-text XML
-
Supplement
(3521 KB) - BibTeX
- EndNote


Atmospheric aerosol particles exert a major impact on human health (World Health Organization, 2016), air quality (Fuzzi et al., 2015) and visibility (Wang et al., 2015). They also impact Earth's radiation balance, and consequently global climate, but their contribution to climate forcing remains highly uncertain (IPCC, 2013).
Atmospheric particles typically contain both organic and inorganic compounds. The fine inorganic mass fraction is mainly inorganic salts, with ammonium sulfate being the most abundant (Zhang et al., 2007). The contribution of organics to sub-micrometre atmospheric particulate matter mass can be as high as 90 %. The thousands of atmospherically relevant organic compounds differ significantly in volatility, solubility and other physicochemical properties, and their complexity hinders our overall understanding of atmospheric organic aerosols (Glasius and Goldstein, 2016).
During its lifetime, atmospheric particulate matter evaporates or grows by condensation but also undergoes chemical transformations due to a number of heterogeneous reactions (Buseck and Adachi, 2008; Seinfeld and Pandis, 2006). Aerosol phase and morphology, among others, can play a significant role in these processes. Specific morphologies, such as coating by organic films, may affect water uptake (Davies et al., 2013) and the rate of heterogeneous reactions (Folkers et al., 2003; Zhou et al., 2012). Recent studies (Sareen et al., 2013; Ruehl and Wilson, 2014) have presented evidence that a hydrophobic organic-rich surface results in lower surface tension for the particle and increases the particle hygroscopicity, even for partial surface coverage (Ovadnevaite et al., 2017). Aerosol microstructure can also have a strong effect on bulk and interfacial diffusion rates (Shiraiwa et al., 2011) or on processes such as light scattering and absorption (Takahama et al., 2010; Zhang and Thompson, 2014).
Several types of morphologies and different phase states have been observed in ambient particles or model systems. Virtanen et al. (2010) reported that biogenic secondary organic aerosol (SOA) particles often exist in an amorphous solid state. On the other hand, the majority of the highly oxygenated or secondary organic particles investigated by Bahadur et al. (2010) and Takahama et al. (2010) were liquid-like and almost spherical, and carboxylic surface enrichment was observed. Enhanced surface partitioning compared with the bulk has also been reported by Werner et al. (2016) for succinic acid. The hydrophobic D62-squalene and α-pinene oxidation products form separate phases in the form of a core–shell morphology according to Robinson et al. (2015). Veghte et al. (2014) have observed homogeneous morphologies for highly water-soluble dicarboxylic acids and partially engulfed ones for acids with limited solubility. Partially engulfed phases have also been reported by Dennis-Smither et al. (2012) in deliquesced oleic acid particles. Reid et al. (2011) stressed the importance of morphologies that include hydrophilic and hydrophobic domains of partially engulfed structures.
Aerosol particle morphology and phase state are often reported to be humidity-dependent (Dennis-Smither et al., 2012; Werner et al., 2016). In between the several humidity cycles (efflorescence and deliquescence) that the aerosol particles undergo, liquid–liquid phase separation may occur (Bertram et al., 2011; O'Brien et al., 2015; You et al., 2012) with one liquid phase rich in organic and the other rich in inorganic (water and inorganic salts). The liquid–liquid phase separation of organic aerosols is usually explained as a salting-out effect: the decreased solubility of organics in water due to inorganic salts present forces them to accumulate together into a separate phase (Bertram et al., 2011; You et al., 2014). Renbaum-Wolff et al. (2016) reported that liquid–liquid phase separation is possible in the absence of inorganic salts and under high relative humidity conditions. Among several factors (such as the O : C ratio, functional groups in the organic compounds, organic-to-inorganic mass ratio, type of inorganic salts present, temperature and particle size) that influence liquid–liquid phase separation, the O : C appears to be the most important (Song et al., 2012; 2013; You et al., 2014; You and Bertram, 2015). Liquid–liquid phase separation has always been reported for organic compounds with O : C lower than 0.5, while it has never been observed for values of O : C higher than 0.8. For intermediate values of the O : C, liquid–liquid phase separation depends on the types of functional groups present.
Some air-quality models assume a single phase composed of organics, inorganics and water (Pun et al., 2003). In others, two separated phases, an organic and an aqueous, are assumed (Koo et al., 2003). A number of detailed studies suggest, though, that these assumptions represent oversimplifications and can affect the model predictions for the partitioning of semi-volatile compounds between the gas and particulate phases as well as the particle properties. Thermodynamic models can predict the morphology of mixed organic–inorganic aerosol particles based on calculations of the total surface free energy of the different phases (Kwamena et al., 2010; Reid et al., 2011; Qiu and Molinero, 2015). Models that describe the formation of surface films by fatty acids on the aerosol surface (Seidl, 2000) have also been proposed. Complex multicomponent aerosol systems are typically described by thermodynamic (Zuend et al., 2010; Zuend and Seinfeld, 2012) or kinetic models (Shiraiwa et al., 2013). The last study highlighted the importance of the phase state and particle morphology or microstructure on gas-particle partitioning; it has also questioned a number of common assumptions typically invoked by some aerosol models, such as the ideal mixing approximation of organics (namely that organic compounds form ideal mixtures with other organics, inorganic salts and water) and the assumption of an instantaneous equilibrium established between gas and particle phases. Zuend et al. (2010, 2012) explored the effect of the ideal mixing and single-phase assumptions on the particulate phase chemistry, gas-particle partitioning predictions and aerosol composition.
By addressing the detailed molecular structure and motion at the level of individual atoms, molecular dynamics (MD) can provide unique information on molecular organization, morphology and microscopic dynamics of ultrafine aerosol. Previous applications of the MD method (Chakraborty and Zachariah, 2011; Hede et al., 2011; Li et al., 2010; Ma et al., 2011) have examined slabs or particles composed only of organic acids and water. More recently, Liyana-Arachchi et al. (2014) explored salt–water slab interfaces with normal alkanes and sodium dodecyl sulfate, while Hudait and Molinero (2014) studied the internal structure of ice-crystallized ultrafine water–salt aerosols. MD was also used by Qiu and Molinero (2015) to verify predictions regarding the liquid–liquid phase separation of nonane and water droplets. In the last two studies, a united-atom representation was invoked.
The types of particle morphologies observed so far include partial engulfing, core–shell morphology with an inorganic core and an organic coating, several intermediate (mixed) formations such as surfaces enriched in organics, morphologies with additional inorganic or organic (liquid, semi-solid or solid) inclusions and morphologies characterized by concentration gradients. However, the conditions under which these morphologies appear are not as yet clear. In the present work, we investigate the morphology and microstructure of aerosol nanoparticles through MD simulations under atmospherically relevant conditions. We focus on particles composed of organic–inorganic mixtures under prespecified conditions of relative humidity corresponding to freshly formed or aged, primary or secondary aerosol. Our emphasis is on the local microscopic structure and overall molecular organization (morphology) of the formed nanoparticles as well as on the key microscopic interactions that lead to these structures. We focus on the effects of relative humidity, type of organic compound present and organic mass fraction on nanoparticle structure.
2.1 Particle components
Five organic compounds with different physicochemical properties were selected and studied (either separately or in mixtures) as representatives of the organic content of atmospheric particles. They include cis-pinonic acid (CPA) or C10H16O3, 3-methyl-1,2,3-butanetricarboxylic acid (MBTCA) or C8H12O6 and the three saturated alkanes n-eicosane or n-C20H42, n-tetracosane or n-C24H50 and n-triacontane or n-C30H62. CPA and MBTCA are oxidation products of monoterpenes (Müller et al., 2012; Zhang et al., 2015) and are used as tracers of biogenic secondary organic aerosol in field measurements (Cheng et al., 2011; Szmigielski et al., 2007). MBTCA is very soluble in water (solubility about 320 g L−1) (Dette et al., 2014) due to the presence of the three carboxyl groups, while CPA dissolves less (solubility around 3.7 g L−1) (Hyvärinen et al., 2006). The O : C of CPA and MBTCA are 0.3 and 0.75, respectively. On the other hand, the three saturated alkanes (n-C20H42, n-C24H50, n-C30H62), which were selected for their hydrophobic character, are components of anthropogenic but also biogenic primary organic aerosol (Kotianová et al., 2008; Wang et al., 2009). Normal alkanes are water-insoluble organic components (with O : C = 0) and form macroscopic waxy crystals (Qiu and Molinero, 2017; Mavrantza et al., 2001). Water, sulfate and ammonium ions were chosen as the typical inorganic components in our study, while the surrounding atmosphere was represented by nitrogen (N2) and oxygen (O2) at their atmospherically relevant stoichiometry.
In all cases, 200 sulfate anions and 400 ammonium cations were placed in the simulation cell. Depending on the simulation, 10–400 organic molecules and 400–3600 water molecules were also considered. The total number of N2 and O2 molecules, which control the size of the simulation cell in an NpT simulation (Karadima et al., 2017), varied from 300 to 900. The composition of the simulated particles, their corresponding wet and dry organic mass fractions and relative humidity conditions are summarized in Table 1. The organic acids used in the investigated systems are quite weak acids, so their deprotonation has been neglected.
Table 1Parameters and particle characteristics for the MD simulations.

1 All RH values are rounded to the nearest integer. 2 RH calculations using the E-AIM model (bulk equilibrium conditions), considering only the inorganic species. 3 RH was calculated with the E-AIM model (bulk equilibrium conditions) and included the organics, where the ideal solution was assumed. 4 RH was estimated based on the number of water molecules found in the gas phase and the mean cell volume during the last 10 ns of the simulations.
2.2 Simulation conditions and protocol
The Materials and Processes Simulations Platform (MAPS®) (Scienomics SARL, 2015) was used to construct all molecules and ions and to build initial configurations for the systems of interest. The simulations were executed using cubic simulation cells subject to periodic boundary conditions in all three directions with an initial edge length of 150 or 170 Å depending on the total number of molecules and ions considered. Prior to all MD simulations, the initial configuration was subjected to potential energy minimization in order to obtain a structure that is completely free of atom overlaps. The MD simulation was performed in the isothermal–isobaric (NpT) statistical ensemble (at pressure p=1 atm and temperature T=320 K). The NpT statistical ensemble used allows for more precise condensed-phase density calculations and should provide results that correspond better to the real atmosphere. The relatively high temperature was chosen to ensure ergodicity of the MD simulations (Karadima et al., 2017), as dynamics can become prohibitively slow at lower temperatures. The effect of this choice will be addressed in selected sensitivity simulations. The Nosé–Hoover thermostat–barostat (Hoover, 1985, 1986; Nosé, 1984) and the velocity–Verlet integrator (Verlet, 1967, 1968) were employed, with the integration time step for the dynamic equations of motion set equal to 1 fs. All simulations were performed with the open-source software Large-scale Atomic/Molecular Massively Parallel Simulator (LAMMPS) (Plimpton, 1995). The total simulation time was in all cases 60 ns, of which only the last 10 ns were used for analysis, with atomic positions stored every 10 ps. For the visualization of the simulation trajectories, the open-source software BIOVIA Discovery Studio® Visualizer (Dassault Systèmes BIOVIA Discovery Visualizer Studios, 2016) was used.
The all-atom OPLS (optimized potentials for liquid simulations) force field (Jorgensen and Tirado-Rives, 1988) was adopted, except for sulfate ions, where the OPLS parameters were modified as described by Karadima et al. (2017). All parameters are available at the Supplement of Karadima et al. (2017). Additional parameters for MBTCA can be found in the Sect. S1 of the Supplement of the current study. The SPC/E model (Berendsen et al., 1987) was used for water and a two-site model (Tsolou and Mavrantzas, 2008; Wang et al., 2013) was adopted for treating nitrogen and oxygen molecules. SPC/E is a simple water model with low computational cost and includes a term for the corresponding polarization energy. The bond lengths of water, nitrogen and oxygen molecules and the bond bending angles of water molecules were kept constant in the simulations using the SHAKE algorithm (Miyamoto and Kollman, 1992). The particle–particle particle–mesh (PPPM) method (Eastwood et al., 1980) was employed for computing electrostatic interactions with calculations carried out in real space up to 14 Å and in the reciprocal Fourier space beyond that. The van der Waals interactions were modelled with a 12–6 Lennard–Jones potential up to 12 Å and a switching-shift function (Brooks et al., 1983) between 12 and 14 Å. Special interactions and Lennard–Jones pair coefficients between different types of atoms were calculated following the mixing rules as prescribed by the OPLS force field (Jorgensen and Tirado-Rives, 1988).
Aerosol nanoparticles were allowed to form by following the procedure outlined in detail in Karadima et al. (2017). Briefly, the nanoparticle was allowed to form spontaneously in the course of the MD simulation, starting from an initial system configuration wherein molecules had been placed randomly in the simulation cell. Usually, a single nanoparticle formed after 1 to 10 ns of simulation time. Particle equilibration and relaxation were examined by monitoring the time evolution of several quantities: (i) the radius of gyration of the particle, (ii) the mean square displacement of the centres of mass of two molecules/ions with respect to their separation at zero time in the particulate phase and (iii) the time autocorrelation function of the angle formed by the position vectors of two tagged atoms in the organic molecules. Typically, the equilibration period took 20 to 30 ns after particle formation. After the formation of the particle, the system's potential energy decreased gradually and reached a plateau always before the middle of the simulation period. The system's energy fluctuated (±2 %) around this low energy value for at least the second half of the simulation period. Thus, in our study, only the last 10 ns of the simulation were used for the calculation of average values corresponding to a nanoparticle of a fully equilibrated microstructure.
2.3 Particle morphology
The equilibrium value of the relative humidity (RH) for each simulation was estimated using a number of approaches. In the direct approach, we used the concentration of water molecules in the gas phase (Table 1). The results of this approach can be uncertain for systems in which there are only a few molecules in the gas phase. For example, in simulated system no. 25, one additional water molecule in the gas phase would change the estimated RH by 12 %. Also, in this direct approach, one needs to examine and carefully treat the water molecules that are found near the particle surface. In the indirect approach, the equilibrium RH was estimated based on the composition of the particles and the Extended Aerosol Inorganics Model (E-AIM) (Clegg et al., 1992, 1998; Wexler and Clegg, 2002). The estimated RH values (Table 1) are equivalent to the predicted water activity in the particles according to aerosol thermodynamics. We first performed these calculations without including the organics (these RH values are used in this work from Sect. 3 onwards). The RH estimation was repeated by also considering the organics in E-AIM and assuming an ideal solution. This inclusion of the organics leads to 1 %–2 % changes in the RH in most cases (Table 1). The highest effect is observed at low-RH conditions (e.g. simulation no. 20), where the RH changes from 40 % to 31 %. In practically all cases, the directly and indirectly estimated RHs differ by a few percent.
One of the disadvantages of the indirect approach is that is assumes that the effect of the particle size on its thermodynamic properties (kelvin effect) is small. Estimating the surface energy of the particles and thus the magnitude of the kelvin effect is extremely challenging. A number of the examined molecules (e.g. cis-pinonic acid) are well known surfactants. As a result, the magnitude of the kelvin effect, depending on the assumed surface tension, can be from a few percent up to 60 % for the nanoparticles examined here. On the other hand, the similarity of the estimated RH values with the direct and indirect approaches neglecting the kelvin effect suggest that the magnitude of this effect is low for the systems examined here. This could be due to the lowering of the surface tension as the organic molecules accumulate mainly in the particle–vapour interface in this study (see Sect. 3).
In the course of the MD simulations, the shape of the formed nanoparticle often deviated from the spherical one, being closer to an ellipsoid. To quantify its degree of sphericity (or, equivalently, asphericity), we computed its three major semi-axes from its mass inertia tensor (Goldstein et al., 2007). Then, to characterize the particle shape, we used the relative shape anisotropy factor κ2 (Theodorou and Suter, 1985) (Table 1). A perfect sphere has a κ2 equal to 0, while values equal to 1 correspond to linear symmetry (Theodorou and Suter, 1985). From the computed values of the three major semi-axes, the volume and average density of the nanoparticle were estimated. From the latter, we next calculated the wet diameter of the corresponding equivalent spherical particle (Table 1).
For the purposes of this study, we considered that the particle volume can be divided in three domains: the particle core (the space around its centre of mass covering 35 % of its volume), the intermediate ring-like region of the particle (the space right after its core covering an additional 35 % of its volume) and the surface of the particle (its outer-most region, with a volume equal to 30 % of the total particle volume). The space division was accomplished by considering the ellipsoidal shape of the particle (Fig. S1) and drawing ellipsoids around its centre of mass with semi-axes defined in proportion to those computed by the mass inertia tensor of the entire particle. According to such a volume division, the thickness of the surface region is limited to 3–10 Å, depending on the exact size of the particle. More details regarding these geometric calculations are available in Sect. S2. The presence of the various molecules in the three domains was quantified by calculating the corresponding percentages of their atoms in these regions. This calculation does not take into account whether all the atoms of a specific molecule are located in the examined region but instead considers only the number of atoms found there. The spatial distribution of atoms inside the particle was also examined by computing radial density profiles (i.e. profiles as a function of radial distance from the centre of mass of the particle).
Spatial correlations between the particle components were quantified through calculations of pair correlation functions (or radial distributions functions), g(r); these functions are appropriately normalized (Allen and Tildesley, 1991) and provide a measure of the probability of finding an atom at a certain distance (within a tolerance) from a reference atom in the particle. The values of these functions at short distances also provide a measure of the degree or strength of local packing in the particle.
The values of all the above-mentioned properties were computed as ensemble averages over the atomistic configurations accumulated during the last 10 ns of the simulation.
3.1 Effect of organic compound type
In the first series of simulations (simulation nos. 1–5 in Table 1), 10 molecules of CPA or MBTCA or one of the three normal alkanes were considered together with 200 sulfate anions, 400 ammonium cations and 400 water molecules. The formed nanoparticles had a low (7 %–14 % dry) organic mass fraction. The relative humidity was 40 % (Table 1) and the equivalent particle diameters were around 4.3 nm, corresponding to a density of 1.4 g cm−3.
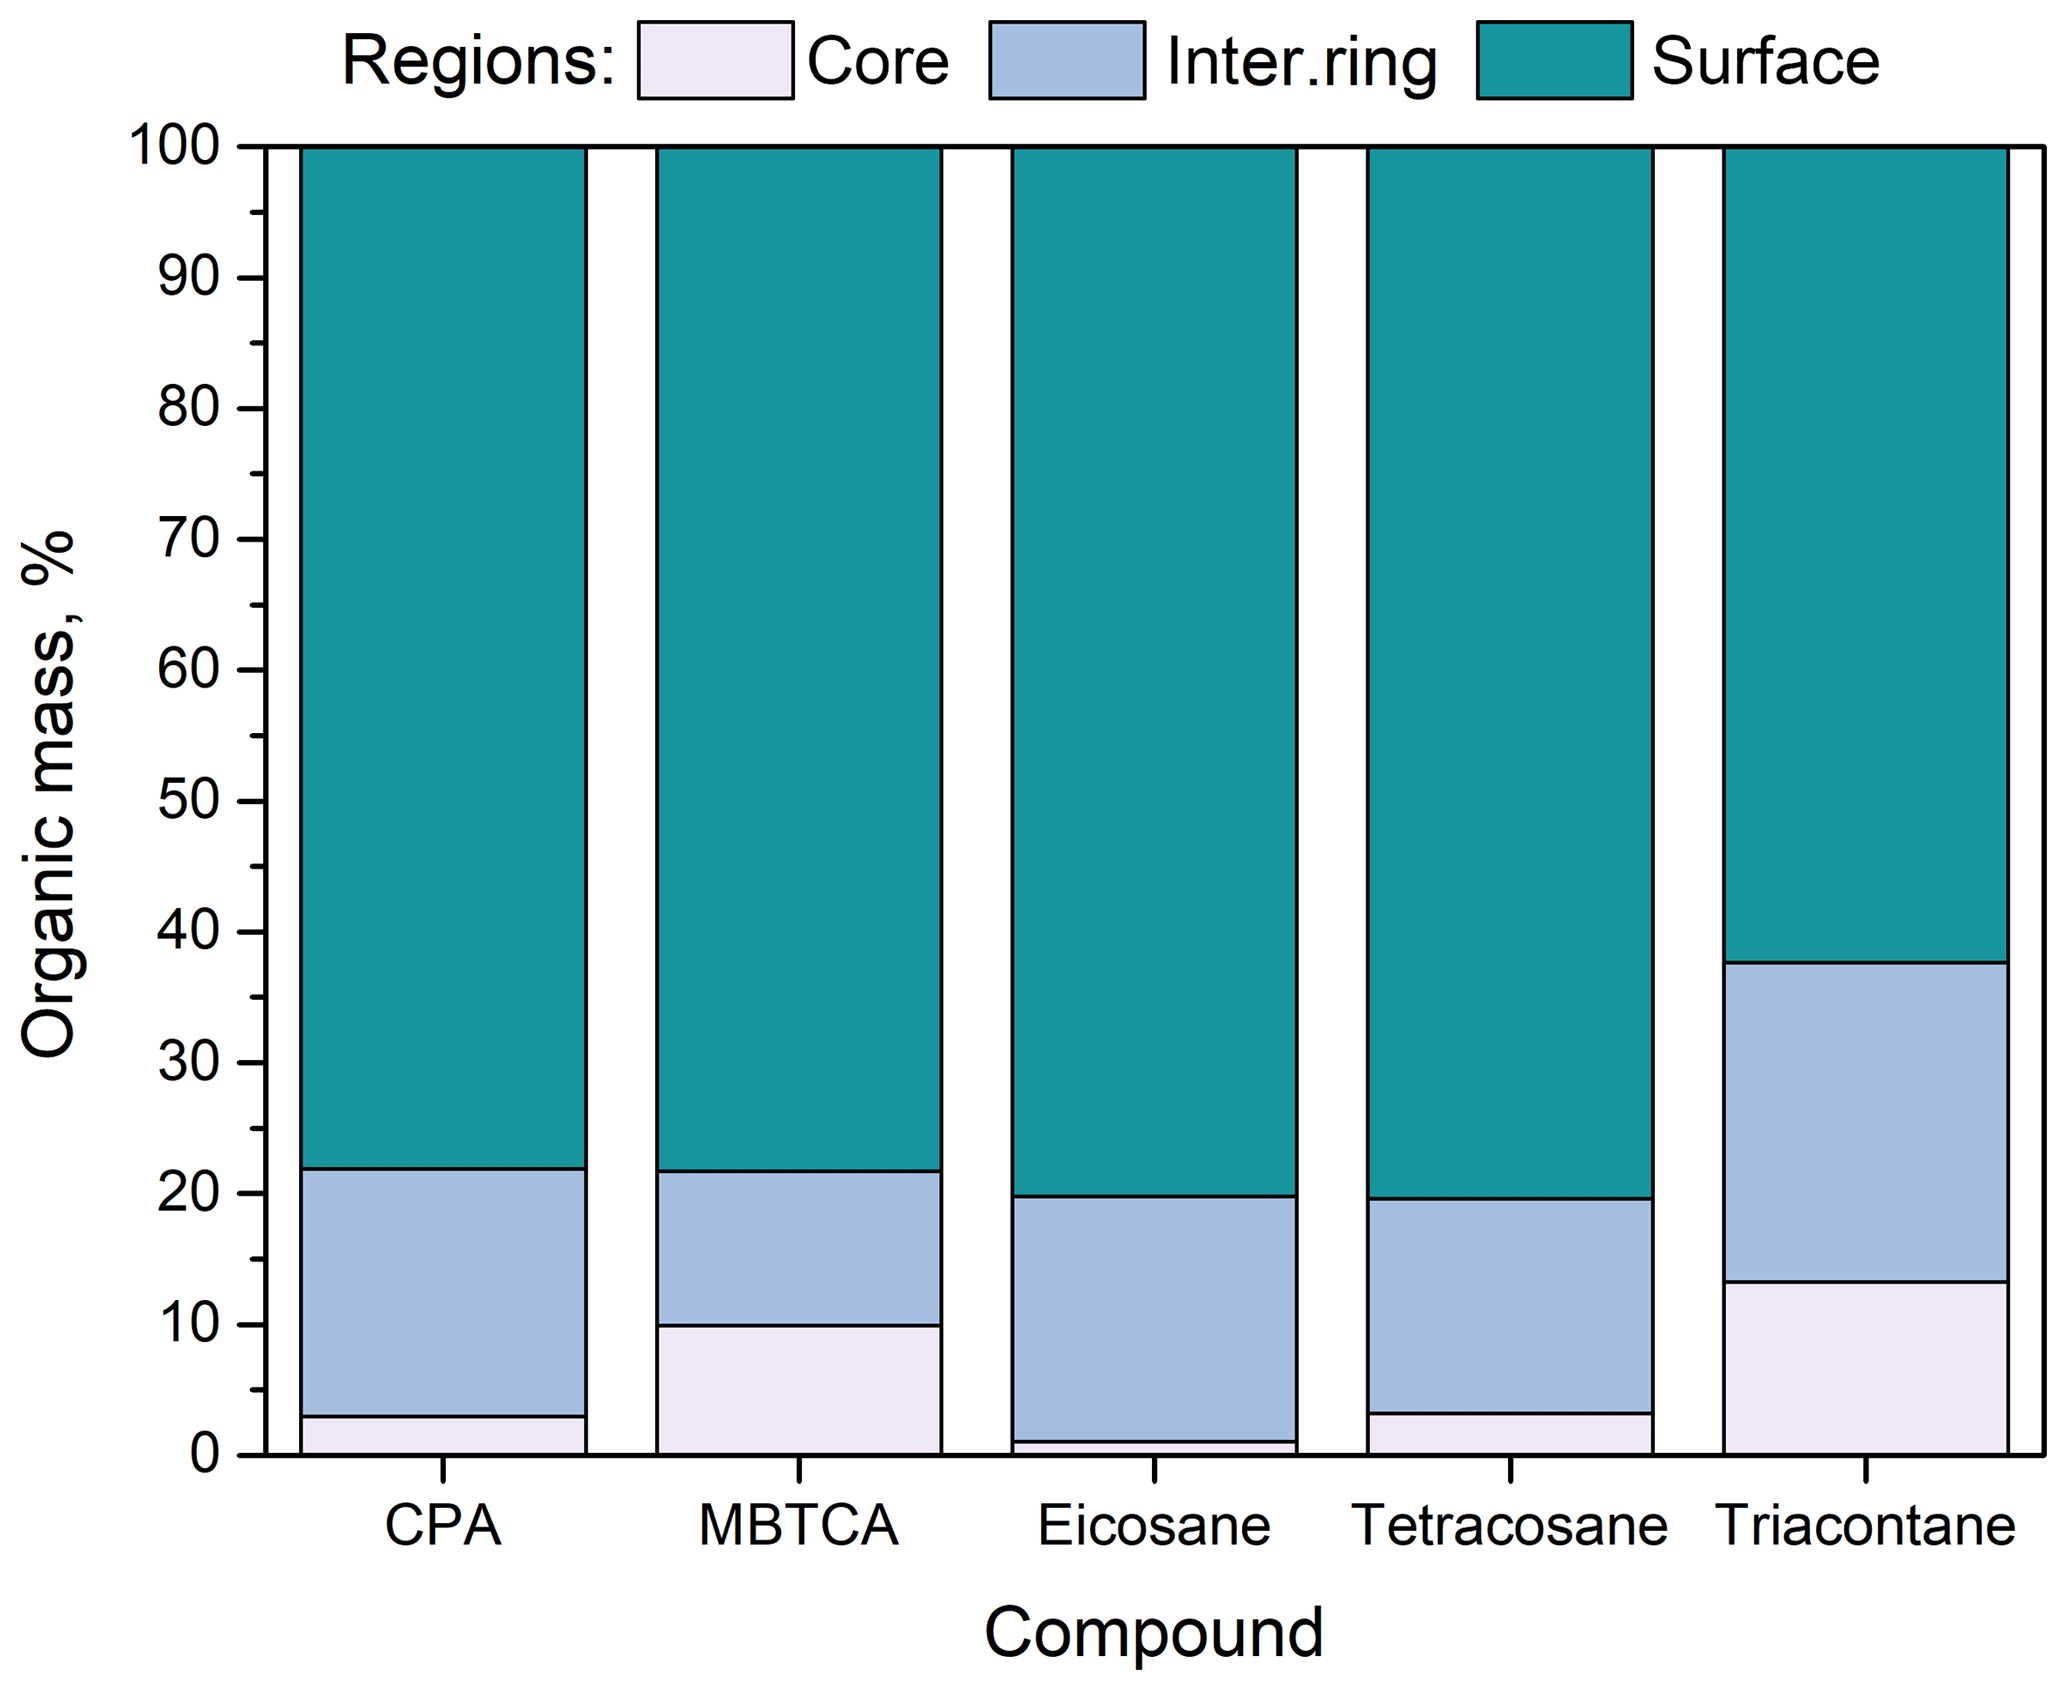
Figure 1Percentage of organic compounds (CPA, MBTCA, n-eicosane, n-tetracosane and n-triacontane) in the three regions (core, intermediate ring, outer surface) of the simulated nanoparticles. Conditions: low organic mass fraction (7 %–14 % dry) and 40 % RH.
In all cases, more than 60 % of the organic molecules were found to reside at the surface of the particle (Fig. 1). N-triacontane was found deeper in the particle with around 40 % of its mass located in the two inner domains; for the rest of the compounds, this percentage was lower, around 20 %. This difference is due to the molecular length of n-triacontane, which makes it comparable to the size of the nanoparticle.
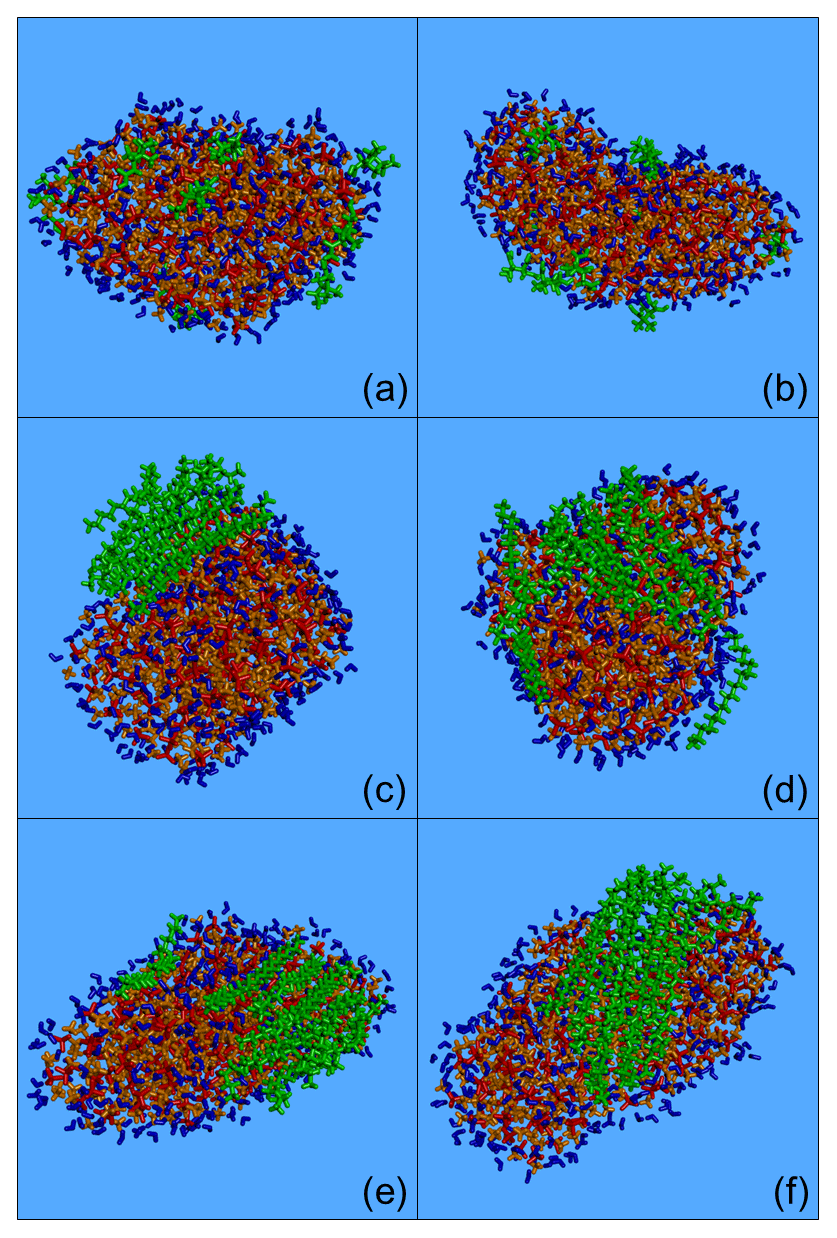
Figure 2Typical snapshots of the nanoparticles composed of (green colour): (a) CPA, (b) MBTCA, (c, d) n-eicosane, (e) n-tetracosane and (f) n-triacontane and sulfate anions (red), ammonium cations (orange) and water molecules (blue) from the MD simulations. Conditions: low organic mass fraction (7 %–14 % dry) and 40 % RH.
Around 10 % of the MBTCA molecules were observed to reside at the core of the particle and another 10 % in the intermediate ring-like domain. The percentage of MBTCA and CPA molecules in these two innermost regions was basically the same, but more MBTCA could be found a little deeper than CPA. This is again a chain-length effect: it is related to the smaller size of MBTCA compared to CPA molecules.
Most of the organic mass for all compound types examined was at the surface. Typical snapshots of these nanoparticles are shown in Fig. 2. The two oxygenated molecules, CPA and MBTCA, were either alone or in groups of 2–3 molecules, forming small neighbourhoods or islands at the surface of the particle (Fig. 2a, b). For the alkanes, organized structures were observed that were more and more robust as the number of carbon atoms increased. The local structures formed by n-eicosane were not stable and broke down during the simulation (Fig. 2c, d). N-tetracosane molecules showed a tendency to pack together, but they were also found at a certain distance from each other (Fig. 2e). N-triacontane molecules, on the other hand, formed a stable, highly organized structure (Fig. 2f).
The morphologies observed for n-eicosane and n-triacontane are consistent with those reported for the NaCl water slabs studied by Liyana-Arachchi et al. (2014). The different alkane structures observed at low organic mass content can be related to their melting points. For n-eicosane this is 310 K (i.e. lower than the simulation temperature), for n-tetracosane it is close to the simulation temperature, and for n-triacontane it is above the simulation temperature (Smolenskii et al., 2002).
Inorganic species were observed in all regions with the core of the particle containing almost exclusively inorganic compounds (Fig. S2). In all three nanoparticle domains (and for all particles studied here), the ratio of ammonium-to-sulfate ions was practically equal to 2 (1.99±0.05), as expected. More than 65 % of the water molecules were in the surface region in all cases and less than 15 % could be found in the particle core (Fig. S3).
For all simulated particles except the n-eicosane-based ones, all organic molecules in the course of the MD simulation remained in the particulate phase. For the n-eicosane simulation, two eicosane molecules were close to migrating from the condensed phase to the gas phase (Fig. S4a, b) and eventually one of them succeeded in jumping from the particulate phase to the gas, where it remained for the rest of the simulation (Fig. S4c, d); the other molecule continued to be in the particle phase. We note that n-eicosane has the highest vapour pressure of all the normal alkanes examined here.
3.2 Effect of relative humidity
The particles discussed in the previous section were at relatively low relative humidity conditions. To investigate the effect of RH on particle morphology, additional simulations were performed under higher RH levels.
3.2.1 CPA-containing particles
We studied the morphology and structure of CPA-containing particles at increasing levels of RH, from 40 to approximately 90 % (simulation nos. 6–9 in Table 1), by increasing the number of water molecules in the simulation cell from 400 to 3200 while keeping the number of CPA molecules (10) and ions (200 sulfate and 400 ammonium ones) constant. The equivalent particle diameter increased with increasing RH, reaching almost 6 nm for the largest particle. The mean particle density decreased from 1.5 g cm−3 at 56 % RH to 1.3 g cm−3 at 89 % RH. The nanoparticles that formed at higher RH were more spherical (the relative shape anisotropy factor κ2 decreased almost to zero; see Table 1).
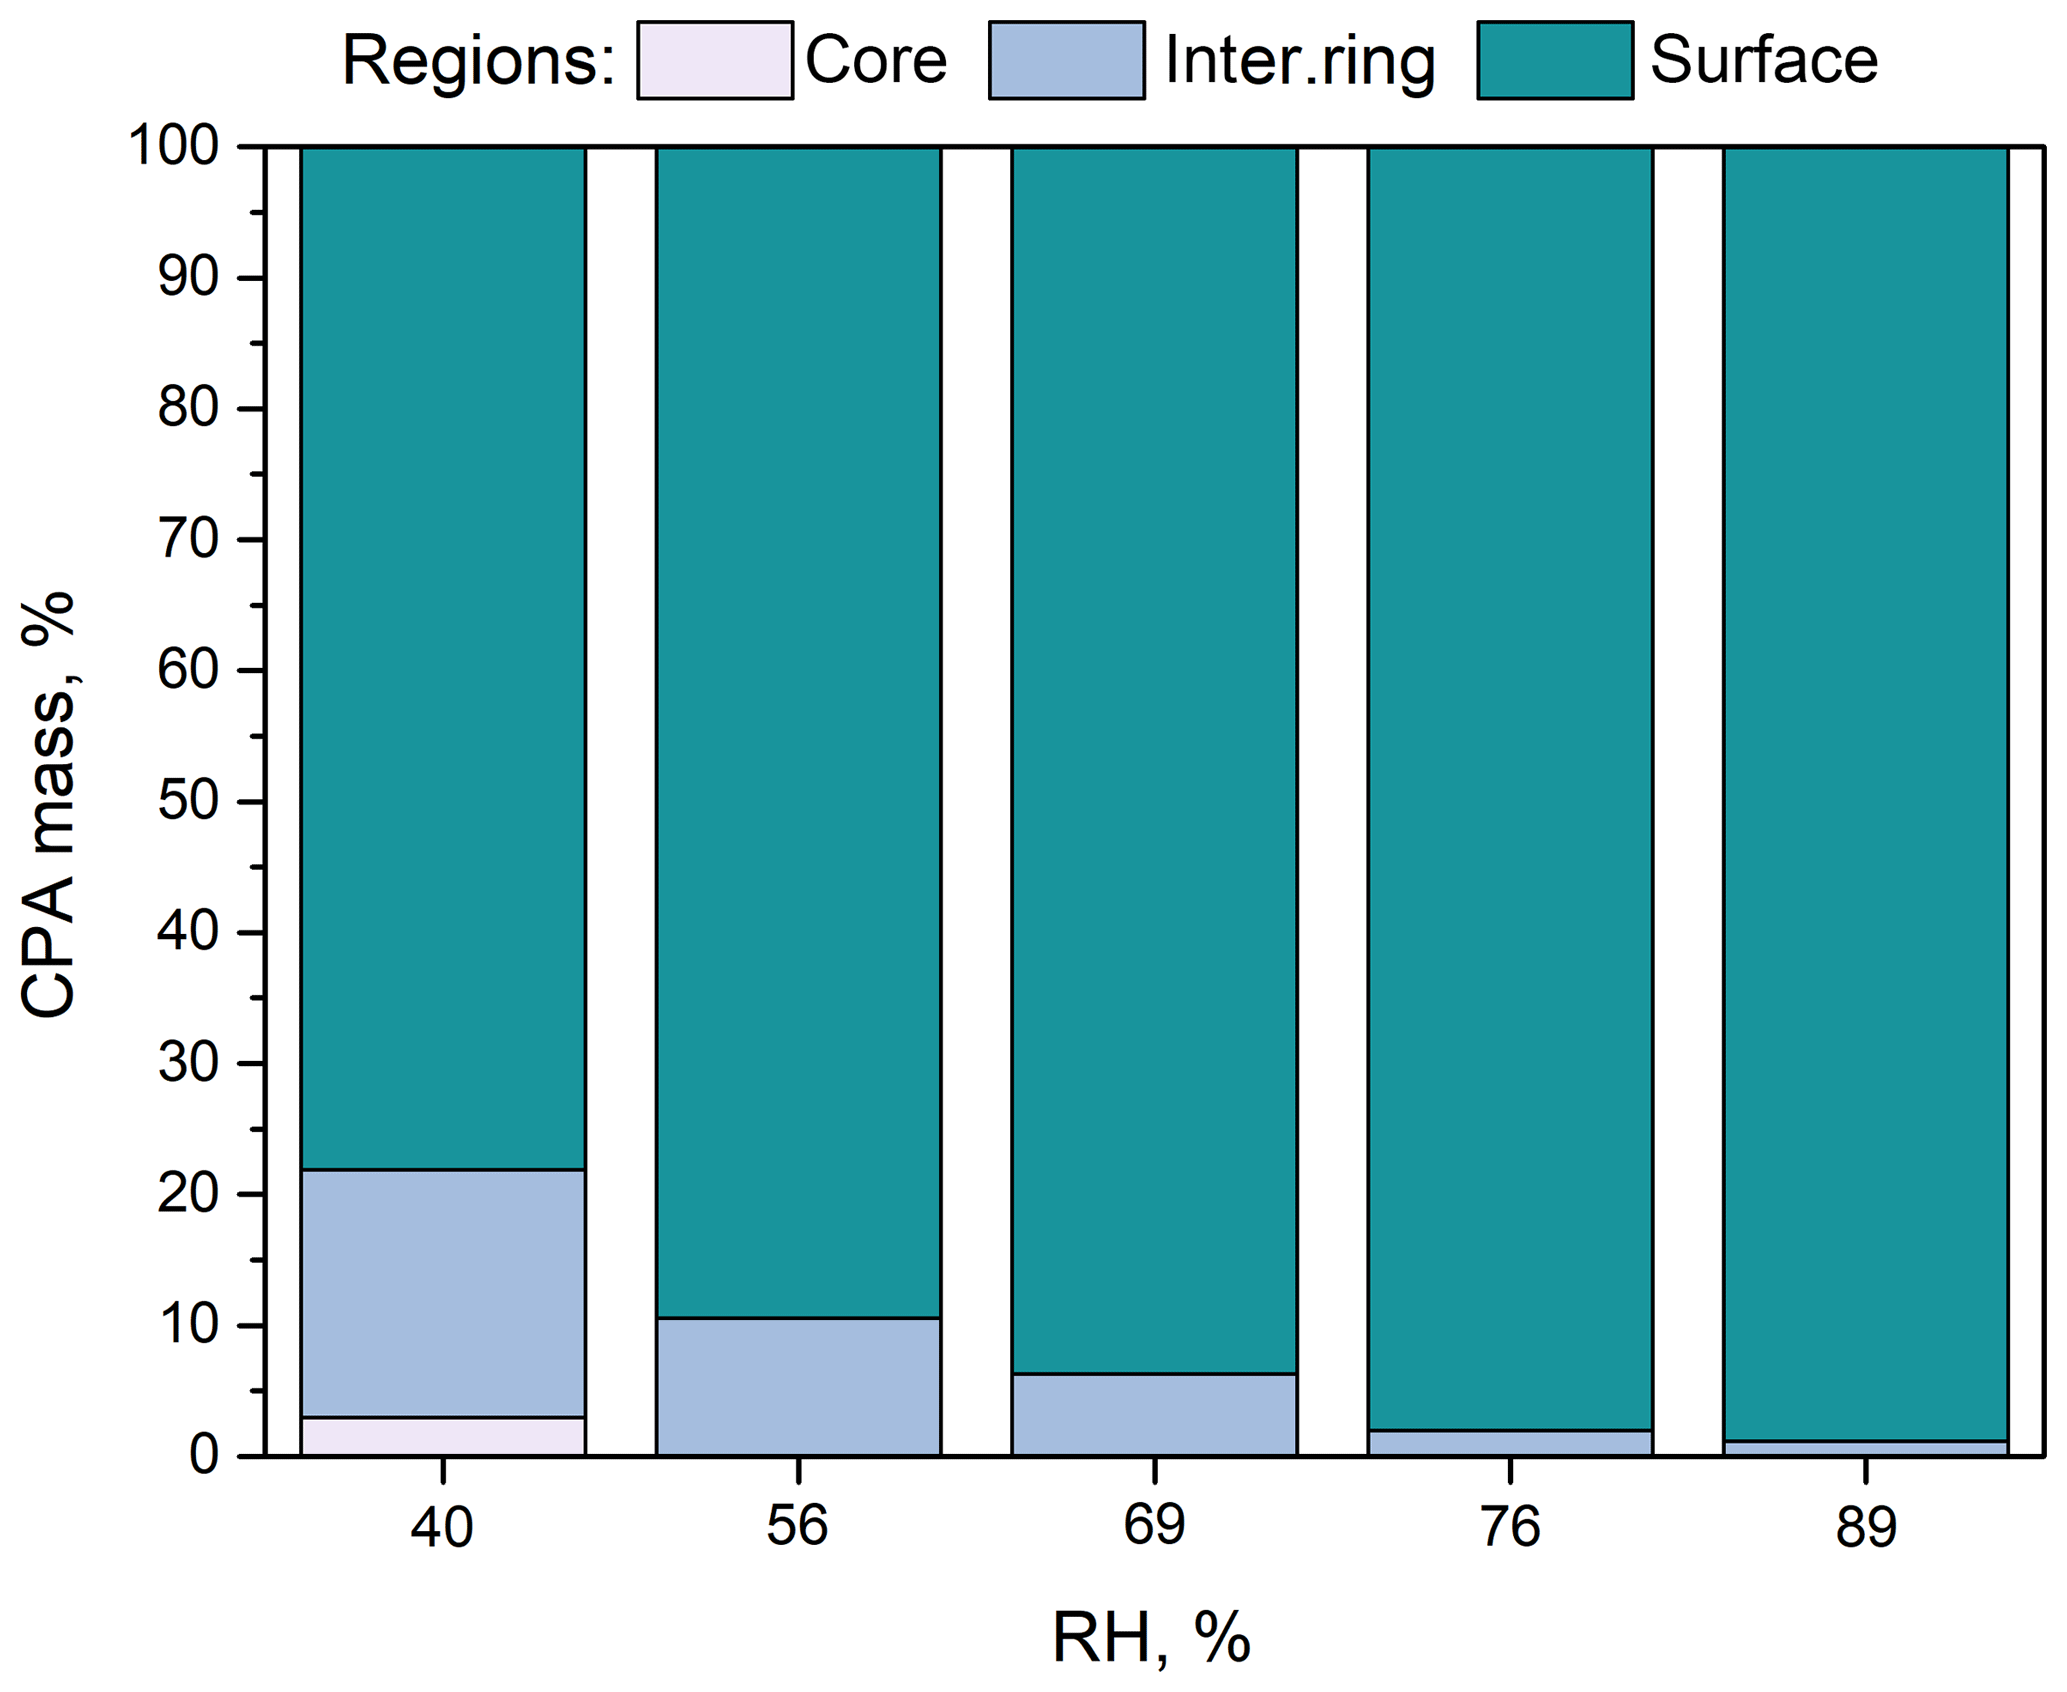
Figure 3Percentage of CPA molecules in the three regions (core, intermediate ring, outer surface) of the simulated nanoparticles with low organic mass content (7 % dry) as a function of RH.
According to our simulations, as the RH increases, less CPA is found in the two innermost domains of the particle (Fig. 3) because the organic molecules move to the surface of the particle (Fig. 4a, b). The fraction of CPA molecules in the outermost region of the particle covering 5 % of its total volume increases from 65 % to 82 % as the RH increases. The accumulation of CPA molecules at the particle surface is further reflected in the corresponding density profiles inside the nanoparticle (Fig. S5). Also, the probability of finding two CPA molecules next to each other is higher at higher RH levels (Fig. S6). CPA is a known surface-active molecule and our findings are consistent with previous studies (Karadima et al., 2017; Li et al., 2010).
For RH greater than 56 %, the particle core contained only ions and water (Fig. S7). This was also true for the intermediate region for RH higher than 76 %. The fraction of water molecules found in the two innermost domains increased as the RH increased (Figs. S7, S8a). According to our simulations, as the water content increases, ions leave the particle surface showing a clear preference for the inner regions (Figs. S7, S8b). Also, as the humidity increases, the ratio of sulfate ions to ammonium ions locally diverges from the nominal value of 2 (Fig. S7). At 89 % RH, there is practically no sulfate at the particle surface but there is a little ammonium present. The distributions of the sulfate and ammonium ions inside the simulated particles are consistent with the MD studies of Gopalakrishnan et al. (2005) and Jungwirth et al. (2005), who used polarizable models for ammonium sulfate aqueous solutions. The repulsion of all the ions from the surface region, the slight preference of ammonium for the surface, and the increased concentrations of ions near the core reported in these studies are also observed here.
Our results suggest that, as the RH increases, the separation between organic molecules and ions becomes more pronounced. The region near the surface accommodates practically all CPA molecules, whereas the ions prefer to reside in the interior domains (the core and the ring). The CPA molecules are either alone or in the form of small islands composed of 2–3 molecules at the surface, although these formations change during the simulation.
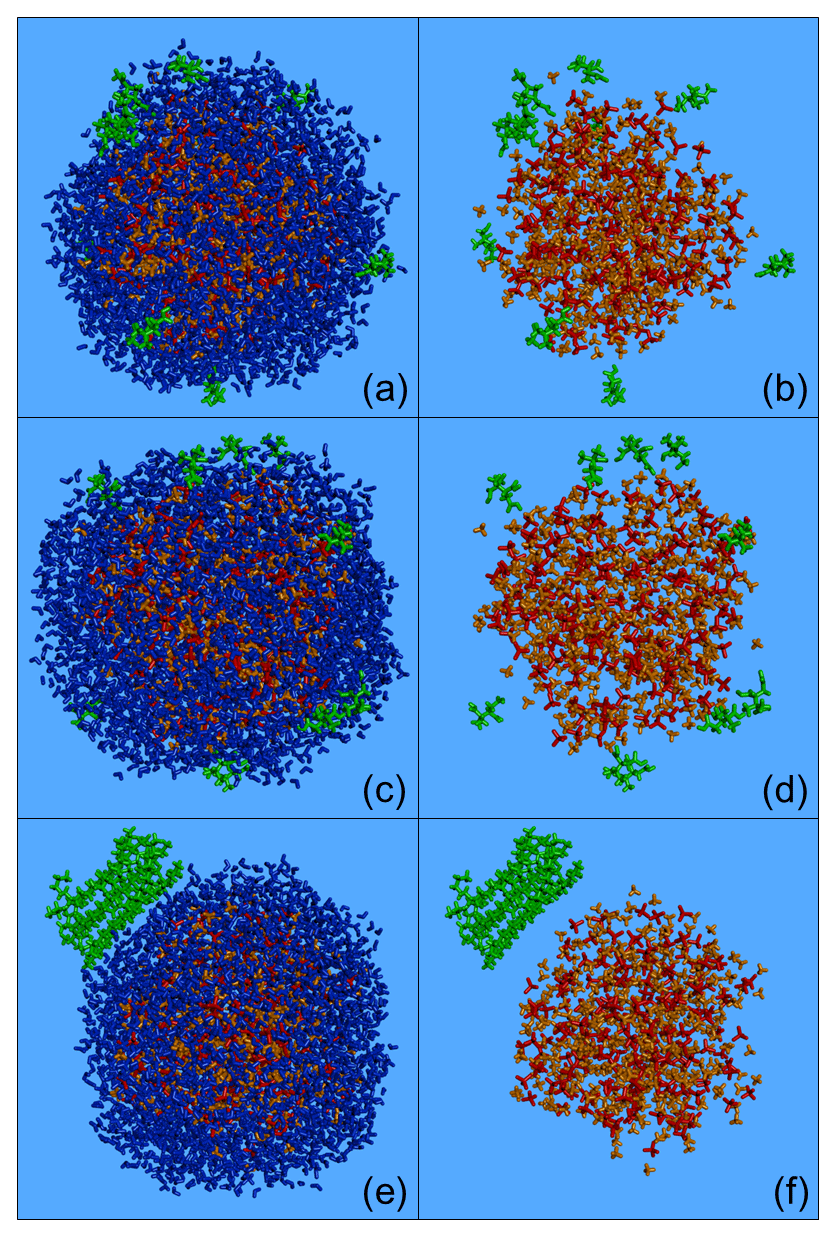
Figure 4Characteristic snapshots from the MD simulations of the nanoparticles containing CPA (a, b), MBTCA (c, d) and n-eicosane (e, f) at low organic mass fraction (7 %–10 %) and 89 % RH, including (a, c, e) and omitting (b, d, f) water molecules. Colour coding: green for CPA, MBTCA and n-eicosane, red for sulfate, orange for ammonium and blue for water.
3.2.2 Particles containing MBTCA and n-alkanes
Particles containing MBTCA, n-eicosane and n-triacontane (7 %–14 %) were also simulated at high RH (approximately 90 %). In our simulations, the formed particles contained 10 organic molecules (MBTCA, n-eicosane or n-triacontane), around 3180 water molecules, 200 sulfate and 400 ammonium ions (simulation nos. 10–12 in Table 1). The resulting particles were almost spherical with an equivalent diameter of about 6 nm and a mass density around 1.3 g cm−3.
A separation between organics and ions was again observed, exactly as in the case of the CPA-containing particles. Organic molecules resided at the surface of the particle either as isolated entities (the MBTCA) or organized in small structures (the normal alkanes) (Figs. 4c–f, S9). In contrast to the CPA-containing particles, no MBTCA islands were observed (Fig. 4c, d). MBTCA contains a shorter alkyl group compared to CPA, plus three carboxyl groups that can easily form hydrogen bonds with the water molecules. On the other hand, alkane molecules preferred to stay close to each other (due to their hydrophobicity) in order to minimize contact with water molecules (Figs. 4e, f, S9). The alkane molecules form a surface lens. Ions are mainly located inside the particle and not at its surface, while water molecules are found everywhere.
The inner particle regions were depleted of organic molecules (Figs. 4c–f, S9–11); the distribution of inorganic species, on the other hand, was similar for all nanoparticles (Fig. S11). The water content was found to increase gradually and smoothly from the core to the surface for all particles (Fig. S12a). The gradient of the water profile is related to ion competition for hydration in the bulk, where they dissolve in the water present in the particle from the outer to the inner regions. Sulfate anions could hardly be found at the surface (Figs. 12b and S11), showing a clear preference for the inner domains of the particle (especially the core). However, some ammonium cations (which in all cases examined here tended to follow the sulfate anions) could be found at the surface (Fig. S11).
3.3 Effect of organic mass
In all previous cases, organics represented less than 15 % of the dry particle mass, which is dominated by ammonium and sulfate ions. In this section, we discuss the effect of increasing organic content on particle morphology and structure at low or intermediate-RH conditions.
3.3.1 CPA-containing nanoparticles
Nanoparticles composed of 100, 200 and 400 CPA molecules (together with 200 sulfate ions, 400 ammonium ions and around 390 water molecules) were simulated. The organic mass fraction of the formed nanoparticles ranged from 7 % to 74 % dry (simulation nos. 1 and 13–15 in Table 1). The particle size increased, and the largest nanoparticle had an equivalent diameter of about 7 nm. The density decreased from 1.4 to 1.1 g cm−3 (Table 1).
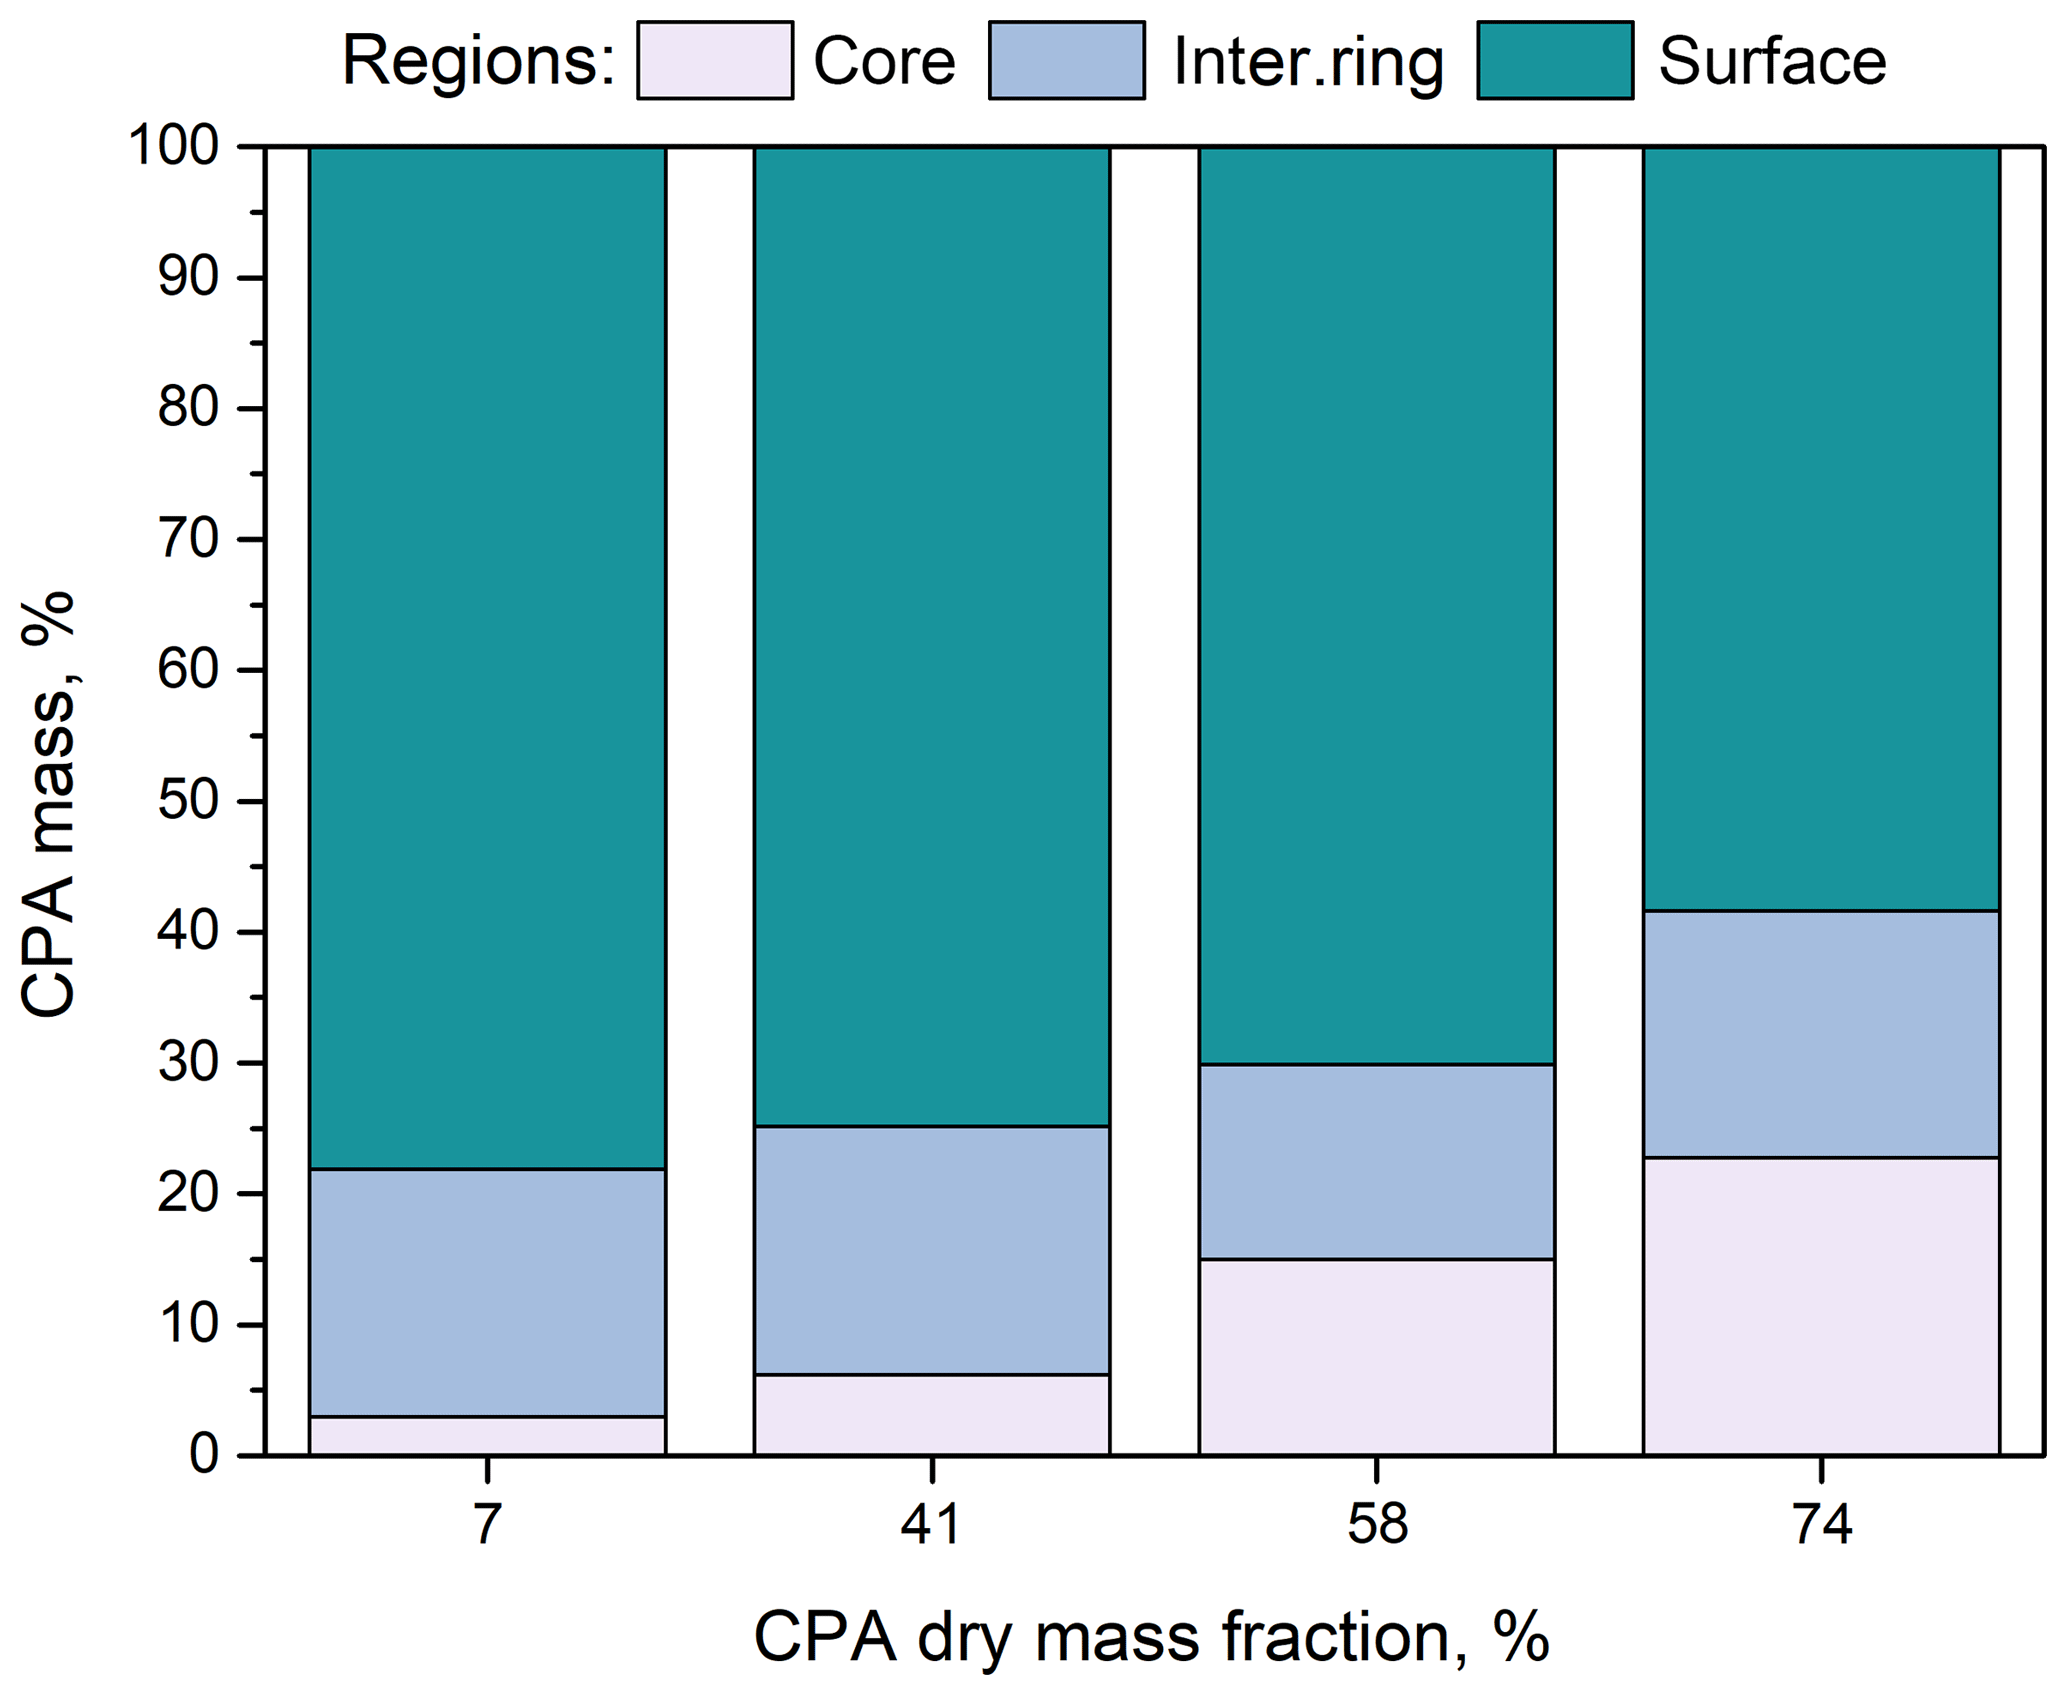
Figure 5Percentage of CPA molecules in the three regions (core, intermediate ring, outer surface) of the simulated nanoparticles as a function of dry organic mass fraction at low-RH conditions.
The percentage of CPA molecules at the particle core increased with increasing organic mass fraction (Fig. 5), but most of the CPA was located at the surface, which caused a shift in the distribution of water molecules towards the interior of the particle (Figs. S13 and 14a) and had only a small effect on the distribution of ions (Fig. S14b). The distribution of water molecules became more uniform as the CPA mass fraction increased. Also, for all organic mass fractions considered, the majority of ions were located at the two inner regions (Fig. S14b).
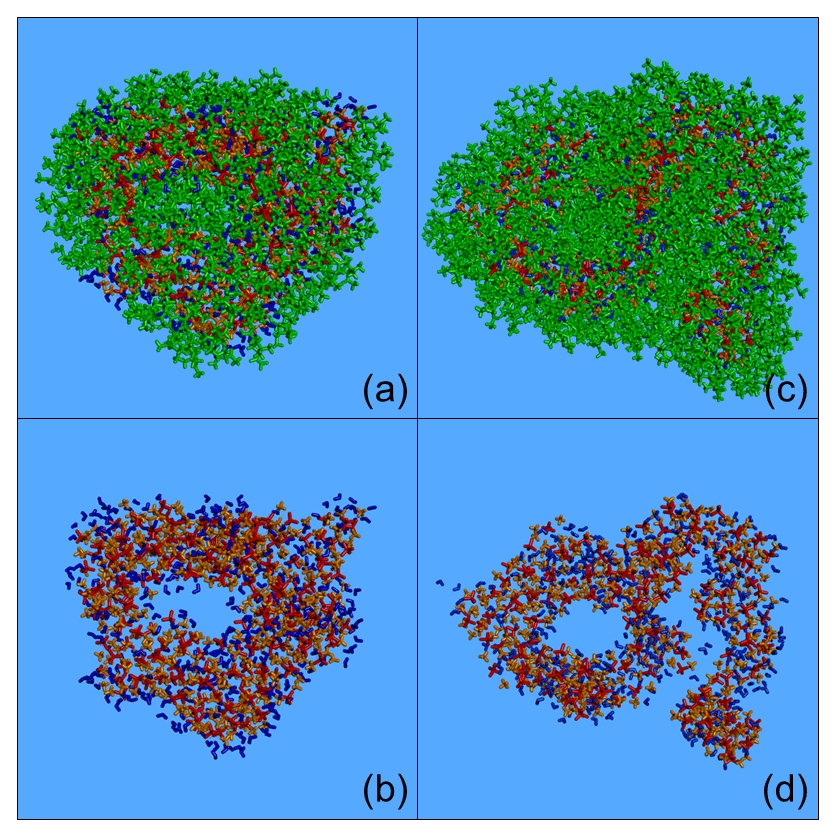
Figure 6Characteristic snapshots from the MD simulations of the two nanoparticles at around 40 % RH, containing CPA: (a) 58 % (dry) including CPA molecules, (b) 58 % (dry) omitting CPA molecules, (c) 74 % (dry) including CPA molecules, and (d) 74 % (dry) omitting CPA molecules. Colour coding: green for CPA, red for sulfate, orange for ammonium and blue for water.
According to Fig. 6, aerosol particles with an intermediate or high organic content can be nonspherical and inhomogeneous. In these particles, CPA molecules prefer to form independent neighbourhoods. Phase separation was again observed, with organic molecules covering the surface of the particle and ions and water molecules residing at the inner domains. The formed nanoparticles are highly inhomogeneous, consisting of an organic layer covering a complex inorganic phase also containing organic inclusions. Increasing the organic mass content forced CPA molecules to move deeper into the nanoparticle (Fig. 6b, d).
3.3.2 MBTCA-containing nanoparticles
The nanoparticle examined here consisted of 100 MBTCA molecules, 200 sulfate ions, 400 ammonium ions and around 390 water molecules. It was characterized by a dry organic mass fraction of 43 %, an equivalent diameter around 5.1 nm and a density equal to 1.3 g cm−3 (simulation no. 16 in Table 1). Increasing the MBTCA content from 7 % to 43 % had a small effect on its distribution: there was a small increase in the number of MBTCA and water molecules at the core of the particle (Fig. S15). The 43 % MBTCA-containing particle was highly inhomogeneous (Fig. S16), with MBTCA molecules also residing inside the particle. This structure is different from that exhibited by the CPA-containing particle at similar compositions, wherein such formations were observed at higher organic mass fractions (58 % and 74 %).
3.3.3 Eicosane-containing nanoparticle
We also examined the effect of increased water content (76 % RH) in a nanoparticle composed mainly of n-eicosane (63 % dry mass). The simulated particle (200 n-eicosane molecules, 200 sulfate ion, 400 ammonium ions and around 1580 water molecules) had an equivalent diameter of 7.4 nm (simulation no. 17 in Table 1).
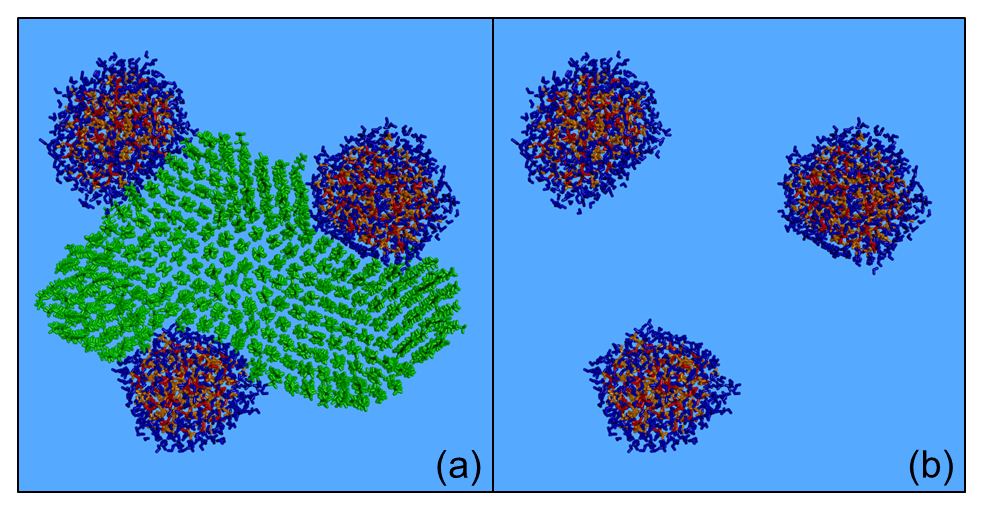
Figure 7Characteristic snapshot from the MD simulation of the nanoparticle containing n-eicosane (63 % dry) at 76 % RH, (a) including and (b) omitting n-eicosane molecules. Colour coding: green for n-eicosane, red for sulfate, orange for ammonium and blue for water.
Eicosane molecules formed a well-organized structure (Fig. 7) characterized by close packing of the eicosane chains in the form of lamellae extending from the core of the nanoparticle to its outer surface along different directions (Figs. 7a and S17). The particle consisted of a continuous organic phase and several separate inorganic and aqueous domains (Fig. 7), resulting in a highly inhomogeneous structure. Alkane molecules could be found everywhere in the particle, which should be contrasted with the case of the eicosane particle at low organic mass fraction and low humidity levels (Fig. S18a). Most of the ions were at the surface and not inside the particle (Fig. S18c).
3.4 Effect of increasing relative humidity at high organic (CPA) mass
Nanoparticles with 74 % dry w/w CPA content were simulated at 40, 76 and 89 % RH (simulation nos. 15, 18 and 19 in Table 1). Their equivalent diameters increased from about 6.8 nm at 40 % RH, to about 6.9 nm at 76 % RH and to about 7.5 nm at 89 % RH. The asphericity of the particles decreased as the RH increased, and it practically vanished at 89 % RH (Table 1).
The effect of an enhanced RH in these particles at high CPA content was similar to that at low-CPA content. The presence of CPA molecules at the surface of the particle was enhanced as the humidity increased. For example, at around 90 % RH, 70 % of the CPA was at the surface of the particle (Fig. 8). In contrast, the concentration of organics in the core was almost zero at around 90 % RH. We also observed the complete absence of ions from the surface of the particle and the low presence of water molecules there (Figs. 8, 9b, d, S19).
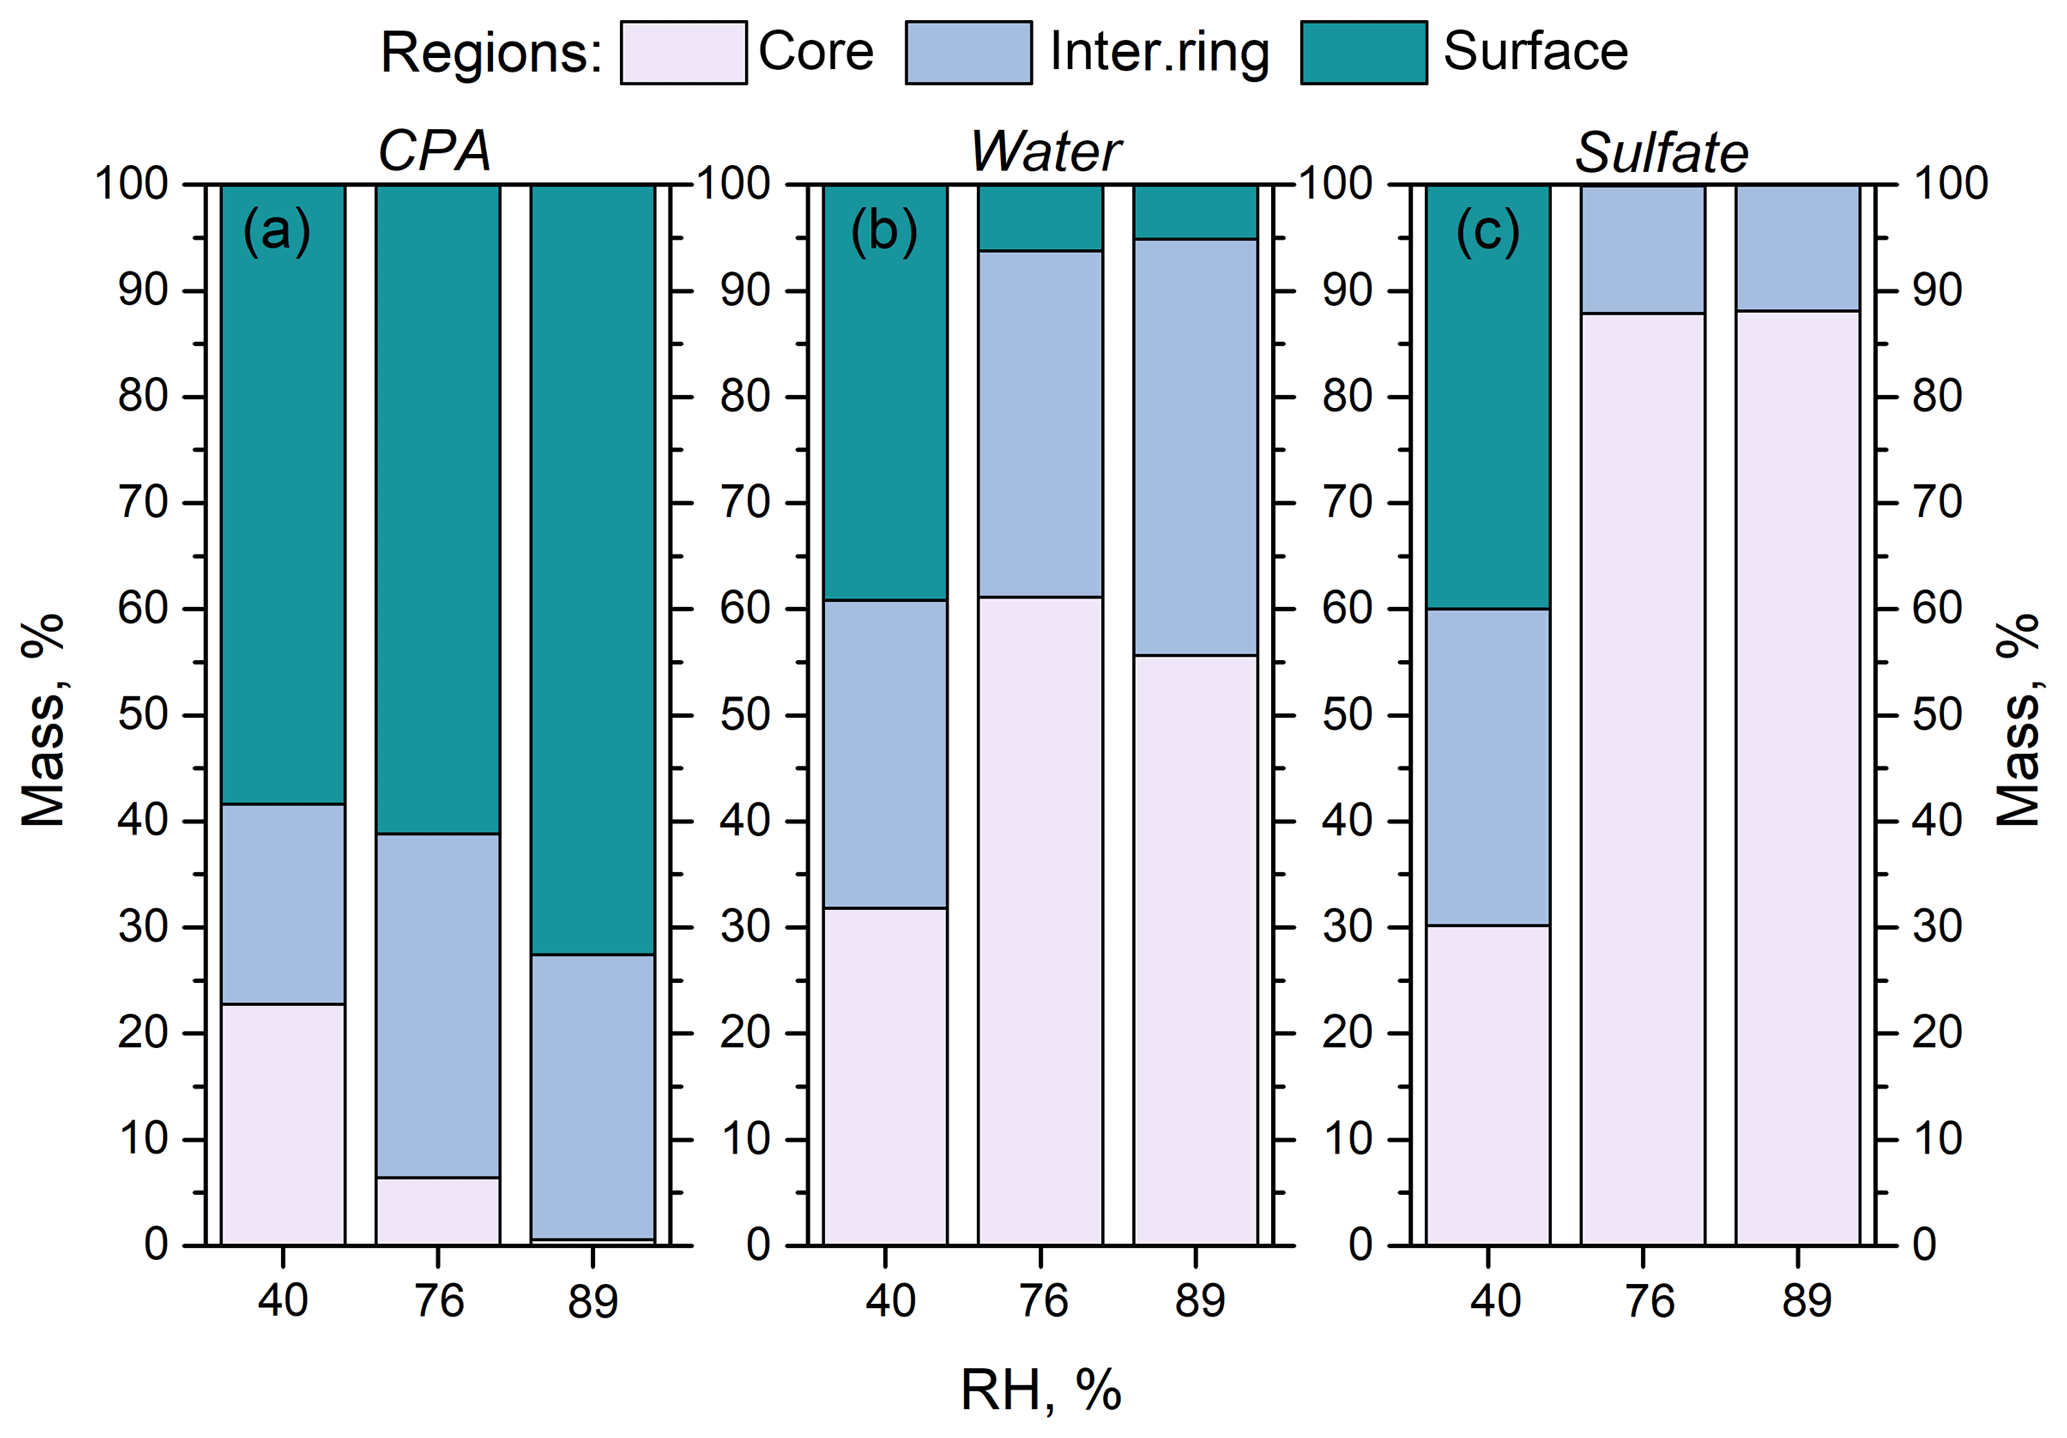
Figure 8Percentage of (a) CPA molecules, (b) water molecules and (c) sulfate ions in the three regions (core, intermediate ring, outer surface) of the simulated nanoparticles, as a function of RH. The dry organic mass content is 74 %.
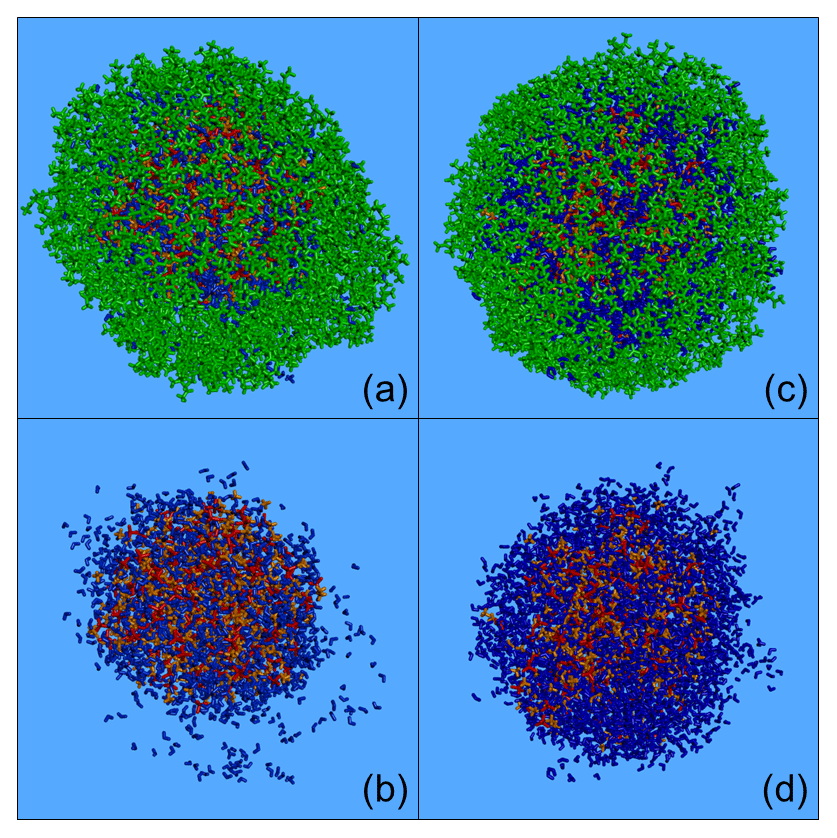
Figure 9Characteristic snapshots from the MD simulations of the nanoparticles containing CPA (74 % dry): (a) at 76 % RH including CPA molecules, (b) at 76 % RH omitting CPA molecules, (c) at 89 % RH including CPA molecules and (d) at 89 % RH omitting CPA molecules. Colour coding: green for CPA, red for sulfate, orange for ammonium and blue for water.
The preference of CPA molecules for the surface of the particle leads to the formation of an organic layer (a coating), resulting in a core–shell morphology as the humidity increases, driven by the salting-out effect (Figs. 9a, c and S19).
3.5 Particles containing multiple organic components
We proceed now to the analysis of the simulation results for particles composed of a mixture of different organic compounds.
3.5.1 CPA and MBTCA mixtures
Particles composed of CPA, MBTCA, sulfate, ammonium and water were simulated (simulation nos. 20–23 in Table 1) at different dry organic contents (43 % and 75 %) and RHs (40 %–90 %). The nanoparticles had an equivalent diameter between 5.2 and 7.5 nm, and their density ranged from 1.2 to 1.3 g cm−3. The particles at higher RH were quite spherical (Table 1).
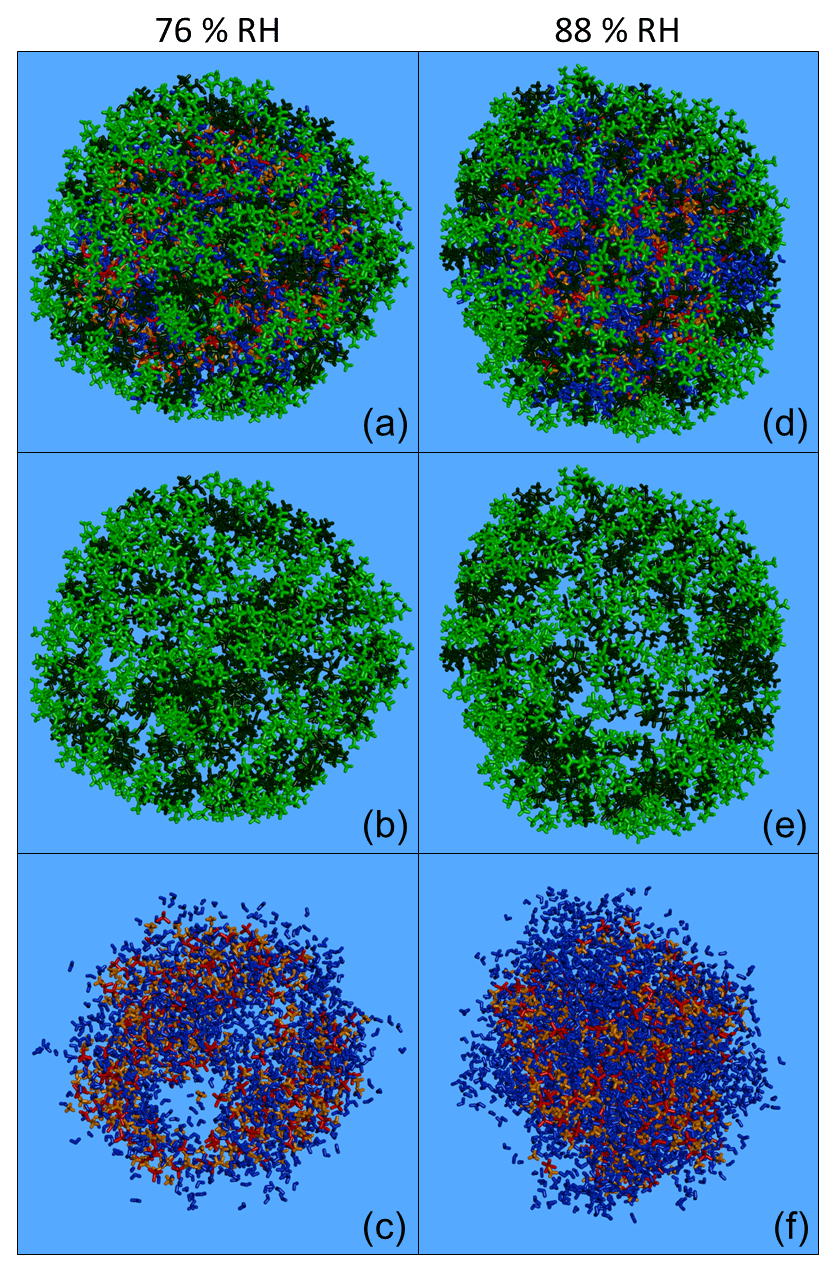
Figure 10Characteristic snapshots from the MD simulations of the nanoparticles containing (dry-mass fraction) 36 % CPA and 39 % MBTCA (a) at 76 % RH, (b) at 76 % RH including only organic molecules, (c) at 76 % RH omitting organic molecules, (d) at 88 % RH, (e) at 88 % RH including only organic molecules and (f) at 88 % RH omitting organic molecules. Colour coding: green for CPA, dark green for MBTCA, red for sulfate, orange for ammonium and blue for water.
In these particles, the increase in humidity and organic mass fraction resulted in a separation of the organic compounds, with the CPA molecules partially covering the MBTCA ones (Fig. 10a–b, d–e). This was less evident in the case of the particle with 43 % organic mass at low RH (Fig. S20a, b), where both types of organics were present at the surface (Fig. S21). However, at a higher RH of approximately 90 % (keeping the organic mass content constant), CPA and MBTCA were concentrated even more at the surface of the particle, with CPA molecules residing mostly at the outermost areas and many MBTCA molecules lying just underneath (Fig. S20d, e). At 75 % organic mass fraction and 76 % RH, the layering between CPA and MBTCA molecules was more pronounced, with the majority of MBTCA residing now inside the particle (Figs. 10a, b, S21). Such a layered arrangement of CPA and MBTCA became even more pronounced at 88 % RH (Figs. 10d, e, S21). The ratio of CPA to MBTCA molecules present in the very outer region of the particle, representing 5 % of its total volume, increased gradually from 1 to 3 as the organic content and the relative humidity increased (simulation nos. 20–23). Given that CPA is a surfactant, the separation of CPA and MBTCA molecules at these conditions implies that CPA hinders MBTCA molecules from reaching the surface of the particle. In the particles examined here, the MBTCA fraction at the interior of the nanoparticles was greater (up to 3 times, at 75 % organic mass and 88 % RH) than the CPA fraction (Fig. S21). Therefore, at least 70 % of the CPA was at the surface of the particle, while MBTCA was always present at the core (Fig. S21).
According to our simulations, increasing the organic mass fraction, and especially the RH, results in the formation of a core–shell structure as organics, especially CPA, are salted out by ions. The surface is enriched in organics and the core in inorganics (Figs. S22–S23). For example, for the particle with 75 % organic mass fraction at 76 % RH, less than 10 % of the water molecules were at the surface; ions, on the other hand, were found in the two interior regions, with more than 70 % of them located at the core (Figs. S22–S23). The intermediate ring-like particle region therefore plays the role of a transition area from an organic-rich phase to an inorganic-rich one. The coating created by the organics at the surface of the particle is not uniform, as it is composed of several small organic neighbourhoods (in a structure that resembles a random network) (Figs. 10a, b, d, e, S20a, b, d, e). The inorganics at the interior of the particle, on the other hand, form either interconnected inclusions (Figs. 10c, S20c) or a continuous phase (Figs. 10f, S20f), depending on the prevailing RH conditions.
3.5.2 CPA and triacontane mixtures
We also simulated nanoparticles consisting of CPA and n-triacontane (simulation nos. 24–26), plus the inorganic ions. These had a density between 1.0 and 1.2 g cm−3 and equivalent diameters that ranged from 5.6 to 8 nm. The particle with an 82 % organic mass fraction at 39 % RH had one of the higher asphericities among all nanoparticles examined in our work (Table 1).
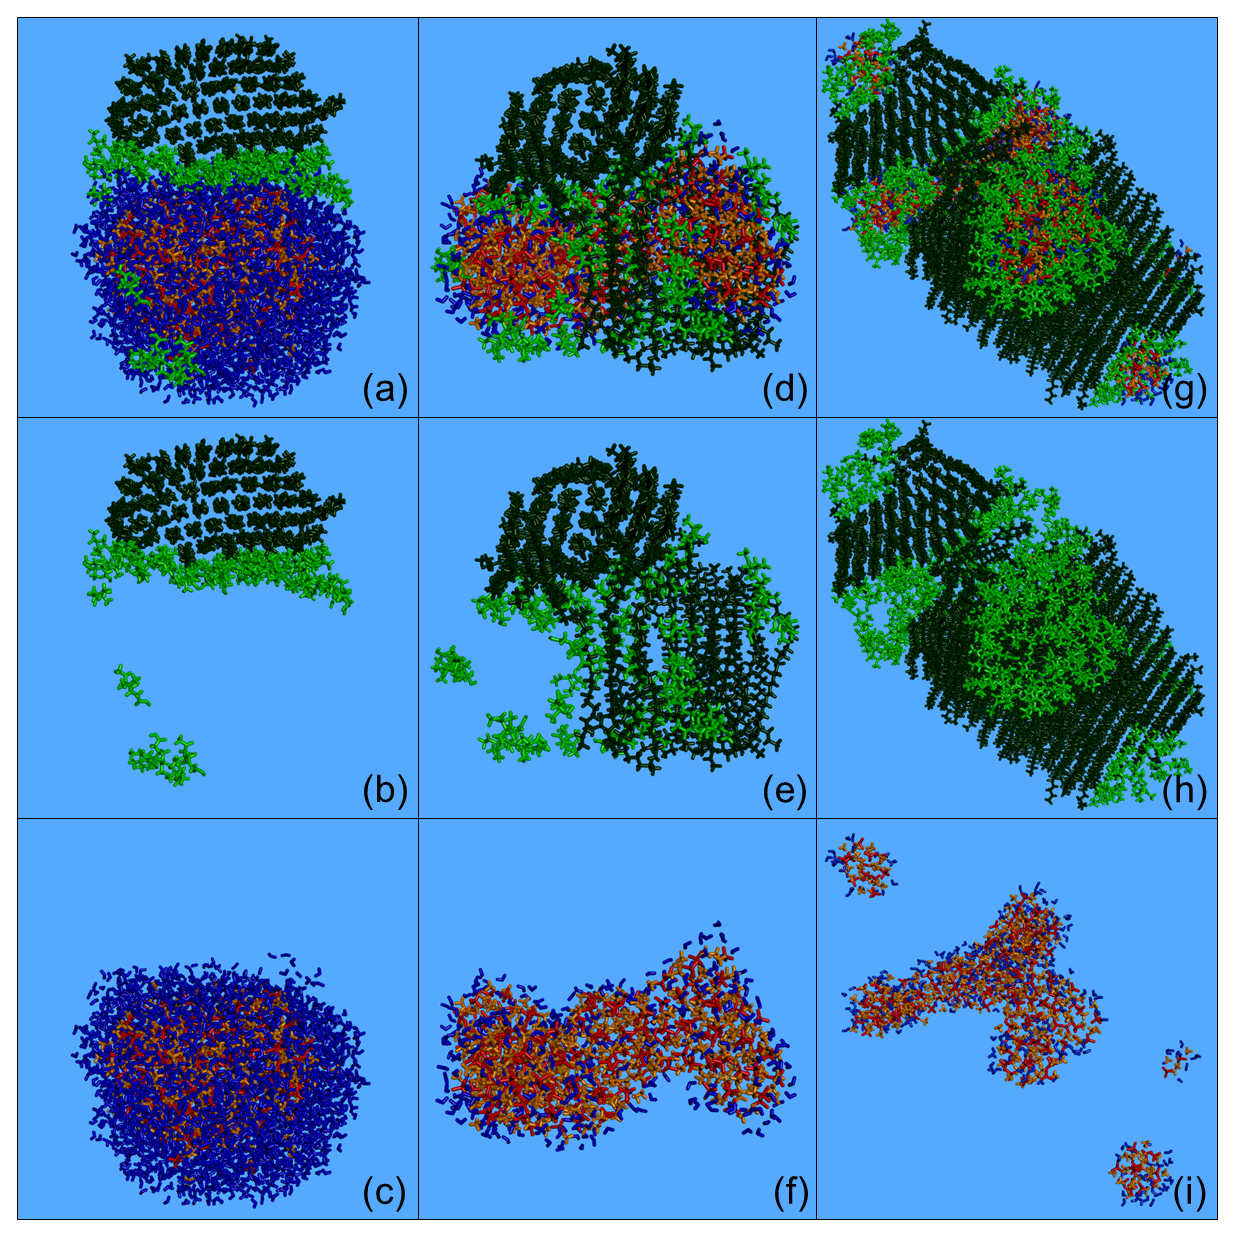
Figure 11Characteristic snapshots from the MD simulations of the nanoparticle containing CPA and n-triacontane: (a) at 88 % RH (53 % dry organic content), (b) at 88 % RH (53 % organics) showing only organic molecules, (c) at 88 % RH (53 % organics) omitting organic molecules, (d) at 40 % RH (53 % dry organic content), (e) at 40 % RH (53 % organics) including only organic molecules, (f) at 40 % RH (53 % organics) omitting organic molecules, (g) at 39 % RH (82 % dry organic content), (h) at 39 % RH (82 % organics) including only organic molecules and (i) at 39 % RH (82 % organics) omitting organic molecules. Colour coding: green for CPA, dark green for n-triacontane, red for sulfate, orange for ammonium and blue for water.
The resulting nanoparticles included multiple hydrophobic and hydrophilic domains: the alkanes formed the hydrophobic region, while the first hydrophilic domain contained the inorganic ions and the second mainly CPA (Fig. 11). At 88 % RH, the alkanes formed a cap over the almost spherical aqueous solution. Most of the CPA molecules were in the area between the alkanes and the aqueous drop (Fig. 11a–c). At low RH, the inorganic domain consisted of a few interconnected (Fig. 11f) or unconnected (Fig. 11i) regions. The alkane domain also included several connected structures (Figs. 11e–h and S24). The CPA molecules were either at the surface covering the aqueous regions or between the alkanes and these hydrophilic domains (Fig. 11d, g). In all nanoparticles discussed in this section, a lot of CPA was at the interface between hydrophobic and aqueous regions, with their methyl (hydrophobic) groups pointing towards the alkane phase. The fraction of CPA molecules at the surface of the particles was lower than that observed in the CPA-containing particles because of the simultaneous presence of n-triacontane and its self-assembly. As expected, due to the enhanced organic content, organic species were present almost everywhere in the particle.
3.6 Sensitivity simulations
3.6.1 Sensitivity to temperature
Additional simulations were performed to examine the effect of temperature on the resulting morphologies. We repeated the simulation of the CPA-containing particle with 7 % dry organic mass content at 40 % RH (simulation no. 1) at two lower temperatures, 286 and 300 K. The nanoparticle with 10 % n-eicosane mass fraction at 40 % RH (simulation no. 3) was also simulated at 300 K. Finally, the particle with 74 % dry-CPA mass content at 39 % RH (simulation no. 15, Fig. 6) was simulated for another 30 ns at 350 K.
The resulting morphologies in all cases were quite similar to those already reported and discussed in the previous sections. For example, despite the high simulation temperature, the inorganic structure observed in simulation no. 15 (Fig. 6d) was still present (Fig. S25). The values of the key properties (e.g. the distribution of the various species inside the particles) were in all cases within the expected statistical uncertainty (Karadima et al., 2017).
3.6.2 Sensitivity to initial system configuration and simulation length
All simulations listed in Table 1, except nos. 4, 10–12, 19, 20–21 and 24, were performed twice under the same temperature and pressure conditions but starting from different initial configurations (different atom positions and initial velocities). In all cases the final particle morphologies and properties obtained in the repeated simulations were within the expected statistical uncertainty of the results of the original simulations. The differences of the potential energy between the two final configurations in the repeated simulations were less than 1 %.
For the particle with 63 % n-eicosane (Fig. 7, simulation no. 17), the second simulation resulted once again in three inorganic regions and one extended alkane phase (Fig. S26). The two simulations reached this structure following different paths; initially the corresponding particles had a different number of inorganic regions, but then these merged to the three regions. One would expect that the thermodynamic equilibrium configuration would correspond to a single aqueous inorganic phase. But, in both simulated systems, the resulting three hydrophilic regions were quite far away so as not to interact due to the intermediate hydrophobic region. Given the limited duration of the simulations in our study, the merging of the three aqueous structures at much longer timescales cannot be excluded. However, the main characteristic of these particles is not the exact number of the hydrophilic regions but the fact that the particles are inhomogeneous and phase separated.
The particles of the repeated MD simulations that contained n-triancontane and CPA at 53 % and 82 % total dry (Fig. 11d, g, simulation nos. 25–26 respectively) also exhibited complex structures (Fig. S27), similar to those observed in the original MD simulations. Similar complex structures and particle morphologies were further observed in both the simulated particles with 74 % dry-CPA content at 39 % RH (Figs. 6c, d, S28a, b).
In additional sensitivity tests we extended the simulation time for systems 1, 5, 8, 13, 14 and 25 to 100 ns. Again, the longer simulation duration did not affect either the final structures or the predicted values of the physical properties of interest. For example, the particle with 58 % dry-CPA content at 40 % RH (Fig. 6a–b) had the same morphology even after a 100 ns simulation (Fig. S28c–d).
Table 2Description and schematic illustration of the morphologies identified in the simulated atmospheric nanoparticles.
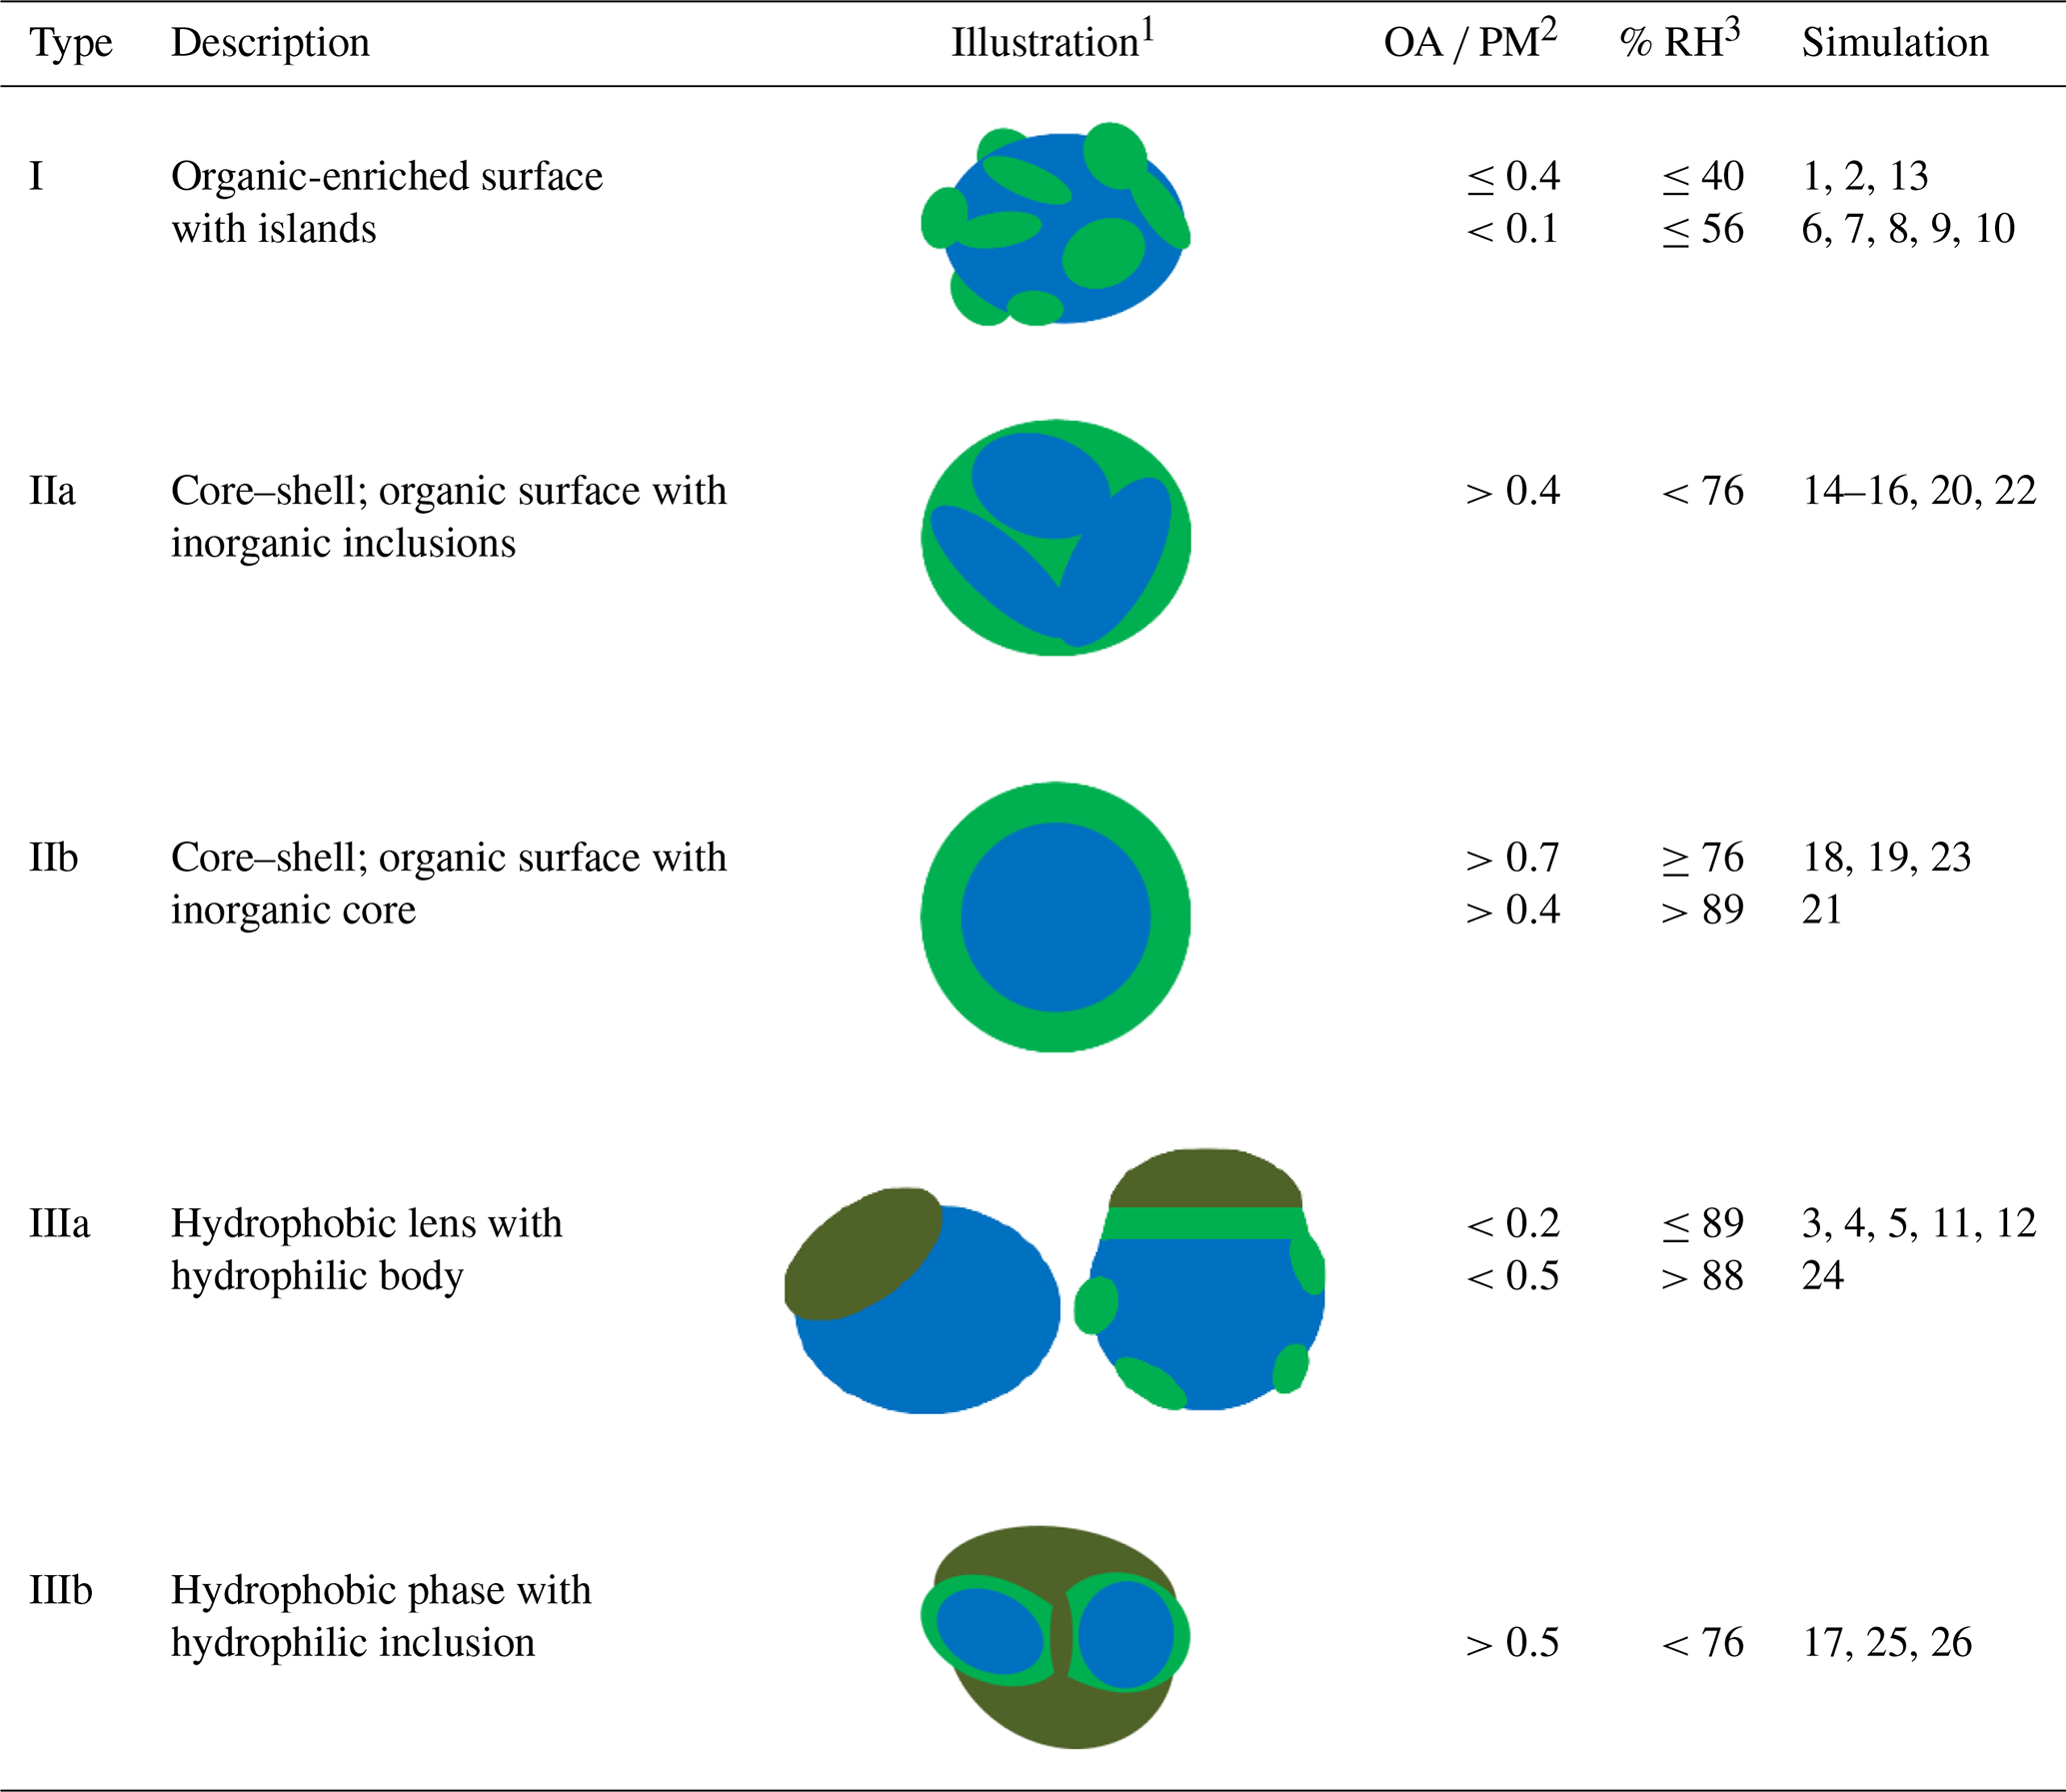
1 Colour notation: hydrophilic organics (green), hydrophobic organics (green leaf), inorganics (blue). 2 OA ∕ PM: organic aerosol ∕ particulate matter (dry organic mass fraction). 3 RH values refer to bulk equilibrium conditions (according to the E-AIM model) and do not include the organics in the calculation.
3.7 Summary of particle morphologies
The relative humidity, the type of organic compound present and the organic mass fraction all affect the morphology of the nanoparticles formed during the simulation. Organic–inorganic phase separation was observed in almost all cases. Organic molecules were found at or near the surface of the particle in contrast to inorganic ions, which concentrated mainly at the interior of the particle. Hydrophilic organic molecules associate more with other organics than with water; thus the frequently assumed existence of a single aqueous phase containing both inorganic ions and secondary organics is not supported by the results of our simulations. Even more, a separation of the organic molecules appears possible: our simulations showed that long-chain alkanes segregate from CPA molecules and that CPA tends to reside in different areas of the particles than MBTCA. The three general types of nanoparticle morphologies predicted by our simulations are summarized in Table 2.
In the first type, the organics mainly form isolated islands at the surface of the particle that has an inorganic core. Some organic molecules may exist further inside the particle. This type is found in particles containing a low or moderate number of oxidized (secondary) organic components (dry-mass fraction less than 40 %) at low-to-moderate RH (less than 56 %).
The second type corresponds to different forms of a core–shell morphology. The core can be multiple (IIa) or one (IIb) inorganic regions and the shell consists of secondary organic components covering the inorganics. In type IIa some organic molecules can also be found in the particle's core. The organics are salted out by the inorganics with the latter dominating the inner domains of the particle. This type is predicted for particles in which the oxidized organics represent more than 40 % of the dry mass of the particle at a range of RH values as low as 39 %. Multiple inorganic inclusions are predicted at low and moderate RH (39 %–76 %), while a single core is present at higher RH or higher organic content. In the case of a mixture of CPA and MBTCA molecules, CPA molecules are predicted to accumulate at the surface of the particle with MBTCA ones lying underneath.
The third and more complex morphology is predicted for particles that contain large linear alkanes, inorganic components and potentially oxidized organics. In all cases the alkanes are organized in one or more hydrophobic neighbourhoods and remain well separated from the rest of the particle constituents. At low organic mass fractions, regardless of RH, a surface lens is formed by the linear alkanes (type IIIa). For organic dry-mass fraction greater than 0.5 and at low or moderate RH, several hydrophobic alkane lamellae with hydrophilic inclusions develop (type IIIb). In all these cases the oxidized organics are found either between the alkanes and the aqueous solution or at the surface of the aqueous solution.
3.8 Comparison with experimental results
Phase separation of organics and inorganics, but also of hydrophobic and hydrophilic organics, was predicted for almost all particles simulated here. This behaviour is consistent with the observations of Reid et al. (2011) who reported the formation of distinct hydrophilic and hydrophobic domains for n-decane and aqueous sodium chloride particles at high RH. Song et al. (2007) also reported that α-pinene products do not mix well with hydrophobic organic aerosol. Phase separation has also been observed by Marcolli and Krieger (2006), who examined 1,2-hexanediol (O : C ratio = 0.33, close to the O : C ratio of CPA) with several salt–water mixtures. You et al. (2014) concluded that phase separation is always observed for O : C < 0.56 and is organic molecule dependent for 0.56 < O : C < 0.8. This is also consistent with the results of our MD study for the three O : C values (0, 0.3, 0.75) studied. On the other hand, in all of our simulations the oxygenated organics were salted out by the inorganics, while Veghte et al. (2013, 2014) reported a homogeneous morphology for particles containing organic compounds with solubility in the range of 60–90 g L−1 with diameters less than 170 or 270 nm, depending on the organic compound. In these studies, dry particles were investigated. Recently, Altaf and Freedman (2017) reported a connection between the drying rate and the dry-particle morphology. They observed that the transition region, where both homogeneous and phase-separated morphologies are observed, shifts to smaller diameters as the drying rate becomes slower and similar to the ambient drying rates. Particles that contained less soluble organic compounds (solubility < 10 g L−1) were, according to Veghte et al. (2014), phase-separated for all diameters examined, which is consistent with our results.
We investigated the morphology of realistic multicomponent atmospheric nanoparticles composed of sulfate and ammonium ions, water and CPA, MBTCA or normal alkanes (or mixtures of these organics) with atomistic MD simulations under atmospherically relevant conditions. A variety of microstructures was observed for these ultrafine particles, depending on composition, humidity and organic mass fraction assumed in the simulation. Three main particle types were identified: organic islands at the surface, inorganic core–organic shell morphologies and complex structures with hydrophobic and hydrophilic domains. The oxidized organics form the first two types, while in particles with hydrophobic organics the third type is prevalent.
The surface-active CPA molecules were mainly located at the outer regions of the particles. As the water content increased, the CPA molecules were found even closer to the surface, with the interior of the particle composed exclusively of inorganic species. The highly oxygenated MBTCA was more likely to be found at the particle core compared to CPA. When MBTCA coexisted with CPA, CPA created a thin layer at the surface, thus providing a shield for MBTCA molecules that resided underneath.
The relatively large alkanes (n-eicosane, n-tetracosane and n-triacontane) were found to form well-organized structures at the particle surface due to their strong hydrophobicity. These could extend, depending on the chain length of the alkane, to the inner regions, forming a single or several lamella configurations for low or moderate organic mass fractions, respectively. The hydrophobic alkanes separated not only from ions and water but also from other oxygenated organic species. In particles where both alkanes and oxidized organics were present, the oxidized organic was located mainly in the zones between the hydrophobic and aqueous domains of the particle.
Increasing the RH resulted in surface enrichment of organics for CPA and/or MBTCA-containing particles. Increasing the organic mass fraction enhanced the presence of organics throughout the particle; however, this effect was also strongly RH dependent. As the RH increased, the oxidized organics were salted out by the ions and concentrated at the surface, while ions accumulated at the core. Depending on concentration, the ions formed inclusions or were distributed quite homogeneously in the core. The hydrophobic alkanes formed separate structures. High humidity levels resulted in the formation of a unique hydrophobic alkane domain (lens-like configuration).
The nanoparticles studied here were heterogeneous, characterized by a small degree of mixing, and the organic-rich phase was located at the particle surface. The small degree of mixing was observed not only between organics and water, but also between different organic compounds. The structure of the particles containing multiple organics (CPA and alkanes or CPA and MBTCA) included formations in which the less oxidized compound was found at the surface and the more oxidized compound was further inside the particle. Some chemical transport models assume that all or at least all the secondary organics in the particles dissolve in the aqueous phase. However, this is not corroborated by our results. According to this study, together with other experimental and theoretical studies, the assumption of well-mixed state should be reconsidered by most chemical transport models.
The data in the study are available from the authors upon request (kkaradima@chemeng.upatras.gr).
The supplement related to this article is available online at: https://doi.org/10.5194/acp-19-5571-2019-supplement.
KSK contributed to the design of the study, conducted the simulations, analysed the results and wrote the paper. VGM contributed to the design of the study, the analysis of the results and the writing of the paper. SNP was responsible for the design and coordination of the study and the synthesis of the results.
The authors declare that they have no conflict of interest.
This study was financially supported by the European Union's Horizon 2020 EUROCHAMP-2020 Infrastructure Activity (grant agreement 730997) and the U.S. National Science Foundation (grant agreement 1455244). The authors acknowledge the computational time granted by the Greek Research & Technology Network (GRNET) in the National HPC facility–ARIS under the project name AtmoStruc (pr004005).
This paper was edited by Daniel Knopf and reviewed by two anonymous referees.
Allen, M. P. and Tildesley, D. J.: Computer Simulation of Liquids, Oxford University Press, New York, 1991.
Altaf, M. B. and Freedman, M. A.: Effect of Drying Rate on Aerosol Particle Morphology, J. Phys. Chem. Lett., 8, 3613–3618, 2017.
Bahadur, R., Russell, L. M. and Prather, K.: Composition and morphology of individual combustion, biomass burning, and secondary organic particle types obtained using urban and coastal ATOFMS and STXM-NEXAFS measurements, Aerosol Sci. Technol., 44, 551–562, 2010.
Berendsen, H. J. C., Grigera, J. R. and Straatsma, T. P.: The missing term in effective pair potentials, J. Phys. Chem., 91, 6269–6271, 1987.
Bertram, A. K., Martin, S. T., Hanna, S. J., Smith, M. L., Bodsworth, A., Chen, Q., Kuwata, M., Liu, A., You, Y., and Zorn, S. R.: Predicting the relative humidities of liquid-liquid phase separation, efflorescence, and deliquescence of mixed particles of ammonium sulfate, organic material, and water using the organic-to-sulfate mass ratio of the particle and the oxygen-to-carbon elemental ratio of the organic component, Atmos. Chem. Phys., 11, 10995–11006, https://doi.org/10.5194/acp-11-10995-2011, 2011.
Brooks, B. R., Bruccoleri, R. E., Olafson, B. D., States, D. J., Swaminathan, S., and Karplus, M.: CHARMM: A program for macromolecular energy, minimization, and dynamics calculations, J. Comput. Chem., 4, 187–217, 1983.
Buseck, P. R. and Adachi, K.: Nanoparticles in the atmosphere, Elements, 4, 389–394, 2008.
Chakraborty, P. and Zachariah, M. R.: On the structure of organic-coated water droplets: From “net water attractors” to “oily” drops, J. Geophys. Res., 116, 1–8, 2011.
Cheng, Y., Brook, J. R., Li, S.-M., and Leithead, A.: Seasonal variation in the biogenic secondary organic aerosol tracer cis-pinonic acid: Enhancement due to emissions from regional and local biomass burning, Atmos. Environ., 45, 7105–7112, 2011.
Clegg, S. L., Pitzer, K. S., and Brimblecombe, P.: Thermodynamics of multicomponent, miscible, ionic solutions. Mixtures including unsymmetrical electrolytes, J. Phys. Chem., 96, 9470–9479, 1992.
Clegg, S. L., Brimblecombe, P., and Wexler, A. S.: Thermodynamic model of the system H+-NH-SO-NO-H2O at tropospheric temperatures, J. Phys. Chem. A, 102, 2137–2154, 1998.
Dassault Systèmes BIOVIA Discovery Visualizer Studios: Dassault Systèmes BIOVIA, San Diego, available at: http://accelrys.com/products/collaborative-science/biovia-discovery-studio/visualization.html, last access: 18 February 2016.
Davies, J. F., Miles, R. E. H., Haddrell, A. E., and Reid, J. P.: Influence of organic films on the evaporation and condensation of water in aerosol, P. Natl. Acad. Sci. USA, 110, 8807–8812, 2013.
Dennis-Smither, B. J., Hanford, K. L., Kwamena, N. O. A., Miles, R. E. H., and Reid, J. P.: Phase, morphology, and hygroscopicity of mixed oleic acid/sodium chloride/water aerosol particles before and after ozonolysis, J. Phys. Chem. A, 116, 6159–6168, 2012.
Dette, H. P., Qi, M., Schröder, D. C., Godt, A., and Koop, T.: Glass-forming properties of 3-methylbutane-1,2,3-tricarboxylic acid and its mixtures with water and pinonic acid, J. Phys. Chem. A, 118, 7024–7033, 2014.
Eastwood, J. W., Hockney, R. W., and Lawrence, D. N.: P3M3DP – The three-dimensional periodic particle-particle/particle-mesh program, Comput. Phys. Commun., 19, 215–261, 1980.
Folkers, M., Mentel, T. F., and Wahner, A.: Influence of an organic coating on the reactivity of aqueous aerosols probed by the heterogeneous hydrolysis of N2O5, Geophys. Res. Lett., 30, 2–5, 2003.
Fuzzi, S., Baltensperger, U., Carslaw, K., Decesari, S., Denier van der Gon, H., Facchini, M. C., Fowler, D., Koren, I., Langford, B., Lohmann, U., Nemitz, E., Pandis, S., Riipinen, I., Rudich, Y., Schaap, M., Slowik, J. G., Spracklen, D. V., Vignati, E., Wild, M., Williams, M., and Gilardoni, S.: Particulate matter, air quality and climate: lessons learned and future needs, Atmos. Chem. Phys., 15, 8217–8299, https://doi.org/10.5194/acp-15-8217-2015, 2015.
Glasius, M. and Goldstein, A. H.: Recent discoveries and future challenges in atmospheric organic chemistry, Environ. Sci. Technol., 50, 2754–2764, 2016.
Goldstein, H., Poole, C., and Safko, J.: Classical Mechanics, 3rd edn., Pearson, London, 2007.
Gopalakrishnan, S., Jungwirth, P., Tobias, D. J., and Allen, H. C.: Air-liquid interfaces of aqueous solutions containing ammonium and sulfate: Spectroscopic and molecular dynamics studies, J. Phys. Chem. B, 109, 8861–8872, 2005.
Hede, T., Li, X., Leck, C., Tu, Y., and Ågren, H.: Model HULIS compounds in nanoaerosol clusters – investigations of surface tension and aggregate formation using molecular dynamics simulations, Atmos. Chem. Phys., 11, 6549–6557, https://doi.org/10.5194/acp-11-6549-2011, 2011.
Hoover, W. G.: Canonical dynamics: Equilibrium phase-space distributions, Phys. Rev. A, 31, 1695–1697, 1985.
Hoover, W. G.: Constant-pressure equations of motion, Phys. Rev. A, 34, 2499–2500, 1986.
Hudait, A. and Molinero, V.: Ice crystallization in ultrafine water-salt aerosols: Nucleation, ice-solution equilibrium, and internal structure, J. Am. Chem. Soc., 136, 8081–8093, 2014.
Hyvärinen, A. P., Lihavainen, H., Gaman, A., Vairila, L., Ojala, H., Kulmala, M., and Viisanen, Y.: Surface tensions and densities of oxalic, malonic, succinic, maleic, malic, and cis-pinonic acids, J. Chem. Eng. Data, 51, 255–260, 2006.
IPCC: Climate Change 2013: The Physical Science Basis, Contribution of Working Group I to the Fifth Assessment Report of the Intergovernmental Panel on Climate Change, edited by: Stocker, T. F., Qin, D., Plattner, G.-K., Tignor, M., Allen, S. K., Boschung, J., Nauels, A., Xia, Y., Bex, V., and Midgley, P. M., Cambridge University Press, Cambridge, UK, New York, 2013.
Jorgensen, W. L. and Tirado-Rives, J.: The OPLS Potential Functions for Proteins. Energy Minimizations for Crystals of Cyclic Peptides and Crambin, J. Am. Chem. Soc., 110, 1657–1666, 1988.
Jungwirth, P., Rosenfeld, D., and Buch, V.: A possible new molecular mechanism of thundercloud electrification, Atmos. Res., 76, 190–205, 2005.
Karadima, K. S., Mavrantzas, V. G., and Pandis, S. N.: Molecular dynamics simulation of the local concentration and structure in multicomponent aerosol nanoparticles under atmospheric conditions, Phys. Chem. Chem. Phys., 19, 16681–16692, 2017.
Koo, B., Ansari, A. S., and Pandis, S. N.: Integrated approaches to modeling the organic and inorganic atmospheric aerosol components, Atmos. Environ., 37, 4757–4768, 2003.
Kotianová, P., Puxbaum, H., Bauer, H., Caseiro, A., Marr, I. L., and Čík, G.: Temporal patterns of n-alkanes at traffic exposed and suburban sites in Vienna, Atmos. Environ., 42, 2993–3005, 2008.
Kwamena, N.-O. A., Buajarern, J., and Reid, J. P.: Equilibrium morphology of mixed organic/inorganic/aqueous aerosol droplets: Investigating the effect of relative humidity and surfactants, J. Phys. Chem. A, 114, 5787–5795, 2010.
Li, X., Hede, T., Tu, Y., Leck, C., and Ågren, H.: Surface-active cis-pinonic acid in atmospheric droplets: A molecular dynamics study, J. Phys. Chem. Lett., 1, 769–773, 2010.
Liyana-Arachchi, T., Zhang, Z., Ehrenhauser, F. S., Avij, P., Valsaraj, K. T., and Hung, F. R.: Bubble bursting as an aerosol generation mechanism during an oil spill in the deep-sea environment: molecular dynamics simulations of oil alkanes and dispersants in atmospheric air/salt water interfaces, Environ. Sci. Process. Impacts, 16, 53–64, 2014.
Ma, X., Chakraborty, P., Henz, B. J., and Zachariah, M. R.: Molecular dynamic simulation of dicarboxylic acid coated aqueous aerosol: structure and processing of water vapor., Phys. Chem. Chem. Phys., 13, 9374–9384, 2011.
Marcolli, C. and Krieger, U. K.: Phase changes during hygroscopic cycles of mixed organic/inorganic model systems of tropospheric aerosols, J. Phys. Chem. A, 110, 1881–1893, 2006.
Mavrantza, I.-E., Prentzas, D., Mavrantzas, V. G., and Galiotis, C.: Detailed atomistic molecular-dynamics simulation of the orthorhombic phase of crystalline polyethylene and alkane crystals, J. Chem. Phys., 115, 3937–3950, 2001.
Miyamoto, S. and Kollman, P. A.: SETTLE: An analytical version of the SHAKE and RATTLE algorithm for rigid water models, J. Comput. Chem., 13, 952–962, 1992.
Müller, L., Reinnig, M.-C., Naumann, K. H., Saathoff, H., Mentel, T. F., Donahue, N. M., and Hoffmann, T.: Formation of 3-methyl-1,2,3-butanetricarboxylic acid via gas phase oxidation of pinonic acid – a mass spectrometric study of SOA aging, Atmos. Chem. Phys., 12, 1483–1496, https://doi.org/10.5194/acp-12-1483-2012, 2012.
Nosé, S.: A molecular dynamics method for simulations in the canonical ensemble, Mol. Phys., 52, 255–268, 1984.
O'Brien, R. E., Wang, B., Kelly, S. T., Lundt, N., You, Y., Bertram, A. K., Leone, S. R., Laskin, A., and Gilles, M. K.: Liquid–liquid phase separation in aerosol particles: Imaging at the nanometer scale, Environ. Sci. Technol., 49, 4995–5002, 2015.
Ovadnevaite, J., Zuend, A., Laaksonen, A., Sanchez, K. J., Roberts, G., Ceburnis, D., Decesari, S., Rinaldi, M., Hodas, N., Facchini, M. C., Seinfeld, J. H., and O'Dowd, C.: Surface tension prevails over solute effect in organic-influenced cloud droplet activation, Nature, 546, 637–641, 2017.
Plimpton, S.: Fast parallel algorithms for short-range molecular dynamics, J. Comput. Phys., 117, 1–19, 1995.
Pun, B. K., Wu, S. Y., Seigneur, C., Seinfeld, J. H., Griffin, R. J., and Pandis, S. N.: Uncertainties in modeling secondary organic aerosols: Three-dimensional modeling studies in Nashville/Western Tennessee, Environ. Sci. Technol., 37, 3647–3661, 2003.
Qiu, Y. and Molinero, V.: Morphology of liquid-liquid phase separated serosols, J. Am. Chem. Soc., 137, 10642–10651, 2015.
Qiu, Y. and Molinero, V.: Strength of alkane–fluid attraction determines the interfacial orientation of liquid alkanes and their crystallization through heterogeneous or homogeneous mechanisms, Crystals, 7, 86, 2017.
Reid, J. P., Dennis-Smither, B. J., Kwamena, N.-O. A., Miles, R. E. H., Hanford, K. L., and Homer, C. J.: The morphology of aerosol particles consisting of hydrophobic and hydrophilic phases: hydrocarbons, alcohols and fatty acids as the hydrophobic component, Phys. Chem. Chem. Phys., 13, 15559–15572, 2011.
Renbaum-Wolff, L., Song, M., Marcolli, C., Zhang, Y., Liu, P. F., Grayson, J. W., Geiger, F. M., Martin, S. T., and Bertram, A. K.: Observations and implications of liquid–liquid phase separation at high relative humidities in secondary organic material produced by α-pinene ozonolysis without inorganic salts, Atmos. Chem. Phys., 16, 7969–7979, https://doi.org/10.5194/acp-16-7969-2016, 2016.
Robinson, E. S., Saleh, R., and Donahue, N. M.: Probing the evaporation dynamics of mixed SOA/squalane particles using size-resolved composition and single-particle measurements, Environ. Sci. Technol., 49, 9724–9732, 2015.
Ruehl, C. R. and Wilson, K. R.: Surface organic monolayers control the hygroscopic growth of submicrometer particles at high relative humidity, J. Phys. Chem. A, 118, 3952–3966, 2014.
Sareen, N., Schwier, A. N., Lathem, T. L., Nenes, A., and McNeill, V. F.: Surfactants from the gas phase may promote cloud droplet formation, P. Natl. Acad. Sci. USA, 110, 2723–2728, 2013.
Scienomics SARL: MAPS, Paris, available at: http://scienomics.com/products/molecular-modeling-platform, last access: 16 July 2015.
Seidl, W.: Model for a surface film of fatty acids on rain water and aerosol particles, Atmos. Environ., 34, 4917–4932, 2000.
Seinfeld, J. H. and Pandis, S. N.: Atmospheric chemistry and physics: From air pollution to climate change, 2nd edn., Johh Wiley & Sons, New Jersey, 2006.
Shiraiwa, M., Ammann, M., Koop, T., and Poschl, U.: Gas uptake and chemical aging of semisolid organic aerosol particles, P. Natl. Acad. Sci. USA, 108, 11003–11008, 2011.
Shiraiwa, M., Zuend, A., Bertram, A. K. and Seinfeld, J. H.: Gas–particle partitioning of atmospheric aerosols: interplay of physical state, non–ideal mixing and morphology, Phys. Chem. Chem. Phys., 15, 11441–11453, 2013.
Smolenskii, E. A., Ryzhov, A. N., Member, C. and Lapidus, R. A. S. A. L.: Simulation of melting temperatures of normal alkanes, Dokl. Chem., 387, 297–301, 2002.
Song, C., Zaveri, R. A., Alexander, M. L., Thornton, J. A., Madronich, S., Ortega, J. V., Zelenyuk, A., Yu, X. Y., Laskin, A., and Maughan, D. A.: Effect of hydrophobic primary organic aerosols on secondary organic aerosol formation from ozonolysis of α-pinene, Geophys. Res. Lett., 34, 1–5, 2007.
Song, M., Marcolli, C., Krieger, U. K., Zuend, A., and Peter, T.: Liquid-liquid phase separation in aerosol particles: Dependence on O : C, organic functionalities, and compositional complexity, Geophys. Res. Lett., 39, 1–5, 2012.
Song, M., Marcolli, C., Krieger, U. K., Lienhard, D. M., and Peter, T.: Morphologies of mixed organic/inorganic/aqueous aerosol droplets, Faraday Discuss., 165, 289–316, 2013.
Szmigielski, R., Surratt, J. D., Gómez-González, Y., van der Veken, P., Kourtchev, I., Vermeylen, R., Blockhuys, F., Jaoui, M., Kleindienst, T. E., Lewandowski, M., Offenberg, J. H., Edney, E. O., Seinfeld, J. H., Maenhaut, W., and Claeys, M.: 3-methyl-1,2,3-butanetricarboxylic acid: An atmospheric tracer for terpene secondary organic aerosol, Geophys. Res. Lett., 34, 2–7, 2007.
Takahama, S., Liu, S., and Russell, L. M.: Coatings and clusters of carboxylic acids in carbon-containing atmospheric particles from spectromicroscopy and their implications for cloud-nucleating and optical properties, J. Geophys. Res.-Atmos., 115, 1–21, 2010.
Theodorou, D. N. and Suter, U. W.: Shape of unperturbed linear polymers: polypropylene, Macromolecules, 18, 1206–1214, 1985.
Tsolou, G. and Mavrantzas, V. G.: Atomistic simulation of the sorption of small gas molecules in polyisobutylene, Macromolecules, 41, 6228–6238, 2008.
Veghte, D. P., Altaf, M. B., and Freedman, M. A.: Size dependence of the structure of organic aerosol, J. Am. Chem. Soc., 135, 16046–16049, 2013.
Veghte, D. P., Bittner, D. R., and Freedman, M. A.: Cryo-transmission electron microscopy imaging of the morphology of submicrometer aerosol containing organic acids and ammonium sulfate, Anal. Chem., 86, 2436–2442, 2014.
Verlet, L.: Computer “experiments” on classical fluids. I. Thermodynamical properties of Lennard-Jones molecules, Phys. Rev., 159, 98–103, 1967.
Verlet, L.: Computer “experiments” on classical fluids. II. Equilibrium correlation functions, Phys. Rev., 165, 201–214, 1968.
Virtanen, A., Joutsensaari, J., Koop, T., Kannosto, J., Yli-Pirilä, P., Leskinen, J., Mäkelä, J. M., Holopainen, J. K., Pöschl, U., Kulmala, M., Worsnop, D. R., and Laaksonen, A.: An amorphous solid state of biogenic secondary organic aerosol particles, Nature, 467, 824–7, 2010.
Wang, B.-B., Wang, X.-D., Chen, M., and Xu, J.-L.: Molecular dynamics simulations on evaporation of droplets with dissolved salts, Entropy, 15, 1232–1246, 2013.
Wang, G., Kawamura, K., Xie, M., Hu, S., Gao, S., Cao, J., An, Z., and Wang, Z.: Size-distributions of n-alkanes, PAHs and hopanes and their sources in the urban, mountain and marine atmospheres over East Asia, Atmos. Chem. Phys., 9, 8869–8882, https://doi.org/10.5194/acp-9-8869-2009, 2009.
Wang, Y. H., Liu, Z. R., Zhang, J. K., Hu, B., Ji, D. S., Yu, Y. C., and Wang, Y. S.: Aerosol physicochemical properties and implications for visibility during an intense haze episode during winter in Beijing, Atmos. Chem. Phys., 15, 3205–3215, https://doi.org/10.5194/acp-15-3205-2015, 2015.
Werner, J., Dalirian, M., Walz, M. M., Ekholm, V., Wideqvist, U., Lowe, S. J., Öhrwall, G., Persson, I., Riipinen, I., and Björneholm, O.: Surface partitioning in organic-inorganic mixtures contributes to the size-dependence of the phase-state of atmospheric nanoparticles, Environ. Sci. Technol., 50, 7434–7442, 2016.
Wexler, A. S. and Clegg, S. L.: Atmospheric aerosol models for systems including the ions H+, NH, Na+, SO, NO, Cl−, Br−, and H2O, J. Geophys. Res., 107, 4207, https://doi.org/10.1029/2001JD000451, 2002.
World Health Organization: Ambient Air Pollution: A global assessment of exposure and burden of disease, World Health Organ., 1–131, 2016.
You, Y. and Bertram, A. K.: Effects of molecular weight and temperature on liquid–liquid phase separation in particles containing organic species and inorganic salts, Atmos. Chem. Phys., 15, 1351–1365, https://doi.org/10.5194/acp-15-1351-2015, 2015.
You, Y., Renbaum-Wolff, L., Carreras-Sospedra, M., Hanna, S. J., Hiranuma, N., Kamal, S., Smith, M. L., Zhang, X., Weber, R. J., Shilling, J. E., Dabdub, D., Martin, S. T., and Bertram, A. K.: Images reveal that atmospheric particles can undergo liquid-liquid phase separations, P. Natl. Acad. Sci. USA, 109, 13188–13193, 2012.
You, Y., Smith, M. L., Song, M., Martin, S. T., and Bertram, A. K.: Liquid-liquid phase separation in atmospherically relevant particles consisting of organic species and inorganic salts, Int. Rev. Phys. Chem., 33, 43–77, 2014.
Zhang, Q. and Thompson, J. E.: Effect of particle mixing morphology on aerosol scattering and absorption: A discrete dipole modeling study, Geo. Res. J., 3–4, 9–18, 2014.
Zhang, Q., Jimenez, J. L., Canagaratna, M. R., et al.: Ubiquity and dominance of oxygenated species in organic aerosols in anthropogenically-influenced Northern Hemisphere midlatitudes, Geophys. Res. Lett., 34, 1–6, 2007.
Zhang, X., McVay, R. C., Huang, D. D., Dalleska, N. F., Aumont, B., Flagan, R. C., and Seinfeld, J. H.: Formation and evolution of molecular products in α-pinene secondary organic aerosol, P. Natl. Acad. Sci. USA, 112, 14168–14173, 2015.
Zhou, S., Lee, A. K. Y., Mcwhinney, R. D., and Abbatt, J. P. D.: Burial effects of organic coatings on the heterogeneous reactivity of particle-borne benzo[a]pyrene (BaP) toward ozone, Phys. Chem. A, 116, 7050–7056, 2012.
Zuend, A. and Seinfeld, J. H.: Modeling the gas-particle partitioning of secondary organic aerosol: the importance of liquid-liquid phase separation, Atmos. Chem. Phys., 12, 3857–3882, https://doi.org/10.5194/acp-12-3857-2012, 2012.
Zuend, A., Marcolli, C., Peter, T., and Seinfeld, J. H.: Computation of liquid-liquid equilibria and phase stabilities: implications for RH-dependent gas/particle partitioning of organic-inorganic aerosols, Atmos. Chem. Phys., 10, 7795–7820, https://doi.org/10.5194/acp-10-7795-2010, 2010.