the Creative Commons Attribution 4.0 License.
the Creative Commons Attribution 4.0 License.
 | 16 Apr 2019
Intercomparison of O3 formation and radical chemistry in the past decade at a suburban site in Hong Kong
Xufei Liu
Xiaopu Lyu
Yu Wang
Fei Jiang
Hong Kong, as one of the densely populated metropolises in East Asia, has been suffering from severe photochemical smog in the past decades, though the observed nitrogen oxides (NOx) and total volatile organic compounds (TVOCs) were significantly reduced. This study, based on the observation data in the autumns of 2007, 2013 and 2016, investigated the photochemical ozone (O3) formation and radical chemistry during the three sampling periods in Hong Kong with the aid of a photochemical box model incorporating the Master Chemical Mechanism (PBM–MCM). While the simulated locally produced O3 remained unchanged (p=0.73) from 2007 to 2013, the observed O3 increased (p < 0.05) at a rate of 1.78 ppbv yr−1 driven by the rise in regionally transported O3 (1.77±0.04 ppbv yr−1). Both the observed and locally produced O3 decreased (p < 0.05) from the VOC sampling days in 2013 to those in 2016 at a rate of and ppbv yr−1, respectively. However, a leveling-off (p=0.32) was simulated for the regionally transported O3 during 2013–2016. The mitigation of autumn O3 pollution in this region was further confirmed by the continuous monitoring data, which have never been reported. Benefiting from the air pollution control measures taken in Hong Kong, the local O3 production rate decreased remarkably (p < 0.05) from 2007 to 2016, along with the lowering of the recycling rate of the hydroxyl radical (OH). Specifically, VOCs emitted from the source of liquefied petroleum gas (LPG) usage and gasoline evaporation decreased in this decade at a rate of ppbv yr−1, leading to a reduction of the O3 production rate from 0.51±0.11 ppbv h−1 in 2007 to 0.10±0.02 ppbv h−1 in 2016. In addition, solvent usage made decreasing contributions to both VOCs (rate ppbv yr−1) and local O3 production rate (1.22±0.17 and 0.14±0.05 ppbv h−1 in 2007 and 2016, respectively) in the same period. All the rates reported here were for the VOC sampling days in the three sampling campaigns. It is noteworthy that meteorological changes also play important roles in the inter-annual variations in the observed O3 and the simulated O3 production rates. Evaluations with more data in longer periods are therefore recommended. The analyses on the decadal changes of the local and regional photochemistry in Hong Kong in this study may be a reference for combating China's nationwide O3 pollution in near future.
- Article
(4984 KB) - Full-text XML
-
Supplement
(990 KB) - BibTeX
- EndNote


Ground-level ozone (O3) is one of the most representative air pollutants in photochemical smog, produced through photochemical reactions between volatile organic compounds (VOCs) and nitrogen oxides (NOx) in the presence of sunlight (NRC; 1992; Jacob et al., 1999; Guo et al., 2017). It is well documented that O3 is harmful to human health (Bell et al., 2004), crops (Wang et al., 2005) and natural ecosystems (Ashmore, 2005). Through the last 30 years, extensive efforts have been made by the local and federal governments to alleviate the tropospheric O3 pollution around the world (NRC; 1992; NARSTO, 2000; Y. Wang et al., 2017, 2018). Effectiveness has gradually shown in some countries/regions, such as Switzerland, Germany, Ireland and eastern North America (Lefohn et al., 2010; Cui et al., 2011; Derwent et al., 2013; Parrish et al., 2014; Lin et al., 2017). In contrast, the O3 levels in many places are still increasing or not decreasing at the expected rates, particularly in East Asia (Ding et al., 2008; Xu et al., 2008; Parrish et al., 2014; Xue et al., 2014a; Y. Wang et al., 2017).
Hong Kong, as one of the densely populated metropolises in East Asia, has been suffering from severe photochemical smog in the past decades, though the locally emitted NOx and total VOCs (TVOCs) were significantly reduced (Xue et al., 2014a; Ou et al., 2015; Lyu et al., 2016a; Y. Wang et al., 2017). On the one hand, this indicates the nonlinear relationship between O3 and its precursors. On the other hand, in addition to local O3 formation, the observed O3 in Hong Kong is also influenced by the regional transport due to the proximity of the highly industrialized Pearl River Delta (PRD) region. Earlier studies revealed that the local O3 production is typically limited by VOCs in urban and some suburban areas in Hong Kong (Zhang et al., 2007; Ling et al., 2014; T. Wang et al., 2017). Namely, cutting VOCs emissions will reduce O3 production, while the reduction of NOx may cause an O3 increment (Cheng et al., 2010, 2013; Guo et al., 2011; Y. Wang et al., 2017). Previous studies also documented that photochemical O3 formation is dependent upon the ratios between TVOCs and NOx (Sillman, 1999; Guo et al., 2013a; Ling et al., 2013), reactivity of VOC species (Zhang et al., 2007; Liu et al., 2008; Cheng et al., 2010) and the composition of NOx (i.e., relative abundances of NO2 and NO) (Richter et al., 2005; Xu et al., 2008; Y. Wang et al., 2018). Moreover, located in the subtropical region, Hong Kong has relatively high temperature and strong solar radiation, which are favorable for local O3 formation. For regional transport, studies (Wang et al., 2001; Ding et al., 2004; T. Wang et al., 2017) indicated that O3 was generally built up in Hong Kong under the northerly winds, whereas it was often driven down by the sea breeze from the South China Sea (SCS) and by the southwest monsoon in warm seasons. The contribution of regional transport to O3 in Hong Kong even reached 70 % under the dominance of the tropical cyclone (Huang et al., 2005), a typical synoptic condition conducive to severe O3 pollution in the Northern Hemisphere (So and Wang, 2003; Huang et al., 2005; Lam et al., 2005). To improve the air quality in Hong Kong, a series of control measures aiming at restriction of VOC emissions have been implemented by Hong Kong government since 2007, which effectively reduced the concentrations of some VOCs, such as propane and i-/n-butanes emitted from taxis and public buses fueled by liquefied petroleum gas (LPG) (Lyu et al., 2016b), the aromatics mainly attributable to solvent usage, and the alkenes in association with diesel exhaust (Lyu et al., 2017a). As a result, Xue et al. (2014a) and Y. Wang et al. (2017) found that the locally produced O3 decreased. However, the regional and superregional transport of O3 and its precursors from PRD and eastern China to Hong Kong had offset the decrease in the local O3 production, resulting in an overall increase in the observed O3 in Hong Kong from 2005 to 2013. Overall, the previous studies have greatly enhanced our understanding on O3 pollution in Hong Kong, and details about the studies can be referred to in Table S1 in the Supplement.
Despite many previous studies (Xue et al., 2014a, 2016; Ou et al., 2015; Lyu et al., 2016a; Y. Wang et al., 2017, 2018), the inter-annual variations in the O3 formation regimes and radical chemistry have not yet been fully understood in Hong Kong. In addition, the online measurement data used in previous long-term O3 study might hamper the exact understanding of the local O3 formation mechanisms, due to the unavailability of many reactive VOCs, such as formaldehyde. Moreover, the trends of the local production and regional transport of O3 were only updated to 2013 in previous studies (Xue et al., 2014a; Y. Wang et al., 2017). In fact, many measures were taken to reduce air pollutants' emissions in the latest years in Hong Kong and PRD. For examples, nearly 75 % of the old catalytic converters in LPG-fueled vehicles were renewed during September 2013–May 2014. A program to eliminate the pre-Euro IV diesel vehicles or to upgrade their emission standards to Euro IV was initiated in March 2014 and is still ongoing until 2019 at its third phase. In the PRD, the second stage of the clean air controlling program was implemented in 2013–2015 (DGEPD, 2013). In 2014, the Guangdong provincial government launched an Action Plan for Air Pollution Prevention and Control (MEE PRC, 2014), putting the emphasis on the emission control of traffic, coal-fired power plants and industrial sources. Investigations on the post-2013 variations in the local O3 production in Hong Kong and the regional impacts provide a good opportunity for us to examine the effectiveness of these local and regional measures.
The objectives of this study were to re-examine the O3 trend in the pre-2013 emissions and trace the O3 evolution in the post-2013 emissions in Hong Kong and to explore the underlying mechanisms for the variations in O3 formation and radical chemistry. With the aid of a photochemical box model, the locally produced and regionally transported O3, as well as its variation trends, were determined (see Sect. 2.5). Under the assumption that the local O3 production in these years was changed due to a series of control measures in Hong Kong, we also aimed to evaluate the actual effectiveness of these control measures. China is suffering from severe O3 pollution, almost the worst in the world. While O3 began to decrease in most areas of North America and Europe, China's O3 pollution was even aggravated in recent years. A series of air pollution control strategies have been implemented in China, though most of them were not specifically designed for O3 abatement. Investigations on O3 trends and the potential causes in Hong Kong would provide a good example of assessing the evolution of O3 pollution and the effects of artificial interventions in China. In addition, the changes in the regional contribution to O3 in Hong Kong determined in this study would throw light upon the variations in O3 in China, particularly in south China. It is expected that this study would have some inspiration for the O3 pollution control in other cities and regions in China.
2.1 Sampling site
Hong Kong is located on the southern coast of China with Guangdong Province to the north and the Pearl River estuary (PRE) to the northwest. The sampling site (22.29∘ N, 113.94∘ E), Tung Chung (TC), is in a newly developed suburban area in western Hong Kong, with a population of ∼77 400 in 2016 (CSD, 2011, 2018). The urban center of Hong Kong is ∼20 km northeast of TC. Hong Kong is dominated by the subtropical oceanic monsoon climate. During warm seasons, the prevailing winds mainly come from the SCS at a relatively low speed (southwest winds). In cold seasons, the east and northeast winds are predominant. Generally, the sampling site receives relatively polluted air masses from mainland China, i.e., the PRD region, Yangtze River Delta region and even north China between October and March, when high O3 levels are often observed (Wang et al., 2009). Therefore, the samplings were mainly conducted in October and November in this study, except for 4 out of 45 sampling days in September. The sampling site was close to a highway running to the Hong Kong International Airport (HKIA), and the HKIA was around 3 km to the north of the site. In addition, the local emissions from residential activities may modulate the air quality at this site. It was expected that O3 at TC would be significantly influenced by NO emitted from the aforementioned sources. As shown in Fig. S1 in the Supplement, the O3 titrated by NO (ΔO3−1) was equivalent to 29.94±8.8 %, 26.7±12.7 % and 32.5±16.6 % of the photochemically formed O3 (ΔO3−2) in the 2007, 2013 and 2016 sampling campaigns, respectively, confirming the importance of NO titration in modulating O3 at the site. Figure 1 shows the locations of the sampling site (TC) and the 12 air quality monitoring stations in the PRD, which witnessed the evolution of air quality in the PRD over the last decade and are used to demonstrate the variations in regional O3 in this study. More detailed description of the site can be found in our previous studies (Cheng et al., 2010; Jiang et al., 2010; Ling et al., 2013; Ou et al., 2015).
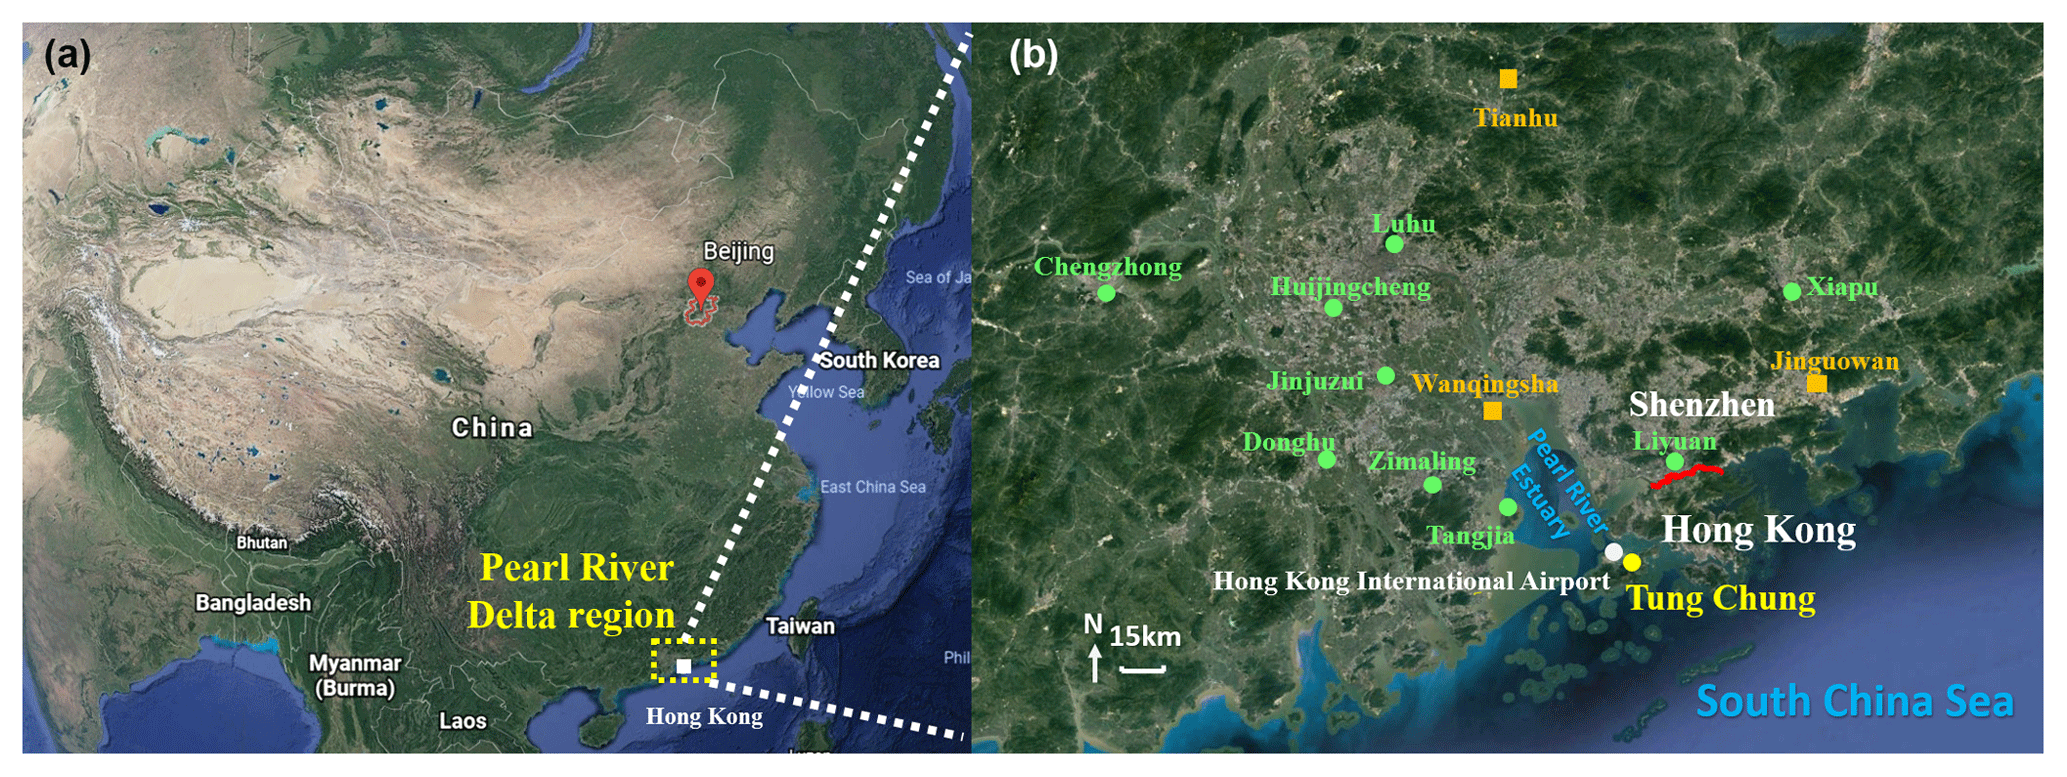
Figure 1Location of the sampling site (yellow circle) and the surrounding environment. The red line in (b) shows the border between Hong Kong and Shenzhen, Guangdong. The three regional and nine urban air quality monitoring stations in the PRD are denoted by orange blocks and green circles, respectively.
2.2 Continuous measurements of trace gases and collection of VOC and OVOC samples
Trace gases (SO2, CO, NO, NO2 and O3) and meteorological conditions were continuously measured at TC site for three autumn periods in 2007, 2013 and 2016 (see Table S2 for the specific sampling periods), including 25 O3 episode days with the maximum hourly average O3 exceeding 100 ppbv (Level II of China National Ambient Air Quality Standard) and 185 non-episode days. VOC and oxygenated volatile organic compounds (OVOCs) samples were selectively collected on 8, 19 and 18 days in 2007, 2013 and 2016, respectively (see Table S2 for the specific sampling dates). The three sampling periods were used as representatives of the autumns in the three years in this study, and the rationality will be discussed in Sect. 3.1.
Trace gases were continuously measured at the TC air quality monitoring station operated by the Hong Kong Environmental Protection Department (HKEPD), ∼0.8 km from our sampling site. The instruments were the same as those used in the US air quality monitoring program (HKEPD, 2017a). Table S3 summarizes the instruments, analysis techniques, detection limits and the time resolutions for measurements of the trace gases. The high-resolution data were collected and averaged into the hourly averages. All the analyzers except the O3 analyzer were zeroed daily by analyzing scrubbed ambient air and calibrated every 2 weeks by a span gas mixture with a NIST (National Institute of Standards and Technology) traceable standard, while the O3 analyzer was calibrated using a transfer standard (Thermo Environmental Instruments (TEI) 49PS) every 2 weeks. Details about the quality assurance and control procedures can be found in Ling et al. (2016a). The meteorological parameters, including temperature, relative humidity, pressure, wind speed, wind direction, precipitation and solar radiation, were also continuously monitored by a mini weather station (Vantage Pro TM & Vantage Pro2 Plus TM weather stations, Davis Instruments) during the sampling periods. Data were integrated into 30 min averages by a built-in program in the weather station. The collection and analysis of VOCs and OVOCs were detailed in our previous studies (Guo et al., 2009; H. Wang et al., 2018). Briefly, pre-cleaned and evacuated 2 L electropolished stainless-steel canisters were used to collect VOC samples. On O3 episode days, a 1 h sample was collected each hour during the daytime (07:00–19:00 LT; all times throughout the paper are in local time), generating 13 samples per day, while five to seven 1 h samples were collected every other hour on non-O3 episode days from 07:00 to 19:00 LT in the 2013 and 2016 sampling campaigns. However, 12 1 h samples were collected on each VOC sampling day between 07:00 and 18:00 in 2007, regardless of O3 episodes or non-episodes. The O3 episode days were predicted prior to sampling based on weather forecast and numerical simulation of O3. Overall, the O3 episodes were usually associated with high temperature, strong solar radiation, low humidity, and weak or northerly winds. A total of 414 canister samples, including 96 samples in 2007, 146 samples in 2013 and 172 samples in 2016, were collected and analyzed during the three sampling periods (Table S2).
In addition to VOC samples, OVOC samples were also collected on the same days as those for the collection of VOCs. Dinitrophenylhydrazine (DNPH)–silica cartridges (Waters Sep-Pak DNPH-Silica, Milford, MA) were used to collect the OVOC samples. An ozone scrubber (Sep-Pak; Waters Corporation, Milford, MA) was connected in front of the DNPH cartridge to prevent interference of ozone. The ozone scrubber was replaced every two OVOC samples. For each OVOC sample, air was drawn to pass the O3 scrubber and the cartridge for 2 h (2.5 h in 2007 sampling campaign) at a flow rate of 0.5 L min−1, which was controlled by a rotameter. During the sampling periods in 2013 and 2016, five to seven OVOC samples were collected every 2 h from 06:00 to 20:00 LT on both O3 episode and non-episode days. In 2007, only two samples were collected on non-O3 episode days at 10:30–13:00 and 13:00–15:30 and four samples between 08:00 and 18:00 on O3 episode days. In total, 275 OVOC samples (28 in 2007, 124 in 2013 and 124 in 2016) were collected and analyzed in the three sampling campaigns (Table S2).
2.3 Chemical analysis
2.3.1 Analysis of VOCs
The concentrations of 48 speciated non-methane hydrocarbons (NMHCs) in the canisters were determined with an Entech model 7100 preconcentrator (Entech Instruments Inc., California, USA) coupled with a gas chromatography mass selective detector (model 5973N, Agilent Technologies, USA), a flame ionization detector, and an electron capture detector (GC-MSD–FID–ECD). The NMHCs were analyzed in the Guangzhou Institute of Geochemistry (GIG), Chinese Academy of Sciences for the samples collected in both 2007 and 2013, and in The Hong Kong Polytechnic University (HKPolyU) for the samples collected in 2016. It should be noted that the GC-MSD–FID–ECD system in the latter two institutes was the same as that at UCI, and intercomparisons were performed regularly among the three institutes, which showed reasonably good agreements (Ling et al., 2014; H. Wang et al., 2018; Zeng et al., 2018). Detailed information about the analysis procedures and quality assurance and control can be found in Colman et al. (2001) and Simpson et al. (2010). Table S4 summarizes the limits of detection (LoDs), precisions and accuracies of the VOC analyses in the three institutes.
The OVOC samples were stored in a refrigerator at 4 ∘C after sampling. For analyses of OVOCs, the cartridges were eluted slowly with 2 mL of acetonitrile into a 2 mL volumetric flask. A high-performance liquid chromatography (HPLC) system (PerkinElmer series 2000, MA, USA) coupled with an ultraviolet (UV) detector operating at 360 nm was used for analysis. The instrument was calibrated using standards of five gradient concentrations covering the concentrations of interest for different OVOCs in ambient air. Good linear relationships (R2 > 0.999) between the standard concentrations and responses of the instrument were obtained for the 16 analyzed OVOC species. The built-in computerized programs of quality control systems such as auto-linearization and autocalibration were used to guarantee the data quality. Detailed information about the analysis and quality control of OVOC samples was provided in Cheng et al. (2014), Cui et al. (2016) and Ling et al. (2016b). Due to the low detection rate of many OVOCs, this study only focused on formaldehyde, acetaldehyde, acetone and propionaldehyde, which had relatively high concentrations.
2.4 Model description
2.4.1 Positive matrix factorization (PMF)
PMF is a receptor model that has been extensively used for source apportionment of airborne particulate matters and VOCs (Lee et al., 1999; Brown et al., 2007). In this study, U.S. EPA PMF 5.0 model (U.S. EPA, 2017) was applied to identify the sources of O3 precursors, according to Eq. (1) (Paatero, 1997; Ling et al., 2014).
where xij is the measured concentration of the jth species in the ith sample, gik represents the contribution of the kth source to the ith sample, fkj denotes the fraction of the jth species in the kth source, and eij is the residual for the jth species in the ith sample. p stands for the total number of independent sources (Paatero, 2000a, b).
The uncertainties of the concentrations applied to PMF were set in the same way as Polissar et al. (1998) and Reff et al. (2007). Values below or equal to the LoD were replaced by half of the LoDs and the uncertainties for these values were set as five-sixths of the corresponding LoDs. For the values greater than LoDs, the uncertainties were calculated as [(error fraction × concentration)2+ (LoD)2]1∕2, where 10 % was assigned as the error fraction. Missing values (mainly due to maintenance or malfunction of the instruments) were replaced by the geometric mean of the measured values and their accompanying uncertainties were set as 4 times the geometric mean value. More details about the settings of the uncertainty were provided in Norris et al. (2008) and Zhang et al. (2012).
The model was run for 20 times with a random seed, and tests with different number of factors were conducted. The optimum solution was finally determined based on both a good fit to the observed data and the most reasonable and interpretable results according to the knowledge on the sources of O3 precursors in Hong Kong (Ling et al., 2011, 2014; Ou et al., 2015).
2.4.2 Observation-based model (OBM)
A photochemical box model coupled with the Master Chemical Mechanism (PBM–MCM) was used to simulate the photochemical O3 formation on the VOC sampling days. In this study, MCM v3.2, a near-explicit chemical mechanism consisting of 5900 species and 16 500 reactions, which fully describes the homogeneous gas phase reactions in the atmosphere (Jenkin et al., 1997, 2003; Saunders et al., 2003), was used. The observation data of temperature, relative humidity, O3, SO2, CO, NO, NO2 and 52 C2-C10 VOCs and OVOCs were input into the model. Specifically, the 52 VOCs and OVOCs included 19 alkanes, 16 alkenes, 13 aromatics and four OVOCs, as shown in Table S5, where the statistics of the mixing ratios of VOCs and OVOCs are also presented. Though previous studies (Guo et al., 2013b; Ling et al., 2016b) indicated that secondary formation dominated the sources of OVOCs in Hong Kong, the primary emissions could not be neglected. Therefore, formaldehyde, acetaldehyde, acetone and propionaldehyde with relatively high abundances were constrained to the observed concentrations in the model, while the other OVOCs with low concentrations and low detection rates were simulated by the model. Nitrous acid (HONO) was not monitored in this study. The average diurnal cycle of HONO mixing ratios measured at the same site in autumn in 2011 (Xu et al., 2015) was input into the model to roughly represent its role in O3 formation and atmospheric radical chemistry. Due to the data limitation, the trends of HONO at TC in the three sampling campaigns were not traceable. However, the measurements at a background site in Hong Kong indicated comparable levels of HONO (p > 0.1) between autumn in 2012 and in 2018 (unpublished data). Therefore, adopting the HONO measured in 2011 as the inputs of the simulations in the three sampling campaigns was likely a plausible assumption, despite some uncertainties. The model was also tailored to the real situations in Hong Kong. Specifically, the height of the planetary boundary layer was allowed to vary from 300 m at night to 1400 m at noon. The photolysis rates were calculated according to the measured solar radiations by the Tropospheric Ultraviolet and Visible radiation model (Madronich and Flocke, 1999; Y. Wang et al., 2017), with the detailed method described in Lyu et al. (2017b). In addition to the chemical processes, the exchange between the lower troposphere and free troposphere and dry deposition were also considered in the model. The concentrations of air pollutants in the free troposphere were set according to the observations at a mountainous site in Hong Kong (Lam et al., 2013). The dry deposition rates were adopted from the previous studies (Lam et al., 2013; Saunders et al., 2003). The other physical processes were not included in the model, which might lead to insufficient description of the transport. However, since the model was constrained to the observations, which included the transported air pollutants, the regional transport was partially considered. In addition, the observations at 07:00 on each day were used to initiate each day's modeling, through which the effect of regional transport before the daytime modeling was also considered. We admit that the PBM–MCM cannot perfectly reproduce the real atmospheric processes. However, it performed well in describing the in situ photochemistry in previous studies (Lam et al., 2013; Ling et al., 2014; Lyu et al., 2017b; Y. Wang et al., 2017). Actually, the deficiency of PBM–MCM in consideration of the atmospheric dynamics enabled us to assess the contributions of regional transport to O3 in Hong Kong, based on the differences between the observed and simulated O3 (Y. Wang et al., 2017).
2.5 Simulation scenarios
The PBM–MCM simulates the in situ O3 photochemistry based on the observed O3 precursors. Figure S2 shows the average mixing ratios of some O3 precursors in different wind sectors. The higher levels of CO, ethyne, ethane, propane and toluene under northwest winds indicated the transport of these species from the PRD to Hong Kong. Meanwhile, O3 might also be transported to Hong Kong. Text S1 in the Supplement discusses the determination of the locally produced and regionally transported O3, as well as the uncertainties. Furthermore, to evaluate the contributions of VOC sources to the local O3 production, two scenarios of model simulation were performed, i.e., scenario A and scenario B. The scenario A simulated the O3 photochemistry in the whole air, which was constrained by the observed concentrations of all the O3 precursors. The model simulations in scenario B (including six assumed sub-scenarios) were constrained by the concentrations of O3 precursors with those contributed by individual sources being subtracted from the observed concentrations. Text S2 elaborates the setup of these scenarios. The simulated O3 in scenario A was regarded as the locally produced O3, as the observed O3 concentrations were not input to constrain the model. Bear in mind that the regional effects cannot be completely eliminated in this approach, due to the impacts of regional air on the observed concentrations of O3 precursors. The differences between scenario A and scenario B reflected the contributions of the individual sources to the simulated O3 production rate. It should be noted that due to the nonlinear relationships between O3 and its precursors, the subtraction approach only qualitatively rather than quantitatively evaluated the contributions of VOC sources to O3 production.
3.1 Observation overview
Figure 2 shows the hourly mixing ratios of O3 observed at TC in the autumns of 2007–2017 with the data on VOC sampling days being highlighted in red. It was found that the autumn O3 increased significantly from 2007 to 2013 (p < 0.01), with a rate of 0.34±0.002 ppbv yr−1. This was consistent with Y. Wang et al. (2017), who reported an overall increase rate of autumn O3 of 0.67±0.07 ppbv yr−1 at the same site for the period of 2005–2013. On the one hand, the discrepancy in O3 increasing rates might be due to the different statistics used to draw the rates, i.e., hourly values in this study and monthly averages in Y. Wang et al. (2017). On the other hand, the autumn O3 increased substantially from 23.9±0.97 ppbv in 2005 to 30.2±0.97 ppbv in 2007, much quicker than the increase between 2007 and 2013. Without the inclusion of the period of 2005–2007 might be another reason for the lower O3 enhancement calculated here. In contrast to the increased autumn O3 during 2007–2013, the autumn O3 decreased obviously from 2013 to 2017 (p < 0.01), at a rate of ppbv yr−1, indicating a fundamental alleviation of O3 pollution in Hong Kong in the last 5 years. Overall, a statistically significant decreasing trend (rate ppbv yr−1) was observed for the autumn O3 at TC from 2007 to 2017 (p < 0.05). The average O3 on VOC sampling days in the three sampling campaigns also followed the same pattern, which increased from 32.8±2.6 ppbv in 2007 to 36.9±2.3 ppbv in 2013 and decreased to 24.4±1.9 ppbv in 2016. Further, we investigated the number of O3 episode days in the autumns of the three VOC sampling years (see Fig. S3) and identified 15 (16.5 % of the autumn days, same below) and 16 (17.6 %) O3 episode days in 2007 and 2013, respectively. However, there was only five (5.5 %) O3 episode days in the autumn of 2016. Similarly, the O3 episode days accounted for 12.5 %, 26.3 % and 5.6 % of the 2007, 2013 and 2016 sampling campaigns, respectively. Therefore, the increase in O3 from 2007 to 2013 and the decrease in the following years could be represented by O3 observed in the three sampling periods.
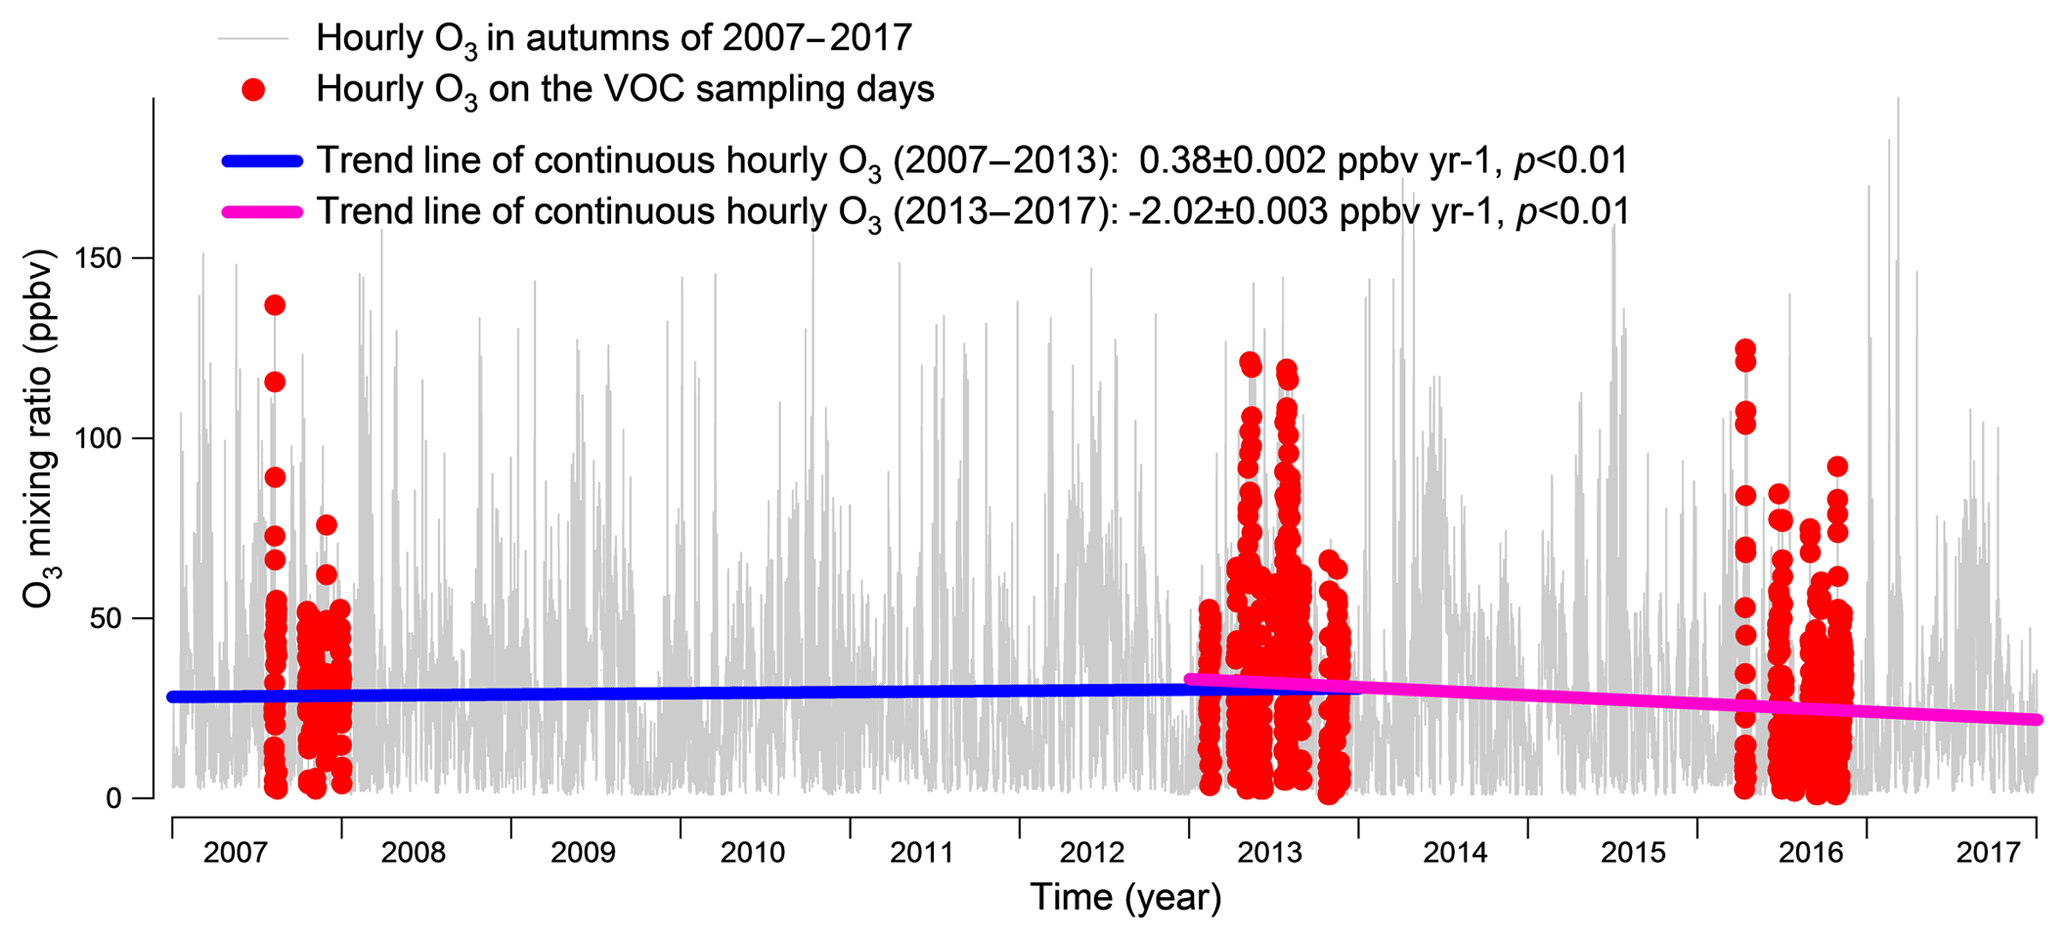
Figure 2Long-term trends of the observed O3 at TC from 2007 to 2017. Hourly O3 values on the VOC sampling days in the autumns of 2007, 2013 and 2016 are marked in red. The hourly variation rates of O3 are converted to yearly rates in the periods of 2007–2013 and 2013–2017.
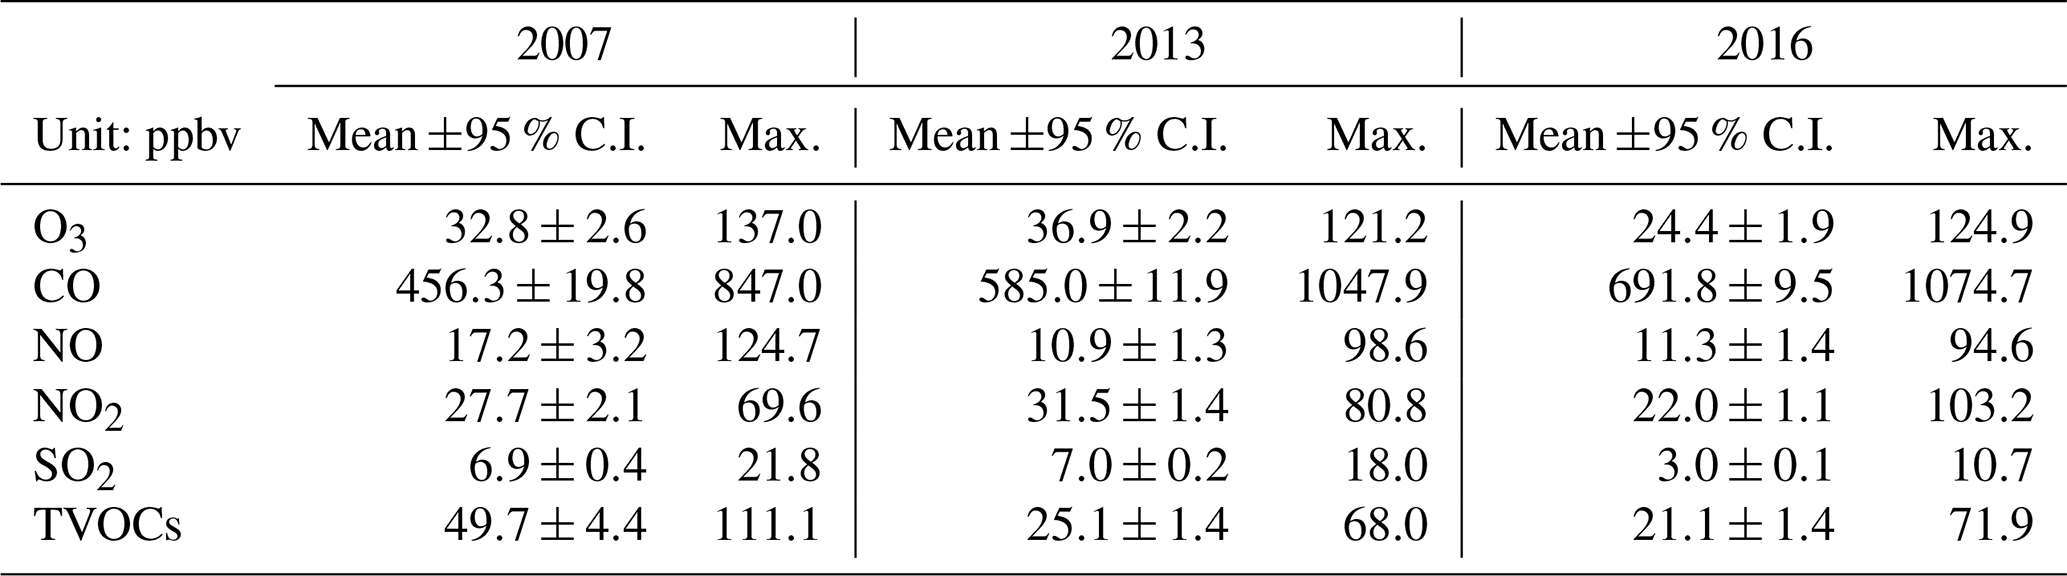
Tables 1 and S6 present the observed O3, CO, NO, NO2, SO2 and TVOCs, as well as the meteorological conditions averaged on the VOC sampling days in 2007, 2013 and 2016. From 2007 to 2013, the TVOCs decreased by nearly a half, which was expected to result in the reduction of O3 in view of the VOC-limited regime of O3 formation at TC (Cheng et al., 2010; Y. Wang et al., 2017). However, the increases in CO and the notable decrease in NO in 2013 could enhance the O3 production. The higher O3 in 2013 indicated that this effect overrode the reduction of TVOCs in influencing the O3 production. In particular, the decrease in NO meant the reduced NO titration to O3, which has been recognized as a primary reason for O3 increase in VOC-limited regime (Chou et al., 2006; H. Wang et al., 2018). From 2013 to 2016, the decrease in O3 was accompanied by the reductions of TVOCs and NO2, though CO remained increasing at the same time. NO2, as a direct source of O3 through photolysis, plays an important role in modulating the O3 variation. Though the causes of NO2 reduction are unknown to us, it might be one of the critical factors contributing to the decline of O3 in Hong Kong in recent years. Conversely, the increase in CO was also confirmed by the continuous monitoring data at TC, with a rate of 33.9±0.7 ppbv yr−1 between 2013 and 2016. In fact, the consistent increasing trend (p < 0.05) was also observed at the roadside sites in Hong Kong (not shown here). While the causes of CO increase in Hong Kong may be complicated, the increased vehicle emission is a plausible explanation. Studies (Johnson, 2008; Yao et al., 2008) revealed that while the new engine technologies performed well in reducing NOx emission, they might lead to the increased emission of CO, with the application of a lower air-to-fuel ratio and engine temperature.
In addition, studies have confirmed that continental anticyclones and tropical cyclones are conducive to severe O3 pollution in Hong Kong because these synoptic systems are often accompanied by northerly winds, high temperature, strong solar radiation, and relatively high pressure in Hong Kong (Ding et al., 2004; Huang et al., 2005; Jiang et al., 2015). Table S7 summarizes the number of O3 episode days with tropical cyclone, continental anticyclone and low-pressure trough in the autumns of 2007, 2013 and 2016. In autumn 2007, eight, eight and one O3 episode day(s) were found to be related to the tropical cyclone, continental anticyclone and low-pressure trough, respectively, with two O3 episode days under the combined influence of tropical cyclone and continental anticyclone. There were also 11 and five O3 episode days in association with tropical cyclone and continental anticyclone in autumn 2013, respectively (H. Wang et al., 2018). However, four out of the five episode days found in autumn 2016 were associated with tropical cyclone, with the other one related to low-pressure trough. Therefore, the lower O3 and fewer O3 episode days in 2016 were also benefited by the meteorological conditions.
Table 1Mixing ratios of the measured trace gases and TVOCs averaged on the selective 45 VOC sampling days in 2007, 2013 and 2016.
3.2 Model simulation of O3
3.2.1 Model validation
Figure 3 compares the simulated O3 in scenario A and the observed O3 on the VOC sampling days. Overall, both the magnitudes and the temporal patterns of the observed O3 were reasonably reproduced, though the mean of the simulated O3 (33.8±1.9 ppbv) was slightly lower than the observed average (37.1±2.0 ppbv). To quantitatively evaluate the model performance, the index of agreement (IOA) was used to examine the goodness of fit between simulated and observed O3. Within the range of 0–1, higher IOA represents better agreement between the simulated and observed values (Willmott, 1982). In this study, the overall IOA for the three sampling periods was 0.74, within the range of IOA (0.67–0.89) accepted by previous studies (Lyu et al., 2015, 2016a, c; N. Wang et al., 2015; Y. Wang et al., 2017, 2018). Good correlations (R2=0.61) were also shown between the simulated and observed hourly O3. Bearing in mind the deficiencies of the box model in describing the atmospheric dynamics, we believed that the modeling results were acceptable, but special attention and explanation to the discrepancies between the simulated and observed O3 were needed.
It was found that the discrepancies were most likely caused by the transport processes, i.e., vertical and horizontal transport, which were not fully represented in the PBM–MCM model (George et al., 2013; Lakey et al., 2015; Y. Wang et al., 2017). For example, the simulated O3 (maximum: 122.6 ppbv) was much higher than the observed O3 (maximum: 44.3 ppbv) on 16 November 2007, when the strong southeast winds (wind direction: 90–180∘) with the highest wind speed of 5.3 m s−1 prevailed in Hong Kong. The south sector winds from SCS might dilute the locally produced O3 and the O3 precursors/intermediates (such as the radicals), which were not constrained by the observations. The same circumstances were also observed on 27 October and 17 November 2007 and 11–12 September and 20 November 2013, with southeast winds dominating (74.4 %) during the daytime (Fig. 3). For those days with the simulated O3 lower than the observed O3, i.e., 3 and 22–25 October 2013 and 6 November 2016, 69.3 % of the winds during the daytime came from the north (wind directions: 0–90 and 270–360∘), which might transport the air masses laden with O3 and/or O3 precursors/intermediates not constrained to the observations from the inland PRD to the sampling site. The observed O3 mixing ratios are plotted against the wind fields in Fig. S4. It is obvious that O3 values were higher under the north winds, while they were lower in the south wind sectors, confirming the effects of dilution and regional transport of the south and north winds on O3 pollution in Hong Kong, respectively.
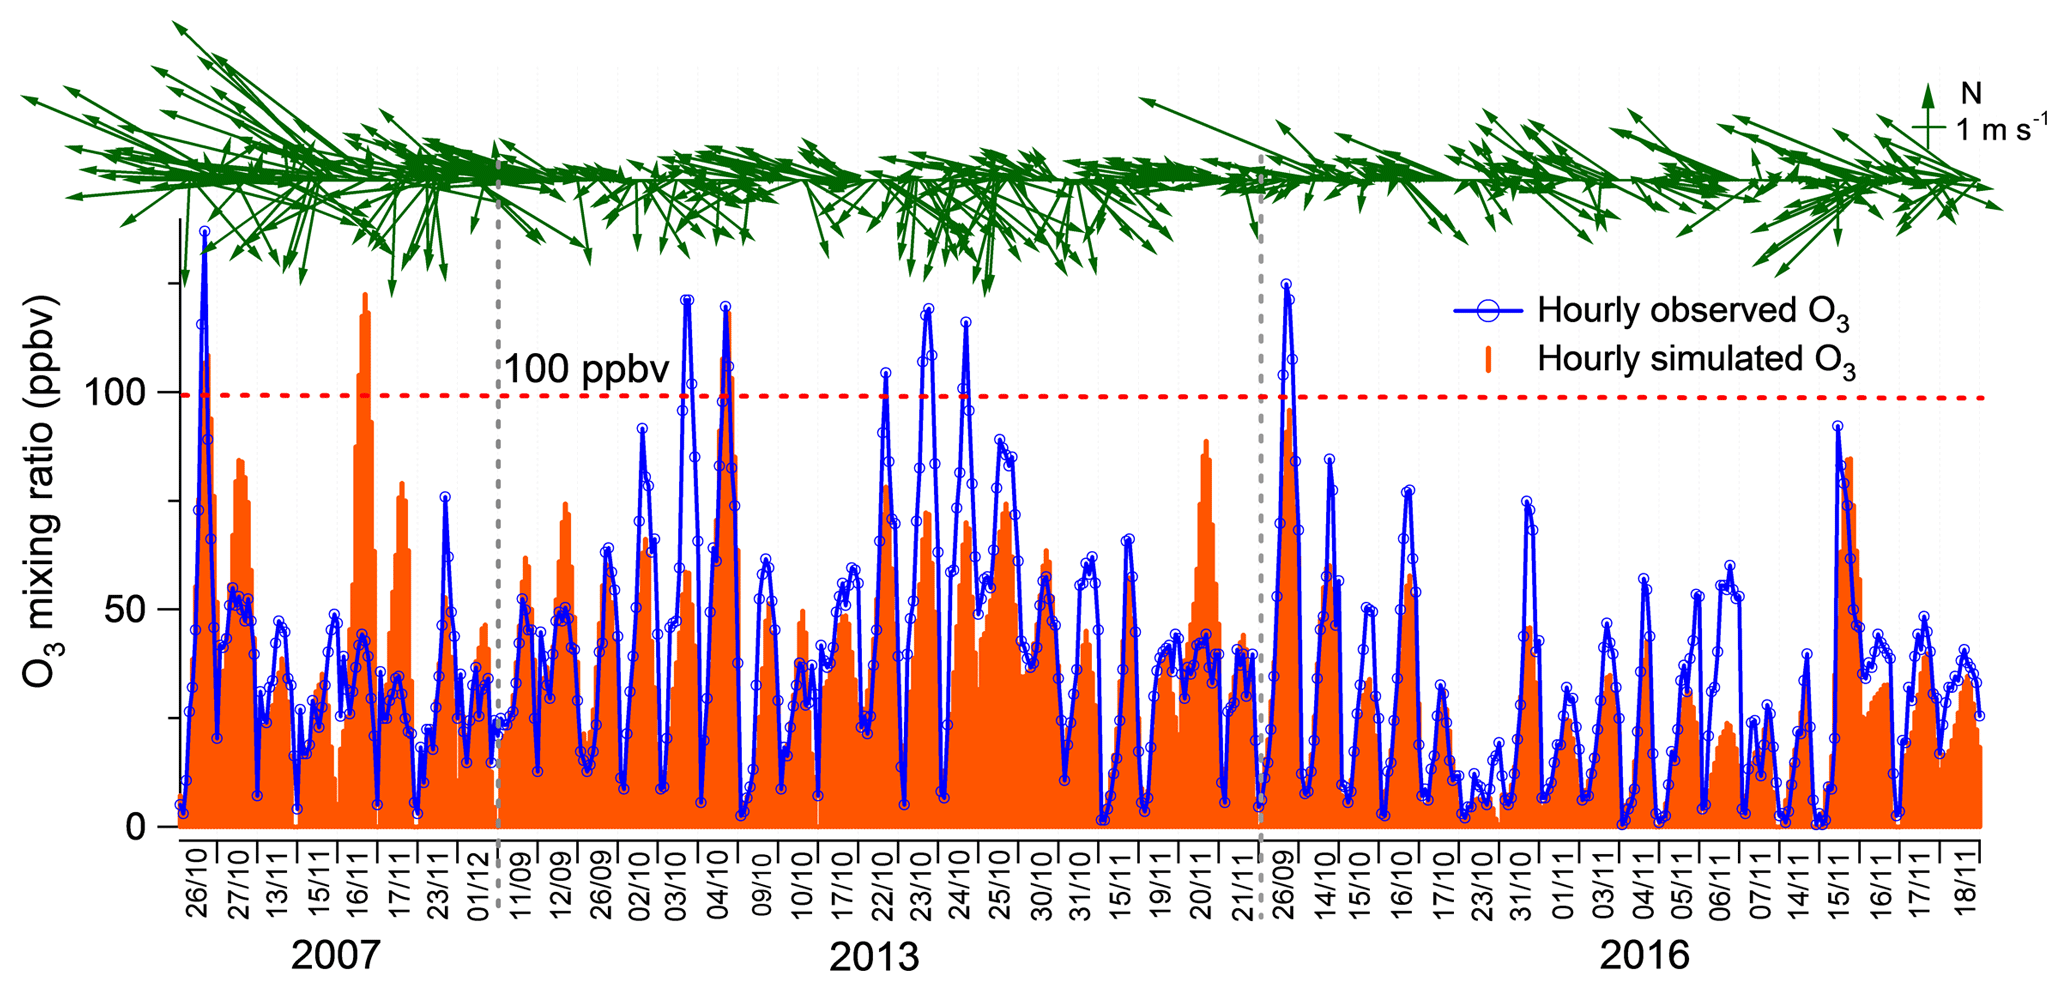
Figure 3Hourly mixing ratio of the simulated and observed O3 at TC during the VOC sampling periods in 2007, 2013 and 2016. The arrows represent the hourly wind sectors monitored at the sampling site.
3.2.2 Inter-annual variations in the locally produced and regional transported O3
As discussed in Sect. 2.5, the simulated O3 in scenario A could be regarded as the locally produced O3. Therefore, the differences between the observed O3 and simulated O3 in scenario A were treated as the regionally transported O3 (Y. Wang et al., 2017). It is noteworthy that some negative values were generated with this method, corresponding to the dilution of the south winds to the locally produced O3 as elaborated in Sect. 3.2.1. Figure 4 shows the hourly mixing ratios of the observed, local and regional O3 at TC in daytime hours (07:00–19:00 LT) of the three sampling campaigns. Overall, the observed O3 was mainly (88.7±2.5 %) contributed by the local photochemical production, with regional transport only accounting for 11.3±2.5 % of the observed daily maximum O3. However, regional transport was responsible for as high as 58.0±5.4 % of the observed daily maximum O3 in Hong Kong on the O3 episode days when northerly winds prevailed, indicating the heavy O3 burden superimposed by regional air masses from PRD. From 2007 to 2013, the simulated locally produced O3 remained statistically unchanged (p > 0.1), in contrast to the increase in observed O3 and regional O3 at rates of 1.78±0.05 ppbv yr−1 (p < 0.05) and 1.77±0.04 ppbv yr−1 (p < 0.05), respectively, the same trends as those reported by Y. Wang et al. (2017) for the autumn O3 during 2005–2013. However, the decrease in the locally produced O3 in the same period as that simulated by Y. Wang et al. (2017) was not seen here according to the simulated O3 in the 2007 and 2013 sampling campaigns. This discrepancy was likely caused by the limited samples in this study, with no OVOCs considered in Y. Wang et al. (2017) and/or not the same study periods between the two studies. Instead, we found that the locally produced O3 showed a significant decline at a rate of ppbv yr−1 during 2013–2016 (p < 0.05), when the regionally transported O3 did not change (p=0.32), resulting in a downward trend () of the observed O3. As such, the increase in the observed O3 from 2007 to 2013 was reversed by the decrease between 2013 and 2016, leading to an overall decreasing trend of the observed O3 during 2007–2016 (rate ppbv yr−1, p < 0.05).
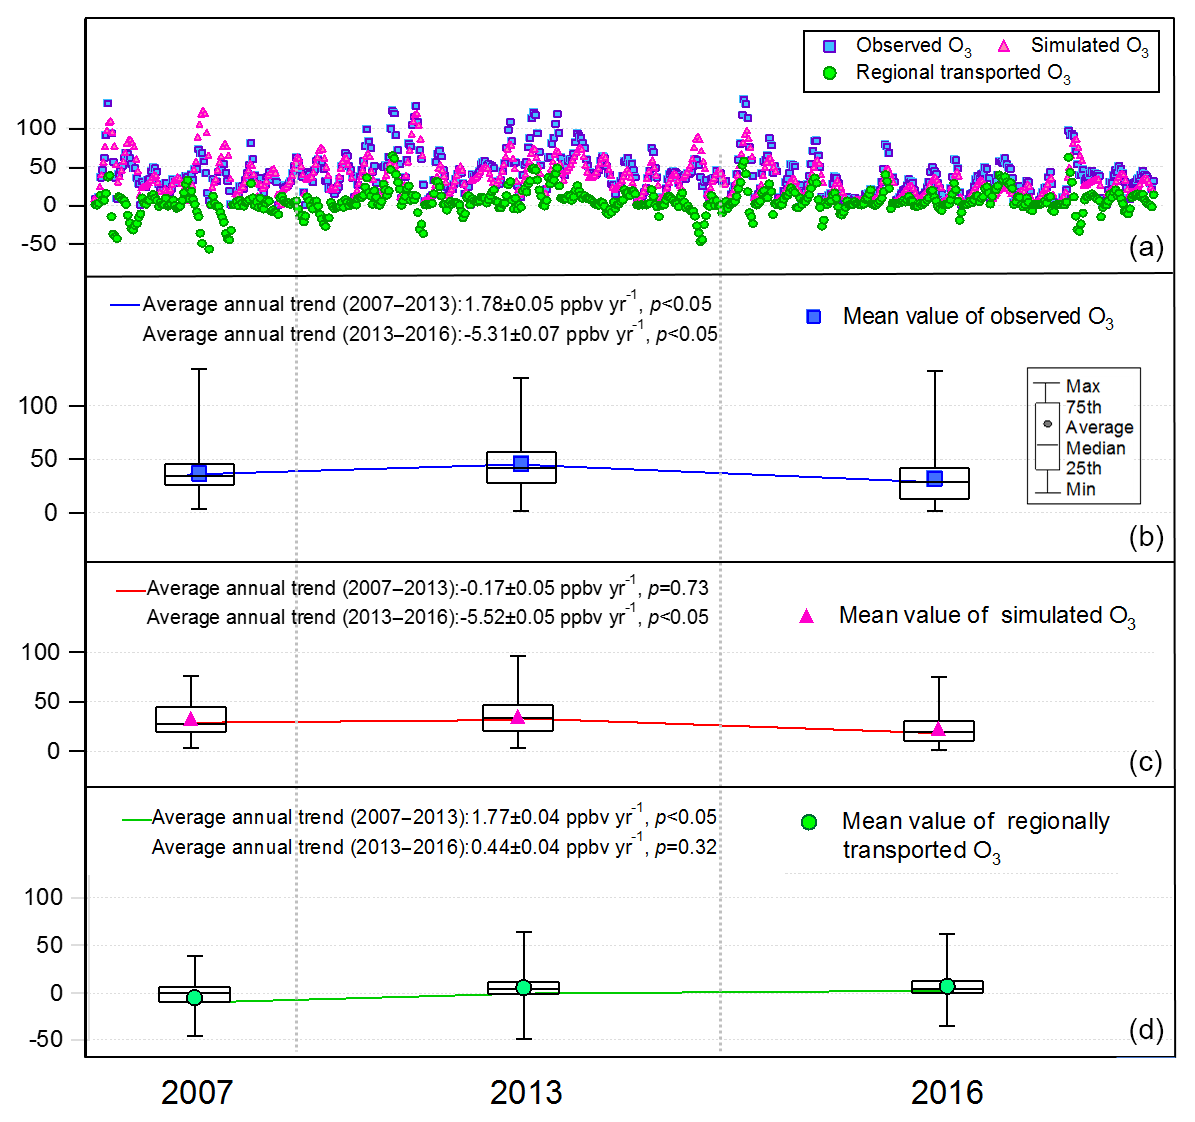
Figure 4Hourly values (a) and the throughout-campaign statistical results (b–d) of the observed, simulated (locally produced) and regional O3 mixing ratios in daytime hours (07:00–19:00 LT) in the three sampling campaigns.
The significant alleviation of O3 pollution in Hong Kong from 2013 to 2016 might be related to the measures taken to control the emissions of O3 precursors in Hong Kong and in mainland China. The effectiveness of the actions launched by the Hong Kong government in O3 abatement was fully demonstrated in previous studies (Xue et al., 2014a; Lyu et al., 2017a; Y. Wang et al., 2017), and would be further evaluated in this study (Sect. 3.4). In addition, the emission controls in mainland China might contribute to the decrease in O3 or at least lessen the regional O3 burden in this period. For example, China's NOx emissions for the first time showed a decreasing trend from 2013, benefiting from the implementation of China's Clean Air Action Plan (Zheng et al., 2018). Furthermore, we looked into the monthly average O3 observed at the 12 air quality monitoring stations across the inland PRD, including three regional monitoring stations, i.e., Tianhu, Wanqingsha and Jinguowan, and nine urban monitoring stations, i.e., Xiapu, Jinjuzui, Donghu, Tangjia, Liyuan, Huijingcheng, Zimaling, Luhu and Chengzhong (https://www.epd.gov.hk/epd/sc_chi/resources_pub/publications/m_report.html, last access: 10 April 2019). As shown in Fig. 5, O3 at these stations remained relatively stable (p=0.68) during 2006–2013, which however showed a contrastively decreasing trend at a rate of ppbv yr−1 from 2013 to 2016. This corroborated our modeling results that the regional contribution to O3 in Hong Kong ceased increasing or even began to decrease since 2013. While the substantial decrease in NOx was a plausible reason for the alleviated regional O3 pollution, meteorological variations might also play roles in modulating O3 variations in these years (Li et al., 2019). However, analyses on the causes are out of the scope of this study. In addition to the reduced local formation and regional transport of O3, the more favorable meteorological conditions in 2016 might be another reason for the O3 decrease, as discussed in Sect. 3.1.
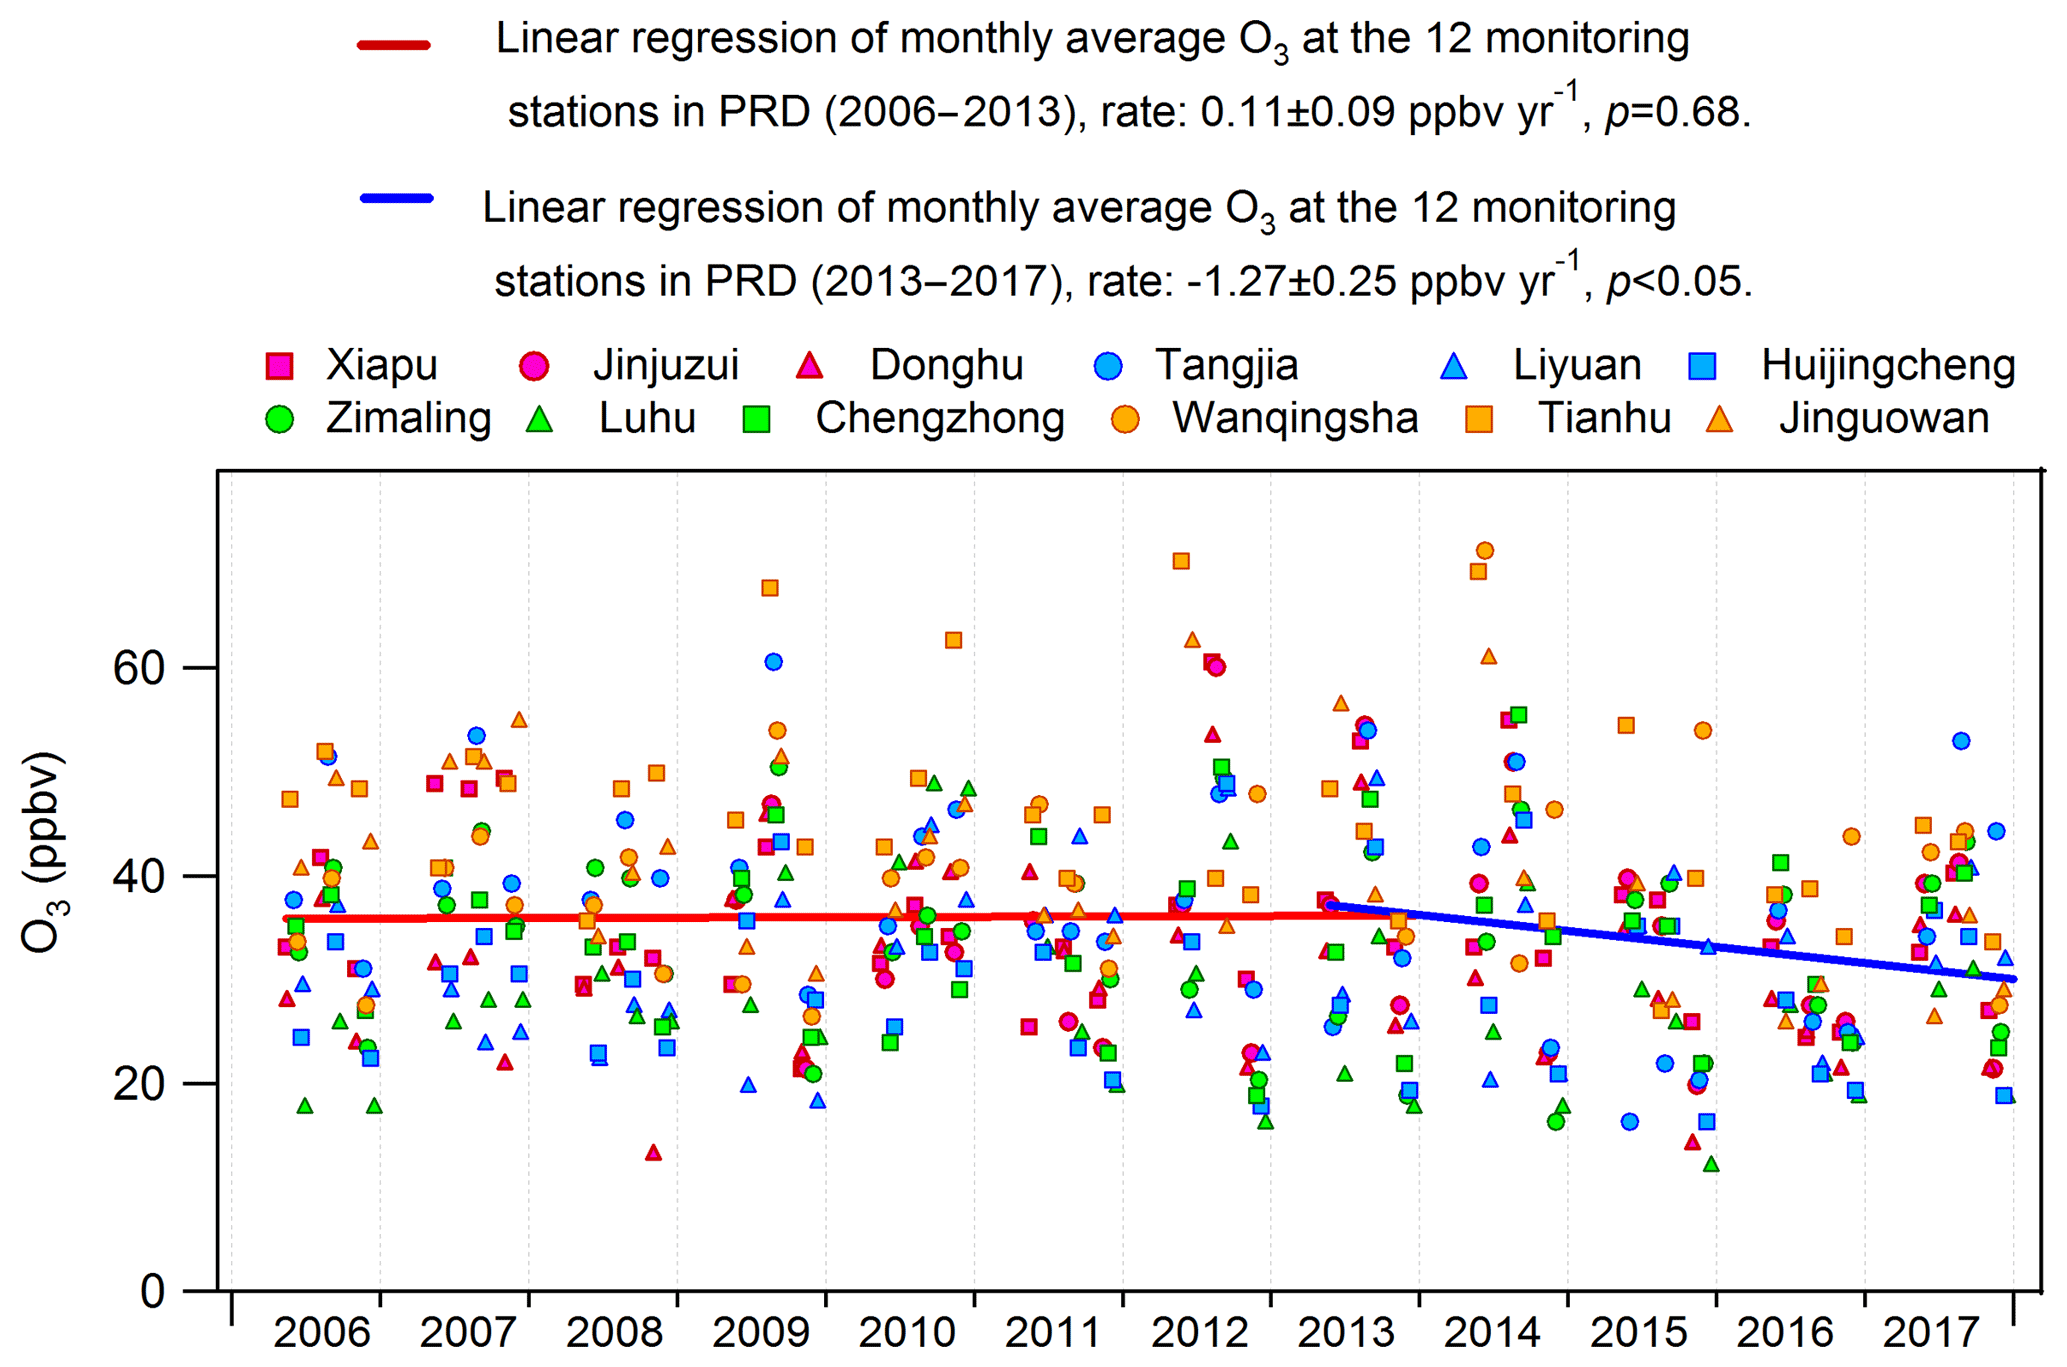
Figure 5Trends of the observed monthly average O3 at the 12 air quality monitoring stations in inland PRD.
3.3 Local production and destruction pathways of O3 and the OH radical
3.3.1 In situ net O3 production
Figure 6 shows the average diurnal profiles of the simulated O3 production and destruction pathways during the three sampling campaigns. Also shown are the average diurnal cycles of the simulated O3. The shift of the peaks between the net O3 production rate and the simulated O3 was due to the accumulation of the newly generated O3 over time in the model, which was also true in the real situations. The reactions between NO2 and O3, leading to the formation of NO3 and N2O5, in addition to dry deposition and aloft exchange, were the main depletions of the simulated O3 in the late afternoon. Consistent with previous studies (Kanaya et al., 2009; Liu et al., 2012; Xue et al., 2014b), these pathways were not included in the calculation of the net O3 production rate because we mainly focused on the photochemical processes in the hours when O3 was accumulated. It was found that the reaction between HO2 with NO dominated the O3 production rates in all the cases, with an average rate of 3.7±0.7 ppbv h−1 (56.5±1.1 %, percentage of the total O3 production rate, same below), 2.5±0.3 ppbv h−1 (64.3±0.8 %) and 1.4±0.2 ppbv h−1 (67.7±0.7 %) in the 2007, 2013 and 2016 sampling campaigns, respectively. In addition, the sum of the reaction rates between RO2 radicals and NO contributed 3.0±0.6 ppbv h−1 (43.5±1.1 %), 1.5±0.2 ppbv h−1 (35.7±0.8 %) and 0.7±0.1 ppbv h−1 (32.3±0.7 %) to the O3 production rate in 2007, 2013 and 2016, respectively.
The formation of HNO3 though the reaction between OH and NO2 served as the main scavenger pathway of O3, as NO2 would be photolyzed and produce O3 otherwise. On average, O3 was consumed in this way at a rate of ppbv h−1 (80.7±3.3 %, percentage of the total O3 destruction rate, same below), ppbv h−1 (79.3±1.8 %) and ppbv h−1 (81.6±2.0 %) in 2007, 2013 and 2016, respectively. The photolysis of O3 was the second contributor to O3 destruction, with an average contribution of ppbv h−1 (8.5±0.5 %) for the three sampling periods. In addition, the ozonolysis of unsaturated VOCs and the reactions between O3 and radicals (OH and HO2) were responsible for 3.5±0.3 % and 1.7±0.2 % of the total destruction rate of the locally produced O3, respectively.
Overall, the net local O3 production rate decreased from 5.2±1.1 ppbv h−1 in 2007, to 2.7±0.4 ppbv h−1 in 2013, until 1.4±0.3 ppbv h−1 in 2016, corresponding to the decline of the locally produced O3 from 2007 to 2016 (Sect. 3.2.2).

Figure 6Average diurnal profiles of the local O3 production and destruction rates in the sampling campaigns of (a) 2007, (b) 2013 and (c) 2016.
3.3.2 Recycling of OH radical
As one of the most important radicals in the atmosphere, OH initiates the oxidation of VOCs, leading to O3 formation. Figure 7 presents the average diurnal profiles of the simulated OH and the formation and loss pathways dominating the recycling of OH during the three sampling periods, which roughly followed the typical pattern of the intensities of photochemical reactions, i.e., higher at noon and lower at the beginning and end of the day. On average, the simulated OH concentration was comparable (p=0.4) between the 2007 sampling campaign ( molecules cm−3) and the 2013 sampling campaign ( molecules cm−3), but it decreased (p < 0.05) to molecules cm−3 in the 2016 sampling campaign.
As expected, the formation and loss rates of OH were basically balanced in all the cases. OH was mainly formed from the reaction of HO2+NO, which accounted for 69.8±1.1 % of the total OH production rate over the three sampling campaigns. The photolysis of HONO ranked second in supplying OH with the contribution of 22.0±1.4 %. As stated in Sect. 2.4.2, the average diurnal cycle of HONO measured at TC in 2011 was adopted in the simulations. To assess the uncertainties, we also calculated the HONO concentrations according to the measured HONO∕NOx ratios and the NOx concentrations at TC in the three sampling campaigns (Fig. S5). The uncertainties in HONO concentrations and in the contributions of HONO to OH formation and loss rates are discussed in Text S3. The formation of OH from HONO photolysis was most efficient in the early morning, which was explained by the morning peak of HONO concentration, due to the nocturnal heterogeneous formation and the vehicle emissions in morning rush hours. Apart from the two dominant pathways, O3 photolysis (6.3±0.2 %), ozonolysis of unsaturated VOCs (1.5±0.2 %) and H2O2 photolysis (0.2±0.01 %) also made some contributions to the formation of OH, with the highest rates at noon or in the early afternoon when the productions of O3 and H2O2 were the most intensive. To sum up, the total formation rates of OH from the primary sources (photolysis of HONO, O3 and H2O2, and ozonolysis of VOCs) were lower than the recycling rates of OH (HO2+NO) throughout the day at TC, consistent with the results in Xue et al. (2016) simulated at the same site. The dominant role of HO2+NO in OH formation at TC (average contribution of 69.8±1.1 %) might be related to the abundant NO at this site. The same pathway was simulated and accounted for only 42.7±0.2 % of the total OH formation rate at an island more than 40 km away from Hong Kong with very low NO concentrations, i.e., maximum of 0.56 ppbv (Y. Wang et al., 2018).
OH was mainly depleted by the reactions with VOCs (32.3±1.2 %), NO2 (31.9±0.9 %), CO (19.3±0.6 %) and NO (16.5±1.1 %). The reaction rates of OH+NO (formation rates of HONO) had the highest values in the morning, approximately in line with the diurnal pattern of the HONO photolysis rates, which however were not completely balanced due to the constraint of HONO to observations in the model. The average net photolysis rates of HONO (differences between the HONO photolysis and formation rates) were , and molecules cm−3 s−1 in the 2007, 2013 and 2016 sampling campaigns, respectively. The losses of OH through the other pathways all exhibited the highest efficiencies at noon or in the early afternoon. It should be noted that the reaction between OH and NO2 was not only the sink of OH but also a termination reaction in the photochemical system. In comparison, the termination reaction rates were lower than the OH formation rates from the primary sources (photolysis of HONO, O3 and H2O2, and ozonolysis of VOCs) in the morning (07:00–10:00 LT), which were reversed in the following hours of the day due to the increases in OH concentrations.
Consistent with the variations in the local O3 production, both the local formation and loss rates of OH decreased from 2007 to 2016 (p < 0.05), with much more obvious reductions in the later phase (2013–2016). On the one hand, the continuous reduction of VOCs resulted in lower HO2 and RO2 concentrations (Fig. S6), hence the lower production rate of OH through the reaction of HO2+NO. At the same time, the destruction rates of OH also decreased due to the reductions of OH and the O3 precursors, except for CO (Fig. 7 and Table 1). The decreases in the OH production and destruction rates indicated that the propagation of the reaction cycles, namely the recycling of OH, became slower from 2007 to 2016. This also explained why the locally produced O3 decreased in these 10 years, since O3 is formed with the consumption and recycling of OH radical.

Figure 7Average diurnal cycles of the OH formation and loss rates during the sampling periods in (a) 2007, (b) 2013 and (c) 2016.
3.4 Source contributions to the production of O3 and radicals
3.4.1 Source apportionment
To resolve the sources of O3 precursors, 27 species, including CO, NO, NO2, 12 alkanes, four alkenes and eight aromatics, were applied to PMF for source apportionment. These species were of either high abundances or typical tracers of VOC sources in Hong Kong. Source apportionment was conducted for a total of 414 samples covering the three sampling periods, so that the uncertainty of the source apportionment results could be reduced, compared to separate source apportionments for each of the three sampling periods. Figure 8 shows the average profiles of the six sources resolved by PMF. The modeling errors were estimated with the bootstrap method integrated in PMF (Brown et al., 2015).
Factor 1 was assigned as the combination of LPG usage and gasoline evaporation, in view of the high loadings of C2–C5 hydrocarbons. Specifically, propane and i-/n-butanes are the main components of LPG in Hong Kong, and gasoline evaporation generally contains large quantities of i-/n-pentanes, in particularly i-pentane (Guo et al., 2013a; Lyu et al., 2017a). Factor 2 was characterized by moderate to high percentages of i-/n-pentanes and TEX (toluene, ethylbenzene and xylenes). These species are commonly seen in gasoline exhausts. Therefore, we defined this factor as gasoline exhausts. Both the third and fourth factors indicated solvent-related emissions. While Factor 3 likely represented household solvent usage, due to the dominance of hexane and hexane isomer (3-methylpentane) (Ling and Guo, 2014; Ou et al., 2015), Factor 4 was more related to emissions from coatings and paints, in view of the dominance of the aromatics (Ling and Guo, 2014). Factor 5 was distinguished by the high concentrations of ethane, ethene, ethyne and benzene, together with the relatively heavy (C7–C10) alkanes, which are typical species in diesel exhausts (Schauer et al., 1999; Kashdan et al., 2008; Sahoo et al., 2011). Therefore, this factor was designated as diesel exhausts. The last factor was denoted as biogenic emissions (BVOCs), due to the exclusive dominance of isoprene (Guenther, 2006).
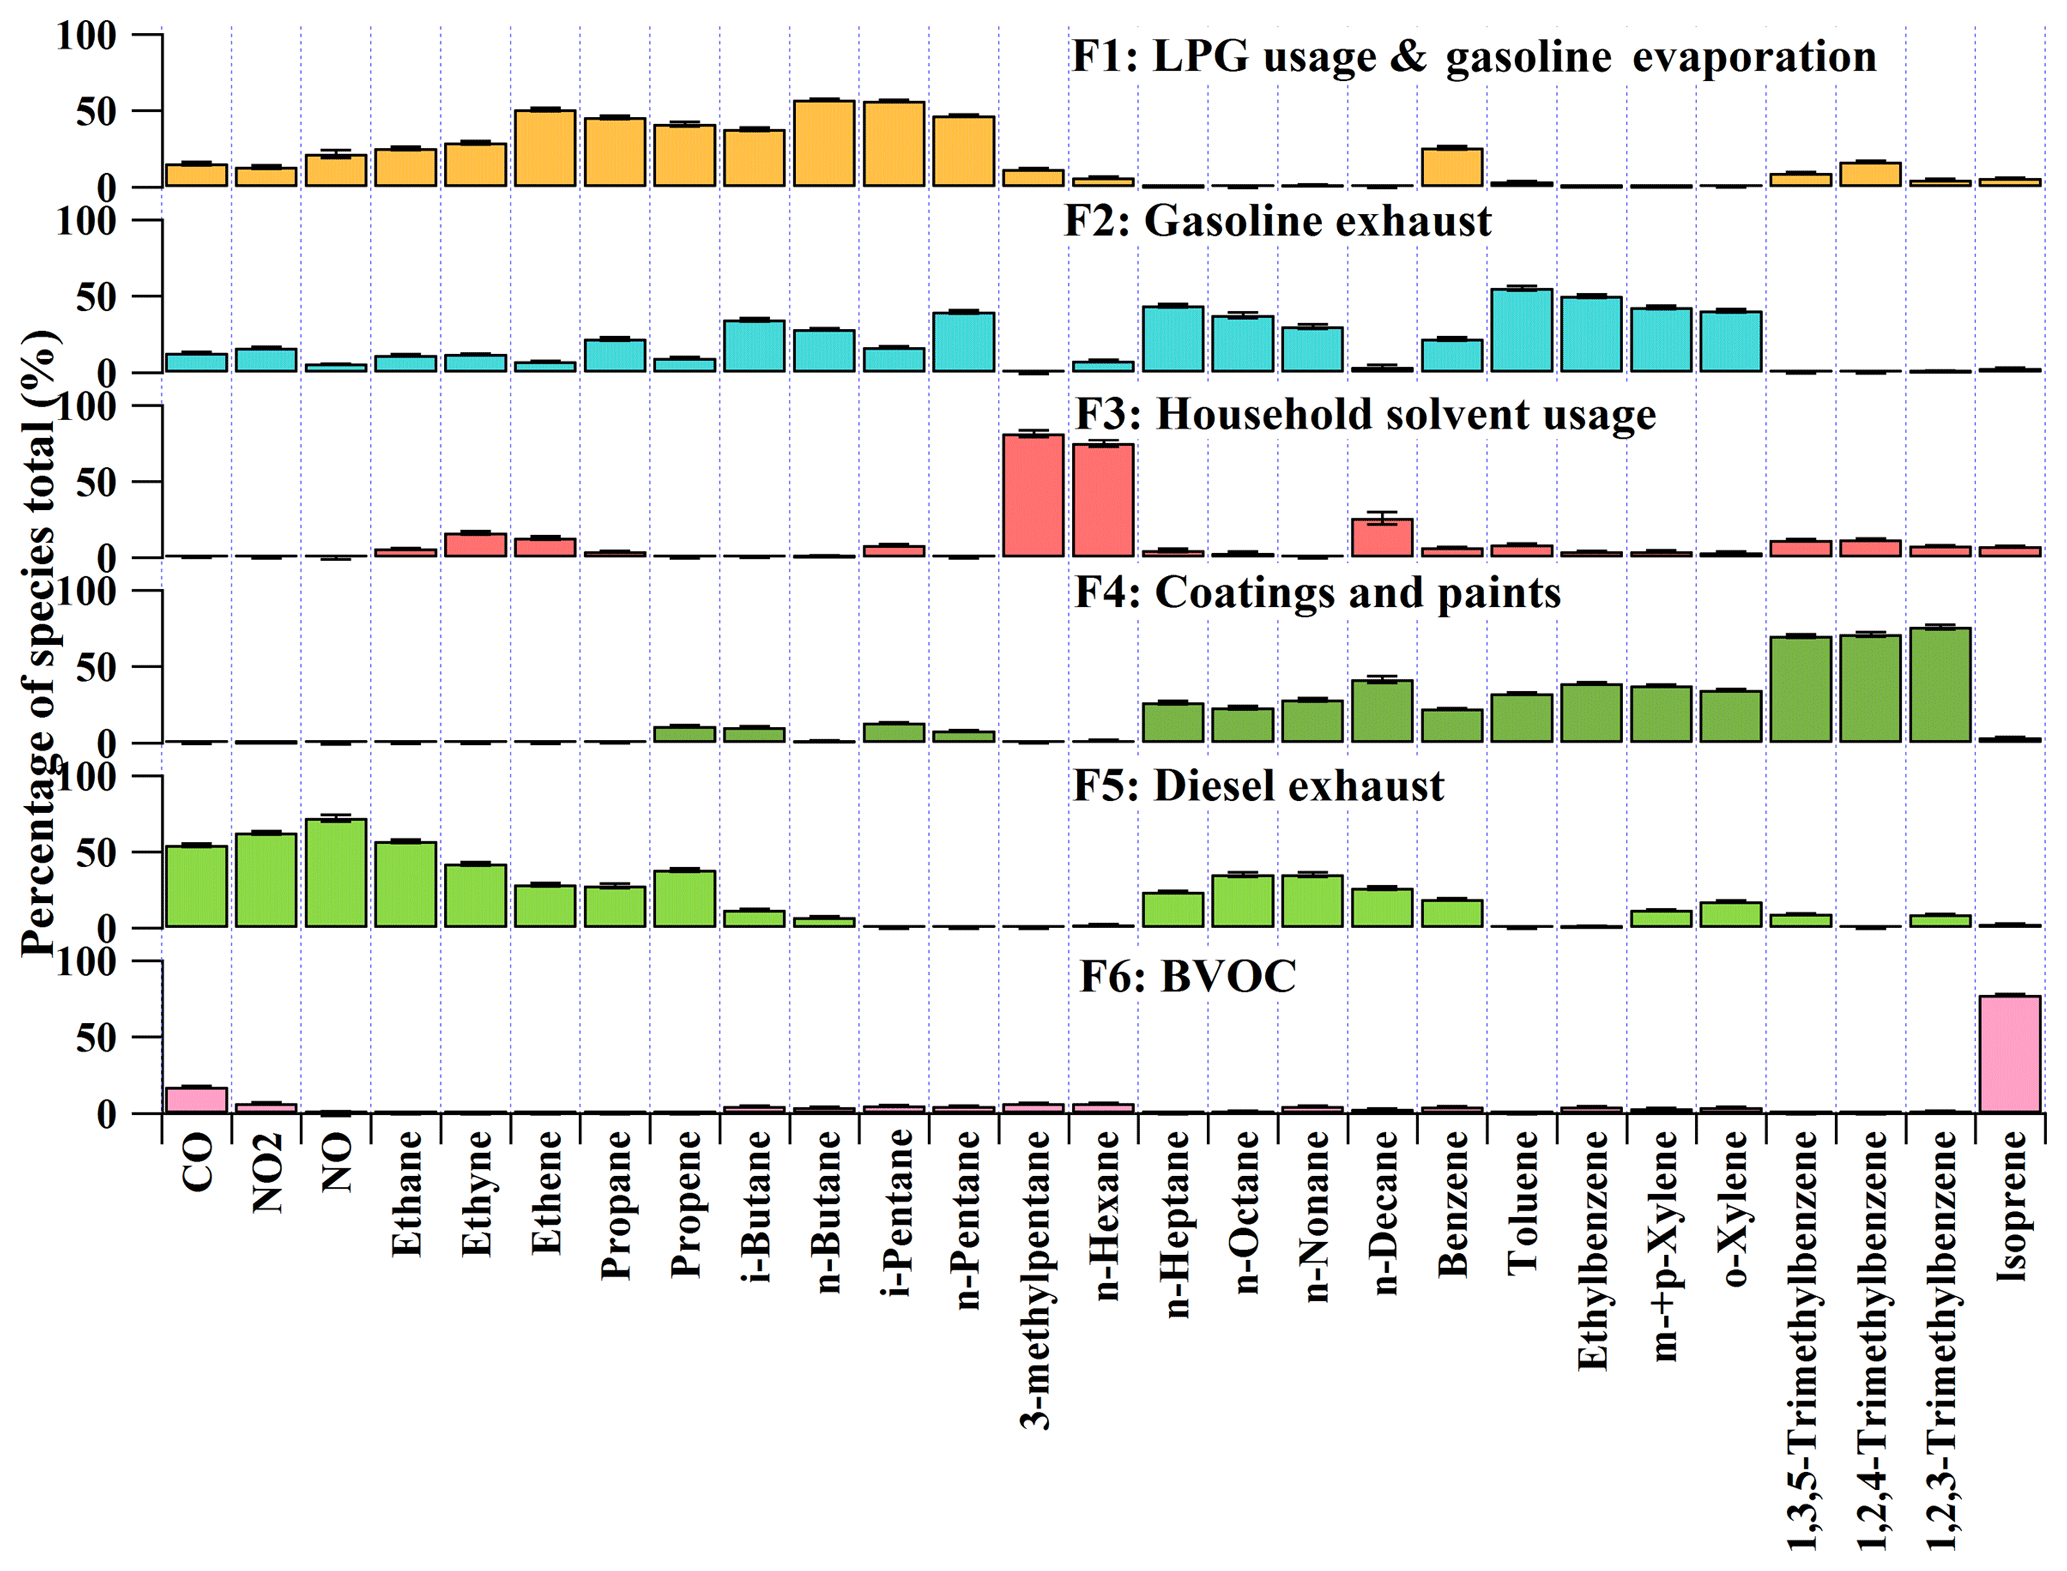
Figure 8Average profiles of the O3 precursors sources at TC in the three sampling campaigns. The uncertainties were estimated with the bootstrap method in PMF.
Figure S7 presents the total mixing ratio of VOCs emitted from each individual source extracted from PMF during the three sampling periods in Hong Kong. The VOC emissions from LPG usage and gasoline evaporation decreased significantly (p < 0.05) at a rate of ppbv yr−1 from 2007 to 2016. However, the VOCs in association with gasoline exhausts experienced an increase (rate ppbv yr−1, p < 0.05) in these years, indicating that the reduction of VOC emissions from LPG usage and gasoline evaporation was not attributable to the change in emissions of gasoline-fueled vehicles. Insight into the mixing ratios of propane and i-/n-butanes (LPG tracers) in this source revealed a significant decline from 3.51±0.52 ppbv in the 2007 sampling campaign to 1.27±0.11 ppbv in the 2016 sampling campaign. Therefore, the reduction of VOC emissions from LPG usage was most likely the reason of the decrease in VOCs allocated to the source of LPG usage and gasoline evaporation. In fact, it was confirmed by our previous studies (Lyu et al., 2016b; Yao et al., 2019) that the replacement of catalytic converters on LPG-fueled vehicles during September 2013–May 2014 effectively reduced the VOC emissions from LPG-fueled vehicles in Hong Kong. In addition, the variations in LPG usage in the inland PRD, where LPG was extensively used as vehicular and domestic fuels (Liu et al., 2008), might also contribute to the emission reduction of VOCs, in view of the decrease in LPG tracers in this source from 2007 (3.51±0.52 ppbv) to 2013 (2.04±0.27 ppbv), when no control was performed against LPG-fueled vehicle emissions in Hong Kong. The VOCs emitted from solvent usage (including the household solvent, coatings and paints) also decreased significantly (p < 0.05) from 2007 to 2016, likely benefiting from the actions taken to restrict the VOC contents in solvent products starting from 2007 (phase I) and 2010 (phase II) in Hong Kong (Lyu et al., 2017a). VOCs attributable to diesel exhausts decreased (p < 0.05) from the 2007 (2.6±0.3 ppbv) to 2013 sampling campaign (2.0±0.2 ppbv), which however were unchanged between 2013 and 2016 (2.2±0.2 ppbv). In fact, a subsidy program has been implemented in Hong Kong since 2007 to progressively eliminate the pre-Euro IV diesel vehicles or to upgrade their emission standards to Euro IV (HKEPD, 2017b), and the effectiveness of this program in VOC reductions until 2013 was confirmed by Lyu et al. (2017a) with the online measurement data at the same site. However, while phase III of this program (2014–2019) is still ongoing, the VOCs emitted from diesel vehicles remained stable between the 2013 and 2016 sampling campaigns. This undesirable result might be due to the fact that the actions were mainly targeted at the pre-Euro, Euro I and Euro II diesel vehicles before 2013, whereas phase III of the program initiated in 2014 focused on the Euro III vehicles (HKEPD, 2017b, 2018). Since the former were vehicles with higher emissions, it is not unreasonable that reduction of VOCs was more discernible between 2007 and 2013. Further, the effectiveness of the phase III program might be somewhat offset by the wearing-out of the pre-existing vehicles and the increase in diesel vehicle populations (Competition Commission, 2017). Further evaluation with more data in a longer period is recommended. At last, the increase in BVOCs from 2007 to 2013 but comparable levels between 2013 and 2016 seemed to be related to the lower (p < 0.05) temperature in the 2007 sampling campaign (Fig. S8 and Table S6). In addition, the more frequent (62.8 %) southeast winds from SCS with higher wind speeds (2.3±0.2 m s−1) might dilute BVOCs emitted from the terrestrial plants in the 2007 sampling campaign.
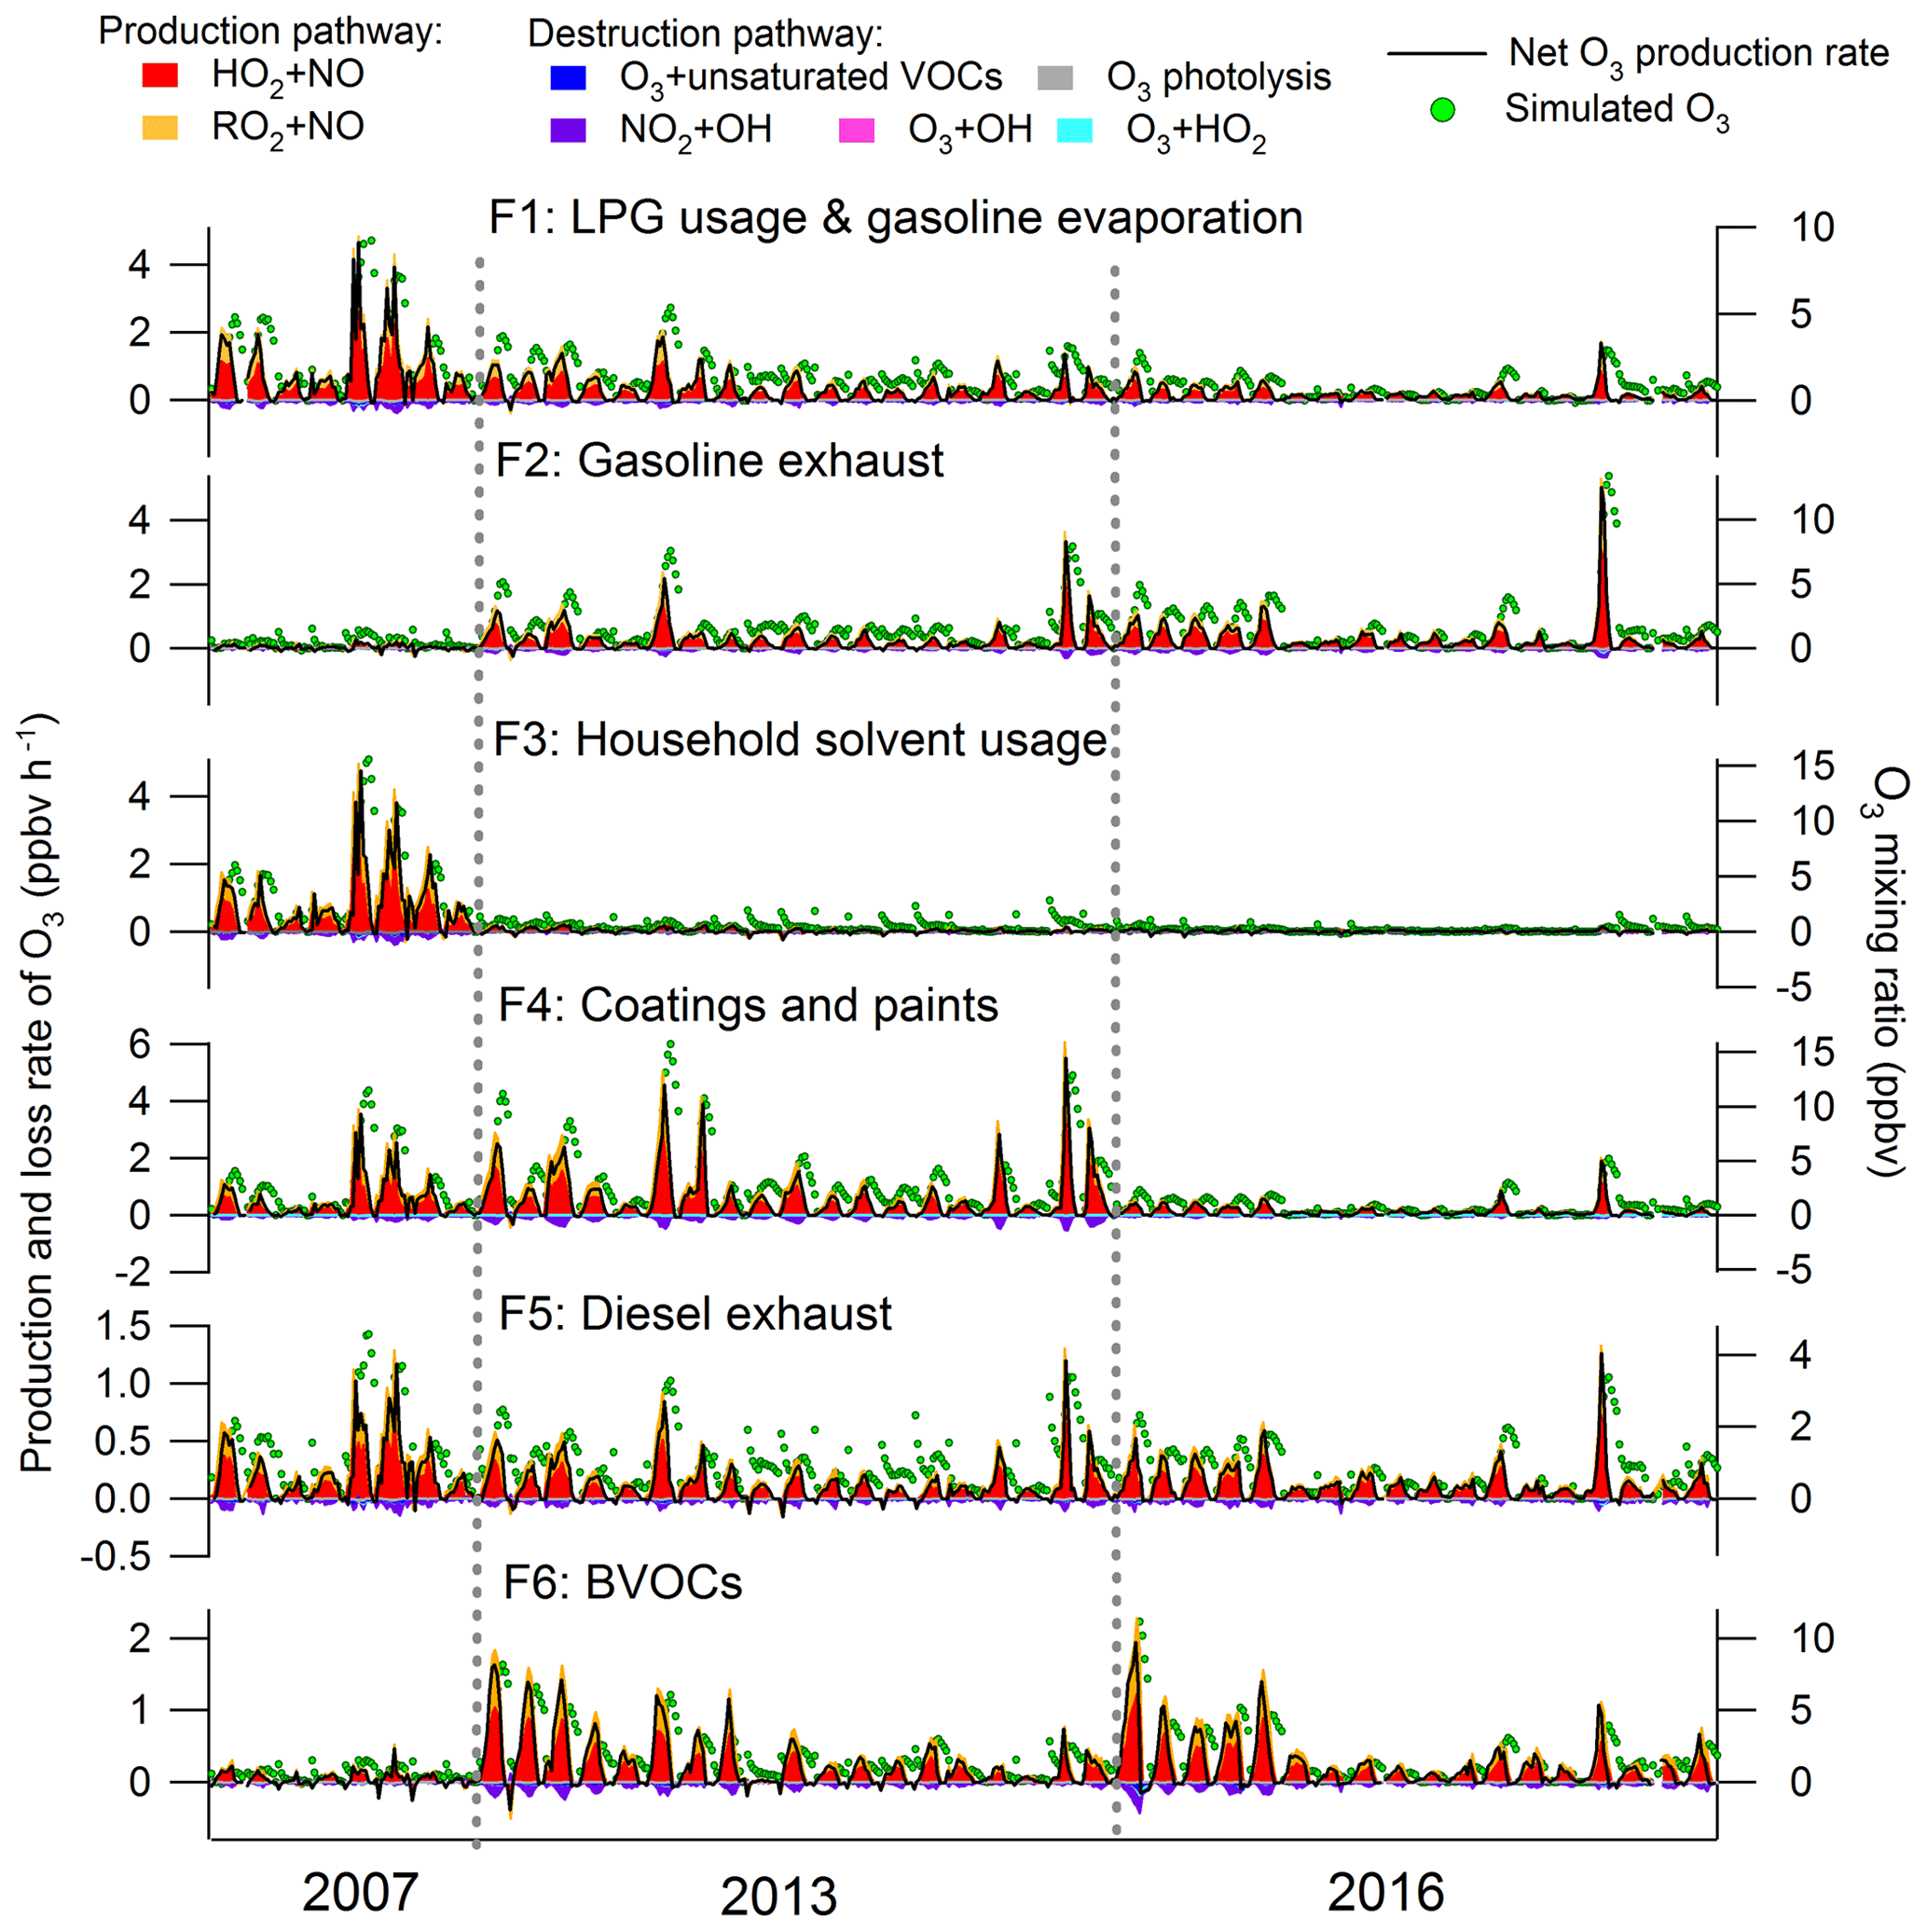
Figure 9Contributions of VOCs in individual sources to the production and destruction rates of O3 and to the O3 mixing ratios in the three sampling campaigns.
3.4.2 Source contributions to O3 production
Figure 9 presents the contributions of VOCs emitted from individual sources to the production and destruction rates of O3, as well as the simulated contributions to the O3 mixing ratios. NOx was not included in these analyses because of its relatively high uncertainties in source apportionment results due to the short lifetimes. Consistent with the O3 production and destruction in the whole air, the pathway of HO2+NO dominated over the reactions between RO2 and NO in O3 production for all the individual sources. The destruction of O3 was mainly driven by NO2 reacting with OH. For the net O3 production rate, VOCs attributable to the coatings and paints made the largest contribution (0.38±0.05 ppbv h−1), followed by gasoline exhausts (0.22±0.03 ppbv h−1), LPG and gasoline evaporation (0.21±0.03 ppbv h−1), BVOCs (0.19±0.03 ppbv h−1), household solvent usage (0.15±0.04 ppbv h−1) and diesel exhausts (0.13±0.01 ppbv h−1). Despite some peak shifts for the reasons illustrated in Sect. 3.3.1, the O3 mixing ratios elevated by the individual sources followed the same pattern as the net O3 production rates, with the highest O3 enhancement (1.92±0.21 ppbv) from the source of coatings and paints and the lowest increase from household solvent usage (0.86±0.06 ppbv) and diesel exhausts (0.83±0.06 ppbv). The contributions of source-specific VOCs to O3 production, particularly the importance of solvent usage in O3 formation in Hong Kong, were generally in line with previous studies (Ling and Guo, 2014; Ou et al., 2015). This was actually expected according to the reactivity of major VOCs in each source. For example, the TEX in the source of coatings and paints (Fig. 8) has been identified to be of high O3 formation potentials (Lau et al., 2010; Ling et al., 2011, 2013). However, the PBM–MCM model simulations enabled us to quantitatively evaluate the contributions of VOC sources to O3 production rates.
From a historical perspective, we found that the contribution of LPG usage and gasoline evaporation to O3 production significantly decreased (p < 0.05) from the 2007 to 2016 sampling campaign (2007: 0.51±0.11 ppbv h−1; 2013: 0.20±0.03 ppbv h−1; 2016: 0.10±0.02 ppbv h−1), which coincided with the variations in VOCs emitted from LPG-fueled vehicles as discussed above. Gasoline exhaust contributed much less (p < 0.05) to the net O3 production rate in 2007 (0.02±0.01 ppbv h−1) than those in 2013 (0.26±0.05 ppbv h−1) and 2016 (0.27±0.07 ppbv h−1), in line with the variations in VOCs emitted from this source. The reductions of VOC emissions from solvents also resulted in the consistent decrease in the net O3 production rate from 1.22±0.17 ppbv h−1 in the 2007 to 0.14±0.05 ppbv h−1 in the 2016 sampling campaign. The O3 production rates contributed by VOCs in diesel exhausts were reduced from 2007 (0.21±0.05 ppbv h−1) to 2013 (0.11±0.02 ppbv h−1) and remained unchanged thereafter (2016: 0.11±0.02 ppbv h−1). The O3 production rate traceable to BVOCs showed a significant increase from 2007 (0.04±0.02 ppbv h−1) to 2016 (0.22±0.04 ppbv h−1) since the mixing ratios of BVOCs significantly increased (p < 0.05) in these years. It is noteworthy that the changes in meteorological conditions in these three sampling campaigns might also partially account for the variations in the source contributions to O3 production. For example, the 2013 sampling campaign was characterized by the relatively higher temperature and lowest relative humidity among the three sampling periods, which favored O3 formation in 2013 (Table S6). In addition, due to limited samples in this study, we recommend further assessments with more data in longer periods to be carried out in future study.
Photochemical pollution with high and increasing concentrations of O3 has been an important environmental issue in south China. With the observation data of O3 and its precursors at a suburban site in Hong Kong, downwind of south China, this study analyzed the inter-annual variations in O3 and its photochemistry, as well as the contributions of VOC sources to the local O3 production rates in 2007, 2013 and 2016. To our knowledge, this is the first time that a substantial alleviation of O3 pollution in this region was identified between 2013 and 2016, in contrast to the repeatedly confirmed O3 increase before 2013. In addition to the changes in meteorological conditions among the three sampling campaigns, the termination of the rise in regionally transported O3 and the decrease in the local O3 production rate contributed to the decline of O3 in the later period. The emission reductions (particularly for NOx) in mainland China starting from 2013, the year when China's Clean Air Action Plan was launched, might more or less play a role in ceasing the increase in regional O3. In Hong Kong, the replacement of catalytic converters and the constraints of VOC contents in solvent products led to the reductions of VOC emissions from LPG-fueled vehicles and solvent usage, respectively. As a result, the local O3 production rate and the recycling rate of the OH radical decreased substantially from 2013 to 2016. Though the variations in meteorological conditions and the limited sample size might somewhat introduce uncertainties to the conclusions drawn from the present study, it is plausible that the local and regional interventions were effective on the control of O3 pollution in Hong Kong. Nevertheless, studies with more data in longer periods should be conducted, not only in Hong Kong but also in mainland China where O3 is still increasing in most of the territories.
The data are accessible at https://drive.google.com/file/d/1rPH8TQMGvnGKjAwTYcNveqtCi_zo019R/view?usp=sharing (Liu, 2019)
The supplement related to this article is available online at: https://doi.org/10.5194/acp-19-5127-2019-supplement.
HG and FJ initiated and designed the experiments, and XuL and XiL carried them out. XiL and YW developed the model code and performed the simulations. XuL and XiL prepared the paper and HG finalized the paper with contributions from all co-authors. XuL and XiL are contributed equally to this work.
The authors declare that they have no conflict of interest.
This study was supported by the National Key R&D Program of China via grant no. 2017YFC0212001, Research Grants Council of the Hong Kong Special Administrative Region Government via grants PolyU 152052/14E, PolyU 152052/16E and CRF/C5004-15E, the Public Policy Research Funding Scheme from Policy Innovation and Co-ordination Office of the Hong Kong Special Administrative Region Government (project number 2017.A6.094.17D), and the Hong Kong Polytechnic University PhD scholarships via research project no. RUDC.
This paper was edited by Leiming Zhang and reviewed by three anonymous referees.
Ashmore, M. R.: Assessing the future global impacts of ozone on vegetation, Plant. Cell. Environ., 28, 949–964, 2005.
Bell, M. L., McDermott, A., Zeger, S. L., Samet, J. M., and Dominici, F.: Ozone and short-term mortality in 95 US urban communities, 1987–2000, JAMA-J. Am. Med. Assoc., 292, 2372–2378, 2004.
Brown, S. G., Frankel, A., and Hafner, H. R.: Source apportionment of VOCs in the Los Angeles area using positive matrix factorization, Atmos. Environ., 41, 227–237, 2007.
Brown, S. G., Eberly, S., Paatero, P., and Norris, G. A.: Methods for estimating uncertainty in PMF solutions, Sci. Total Environ., 518, 626–635, 2015.
Census and Statistics Department (CSD): 2011 Population Census in Hong Kong, available at: https://www.census2011.gov.hk/en/constituency-area-i.html (last access: 25 October 2018), 2011.
Census and Statistics Department (CSD): District profile for 2016 Population Census in Hong Kong, available at: https://www.bycensus2016.gov.hk/en/bc-dp.html, last access: 25 October 2018.
Cheng, H. R., Guo, H., Wang, X. M., Saunders, S. M., Lam, S. H. M., Jiang, F., Wang, T. J., Ding, A. J., Lee, S. C., and Ho, K. F.: On the relationship between ozone and its precursors in the Pearl River Delta: application of an observation-based model (OBM), Environ. Sci. Pollut. R., 17, 547–560, 2010.
Cheng, H. R., Saunders, S. M., Guo, H., Louie, P. K. K., and Jiang, F.: Photochemical trajectory modeling of ozone concentrations in Hong Kong, Environ. Pollut, 180, 101–110, 2013.
Cheng, Y., Lee, S. C., Huang, Y., Ho, K. F., Ho, S. S. H., Yau, P. S., Louie, P. K. K., and Zhang, R. J.: Diurnal and seasonal trends of carbonyl compounds in roadside, urban, and suburban environment of Hong Kong, Atmos. Environ., 89, 43–51, 2014.
Chou, C. C. K, Liu, S. C., Lin, C. Y., Shiu, C. J., and Chang, K. H.: The trend of surface ozone in Taipei, Taiwan, and its causes: Implications for ozone control strategies, Atmos. Environ., 40, 3898–3908, 2006.
Colman, J. J., Swanson, A. L., Meinardi, S., Sive, B. C., Blake, D. R., and Rowland, F. S.: Description of the analysis of a wide range of volatile organic compounds in whole air samples collected during PEM-Tropics A and B, Anal. Chem., 73, 3723–3731, 2001.
Competition Commission: Report on Study into Hong Kong's Auto-fuel Market, available at: https://www.compcomm.hk/en/media/press/files/Full_Report_Auto_fuel_Market_Study_Report_Eng.pdf (last access: 25 October 2018), 2017.
Cui, J., Pandey Deolal, S., Sprenger, M., Henne, S., Staehelin, J., Steinbacher, M., and Nédélec, P.: Free tropospheric ozone changes over Europe as observed at Jungfraujoch (1990–2008): An analysis based on backward trajectories, J. Geophys. Res.-Atmos., 116, D10304, https://doi.org/10.1029/2010JD015154, 2011.
Cui, L., Zhang, Z., Huang, Y., Lee, S. C., Blake, D. R., Ho, K. F., Wang, B., Gao, Y., Wang, X. M., and Louie, P. K. K.: Measuring OVOCs and VOCs by PTR-MS in an urban roadside microenvironment of Hong Kong: relative humidity and temperature dependence, and field intercomparisons, Atmos. Meas. Tech., 9, 5763–5779, https://doi.org/10.5194/amt-9-5763-2016, 2016.
Derwent, R. G., Manning, A. J., Simmonds, P. G., Spain, T. G., and O'Doherty, S.: Analysis and interpretation of 25 years of ozone observations at the Mace Head Atmospheric Research Station on the Atlantic Ocean coast of Ireland from 1987 to 2012, Atmos. Environ., 80, 361–368, 2013.
Ding, A. J., Wang, T., Zhao, M., Wang, T. J., and Li, Z. K.: Simulation of sea-land breezes and a discussion of their implications on the transport of air pollution during a multi-day ozone episode in the Pearl River Delta of China, Atmos. Environ., 38, 6737–6750, 2004.
Ding, A. J., Wang, T., Thouret, V., Cammas, J.-P., and Nédélec, P.: Tropospheric ozone climatology over Beijing: analysis of aircraft data from the MOZAIC program, Atmos. Chem. Phys., 8, 1–13, https://doi.org/10.5194/acp-8-1-2008, 2008.
Dongguan Environment Protection Department (DGEPD): Clean air action plan in Pearl River Delta region, Phase II (2013–2015), available at: http://dgepb.dg.gov.cn/publicfiles///business/htmlfiles/dgepb/cmsmedia/document/doc172679.pdf (last access: 25 October 2018), 2013.
Guenther, A., Karl, T., Harley, P., Wiedinmyer, C., Palmer, P. I., and Geron, C.: Estimates of global terrestrial isoprene emissions using MEGAN (Model of Emissions of Gases and Aerosols from Nature), Atmos. Chem. Phys., 6, 3181–3210, https://doi.org/10.5194/acp-6-3181-2006, 2006.
George, I. J., Matthews, P. S. J., Whalley, L. K., Brooks, B., Goddard, A., Baeza-Romero, M. T., and Heard, D. E.: Measurements of uptake coefficients for heterogeneous loss of HO2 onto submicron inorganic salt aerosols, Phys. Chem. Chem. Phys., 15, 12829–12845, 2013.
Guo, H., Jiang, F., Cheng, H. R., Simpson, I. J., Wang, X. M., Ding, A. J., Wang, T. J., Saunders, S. M., Wang, T., Lam, S. H. M., Blake, D. R., Zhang, Y. L., and Xie, M.: Concurrent observations of air pollutants at two sites in the Pearl River Delta and the implication of regional transport, Atmos. Chem. Phys., 9, 7343–7360, https://doi.org/10.5194/acp-9-7343-2009, 2009.
Guo, H., Cheng, H. R., Ling, Z. H., Louie, P. K. K., and Ayoko, G. A.: Which emission sources are responsible for the volatile organic compounds in the atmosphere of Pearl River Delta?, J. Hazard. Mater., 188, 116–124, 2011.
Guo, H., Ling, Z. H., Cheung, K., Jiang, F., Wang, D. W., Simpson, I. J., Barletta, B., Meinardi, S., Wang, T. J., Wang, X. M., Saunders, S. M., and Blake, D. R.: Characterization of photochemical pollution at different elevations in mountainous areas in Hong Kong, Atmos. Chem. Phys., 13, 3881–3898, https://doi.org/10.5194/acp-13-3881-2013, 2013a.
Guo, H., Ling, Z. H., Cheung, K., Wang, D. W., Simpson, I. J., and Blake, D. R.: Acetone in the atmosphere of Hong Kong: Abundance, sources and photochemical precursors, Atmos. Environ., 65, 80–88, 2013b.
Guo, H., Ling, Z. H., Cheng, H. R., Simpson, I. J., Lyu, X. P., Wang, X. M., Shao, M., Lu, H. X., Ayoko, G., Zhang, Y. L., and Saunders, S. M.: Tropospheric volatile organic compounds in China, Sci. Total Environ., 574, 1021–1043, 2017.
Hong Kong Environmental Protection Department (HKEPD): Inquire and Download Air Quality Monitoring Data, available at: https://cd.epic.epd.gov.hk/EPICDI/air/station/?lang=en (last access: 25 October 2018), 2017a.
Hong Kong Environmental Protection Department (HKEPD): Cleaning the Air at Street Level, available at: http://www.epd.gov.hk/epd/english/environmentinhk/air/prob_solutions/strategies_apc.html (last access: 25 October 2018), 2017b.
Hong Kong Environmental Protection Department (HKEPD): Phasing Out Pre-Euro IV Diesel Commercial Vehicles, available at: https://www.epd.gov.hk/epd/english/environmentinhk/air/prob_solutions/Phasing_out_diesel_comm_veh.html, last access: 25 October 2018.
Huang, J. P., Fung, J. C., Lau, A. K., and Qin, Y.: Numerical simulation and process analysis of typhoon-related ozone episodes in Hong Kong, J. Geophys. Res.-Atmos., 110, D05301, https://doi.org/10.1029/2004jd004914, 2005.
Jacob, D. J.: Introduction to atmospheric chemistry, Princeton University Press, Princeton, New Jersey, USA, 1999.
Jenkin, M. E., Saunders, S. M., and Pilling, M. J.: The tropospheric degradation of volatile organic compounds: a protocol for mechanism development, Atmos. Environ., 31, 81–104, 1997.
Jenkin, M. E., Saunders, S. M., Wagner, V., and Pilling, M. J.: Protocol for the development of the Master Chemical Mechanism, MCM v3 (Part B): tropospheric degradation of aromatic volatile organic compounds, Atmos. Chem. Phys., 3, 181–193, https://doi.org/10.5194/acp-3-181-2003, 2003.
Jiang, F., Guo, H., Wang, T. J., Cheng, H. R., Wang, X. M., Simpson, I. J., Ding, A. J., Saunders, S. M., Lam, S. H. M., and Blake, D. R.: An ozone episode in the Pearl River Delta: Field observation and model simulation, J. Geophys. Res., 115, D22305, https://doi.org/10.1029/2009JD013583, 2010.
Jiang, Y. C., Zhao, T. L., Liu, J., Xu, X. D., Tan, C. H., Cheng, X. H., Bi, X. Y., Gan, J. B., You, J. F., and Zhao, S. Z.: Why does surface ozone peak before a typhoon landing in southeast China?, Atmos. Chem. Phys., 15, 13331–13338, https://doi.org/10.5194/acp-15-13331-2015, 2015.
Johnson, B. T.: Diesel engine emissions and their control, Platin. Met. Rev., 52, 23–37, 2008.
Kanaya, Y., Pochanart, P., Liu, Y., Li, J., Tanimoto, H., Kato, S., Suthawaree, J., Inomata, S., Taketani, F., Okuzawa, K., Kawamura, K., Akimoto, H., and Wang, Z. F.: Rates and regimes of photochemical ozone production over Central East China in June 2006: a box model analysis using comprehensive measurements of ozone precursors, Atmos. Chem. Phys., 9, 7711–7723, https://doi.org/10.5194/acp-9-7711-2009, 2009.
Kashdan, J. T.: Tracer LIF Visualisation Studies of Piston-Top Fuel Films in a Wall-Guided, Low-NOx Diesel Engine, SAE Tech. Paper, 2008-01-2474, 2008.
Lakey, P. S. J., George, I. J., Whalley, L. K., Baeza-Romero, M. T., and Heard, D. E.: Measurements of the HO2 uptake coefficients onto single component organic aerosols, Environ. Sci. Technol., 49, 4878–4885, 2015.
Lam, K. S., Wang, T. J., Wu, C. L., and Li, Y. S.: Study on an ozone episode in hot season in Hong Kong and transboundary air pollution over Pearl River Delta region of China, Atmos. Environ., 39, 1967–1977, 2005.
Lam, S. H. M., Saunders, S. M., Guo, H., Ling, Z. H., Jiang, F., Wang, X. M., and Wang, T. J.: Modelling VOC source impacts on high ozone episode days observed at a mountain summit in Hong Kong under the influence of mountain-valley breezes, Atmos. Environ., 81, 166–176, 2013.
Lau, A. K. H., Yuan, Z., Yu, J. Z., and Louie, P. K.: Source apportionment of ambient volatile organic compounds in Hong Kong, Sci. Total Environ., 408, 4138–4149, 2010.
Lee, E., Chan, C. K., and Paatero, P.: Application of positive matrix factorization in source apportionment of particulate pollutants in Hong Kong, Atmos. Environ., 33, 3201–3212, 1999.
Lefohn, A. S., Shadwick, D., and Oltmans, S. J.: Characterizing changes in surface ozone levels in metropolitan and rural areas in the United States for 1980–2008 and 1994–2008, Atmos. Environ., 44, 5199–5210, 2010.
Li, K., Jacob, D. J., Liao, H., Shen, L., Zhang, Q., and Bates, K. H.: Anthropogenic drivers of 2013–2017 trends in summer surface ozone in China, P. Natl. Acad. Sci. USA, 116, 422–427, 2019.
Lin, M., Horowitz, L. W., Payton, R., Fiore, A. M., and Tonnesen, G.: US surface ozone trends and extremes from 1980 to 2014: quantifying the roles of rising Asian emissions, domestic controls, wildfires, and climate, Atmos. Chem. Phys., 17, 2943–2970, https://doi.org/10.5194/acp-17-2943-2017, 2017.
Ling, Z., Guo, H., Simpson, I. J., Saunders, S. M., Lam, S. H. M., Lyu, X., and Blake, D. R.: New insight into the spatiotemporal variability and source apportionments of C1–C4 alkyl nitrates in Hong Kong, Atmos. Chem. Phys., 16, 8141–8156, https://doi.org/10.5194/acp-16-8141-2016, 2016a.
Ling, Z., Guo, H., Chen, G., Lam, S. H. M., and Fan, S.: Formaldehyde and acetaldehyde at different elevations in mountainous areas in Hong Kong, Aerosol Air Qual. Res., 16, 1868–1878, 2016b.
Ling, Z. H. and Guo, H.: Contribution of VOC sources to photochemical ozone formation and its control policy implication in Hong Kong, Environ. Sci. Policy, 38, 180–191, 2014.
Ling, Z. H., Guo, H., Cheng, H. R., and Yu, Y. F.: Sources of ambient volatile organic compounds and their contributions to photochemical ozone formation at a site in the Pearl River Delta, southern China, Environ. Pollut., 159, 2310–2319, 2011.
Ling, Z. H., Guo, H., Zheng, J. Y., Louie, P. K. K., Cheng, H. R., Jiang, F., Cheung, K., Wong, L. C., and Feng, X. Q.: Establishing a conceptual model for photochemical ozone pollution in subtropical Hong Kong, Atmos. Environ., 76, 208–220, 2013.
Ling, Z. H., Guo, H., Lam, S. H. M., Saunders, S. M., and Wang, T.: Atmospheric photochemical reactivity and ozone production at two sites in Hong Kong: Application of a Master Chemical Mechanism-photochemical box model, J. Geophys. Res.-Atmos., 119, 10567–10582, 2014.
Liu, X.: Data for the paper “Intercomparison of O3 formation and radical chemistry in the past decade at a suburban site in Hong Kong”, Google Drive, available at: https://drive.google.com/file/d/1rPH8TQMGvnGKjAwTYcNveqtCi_zo019R/view?usp=sharing, last access: 12 April 2019.
Liu, Y., Shao, M., Lu, S., Chang, C.-C., Wang, J.-L., and Chen, G.: Volatile Organic Compound (VOC) measurements in the Pearl River Delta (PRD) region, China, Atmos. Chem. Phys., 8, 1531–1545, https://doi.org/10.5194/acp-8-1531-2008, 2008.
Liu, Z., Wang, Y., Gu, D., Zhao, C., Huey, L. G., Stickel, R., Liao, J., Shao, M., Zhu, T., Zeng, L., Amoroso, A., Costabile, F., Chang, C.-C., and Liu, S.-C.: Summertime photochemistry during CAREBeijing-2007: ROx budgets and O3 formation, Atmos. Chem. Phys., 12, 7737–7752, https://doi.org/10.5194/acp-12-7737-2012, 2012.
Lyu, X. P., Ling, Z. H., Guo, H., Saunders, S. M., Lam, S. H. M., Wang, N., Wang, Y., Liu, M., and Wang, T.: Re-examination of C1-C5 alkyl nitrates in Hong Kong using an observation-based model, Atmos. Environ., 120, 28–37, 2015.
Lyu, X. P., Liu, M., Guo, H., Ling, Z. H., Wang, Y., Louie, P. K. K., and Luk, C. W. Y.: Spatiotemporal variation of ozone precursors and ozone formation in Hong Kong: grid field measurement and modelling study, Sci. Total Environ., 569, 1341–1349, 2016a.
Lyu, X., Guo, H., Simpson, I. J., Meinardi, S., Louie, P. K. K., Ling, Z., Wang, Y., Liu, M., Luk, C. W. Y., Wang, N., and Blake, D. R.: Effectiveness of replacing catalytic converters in LPG-fueled vehicles in Hong Kong, Atmos. Chem. Phys., 16, 6609–6626, https://doi.org/10.5194/acp-16-6609-2016, 2016b.
Lyu, X. P., Chen, N., Guo, H., Zhang,W. H., Wang, N., Wang, Y., and Liu, M.: Ambient volatile organic compounds and their effect on ozone production in Wuhan, Central China, Sci. Total Environ., 541, 200–209, 2016c.
Lyu, X. P., Zeng, L. W., Guo, H., Simpson, I. J., Ling, Z. H., Wang, Y., Murray, F., Louie, P. K. K., Saunders, S. M., Lam, S. H. M., and Blake, D. R.: Evaluation of the effectiveness of air pollution control measure in Hong Kong, Environ. Pollut., 220, 87–94, 2017a.
Lyu, X. P., Guo, H., Wang, N., Simpson, I. J., Cheng, H. R., Zeng, L. W., Saunders, S. M., Lam, S. H. M., Meinardi, S., and Blake, D. R.: Modeling C1-C4 alkyl nitrate photochemistry and their impacts on O3 production in urban and suburban environments of Hong Kong, J. Geophys. Res.-Atmos., 122, 10539–10556, 2017b.
Madronich, S. and Flocke, S.: The role of solar radiation in atmospheric chemistry, Environ. Photochem., 2, 1–26, 1999.
Ministry of Ecology and Environment of the People's Republic of China (MEE PRC): Action plan for preventing and controlling air pollution in Guangdong Province, China, available at: http://www.mee.gov.cn/xxgk/hjyw/201403/t20140303_268619.shtml (last access: 25 October 2018), 2014.
NARSTO: An Assessment of tropospheric ozone pollution: a North American perspective, NARSTO synthesis team, available at: http://cdiac.ess-dive.lbl.gov/programs/NARSTO/ozone_assessment.html (last access: 25 October 2018), 2000.
National Research Council (NRC): Rethinking the ozone problem in urban and regional air pollution, National Academies Press, Washington, DC, 1992.
Norris, G., Wade, K., and Foley, C.: EPA Positive Matrix Factorization (PMF) 3.0 Fundamentals & User Guide, EPA 600/R-08/108, US Environmental Protection Agency, Office of Research and Development, Washington, USA, 2008.
Ou, J. M., Guo, H., Zheng, J. Y., Cheung, K., Louie, P. K. K., Ling, Z. H., and Wang, D. W.: Concentrations and sources of non-methane hydrocarbons (NMHCs) from 2005 to 2013 in Hong Kong: A multi-year real-time data analysis. Atmos. Environ., 103, 196–206, 2015.
Paatero, P.: Least squares formulation of robust non-negative factor analysis, Chemometr. Intell. Lab., 37, 23–35, 1997.
Paatero, P.: User's Guide for Positive Matrix Factorization Programs PMF2 and PMF3, Part 1: Tutorial, Prepared by University of Helsinki, Finland (February), 2000a.
Paatero, P.: User's Guide for Positive Matrix Factorization Programs PMF2 and PMF3, Part 2: Reference, Prepared by University of Helsinki, Finland, 2000b.
Parrish, D. D., Lamarque, J. F., Naik, V., Horowitz, L., Shindell, D. T., Staehelin, J., Derwent, R., Cooper, O. R., Tanimoto, H., Volz-Thomas, A., and Gilge, S.: Long-term changes in lower tropospheric baseline ozone concentrations: Comparing chemistry-climate models and observations at northern midlatitudes., J. Geophys. Res.-Atmos., 119, 5719–5736, 2014.
Polissar, A. V., Hopke, P. K., Paatero, P., Malm, W. C., and Sisler, J. F.: Atmospheric aerosol over Alaska: 2. Elemental composition and sources, J. Geophys. Res.-Atmos., 103, 19045–19057, 1998.
Reff, A., Eberly, S. I. and Bhave, P. V.: Receptor modeling of ambient particulate matter data using positive matrix factorization: review of existing methods, J. Air Waste Manage., 57, 146–154, 2007.
Richter, A., Burrows, J. P., Nub, H., Granier, C., and Niemeier, U.: Increase in tropospheric nitrogen dioxide over China observed from space, Nature, 437, 129–132, 2005.
Sahoo, D., Petersen, B., and Miles, P.: Measurement of equivalence ratio in a light-duty low temperature combustion diesel engine by planar laser induced fluorescence of a fuel tracer, SAE Int. J. Engines, 4, 2312–2325, 2011.
Saunders, S. M., Jenkin, M. E., Derwent, R. G., and Pilling, M. J.: Protocol for the development of the Master Chemical Mechanism, MCM v3 (Part A): tropospheric degradation of non-aromatic volatile organic compounds, Atmos. Chem. Phys., 3, 161–180, https://doi.org/10.5194/acp-3-161-2003, 2003.
Schauer, J. J., Kleeman, M. J., Cass, G. R., and Simoneit, B. R.: Measurement of emissions from air pollution sources, 2. C1 through C30 organic compounds from medium duty diesel trucks, Environ. Sci. Technol., 33, 1578–1587, 1999.
Sillman, S.: The relation between ozone, NOx and hydrocarbons in urban and polluted rural environments, Atmos. Environ., 33, 1821–1845, 1999.
Simpson, I. J., Blake, N. J., Barletta, B., Diskin, G. S., Fuelberg, H. E., Gorham, K., Huey, L. G., Meinardi, S., Rowland, F. S., Vay, S. A., Weinheimer, A. J., Yang, M., and Blake, D. R.: Characterization of trace gases measured over Alberta oil sands mining operations: 76 speciated C2–C10 volatile organic compounds (VOCs), CO2, CH4, CO, NO, NO2, NOy, O3 and SO2, Atmos. Chem. Phys., 10, 11931–11954, https://doi.org/10.5194/acp-10-11931-2010, 2010.
So, K. L. and Wang, T.: On the local and regional influence on ground-level ozone concentrations in Hong Kong, Environ. Pollut., 123, 307–317, 2003.
United States Environmental Protection Agency (US EPA): Positive Matrix Factorization Model for environmental data analyses, available at: https://www.epa.gov/air-research/positive-matrix-factorization-model-environmental-data-analyses (last access: 25 October 2018), 2017.
Wang, H., Lyu, X., Guo, H., Wang, Y., Zou, S., Ling, Z., Wang, X., Jiang, F., Zeren, Y., Pan, W., Huang, X., and Shen, J.: Ozone pollution around a coastal region of South China Sea: interaction between marine and continental air, Atmos. Chem. Phys., 18, 4277–4295, https://doi.org/10.5194/acp-18-4277-2018, 2018.
Wang, H. X., Kiang, C. S., Tang, X. Y., Zhou, X. J., and Chameides, W. L.: Surface ozone: A likely threat to crops in Yangtze delta of China, Atmos. Environ., 39, 3843–3850, 2005.
Wang, N., Guo, H., Jiang, F., Ling, Z. H., and Wang, T.: Simulation of ozone formation at different elevations in mountainous area of Hong Kong using WRF-CMAQ model, Sci. Total Environ, 505, 939–951, 2015.
Wang, T., Wei, X. L., Ding, A. J., Poon, C. N., Lam, K. S., Li, Y. S., Chan, L. Y., and Anson, M.: Increasing surface ozone concentrations in the background atmosphere of Southern China, 1994–2007, Atmos. Chem. Phys., 9, 6217–6227, https://doi.org/10.5194/acp-9-6217-2009, 2009.
Wang, T., Xue, L. K., Brimblecombe, P., Lam, Y. F., Li, L., and Zhang, L.: Ozone pollution in China: A review of concentrations, meteorological influences, chemical precursors, and effects, Sci. Total Environ., 575, 1582–1596, 2017.
Wang, Y., Wang, H., Guo, H., Lyu, X. P., Cheng, H. R., Ling, Z. L., Louie, P. K. K., Simpson, I J., Meinardi, S., and Blake, D. R.: Long-term O3- precursor relationships in Hong Kong: field observation and model simulation, Atmos. Chem. Phys., 17, 10919-10935, 2017.
Wang, Y., Guo, H., Zou, S. C., Lyu, X. P., Ling, Z. H., Cheng, H. R., and Zeren, Y. Z.: Surface O3 photochemistry over the South China Sea: Application of a near-explicit chemical mechanism box model, Environ. Pollut., 234, 155–166, 2018.
Willmott, C. J.: Some comments on the evaluation of model performance, B. Am. Meteorol. Soc., 63, 1309–1313, 1982.
Xu, X., Lin, W., Wang, T., Yan, P., Tang, J., Meng, Z., and Wang, Y.: Long-term trend of surface ozone at a regional background station in eastern China 1991–2006: enhanced variability, Atmos. Chem. Phys., 8, 2595–2607, https://doi.org/10.5194/acp-8-2595-2008, 2008.
Xu, Z., Wang, T., Wu, J., Xue, L., Chan, J., Zha, Q., Zhou, S., Louie, P. K., and Luk, C. W.: Nitrous acid (HONO) in a polluted subtropical atmosphere: Seasonal variability, direct vehicle emissions and heterogeneous production at ground surface, Atmos. Environ., 106, 100–109, 2015.
Xue, L. K., Wang, T., Louie, P. K., Luk, C. W., Blake, D. R., and Xu, Z.: Increasing external effects negate local efforts to control ozone air pollution: a case study of Hong Kong and implications for other Chinese cities, Environ. Sci. Technol., 48, 10769–10775, 2014a.
Xue, L., Gu, R., Wang, T., Wang, X., Saunders, S., Blake, D., Louie, P. K. K., Luk, C. W. Y., Simpson, I., Xu, Z., Wang, Z., Gao, Y., Lee, S., Mellouki, A., and Wang, W.: Oxidative capacity and radical chemistry in the polluted atmosphere of Hong Kong and Pearl River Delta region: analysis of a severe photochemical smog episode, Atmos. Chem. Phys., 16, 9891–9903, https://doi.org/10.5194/acp-16-9891-2016, 2016.
Xue, L. K., Wang, T., Gao, J., Ding, A. J., Zhou, X. H., Blake, D. R., Wang, X. F., Saunders, S. M., Fan, S. J., Zuo, H. C., Zhang, Q. Z., and Wang, W. X.: Ground-level ozone in four Chinese cities: precursors, regional transport and heterogeneous processes, Atmos. Chem. Phys., 14, 13175–13188, https://doi.org/10.5194/acp-14-13175-2014, 2014b.
Yao, C., Cheung, C. S., Cheng, C., Wang, Y., Chan, T. L., and Lee, S. C.: Effect of diesel/methanol compound combustion on diesel engine combustion and emissions, Energ. Convers. Manage., 49, 1696–1704, 2008.
Yao, D., Lyu, X., Murray, F., Morawska, L., Yu, W., Wang, J., and Guo, H.: Continuous effectiveness of replacing catalytic converters on liquified petroleum gas-fueled vehicles in Hong Kong., Sci. Total Environ., 648, 830–838, 2019.
Zeng, L., Lyu, X., Guo, H., Zou, S., and Ling, Z.: Photochemical Formation of C1–C5 Alkyl Nitrates in Suburban Hong Kong and over the South China Sea, Environ. Sci. Technol., 52, 5581–5589, 2018.
Zhang, J., Wang, T., Chameides, W. L., Cardelino, C., Kwok, J., Blake, D. R., Ding, A., and So, K. L.: Ozone production and hydrocarbon reactivity in Hong Kong, Southern China, Atmos. Chem. Phys., 7, 557–573, https://doi.org/10.5194/acp-7-557-2007, 2007.
Zhang, Y., Wang, X., Blake, D. R., Li, L., Zhang, Z., Wang, S., Guo, H., Lee, S. C., Gao, B., Chan, L., and Wu, D.: Aromatic hydrocarbons as ozone precursors before and after outbreak of the 2008 financial crisis in the Pearl River Delta region, south China., J. Geophys. Res.-Atmos., 117, D15306, https://doi.org/10.1029/2011JD017356, 2012.
Zheng, B., Tong, D., Li, M., Liu, F., Hong, C., Geng, G., Li, H., Li, X., Peng, L., Qi, J., Yan, L., Zhang, Y., Zhao, H., Zheng, Y., He, K., and Zhang, Q.: Trends in China's anthropogenic emissions since 2010 as the consequence of clean air actions, Atmos. Chem. Phys., 18, 14095–14111, https://doi.org/10.5194/acp-18-14095-2018, 2018.