the Creative Commons Attribution 4.0 License.
the Creative Commons Attribution 4.0 License.
 | 14 Jan 2019
Volatile organic compounds and ozone in Rocky Mountain National Park during FRAPPÉ
Katherine B. Benedict
Yong Zhou
Barkley C. Sive
Anthony J. Prenni
Kristi A. Gebhart
Emily V. Fischer
Ashley Evanoski-Cole
Amy P. Sullivan
Sara Callahan
Bret A. Schichtel
Huiting Mao
Ying Zhou
Jeffrey L. Collett Jr.
The 2014 Front Range Air Pollution and Photochemistry Éxperiment (FRAPPÉ) aimed to better characterize summertime air quality in the Northern Front Range Metropolitan Area (NFRMA) and its impact on surrounding areas. As part of this study, measurements of gas- and particle-phase species were collected in Rocky Mountain National Park (ROMO), located in the mountains west of the urban northern Front Range corridor from July to October 2014. We report on measurements of ozone from two locations in the park and a suite of volatile organic compounds (VOCs) measured using a continuous real-time gas chromatography (GC) system and a quadrupole proton-transfer-reaction mass spectrometer (PRT-MS) at the ROMO Longs Peak (ROMO-LP) air quality site. We also measured VOCs using canister samples collected along transects connecting the NFRMA and ROMO. These datasets show that ROMO is impacted by NFRMA emission sources, and high observed mixing ratios of VOCs associated with oil and gas extraction (e.g. ethane) and urban sources (e.g. ethene and C2Cl4) occur during periods of upslope transport. Hourly ozone mixing ratios exceeded 70 ppb during six events. Two of the six events were largely associated with VOCs from the oil and gas sector, three high ozone events were associated with a mixture of VOCs from urban and oil and gas sources, and one high ozone event was driven by a stratospheric intrusion. For the high ozone events most associated with emissions from oil and gas activities, we estimate that VOCs and NOx from sources along the Front Range contributed ∼20 ppbv of additional ozone.
- Article
(7971 KB) - Full-text XML
-
Supplement
(1089 KB) - BibTeX
- EndNote


Ozone (O3) is a regulated pollutant that can impact both human and ecosystem health. Monthly mean daytime O3 has been increasing in the Rocky Mountains and throughout much of the west (Strode et al., 2015), and there are concerns about O3 levels and exceedances of the O3 National Ambient Air Quality Standard (NAAQS) at high-elevation sites (Christensen et al., 2015; Musselman and Korfmacher, 2014). In Rocky Mountain National Park (ROMO), a protected Class I area with millions of visitors each year (National Park Service, 2017), O3 mixing ratios often exceed the current NAAQS standard of 70 ppb and vegetation injury thresholds (Kohut et al., 2012). A timeline of O3 mixing ratios measured at the ROMO Longs Peak (ROMO-LP) CASTNET (Clean Air Status and Trends Network) site from January 2010 to December 2015 is shown in Fig. 1. In general, O3 mixing ratios were lower during the summer of 2014 than in the preceding 4 years; specifically, the peak O3 mixing ratios were lower and there were fewer hours when mixing ratios exceeded 70 ppb. Weather conditions, including greater rainfall and cloud cover than is typical during the summer months, contributed to lower O3 levels in ROMO and on the Front Range (Cheadle et al., 2017; McDuffie et al., 2016). In addition to transport and O3 production from regional source emissions, the US Intermountain West (all elevations) has a higher probability of stratospheric O3 reaching the troposphere from tropopause folding (related to midlatitude jet or cutoff low) and stratospheric intrusion events (Lin et al., 2015; Musselman and Korfmacher, 2014; Reddy and Pfister, 2016; Wooldridge et al., 1997). At Great Basin National Park, another high-elevation park in the west, elevated O3 mixing ratios have been shown to be impacted by long-range transport, regional transport, and high-altitude transport (Christensen et al., 2015), highlighting the complex nature of O3 sources at these Intermountain West sites.
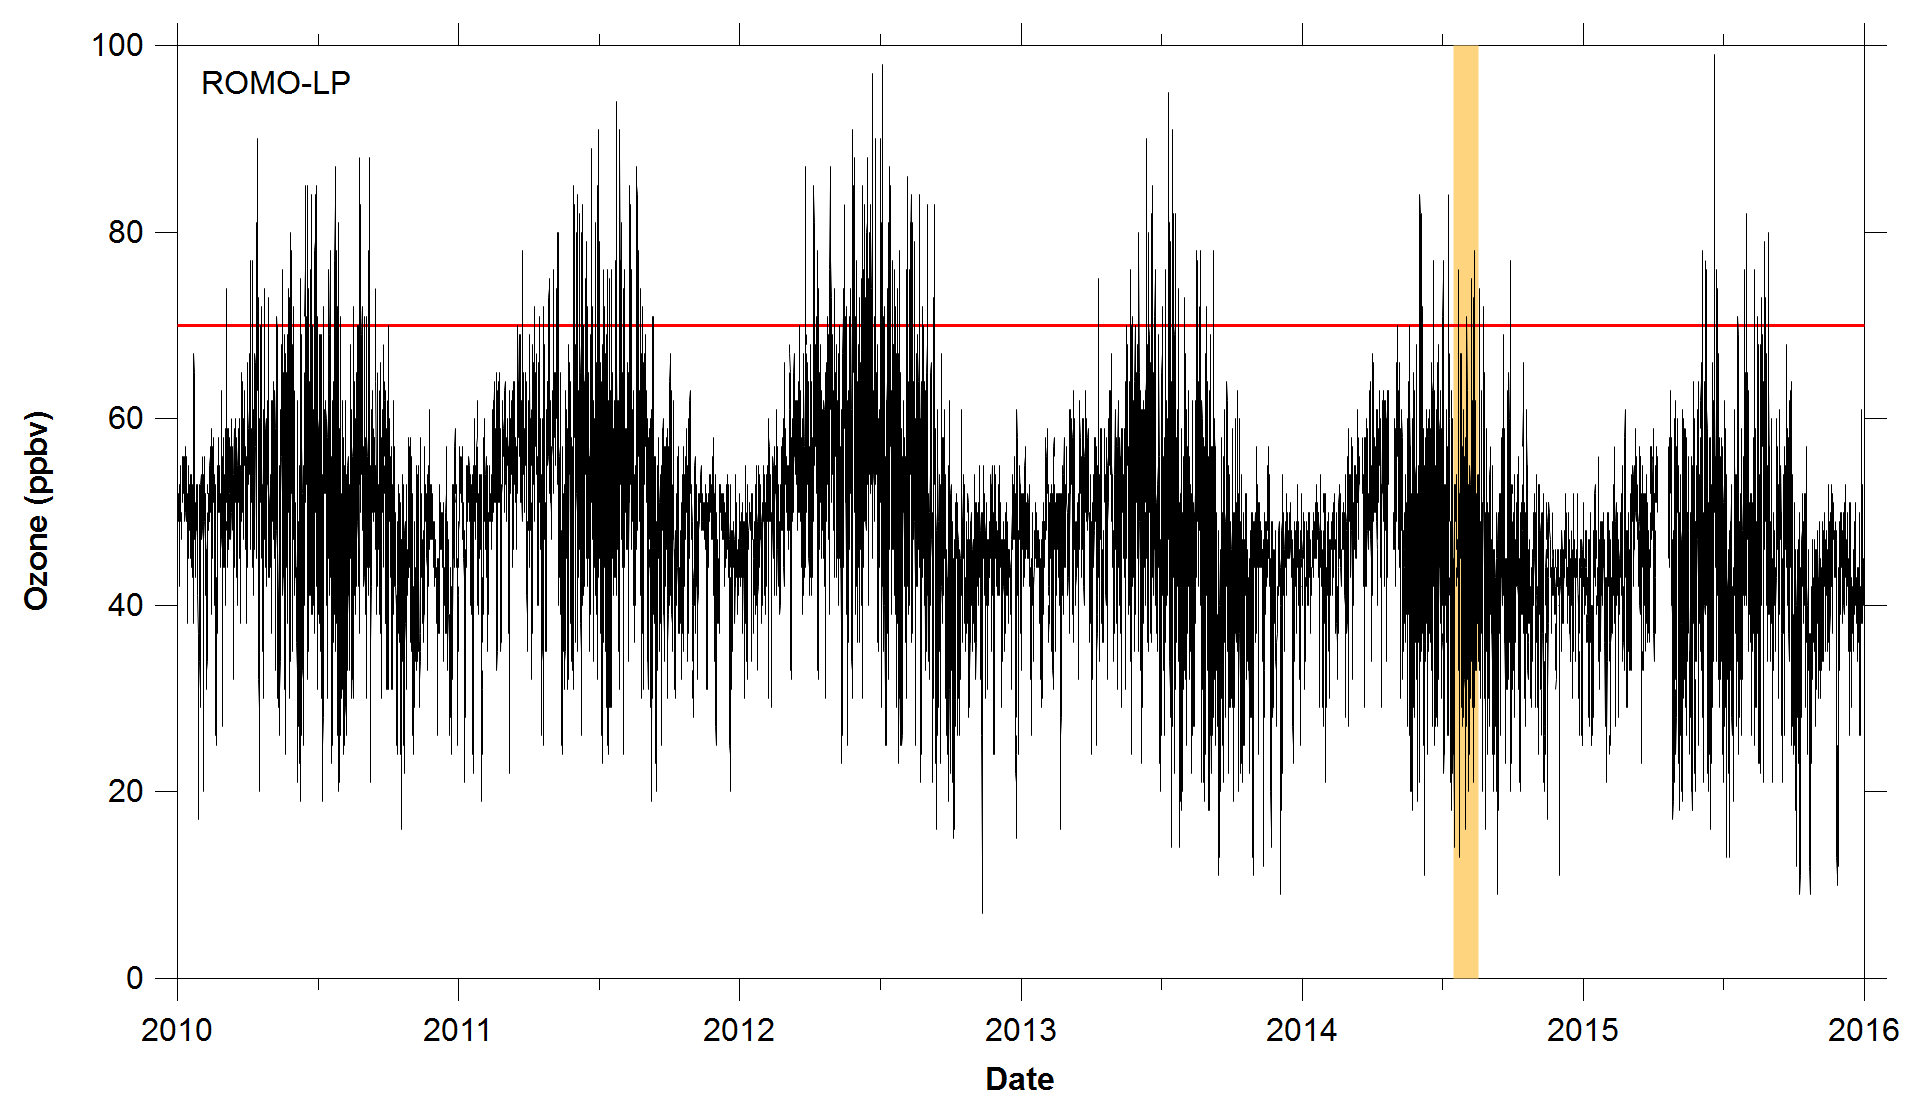
Figure 1Hourly O3 measurements at ROMO-LP from January 2010 to December 2015. The red line indicates the current NAAQS 8 h daily maximum value of 70 ppb. The shaded region designates the FRAPPÉ study period.
ROMO is in close proximity to the Northern Front Range Metropolitan Area (NFRMA), which includes Denver, Boulder, and Fort Collins (urban areas) (Fig. 2), in addition to the Denver-Julesburg Basin, which has seen significant increases in oil and natural gas production. For example, in nearby Weld County, the number of active wells doubled between January 2008 and July 2015, to over 27 000 (Colorado Oil and Gas Conservation Commission, COGCC, 2/2016). Previous studies have extensively characterized NFRMA volatile organic compound (VOC) emissions, including those from oil and natural gas extraction activities, and their influence on air quality at the Boulder Atmospheric Observatory (BAO) Gilman et al., 2013; McDuffie et al., 2016; Pétron et al., 2012; Swarthout et al., 2013). These studies demonstrate the extremely high mixing ratios of alkanes in the NFRMA, with maximum observed ethane and propane mixing ratios exceeding 100 ppbv (Swarthout et al., 2013) compared to mean values of 0.56–8.74 and 0.29–6.05 ppbv, respectively, in urban areas (Baker et al., 2008). The extent to which these emissions reach ROMO has not been previously determined, although previous studies have shown that agricultural ammonia emissions from a similar geographic source region are frequently transported into ROMO (Beem et al., 2010; Benedict et al., 2013).
The Front Range Air Pollution and Photochemistry Éxperiment (FRAPPÉ) took place in the summer of 2014 and was focused on characterizing summertime air quality and O3 formation in the NFRMA. FRAPPÉ included extensive ground, mobile, and aircraft measurements throughout the region, including ROMO. This work focuses on a primary goal of the measurements at ROMO – to better understand the factors contributing to high O3 in the park including potential contributions of the NFRMA. These data are meant to inform strategies to reduce O3 in the park and the exposure of visitors and ecosystems to elevated O3 levels. Measurements at the ROMO Longs Peak site (40.2783∘ N, 105.5457∘ W; 2784 m a.s.l.) during FRAPPÉ included a suite of VOCs in addition to O3 and meteorological parameters, which are routinely measured at the site. Whole air canister samples were also collected along US Route 34 from the NFRMA to higher-elevation sites (3600 m) to examine spatial variations in VOC concentrations (Fig. 2). Ozone and meteorological measurements were also made at an additional high-elevation site within ROMO, located off Trail Ridge Road (ROMO-TR; 40.3900∘ N, 105.6865∘ W; 3498 m a.s.l.). Additional measurements carried out at ROMO during FRAPPÉ are the focus of separate publications (Benedict et al., 2018; Zaragoza et al., 2017).
2.1 In situ volatile organic compound measurements
A cryogen-free concentration system coupled with two gas chromatographs (GCs) was installed in the Colorado State University mobile laboratory for near-real-time (1 h sample frequency) analysis of VOCs at the Longs Peak monitoring station at ROMO from 17 July to 4 September 2014. Ambient air was drawn from 5.25 m above ground level using a 3 m × 0.635 cm outer diameter (o.d.) stainless steel line followed by a 3 m × 0.4 cm inner diameter (i.d.) PFA Teflon line. Airflow was maintained continuously at ∼7 L min−1 using a metal bellows pump (MB-158, Senior Flexionics, Sharon, MA) and delivered a pressure of 10 psig. The inlet residence time was <1 s. A sub-stream of the pressurized air (∼2.5 L min−1) was directed to a water management system, which reduced water vapor before entering the analytical system. The water management system consisted of a 7.5 m × 0.635 cm o.d. stainless steel coil and a stainless steel liquid water reservoir, which was housed in a commercial refrigerator and set at ∼2 ∘C. The total volume of the system was ∼380 mL, yielding a residence time of <10 s. The VOC analytical system was similar to those used in previous studies (Abeleira et al., 2017; Sive et al., 2005) and utilized a Qdrive 2s102K cryocooler (Chart, Inc., Troy, NY) that was capable of cooling a sample enrichment loop from 100 to −180 ∘C in 25 min for sample concentration. Additional details are provided in the Supplement. Two different whole air standards were alternately analyzed every 10 samples throughout the campaign for quantification of the target gases as well as to monitor the system's performance; the standard mixing ratios were representative of clean and polluted levels encountered at ROMO. The measurement precision, represented by the relative standard deviation (RSD) of the peak areas for each compound in the standards, was 1 %–8 % for the non-methane hydrocarbons (NMHCs), 3 %–11 % for halocarbons, and 3 %–5 % for alkyl nitrates. A list of VOCs measured during this study using the in situ GC is shown in Table 1.
2.1.1 Canister sampling
Whole air canister samples were collected at eight non-urban locations during the campaign to investigate the spatial distributions of VOCs. Canister samples were collected in the Big Thompson Canyon along Route 34 en route to the ROMO Longs Peak site 3 days a week during the campaign; several transects were also continued up Trail Ridge Road to the continental divide at the Alpine Visitor Center in ROMO (ROMO-TR, Fig. 2) when upslope transport was expected. Canisters were typically collected between 13:00 and 18:00 (local time) as grab samples (30–60 s) along the roadway. Canisters were opened into the wind to avoid sampling emissions from vehicles and only in a few cases there is evidence of traffic in the canisters. A total of 39 individual VOCs were quantified from the canister samples in our laboratory at Colorado State University using a five-channel, three-GC analytical system, which employed three flame ionization detectors (FIDs), one electron capture detector (ECD) and one mass spectrometer (MS). The gases analyzed included C2–C10 NMHCs, C1–C2 halocarbons, C1–C5 alkyl nitrates, selected reduced sulfur compounds, and OVOCs (oxygenated VOCs). A complete list of VOCs measured from the canister samples using the lab analytical system is included in Table 1.
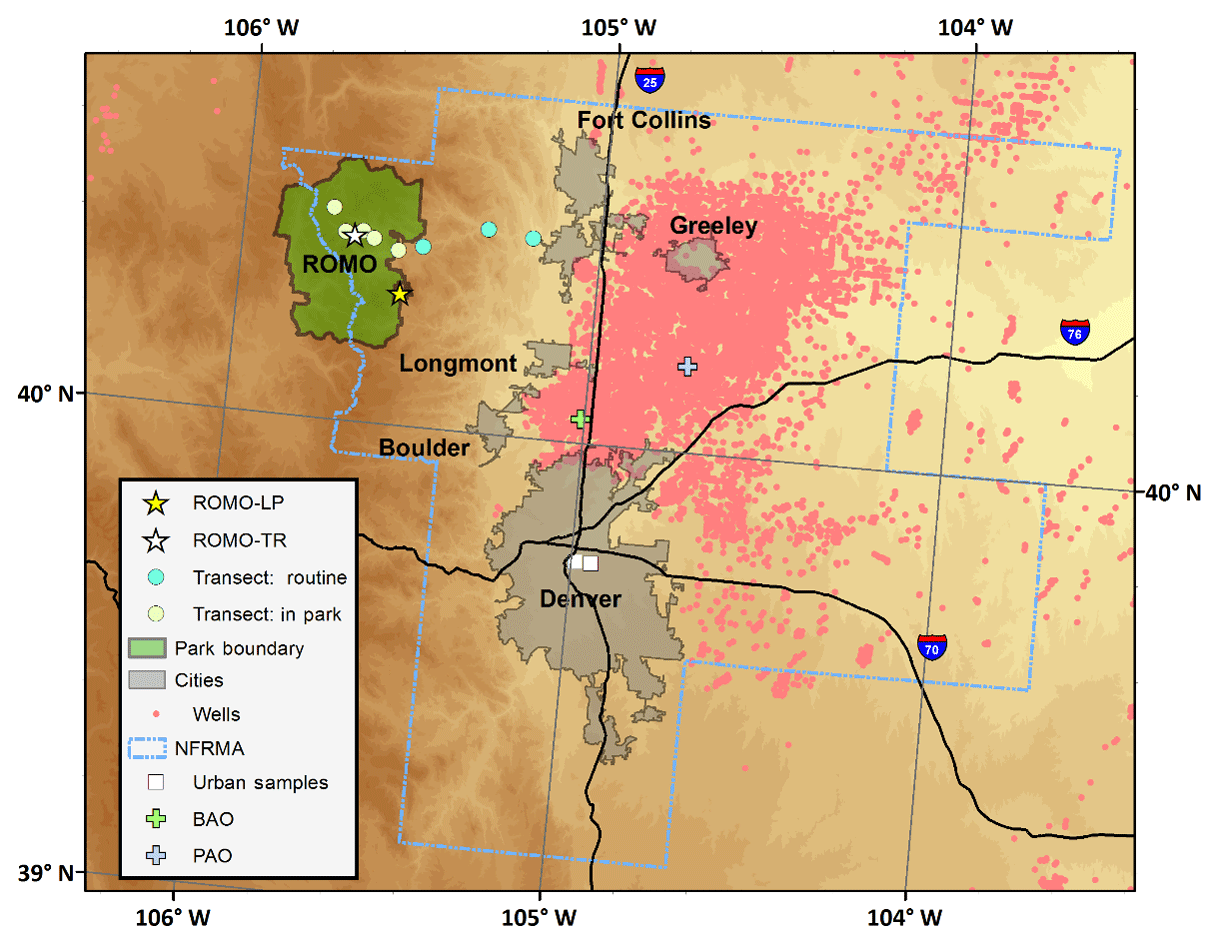
Figure 2Map of sampling sites, including locations of the transect samples. Also shown are oil and gas well locations (COGCC, 2018) and cities along the NFRMA.
The analytical system and methodology used for this study are similar to those used in previous studies (Russo et al., 2010b; Sive, 1998; Zhou et al., 2010). Multiple standards were used during sample analysis (analyzed every 10 samples). The whole air working standards employed for this work have mixing ratios representative of clean free-tropospheric air (NMHCs mixing ratios on the order of ∼10–100 pptv) and suburban air (NMHC mixing ratios on the order of ∼1–2 ppbv), thus bracketing the low and high ranges for the measurements at ROMO (e.g. Russo et al., 2010a). The measurement precision, represented by the relative standard deviation of the peak areas for each compound in the whole air standards, was 1 %–8 % for the NMHCs, 3 %–10 % for halocarbons, and 3 %–5 % for the alkyl nitrates.
Table 1VOCs measured using the in situ GC system and PTR-MS at ROMO-LP. Also denoted are gases reported from the transect canister samples. Statistics are given for the GC and select PTR-MS data.

2.1.2 Proton-transfer-reaction mass spectrometer (PTR-MS)
Selected VOCs and OVOCs were monitored in real time by a quadrupole proton-transfer-reaction mass spectrometer located in the National Park Service (NPS) air quality monitoring shelter (PTR-MS; Ionicon Analytik, Innsbruck, Austria) from 14 July to 8 September 2014. The PTR-MS-sampled air that was continuously drawn through a 13 m × 1.27 cm o.d. (0.9525 cm i.d.) PFA Teflon inlet from 10 m above ground level. The flow rate through the sample line was ∼70 L min−1, resulting in a <1 s residence time. A diaphragm pump was used to draw a sub-stream of air off the main inlet line through a 1 m × 0.635 cm PFA Teflon line at a flow rate of 1 L min−1 from which the PTR-MS sampled.
The PTR-MS was operated with a drift tube pressure and temperature of 2.0 mbar and 45 ∘C, respectively, and a potential of 600 V applied over the length (9.6 cm) of the drift tube. The ion source water flow rate was 11 mL min−1 and the discharge current was 8 mA. A series of 30 masses was monitored continuously; six masses were monitored for diagnostic purposes while the remaining 24 masses corresponded to VOCs of interest. The dwell time for each of these 24 masses ranged from 1 to 10 s, yielding a total measurement cycle of ∼3 min. The system was zeroed every 25 h for 10 cycles by diverting the flow of ambient air through a heated catalytic converter (0.5 % Pd on alumina at 550 ∘C) to determine system background signals. Calibrations for the PTR-MS system were conducted using three different high-pressure cylinders containing synthetic blends of selected NMHCs and OVOCs at ppbv levels. Each of the cylinders used in the calibrations had an absolute accuracy of % for all gases. Standards were diluted to atmospheric mixing ratios (ppbv to pptv levels) with catalytic-converter-prepared zero air adjusted to maintain the humidity of the sampled air for 6–10 cycles every 25–75 h. Mixing ratios for each gas were calculated by using the normalized counts per second which were obtained by subtracting out the nonzero background signal for each compound. The PTR-MS precision was estimated from counting statistics and ranged from 6 % to 15 %.
2.2 Ozone measurement at Longs Peak and Trail Ridge Road
2.2.1 Trail Ridge Road
The third generation of a custom-built portable O3 monitoring system (POMS3 Model 202, Air Resource Specialists, Inc., Fort Collins, CO) was deployed at a high-elevation site located off of the Ute Trail in ROMO (40.3900∘ N, 105.6865∘ W; 3498 m a.s.l.) during FRAPPÉ for O3 and meteorological measurements. Measurements were conducted from 11 July to 18 September 2014. The system incorporated two 2B Technologies O3 analyzers, a 6.1 m sampling mast, a data acquisition system, and meteorological instruments for measurements of wind speed, wind direction, temperature, relative humidity, solar radiation, and precipitation. The POMS3 unit was fitted with solar panels and batteries sufficient for operation during the campaign. Hourly averages of O3 and meteorological parameters were reported for this site. More information on the Trail Ridge O3 measurements and calibration procedures can be found in the Supplement.
2.2.2 Longs Peak
Ozone and meteorological measurements have been measured continuously at the ROMO Longs Peak site since 1987, as part of the National Park Service Gaseous Pollutant Monitoring Program. As a regulatory O3 monitoring station, the sampling methods for gaseous and meteorological monitoring are based on the 40 CFR Part 58 requirements. The Longs Peak site includes a temperature-controlled shelter that houses the O3 analyzer and calibration system. The O3 inlet and meteorological measurements are located on top of a 10 m tower. Ozone is measured by UV absorption utilizing a Thermo 49i O3 analyzer coupled with a Thermo 49i O3 reference station for nightly zero, precision and span checks. One minute O3 data are recorded and hourly averages are generated from the 1 min O3 data. The suite of meteorological measurements include wind speed, wind direction, relative humidity, temperature, solar radiation, and precipitation, and 1 min meteorological data were acquired during FRAPPÉ. As with the POMS3 site, further details can be found in the Gaseous Pollutant Monitoring Program 2015 Quality Assurance Project Plan (https://ard-request.air-resource.com/Project/documents.aspx, last access: 9 February 2018).
2.3 Data filtering to remove local source effects
Initial analysis of FRAPPÉ data showed unexpectedly high propane concentrations relative to other VOCs at the ROMO-LP site. The highest propane concentrations were associated with the lowest wind speeds, suggesting that a leaking propane tank used by a nearby youth camp (<200 m) was a local source. Typically in the US, propane fuel is primarily composed of propane (at least 90 %), with no more than 2.5 % butanes and a maximum of 5 % propylene (ASTM Standard D1835-16, 2016). To better understand the influence of regional VOC emissions and transport on the distributions of VOCs and O3 in ROMO, it was necessary to filter out alkane, alkene, and BTEX (benzene, toluene, ethylbenzene, xylene) data that were affected by the local emissions. In this study, data with ethane ∕ propane ratios <1 were considered to be propane tank influenced and were removed. The resulting ratio of ethane to propane for filtered data (1.2) was similar to that determined for transect samples (1.13) taken at multiple locations in ROMO at different times, supporting the data-filtering approach.
Throughout the campaign, hourly VOC mixing ratios varied by 1 to 3 orders of magnitude (Table 1). Figures 3, S1, and S2 show this variability for several VOCs as well as for O3 at the ROMO-LP and ROMO-TR sites from 17 July to 4 September 2014. The C2–C5 alkanes, C2–C4 alkenes, ethyne, aromatics (benzene and toluene), C2–C5 alkyl nitrates, tetrachloroethylene (C2Cl4), trichloroethylene (C2HCl3), and OVOCs, such as methanol, generally had similar temporal variations during most of the study period. The similar temporal patterns suggest that many of the concentration changes are driven by meteorology, with westerly flow generally transporting cleaner air and easterly flow transporting pollutants from the NFRMA. However, in some cases, differences between species' mixing ratio enhancements likely reflect specific sources influencing air masses that reach the park.
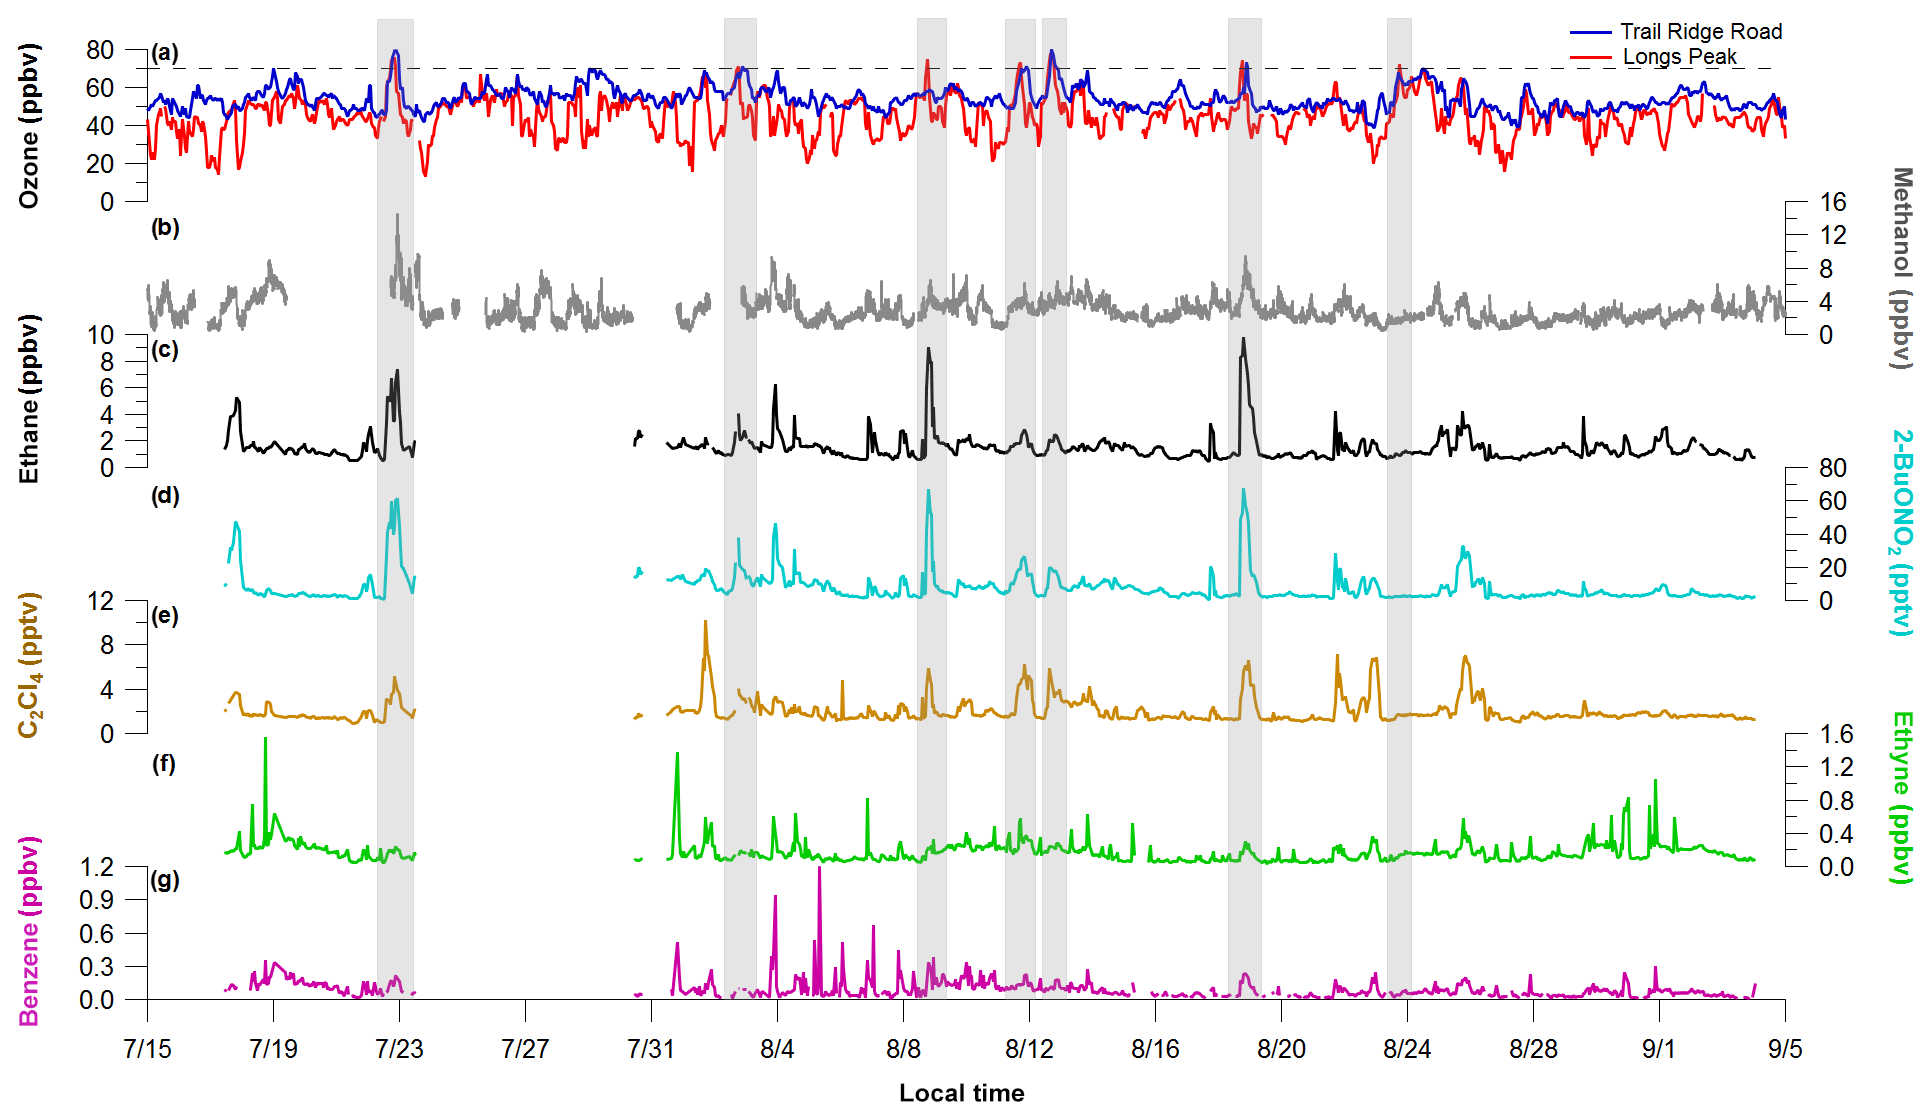
Figure 3A subset of VOCs measured at the ROMO-LP site from 17 July to 4 September 2014. From 19 to 22 July and from 23 to 30 July, the PTR-MS and GC system, respectively, were shut down due to air conditioner failures in the field laboratories. Ozone measurements from both the ROMO-LP (Longs Peak) and ROMO-TR (Trail Ridge Road) sites are also shown. Shaded areas represent periods selected for further analysis when hourly O3 exceeded 70 ppb (dashed line).
All of the VOCs from Fig. 3 have sources in the NFRMA. For example, light alkanes (e.g. ethane) have oil and natural gas sources in northeastern Colorado and have been observed in high abundance along the Front Range (Abeleira et al., 2017; Gilman et al., 2013; Swarthout et al., 2013). Vehicle combustion, prevalent throughout the NFRMA, is an important source of light alkenes, ethyne, and aromatics (e.g. benzene) (Koppmann, 2007), although oil and gas emissions have also been shown to be the most important source of aromatics, specifically benzene, at certain locations (Abeleira et al., 2017; Halliday et al., 2016). C2Cl4 and C2HCl3 are widely used as solvents and dry cleaning fluids and are frequently used as tracers of urban air masses (Blake et al., 1996). Methanol has vegetative sources and potential oil and gas sources in some basins where it is used during cold weather to inhibit equipment freezing (Warneke et al., 2014), but, more importantly for the Front Range, in summer this trace gas also comes from animal agriculture and confined animal feeding operations (CAFOs) (Sun et al., 2008). Given the co-location of agricultural and oil- and gas-related sources in NE Colorado, it is difficult to ascertain the magnitude of each source, but it is likely that agriculture and CAFOs would be the larger source in the NFRMA and surrounding areas during the summer.
To better understand VOC influence from these sources, air mass transport patterns were examined with back trajectories started hourly at 10 m above ground with previous air mass positions traced backward in time for 2 days using the Hybrid Single-Particle Lagrangian Integrated Trajectory (HYSPLIT) model version 4.9 (Stein et al., 2015). Input data are from the North American Mesoscale Model with a grid resolution of 12 km (NAM12) (Janjic, 2003). Back-trajectory residence time analyses are a long-established method to examine upwind air mass transport pathways for periods of interest (Ashbaugh et al., 1985). Previous back-trajectory analyses for ROMO captured most meso-synoptic-scale patterns, but may underestimate the easterly upslope flow into the park (Gebhart et al., 2011, 2014). In Fig. 4a, the overall residence time (ORT) shows the relative probability for transport from the areas upwind of ROMO-LP during all hours of the study without regard to observed air mass composition. Results indicate that, during the study period, air masses arrived from all directions, but areas most frequently upwind were areas to the southwest and the Front Range. Similarly, high-mixing-ratio residence times (HRTs) were generated using only hours when a measured VOC mixing ratio at ROMO-LP exceeded the 90th percentile of study values. The HRT for ethane, which primarily is from leakage during the production and transport of natural gas (Tzompa-Sosa et al., 2017), is shown in Fig. 4b. A sparser pattern results from including only 10 % of the hours. Many of the same areas are upwind as in the ORT, but areas to the east have a higher probability of being upwind during this subset of high-concentration time periods.
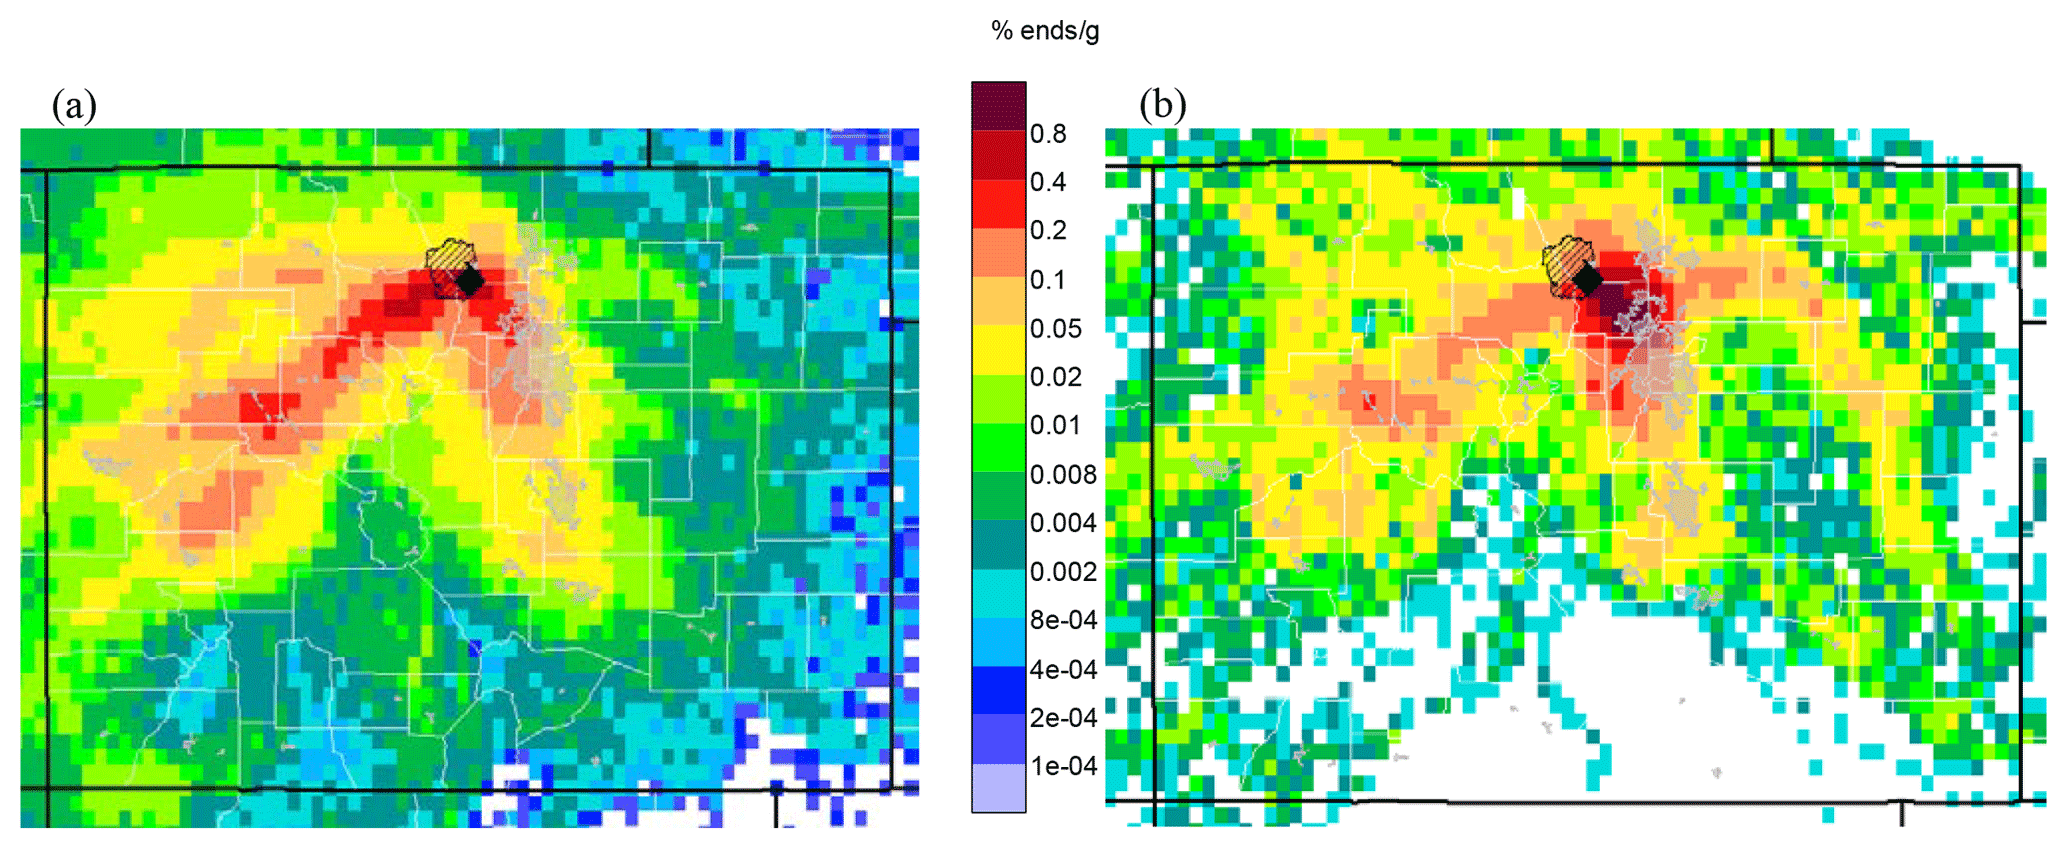
Figure 4Residence time maps showing areas up to 2 days upwind of ROMO-LP (black diamond) during (a) all hours of the study period (17 July–4 September 2014) and (b) during hours with ethane >90th percentile. Colors indicate the relative frequency of transport. Light-grey overlay indicated urban areas. Units are the percent of total endpoints in each grid cell. Endpoints are upwind air mass locations calculated every hour for 2 days back in time for every trajectory that arrived at the receptor during the duration of the study period.
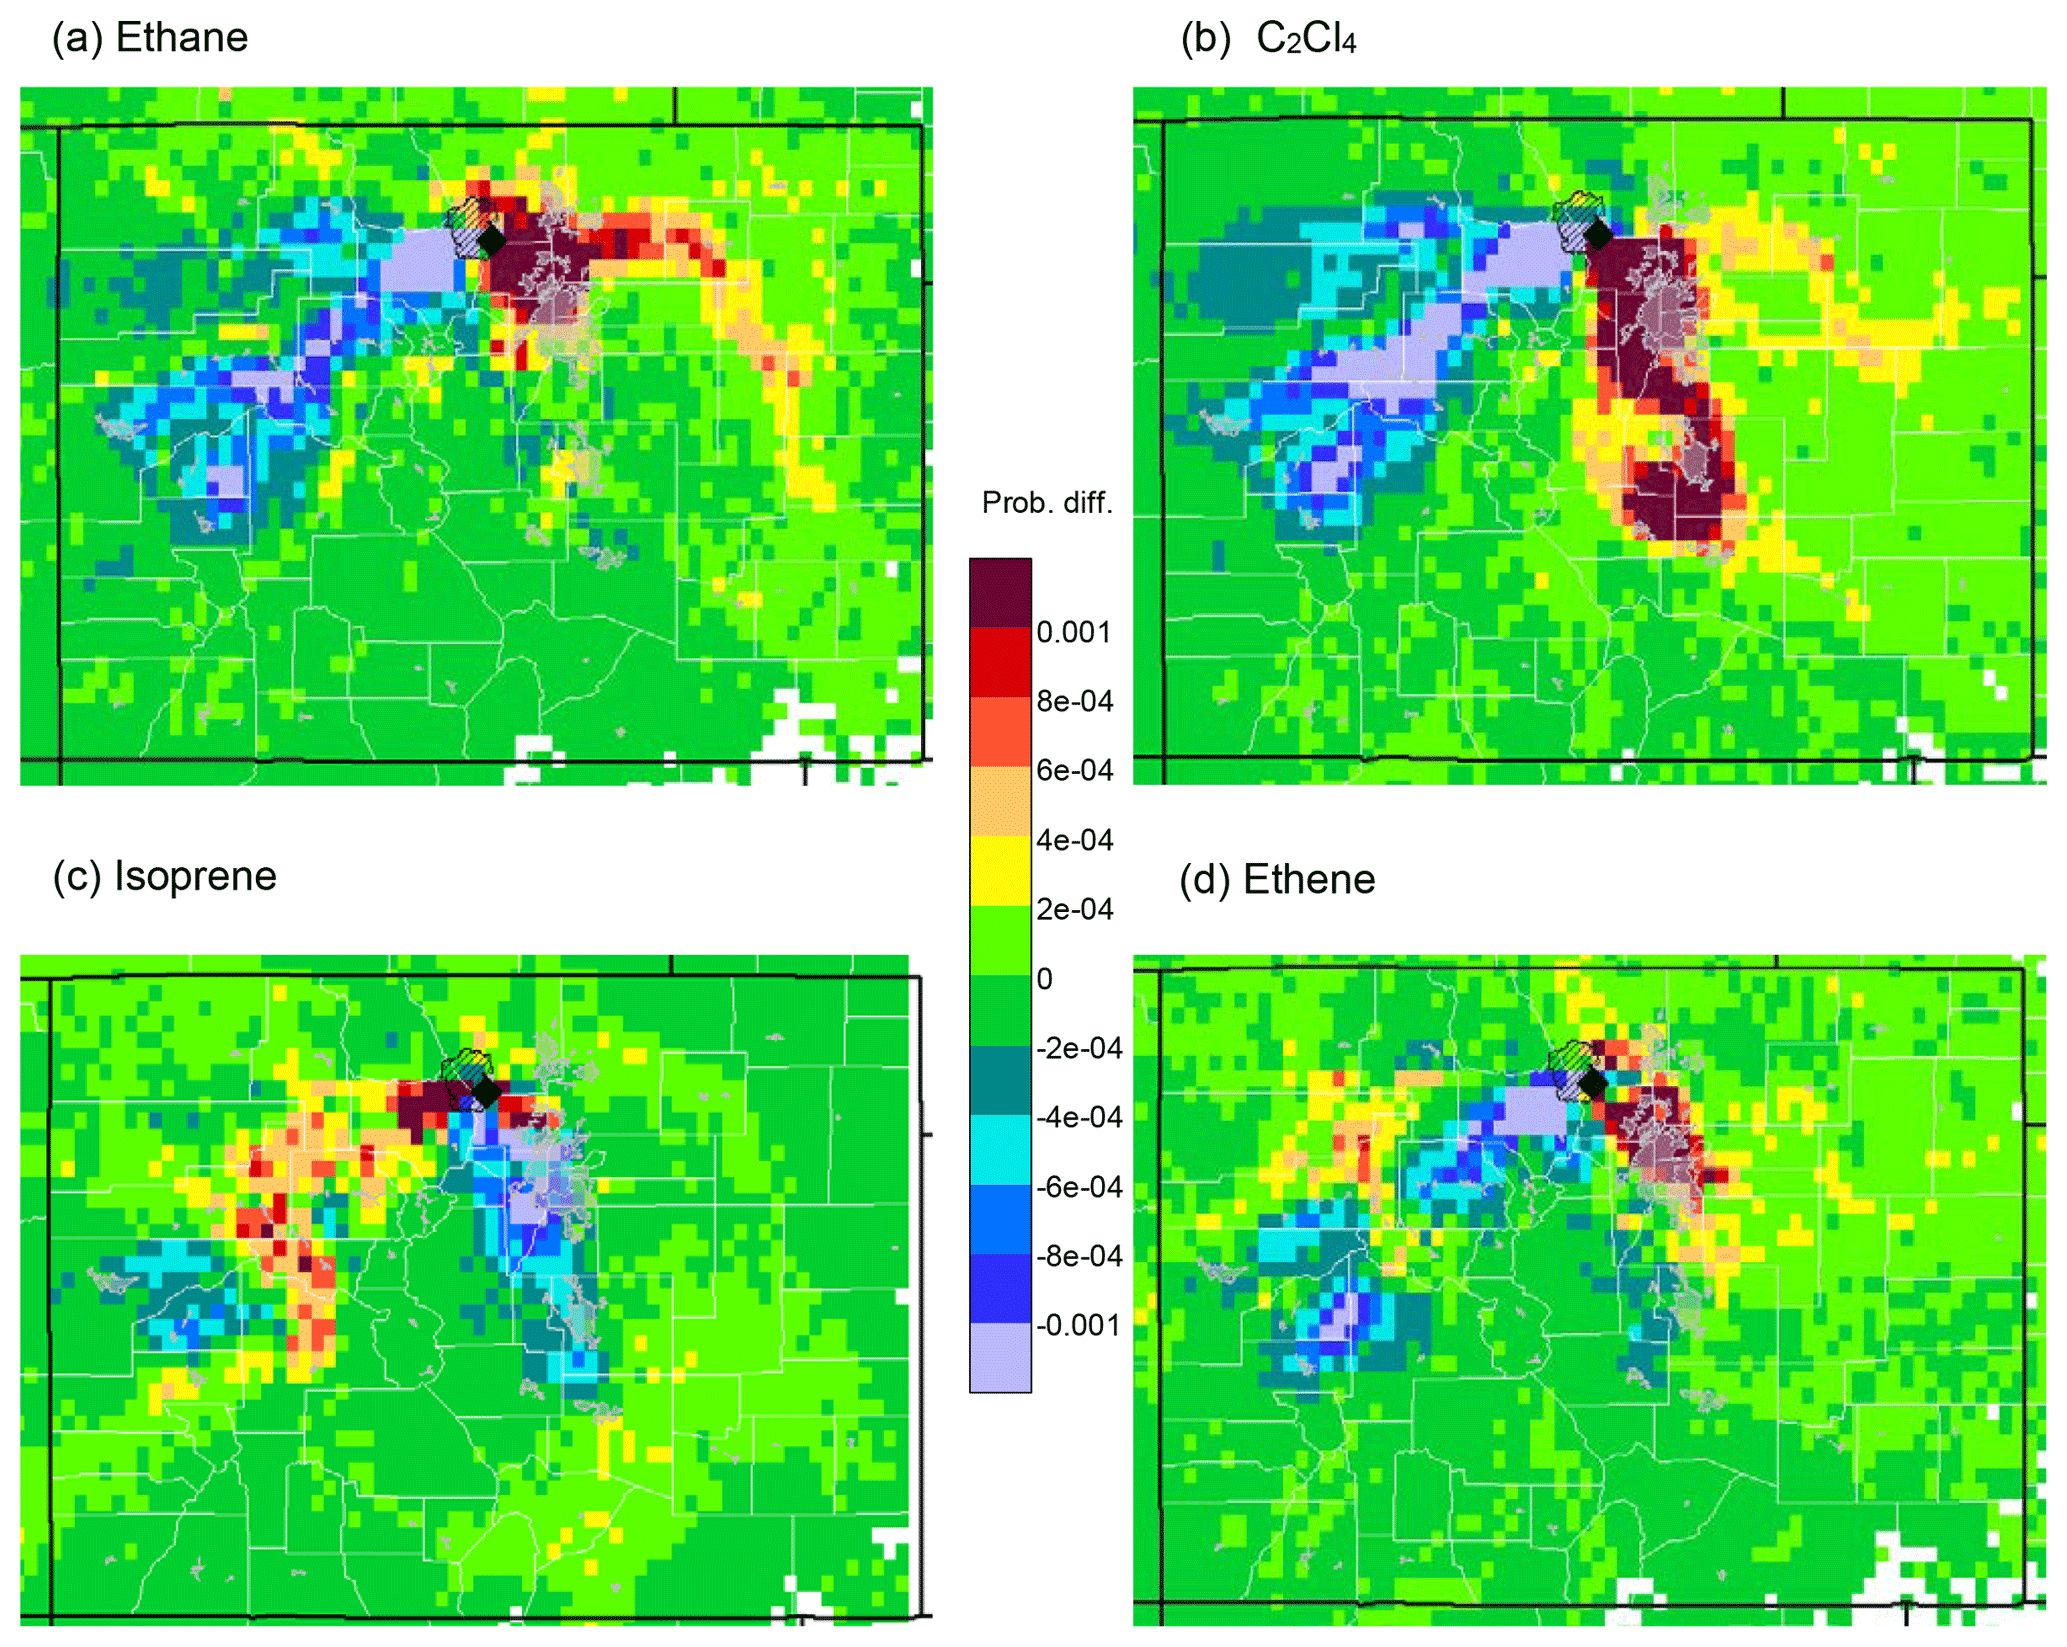
Figure 5Differences between upwind transport during hours of 90th percentile or higher mixing ratios and average conditions during the study (HRT − ORT) for (a) ethane, (b) C2Cl4, (c) isoprene, and (d) ethene. Yellow to red colors indicate areas that were more likely than average to be upwind during the 2 days prior to a high-concentration measurement at ROMO-LP (black diamond). Blue to purple colors indicate areas that were less likely to be upwind, while areas in green had similar likelihoods of being upwind during average hours and during high-mixing-ratio hours. Light-grey overlay indicated urban areas.
Figure 5 presents differences between transport patterns during high-mixing-ratio measurements (exceeding the 90th percentile), as compared to all study conditions. The difference maps in Fig. 5 are calculated by subtracting the overall probability of transport (ORT) from the probability of transport on a high-mixing-ratio hour (HRT), or HRT − ORT (Poirot et al., 2001). Figure 5a shows the results for ethane (Fig. 4b–a). This more clearly shows that high concentrations of ethane are preferentially associated with transport from northeastern Colorado, where large oil and gas emissions occur (Fig. 2). Figure 5b shows a similar analysis, but for C2Cl4 (urban tracer) measurements. The results again point to the NFRMA, but with more of an influence from further south toward Denver because of its widespread usage in the region. Figure 5c shows results for isoprene in this case, wooded mountainous areas to the west are upwind more often than average. Plots for ethene (tracer for fuel combustion) (Fig. 5d) and ethyne (not shown) also point to the NFRMA. These results are not surprising, as upslope conditions from the east are expected to transport pollutants to the park. However, this is the first time that in situ VOC tracers have been used to demonstrate the many Front Range sources that impact ROMO.
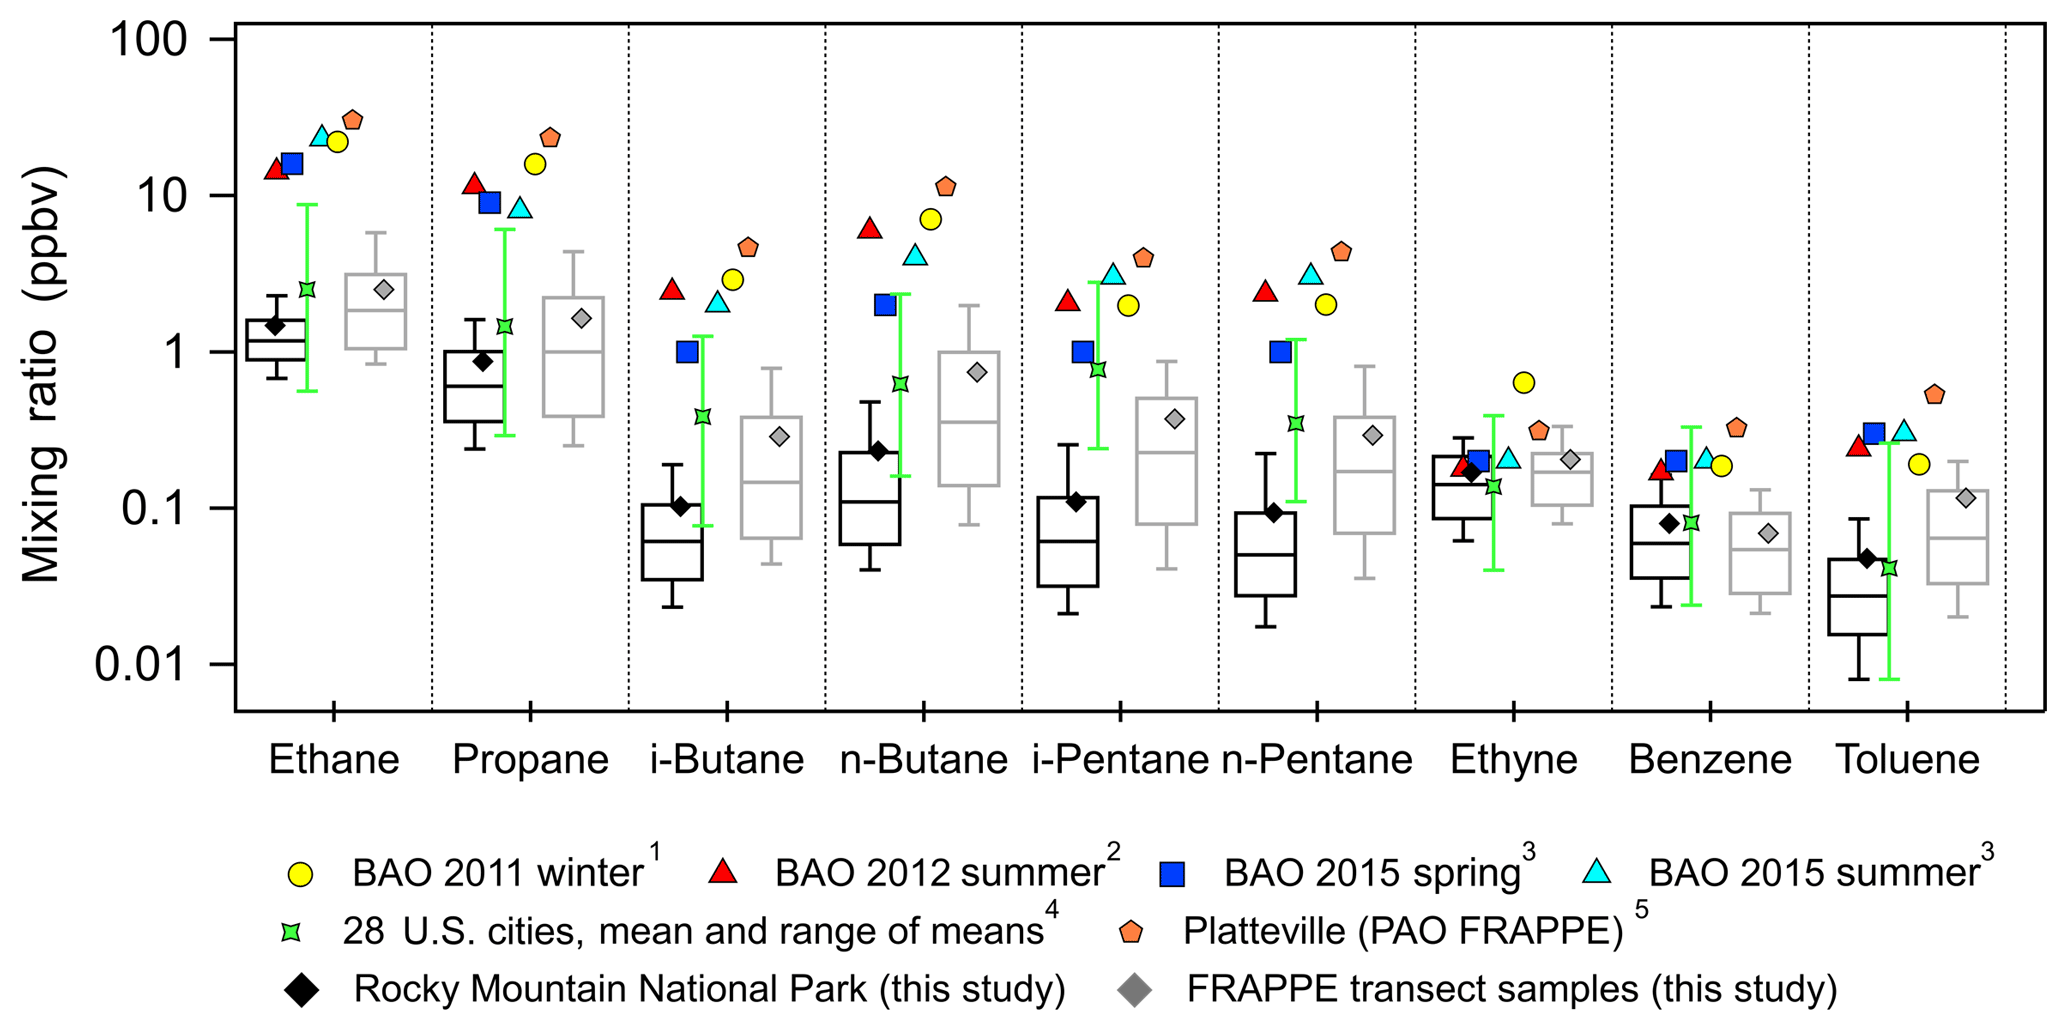
Figure 6Box plots for mixing ratios of selected VOCs in ROMO hourly samples (black) and all transect canister samples (grey) and mean mixing ratios from previous studies (1 Swarthout et al., 2013, 2 McDuffie et al., 2016, 3 Abeleria et al., 2017, 4 Baker et al., 2008, 5 Halliday et al., 2016). Median mixing ratios from this study are shown as the black horizontal lines, the means are shown as the diamond symbols, the top and bottom of the boxes are the 75th and 25th percentiles, and the whiskers are the 90th and 10th percentiles. The error bars on the Baker et al. (2008) data represent the maximum and minimum means observed across the cities. The data from Swarthout et al. (2013) are a mean of hourly canisters collected from noon on 18 February to noon 13 March 2011. The McDuffie et al. (2016) data are a mean of in situ measurements made every 25 min from 27 July to 12 August 2012. Abeleria et al. (2017) collected in situ hourly data and the values shown are means. PAO canisters were typically collected 2–3 times a day most days from 17 July to 10 August; the data can be found in NASA Langley's data repository (https://www-air.larc.nasa.gov/data.htm, last access: 16 August 2018).
At their peak values, NMHC mixing ratios observed at ROMO can be of comparable magnitude to urban/industrial regions, further suggesting a significant impact of the polluted NFRMA on ROMO during specific events. The range of mixing ratios observed at ROMO overlaps the range of observations compiled by Baker et al. (2008) from 28 cities across the United States (Fig. 6). Mixing ratios of i-pentane at ROMO are generally lower than those observed in the 28 cities, likely due to the impact of oil and gas in the region as combustion emissions are enhanced in i-pentane from the reformulation of gasoline while oil and gas emissions tend to have slightly elevated levels of n-pentane (vs. i-pentane) when extracted from the ground. Although measurements at ROMO were lower than at most other locations shown in Fig. 6, mixing ratios of these VOCs are much higher at ROMO than is typical for remote sites (Jobson et al., 1994; Rindsland et al., 2002; Rudolph, 1995; Simpson et al., 2012). Observed mixing ratios during afternoons with upslope flow can be similar to those observed simultaneously in the Front Range (see maximum values in Table 1). ROMO is a Class I area that is afforded the highest level of air quality protection, while these other locations are in major source regions. The fact that maximum NMHC levels at ROMO are of similar magnitude to these other areas suggests a significant impact on the park from anthropogenic emissions, at least during episodic transport. Figure 6 also includes measurements made during FRAPPÉ at the Platteville Atmospheric Observatory (PAO), a rural location surrounded by agriculture and intensive oil and gas development in northeastern Colorado (Halliday et al., 2016). Observed mixing ratios at this site tended to be the highest of those included in this figure. With the exception of benzene and ethyne, measured mixing ratios from the transect samples (grey) and other measurements made in the Front Range (Abeleira et al., 2017; McDuffie et al., 2016; Swarthout et al., 2013) generally exceed those measured in ROMO. The transect samples were collected next to the road and only during daytime hours, when upslope flow from the east is prevalent. Both factors likely contribute to the larger values measured compared to the measurements at ROMO. The ROMO and transect ethyne mixing ratios presented in this figure likely represent background levels as there is significant overlap for all sites with the range of means from 28 US cities. Benzene mixing ratios also suggest background values for the ROMO and transect samples while slightly elevated mixing ratios at BAO and PAO indicate additional sources, likely from oil and gas (Halliday et al., 2016).
The ratio of i-pentane to n-pentane has been used to identify air masses impacted by oil and gas emissions. Although this ratio varies by basin, a ratio less than 1 is generally indicative of oil and gas emissions (COGCC, 2007; Gilman et al., 2013; Prenni et al., 2016; Swarthout et al., 2013, 2015). During FRAPPÉ, Halliday et al. (2016) reported an i- to n-pentane ratio of 0.89 at PAO. This ratio is expected to be enhanced in areas where fuel evaporation is an important source of NMHCs (Harley et al., 1992; McGaughey et al., 2004), as i-pentane is an abundant component of gasoline and is elevated relative to n-pentane. As such, ratios in urban areas are often in the range of 1.5–4 (Baker et al., 2008; McLaren et al., 1996; Parrish et al., 1998; Russo et al., 2010a). For ROMO-LP hourly samples, shown in Fig. 7, the average ratio of i-pentane to n-pentane was 1.10 throughout the campaign. The transect samples had an average ratio of 1.19 (not shown), which is 8 % higher than the ROMO hourly samples. The slightly higher values along the transects may reflect impacts from nearby vehicle emissions. In Fig. 7, markers are colored by ethane mixing ratio. As seen in Fig. 7, a strong oil and gas signature is evident on many sample days, with low i- to n-pentane ratios associated with higher ethane mixing ratios; similarly, higher ratios were usually associated with lower ethane mixing ratios from clean air masses transported from the west.
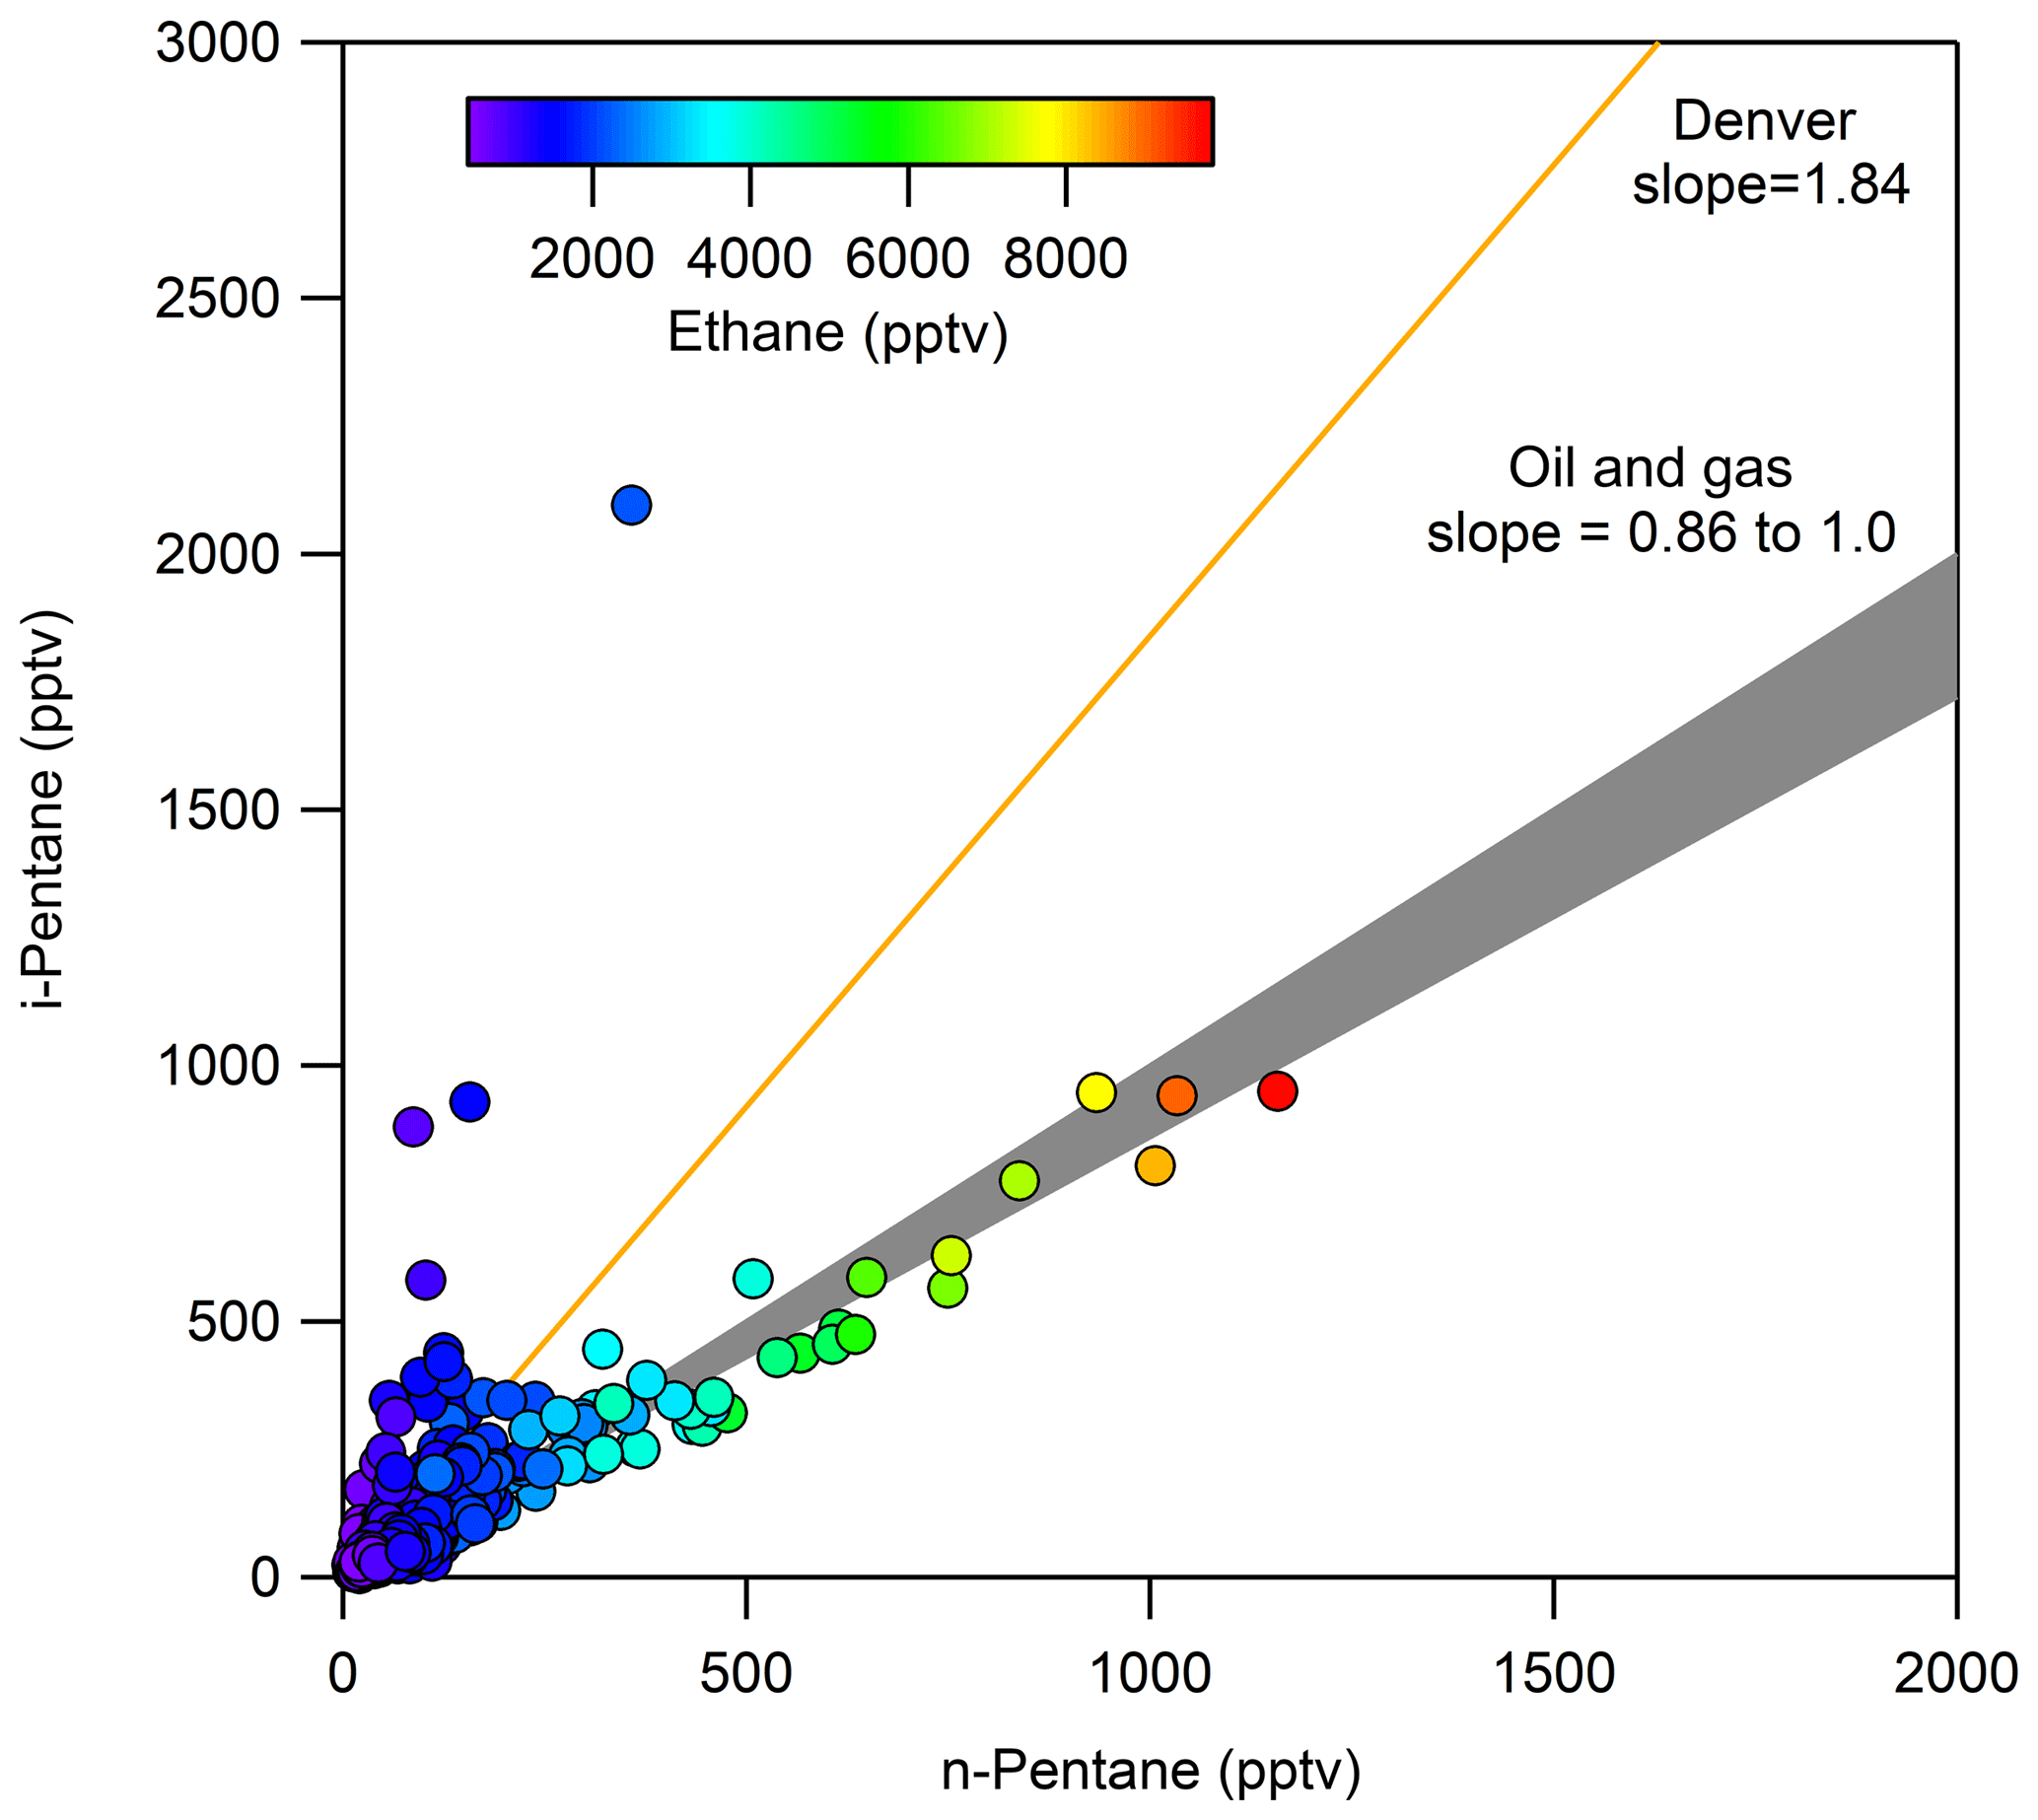
Figure 7i-Pentane versus n-pentane for ROMO hourly samples, colored by ethane mixing ratio. For reference, also shown are the i- to n-pentane ratios for measurements collected in Denver (Baker et al., 2008) and a range of slopes from 0.86 to 1 line where everything that falls in this range indicates oil and gas influenced (COGCC, 2007; Gilman et al., 2013).
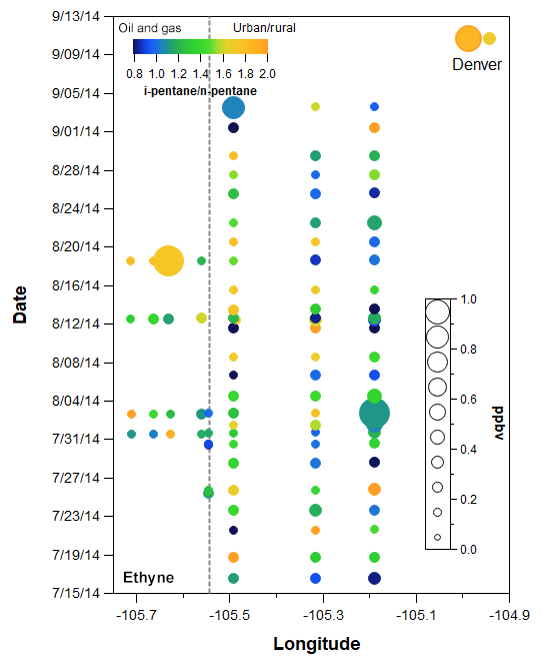
Figure 8VOC canister data plotted by longitude and date with ethane mixing ratio represented by the size of each point and the i- to n-pentane represented by the color. Locations correspond to transect samples shown in Fig. 2. Points to the left of the grey dashed line were taken in ROMO.
Figure 8 shows the spatial and temporal variability of i- to n-pentane in all of the canister transect samples, with the points sized by ethane mixing ratio (other gases are shown in the Supplement Fig. S3). The transect samples show a general east–west gradient with lower ratios typically observed at the easternmost sites, consistent with the oil and gas production activity in this area. However, significant variability was observed throughout the study at most of the transect sampling locations, with the range encompassing conditions indicative of dominant oil and gas influence (<1) to conditions more indicative of urban influences (1.93). On three occasions samples were collected from the Front Range up to the ROMO-TR site near the continental divide. Even limiting measurements to these three sampling dates at high elevation, the i- to n-pentane ratios indicated a range of air mass source histories impacted the park.
4.1 Ozone distributions at ROMO during FRAPPÉ
Ozone measurements at the ROMO-LP and ROMO-TR sites show coincident peaks for most of the FRAPPÉ study period (Fig. 3), although O3 mixing ratios were slightly higher and had considerably less variability at the ROMO-TR site. For ease of comparison, the frequency distributions of the O3 mixing ratios are shown in Fig. 9. The mean O3 mixing ratios at ROMO-TR and ROMO-LP were 53 ppb (1 h max: 82 ppb) and 43 ppb (1 h max: 79 ppb), respectively, where ROMO-LP is lower in elevation and closer to the Front Range. Differences in these distributions can be attributed to several factors. First, the Longs Peak site is located in a valley, where pollutants can be trapped by stable nocturnal inversions, allowing efficient dry deposition or the titration of O3 by NO, as seen by the regular nighttime decreases in O3 in Fig. 3. In comparison, the Trail Ridge Road site near the continental divide sits above the nocturnal inversion and is isolated from surface loss processes. This results in a skewed distribution toward lower mixing ratios at the Longs Peak site, with the median, 25th percentile, and 75th percentile values of 45, 36, and 51 ppb compared to the normal distribution at Trail Ridge Road with higher median, 25th percentile, and 75th percentile values of 53, 49, and 57 ppb (Fig. 9). Second, additional photochemical processing can occur during transport to the more distant Trail Ridge site during upslope events, resulting in slightly higher O3 levels, as indicated by the 1 h maximum values (ROMO-TR = 82 ppb; ROMO-LP = 79 ppb). Nevertheless, the relationship of the timelines of the O3 data from both sites during elevated concentrations suggests they are often impacted by similar air masses (r2=0.33, p<0.0001).
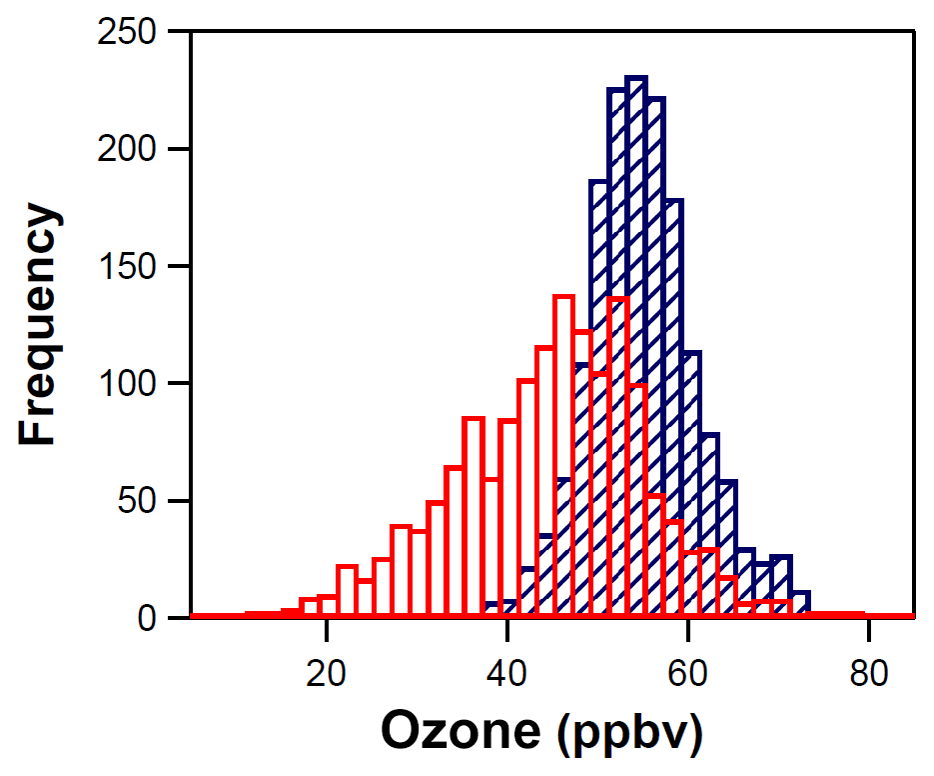
Figure 9Distribution of the O3 mixing ratios at the ROMO-LP (red) and ROMO-TR (blue) sites for the entire study period.
Elevated O3 mixing ratios at ROMO are generally expected to be related to air masses that are transported to the site from the NRFMA resulting from the mountain–plains solenoid circulation, a local transport phenomenon occurring frequently during summertime (Bossert and Cotton, 1994; Sullivan et al., 2016; Toth and Johnson, 1985). Such conditions have the potential to transport air pollutants into the park from oil and gas source regions as well as from urban sources across the Front Range, as shown in Figs. 4 and 5. Conducting a similar back-trajectory analysis for O3 as done for the VOCs, Fig. 10 shows results for HRT − ORT for the top 10 % of O3 measurements. As for the VOCs, elevated O3 mixing ratios are largely associated with transport from the NFRMA (including Denver).
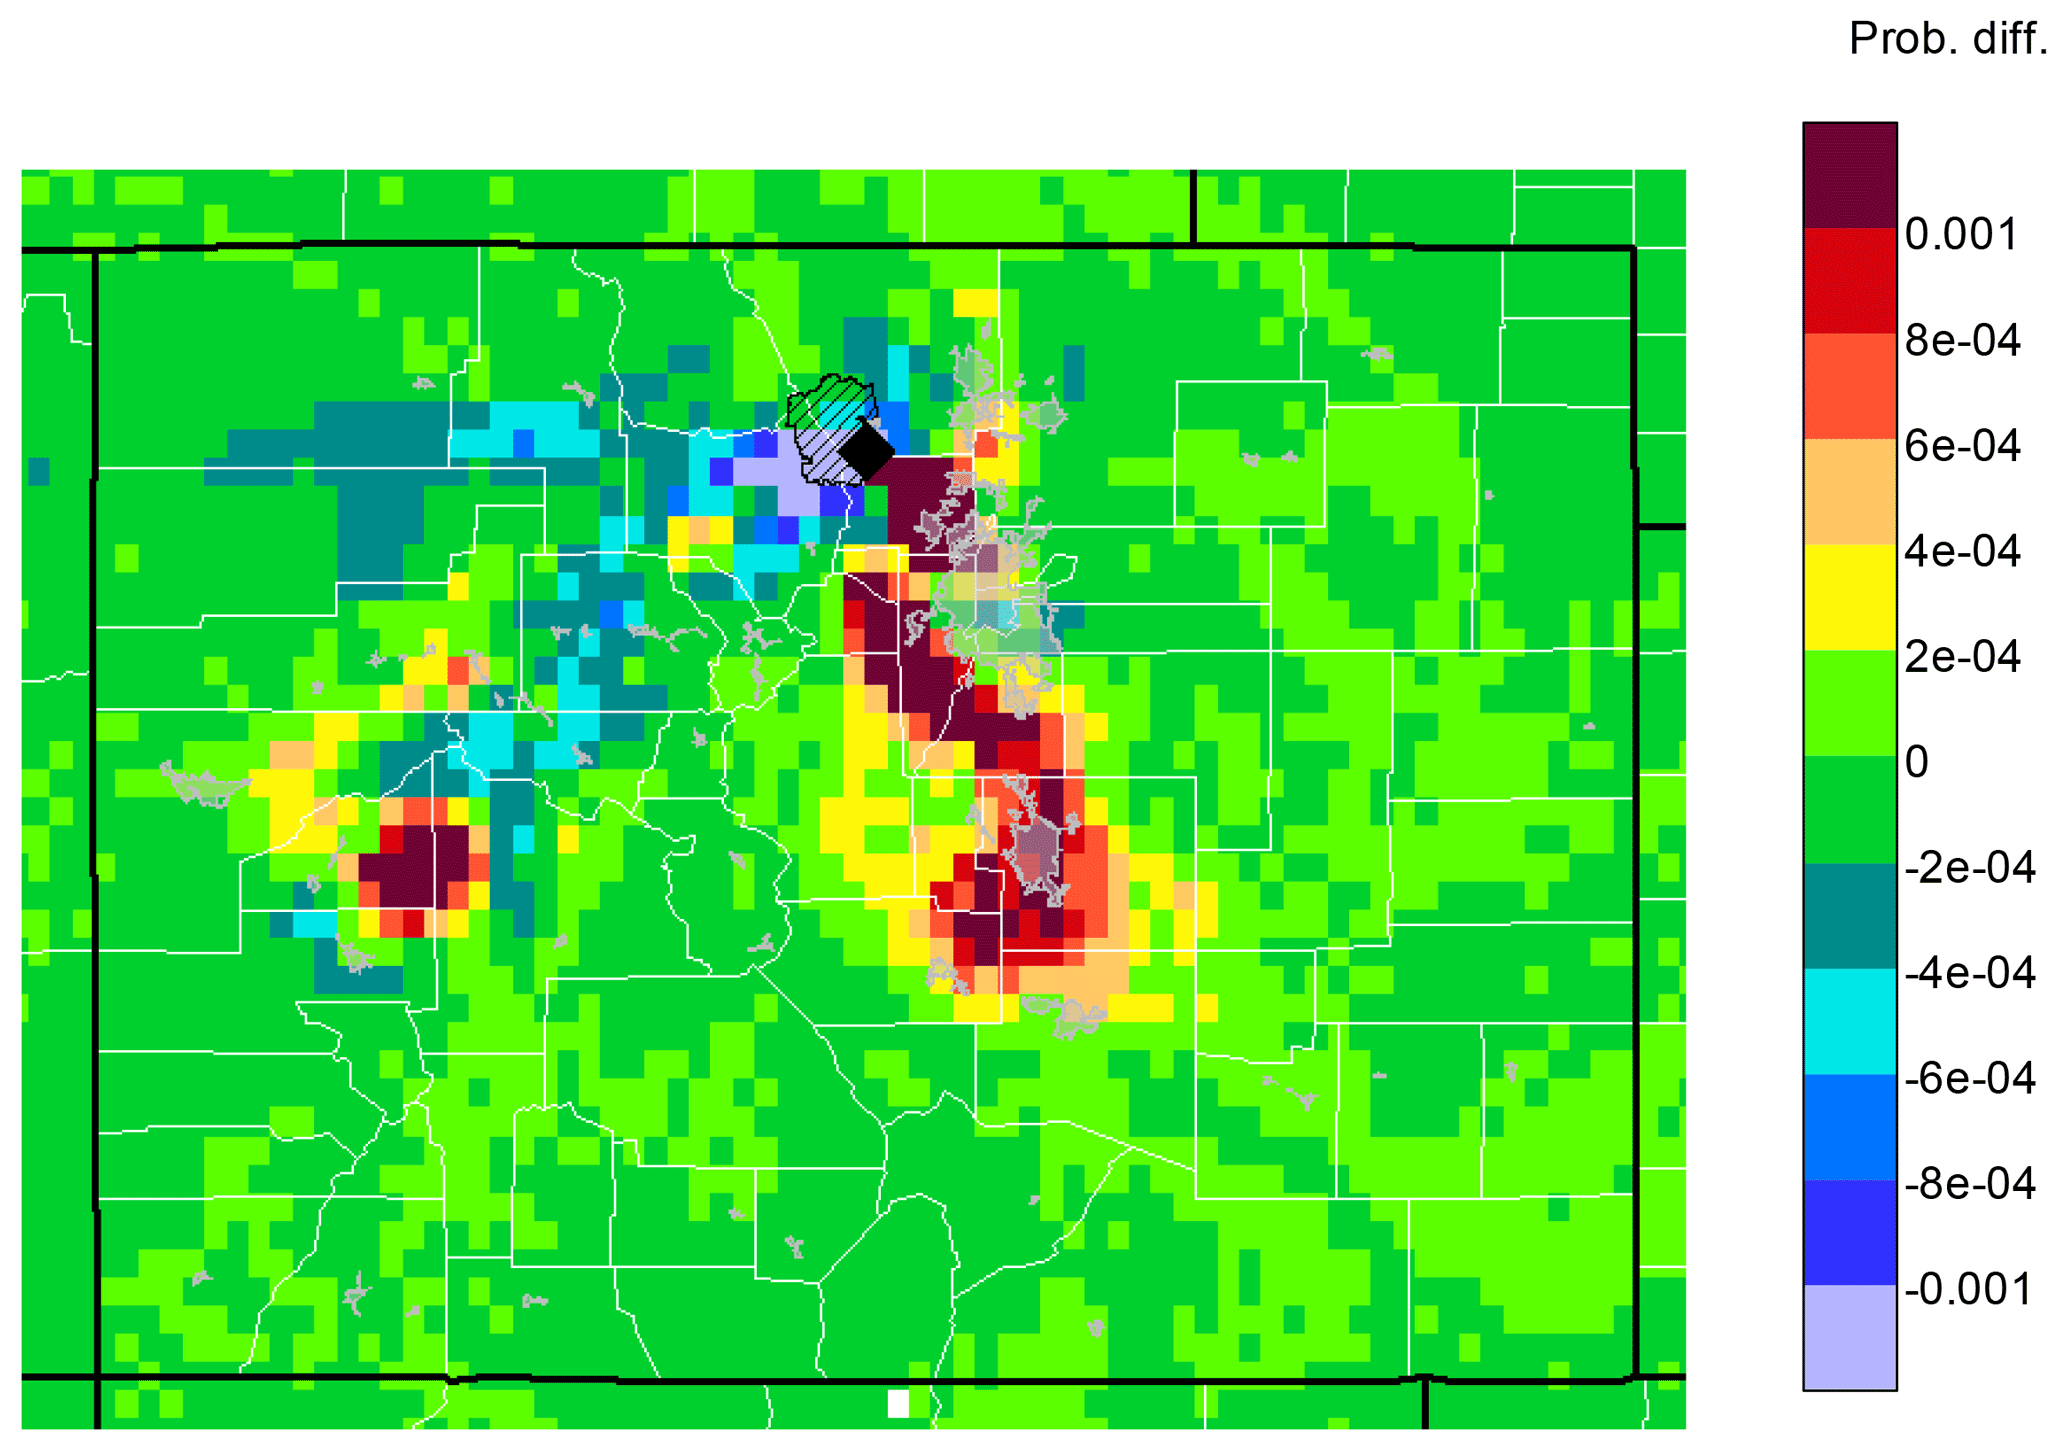
Figure 10Differences between upwind transport during hours of 90th percentile or higher mixing ratios and average conditions during the study (HRT − ORT) for O3. Warm colors indicate areas that were more likely than average to be upwind during the 2 days prior to a high-mixing-ratio measurement at ROMO-LP. Cool colors indicate areas that were less likely to be upwind, while areas in green had similar likelihoods of being upwind during average and high-mixing-ratio hours.
4.2 High-O3 days
Impacts to ROMO during upslope events can be quite pronounced with elevated mixing ratios of many VOCs including alkanes, alkyl nitrates, and others depending on the event, but assessing these same upslope events averaged over a day or more diminishes their visibility, resulting in lower overall values for these longer time periods. Therefore, we use an event-based approach focused on upslope events from the NFRMA to examine what sources of Front Range emissions are impacting ROMO. During FRAPPÉ, 1 h O3 mixing ratios equal to or greater than 70 ppb were observed at both the ROMO-LP and ROMO-TR sites. These events are indicated by the grey shaded areas in Fig. 3 and are summarized in Table 2. Elevated O3 mixing ratios were typically accompanied by increased concentrations of various VOC source tracers. For example, alkyl nitrate concentrations (2-butyl nitrate, 2-BuONO2, is shown as an example) in Fig. 3 were elevated on 6 of the 7 high-O3 days (not 23 August). Alkyl nitrates are produced from the oxidation of their parent hydrocarbons such as n-butane and n-pentane, emissions derived primarily from fossil fuels in the NFRMA, and share a common photochemical production mechanism with O3. PAN was also elevated (>700 pptv) on all of the days shown in Table 2 except 23 and 24 August (see below).
Table 2Summary of high-O3 events where at least 1 h exceeded 70 ppb. Timing of the exceedance and the average peak concentration for both the Longs Peak and Trail Ridge monitoring sites are also included. Times shown are local.
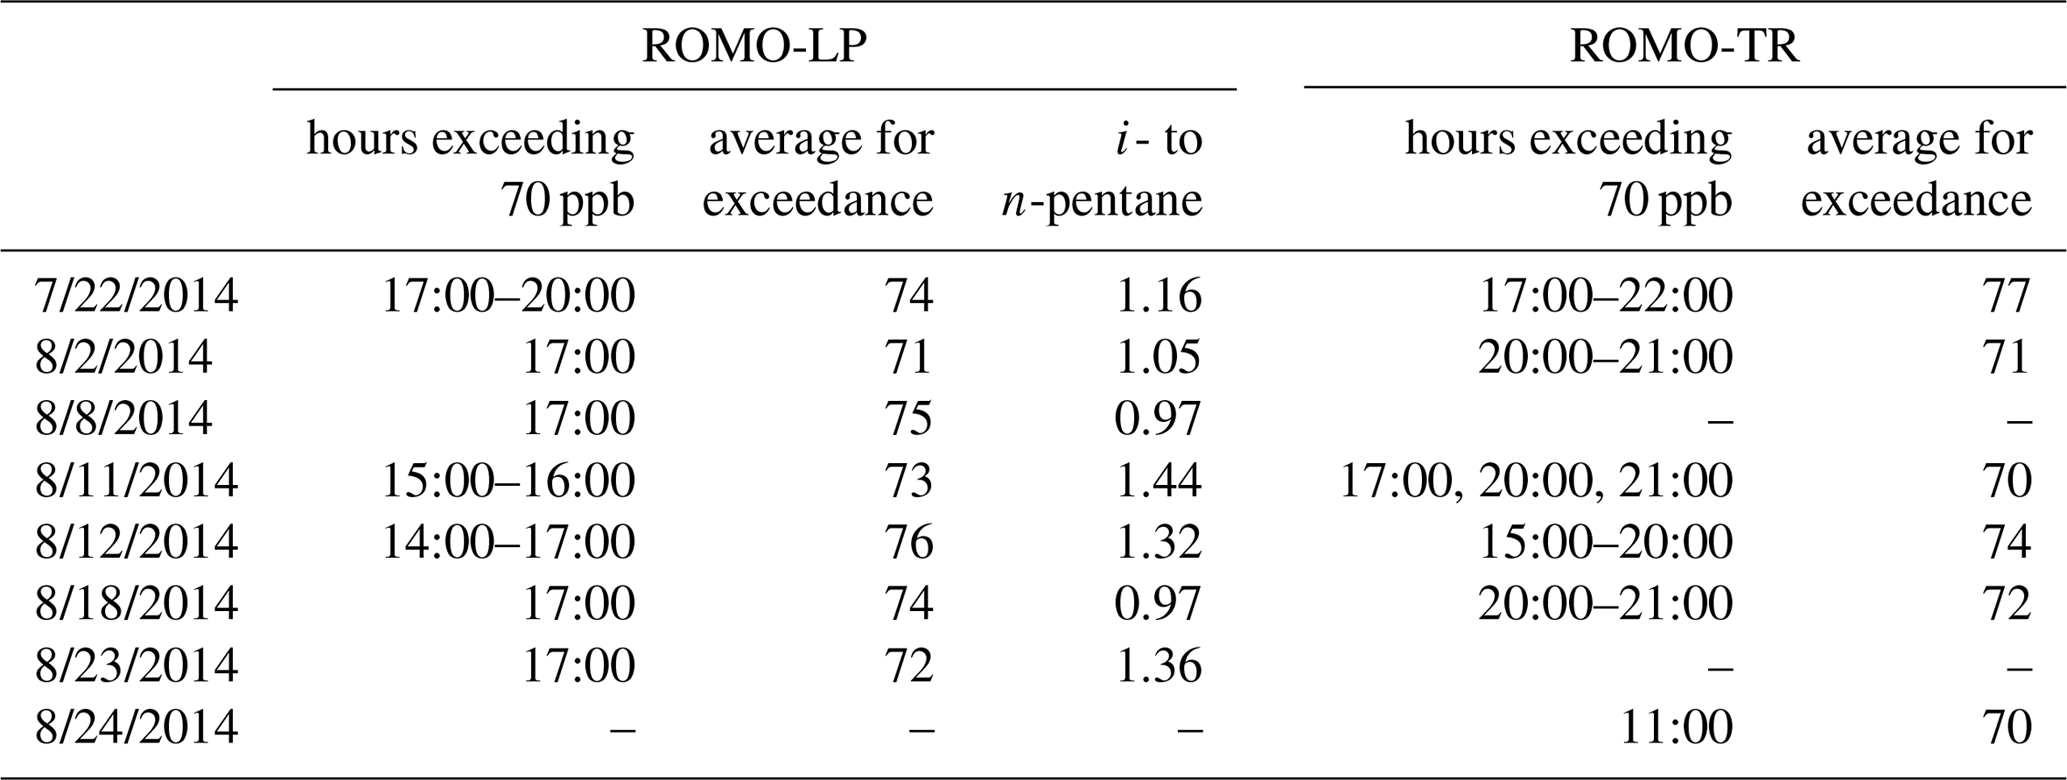
During upslope flows created by thermally driven mountain–valley circulation, a mixture of direct emissions and photochemically produced secondary compounds can be transported to ROMO. We observed increases in concentration of a mixture of photochemically produced (PAN, alkyl nitrates) and directly emitted (alkanes, NOx) compounds at ROMO during these events. The photochemistry that produces species like PAN and alkyl nitrates can occur anywhere along the transport path to the ROMO receptor site. VOC signatures are useful in assessing the influence of oil and gas emissions in the Front Range on air masses with elevated O3 mixing ratios transported to the park. As noted above, the i- to n-pentane ratio is expected to be less than 1 for air masses primarily impacted by oil and gas emissions. Two of the O3 episodes had i- to n-pentane ratios above 1.3 (11 and 12 August ) while two O3 episodes, 8 and 18 August, occurred when the i- to n-pentane ratios were less than 1 (Table 2). In all of the air masses from these days, the VOC signatures reflect several Front Range source types. On 8 and 18 August the pentane ratio is less than 1 and alkane (C2–C6) mixing ratios are 3.8 times higher than canister samples from Denver, suggesting greater influence from oil and gas emissions, compared to the other high-O3 days at ROMO. 22 July, another high-O3 day, had an average i- to n-pentane ratio of 1.16 with the ratio increasing over the hours of the exceedance to 1.4. Alkane mixing ratios on 22 July were 2.2 times greater than in Denver while 11 and 12 August had an average alkane mixing ratio 1.2 times greater than those observed in Denver. Due to the higher i- to n-pentane ratio during the peak of O3 and the relative alkane mixing ratio, 22 July was grouped with 11 and 12 August as a mixed air mass with urban and oil and gas influences. As seen in Fig. 3, these dates also had some of the highest ethane mixing ratios observed throughout the study period, in addition to elevated mixing ratios of O3, halocarbons, OVOCs, and ethyne.
To further investigate the impact of VOCs on O3 we next examine photochemical products and tracers. PAN is an excellent tracer of photochemical activity because it has a low background abundance and it is not directly emitted. Zaragoza et al. (2017) showed that, when PAN and O3 are disconnected in the Front Range, the source of the O3 is not local photochemical production. At ROMO we see that increases in O3 are associated with increases in alkyl nitrates and PAN suggesting a common photochemical source. The main source of the C2–C5 alkyl nitrates is the photochemical production from their parent alkane precursors, as outlined in the following simplified reaction scheme:
As shown by Reactions (R1)–(R5), alkyl nitrates share a common photochemical production mechanism with O3. However, O3 formation results from the photolysis of NO2 (Reaction R4), whereas the formation of alkyl nitrates serves as a sink for NOx, RO, and RO2, which affects O3 production efficiency (Atkinson et al., 1982; Ranschaert et al., 2000; Russo et al., 2010b). Nonetheless, based on these reactions, it is expected that under a wide range of conditions O3 and alkyl nitrates should be correlated as they are produced concurrently in the atmosphere (e.g., Abeleira et al., 2018; Day et al., 2003; Flocke et al., 1991; Perring et al., 2013; Rosen et al., 2004; Russo et al., 2010b). Methyl nitrate is excluded from this analysis because photochemical production from its parent alkane, methane, does not meet our assumptions, and there are primary sources which impact the park (Benedict et al., 2018). As noted in Perring et al. (2013), only a limited number of studies report the correlation of O3 or Ox with alkyl nitrates, with half of the studies using the sum of alkyl nitrates (ΣANs) because a nonselective technique was used that did not allow for individual speciation of the alkyl nitrates (Flocke et al., 1991; Neuman et al., 2012; O'Brien et al., 1995; Perring et al., 2013; Roberts et al., 1996; Rosen et al., 2004). Flocke et al. (1991) reported the correlation of ΣC2–C5 straight-chain-alkane-derived nitrates plus a single C4 branched-chain-alkane-derived nitrate with Ox measured at Shauinsland, Germany.

Figure 11Contributions to VOC–•OH reactivity (VOC-OHR) for the high-O3 days for peak O3 hours as shown in Table 2. Days with high O3 were grouped by the ratio of i- to n-pentane for oil- and gas-influenced and urban-influenced air masses. Background days, defined by the lowest 10th percentile for ethane, and the stratospheric influenced period are used for comparison to the high-O3 days resulting from anthropogenic activities. The size of each pie chart is proportional to the total VOC-OHR for the given type of air mass. Reactivity was calculated using rate constants from Atkinson and Avery (2003) and Atkinson (1986).
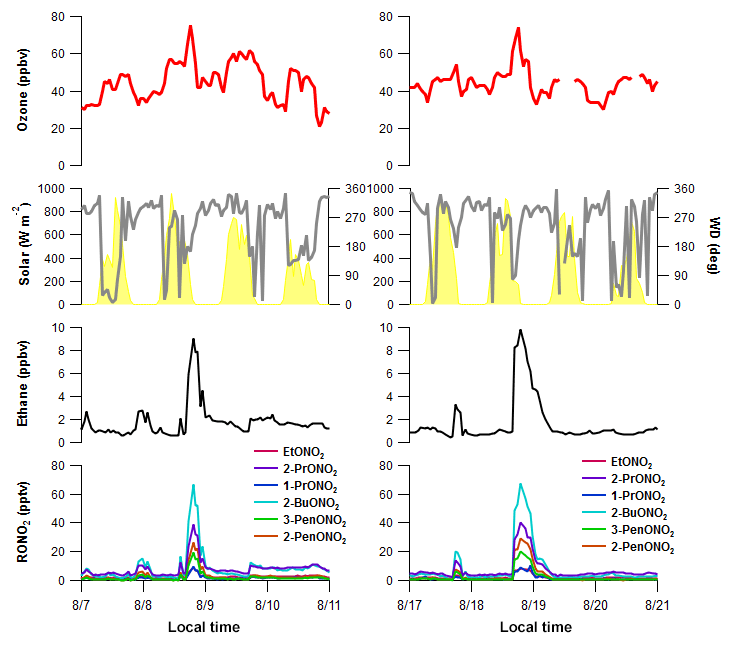
Figure 12Time series plots of O3, solar radiation, wind direction, ethane, and the C2–C5 alkyl nitrates during the (a) 8 August and (b) 18 August upslope events.
Here, we use coincident observations of alkyl nitrates during these elevated O3 periods to estimate the contribution of the light alkanes from NFRMA emissions to O3 production. Alkyl nitrate formation can be used as a proxy for O3 production if we make the following assumptions. First, photochemical production is rapid compared to removal processes and mixing across gradients. The rate of alkyl nitrate formation is tied to its parent alkane's concentration and reaction rate with the hydroxyl radical (OH), which is the VOC–OH reactivity (VOC-OHR; Reaction R1), as this is the rate-limiting step in alkyl peroxy radical (RO2) formation. In NFRMA areas that are more influenced by oil and gas emissions, the VOC–OH reactivity values for the alkyl nitrate parent alkanes are high (Fig. 11), resulting in rapid production compared to their removal rates. Because of their relatively long lifetimes ( days for summer), the C2–C5 alkyl nitrates can be transported long distances and serve as a temporary reservoir for NOx, ultimately leading to O3 production in downwind or remote regions (e.g., Clemitshaw et al., 1997; Flocke et al., 1998; Roberts et al., 1998). For the upslope events on 8 and 18 August, the assumption that photochemical production of the alkyl nitrates is rapid compared to removal processes is supported based on the rates of formation (hours) versus their removal (days). Second, the precursor compounds (VOCs and NOx) both have sources in Weld County, where significant oil and gas development exists. NOx was elevated during both events (not shown) and the 2014 National Emissions Inventory (US EPA, 2017) suggests Weld County has the largest emissions of NOx and VOCs in the state, and so it is reasonable to assume that emissions are collocated. The collocation of sources indicates these air masses likely contained sufficient NOx for alkyl nitrate and O3 formation and the excess O3 is clearly related to VOC and NOx emissions from the oil and gas region. There could be NOx additions to the air mass as it moves west, but this does not violate the assumption because of the timescale for the transport, which is relatively fast. Third, transport time from the source region (NFRMA) to the park is rapid (on the order of hours). This assumption is validated by the time series plots shown in Fig. 12, where during the upslope events rapid increases in mixing ratios are observed within an hour of when the wind shifts to an upslope direction.
To estimate the excess O3 produced and transported to ROMO during the upslope events, O3 is plotted against each of the alkyl nitrates for the time periods immediately before and after the event, as shown in Fig. 14 for 2-butyl nitrate, and fit with an orthogonal distance linear regression. The slope of O3 versus each of the alkyl nitrates was determined, then the hourly concentration for each alkyl nitrate was multiplied by the slope value. Table 3 provides a summary of the O3∕RONO2 slopes in ppbv/ppbv, intercept values (background O3) in ppbv, the range of attributed O3 (ppbv), and the attributed O3 value (ppbv) based on the correlation in each of the O3–alkyl-nitrate scatter plots. We use the background O3 value to estimate the range of influence on O3 production derived from Front Range source by the individual parent alkane precursors (attributed O3). Using this method we can also investigate the contribution of other VOCs to O3 production; however, in the case where alkanes are the dominant contributor to VOC–OH reactivity, we focus on the alkyl nitrates produced photochemically to provide an estimate of the NFRMA on O3.
Table 3Summary of the O3∕RONO2 slopes (ppbv/ppbv), intercept values (ppbv), the range of O3 attributable to each parent alkane, and the average O3 attributable to each parent alkane based on the correlation in each of the O3–alkyl-nitrate scatter plots for the upslope events on 8 and 18 August. An orthogonal distance regression was used to determine the slope and intercept.
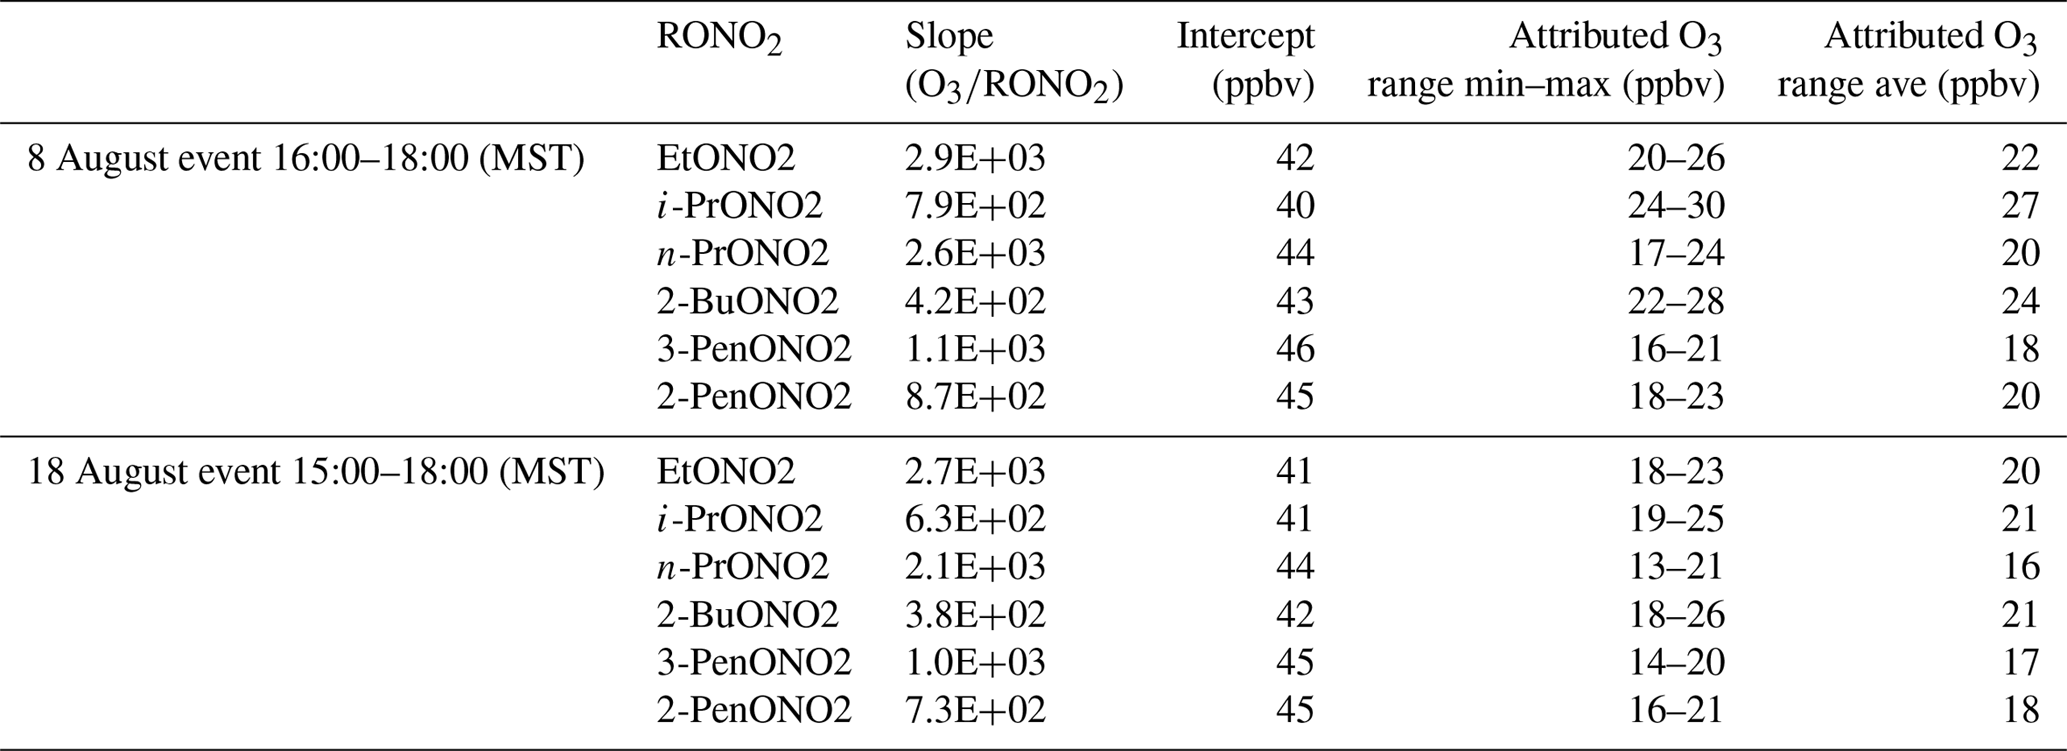
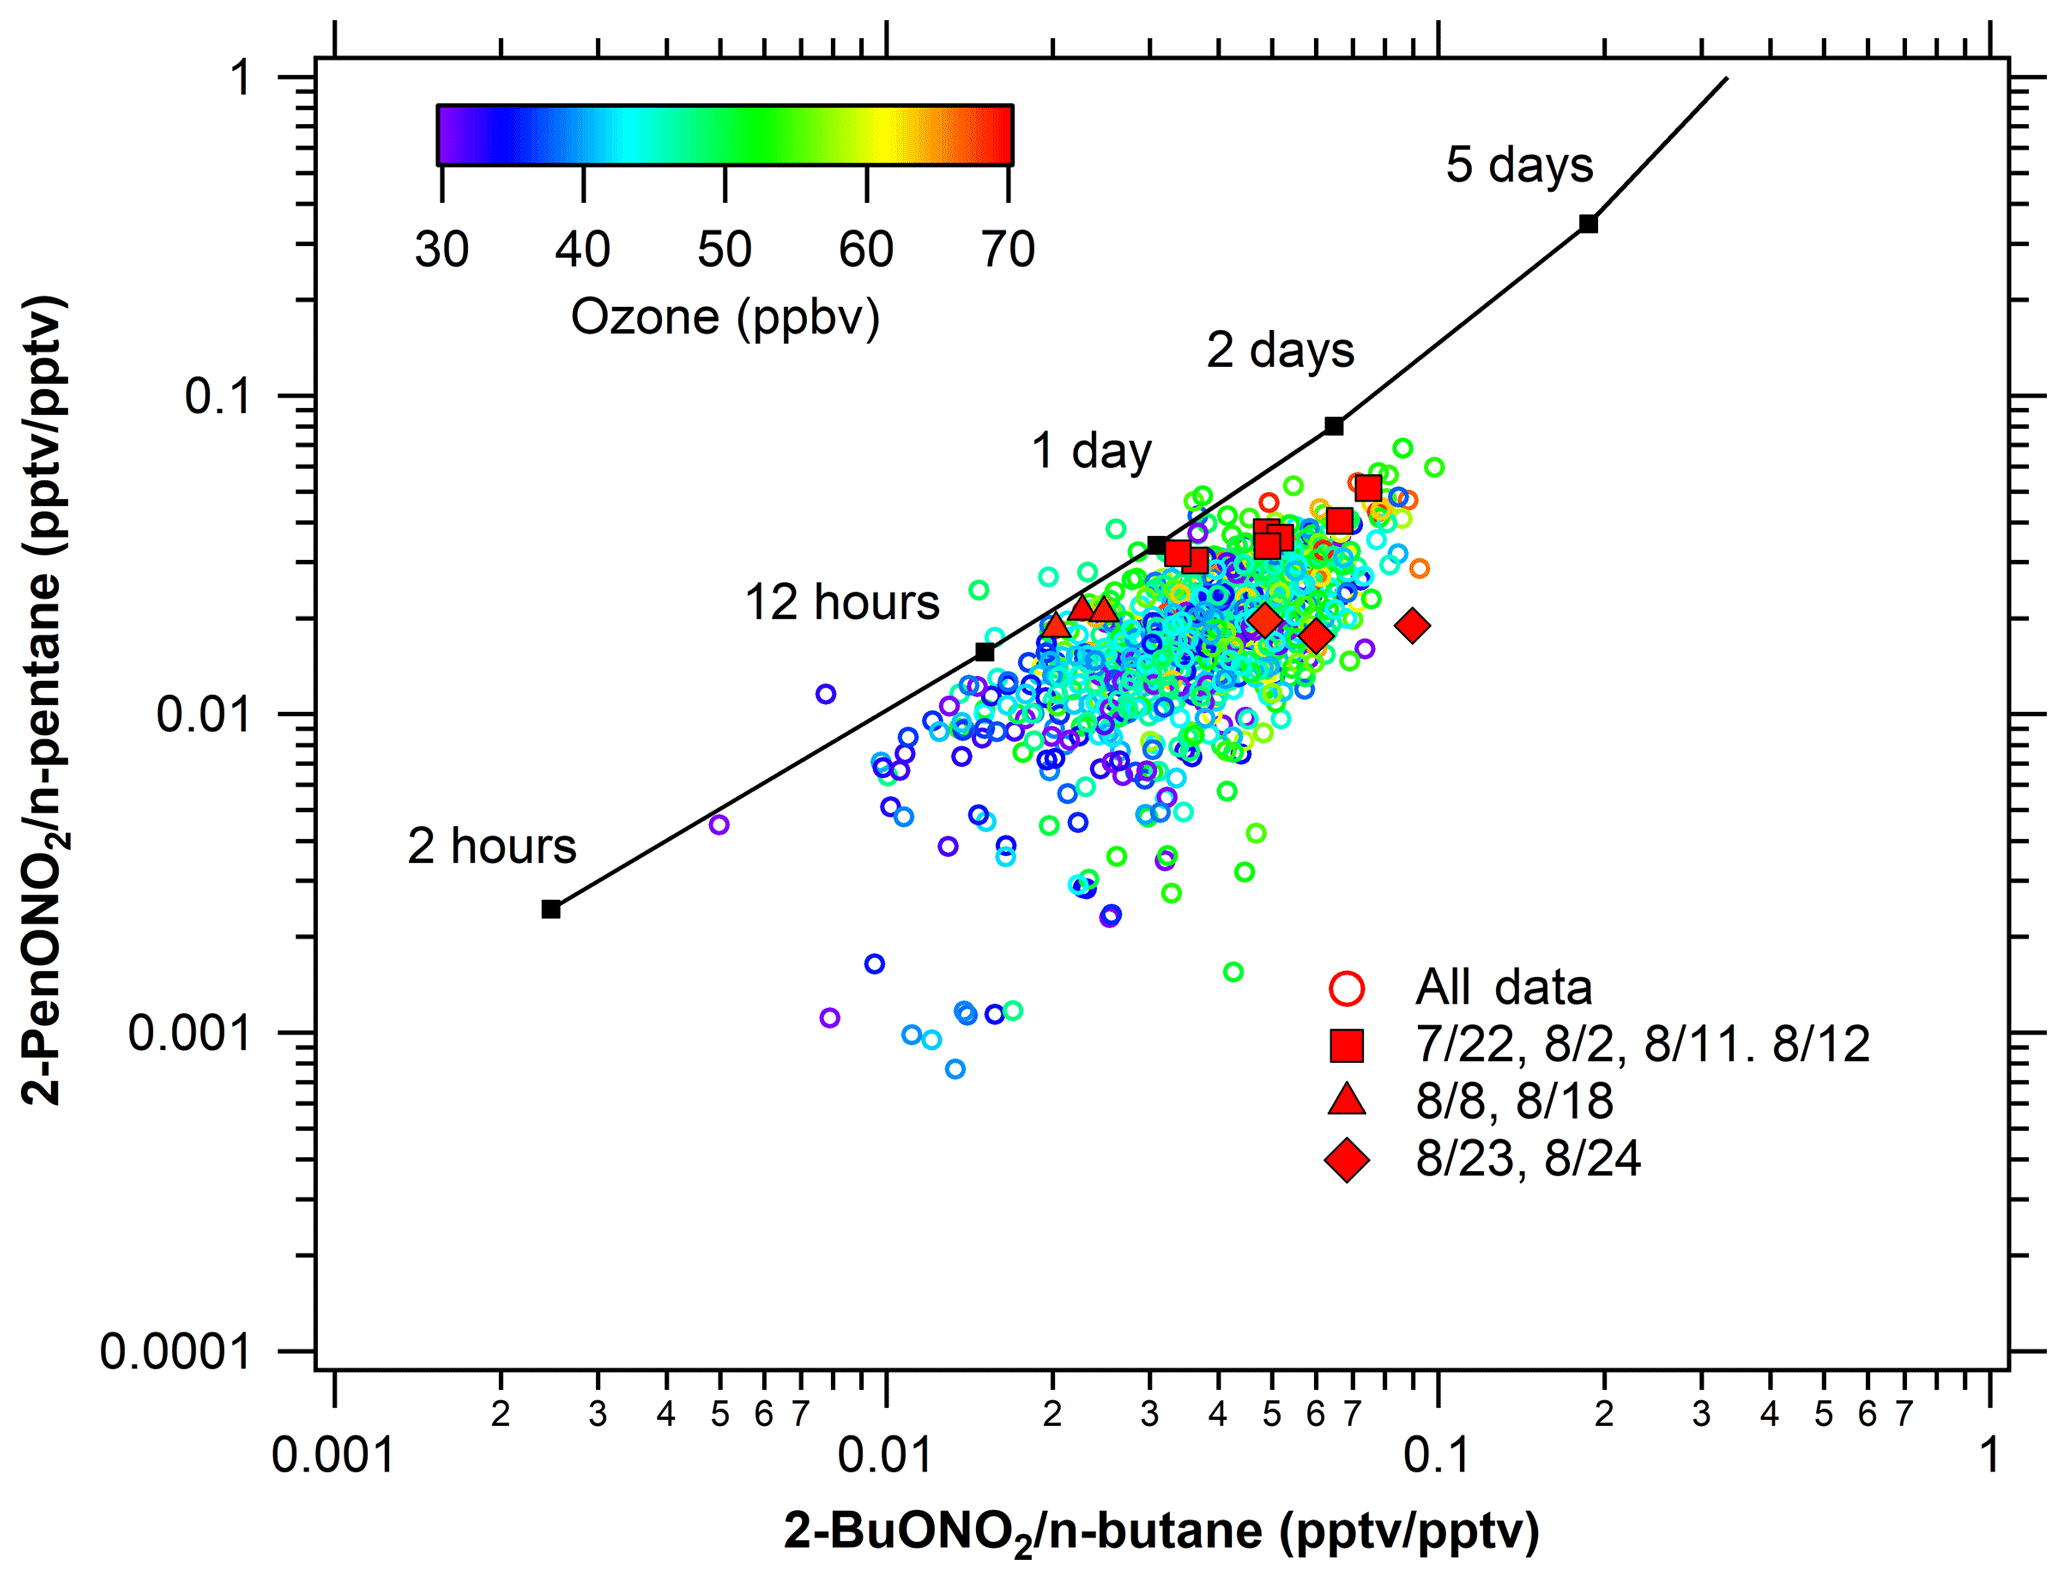
Figure 13Photochemical age of alkyl nitrates. Comparison of observed alkyl nitrate: parent hydrocarbon ratios to predicted values provide an estimate of photochemical age.
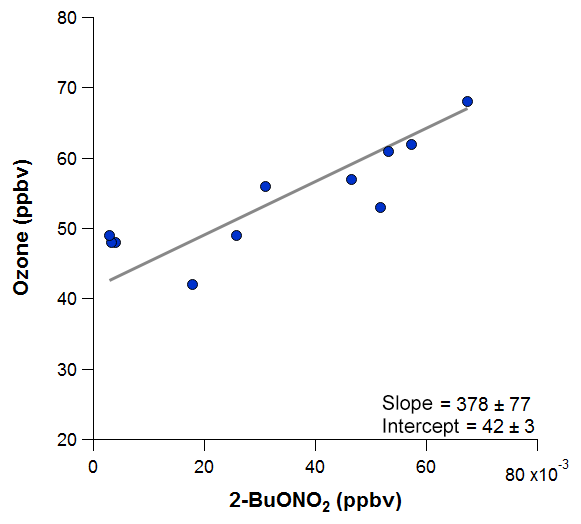
Figure 14The orthogonal distance linear relationship of O3 with 2-butyl nitrate during the 18 August event, when the park was clearly influenced by an air mass containing oil and gas emissions. This relationship is used in estimating the excess O3 produced due to oil and gas emissions.
As shown in Table 3, each of the individual alkyl nitrates gives a slightly different background O3 value (y-intercept); however, they are all within a few ppbv of each other, providing a reasonable estimate of the background O3 during that time period. The values reported for this work are also in the range of values reported by McDuffie et al. (2016) for BAO during summer 2014. The estimated average attributed O3 production values determined for each event are 22±3 ppbv and 19±2 ppbv for the 8 and 18 August events at ROMO-LP, respectively, and the average background O3 was 43±2 ppbv. These values represent an upper limit on the excess O3 produced from NFRMA air masses transported to ROMO that were dominated by oil and gas emissions. Other compounds produced photochemically in situ (e.g., PAN and acetone) provide similar values to the alkyl nitrates for the attributed O3 (not shown). The alkyl nitrate correlation method does not allow us to explicitly separate the impact of NOx, additional OVOCs, or other species such as alkenes (Fig. 11), which all likely contribute to ozone production. These results are consistent with measurements along the NFRMA during FRAPPÉ by Cheadle et al. (2017), who showed that on individual days emissions from oil and gas operations can contribute upwards of 30 ppbv to excess O3 production. The high-concentration air masses measured in the Front Range contain a similar mix of compounds as the air masses transported to ROMO during upslope events. Accounting for mixing and dilution, enhancements in O3 resulting from oil and gas and NFRMA emissions are expected to be lower at ROMO. Worth noting is the consistency of these O3 enhancements for the two events at ROMO and the marked similarity of the air mass compositions measured in the park (Fig. 12). Figure 12 shows O3, ethane, and alkyl nitrate mixing ratios during the events, along with meteorology data. For the 8 August upslope event, the winds were variable and out of the SSE and it was sunnier (solar radiation ∼200–300 W m−2 higher) than 18 August, but ∼3 ∘C cooler (not shown). The 18 August upslope event had winds from the east and a sharp drop in solar radiation just prior to the upslope event. Nonetheless, the alkyl nitrates, light alkanes, PAN, and O3 mixing ratios were strikingly comparable during these two events (Fig. 12) as were the overall air mass reactivity (Fig. 11) and photochemical age (Fig. 13), indicating comparable source region emissions. When considering the entire study period, and not just these specific events, the NFRMA and oil and gas contribution to O3 at ROMO is much smaller than during these episodes, given that upslope (southeasterly) flow is not the predominant wind direction (McDuffie et al., 2016).
Intermediate i- to n-pentane ratios (1.16–1.44) were observed for measurements on 22 July, 11 August, and 12 August, suggesting that multiple Front Range sources impacted ROMO during these O3 events. In addition to urban sources, biomass burning emissions influenced the Front Range on 11–12 August (Dingle et al., 2016). The highest O3 levels across the Front Range during FRAPPÉ were observed on 22 July (Pfister et al., 2017; Sullivan et al., 2016), which also had the highest average afternoon (12:00–20:00) concentrations of total alkanes (9700 pptv), alkenes (277 pptv), biogenics (252 pptv), alkyl nitrates (110 pptv), and OVOCs (9.8 ppbv; methanol, acetaldehyde, MVK+MACR, MEK, and acetic acid) at ROMO among all of the high-O3 days. Throughout the region, clear skies and a lower and slow growing planetary boundary layer, coupled with reduced ventilation, resulted in less dilution and increased precursor concentrations, contributing to the elevated O3 (Pfister et al., 2017). These elevated mixing ratios were likely then transported to ROMO by thermally driven upslope flow observed along the Front Range (Sullivan et al., 2016).
The O3 events observed on 23 August (ROMO-LP) and 24 August (ROMO-TR) have neither an oil and gas nor an urban signature. PAN also remained <300 pptv during both days. Here we focus on the event on 23 August at ROMO-LP, where VOC measurements were collocated. On 23 August, air masses came from the west without passing over the NFRMA and had much lower abundances of O3 precursors and photochemical products (Fig. 3), suggesting that the high O3 mixing ratios were not generated from regional photochemical production. These high O3 mixing ratios are associated with the red region in western Colorado in Fig. 10. Mixing ratios of alkanes (total 1505 pptv), alkenes (total 93 pptv), aromatics (42 pptv), alkyl nitrates (total 17 ppt), halocarbons (4 pptv; C2Cl4, CH3I, CH2Br2, CHBrCl2, CHBr3), and OVOCs (2.8 ppbv; methanol, acetaldehyde, MVK+MACR, MEK, and acetic acid) were all low compared to the other high-O3 periods and most of the study. For this same time period the average NOx mixing ratio (0.52 ppbv) was lower than those during other high-O3 periods (1.2–3.1 ppbv; no data for 11 August). Additionally, a comparison of soundings from Denver (http://weather.uwyo.edu/upperair/sounding.html, last access: 10 May 2018) shows a pocket of dry air from 500 to 100 hPa which does not occur on any of the other high-O3 days (Fig. 15a), and water vapor decreases during the event on 23 August (Fig. 15b). This is the only high-O3 event for which O3 and water vapor exhibit a robust anti-correlation (R2=0.627, p<0.0001) during the study. The low coincident mixing ratios of NOx and VOCs, the dry air aloft, and the robust anti-correlation of O3 and water vapor at the surface during the O3 event suggest an intrusion of stratospheric or upper-tropospheric air on 23 August. A stratospheric–tropospheric exchange event also was observed in Fort Collins in early August during FRAPPÉ (Sullivan et al., 2016).
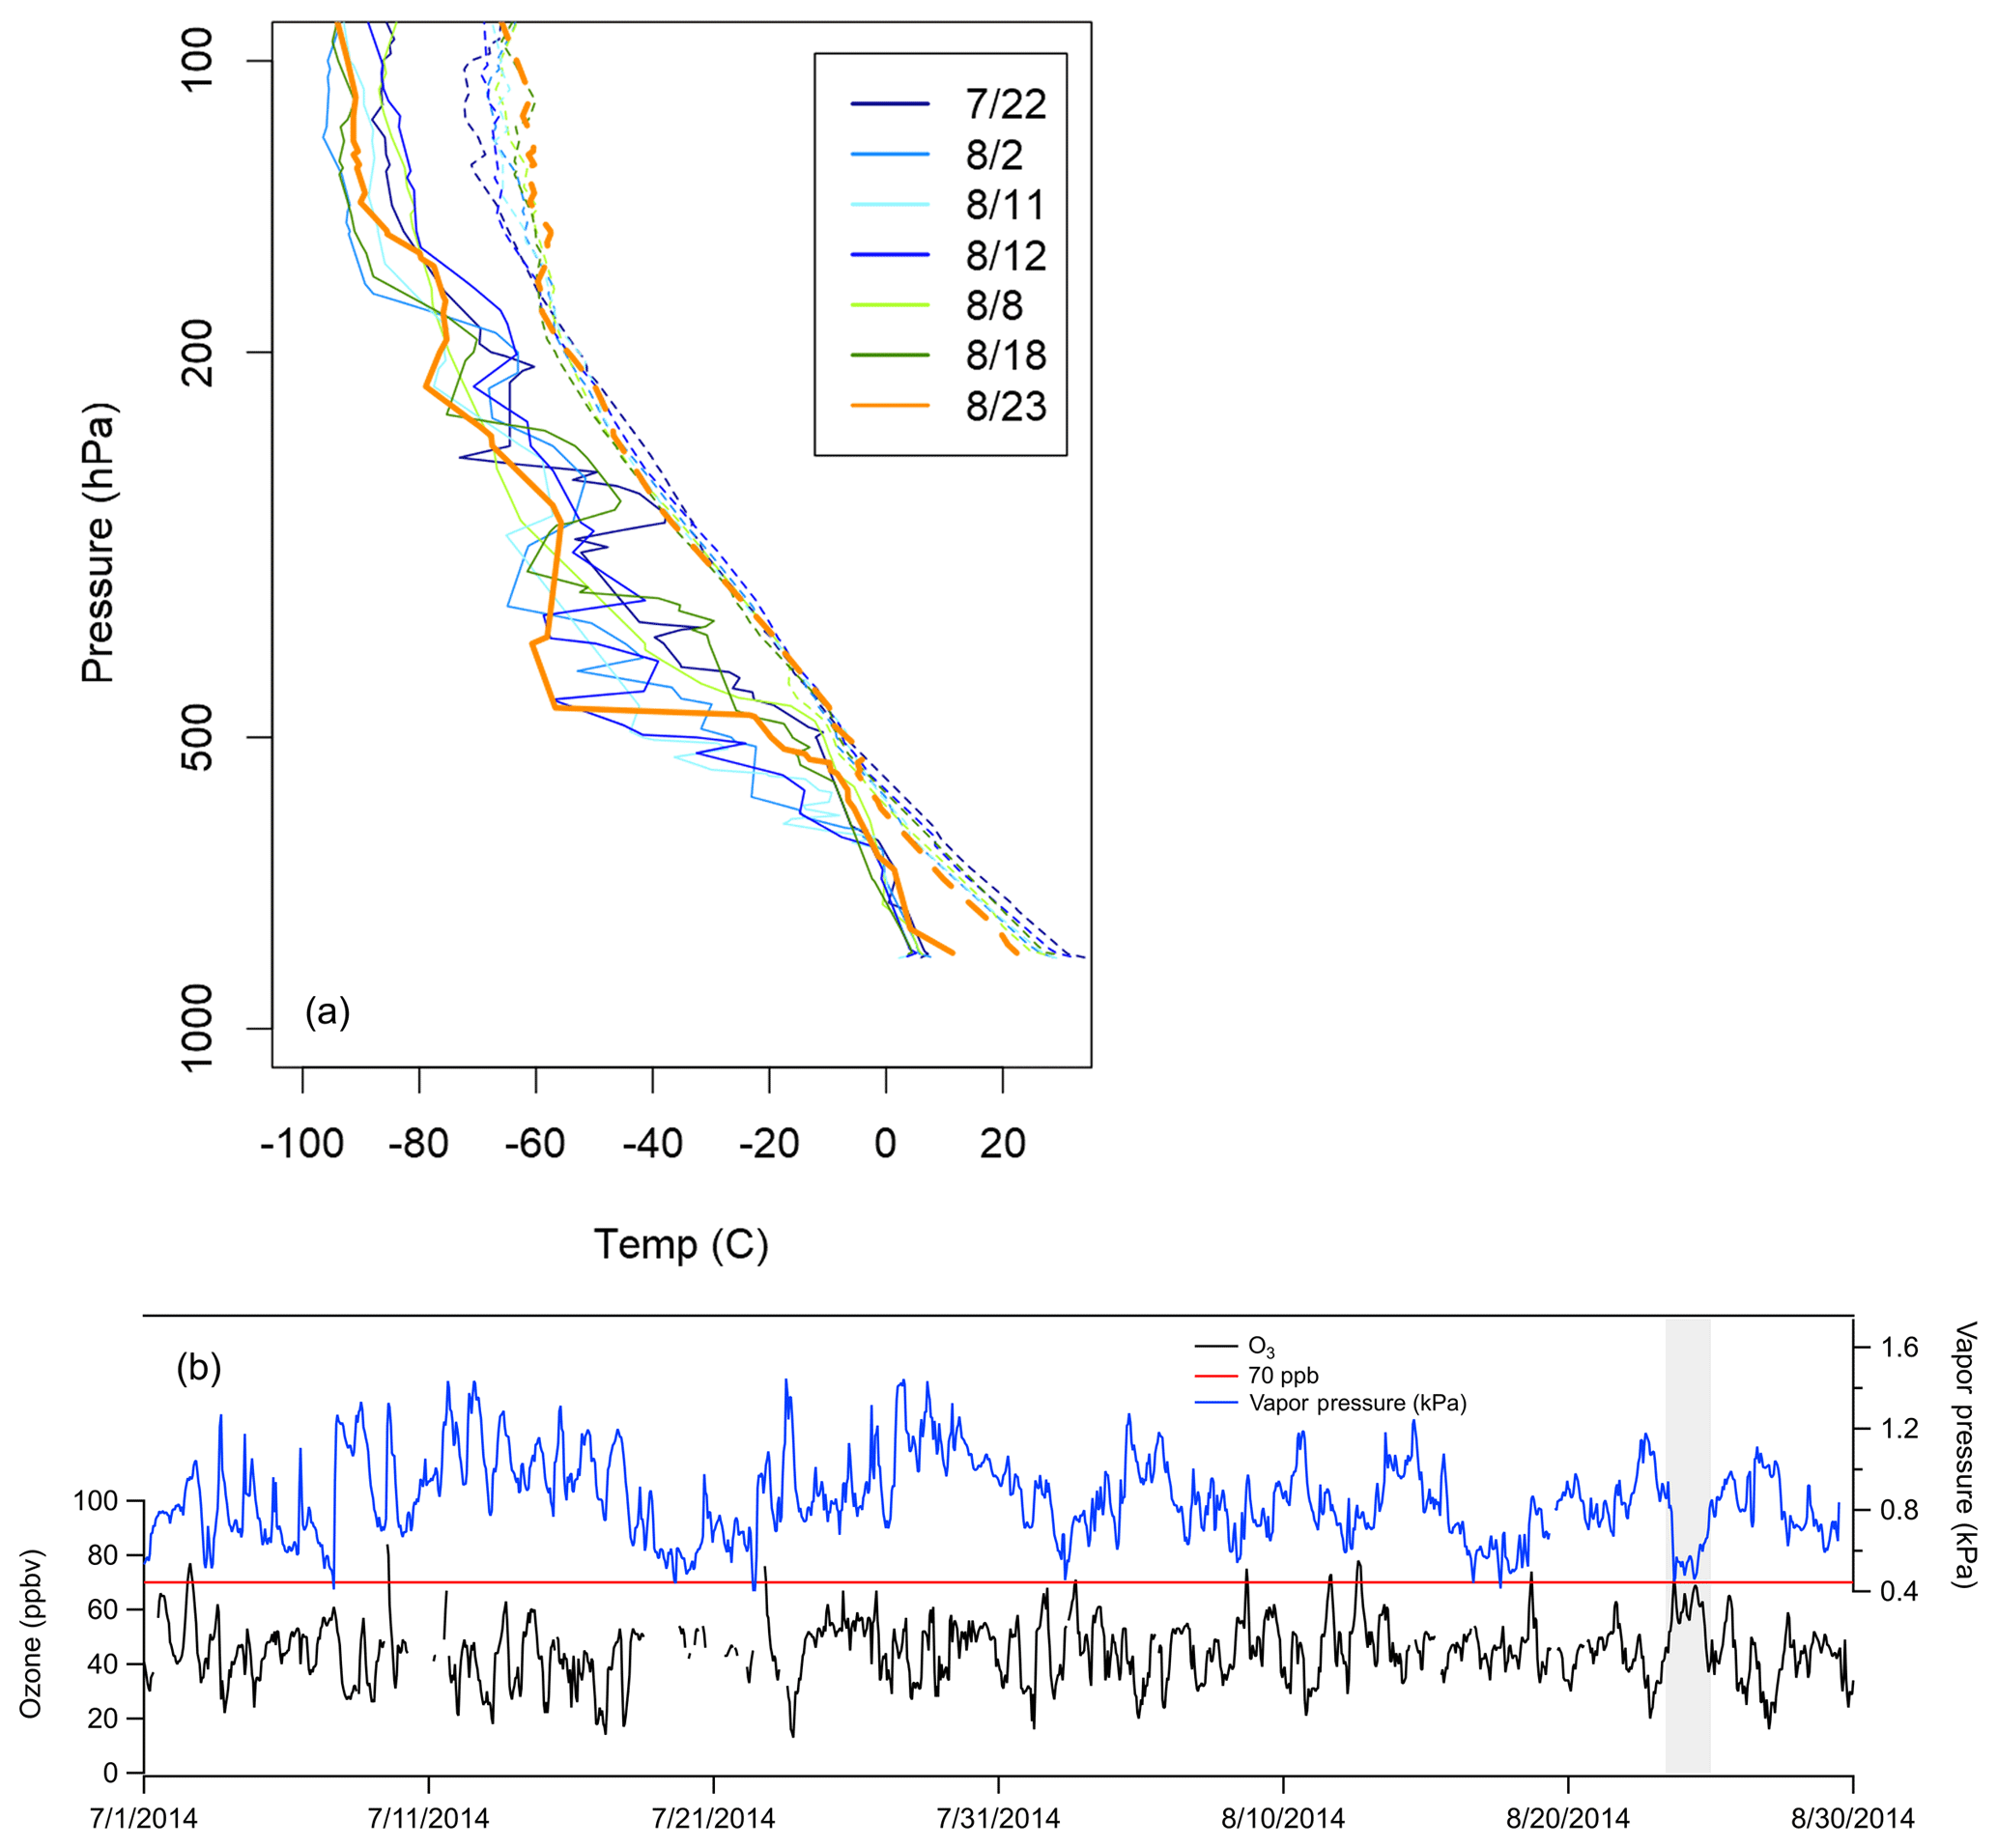
Figure 15(a) Denver soundings (available at http://weather.uwyo.edu/upperair/sounding.html, last access: 10 May 2018) from high-O3 days, showing surface temperature (dashed lines) and dew point (solid lines). (b) Measured O3 concentration and water vapor at ROMO-LP during the study period. The event from 23 August is highlighted with grey shading.
4.3 Hydroxyl radical (OH) reactivity and photochemical age
Photolysis of NO2 is the only way to produce O3 in the troposphere. Oxidation of VOCs by hydroxyl radicals (OH) in the atmosphere is typically the first step in the formation of peroxy radicals (RO2) which react with NO to produce NO2. Calculating the kinetic OH reactivity (OHR) helps to identify compounds that are likely to quickly form RO2 and ultimately contribute to O3 production. The OHR for VOCs is calculated using the following expression:
where [VOC]i is the concentration of each VOC and is the reaction rate constant for each VOC with OH. The VOC-OHR is calculated for the high-O3 events during FRAPPÉ which had an oil and gas influence, a combined oil and gas and urban influence, the stratospheric and/or upper-troposphere intrusion event, and for background conditions (without regard to the O3 mixing ratio and defined as lowest 10th percentile for ethane). This metric is an imperfect measure of O3 production potential since it does not account for chain termination or propagation steps, nor does it properly capture differences in VOC production of peroxy radicals during photolysis or reaction with other oxidants. However, VOC-OHR is a useful tool because it is a measure of the initial rate of peroxy radical formation that can be interpreted as the potential for a specific compound to ultimately produce O3.
Table 4Percentage contributions of the light alkanes to the alkane OHR during the oil- and gas-influenced events at ROMO during FRAPPÉ (total alkane OHR = 0.62 s−1) and from measurements at the BAO and PAO.
1 Swarthout et al. (2013), 2 McDuffie et al. (2016), 3 Abeleria et al. (2017), 4 Halliday et al. (2016).
For the events influenced by oil and gas emissions, the alkanes and OVOCs were the major contributors to the VOC-OHR, comprising almost 40 % and 39 %, respectively, of the calculated total (Fig. 11). For the high-O3 air masses that also included an urban influence, the OHR for OVOCs dominated (40 %), followed by alkanes (∼20 %) and alkenes (∼17 %) which were more comparable, reflecting increased reactivity contributions of the light alkenes from urban areas. However, the alkanes were still the largest non-OVOC contributor of VOC-OHR to this category. The importance of isoprene, with ∼21 % of the total reactivity, is also more apparent, even though the average mixing ratio was only 64 pptv for these days. Larger mixing ratios of isoprene (∼270 pptv) during background periods results in the calculated VOC-OHR being dominated (∼74 %) by isoprene reactivity and of similar magnitude as the more polluted oil and gas days. In all cases, ethyne and the aromatics were only minor contributors to the calculated overall OHR. Finally, it is worth noting that the OHR values calculated here are lower bounds on the actual VOC-OHR in the studied air masses. The OHR values only represent the initial attack of OH with the VOC and does not reflect the subsequent contributions of the oxidation products formed and how these influence and change the overall air mass and its reactivity.
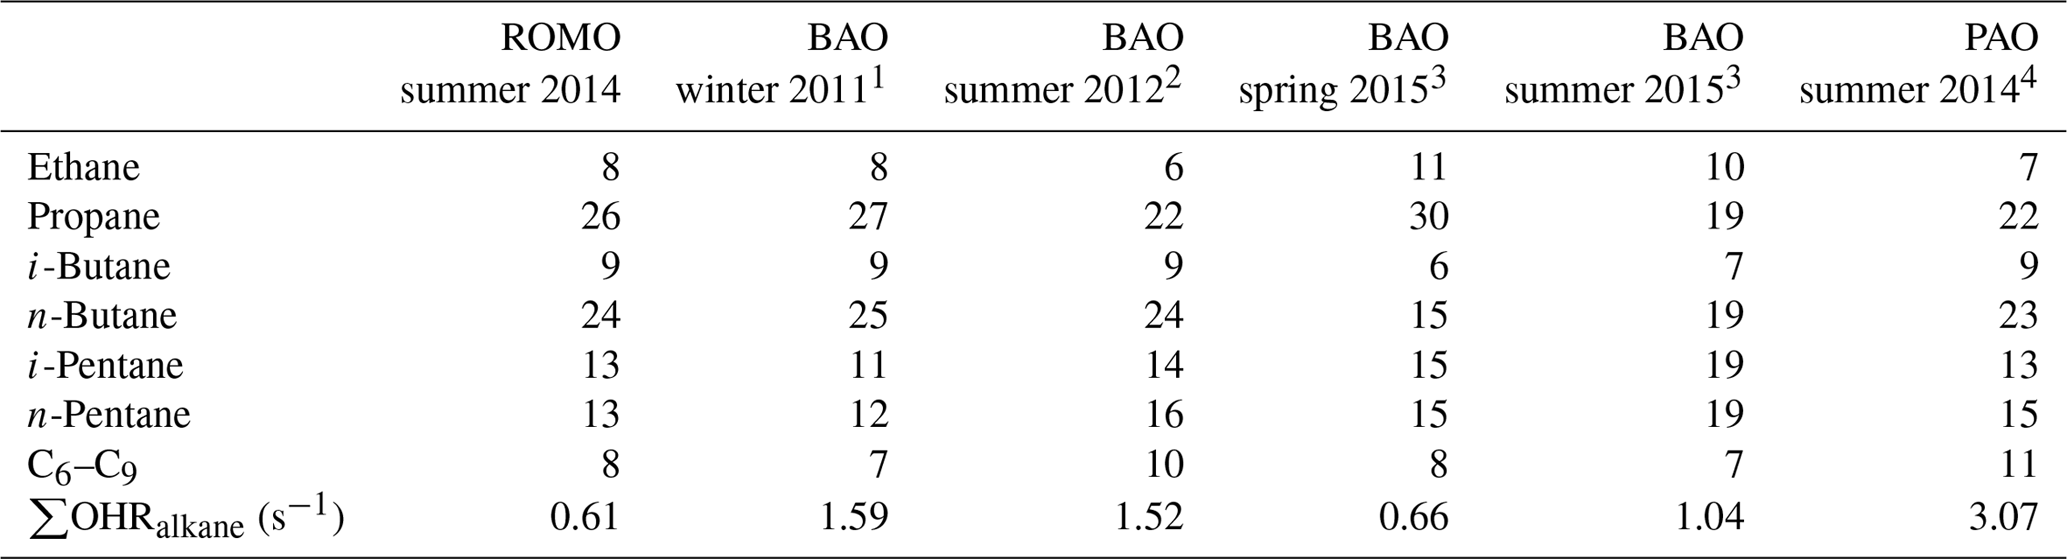
To estimate the impact of the oil and gas emissions on OHR at the park, we compare the average straight-chain-alkane OHR during the upslope events to that of the background and combined oil- and gas-influenced and urban-influenced alkane OHRs, which include the C2–C8 alkanes. The reactivity attributed to the alkanes is considered because they are the dominant VOCs associated with the oil and gas emissions. The alkane OHR for the oil and gas events was 0.62 s−1, which comprised ∼40 % of the total calculated OHR (includes all measured compounds) for those events. In comparison to the oil- and gas-influenced events, the alkane OHR for the urban-influenced events was only 0.21 s−1, while the background alkane OHR was only 0.02 s−1, and comprised much smaller fractions of the total calculated OHR for those periods. The difference in alkane reactivity between the oil and gas events and the urban-influenced events was 0.41 s−1; the difference between oil- and gas-influenced and background events was 0.60 s−1. Furthermore, the percent contribution of the individual straight chain C2–C8 alkanes to the total alkane OHR is similar to that of other measurements made in the regions across seasons (Abeleira et al., 2017; Halliday et al., 2016; McDuffie et al., 2016; Swarthout et al., 2013), underscoring the consistent temporal and spatial compositional influence of the oil and gas source signature impacting ROMO during upslope events (Table 4).
Air mass photochemical age can be calculated using the alkyl nitrate to parent hydrocarbon ratio (R–ONO2∕R–H) (e.g., Bertman et al., 1995; Russo et al., 2010b; Simpson et al., 2003; Swarthout et al., 2013). This reaction scheme assumes only OH-initiated photochemical production of a given alkyl nitrate from its parent hydrocarbon, and so deviations from the model suggest additional sources or chemistry not captured in this simple scheme. Details of the chemical mechanisms and calculations can be found in the supplement. The modeled ratios of 3-pentyl nitrate to n-pentane versus 2-butyl nitrate to n-butane are calculated using [OH] = 106 molecules cm−3 and are shown as the solid line in Fig. 13. Measured ratios of these species are shown as the symbols and are colored by O3 mixing ratio. Based on this model, VOC ages in sampled air masses ranged from several hours to 2 days and, as generally observed with the pentyl nitrates, they typically lie below the model prediction line with a relatively small offset. Focusing on the high-O3 periods, shown as red filled symbols, the oil- and gas-influenced events on 8 and 18 August show the best agreement with the model, with a photochemical age of less than 1 day, indicating local sources of the parent hydrocarbons and that photochemical production was driving the O3 and alkyl nitrate production these days. On 22 July, 11 August, and 12 August, when both urban and oil and gas impacts were observed, the measured ratios deviate from the model in a systematic way, suggesting that the air masses were influenced by multiple chemical processes. Finally, on 23 and 24 August, the alkyl nitrate to parent alkane ratios deviated from the photochemical line significantly, providing another line of evidence that the increase in O3 was not from photochemical production in a polluted environment, consistent with influences of O3-enriched air from the upper troposphere.
Rocky Mountain National Park is a Class I area that is afforded the highest level of air quality protection. Nevertheless, O3 mixing ratios can reach levels that negatively impact vegetation and human health, particularly for older adults and people who are active outdoors. In this study, O3 and a suite of VOC measurements were made at ROMO as part of the 2014 FRAPPÉ field campaign. Although average and peak O3 mixing ratios were lower during FRAPPÉ compared to other recent summer seasons, 1 h mixing ratios exceeding 70 ppbv were routinely measured in the park during this period. This study was aimed at better understanding sources of VOCs that impact the park and, particularly, what drives these high ozone events.
ROMO is located just west of the NFRMA in Colorado, and the park can be impacted by a variety of emissions sources. Significant variability in the measured VOC abundances suggests that the sampling site was impacted by emissions from biogenic, urban, combustion, agricultural, and oil and gas sources during the study period. Light alkanes measured at ROMO, markers for oil and gas production, were significantly elevated relative to background levels and at times reached mixing ratios measured in some oil and gas source regions during upslope events (e.g., Swarthout et al., 2015). Mixing ratios reached 9800 ppt for ethane, 1158 ppt for i-butane, 2378 ppt for n-butane, 2095 ppt for i-pentane, and 1712 ppt for n-pentane.
Using VOCs as source markers, we determined that the elevated O3 periods were primarily associated with upslope events. For the days with a greater oil and gas impact, Front Range emissions contributed an upper bound of 20 ppbv excess O3, having a major impact on total O3 mixing ratios on those days. In air masses with increased urban influence, alkenes played a more important role; however, even for these urban-influenced air masses, a clear oil and gas signature was also present. During background periods, when air masses arrived from the west, O3 was typically low and VOC–OH reactivity was dominated by isoprene (74 %). Total VOC-OHR was of similar magnitude on the background (0.99 s−1) and oil- and gas-influenced (1.26 s−1) days but alkanes dominated total VOC-OHR (40 %) on oil and gas days. The mixed urban- and oil- and gas-influenced days were characterized by slightly lower total VOC-OHR (0.825 s−1) and OH reactivity was dominated by OVOCs (40 %), alkanes (20 %), and alkenes (17 %). In one distinct case, elevated O3 was associated with air mass transport from the west. For this case, the abundances of VOCs and other secondary species were very low (total VOC-OHR = 0.16 s−1), and there was a clear anti-correlation of O3 and surface water vapor, suggesting that an intrusion of stratospheric or O3-rich upper-tropospheric air contributed to elevated O3 measured at the surface.
Elevated O3 in the Front Range and ROMO has been a persistent air quality issue. Findings from this study reaffirm that ROMO is impacted by a variety of anthropogenic emissions sources in the NFRMA. State and federal agencies have implemented regulations that have successfully reduced emissions from traditional sources (mobile, power plant, and other activities), gradually reducing O3 since 2009 at a rate of ppbv yr−1 in ROMO (McGlynn et al., 2018). Continued population growth and the competing effects of increasing emissions from oil and gas extraction appear to be diminishing the impact of the regulations as emissions from emerging sectors or increased population are contributing to the high-O3 episodes. Management practices aimed at reducing high O3 levels at the park thus cannot focus on controlling a single source, but instead must take a broader approach to focus on reductions in the traditional sources as well as these new sources. Recent work by Zhou et al. (2019) suggests that emission reductions of both volatile organic compounds and nitrogen oxides (NOx) could lead to effective O3 mitigation in the Intermountain West. Additionally, identifying periods of stratospheric O3 influence should also be a priority when assessing which high-O3 episodes can be mitigated through emissions control.
The data used in this analysis are available in the FRAPPÉ/DISCOVER-AQ data archive (https://www-air.larc.nasa.gov/cgi-bin/ArcView/discover-aq.co-2014, last access: 8 January 2019) in the Ground-Other category under the PIs Collett, Fischer, and Sive.
The supplement related to this article is available online at: https://doi.org/10.5194/acp-19-499-2019-supplement.
KBB led the writing and analysis for the manuscript with significant contributions from YoZ, AJP, and BCS and comments from all authors. JLCJ, BAS, AJP, and BCS designed the field study. KBB, YoZ, AJP, BCS, EVF, AEC, APS, and SC collected data in the field. KAG performed the back-trajectory modeling and residence time analysis. HM and YiZ provided input on the VOC photochemistry.
The authors declare that they have no conflict of interest.
Support for this work was provided by the National Park Service. The
assumptions, findings, conclusions, judgments, and views presented herein are
those of the authors and should not be interpreted as necessarily
representing the National Park Service. We recognize the contributions of the
FRAPPÉ/Discover-AQ PIs (Gabriele Pfister, NCAR; Frank Flocke, NCAR; Jim
Crawford, NASA) and the other FRAPPÉ/Discover-AQ funding sources (NSF,
NCAR, Colorado Department of Public Health and Environment, NASA) for their
support and contributions in organizing and directing the experiment,
including the flight and measurement planning, field operations, and
maintenance of the data archive.
Edited by:
Eleanor Browne
Reviewed by: two anonymous referees
Abeleira, A., Pollack, I. B., Sive, B., Zhou, Y., Fischer, E. V., and Farmer, D. K.: Source characterization of volatile organic compounds in the Colorado Northern Front Range Metropolitan Area during spring and summer 2015, J. Geophys. Res.-Atmos., 122, 3595–3613, https://doi.org/10.1002/2016JD026227, 2017.
Abeleira, A., Sive, B., Swarthout, R. F., Fischer, E. V., Zhou, Y., and Farmer, D. K.: Seasonality, sources and sinks of C1–C5 alkyl nitrates in the Colorado Front Range, Elem. Sci. Anth., 6, 45–63, https://doi.org/10.1525/elementa.299, 2018.
Ashbaugh, L. L., Malm, W. C., and Sadeh, W. Z.: A residence time probability analysis of sulfur concentrations at Grand Canyon National Park, Atmos. Environ., 19, 1263–1270, https://doi.org/10.1016/0004-6981(85)90256-2, 1985.
ASTM Standard D1835-16: Standard Specification for Liquefied Petroleum (LP) Gases, ASTM International, West Conshohocken, PA, available at: http://www.astm.org (last access: 17 July 2018), 2016.
Atkinson, R.: Kinetics and mechanisms of the gas-phase reactions of the hydroxyl radical with organic compounds under atmospheric conditions, Chem. Rev., 86, 69–201, https://doi.org/10.1021/cr00071a004, 1986.
Atkinson, R. and Arey, J.: Atmospheric Degradation of Volatile Organic Compounds, Chem. Rev., 103, 4605–4638, https://doi.org/10.1021/cr0206420, 2003.
Atkinson, R., Aschmann, S. M., Carter, W. P. L., Winer, A. M., and Pitts, J. N.: Alkyl nitrate formation from the nitrogen oxide (NOx)-air photooxidations of C2−C8 n-alkanes, J. Phys. Chem., 86, 4563–4569, https://doi.org/10.1021/j100220a022, 1982.
Baker, A. K., Beyersdorf, A. J., Doezema, L. A., Katzenstein, A., Meinardi, S., Simpson, I. J., Blake, D. R., and Sherwood Rowland, F.: Measurements of nonmethane hydrocarbons in 28 United States cities, Atmos. Environ., 42, 170–182, https://doi.org/10.1016/j.atmosenv.2007.09.007, 2008.
Beem, K. B., Raja, S., Schwandner, F. M., Taylor, C., Lee, T., Sullivan, A. P., Carrico, C. M., McMeeking, G. R., Day, D., Levin, E., Hand, J., Kreidenweis, S. M., Schichtel, B., Malm, W. C., and Collett, J. L.: Deposition of reactive nitrogen during the Rocky Mountain Airborne Nitrogen and Sulfur (RoMANS) study, Environ. Pollut., 158, 862–872, https://doi.org/10.1016/j.envpol.2009.09.023, 2010.
Benedict, K. B., Day, D., Schwandner, F. M., Kreidenweis, S. M., Schichtel, B., Malm, W. C., and Collett, J. L.: Observations of atmospheric reactive nitrogen species in Rocky Mountain National Park and across northern Colorado, Atmos. Environ., 64, 66–76, https://doi.org/10.1016/j.atmosenv.2012.08.066, 2013.
Benedict, K. B., Prenni, A. J., Sullivan, A. P., Evanoski-Cole, A. R., Fischer, E. V., Callahan, S., Sive, B. C., Zhou, Y., Schichtel, B. A., and Collett Jr., J. L.: Impact of Front Range sources on reactive nitrogen concentrations and deposition in Rocky Mountain National Park, PeerJ, 6, e4759, https://doi.org/10.7717/peerj.4759, 2018.
Bertman, S. B., Roberts, J. M., Parrish, D. D., Buhr, M. P., Goldan, P. D., Kuster, W. C., Fehsenfeld, F. C., Montzka, S. A., and Westberg, H.: Evolution of alkyl nitrates with air mass age, J. Geophys. Res.-Atmos., 100, 22805–22813, https://doi.org/10.1029/95JD02030, 1995.
Blake, D. R., Blake, N. J., Smith, T. W., Wingenter, O. W., and Rowland, F. S.: Nonmethane hydrocarbon and halocarbon distributions during Atlantic Stratocumulus Transition Experiment/Marine Aerosol and Gas Exchange, June 1992, J. Geophys. Res.-Atmos., 101, 4501–4514, https://doi.org/10.1029/95JD01370, 1996.
Bossert, J. E. and Cotton, W. R.: Regional-Scale Flows in Mountainous Terrain. Part I: A Numerical and Observational Comparison, Mon. Weather Rev., 122, 1449–1471, https://doi.org/10.1175/1520-0493(1994)122<1449:RSFIMT>2.0.CO;2, 1994.
Cheadle, L. C., Oltmans, S. J., Petron, G., Schnell, R. C., Mattson, E. J., Herndon, S. C., Thompson, A. M., Blake, D. R., and McClure-Begley, A.: Surface ozone in the Colorado northern Front Range and the influence of oil and gas development during FRAPPE/DISCOVER-AQ in summer 2014, Elem. Sci. Anth., 5, 61–83, https://doi.org/10.1525/elementa.254, 2017.
Christensen, J. N., Weiss-Penzias, P., Fine, R., McDade, C. E., Trzepla, K., Brown, S. T., and Gustin, M. S.: Unraveling the sources of ground level ozone in the Intermountain Western United States using Pb isotopes, Sci. Total Environ., 530–531, 519–525, https://doi.org/10.1016/j.scitotenv.2015.04.054, 2015.
Clemitshaw, K. C., Williams, J., Rattigan, O. V., Shallcross, D. E., Law, K. S., and Anthony Cox, R.: Gas-phase ultraviolet absorption cross-sections and atmospheric lifetimes of several C2-C5 alkyl nitrates, J. Photoch. Photobio. A, 102, 117–126, https://doi.org/10.1016/S1010-6030(96)04458-9, 1997.
COGCC: Greater Wattenberg Area Baseline Study, Technical Report, Colorado Oil and Gas Conservation Commission, 2007.
COGCC: Well Surface Location Data, CO Oil and Gas Conservation Commission, available at: http://cogcc.state.co.us/data2.html\#/downloads, last access: 24 January 2018.
Day, D. A., Dillon, M. B., Wooldridge, P. J., Thornton, J. A., Rosen, R. S., Wood, E. C., and Cohen, R. C.: On alkyl nitrates, O3, and the “missing NOy”, J. Geophys. Res.-Atmos., 108, 4501, https://doi.org/10.1029/2003JD003685, 2003.
Dingle, J. H., Vu, K., Bahreini, R., Apel, E. C., Campos, T. L., Flocke, F., Fried, A., Herndon, S., Hills, A. J., Hornbrook, R. S., Huey, G., Kaser, L., Montzka, D. D., Nowak, J. B., Reeves, M., Richter, D., Roscioli, J. R., Shertz, S., Stell, M., Tanner, D., Tyndall, G., Walega, J., Weibring, P., and Weinheimer, A.: Aerosol optical extinction during the Front Range Air Pollution and Photochemistry Éxperiment (FRAPPÉ) 2014 summertime field campaign, Colorado, USA, Atmos. Chem. Phys., 16, 11207–11217, https://doi.org/10.5194/acp-16-11207-2016, 2016.
Flocke, F., Volz-Thomas, A., and Kley, D.: Measurements of alkyl nitrates in rural and polluted air masses, Atmos. Environ. A-Gen., 25, 1951–1960, https://doi.org/10.1016/0960-1686(91)90276-D, 1991.
Gebhart, K. A., Schichtel, B. A., Malm, W. C., Barna, M. G., Rodriguez, M. A., and Collett, J. L.: Back-trajectory-based source apportionment of airborne sulfur and nitrogen concentrations at Rocky Mountain National Park, Colorado, USA, Atmos. Environ., 45, 621–633, https://doi.org/10.1016/j.atmosenv.2010.10.035, 2011.
Gebhart, K. A., Malm, W. C., Rodriguez, M. A., Barna, M. G., Schichtel, B. A., Benedict, K. B., Collett, J. L., and Carrico, C. M.: Meteorological and Back Trajectory Modeling for the Rocky Mountain Atmospheric Nitrogen and Sulfur Study II, Adv. Meteorol., 2014, 1–19, https://doi.org/10.1155/2014/414015, 2014.
Gilman, J. B., Lerner, B. M., Kuster, W. C., and de Gouw, J. A.: Source Signature of Volatile Organic Compounds from Oil and Natural Gas Operations in Northeastern Colorado, Environ. Sci. Technol., 47, 1297–1305, https://doi.org/10.1021/es304119a, 2013.
Halliday, H. S., Thompson, A. M., Wisthaler, A., Blake, D. R., Hornbrook, R. S., Mikoviny, T., Müller, M., Eichler, P., Apel, E. C., and Hills, A. J.: Atmospheric benzene observations from oil and gas production in the Denver-Julesburg Basin in July and August 2014, J. Geophys. Res.-Atmos., 121, 2016JD025327, https://doi.org/10.1002/2016JD025327, 2016.
Harley, R. A., Hannigan, M. P., and Cass, G. R.: Respeciation of organic gas emissions and the detection of excess unburned gasoline in the atmosphere, Environ. Sci. Technol., 26, 2395–2408, https://doi.org/10.1021/es00036a010, 1992.
Janjic, Z. I.: A nonhydrostatic model based on a new approach, Meteorol. Atmos. Phys., 82, 271–285, https://doi.org/10.1007/s00703-001-0587-6, 2003.
Jobson, B. T., Wu, Z., Niki, H., and Barrie, L. A.: Seasonal trends of isoprene, C2–C5 alkanes, and acetylene at a remote boreal site in Canada, J. Geophys. Res.-Atmos., 99, 1589–1599, https://doi.org/10.1029/93JD00424, 1994.
Kohut, R., Flanagan, C., Cheatham, J., and Porter, E.: Foliar Ozone Injury on Cutleaf Coneflower at Rocky Mountain National Park, Colorado, West. N. Am. Naturalist, 72, 32–42, https://doi.org/10.3398/064.072.0104, 2012.
Koppmann, R. (Ed.): Volatile Organic Compounds in the Atmosphere, 1st Edn., Wiley-Blackwell, Oxford, Ames, Iowa, 2007.
Lin, M., Fiore, A. M., Horowitz, L. W., Langford, A. O., Oltmans, S. J., Tarasick, D., and Rieder, H. E.: Climate variability modulates western US ozone air quality in spring via deep stratospheric intrusions, Nat. Commun., 6, 7105, https://doi.org/10.1038/ncomms8105, 2015.
McDuffie, E. E., Edwards, P. M., Gilman, J. B., Lerner, B. M., Dubé, W. P., Trainer, M., Wolfe, D. E., Angevine, W. M., deGouw, J., Williams, E. J., Tevlin, A. G., Murphy, J. G., Fischer, E. V., McKeen, S., Ryerson, T. B., Peischl, J., Holloway, J. S., Aikin, K., Langford, A. O., Senff, C. J., Alvarez, R. J., Hall, S. R., Ullmann, K., Lantz, K. O., and Brown, S. S.: Influence of oil and gas emissions on summertime ozone in the Colorado Northern Front Range, J. Geophys. Res.-Atmos., 121, 2016JD025265, https://doi.org/10.1002/2016JD025265, 2016.
McGaughey, G. R., Desai, N. R., Allen, D. T., Seila, R. L., Lonneman, W. A., Fraser, M. P., Harley, R. A., Pollack, A. K., Ivy, J. M., and Price, J. H.: Analysis of motor vehicle emissions in a Houston tunnel during the Texas Air Quality Study 2000, Atmos. Environ., 38, 3363–3372, https://doi.org/10.1016/j.atmosenv.2004.03.006, 2004.
McGlynn, D., Mao, H., Wu, Z., Sive, B., and Sharac, T.: Understanding Long-Term Variations in Surface Ozone in United States (U.S.) National Parks, Atmosphere, 9, 125, https://doi.org/10.3390/atmos9040125, 2018.
McLaren, R., Singleton, D. L., Lai, J. Y. K., Khouw, B., Singer, E., Wu, Z., and Niki, H.: Analysis of motor vehicle sources and their contribution to ambient hydrocarbon distributions at urban sites in Toronto during the Southern Ontario oxidants study, Atmos. Environ., 30, 2219–2232, https://doi.org/10.1016/1352-2310(95)00178-6, 1996.
Musselman, R. C. and Korfmacher, J. L.: Ozone in remote areas of the Southern Rocky Mountains, Atmos. Environ., 82, 383–390, https://doi.org/10.1016/j.atmosenv.2013.10.051, 2014.
National Park Service: Stats Report Viewer, available at: https://irma.nps.gov/Stat/Reports/Park, last access: 3 February 2017.
Neuman, J. A., Aikin, K. C., Atlas, E. L., Blake, D. R., Holloway, J. S., Meinardi, S., Nowak, J. B., Parrish, D. D., Peischl, J., Perring, A. E., Pollack, I. B., Roberts, J. M., Ryerson, T. B., and Trainer, M.: Ozone and alkyl nitrate formation from the Deepwater Horizon oil spill atmospheric emissions: OZONE AND ALKYL NITRATES FROM DWH, J. Geophys. Res.-Atmos., 117, D09305, https://doi.org/10.1029/2011JD017150, 2012.
O'Brien, J., Shepson, P., Muthuramu, K., Hao, C., Niki, H., Hastie, D., Taylor, R., and Roussel, P.: Measurements of Alkyl and Multifunctional Organic Nitrates at a Rural Site in Ontario, J. Geophys. Res.-Atmos., 100, 22795–22804, https://doi.org/10.1029/94JD03247, 1995.
Parrish, D. D., Trainer, M., Young, V., Goldan, P. D., Kuster, W. C., Jobson, B. T., Fehsenfeld, F. C., Lonneman, W. A., Zika, R. D., Farmer, C. T., Riemer, D. D., and Rodgers, M. O.: Internal consistency tests for evaluation of measurements of anthropogenic hydrocarbons in the troposphere, J. Geophys. Res.-Atmos., 103, 22339–22359, https://doi.org/10.1029/98JD01364, 1998.
Perring, A. E., Pusede, S. E., and Cohen, R. C.: An Observational Perspective on the Atmospheric Impacts of Alkyl and Multifunctional Nitrates on Ozone and Secondary Organic Aerosol, Chem. Rev., 113, 5848–5870, https://doi.org/10.1021/cr300520x, 2013.
Pétron, G., Frost, G., Miller, B. R., Hirsch, A. I., Montzka, S. A., Karion, A., Trainer, M., Sweeney, C., Andrews, A. E., Miller, L., Kofler, J., Bar-Ilan, A., Dlugokencky, E. J., Patrick, L., Moore, C. T., Ryerson, T. B., Siso, C., Kolodzey, W., Lang, P. M., Conway, T., Novelli, P., Masarie, K., Hall, B., Guenther, D., Kitzis, D., Miller, J., Welsh, D., Wolfe, D., Neff, W., and Tans, P.: Hydrocarbon emissions characterization in the Colorado Front Range: A pilot study, J. Geophys. Res.-Atmos., 117, D04304, https://doi.org/10.1029/2011JD016360, 2012.
Pfister, G. G., Reddy, P. J., Barth, M. C., Flocke, F. F., Fried, A., Herndon, S. C., Sive, B. C., Sullivan, J. T., Thompson, A. M., Yacovitch, T. I., Weinheimer, A. J., and Wisthaler, A.: Using Observations and Source-Specific Model Tracers to Characterize Pollutant Transport During FRAPPÉ and DISCOVER-AQ, J. Geophys. Res.-Atmos., 122, 2017JD027257, https://doi.org/10.1002/2017JD027257, 2017.
Poirot, R. L., Wishinski, P. R., Hopke, P. K., and Polissar, A. V.: Comparative Application of Multiple Receptor Methods To Identify Aerosol Sources in Northern Vermont, Environ. Sci. Technol., 35, 4622–4636, https://doi.org/10.1021/es010588p, 2001.
Prenni, A. J., Day, D. E., Evanoski-Cole, A. R., Sive, B. C., Hecobian, A., Zhou, Y., Gebhart, K. A., Hand, J. L., Sullivan, A. P., Li, Y., Schurman, M. I., Desyaterik, Y., Malm, W. C., Collett Jr., J. L., and Schichtel, B. A.: Oil and gas impacts on air quality in federal lands in the Bakken region: an overview of the Bakken Air Quality Study and first results, Atmos. Chem. Phys., 16, 1401–1416, https://doi.org/10.5194/acp-16-1401-2016, 2016.
Ranschaert, D. L., Schneider, N. J., and Elrod, M. J.: Kinetics of the C2H5O2 + NOx Reactions: Temperature Dependence of the Overall Rate Constant and the C2H5ONO2 Branching Channel of C2H5O2 + NO, J. Phys. Chem. A, 104, 5758–5765, https://doi.org/10.1021/jp000353k, 2000.
Reddy, P. J. and Pfister, G. G.: Meteorological factors contributing to the interannual variability of midsummer surface ozone in Colorado, Utah, and other western U.S. states, J. Geophys. Res.-Atmos., 121, 2015JD023840, https://doi.org/10.1002/2015JD023840, 2016.
Rindsland, C. P., Jones, N. B., Connor, B. J., Wood, S. W., Goldman, A., Stephen, T. M., Murcray, F. J., Chiou, L. S., Zander, R., and Mahieu, E.: Multiyear infrared solar spectroscopic measurements of HCN, CO, C2H6, and C2H2 tropospheric columns above Lauder, New Zealand (45∘ S latitude), J. Geophys. Res.-Atmos., 107, https://doi.org/10.1029/2001JD001150, 2002.
Roberts, J. M., Parrish, D., Norton, R. B., Bertman, S. B., Holloway, J. S., Trainer, M., Fehsenfeld, F. C., Carroll, M. A., Albercook, G. M., Wang, T., and Forbes, G.: Episodic removal of NOy species from the marine boundary layer over the North Atlantic, J. Geophys. Res.-Atmos., 101, 28947–28960, 1996.
Roberts, J. M., Bertman, S. B., Parrish, D. D., Fehsenfeld, F. C., Jobson, B. T., and Niki, H.: Measurement of alkyl nitrates at Chebogue Point, Nova Scotia during the 1993 North Atlantic Regional Experiment (NARE) intensive, J. Geophys. Res.-Atmos., 103, 13569–13580, https://doi.org/10.1029/98JD00266, 1998.
Rosen, R. S., Wood, E. C., Wooldridge, P. J., Thornton, J. A., Day, D. A., Kuster, W., Williams, E. J., Jobson, B. T., and Cohen, R. C.: Observations of total alkyl nitrates during Texas Air Quality Study 2000: Implications for O3 and alkyl nitrate photochemistry, J. Geophys. Res.-Atmos., 109, D07303, https://doi.org/10.1029/2003JD004227, 2004.
Rudolph, J.: The tropospheric distribution and budget of ethane, J. Geophys. Res., 100, 11369–11381, https://doi.org/10.1029/95JD00693, 1995.
Russo, R. S., Zhou, Y., White, M. L., Mao, H., Talbot, R., and Sive, B. C.: Multi-year (2004–2008) record of nonmethane hydrocarbons and halocarbons in New England: seasonal variations and regional sources, Atmos. Chem. Phys., 10, 4909–4929, https://doi.org/10.5194/acp-10-4909-2010, 2010a.
Russo, R. S., Zhou, Y., Haase, K. B., Wingenter, O. W., Frinak, E. K., Mao, H., Talbot, R. W., and Sive, B. C.: Temporal variability, sources, and sinks of C1−C5 alkyl nitrates in coastal New England, Atmos. Chem. Phys., 10, 1865–1883, https://doi.org/10.5194/acp-10-1865-2010, 2010b.
Simpson, I. J., Blake, N. J., Blake, D. R., Atlas, E., Flocke, F., Crawford, J. H., Fuelberg, H. E., Kiley, C. M., Meinardi, S., and Rowland, F. S.: Photochemical production and evolution of selected C2−C5 alkyl nitrates in tropospheric air influenced by Asian outflow, J. Geophys. Res.-Atmos., 108, 8808, https://doi.org/10.1029/2002JD002830, 2003.
Simpson, I. J., Andersen, M. P. S., Meinardi, S., Bruhwiler, L., Blake, N. J., Helmig, D., Rowland, F. S., and Blake, D. R.: Long-term decline of global atmospheric ethane concentrations and implications for methane, Nature, 488, 490–494, https://doi.org/10.1038/nature11342, 2012.
Sive, B. C.: Atmospheric Nonmethane Hydrocarbons: Analytical Methods and Estimated Hydroxyl Radical Concentrations, University of California, Irvine, 1998.
Sive, B. C., Zhou, Y., Troop, D., Wang, Y., Little, W. C., Wingenter, O. W., Russo, R. S., Varner, R. K., and Talbot, R.: Development of a Cryogen-Free Concentration System for Measurements of Volatile Organic Compounds, Anal. Chem., 77, 6989–6998, https://doi.org/10.1021/ac0506231, 2005.
Stein, A. F., Draxler, R. R., Rolph, G. D., Stunder, B. J. B., Cohen, M. D., and Ngan, F.: NOAA's HYSPLIT Atmospheric Transport and Dispersion Modeling System, B. Am. Meteorol. Soc., 96, 2059–2077, https://doi.org/10.1175/BAMS-D-14-00110.1, 2015.
Strode, S. A., Rodriguez, J. M., Logan, J. A., Cooper, O. R., Witte, J. C., Lamsal, L. N., Damon, M., Van Aartsen, B., Steenrod, S. D., and Strahan, S. E.: Trends and variability in surface ozone over the United States, J. Geophys. Res.-Atmos., 120, 2014JD022784, https://doi.org/10.1002/2014JD022784, 2015.
Sullivan, J. T., McGee, T. J., Langford, A. O., Alvarez, R. J., Senff, C. J., Reddy, P. J., Thompson, A. M., Twigg, L. W., Sumnicht, G. K., Lee, P., Weinheimer, A., Knote, C., Long, R. W., and Hoff, R. M.: Quantifying the contribution of thermally driven recirculation to a high-ozone event along the Colorado Front Range using lidar, J. Geophys. Res.-Atmos., 121, 10377–10390, https://doi.org/10.1002/2016JD025229, 2016.
Sun, H., Trabue, S. L., Scoggin, K., Jackson, W. A., Pan, Y., Zhao, Y., Malkina, I. L., Koziel, J. A., and Mitloehner, F. M.: Alcohol, Volatile Fatty Acid, Phenol, and Methane Emissions from Dairy Cows and Fresh Manure, J. Environ. Qual., 37, 615–622, https://doi.org/10.2134/jeq2007.0357, 2008.
Swarthout, R. F., Russo, R. S., Zhou, Y., Hart, A. H., and Sive, B. C.: Volatile organic compound distributions during the NACHTT campaign at the Boulder Atmospheric Observatory: Influence of urban and natural gas sources, J. Geophys. Res.-Atmos., 118, 10614–10637, https://doi.org/10.1002/jgrd.50722, 2013.
Swarthout, R. F., Russo, R. S., Zhou, Y., Miller, B. M., Mitchell, B., Horsman, E., Lipsky, E., McCabe, D. C., Baum, E., and Sive, B. C.: Impact of Marcellus Shale Natural Gas Development in Southwest Pennsylvania on Volatile Organic Compound Emissions and Regional Air Quality, Environ. Sci. Technol., 49, 3175–3184, https://doi.org/10.1021/es504315f, 2015.
Toth, J. and Johnson, R.: Summer Surface Flow Characteristics Over Northeast Colorado, Mon. Weather Rev., 113, 1458–1469, https://doi.org/10.1175/1520-0493(1985)113<1458:SSFCON>2.0.CO;2, 1985.
Tzompa-Sosa, Z. A., Mahieu, E., Franco, B., Keller, C. A., Turner, A. J., Helmig, D., Fried, A., Richter, D., Weibring, P., Walega, J., Yacovitch, T. I., Herndon, S. C., Blake, D. R., Hase, F., Hannigan, J. W., Conway, S., Strong, K., Schneider, M., and Fischer, E. V.: Revisiting global fossil fuel and biofuel emissions of ethane, J. Geophys. Res.-Atmos., 122, 2016JD025767, https://doi.org/10.1002/2016JD025767, 2017.
US EPA: National Emissions Inventory (NEI), available at: https://www.epa.gov/air-emissions-inventories/national-emissions-inventory-nei, last access: 22 February 2017.
Warneke, C., Geiger, F., Edwards, P. M., Dube, W., Pétron, G., Kofler, J., Zahn, A., Brown, S. S., Graus, M., Gilman, J. B., Lerner, B. M., Peischl, J., Ryerson, T. B., de Gouw, J. A., and Roberts, J. M.: Volatile organic compound emissions from the oil and natural gas industry in the Uintah Basin, Utah: oil and gas well pad emissions compared to ambient air composition, Atmos. Chem. Phys., 14, 10977–10988, https://doi.org/10.5194/acp-14-10977-2014, 2014.
Wooldridge, G., Zeller, K., and Musselman, R.: Ozone concentration characteristics at a high-elevation forest site, Theor. Appl. Climatol., 56, 153–164, https://doi.org/10.1007/BF00866424, 1997.
Zaragoza, J., Callahan, S., McDuffie, E. E., Kirkland, J., Brophy, P., Durrett, L., Farmer, D. K., Zhou, Y., Sive, B., Flocke, F., Pfister, G., Knote, C., Tevlin, A., Murphy, J., and Fischer, E. V.: Observations of acyl peroxy nitrates during the Front Range Air Pollution and Photochemistry Éxperiment (FRAPPÉ), J. Geophys. Res.-Atmos., 122, 12416–12432, https://doi.org/10.1002/2017JD027337, 2017.
Zhou, Y., Shively, D., Mao, H., Russo, R. S., Pape, B., Mower, R. N., Talbot, R., and Sive, B. C.: Air Toxic Emissions from Snowmobiles in Yellowstone National Park, Environ. Sci. Technol., 44, 222–228, https://doi.org/10.1021/es9018578, 2010.
Zhou, Y., Mao, H., and Sive, B. C.: Impacts of Oil and Gas Emissions on Long-term Trends in Surface Ozone in the Intermountain West National Parks During 2005–2015, J. Geophys. Res.-Atmos., in review, 2019.