the Creative Commons Attribution 4.0 License.
the Creative Commons Attribution 4.0 License.
 | 10 Apr 2019
A comprehensive characterization of ice nucleation by three different types of cellulose particles immersed in water
Kouji Adachi
David M. Bell
Franco Belosi
Hassan Beydoun
Bhaskar Bhaduri
Heinz Bingemer
Carsten Budke
Hans-Christian Clemen
Franz Conen
Kimberly M. Cory
Joachim Curtius
Paul J. DeMott
Oliver Eppers
Sarah Grawe
Susan Hartmann
Nadine Hoffmann
Kristina Höhler
Evelyn Jantsch
Alexei Kiselev
Thomas Koop
Gourihar Kulkarni
Amelie Mayer
Masataka Murakami
Benjamin J. Murray
Alessia Nicosia
Markus D. Petters
Matteo Piazza
Michael Polen
Naama Reicher
Yinon Rudich
Atsushi Saito
Gianni Santachiara
Thea Schiebel
Gregg P. Schill
Johannes Schneider
Lior Segev
Emiliano Stopelli
Ryan C. Sullivan
Kaitlyn Suski
Miklós Szakáll
Takuya Tajiri
Hans Taylor
Yutaka Tobo
Romy Ullrich
Daniel Weber
Heike Wex
Thomas F. Whale
Craig L. Whiteside
Katsuya Yamashita
Alla Zelenyuk
We present the laboratory results of immersion freezing efficiencies of cellulose particles at supercooled temperature (T) conditions. Three types of chemically homogeneous cellulose samples are used as surrogates that represent supermicron and submicron ice-nucleating plant structural polymers. These samples include microcrystalline cellulose (MCC), fibrous cellulose (FC) and nanocrystalline cellulose (NCC). Our immersion freezing dataset includes data from various ice nucleation measurement techniques available at 17 different institutions, including nine dry dispersion and 11 aqueous suspension techniques. With a total of 20 methods, we performed systematic accuracy and precision analysis of measurements from all 20 measurement techniques by evaluating T-binned (1 ∘C) data over a wide T range (−36 ∘C ∘C). Specifically, we intercompared the geometric surface area-based ice nucleation active surface site (INAS) density data derived from our measurements as a function of T, ns,geo(T). Additionally, we also compared the ns,geo(T) values and the freezing spectral slope parameter ( from our measurements to previous literature results. Results show all three cellulose materials are reasonably ice active. The freezing efficiencies of NCC samples agree reasonably well, whereas the diversity for the other two samples spans ≈ 10 ∘C. Despite given uncertainties within each instrument technique, the overall trend of the ns,geo(T) spectrum traced by the T-binned average of measurements suggests that predominantly supermicron-sized cellulose particles (MCC and FC) generally act as more efficient ice-nucleating particles (INPs) than NCC with about 1 order of magnitude higher ns,geo(T).
- Article
(1846 KB) - Full-text XML
-
Supplement
(2219 KB) - BibTeX
- EndNote


1.1 Background
Glaciation of supercooled clouds through immersion freezing induced by ice-nucleating particles (INPs) is an important atmospheric process affecting the formation of precipitation and the Earth's energy budget (Boucher et al., 2013; Vergara-Temprado et al., 2018). Currently, the climatic impact of INPs is, however, uncertain due to our insufficient knowledge regarding their diversity and abundance in the atmosphere (e.g., Hoose and Möhler, 2012; Murray et al., 2012; Kanji et al., 2017; Knopf et al., 2018). Recently, microcrystalline cellulose (MCC) particles of <16 µm in diameter, extracted from natural wood pulps (Aldrich, 435236), have been identified as an efficient INP (Hiranuma et al., 2015a, H15a hereafter). Experiments with this surrogate may provide useful information to understand the role of biological INPs in the troposphere as presented in H15a. Conspicuously, the H15a modeling results suggest that the tropospheric concentration of ice-nucleating cellulose becomes substantial (>0.1 L−1) below about −21 ∘C.
Cellulose is a linear polymer of 1–4 linked β-d-anhydroglucopyranose molecules, deriving from plant fragments, leaf litter, wood fiber, non-wood fiber and/or even microbes (Quiroz-Castañeda and Folch-Mallol, 2013; Thakur and Thakur, 2014; Chawla et al., 2009). The composition and structure of cellulose-containing bio-fiber depends on the source and several different factors, summarized in Khalil et al. (2012) and Dittenber and GangaRao (2012). In general, airborne cellulose particles are prevalent (>0.05 µg m−3) throughout the year even at remote and elevated locations as reported in Sánchez-Ochoa et al. (2007). A more recent study of carbonaceous aerosol composition in Switzerland over 2 years showed that ambient cellulose represents approximately 36 %–60 % of primary biological organic aerosols, and the ambient cellulose concentration exceeded a few micrograms per cubic meter (Figs. 6 and 7d of Vlachou et al., 2018). Their water-insoluble, hydrolysis-resistant and heat-resistive features (Fernández et al., 1997; Quiroz-Castañeda and Folch-Mallol, 2013) may in part explain the long-range transport and high concentrations of cellulose even at geographically dispersed sites. Another unique characteristic of ambient cellulose is its wide range of physical size available for freezing. For example, the size distribution measurements of ambient cellulose particles by Puxbaum and Tenze-Kunit (2003) indicate the presence of particulate cellulose in the range from 10 nm to >20 µm. The presence of supermicron particles, possessing larger surfaces compared to submicron ones, is remarkable since they can potentially act as supermicron-sized INPs since large surfaces may promote efficient formation of ice embryos (Pruppacher and Klett, 2010; Schnell and Vali, 1972 and 1973). Nevertheless, more comprehensive characterization of ice-nucleating properties of various cellulose-containing particles is necessary to examine if the ice-nucleating activity is specific to MCC or generally relevant to all cellulose materials in the atmosphere.
1.2 Previous INUIT activities
In 2012, the German research consortium-led INUIT (Ice Nuclei research UnIT) project was commenced to comprehensively study heterogeneous ice nucleation processes in the atmosphere. Throughout the period since, this project has provided a transnational platform to bolster collaborative research activities between meticulous groups who study atmospheric INPs. In turn, INUIT has accelerated ice nucleation research in a wide range of study scales from nanoscopic microphysics (e.g., Kiselev et al., 2017) to cloud-scale modeling (e.g., Diehl and Mitra, 2015; Paukert and Hoose, 2014) in cross- and interdisciplinary manners.
Formerly, several INUIT studies addressed quantitative validations of ice nucleation (IN) instruments using test proxies of atmospheric particles (Wex et al., 2015; Hiranuma et al., 2015b; Burkert-Kohn et al., 2017). Some studies focused on identifying potential reasons of the data diversity (e.g., different experimental methods and sample preparation methods). For example, Burkert-Kohn et al. (2017) conducted the intercomparison workshop by co-deploying instruments with a uniform aerosol dispersion procedure and size segregation method to minimize the diversity in ice nucleation results. Hiranuma et al. (2015b), H15b henceforth, took a different approach to perform an intercomparison of INP measurement techniques. The authors demonstrated the collaborative multi-institutional laboratory work with a total of 14 institutions (seven from Germany, four from the US, one from the UK, one from Switzerland and one from Japan) by distributing a test particulate sample to partners and allowing measurements at their home laboratories. The authors discussed the potential effect of sampling of the dust, agglomeration, flocculation, surface estimation methods, multiple nucleation modes and chemical aging on the observed data deviation amongst 17 different IN instruments. This study suggested that a combination of above-listed factors may be responsible for ∼ 8 ∘C diversity in terms of temperature and up to 3 orders of magnitude difference with respect to the ice nucleation active surface site (INAS) density, ns(T), parameters. Further, two follow-up studies on potential effects of aggregation upon IN were performed in Emersic et al. (2015) and Beydoun et al. (2016). The former study presented the potential role of aggregation and sedimentation of mineral particles, altering their IN efficiency in aqueous suspension, by combining experimental and modeling approaches. The latter study presented a subset of cellulose data used in this study, and the authors postulated that the widening of the frozen fractions and enhanced ice activity towards high T was attributable to increased diversity in ice-nucleating activity for lower concentrations and particle surfaces. In other words, there is a distribution of active sites between individual droplets depending on the total surface area. Nevertheless, our understanding of overall consistency of current INP measurement techniques and dominant mechanisms that may be responsible for diversity among measurements is still insufficient.
1.3 Goals
The measurement strategy for this study was formulated in 2015 to further augment our understanding of the sensitivity of various ice nucleation instruments with respect to immersion freezing efficiencies. Beyond official INUIT-participating institutes, including Bielefeld University (BU), Goethe University Frankfurt (GUF), Johannes Gutenberg University of Mainz (JGU), Karlsruhe Institute of Technology (KIT), the Max Planck Institute for Chemistry (MPIC), the Leibniz Institute for Tropospheric Research (TROPOS), the Technical University of Darmstadt (TUD) and the Weizmann Institute of Science (WIS), 10 associated institutes (five from the US, three from Europe and two from Japan) are involved in this study. These associated partners include Carnegie Melon University (CMU), Colorado State University (CSU), North Carolina State University (NC State), the Pacific Northwest National Laboratory (PNNL), West Texas A&M University (WTAMU), the Institute of Atmospheric Sciences and Climate-National Research Council (ISAC-CNR), the University of Basel, the University of Leeds, the Meteorological Research Institute (MRI) and the National Institute of Polar Research (NIPR). In this study, we have used three cellulose samples, microcrystalline cellulose (MCC, Aldrich, 435236), fibrous cellulose (FC, Sigma, C6288) and nanocrystalline cellulose (NCC, Melodea, WS1), as atmospheric surrogates for non-proteinaceous biological particles. These samples were shared with all collaborators, and immersion freezing experiments were conducted individually at each institution to obtain immersion freezing data as a function of multi-experimental parameters (see Sect. 3.1). The motivation of using multiple types of cellulose was to (1) examine the immersion freezing abilities of both predominantly supermicron (MCC and FC) and submicron (NCC) cellulose particles to assess a wide size range of chemically uniform biological particles and (2) look into diverse surface structure (Table 1)
Table 1Properties of microcrystalline cellulose (MCC), fibrous cellulose (FC) and nanocrystalline cellulose (NCC).
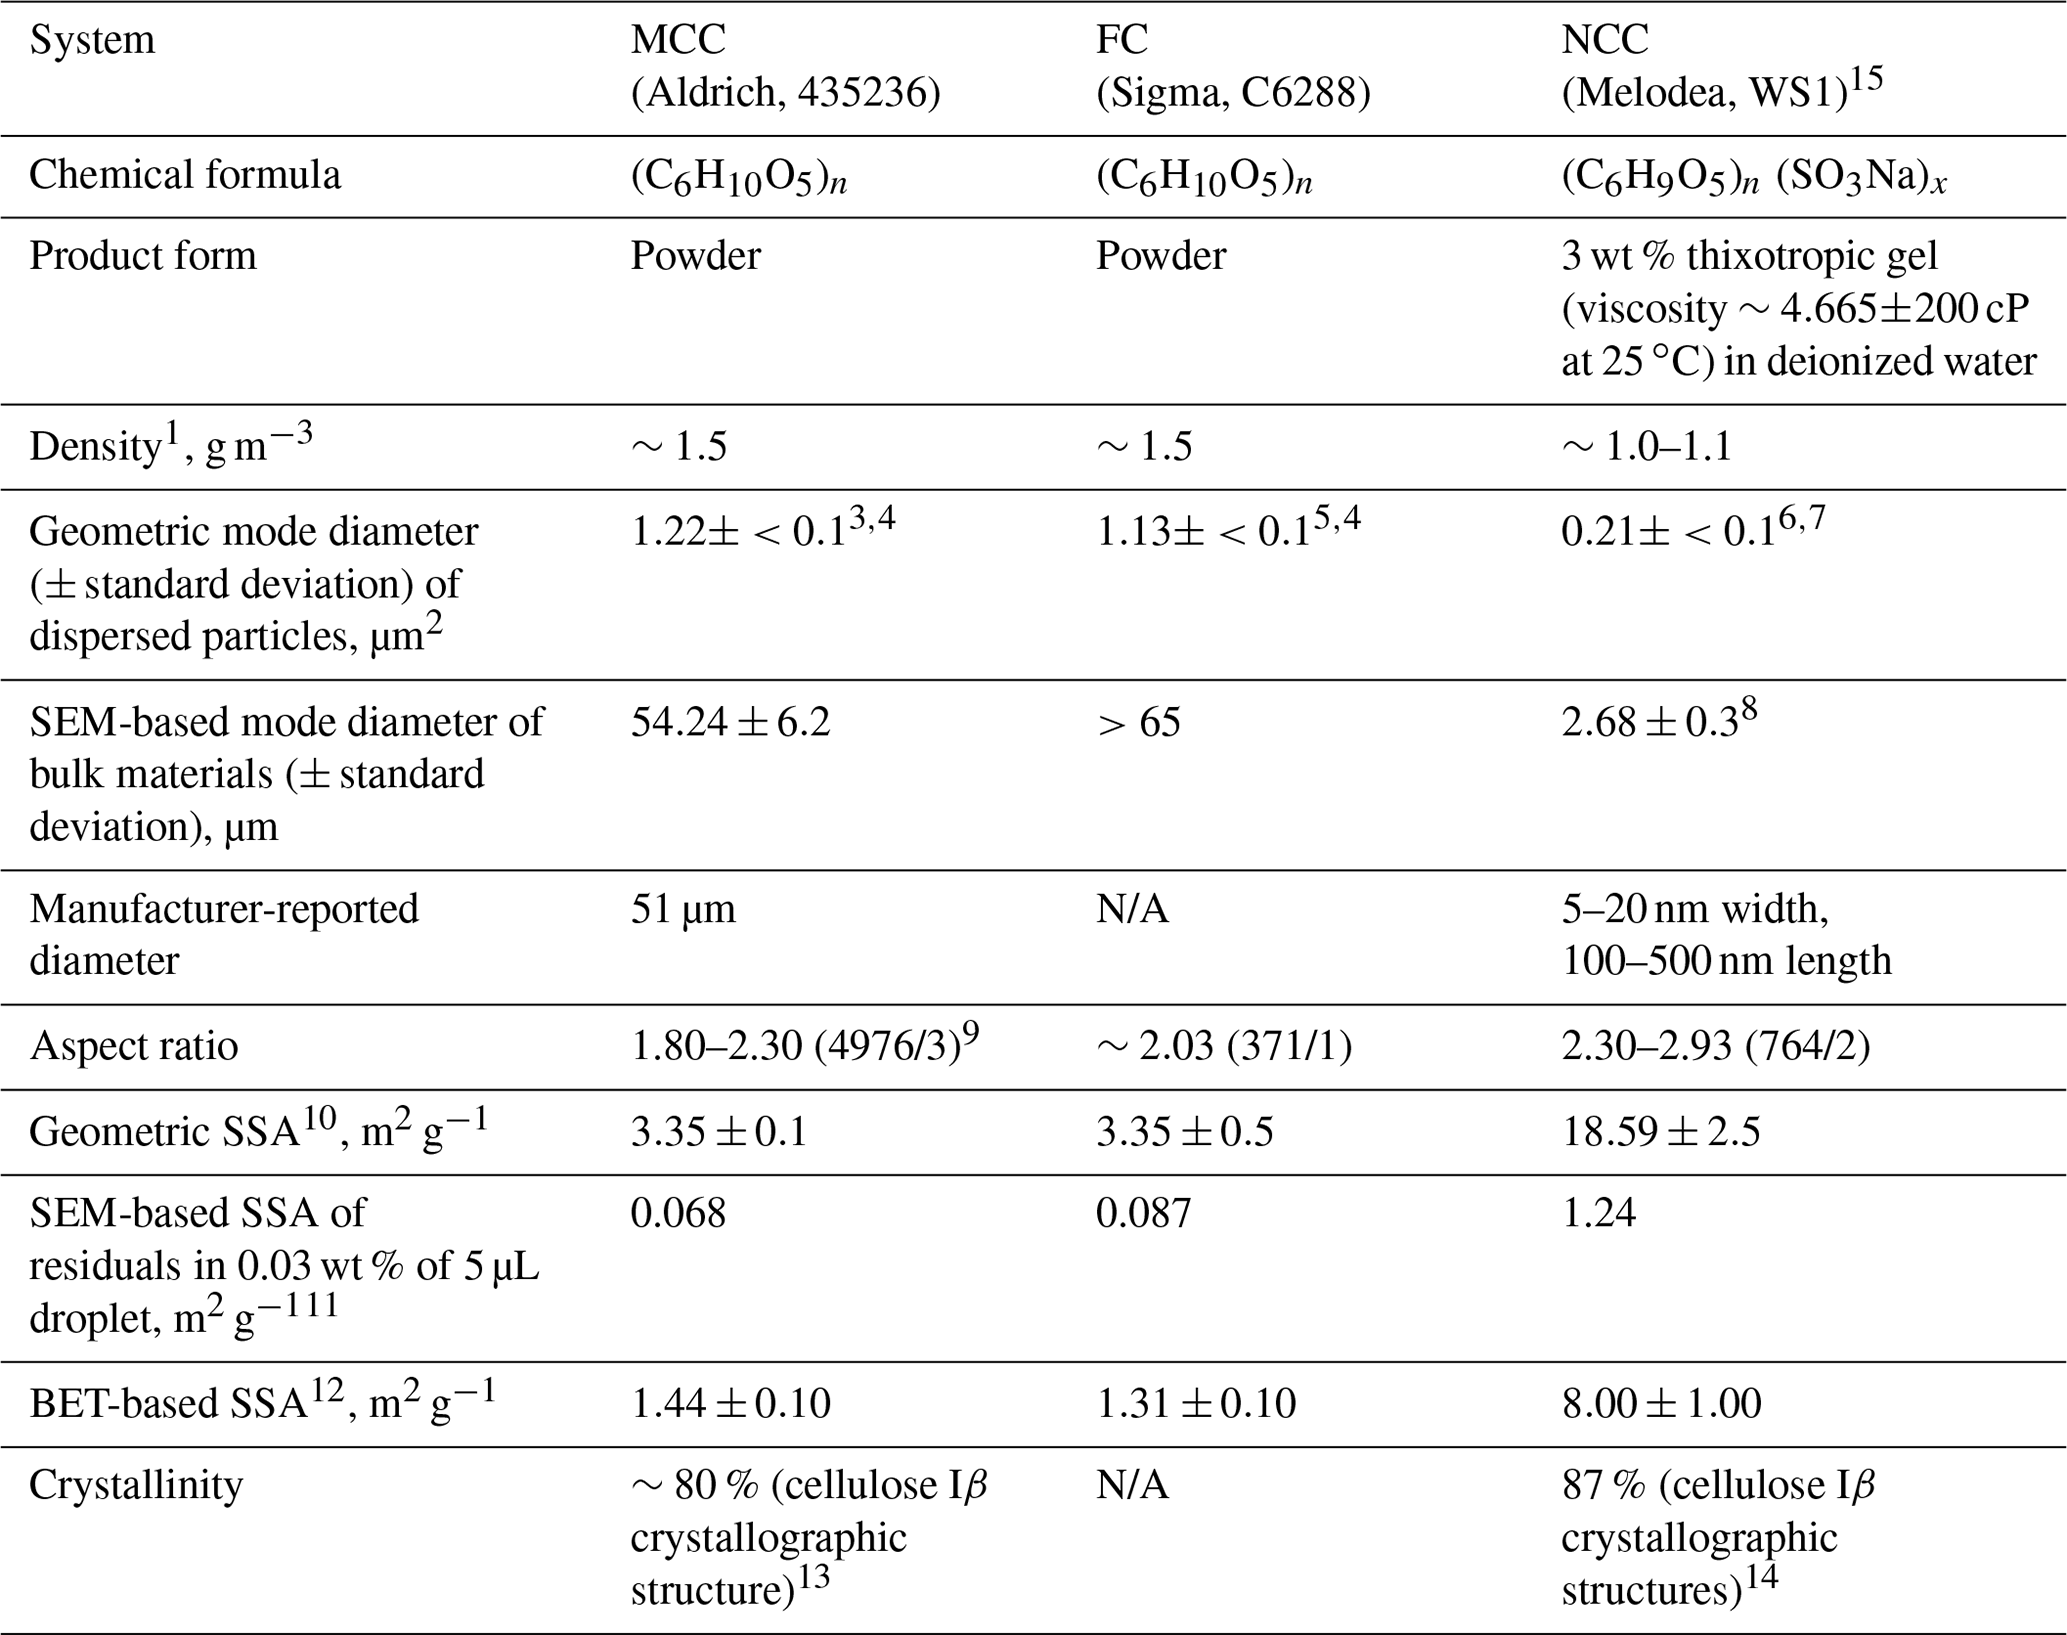
1 Bulk density values according to manufacturers. 2 Based on ΔS/ΔlogDve from ADIA measurements. 3 Measured by a combination of a scanning mobility particle sizer (SMPS) and an aerodynamic particle sizer (APS) at Aerosol Interaction and Dynamics in the Atmosphere (AIDA) (INUIT06_1, 17, 31, 42, 43, 44, 45, 46, 54). 4 Dry particles were dispersed into the AIDA chamber using a rotating brush generator (RBG1000, PALAS). 5 Measured by a combination of SMPS and APS at AIDA (INUIT06_6, 14). 6 Measured by a combination of SMPS and APS at AIDA (INUIT08_6, 7, 9, 10). 7Water-suspended NCC was aerosolized using the customized-atomizer (Wex et al., 2015). 8 The SEM-based mode diameter of atomized NCC is 0.28 µm, which is similar to that of bulk NCC. 9 Average aspect ratio per substrate: the numbers in parentheses represent a total number of particles/substrate(s) analyzed under SEM for each subset. 10 Geometric SSA is derived from ADIA measurements (i.e., fraction of total surface area concentration to total mass concentration estimated from a combination of SMPS and APS; see Fig. S1). The particles in AIDA were all <10 µm in diameter. 11 Measured using droplet residuals derived from 5 µL of 0.03 wt % suspension. Uncertainty is not given because all individual particle counts were compiled to calculate the SSA value of each sample. 12 Brunauer et al., 1938. 13 Nishiyama et al., 2002. 14 Aulin et al., 2009. 15 Two NCC samples from different batches, namely non-sterile NCC (NCC01) and freshly generated NCC (NCC02), were used for the IN characterization.
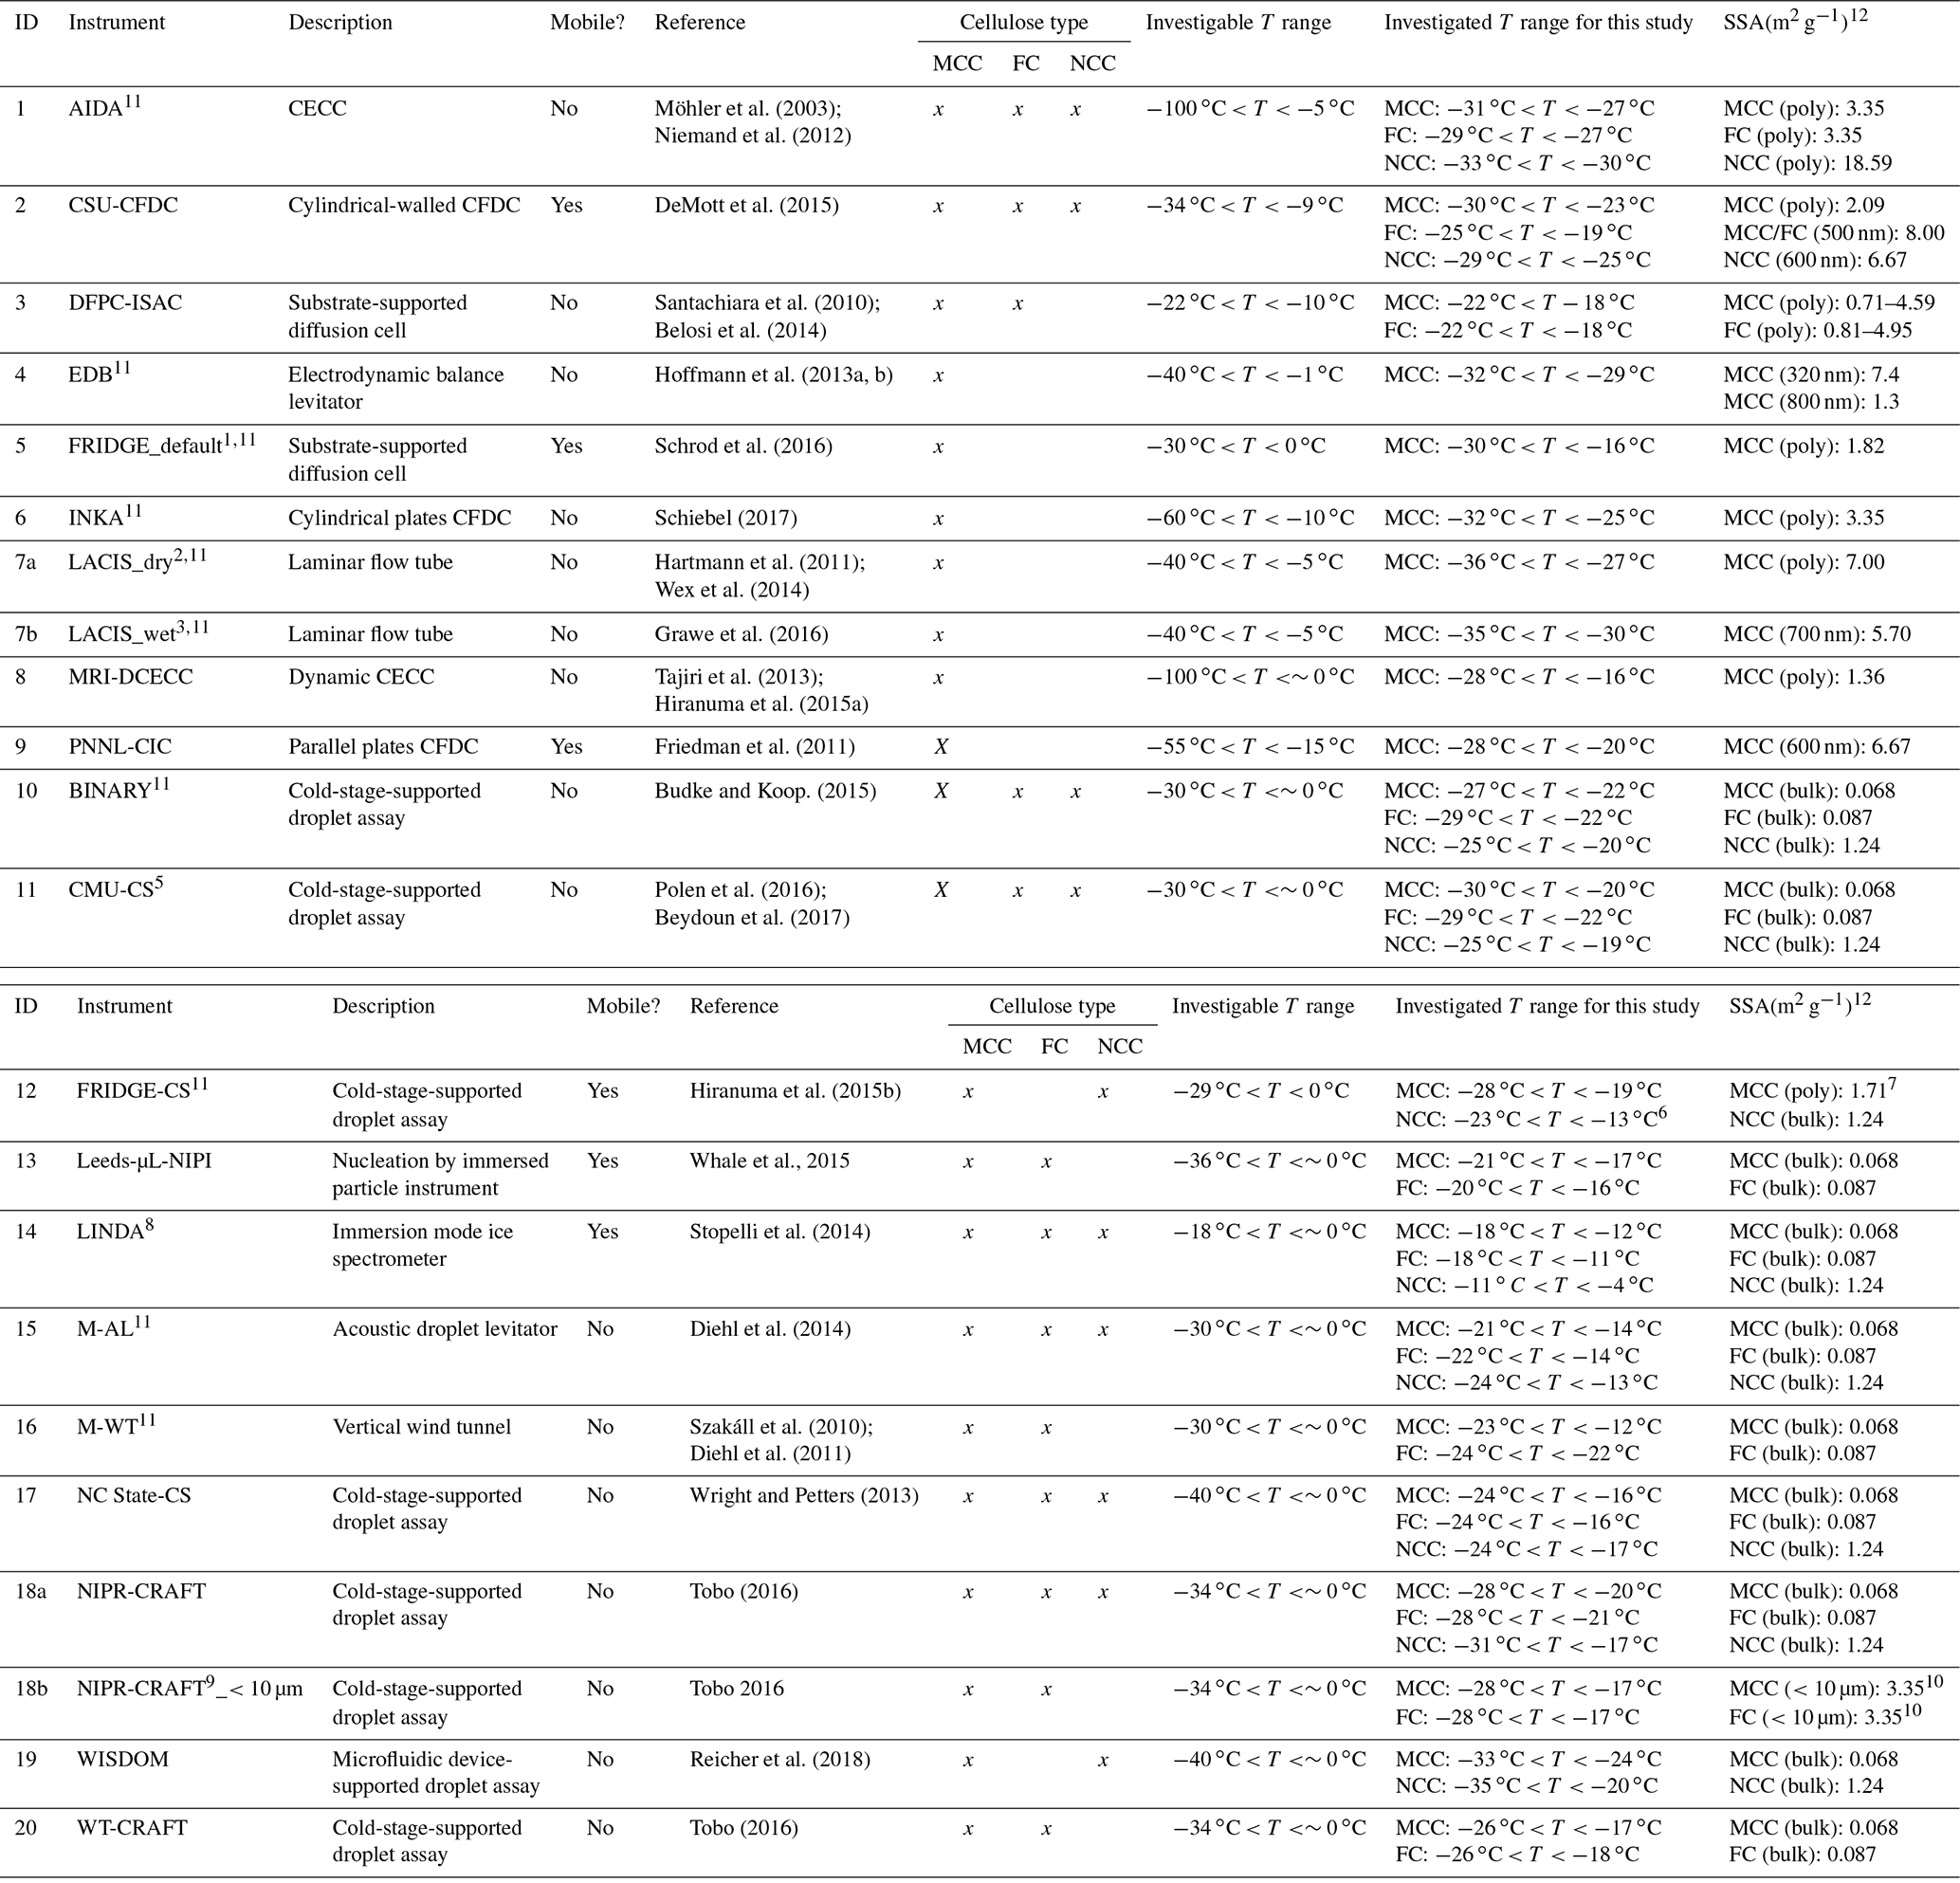
A total of 20 measurement techniques are used in this study to compile a comprehensive dataset for evaluating immersion freezing properties of cellulose samples. The dataset is analyzed to understand functional dependence of various experimental parameters and of cellulose particle characteristics. In this work, 11 instruments test samples used aqueous suspensions while nine examined aerosolized powders dispersed in synthetic air with a low relative humidity (RH) or atomized/nebulized suspensions containing cellulose samples followed by a diffusion drying process, referred to as dry dispersion methods henceforth. The basic experimental methods and parameterization approaches used to interpret the data are discussed in Sect. 3.1 and 3.2.
This work extends a previous proof-of-principle experiment that demonstrated the importance of cellulose-containing particles in the atmosphere (H15a). To date, there has been an increasing and diverse awareness of the presence of atmospheric cellulose (e.g., Vlachou et al., 2018; Schütze et al., 2017; Legrand et al., 2007; Yttri et al., 2018; Samaké et al., 2019) – not as levoglucosan (the pyrolysis product of cellulose). Thus, the main objective of this study is to comprehensively examine the immersion freezing efficiency of cellulose that could be important in an atmospheric context. In addition, the comprehensive ice nucleation data of cellulose materials presented in this work can be used to elucidate the role of airborne biological ice-nucleating aerosols derived from leaf litters and their emissions over natural surfaces (e.g., Schnell and Vali, 1976) and harvest regions, which certainly contained populations of plant matter in the air (Suski et al., 2018).
All of our samples are linear polymers of glucosyl derivatives, mechanically extracted through <200 ∘C heat application and catalytic oxidation (e.g., Battista et al., 1962; Brinchi et al., 2013). In particular, MCC is extracted from hardwoods (e.g., oak; personal communication with the manufacturer, Aldrich). A summary of major properties of three samples is provided in Table 1. Briefly, these highly stable biopolymers, whose bulk density ranges between 1.0 and 1.5 g cm−3, exhibit different physical dimensions depending on sample processing and treatments. As seen in Table 1, the geometric size of dispersed particles is more than 10-fold smaller than the size of bulk materials measured by electron microscopy without any exception, suggesting the presence of super aggregates in non-dispersed bulk samples. We note that the powder size of MCC reported by the manufacturer (∼ 50 µm) is in good agreement with our size measured with a scanning electron microscope (SEM). In contrast, the particle size of NCC reported on the manufacturer's material data sheet (data based on transmission electron microscopy) is more comparable to the dispersed particle diameter of ∼ 0.2 µm than the SEM-based size. In this paper, the NCC size by SEM represents the size of NCC residuals (i.e., leftover particles after evaporating water content) from a 5 µL suspension droplet of 0.03 wt %. Due to the high viscosity of the gelatinous form of NCC (4.665 ± 200 cP at 25 ∘C), aggregation may have occurred while evaporating water. Even after the 15 min ultrasonic bath treatment of the suspension, aggregates seem to remain unelucidated, which is reflected in their SEM-based diameter of >2.5 µm. A more detailed discussion of particle and residual size distributions is available in Sect. S1 in the Supplement.
The average aspect ratios (ARs) of each cellulose material in Table 1 were estimated with an identical procedure employed in our previous H15a study. We evaluated a total of 4.976 MCC, 371 FC and 764 NCC particles. The Everhart–Thornley detector (ETD) of a scanning electron microscope (SEM, FEI, Quanta 650 FEG) was used to acquire the below-the-lens micrograph image and measure two-dimensional axis length of particles deposited on membrane filters. The degree of elongation appears to be higher for NCC (average AR up to 2.93) when compared to MCC and FC (average AR of <2.30). Nonetheless, all sample types show that particles are elongated with an aspect ratio varying from ∼ 2 to 3, which is similar to our previous measurement on MCC particles (i.e., 2.1).
Three different measurements of the unit surface area per unit mass (specific surface area, SSA), namely geometric SSA, SEM-based SSA and Brunauer–Emmett–Teller (BET) SSA, for each system are also shown in Table 1. These measurements correspond to SSA of (1) mechanically aerosolized particles (<10 µm in diameter) in the Aerosol Interaction and Dynamics in the Atmosphere (AIDA) chamber, (2) droplet residuals obtained after evaporating water content of a 5 µL droplet of 0.03 wt % aqueous suspension and (3) bulk samples. Our intention of using different SSA metrics is to provide the most adequate parameter for the ns,geo(T) estimation of individual techniques based on their characteristics (e.g., geometric SSA for dry dispersion techniques and SEM-based SSA for aqueous suspension techniques). As demonstrated in our previous H15b comparison effort, when a reduced SSA value is observed for the same sample, it indicates the presence of agglomeration. Hence, the degree of aggregation of cellulose fibers is presumably responsible for the observed differences in SEM-based SSA values for residuals obtained from suspensions from geometric SSA of the mechanically aerosolized particles (Table 1). Alternatively, a loss of larger particles from the sample, which may happen in airborne aerosols due to settling or impaction in the particle generation setup may also lead to different SSA values if the surface properties of the cellulose particles differ with the particle size. A more detailed discussion of chemical composition and impurity analyses of our sample materials, including single-particle aerosol spectrometry and scanning electron microscopy, are discussed in Sects. S2 and S3 in the Supplement, respectively.
Table 2Summary of INUIT measurement techniques and instruments. Their acronyms are available in the Supplement. ID 1–9 and ID 10–20 represent dry dispersion measurements and suspension techniques, respectively (alphabetical order).
1 Default deposition nucleation mode
operation. 2 Experiments with dry-dispersed aerosol injection.
3 Experiments with atomized-aerosol injection. 4 Homogenized-sample
data. 5 0.001–1 wt % aqueous suspensions employed.
6 Experiments
with 1.2 wt % non-diluted suspension.
7 TSI optical particle sizer basis. 8 Experiments with both dissolved mass in solution
and dry powder mass. 9 Experiments with size-selected
(<10 µm) particles. 10 The AIDA-derived geometric SSA
value (3.35 m2 g−1)
was used since it accounts for only <10 µm particles. 11 Instruments of INUIT project partners.
12 Specific surface area; poly: polydispersed particles;
homo: homogenized particles; bulk: bulk material.
3.1 Ice nucleation measurements
A total of 20 techniques were used to investigate the ice-nucleating properties, in particular immersion freezing (Vali et al., 2015), of cellulose particles (Table 2). In this study, nine techniques employed dry dispersion methods that refer to experiments employing water vapor condensation onto dry dispersed particles followed by droplet freezing, and another set of 11 techniques used aqueous suspension methods that denote the experiments started with the test sample pre-suspended in water before cooling. Detailed information of individual methods and their applications to study atmospherically relevant INPs are provided in references given in Table 2 and elsewhere (e.g., DeMott et al., 2017). More detailed quantitative and nominal descriptions of both dry dispersion and aqueous suspension methods used in this study are available in Sect. S4.
Note that only nonmandatory guidelines were provided as an experimental protocol by INUIT to those who employed aqueous suspension techniques, and the experimental protocol for the wet suspension techniques was decided by each investigator. The intention was not to introduce limitations and constraints to participants. For MCC and FC, the INUIT protocol recommended the following procedures:
-
measurements with <0.05 wt % suspension,
-
idle time of ∼ 30 min without stirring for large particles to settle out,
-
preparation of droplets out of the quasi-steady state suspension (i.e., the upper layer of the suspension),
-
storage of the sample in the chemically inert container at ambient temperature.
In a similar way, for NCC, the INUIT protocol suggested
-
1 min sonication of the original sample for initial homogenization,
-
dilution to the desired final concentration using deionized water (18.2 MΩ cm−1),
-
mixing the suspension vigorously for 3 min using a high-shear mechanical stirrer, homogenizer or probe sonicator to obtain a homogenous suspension, alternatively, using an ultrasonic bath for 30 min in the case of a sample volume <10 mL,
-
measurements with <0.03 wt % in order to diminish particle aggregation,
-
storage of the sample in a dry and cool (4 ∘C) environment.
More detailed discussion regarding nominal parameters is given in Sect. S4.
3.2 Ice nucleation parameterization
In this section, we describe a procedure to parameterize immersion freezing abilities for both dry dispersion methods and aqueous suspension techniques. The immersion freezing data of cellulose particles in a wide range of temperatures is then discussed by comparing ns,geo(T) spectra from all 20 instruments. Please note that using the scaled metrics for the validation (e.g., ns,geo(T) scaling with the technique-specific SSA value) is indispensable in this study because the changes or uncertainties in surface area amongst groups are an issue as described in Sect. S4. The INP concentration per volume of air (nINP(T); e.g., DeMott et al., 2017; Vali, 1971) is a useful parameter for instrumental evaluation when utilizing identical samples at a single location with known sampling flows but is not applicable in this work.
The majority of dry dispersion methods employ the approximation of Niemand et al. (2012). If the activated ice fraction is small (<0.1), the Taylor series approximation can be applied, and we can estimate ns,geo(T):
in which Nice(T) is the cumulative number concentration of formed ice crystals at T (cm−3), Ntotal is the total number concentration of particles prior to any freezing event (cm−3), Sve is the volume-equivalent surface area of an individual particle (m2) and Stotal is the total surface area (m2). For the LACIS (Leipzig Aerosol Cloud Interaction Simulator) data, the left part of Eq. (1) was used without any approximation.
One distinct exception is the electrodynamic balance (EDB) method, in which the probability of contact freezing on a single collision, ec, is first inverted from frozen fraction (FF) to take into account the rate of collision and, then, scaled to surface area of a single INP to estimate ns,geo(T) (Hoffmann et al., 2013a, b):
Note that the INP colliding with the supercooled droplet is only partially submersed in water, and therefore the surface available for nucleation is corrected by a dimensionless factor kimm. The value of this factor depends on the wettability of the particle surface and is generally unknown. In this work, kimm=1 has been assumed. The effective surface area of MCC particles has been derived from the scanning electron microscope images of the particles collected on the Nuclepore® membrane filters placed inline to the EDB, as described in Sect. S1.
The results of 11 aqueous suspension methods are interpreted in terms of the frozen fraction (FF), INP concentration per volume of liquid (cINP, Vali, 1971) and geometric size-based ice nucleation active surface-site density (ns,geo(T); Connolly et al., 2009; H15b). The cumulative FF at T is
where Nu is the number of unfrozen droplets and N is the total number of originally liquid entities. Following Eq. (1) in DeMott et al. (2017), conversion to cINP at T is expressed by
where Vd represents the individual droplet volume. Finally, the ns,geo(T) value as a function of T can be estimated by
where ρw is the water density (=997.1 g L−1), ω is the mass ratio of analyte and water (unit-less), and θ is the SSA value (m2 g−1), provided in Tables 2, S1 and S2.
Accordingly, we compare the ns,geo(T) and (i.e., the freezing spectral slope parameter, H15b) data from our measurements to five literature results. These reference results include previously reported ns,geo(T) curves of illite NX particles from H15b (hereafter H15NX), MCC particles from H15a (hereafter H15MCC), Snomax (Wex et al., 2015, hereafter W15), desert dusts (Ullrich et al., 2017, hereafter U17) and K feldspar (Atkinson et al., 2013, hereafter A13). The ns,geo(T) (m−2 as a function of ∘C) fits from the reference literature are
For H15MCC (wet), the nm(T)-to-ns,geo(T) conversion was performed using SEM-based SSA constants of 0.068 m2 g−1. The geometric SSA value of 7.99 m2 g−1 was used for W15. This SSA value was derived from the polydisperse particle size distribution measurements of Snomax obtained during AIDA studies, whose IN data are included to compute immersion freezing results reported in Wex et al. (2015). For microcline (K feldspar), the ns,geo(T)-to-ns,BET(T), conversion was performed using a laser diffraction-based geometric SSA of 0.89 m2 g−1and an N2 BET SSA of 3.2 m2 g−1 reported in Atkinson et al. (2013). Please note that laser diffraction tends to be sensitive to the larger particles in a distribution, so it may miss the smaller particles and underestimate surface area.
3.3 Temperature binning
A consistent data interpolation method is important to systematically compare different ice nucleation measurement methodologies as demonstrated in H15b. In this study, we present T-binned average ice nucleation data (i.e., 1 ∘C bins for −36 ∘C ∘C). Unless the data were originally provided in 1 ∘C binned data (i.e., weighted average or cumulative counts) (i.e., BINARY, DFPC-ISAC, FRIDGE-CS (MCC portion), LINDA, NC State-CS, NIPR-CRAFT, WISDOM and WT-CRAFT), all data are binned in a consistent manner using either a moving average (where original data points are finer than 1 ∘C) or a piecewise cubic hermite interpolating polynomial function (where original data points are equivalent to or coarser than 1 ∘C). For the former case, the default span for the moving average is 3 (i.e., centered moving average for a 0.5 ∘C resolution data). If the temperature resolution is finer than 0.5 ∘C, the number of moving average span is equal to the number of data points in each temperature bin (an even span is reduced by 1). The comparison of T-binned immersion freezing spectra from particle dispersion methods and aqueous suspension methods is discussed in Sect. 4.1.

Figure 1Immersion freezing ns,geo(T) spectra for MCC (a), FC (b) and NCC (c) from different techniques. Dry dispersion results (DD, pink markers) and aqueous suspension results (AS, blue markers) are shown in (a.i–c.i) to highlight the difference between these two subsets. Intercomparisons of DD and AS for each cellulose sample type using T-binned ns,geo are presented in (a.ii–c.ii) and (a.iii–c.iii), respectively. The log average of all results as well as the deviation between maxima and minima of ns,geo(T) are shown in (a.iv–a.iv). Reference immersion freezing ns(T) spectra for MCC (H15a) illite NX (H15b), Snomax (Wex et al., 2015), desert dusts (U17; Ullrich et al., 2017) and K feldspar (A13; Atkinson et al., 2013) are also shown (see Sect. 4.1). For NCC, the results from two different batches (NCC01 from December 2014 and NCC02 from May 2015) are shown.
4.1 Dry dispersion vs. aqueous suspension methods
Temperature-binned ensemble ns,geo(T) spectra of MCC, FC and NCC in a temperature range between −4 and −38 ∘C are presented in Fig. 1. Different columns (a–c) correspond to different sample types: (a) MCC, (b) FC and (c) NCC. Figure 1a.i, b.i and c.i show a comparison between dry-dispersion-type measurements and aqueous suspension measurements of cellulose samples with previous parameterizations of other reference samples (Fig. 1a.i, b.i, c.i). The ns,geo(T) spectra from each subgroup of techniques are independently summarized in Fig. 1a.ii–c.ii and a.iii–c.iii. More detailed representations of ns,geo(T) spectra from individual techniques are discussed in Sect. 4.3. Lastly, Fig. 1a.iv, b.iv and c.iv show the overall deviation between maxima and minima of ns,geo(T) as pink shaded areas. As inferred from Fig. 1a.i–c.i, a.ii–c.ii and a.iii–c.iii, dry particle-dispersed measurements generally show higher ns,geo(T) values than aqueous suspension measurements above −24 ∘C regardless of sample types. Furthermore, as apparent in Fig. 1a.iv–c.iv, the ns,geo(T) differences among measurements can extend to up to 3 orders of magnitude at −20 ∘C (for MCC and FC) and −15 ∘C (for NCC), where the results from particle dispersion measurements and a majority of suspension measurements coexist.
The observed divergence in ns,geo(T) is most significant at temperatures higher than −24 ∘C, where the slope in the aqueous suspension spectra is steeper (i.e., ). Most aqueous suspension methods capture the abruptly increasing segment of the ns,geo(T) spectral slopes at −20 ∘C ∘C. In this T region, the slope is virtually identical to the slopes of wet H15NX and H15MCC spectra (0.35–0.37, Eqs. 7 and 9) and is also closely parallel to the A13 parameterization (0.45, Eq. 12), suggesting the number of active sites are different. Likewise, our T-binned data from dry dispersion methods exhibit similar ns,geo(T) values when compared to the previous parameterizations. For instance, our dry-dispersed cellulose spectra (i.e., Δlog(ns)∕ΔT of 0.20, 0.28 and 0.22 for MCC, FC and NCC) present trends comparable to the dry H15 curves (0.18–0.24, Eqs. 7 and 9) and U17 parameterization (0.22, Eq. 11).
It is interesting that a similar difference between dry dispersion and aqueous suspension results (i.e., ns,geo(T) of dry-dispersed particle of suspension results) is made by previous intercomparison activities with mineralogically heterogeneous dust particles (Emersic et al., 2015; H15b). In brief, Emersic et al. (2015) report the dry dispersion chamber-measured ns,geo(T) can be up to a factor of 1000 larger than the cold stage results for multiple mineral dust samples, including illite NX, kaolinite and K feldspar. Our previous study also shows that ns,geo(T) of illite NX increases sharply at lower temperatures in the T range from −18 to −27 ∘C, followed by the leveling off segment at the low-temperature region. It is certainly common for the ns,geo(T) spectrum to level off at the ns,geo(T) maxima. As mentioned in Sect. 1.2, several studies (Emersic et al., 2015; Beydoun et al., 2016) reported the mechanism of the observed divergence between two subsets of methods. Nonetheless, the reduction in the slope of ns,geo(T) spectrum may be a plausible contributor to the higher reported ns,geo(T) values in some aqueous suspension measurement results (WISDOM (WeIzmann Supercooled Droplets Observation on Microarray), CMU-CS (Carnegie Mellon University – cold stage) in Sect. 4.3), which are comparable to the dry dispersion results (i.e., data of freezing of individual droplets containing a single aerosol particle) for illite NX and cellulose (Beydoun et al., 2016).
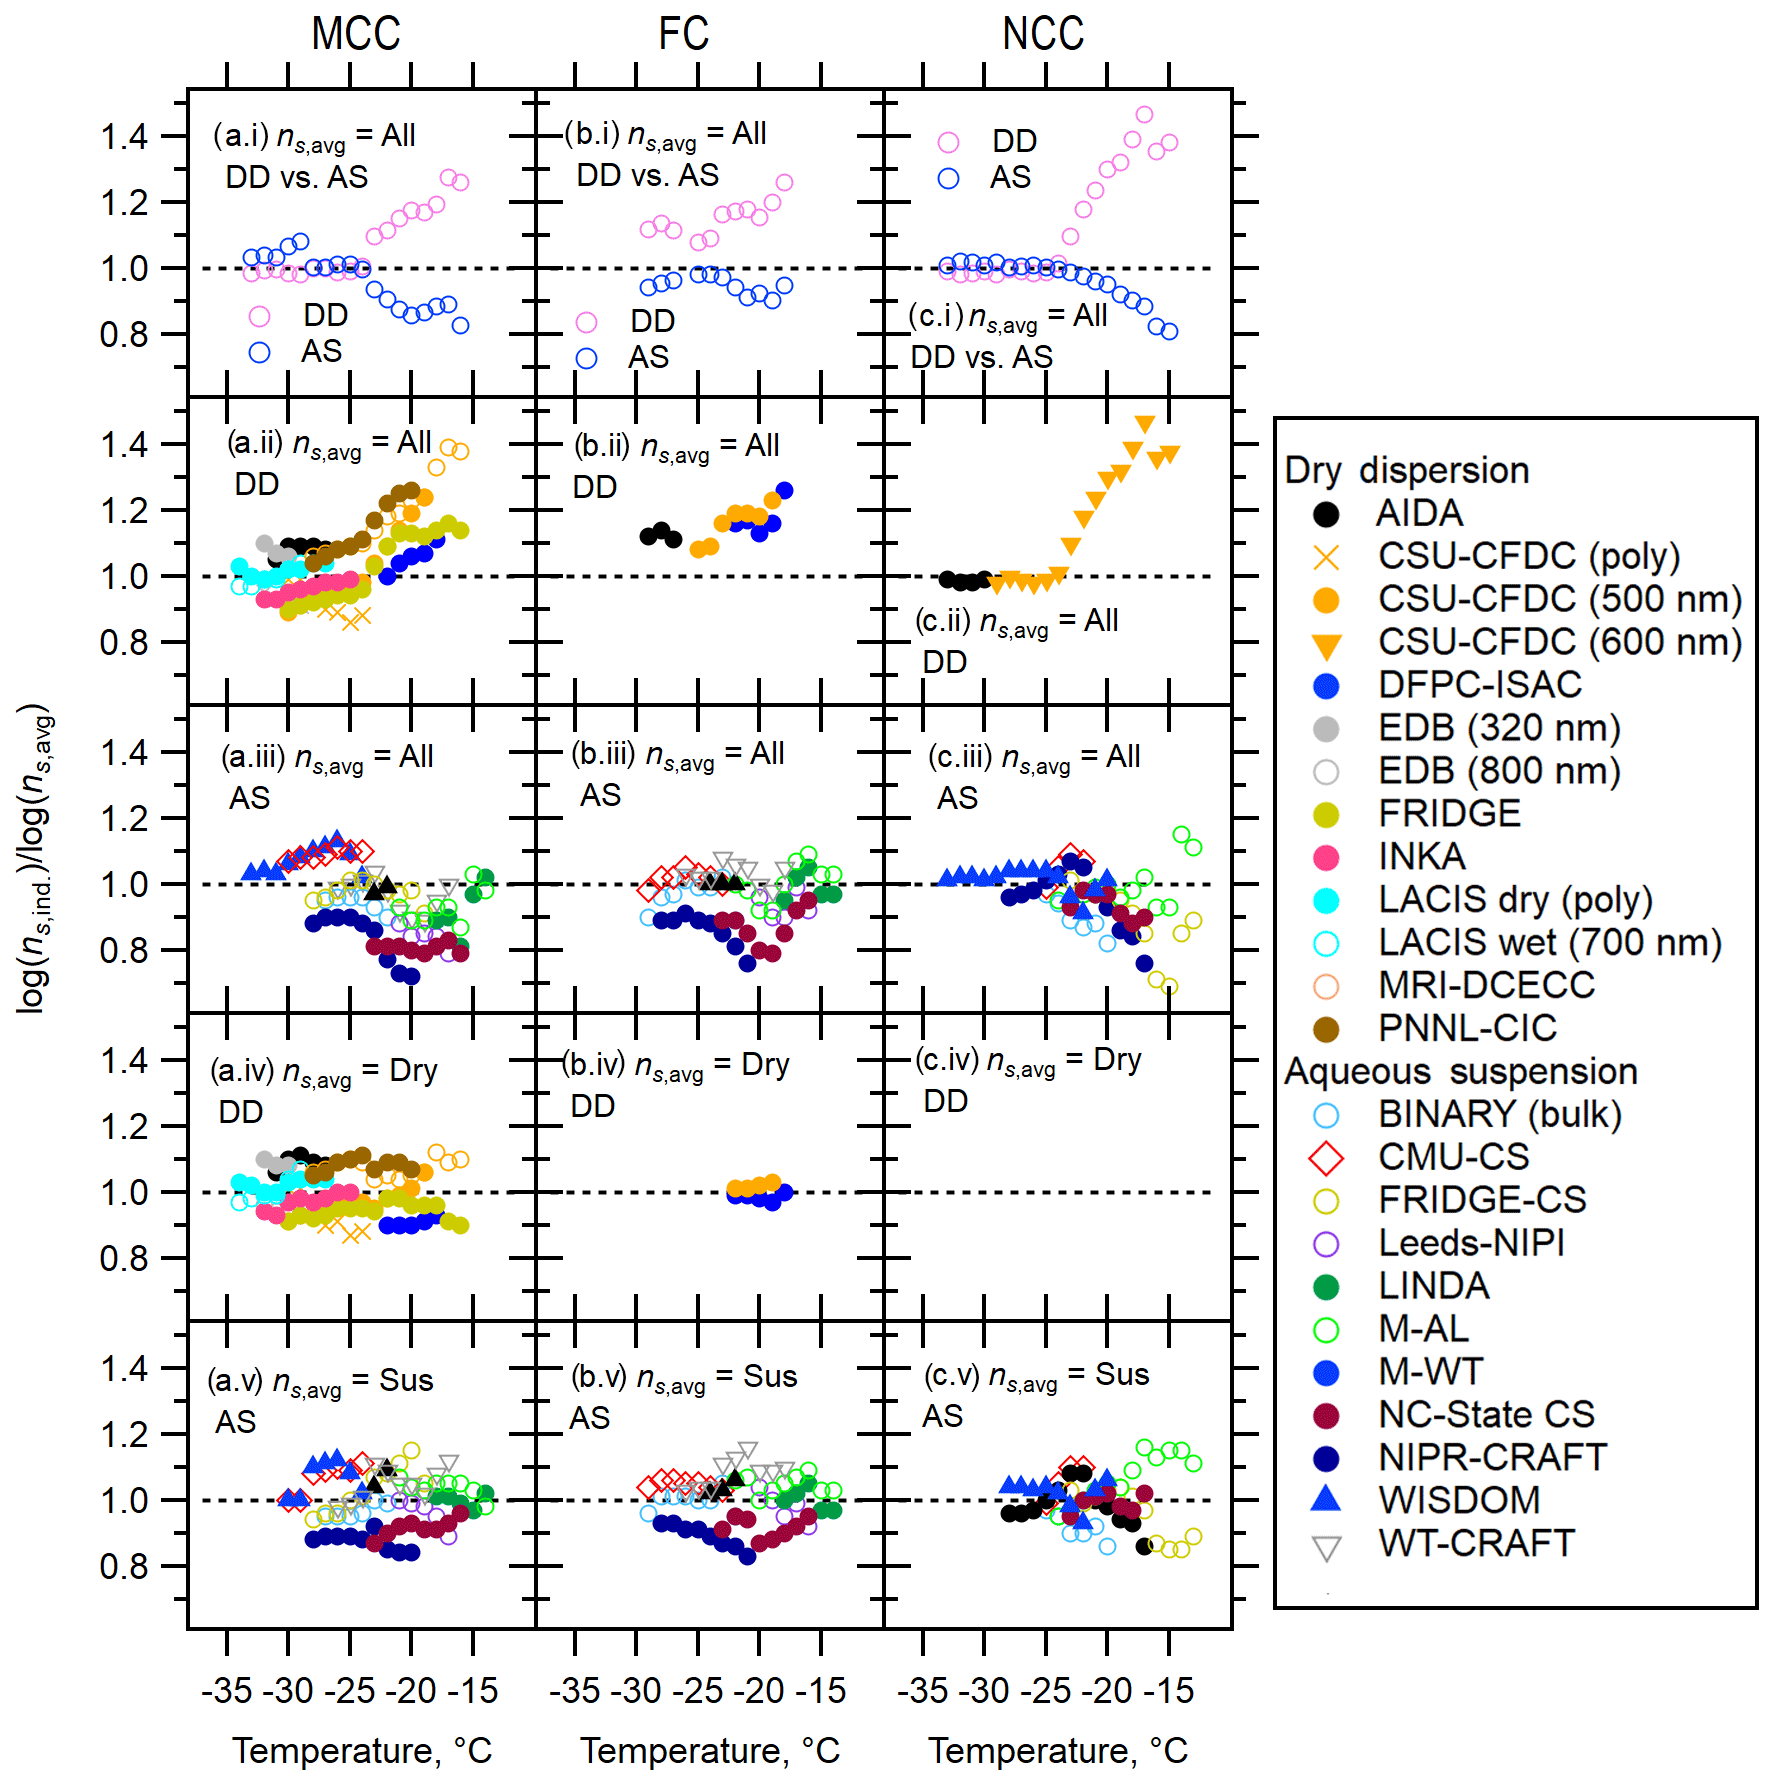
Figure 2T-binned ratios of the interpolated individual measurements to the average of the data, log(, based on the geometric surface area (ns,geo) for MCC (a), FC (b) and NCC (c). T-binned log( values are presented for (a.i–c.i) ratios of the log average to dry dispersion measurements (DD) or aqueous suspension measurements (AS) to the log average to all the data (All), (a.ii–c.ii) ratios of the individual DD measurements to all, (a.iii–c.iii) ratios of the individual AS measurements to all, (a.iv–c.iv) ratios of the individual particle dispersion measurements to DD and (a.v–c.v) ratios of the individual aqueous suspension measurements to AS. The black dotted line represents log(. (c.iv) is left blank since only one dataset is available at each temperature; thereby, no differences can arise.
Next, Fig. 2 depicts the ns,geo(T) diversity in log(), which represents the ratio of the log of individual measurements (ns,ind) to the log average of ns,geo(T) expressed as ns,avg at given temperatures. In other words, this figure provides an overview of the ns,geo(T) deviations across the various techniques employed in this work. These ns ratios are shown for the temperature range covered by at least two measurement techniques used in the present study. In this figure, different panels show three different ns,avg values as denominators, including the average based on all bulk data (all, panels a.i–c.i, a.ii–c.ii and a.iii–c.iii), dry dispersion subgroup (dry, panels a.iv–c.iv), or aqueous suspension subgroup (sus, panels a.v–c.v). As for numerators (ns,ind), the interpolated T-binned data (1 ∘C) from Fig. 1 are used. A total of five panels are presented. First, a summary comparison of two method categories (dry dispersion and aqueous suspension) in a temperature range of −33 ∘C ∘C is given in Fig. 2a.i–c.i. As shown in these panels, data deviation (i.e., scatter from the average log( line) can be seen in both dry dispersion and aqueous suspension measurements. Other panels provide more evidence on the measurement diversity. In short, while the log() values range within 0.8–1.2 for dry dispersion (DD) and aqueous suspension (AS) cases (panels a.iv–c.iv and a.v–c.v), more prominent scatter of the log() values (0.6–1.4) is seen when “all” is used as ns,avg values (panels a.i–c.i, a.ii–c.ii and a.iii–c.iii). Thus, the observed deviation is the largest with ns,avg of all (i.e., both AS and DD). Furthermore, the deviation becomes more apparent towards higher temperatures. This trend persists regardless of sample type. Further discussion on the observed deviations and diversity between dry and aqueous suspension measurement techniques is beyond the scope of this study. Some discussions regarding potential sources and explanations of deviations, which warrant future studies, are given in Sects. S4, S5, S9 and S10.
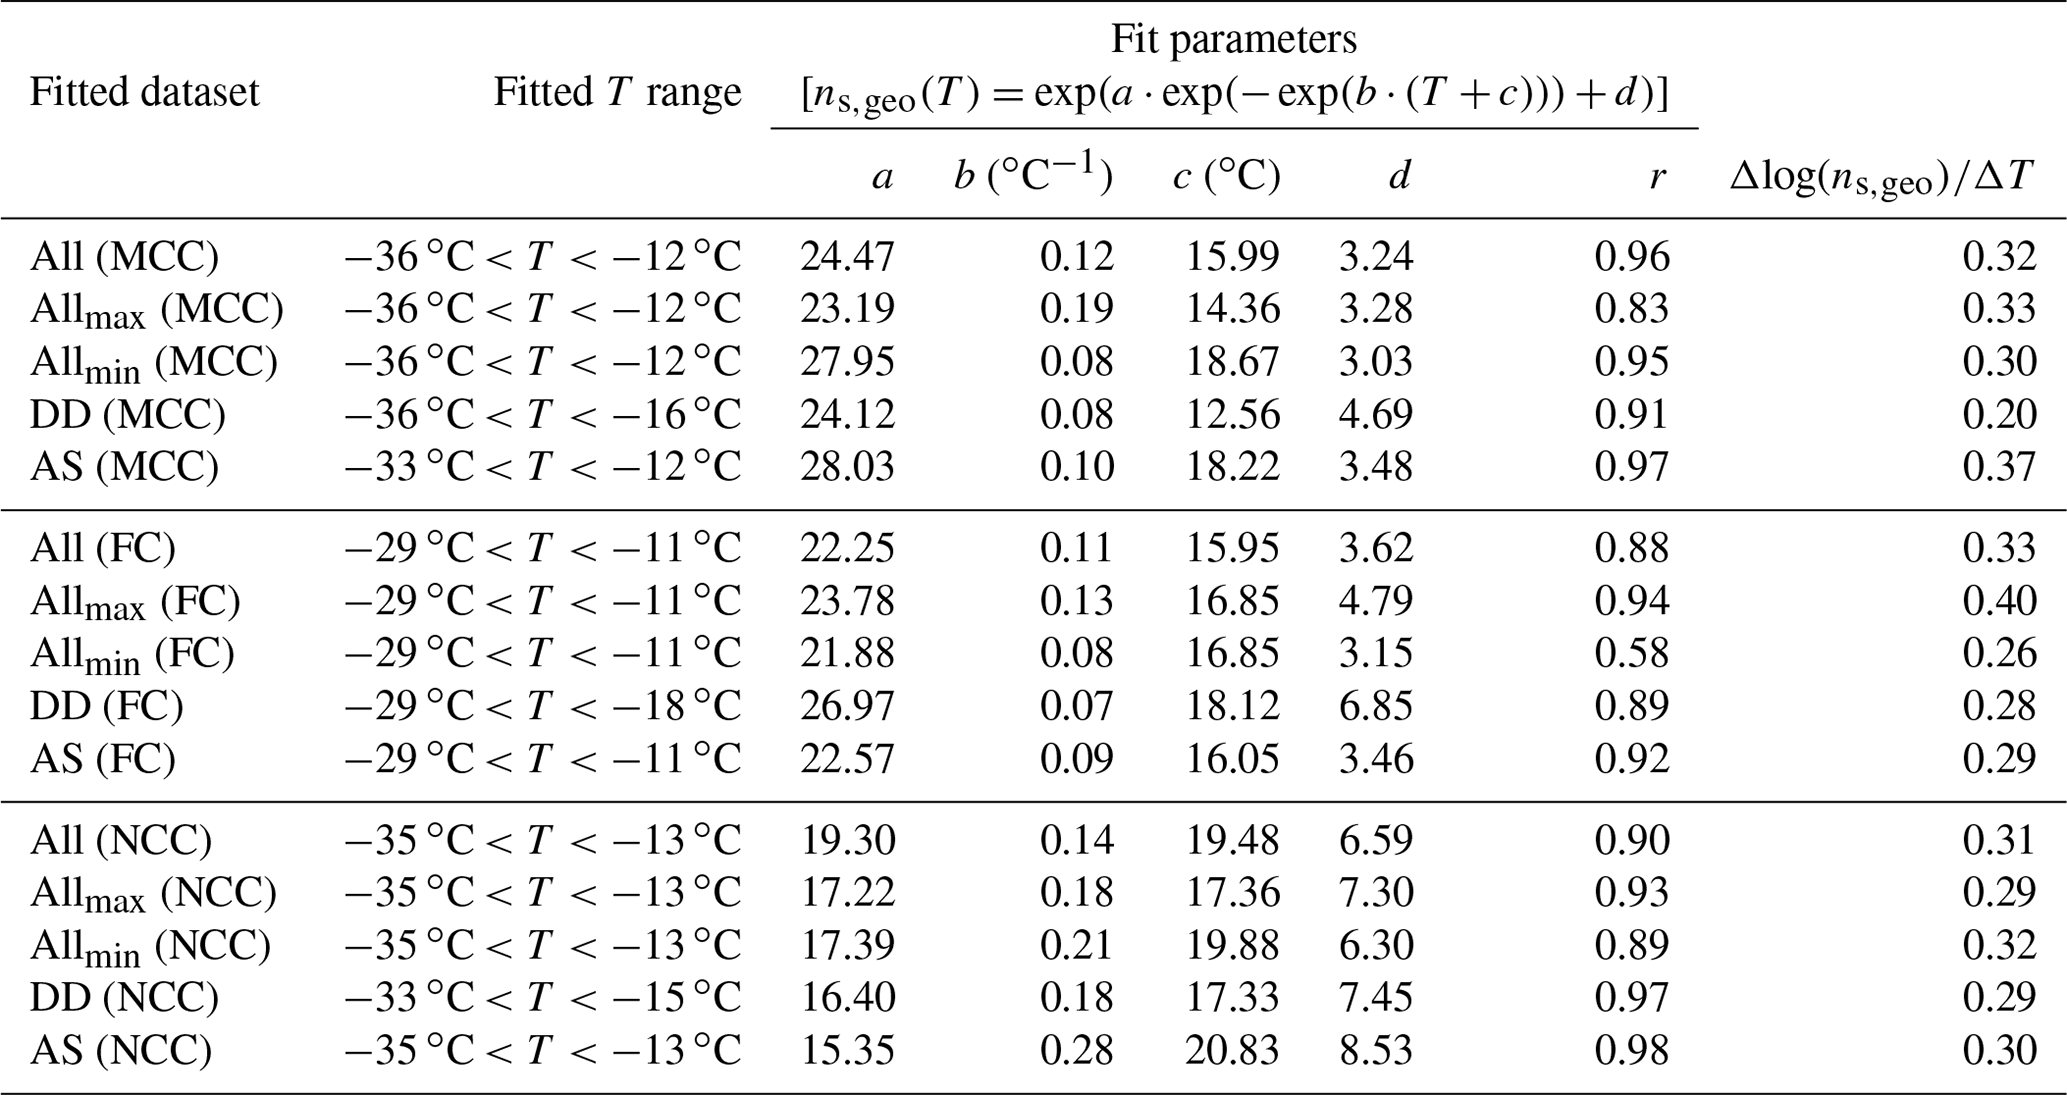
Table 3List of the Gumbel cumulative distribution fit parameters to the ns,geo(T) for T-binned ensemble datasets of MCC, FC and NCC (All). The datasets are fitted in the log space. In addition to all, fit parameters for ensemble maximum values (Allmax), ensemble minimum values (Allmin), suspension subset (AS) and the dry-dispersed particle subset (DD) are also included in this table. The correlation coefficient, r, for each fit is also shown. All ns,geo(T) values are per square meter. T is in degrees Celsius.
4.2 Comparison of three cellulose sample types
The multiple exponential distribution fits (also known as the Gumbel cumulative distribution function) for T-binned data of all three cellulose samples are summarized in Table 3. Fit parameters as well as Δlog(ns)∕ΔT for each category are given in this table. As can be inferred from the table, the overall Δlog(ns)∕ΔT value is almost identical for all three sample types (0.31–0.33) in spite of some deviations observed for the minimum and maximum (0.26–0.40). The observed consistency in the spectral slopes suggests cellulose material exhibits relatively similar ice nucleation above examined temperatures ( ∘C).
For all cellulose types, a reasonable correlation coefficient (r) is found for each technique (i.e., DD and AS), suggesting reasonable agreement and consistency for the results from a similar group of immersion freezing techniques. However, we must reiterate the discrepancy between DD and AS. For instance, our observation of lower values of DD slopes (0.20–0.29) compared to those of AS slopes (0.29–0.37) in the similar temperature range suggests distinct differences between the two subsets of methods. Moreover, the dry-dispersed MCC shows relatively lower Δlog(ns)∕ΔT of 0.20 than FC and NCC (note not all instruments delivered FC and NCC measurements; see Table 2). This exception potentially indicates a fundamental difference of dry-dispersed MCC from other sample types.
Table 4T-binned ns,geo values (per square meter) of three different cellulose samples based on the log average of all available results at T (i.e., Fig. 1a–c.iv)). The first MCC column represents reference immersion freezing ns,geo(T) values for MCC from H15a. The numbers in parentheses are maxima and minima of ns,geo at T. The numbers in brackets represent the number of instruments used to calculate the log average ns,geo at T. The ns,geo(T) values derived from a single instrument are not included in this table.
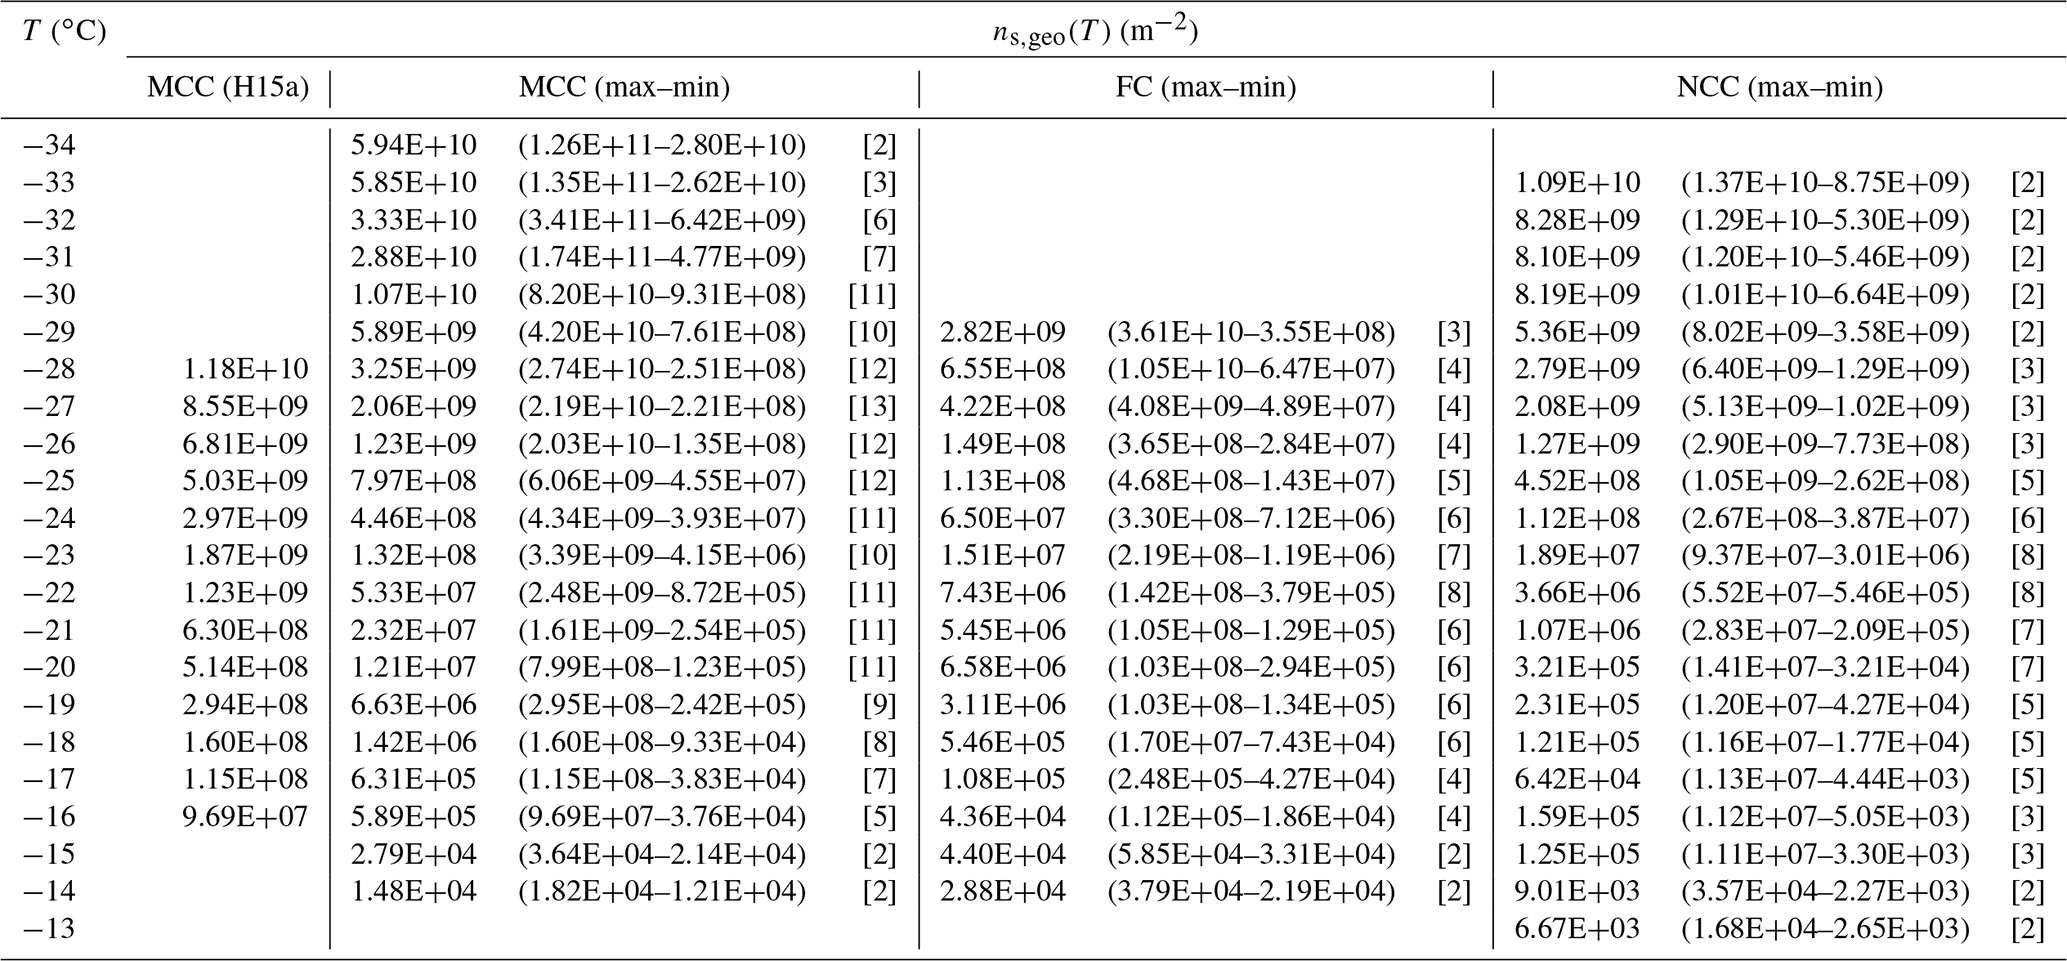
Table 4 provides the log average of T-binned ns,geo(T) values for all of the cellulose samples, representing detailed comparisons of MCC, FC and NCC. Section S6 (Fig. S7) also summarizes the comparison between the averages for each material. As seen in the table and figure, there is a discrepancy between this study and previous work for MCC. At −28 ∘C, for example, our log average ns,geo(T) of MCC (3.25×10⁹ m−2, Table 4) is smaller than the previous MCC result at the same T (1.18×10¹⁰ m−2, H15a). This difference possibly reflects the fact that our average ns,geo(T) includes the results from a multitude of aqueous suspension measurements, which typically fall in the lower range of DD measurements (Sect. 4.1), while H15MCC (Eq. 9) is derived from a dry dispersion method only. Note that the ns,geo(T) maxima from Table 4 reasonably overlap with the H15MCC parameterization.
The highest ns,geo(T) value of the FC experiments (3.6×10¹⁰ m−2 at −29 ∘C from AIDA) is somewhat lower than that of MCC. Similarly, the highest ns,geo(T) value of the NCC experiments (1.5×10¹⁰ m−2 at −35 ∘C from WISDOM) is an order of magnitude lower than that of MCC as well as W15.
Table 4 also implies that MCC possesses higher ice nucleation efficiency relative to the other two types. First, at above −25 ∘C, the immersion freezing ability of MCC typically exceeds that of NCC. Second, at −22 to −24 ∘C, where more than seven instruments are involved to calculate the average T-binned ns,geo(T), the MCC ns,geo(T) is consistently 1 order of magnitude higher than that of FC and NCC. Third, when compared to FC, MCC generally possesses slightly higher ns,geo(T) at T below −16 ∘C. Likewise, a similar trend holds true when we compare MCC to NCC at T below −17 ∘C. The observed difference is up to 2 orders of magnitude at −20 ∘C. Please note that, at the high T region ( ∘C), dry dispersion techniques are not sensitive enough to detect INPs with their experimental parameters used in this study (Tables S1 and S3). In contrast, detecting rare INPs by increasing the concentration of the aqueous particle suspension is advantageous yet also challenging. In other words, the measurement uncertainties generally propagate towards high temperatures because the confidence interval is relatively wider when there are only a few frozen droplets. Hence, our observation of less immersion freezing ability of MCC at this T range (up to a factor of ∼ 20 at −16 ∘C) may not be conclusive. Particle sedimentation, aggregation and the concentrations effect identified by Beydoun et al. (2016) are also more prominent at higher concentration, especially for cellulose samples.
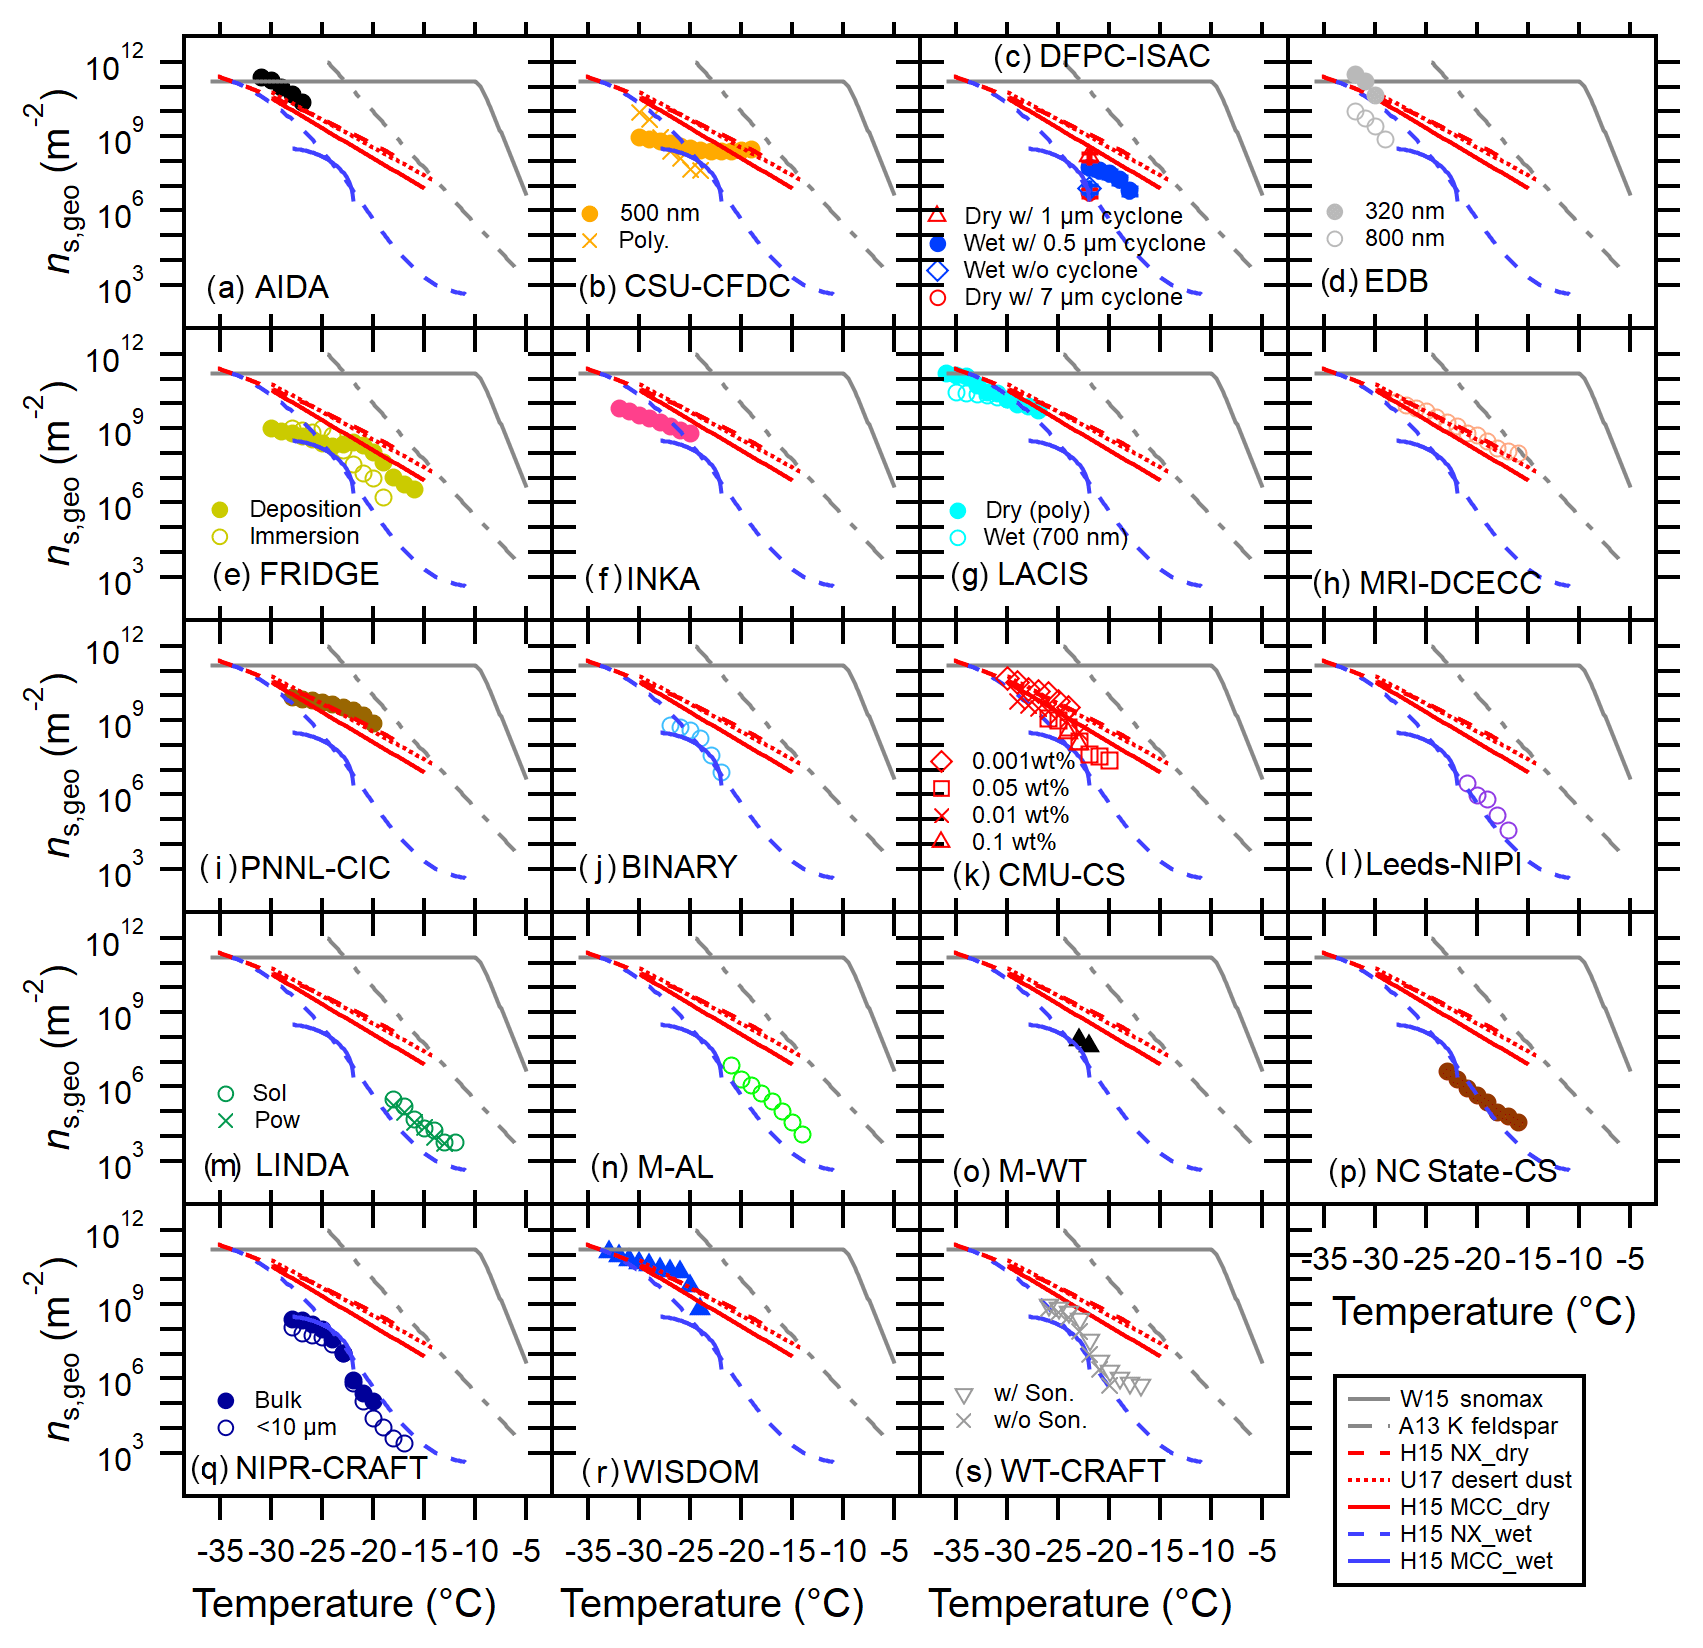
Figure 3Intercomparison of 20 INP measurement methods for MCC using T-binned ns,geo. FRIDGE results of default (solid circles) and imm.mode (open circles) measurements are both presented in (e). Reference immersion freezing ns(T) spectra for MCC (H15a) illite NX (H15b), Snomax (Wex et al., 2015), desert dusts (U17; Ullrich et al., 2017) and K feldspar (A13; Atkinson et al., 2013) are also shown (see Sect. 3.2). Both aqueous suspension and dry dispersion results of FRIDGE are presented in panel e.
4.3 Individual immersion freezing measurements
All individual ns,geo(T) spectra of MCC, FC and NCC from each technique are shown in Figs. 3, 4 and 5, respectively. Only brief remarks regarding each technique are summarized below. Several special experiments were carried out using seven techniques to complement our understanding of cellulose ice nucleation. The results from these unique experiments are first described (Sect. 4.3.1–4.3.7) followed by the other remarks (Sect. 4.3.8–4.3.19).

Figure 4Intercomparison of 12 INP measurement methods for FC using T-binned ns,geo. Reference immersion freezing ns(T) spectra are provided as in Fig. 3.
4.3.1 CSU-CFDC
Immersion freezing ability of both polydisperse and quasi-monodisperse dry-dispersed MCC particles was characterized by CSU-CFDC (Colorado State University – Continuous Flow Diffusion Chamber). In short, ice-nucleating efficiencies of differential mobility analyzer (DMA) size-selected MCC particles (500 nm mobility diameter) were compared to those of the polydisperse population for immersion freezing experiments.
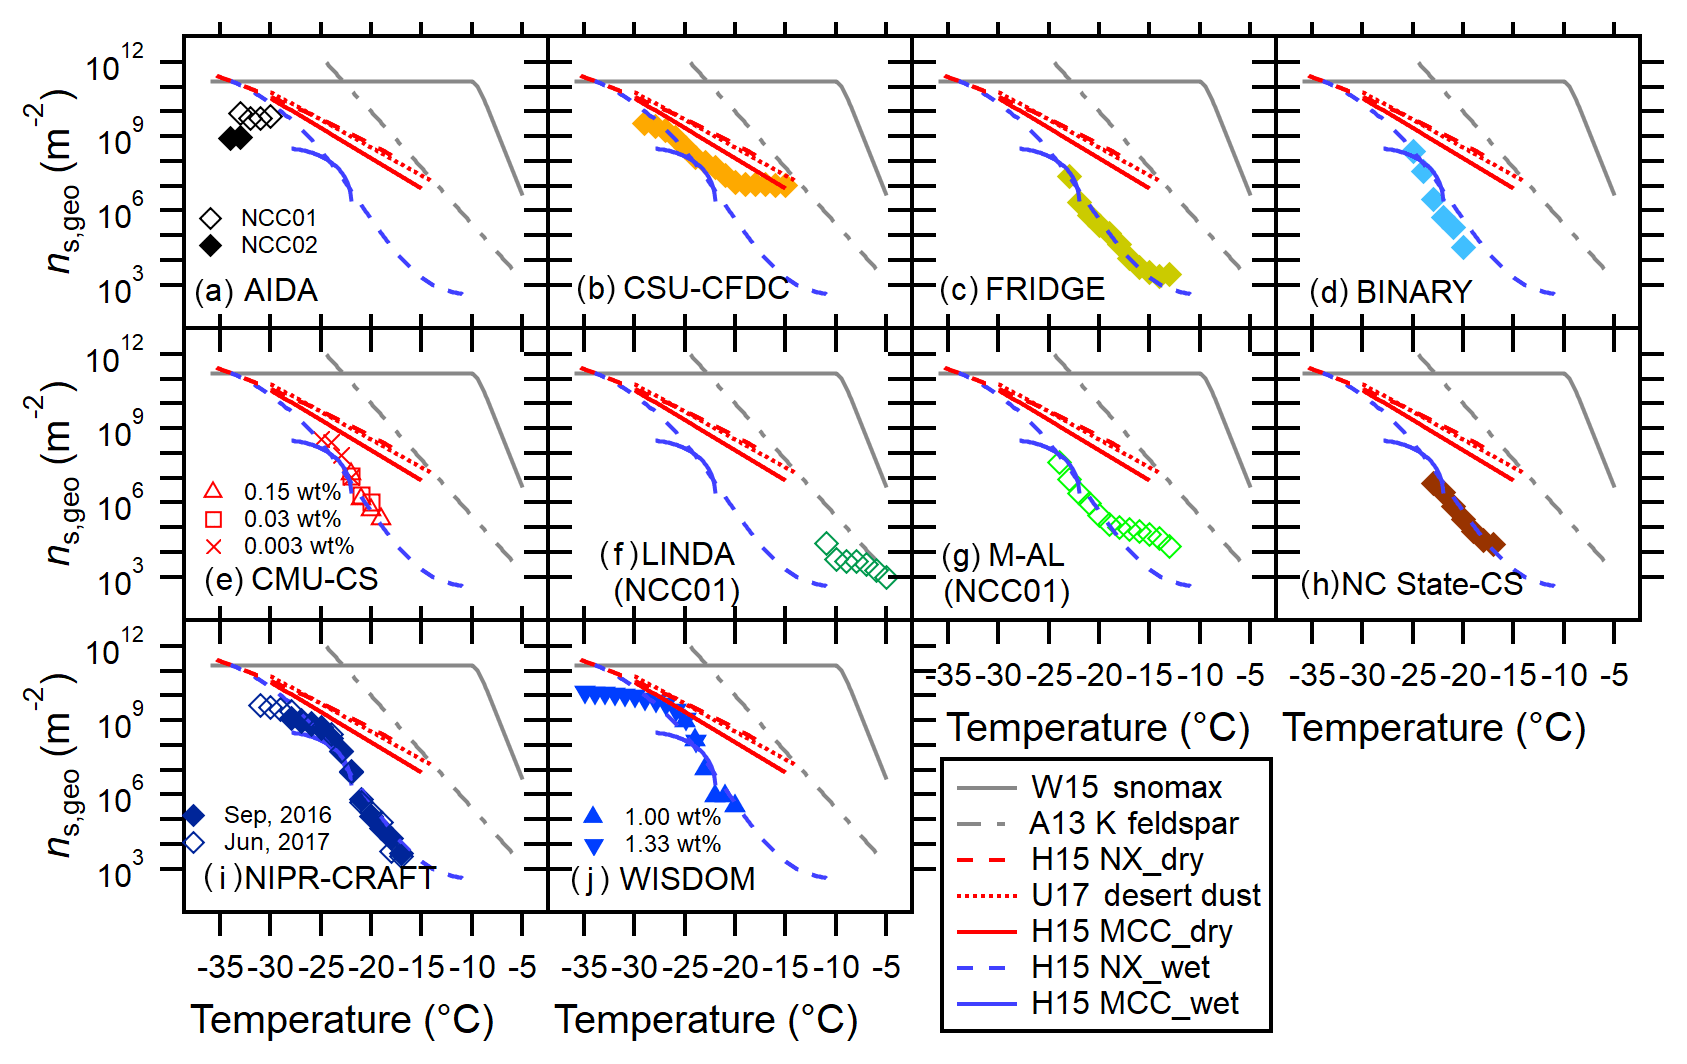
Figure 5Intercomparison of 11 INP measurement methods for NCC using T-binned ns,geo. Reference immersion freezing ns(T) spectra are provided as in Fig. 3. Note that unless otherwise specified, the data are for NCC02.
As seen in Fig. 3b, the discrepancy between the results from two populations is substantial. Similar to the LACIS result, a weak temperature dependence of ns,geo(T) of monodisperse MCC particles is observed within defined experimental uncertainties (Table S1). Observed quasi-flat of the monodisperse case suggests a weak T dependence of immersion freezing ability of a given specific size of MCC particles for the investigated temperature range. Conversely, a polydisperse spectrum, which represents the result of an ensemble of different MCC particle sizes, shows a stronger trend of the slope towards a low T segment, suggesting a nonuniform distribution of active sites over the available Stotal of cellulose in this study. Some previous INUIT studies demonstrated the size independence of the ns,geo(T) value using submicron hematite and illite NX particles based on AIDA ice nucleation experiments (Hiranuma et al., 2014, 2015b). Such a characteristic may not remain true for the immersion mode freezing of supermicron-sized fiber particles.
For all sample types, as seen in Figs. 3b, 4b and 5b, the CSU-CFDC results do not agree well with H15a (MCC_dry, Eq. 8). Instead, they virtually agree with the wet generation results. This is especially true for the results with polydisperse population. Note that formerly observed agreement within a factor of 3 in ns,geo(T) estimation (cloud simulation chamber INAS > CSU-CFDC INAS; DeMott et al., 2015) is seen only at −30 ∘C. The observed discrepancy may be due to nonuniform active site density for different sizes. Another possible explanation may be due to the alternation of cellulose physicochemical properties perhaps upon humidification during shipping, causing behavior more like aqueous suspended particles. One thing that we need to keep in mind is that the CFDC uses a 2.4 µm particle impactor at its inlet (Table S3). Because of the impactor, there is loss of larger particles. Thus, the ns,geo(T) results may vary, possibly due to the difference in the size of cellulose samples examined. At −23 ∘C, where the data of size-selected measurements exist for all three cellulose samples, CSU-CFDC show (Figs. 3b, 4b and 5b).
4.3.2 DFPC-ISAC
The DFPC-ISAC (Dynamic Filter Processing Chamber – Institute of Atmospheric Sciences and Climate) instrument (Santachiara et al., 2010) provided data for condensation and immersion freezing. The use of 103 % RHw in this investigation was optimized to count statistically significant amounts of INPs in this system for examined cellulose particles (i.e., MCC and FC). With this system, we assessed the IN efficiencies of different sizes of MCC and FC particles generated by means of different cyclone cut sizes (0.5, 1.0, 7.0 µm or none). Further, both dry-dispersed (dry) and nebulizer-generated particles (wet) were systematically assessed for their INP activities. Without an exception, INP concentrations were measured at −22 ∘C for all specimens. For the case of particles (<0.5 µm cyclone-selected), we additionally measured INP concentrations at −18 ∘C to assess the general trend of the INP activated as a function of T. This particular case was selected for the extended study due to the similarity of their geometric SSAs to those of the AIDA cloud parcel simulation measurements. In addition, while collecting the cellulose particles on nitrate membrane filters (Millipore, 0.47 µm pore size) used for IN assessment, parallel measurements of particle size distributions using an optical particle counter (Grimm, 1.108) were carried out. The results of size distributions, represented by the SSA values, are summarized in Table 5.
Table 5Summary of the geometric SSA of MCC and FC particles assessed by DFPC-ISAC. In general, high SSA values indicate the presence of small grains because the relative dominance of the mass to the surface becomes small.

For dry, increasing the cut size tends to decrease the SSA value, implying large particles come through, and the dominance of the mass relative to the surface becomes significant. This observation is valid as the cyclone is used to remove particles larger than the designated cut size. Regardless of whether using the cyclone or not, particle sizes out of the nebulizer generation are somehow comparable to those of dry dispersion with a cyclone of 1 µm cut size. The observed difference between wet and dry is indicative of the changes in particle size and morphology while drying atomized particles from a suspension of the powder in water as described in Sect. S2.
Figures 3c and 4c show all the results of INP measurements by DFPC-ISAC. For MCC, the interpolated DFPC results of the immersed particles (<0.5 µm cyclone-selected) fall in the middle of FRIDGE (FRankfurt Ice Nuclei Deposition FreezinG Experiment) results that two different modes for −22 ∘C ∘C. More interestingly, the slope of the DFPC ns,geo(T) spectrum () represents the median of the slopes of FRIDGE measurements (i.e., 0.17 for default mode and 0.31 for immersion mode). This observation is consistent with other results of (1) size-selected particles tend to exhibit a gentle slope (similar to the observations from CFDC and LACIS) and (2) nebulizer-generated techniques tend to result in a deteriorated INP activity (H15b).
Another important implication of the DFPC results is that submicron dry particles show the highest INP efficiencies, which practically lie on ns,geo(T) data points of H15a parameterization at a given T for both MCC and FC. Moreover, inclusion of supermicron sizes (no cyclone or 7 µm) seems to reduce IN efficiencies of both MCC and FC. Further investigation is required to interpret these results.
Over the temperature range of −18 to −22 ∘C, the DFPC results of immersed particles (<0.5 µm cyclone-selected), show (Figs. 3c and 4c). Note that appears to be slightly higher than . This observation is not consistent with the general trend of (Sect. 4.2). However, the observed difference is only a factor of <2 on average.
4.3.3 FRIDGE
The FRIDGE (FRankfurt Ice Nuclei Deposition FreezinG Experiment) data were derived from both default mode (a combination of deposition, condensation ice nucleation and immersion freezing at RHw of 101 %) and immersion mode operation for MCC. With these two different operational modes, FRIDGE investigated the ice nucleation ability of both dry and droplet-suspended particles deposited on a substrate. In particular, the default mode operation of FRIDGE provided data from −16 to −30 ∘C (MCC) by scanning RHice and RHw (low to high) at a constant temperature. Accordingly, ice crystals formed at the highest RHw of 101 % were considered to be a measure of immersion Nice from dry-dispersed particle measurements. Likewise, the immersion mode operation of FRIDGE provided data from −19 to −28 ∘C (MCC) and from −13 to −23 ∘C (NCC). As demonstrated in H15b, this immersion mode counts immersion freezing of suspended particles in which the particles are first washed into droplets and then placed on the substrate to be comparable to the dry dispersion method. Hence, this method is advantageous to collect a filter sample of cellulose, prepared the same way as in the dry dispersion experiment and then run it on a cold stage.
Figure 3e shows the comparison of ns,geo(T) derived from the two different operation modes of FRIDGE. There are a few important implications from the FRIDGE results. First, on average, the measurements with dry particles in the “default” setting showed more than an order of magnitude higher ns,geo(T) in comparison to the immersed particles in FRIDGE experiments at ∘C. As shown in Fig. 3e, the deposition mode data suggest that ns,geo(T) values for −22 ∘C ∘C are close (within a factor of 2) to those from MRI-DCECC, in which experiments were carried out with a high degree of particle agglomeration. In comparison to the default mode result, FRIDGE experiments in the pure immersion mode showed much lower ns,geo(T) than that with the default setting but agreed with other immersion datasets. Second, a steeper of 0.31 was found for the measurements with immersed particles at ∘C when compared to the slope of the deposition mode data (i.e., 0.17). As a temperature shift (i.e., shifting the data a few degrees Celsius) does not offset the discrepancy, other mechanistic interpretations might be plausible causes of this discrepancy. For instance, this difference may be a consequence of the different IN efficiencies of nucleation modes of both experimental approaches (e.g., deposition + condensation + immersion vs. immersion alone) in the examined temperature range, the different sample preparation processes, effects of agglomeration or a combination of the three. The divergence of default mode and cold-stage (CS) mode becomes notable at ∘C, perhaps suggesting the effect of agglomeration. Specifically, agglomeration may take place inside the pipetted droplets. While pipetting agglomeration and separation are avoided by shaking the sample, but during cooling it lasts 15–30 min until a droplet freezes.
Figure 5c presents the summary of FRIDGE-CS measurements for NCC. The ns,geo(T) spectrum nearly overlaps with the H15b (illite NX wet) reference spectrum. It also agrees well with the other droplet freezing instruments CMU-CS, NIPR-CRAFT (National Institute of Polar Research – Cryogenic Refrigerator Applied to Freezing Test), NCS-CS, BINARY (Bielefeld Ice Nucleation ARraY) and WISDOM. Similar ns,geo(T) values were obtained, although the methods analyzed droplets of different volumes. In particular FRIDGE and WISDOM ns,geo(T) agree with each other by better than 0.3 ∘C. By comparing NCC to MCC at −23 ∘C ∘C, the FRIDGE-CS results show for > 1 order of magnitude throughout this overlapping T range. Note that the value of NCC (0.40) is somewhat higher than the average slope parameters listed in Table 3.
4.3.4 LACIS
With LACIS (Leipzig Aerosol Cloud Interaction Simulator), we examined immersion mode freezing of both atomized and dry-dispersed MCC particles separately. For atomized particle generation, particles were dried in a diffusion dryer directly after spraying the suspension. Succinctly, LACIS measured immersion ice nucleation ability of atomizer-generated MCC particles for 700 nm mobility diameters in the temperature range of −35 ∘C ∘C. The selection of this relatively large size was necessary to obtain a signal above the limit of detection in the system. The experiments with dry-dispersed MCC were performed with polydisperse MCC particles for −36 ∘C ∘C. Note that a cyclone was used in the air stream of LACIS (Table S3).
Generally, LACIS measurements with dry dispersed MCC particles are in agreement with those from H15a as apparent in Fig. 3g (ns,geo (−30 ∘C) m−2). Furthermore, LACIS measurements down to −36 ∘C with dry polydisperse MCC particles show that (=0.17, Table S1) is identical to MRI-DCECC for −28 ∘C ∘C. Contrastively, the slope of the spectrum for 700 nm size-segregated MCC particles (=0.05) is considerably lower than that of the polydisperse case. This slope of the LACIS ns,geo(T) spectrum is parallel to that of the CSU-CFDC spectrum (dry-dispersed 500 nm case, slope = 0.05 for −30 ∘C ∘C; Fig. 3b). Thus, though we cannot certainly define the relative importance of the aerosol generation method (e.g., the changes in physicochemical properties of particles occurred during atomization as prescribed in Sect. S2), the aerosol size might have a non-negligible impact on the variation in spectral slopes. Therefore, the immersion freezing efficiency of MCC particles is likely different for differently sized MCC particles, meaning that a single ns,geo(T) curve cannot be reported for MCC. With this, the method of accounting for differences in surface area between different groups and methods becomes questionable for a complex system like cellulose. Furthermore, its complex morphology (see Sect. S5) causes the determination of the surface area to be quite prone to errors which can be a reason for the observed differences in ns,geo(T). The ns framework must be rigorously tested with more empirical data. Nevertheless, for LACIS, both polydisperse and quasi-monodisperse MCC particles exhibit similar ns,geo(T) values above −30 ∘C (e.g., ns,geo (−30 ∘C) m−2 in Fig. 3g), suggesting a negligible size dependency of ns,geo(T) for MCC particles in this temperature range.
4.3.5 LINDA
LINDA (LED-based Ice Nucleation Detection Apparatus), a vial-based immersion freezing assay, was utilized to compare the freezing activity of bulk suspension (0.1 wt % cellulose in NaCl solvent) to that of dry powders individually suspended in each vial (sus vs. pow henceforth). Such a comparison was carried out to ensure that employing different methods of vial preparation did not impede ice nucleation of cellulose samples, including MCC and FC. For the latter procedure (pow), pre-weighed cellulose powders (0.2 mg) were directly poured into 200 mg (199.8 µL) of 0.1 % NaCl solution to realize the concentration of cellulose in each vial to be equivalent to 0.1 wt %, such that two procedures became comparable. We note that all vials, regardless of the procedure, were sonicated (46 kHz) for 5 min prior to each LINDA measurement. Note that we used non-sterile NCC (NCC01) for the IN characterization with LINDA.
The results of MCC and FC are shown in Figs. 3m and 4g. The results suggest similarity of ns,geo(T) within the experimental uncertainties of LINDA (Stopelli et al., 2014) for the range of examined temperatures (−7 to −18 ∘C). Further, the slope of LINDA ns,geo(T) spectra of 0.29 is identical for both scenario cases (i.e., sus and pow). Hence, for a given mass concentration of 0.1 wt %, both vial preparation procedures seem valid. Nonetheless, suspended cellulose powders settle rapidly in both cases, implying the necessity of taking great care when measuring INP activity of supermicron-sized particles with the ∼ 200 µL vial-based assay.
For −18 ∘C ∘C, the LINDA results (bulk suspension) show with similar (0.29–0.30), verifying comparable performance of this vial-based technique to other suspension methods (Figs. 3m and 4g).
Figure 5f shows the freezing spectrum of NCC01 with the slope parameter of 0.21. The observation of higher activity of NCC01 compared to MCC and FC implies possible inclusion of INA materials in the original 3 % solution of NCC01. The source is not known, and the source identification is beyond the scope of this work. The sample stability of another NCC sample from another batch, NCC02, is discussed in Sect. 4.3.6.
4.3.6 NIPR-CRAFT
NIPR-CRAFT (National Institute of Polar Research – Cryogenic Refrigerator Applied to Freezing Test), a suite of cold stage instruments, offered the immersion freezing measurements of all three cellulose samples using droplets with volumes of 5 µL. This microliter range volume was the largest amongst all aqueous suspension techniques employed within this work. Such a large drop volume advantageously enables high-resolution immersion freezing analysis for a wide range of temperatures (−31 ∘C ∘C). The highest freezing temperatures are attained with the largest droplets, which contain the largest surface area of cellulose.
By means of Stokes law gravity differential settling (Tobo, 2016), <10 µm MCC and FC particles of were extracted to generate droplets containing size-segregated cellulose samples. These droplets were subsequently assessed on NIPR-CRAFT, estimating an immersion freezing ability of MCC and FC with a SSA of 3.35 m2 g−1 (the AIDA-derived geometric SSA value, accounting for only <10 µm particles). Afterwards, the obtained results of <10 µm were compared to those of bulk (SEM-based SSA of 0.068–0.087 m2 g−1). Furthermore, we facilitated NIPR-CRAFT for the quality check of the NCC sample over time. Expressly, we stored NCC02 at 4 ∘C for 9 months and made follow-up measurements to examine the potential decay of the samples, potentially altering its immersion freezing.
Figures 3q and 4k show the NIPR-CRAFT results for MCC and FC. In general, the NIPR-CRAFT data represent the lower boundary of compiled ns,geo(T) spectra defined by the bulk of the instruments (Fig. 2a.iii and 2b.iii). Constant offset between NIPR-CRAFT and the log average of AS methods in ns,geo(T) is seen at −28 ∘C ∘C for on average a factor of >9 for MCC and >2.7 for FC. Immersion freezing abilities of bulk and size-segregated samples are in agreement within the measurement uncertainties. The spectral slopes for bulk MCC and FC are 0.41 and 0.39, respectively, and are in agreement with WT-CRAFT (West Texas A&M University – Cryogenic Refrigerator Applied to Freezing Test) (measurements with 3 µL sonicated samples), indicating the presence of systematic error (e.g., temperature shift towards the low end). The spectral slopes for size-segregated MCC and FC are 0.43 and 0.34, respectively, and are in agreement with bulk NIPR-CRAFT.
Figure 5i shows time trials of NCC02 and similarity in IN activity over 9 months. As inferred from the overlapped spectra, the influence of the decay over time is negligible. Over time, the spectral slopes and ns,geo(T) remain similar, indicating high stability of NCC02.
For investigated temperatures listed in Table 2, the bulk NIPR-CRAFT results show (Figs. 3q and 4k). Corresponding values are similar (0.41 for MCC and 0.39 for FC) but notably higher than any averaged slope parameters listed in Table 3. With an even higher slope value of 0.50, the values exceed both and at T below −20 ∘C (Fig. 5i).
4.3.7 WT-CRAFT
The WT-CRAFT (West Texas A&M University – Cryogenic Refrigerator Applied to Freezing Test) system, which is a replica of NIPR-CRAFT (Tobo, 2016), measured the freezing abilities of droplets containing 0.05–0.0005 wt % MCC and FC at ∘C. WT-CRAFT also examined if the pre-treatment of aqueous suspension (i.e., sonication of 50 mL falcon tube for 15 min) has any influence on IN efficiency of MCC and FC. More specifically, we compared the IN efficiency of 49 drops made out of the sonicated suspension containing a given percentage by weight of MCC and FC to those of non-sonicated suspension left idle for at least 60 min.
The results are shown in Figs. 3s and 4l. As seen in these figures, early freezer only appears in the case of pre-application of sonication. This trend is especially notable for the MCC case. As a result, the difference of the spectral slope for MCC deviates from 0.36 (sonicated case) to 0.52 non-sonicated case). Importantly, our results suggest that MCC may suffer more from the particle settling in the suspension when compared to FC for examined ranges of temperature and percentage by weight. Nevertheless, the difference in ns,geo(T) is within a factor of 4 at the most, which is well within our experimental uncertainty (see Table S2).
Below −22 ∘C, WT-CRAFT shows (Figs. 3s and 4l). The MCC result exhibits a sharper increase in ns,geo(T) within the limited temperature range with a of 0.36 than FC ().
4.3.8 AIDA
The AIDA (Aerosol Interaction and Dynamics in the Atmosphere) cloud simulation chamber facility at KIT represents the world's foremost facility for studying ice clouds in a controlled setting. As shown in Fig. 2, for all cellulose types, the AIDA data hover in the upper bound of the comprehensive ns,geo(T) spectrum defined by the bulk of the instruments. The corresponding log is within 1.2. The spectral slope for immersion freezing of cellulose from AIDA varies depending on the sample type. For MCC, is 0.24 and equivalent to that of H15a (MCC, dry, Eq. 8). The larger slope value is found for FC (0.47), which is practically parallel to A13 (0.45), and deviates from other DD instruments ( of 0.28). But the ns,geo(T) data of FC from AIDA are in fair agreement with the log ns,geo(T) average for examined T. Finally, the NCC02 results agree well with CSU-CFDC and WISDOM. Observed quasi-flat of NCC02 (0.04) suggests a weak T dependence of immersion freezing ability for the investigated temperature range. In addition, similar to the observation made by LINDA, higher activity of NCC01 compared to NCC02 is seen in Fig. 5a. This difference suggests the inclusion of INA materials in the original 3 % solution of NCC01 (the source is not known). For investigated temperatures listed in Table 2, AIDA shows and (Figs. 3a, 4a and 5a; see also Sect. S7).
4.3.9 EDB
EDB (electrodynamic balance) contact freezing experiments have been performed with MCC particles preselected in the DMA at two electrical mobility diameters: 320 and 800 nm. Due to the low concentration (typically less than 30 cm−3) of the MCC particles produced by the dry dispersion method (a turbulent flow disperser, Table S3), and relatively low IN efficacy of MCC particles, the measurements of ec were possible only in a limited temperature range between −29 and −32 ∘C. A strong asphericity of the MCC particles contributes to the uncertainty of ns,geo(T) determination, which differs by 2 orders of magnitude for particles with mobility diameters of 320 and 800 nm. An additional uncertainty factor is the unknown portion of the MCC particle submersed in water upon contact with the supercooled droplet (kimm; see Eq. 2). We set kimm=1, thus giving a lower estimate of the possible ns,geo(T) value. On the whole, the contact INAS density falls nicely within the range of ns,geo(T) values measured by other instruments but does not exceed H15MCC parametrization for dry NCC particles. This is not very surprising given the experimental uncertainties of the EDB-based method.
4.3.10 INKA
INKA (Ice Nucleation Instrument of the Karlsruhe Institute of Technology; Schiebel, 2017) is a cylindrical continuous flow diffusion chamber built after the design of the CSU-CFDC (Richardson, 2010), but with a prolonged residence time of the sample (Chen et al., 2000). Using INKA, we studied the condensation and immersion freezing of MCC, which was dry dispersed into a 4 m3 stainless steel tank using the same procedure as for the AIDA experiments. No additional impactor was used at the INKA inlet.
The aerosol freezing ability was measured from −32.5 to −25 ∘C for increasing relative humidity from well below liquid water saturation to about 110 % RH in a total of eight scans. Data reported in this paper were interpolated at a relative humidity of 107 %, taking into account that the nominal relative humidity for CFDCs has to be above 100 % in order to enable full aerosol activation (DeMott et al., 2015; Garimella et al., 2017). INKA measured ice nucleation surface site densities, which are close to the average of all measured data (see Fig. 2). The results match the data measured by the CSU-CDFDC for polydisperse aerosol, with slightly less pronounced temperature dependence.
4.3.11 MRI
The MRI (Meteorological Research Institute) cloud simulation chamber experiments were conducted to demonstrate that MCC particles can act as efficient immersion freezing nuclei in simulated supercooled clouds. The evacuation rate corresponded to the updraft velocity of 5 m s−1. Dry MCC powders were dispersed by a rotating brush generator (PALAS, RBG1000) and injected into the ventilated 1.4 m3 chamber vessel. Using the data from six experiments, we calculated the ice-nucleation-active surface-site densities of aerosolized cellulose in the temperature range from −15 to −30 ∘C. The regression line for the experimental data is with a correlation coefficient of 0.84. As shown in Figs. 2 and 3h, for the dry MCC type, the MRI cloud simulation chamber data exist in the upper bound of the comprehensive ns,geo(T) spectrum.
4.3.12 PNNL-CIC
At PNNL-CIC (Pacific Northwest National Laboratory – Compact Ice Chamber) immersion freezing properties of size-selected MCC samples at a temperature ranging from −20 to −28 ∘C were investigated. The chamber was operated at RH %, and the evaporation section of the chamber was maintained at aerosol lamina temperature. The uncertainty (±0.5 ∘C) in the aerosol lamina temperature was calculated based on aerosol lamina profile calculations. ns,geo(T) calculations were performed using immersion freezing frozen fraction and surface area of MCC particles. The ns,geo(T) values varied from 1×10⁸ to 1×10⁹ m−2. (=0.13, Fig. 3i) agreed well with that of the U17 dust parameterization in the same temperature range.
4.3.13 BINARY
The three different cellulose types were investigated with the BINARY (Bielefeld Ice Nucleation ARraY) setup (Budke and Koop, 2015), and their sample preparation is described in Table S4. We note that the original MCC and FC data are those published in H15a, i.e., before the recommended suspension preparation procedure was developed. As described in H15a these bulk suspensions suffered from sedimentation and hence are not predestined for a ns,geo(T) intercomparison. The original raw data from H15a were re-analyzed here in order to have the same 1 ∘C binning and averaging as other techniques. Moreover, a different background correction was applied, also to the NCC samples: the first 5 % and last 5 % of nucleation data points in a given frozen fraction curve (i.e., the data smaller than 0.05 and greater than 0.95 in FF) were excluded in order to account for a concentration variation between individual droplets due to sedimentation and for nucleation events triggered by the glass substrate or impurities in the “pure” water background.
For −25 ∘C ∘C, the bulk BINARY data for the different cellulose samples are in a similar active site range, i.e., the results show (Figs. 3j, 4d and 5d). At −25 ∘C the MCC and FC data show a rapid change in slope and at a lower temperature they level off at a ns,geo(T) value of about 108 m−2, which may be due to the sedimentation of cellulose particles with lower ice nucleation activity as discussed above. In contrast, no such change in slope is observed for NCC (which did not suffer from apparent sedimentation), thus consistent with higher values observed below −25 ∘C in small-droplet experiments and with dry suspension techniques. Moreover, above −25 ∘C the NCC data agree well with other large-volume droplet experiments such as NIPR-CRAFT and NC-State CS as well as with small-droplet techniques such as WISDOM. In summary, these observations imply that techniques using large droplets may suffer from sedimentation if the suspended material consists of particles with a wide size distribution. However, if smaller and homogeneous particles are suspended they give results similar to small-droplet techniques.
4.3.14 CMU-CS
The immersion freezing ability of a wide range of aqueous suspension concentrations and immersion freezing temperatures was measured by CMU-CS (Carnegie Mellon University – cold stage; Polen et al., 2016, 2018; Beydoun et al., 2017). This cold stage device facilitates the sampling of drops within a squalene oil matrix that allows for experiments using varied percentage by weight of the cellulose test samples (0.001 to 0.15 wt %) for this study. Drops containing MCC, FC and NCC02 were studied at a cooling rate of 1 ∘C min−1 to determine the immersion freezing temperature spectrum.
A total of 10 immersion mode freezing experiments with a droplet volume of 0.1 µL were performed. Using this instrument, a wide range of temperatures were investigated ( ∘C) yielding ns,geo(T) values ranging from 105 to 1010 m−2. The data from the 10 individual runs collapsed into a single ns,geo(T) spectrum, suggesting that the mass loading of dust in the droplet did not affect the measurements for the percentage by weight values investigated. For MCC, the data are in fair quantitative agreement with the H15a (dry MCC) parameterization at temperatures below −25 ∘C. The ns,geo(T) values of both FC and NCC are about 1 order of magnitude lower than the MCC ns,geo(T) values, agreeing with a general trend and overlapping with the wet MCC reference curve.
Remarkably, the CMU-CS data show that the value of for MCC (=0.20, Table S2) is the least amongst the aqueous suspension techniques and the closest to the results of the bulk dry techniques (the DD slope = 0.20, Table 3), potentially suggesting a similar and more atmospherically representative experimental condition (less particle inclusion in a single droplet) when compared to other aqueous methods.
At −25 ∘C, where the immersion freezing abilities of all three cellulose samples were assessed, the CMU-CS result shows (Figs. 3k, 4e and 5e). Note that MCC and FC exhibit broad ns,geo(T) spectra with the values of 0.20 (MCC) and 0.34 (FC), detecting ice nucleation at ∘C, whereas the NCC spectrum spans a limited T range (−25 ∘C ∘C) with the value of 0.51. The observed widening of the spectra and detection temperature sensitivity suggests that supermicron-sized particles have increased diversity in immersion freezing compared to submicron particles.
4.3.15 Leeds-NIPI
µL-NIPI (Nucleation by Immersed Particles Instrument) is a droplet freezing device which controls the temperature of 1 µL water droplets supported on a hydrophobic glass slide and monitors freezing in those droplets (Whale et al. 2015). For this study, 0.1 wt % suspensions of FC and MCC cellulose were made up in Milli-Q water by stirring for 30 min in glass vials. The suspensions were then stirred continuously while 1 µL droplets were pipetted onto a hydrophobic glass slide using an electronic pipette. Droplets were then cooled from room temperature (∼18 ∘C) at a rate of 1 ∘C min−1 until they froze, with freezing being monitored by a digital camera. A gentle flow of dry nitrogen was passed over the droplets to ensure that ice did not grow across the hydrophobic slide and cause unwanted droplet freezing. Temperature error for the instrument has been estimated at ±0.4 ∘C, and ns,geo(T) error bars were calculated by propagating the uncertainties from droplet volume and weighing of the cellulose and water. The instrument has a freezing background, likely caused by minor impurities in the Milli-Q water or on the hydrophobic slide. A background subtraction is performed to account for any freezing caused by this background (O'Sullivan et al., 2015); however the freezing reported here occurred at sufficiently high temperatures such that they did not overlap with the background freezing. For investigated temperatures listed in Table 2, Leeds-NIPI shows , but the values are on average a factor of 2 higher than across the investigated T range (Figs. 3l and 4f). The values for MCC and FC are 0.47 and 0.57, respectively.
4.3.16 M-AL
For investigating the immersion freezing of droplets containing cellulose particles we have utilized two independent contact-free drop levitation methods in our laboratory at the Johannes Gutenberg University of Mainz, Germany. One of them is M-AL (Mainz – acoustic levitator), which was placed inside a walk-in cold room where the ambient temperature was set to be −30 ∘C. After introducing single drops into M-AL the drops were cooling down (at a continuously varying cooling rate) adapting their surface temperature to the ambient temperature. The size of the levitated drops was approx. 2 mm, which was determined for each drop from the images captured by a digital video camera attached to the M-AL. Such large droplet size enabled the direct measurement of the surface temperature during the experiments with means of an infrared thermometer, therefore reducing the error in temperature originating from indirect determination of droplet temperature. The onset of freezing was characterized by a sudden increase in the surface temperature caused by the latent heat released during nucleation. The freezing temperatures of 100 drops were measured for each cellulose sample (MCC, FC and NCC) at two distinct concentrations, 1.0 and 0.1 wt %. Due to the relatively large droplet size a wide range of temperatures was covered (−13 to −23 ∘C), yielding ns,geo(T) values ranging from 104 to 107 m−2. The NCC sample we obtained for investigation was contaminated by mold; therefore the ns,geo(T) deviates significantly from other techniques at temperature above −20 ∘C (see Fig. 1c.iii). For investigated temperatures listed in Table 2, M-AL shows and (Figs. 3n, 4h and 5g). For example, at −17 ∘C, the ns,geo(T) values of MCC, FC and NCC are 2.54×10⁵, 2.48×10⁵ and 8.28×10⁴ m−2. The values vary for 0.28 (FC) −0.40 (MCC), with the spectral parameter of NCC (0.31) falling around the middle.
4.3.17 M-WT
The main facility of our laboratory at the JGU Mainz is the M-WT (Mainz – wind tunnel) in which atmospheric hydrometeors can be freely suspended in the updraft of the tunnel at temperatures down to −30 ∘C. Since all hydrometeors (from cloud droplets of a few tens of micrometers to large hailstones with sizes of several centimeters) can be freely floated at their terminal falling velocities, the relevant physical quantities, as for instance the Reynolds number and the ventilation coefficient, are equal to those in the real atmosphere.
The immersion freezing measurements in the M-WT have been conducted under isothermal conditions. The air was cooled down to a certain temperature between −20 and −25 ∘C and at that temperature the frozen fraction of water droplets containing MCC or FC was measured by investigating typically 50 droplets a day. The drop temperatures were determined from the continuously recorded air temperature and humidity (Diehl et al., 2014; Pruppacher and Klett, 2010). The size of the droplets was calculated from the vertical air speed, which can be measured with high accuracy in the M-WT (Diehl et al., 2014). Due to the small droplet size and the applied INP concentration (0.1 wt %) a relatively narrow temperature range could be investigated, yielding ns,geo(T) values ranging from 106 to 108 m−2. Over −23 ∘C ∘C, M-WT shows (Figs. 3o and 4i). Corresponding values are 0.26 for MCC and 0.48 for FC.
4.3.18 NC State-CS
Across investigated temperatures ( ∘C), results from the NC State-CS (North Carolina State University – cold stage) show that INAS is indistinguishable between FC, MCC and NCC for all temperatures within experimental uncertainty, except for ∘C where is less than that of FC and MCC. Overall, the NCC spectrum is narrower than the FC and MCC spectra, suggesting that the distribution of active sites for NCC is slightly more homogenous. The data connect with the parameterization at ∘C but fall below ∼1 order of magnitude at ∘C. The data intersect with the parameterization in the ∘C range. However, the has a steeper slope with temperature and thus overpredicts and underpredicts at lower and higher temperatures, respectively (see also Sect. S8).
4.3.19 WISDOM
Over the investigated temperature range given in Table 2, WISDOM (WeIzmann Supercooled Droplets Observation on Microarray) shows (Figs. 3r and 5j). The MCC result exhibits a broader spectrum with of 0.26 than NCC (). The observed relation between widening of spectra and increased ns,geo(T) suggests that supermicron-sized particles have increased diversity in immersion freezing compared to submicron particles. Looking at the overall NCC data (Fig. 1c.iii), nearly all aqueous suspension techniques, independently of the drop volume, agree with the WISDOM data and all point towards the AIDA data. We remark that the WISDOM team followed the suggested sample handling details described in Sect. 3.1.
This paper presents the immersion freezing efficiencies of cellulose particles of three different types evaluated by a total of 20 IN instruments at supercooled temperature conditions. Three cellulose samples examined in this study showed a propensity to nucleate ice, and their ice nucleation activity is comparable to that of another test system (i.e., illite NX) that we have previously evaluated. On average, supermicron-sized cellulose samples are more ice active than the nanocellulose samples at a T lower than −20 ∘C, although the difference is not apparent for all temperatures when considering experimental uncertainty.
Our work also provides a comprehensive dataset of experimental variables in INP measurement techniques to complement our insufficient knowledge regarding inter-method diversity that, when filled, will enhance the credibility of our experiments to evaluate INP abundance in the atmosphere. Strikingly, our results indicate that the overall diversity derived from comparing techniques is significant when compared to the individual uncertainties of each instrument.
The observed diversity amongst measurement techniques for cellulose is larger than that observed for a mineralogically heterogeneous illite NX sample described in our previous intercomparison study (H15b). For illite NX, the deviations in temperature (−36 ∘C ∘C) are within 8 ∘C (H15b) while they span 10 ∘C for cellulose. For ns,geo(T), while the span in results covers a maximum of 3 orders of magnitude for illite NX, they span 4 orders of magnitude for cellulose. These diversities suggest the complex surface structure and compositional heterogeneity may play a substantial role in explaining the diversity. This also implies that the cellulose system might not be suitable as a calibrator at this stage unless we completely understand the complex properties of different cellulose materials.
In conclusion, we have shown that several types of cellulose have the capacity to nucleate ice as efficiently as some mineral dust samples. Given cellulose within plant residue is present in the atmosphere, it represents a poorly characterized non-proteinaceous INP type. While the diverse instruments employed in this study agree in that cellulose has the capacity to nucleate ice, their quantitative agreement is poor. Unfortunately, it is not possible yet to say what the cause of this disagreement is. We suggest a number of topics that future studies could address in order to better understand and resolve this discrepancy (Sects. S4, S5, S9 and S10). Nevertheless, we show that cellulose has the potential to be an important atmospheric ice-nucleating particle and more work is warranted. Our knowledge of non-proteinaceous biological INPs is still limited. Thus, it is important to further conduct comprehensive studies on the ice nucleation activity of other important plant structural materials, such as cellulose polymorphs, lignin materials, lipids, carbohydrates and other macromolecule saccharides (e.g., Pummer et al., 2012; Dreischmeier et al., 2017; Suski et al., 2018), as well as natural plant debris in simulated supercooled clouds of the lower and middle troposphere. Such additional studies are especially important for assessing the overall role of non-proteinaceous bio-INPs in clouds and the climate system.
Within the framework of INUIT, we established a new community database including the laboratory results on ice nucleation with access for registered users. The tabulated data are available in a publically accessible MySQL portal at https://imk-aaf-s1.imk-aaf.kit.edu:8081/inuit/ (KIT-INK-AAF, 2019). This database helps the users to evaluate and interpret the comprehensive laboratory ice nucleation results measured over the past years. It also provides a good basis for a database with a wider public access. All data associated with this study will be made available without any barriers to the user. But, please first contact Ottmar Möhler (ottmar.moehler@kit.edu). Any disputes about the use of other groups' data, particularly with respect to publications, will be resolved by the INUIT coordinators.
The supplement related to this article is available online at: https://doi.org/10.5194/acp-19-4823-2019-supplement.
JC and OM proposed the framework of this collaborative multi-institutional laboratory work. The overall paper, coordinated and led by NH, was a collaborative effort of the partners of the INUIT group and associated partners. NH and OM conceived the AIDA experiments, analyzed and discussed the results, and contributed to the AIDA text. KS and GPS performed CFDC experiments and KS, GPS and PJD analyzed CFDC experimental data. MP performed the DFPC experiments and analysis with the support of AN. He also contributed to the data elaboration. FB and GS contributed to the design of the cellulose aerosol generation systems and data elaboration. FB oversaw the DFPC ice nucleation measurements. DW performed the FRIDGE experiments and contributed to the associated data analysis with the support of HB. TS and KH performed and analyzed INKA experiments. SG performed the LACIS measurements and data evaluation, which were coordinated and overlooked by HW. KY, TT, AS and MM performed MRI cloud simulation chamber experiments and contributed to the associated data analysis in collaboration with OM and NH. GK carried out the PNNL-CIC experiments and data analysis. EJ and TK designed the BINARY experiments, which were performed by EJ. CB, EJ and TK analyzed and discussed the data, and EJ and TK contributed the associated text. MP, HB and RCS performed the CMU-CS experiments and their analysis. YT and KMC performed the NIPR-CRAFT experiments. TFW performed muL-NIPI experiments. TFW and BJM analyzed and discussed the data and contributed the associated text. ES conducted the measurements with LINDA with the support of FC. MS, OE and AM performed the M-AL and M-WT measurements and evaluated and discussed the experimental results, and they contributed to the associated text. HT and MDP coordinated and carried out the NC State-CS experiments. MT helped with initial data processing. MDP performed the final data processing and contributed the associated text. NR, YR and BB performed and analyzed WISDOM experiments; LS designed the freezing detection program and helped with the data analysis. CLW and KMC designed and performed the WT-CRAFT experiments and contributed to the associated data analysis and text under the guidance of NH. JS and HCC conducted single-particle mass spectrometric laboratory measurements. AZ, KS and DMB performed the miniSPLAT and multidimensional characterization experiments and accompanying data analysis. For offline microscopy, KA performed electron microscopy and image analyses. RU contributed to the database work. All authors discussed the results and contributed to the final version of the paper.
The authors declare that they have no conflict of interest.
This article is part of the special issue “Results from the ice nucleation research unit (INUIT) (ACP/AMT inter-journal SI)”. It is not associated with a conference.
INUIT (Ice Nuclei research UnIT) is a multi-institutional project (FOR1525, https://www.ice-nuclei.de/, last access: 20 March 2019) funded by the German Research Foundation (DFG). The objective of INUIT is to comprehensively study the atmospheric heterogeneous ice formation with collaboration among various research institutions. All INUIT members and associated partners acknowledge Birte Hülsen und Susanne Staechelin for central coordination and administration of the INUIT research unit. We thank Shaul Lapidot, Clarite Azerraf and Melodea Ltd. for providing the NCC samples for this research.
The AIDA team (Ottmar Möhler and Naruki Hiranuma) and the INKA team (Kristina Höhler and Thea Schiebel) acknowledge the IMK-AAF engineering and infrastructure group (Georg Scheurig, Rainer Buschbacher, Tomasz Chudy, Olga Dombrowski, Jens Nadolny, Frank Schwarz and Steffen Vogt) for their continued support throughout INUIT-1 and INUIT-2. The CSU-CFDC team (Kaitlyn Suski, Gregg P. Schill and Paul J. DeMott) acknowledges the US National Science Foundation (NSF) for support from grant AGS1358495. Gregg P. Schill additionally acknowledges support from NSF postdoctoral grant AGS1433517. The CNR-ISAC team acknowledges funding for their research from the European Union's Seventh Framework Programme FP7-ENV-2013 project BACCHUS (grant no. 603445) and Franco Corticelli (Institute for Microelectronics and Microsystems IMM-CNR) for SEM observations. The FRIDGE group acknowledges funding by DFG in the Research Unit FOR 1525 (INUIT) under BI 462/3-2. For the LACIS work, Heike Wex was funded within the INUIT subproject WE 4722/1-2. The MRI cloud simulation chamber experiments were partly supported by JSPS KAKENHI grant numbers 23244095 and 17H00787. Support of the PNNL-CIC work for Gourihar Kulkarni was provided by the U.S. Department of Energy (DOE) Office of Biological and Environmental Research (OBER) Atmospheric Research Systems Program (ASR). The Pacific Northwest National Laboratory is operated for DOE by Battelle Memorial Institute under contract DE-AC05-76RLO 1830. In addition, Ottmar Möhler, Naruki Hiranuma and Gourihar Kulkarni acknowledge the EMSL general use grant (proposal ID 49077) for supporting the PNNL-CIC work. The BINARY group (Carsten Budke, Evelyn Jantsch and Thomas Koop) acknowledges funding from DFG under the INUIT subproject KO 2944/2-2 and also acknowledges Sabine Robrecht, who designed and performed experiments that contributed to the development of the recommended suspension preparation protocol. The CMU-CS team (Michael Polen, Hassan Beydoun, and Ryan C. Sullivan) was supported by the National Science Foundation (grant number CHE-1554941, and a graduate research fellowship for Michael Polen). The NIPR-CRAFT experiments were partly supported by JSPS KAKENHI grant numbers 15K13570 and 16H06020. Kimberly M. Cory and Naruki Hiranuma thank the NSF-EAPSI for the validation of NCC as well as microscopy characterization of our cellulose samples conducted in collaboration with Yutaka Tobo and Kouji Adachi in Japan. The Leeds group thanks the European Research Council (ERC, 240449 ICE; 632272 IceControl; 648661; MarineIce; 713664 CryoProtect) and the Natural Environment Research Council (NERC, NE/I019057/1). The part of the research based on LINDA measurements was supported by the Swiss National Science Foundation (SNF) through grant nos. 200021_140228 and 200020_159194. For M-AL and M-WT, Miklós Szakáll and Amelie Mayer acknowledge support from Deutsche Forschungsgemeinschaft (DFG) under contract SZ260/4-2 within Research Unit INUIT (FOR 1525). The NC State group (Hans Taylor and Markus D. Petters) acknowledges funding from NSF-AGS 1450690. The NC State group thanks Danielle Dillane, Mary Hester, Chris Rohrbach, Margaret Scott, Hannah Tekleab and Mark Wu for their help with collecting the raw data. The WISDOM team (Yinon Rudich and Naama Reicher) gratefully acknowledge support from the Ice Nuclei Research Unit (INUIT) of the DFG, The Helen Kimmel Center for Planetary Sciences and the DeBotton center for Marine Sciences. Naruki Hiranuma and Craig L. Whiteside thank the HEAF and Killgore research grant for the development and implementation of WT-CRAFT. This material is based upon work supported by the U.S. Department of Energy, Office of Science, Office of Biological and Environmental Research (DE-SC0018979).
For offline mass spectrometry, Johannes Schneider and Hans-Christian Clemen acknowledge funding from DFG under the INUIT subproject SCHN 1138/2-2. Additional support (Alla Zelenyuk, David M. Bell, Kaitlyn Suski) was provided by the U.S. Department of Energy (DOE) Office of Biological and Environmental Research (OBER) Atmospheric Research Systems Program (ASR). Part of the research was performed using EMSL, a DOE Office of Science User Facility sponsored by the Office of Biological and Environmental Research and located at Pacific Northwest National Laboratory.
For offline microscopy, Kouji Adachi thanks the Global Environment
Research Fund of the Japanese Ministry of the Environment (2-1703) and JSPS
KAKENHI (grant numbers JP16K16188, JP15H02811 and JP16H01772). Naruki Hiranuma thank
Soeren Zorn and Konrad Kandler for a useful discussion regarding
potential artifact analyses at the initial stage.
The article processing charges for this open-access
publication were covered by a Research
Centre of the Helmholtz Association.
This paper was edited by Barbara Ervens and reviewed by two anonymous referees.
Atkinson, J. D., Murray, B. J., Woodhouse, M. T., Carslaw, K., Whale, T. F., Baustian, K., Dobbie, S., O'Sullivan, D., and Malkin, T. L.: The importance of feldspar for ice nucleation by mineral dust in mixed-phase clouds, Nature, 498, 355–358, https://doi.org/10.1038/nature12278, 2013.
Aulin, C., Ahola, S., Josefsson, P., Nishino, T., Hirose, Y., Österberg, M., and Wågberg, L.: Nanoscale cellulose films with different crystallinities and mesostructures – their surface properties and interaction with water, Langmuir, 25, 7675–7685, https://doi.org/10.1021/la900323n, 2009.
Battista, O. A. and Smith, P. A.: Microcrystalline cellulose, Ind. Eng. Chem., 54, 20–29, https://doi.org/10.1021/ie50633a003, 1962.
Belosi, F. and Santachiara, G.: Ice-formation nuclei in Antarctica: new and past measurements Atmos. Res., 145, 105–111, https://doi.org/10.1016/j.atmosres.2014.03.030, 2014.
Beydoun, H., Polen, M., and Sullivan, R. C.: Effect of particle surface area on ice active site densities retrieved from droplet freezing spectra, Atmos. Chem. Phys., 16, 13359–13378, https://doi.org/10.5194/acp-16-13359-2016, 2016.
Beydoun, H., Polen, M., and Sullivan, R. C.: A new multicomponent heterogeneous ice nucleation model and its application to Snomax bacterial particles and a Snomax-illite mineral particle mixture, Atmos. Chem. Phys., 17, 13545–13557, https://doi.org/10.5194/acp-17-13545-2017, 2017.
Boucher, O., Randall, D., Artaxo, P., Bretherton, C., Feingold, G., Forster, P., Kerminen, V.-M., Kondo, Y., Liao, H., Lohmann, U., Rasch, P., Satheesh, S. K., Sherwood, S., Stevens, B., and Zhang, X. Y.: Clouds and Aerosols, in: Climate Change 2013: The Physical Science Basis. Contribution of Working Group I to the Fifth Assessment Report of the Intergovernmental Panel on Climate Change, edited by: Stocker, T. F., Qin, D., Plattner, G.-K., Tignor, M., Allen, S. K., Boschung, J., Nauels, A., Xia, Y., Bex, V., and Midgley, P. M., Cambridge University Press, Cambridge, United Kingdom and New York, NY, USA, 571–657, 2013.
Brinchi, L., Cotana, F., Fortunati, E., and Kenny, J. M.: Production of nanocrystalline cellulose from lignocellulosic biomass: technology and applications, Carbohyd. Polym., 94, 154–169, https://doi.org/10.1016/j.carbpol.2013.01.033, 2013.
Brunauer, S., Emmett, P. H., and Teller, E.: Adsorption of gases in multimolecular layers, J. Am. Chem. Soc., 60, 309–319, https://doi.org/10.1021/ja01269a023, 1938.
Budke, C. and Koop, T.: BINARY: an optical freezing array for assessing temperature and time dependence of heterogeneous ice nucleation, Atmos. Meas. Tech., 8, 689–703, https://doi.org/10.5194/amt-8-689-2015, 2015.
Burkert-Kohn, M., Wex, H., Welti, A., Hartmann, S., Grawe, S., Hellner, L., Herenz, P., Atkinson, J. D., Stratmann, F., and Kanji, Z. A.: Leipzig Ice Nucleation chamber Comparison (LINC): intercomparison of four online ice nucleation counters, Atmos. Chem. Phys., 17, 11683–11705, https://doi.org/10.5194/acp-17-11683-2017, 2017.
Chawla, P. R., Bajaj, I. B., Survase, S. A., and Singhal, R. S.: Microbial cellulose: Fermentative production and applications, Food Technol. Biotech., 47, 107–124, 2009.
Chen, Y., DeMott, P. J., Kreidenweis, S. M., Rogers, D. C., and Sherman, D. E.: Ice formation by sulfate and sulfuric acid aerosol particles under upper-tropospheric conditions, J. Atmos. Sci., 57, 3752–3766, https://doi.org/10.1175/1520-0469(2000)057<3752:IFBSAS>2.0.CO;2, 2000.
Connolly, P. J., Emersic, C., and Field, P. R.: A laboratory investigation into the aggregation efficiency of small ice crystals, Atmos. Chem. Phys., 12, 2055–2076, https://doi.org/10.5194/acp-12-2055-2012, 2012.
DeMott, P. J., Prenni, A. J., McMeeking, G. R., Sullivan, R. C., Petters, M. D., Tobo, Y., Niemand, M., Möhler, O., Snider, J. R., Wang, Z., and Kreidenweis, S. M.: Integrating laboratory and field data to quantify the immersion freezing ice nucleation activity of mineral dust particles, Atmos. Chem. Phys., 15, 393–409, https://doi.org/10.5194/acp-15-393-2015, 2015.
DeMott, P. J., Hill, T. C. J., Petters, M. D., Bertram, A. K., Tobo, Y., Mason, R. H., Suski, K. J., McCluskey, C. S., Levin, E. J. T., Schill, G. P., Boose, Y., Rauker, A. M., Miller, A. J., Zaragoza, J., Rocci, K., Rothfuss, N. E., Taylor, H. P., Hader, J. D., Chou, C., Huffman, J. A., Pöschl, U., Prenni, A. J., and Kreidenweis, S. M.: Comparative measurements of ambient atmospheric concentrations of ice nucleating particles using multiple immersion freezing methods and a continuous flow diffusion chamber, Atmos. Chem. Phys., 17, 11227–11245, https://doi.org/10.5194/acp-17-11227-2017, 2017.
Diehl, K., Mitra, S. K., Szakáll, M., Blohn, N. V., Borrmann, S., and Pruppacher, H. R.: Chapter 2, Wind Tunnels: Aerodynamics, Models, and Experiments, in: The Mainz Vertical Wind Tunnel Facility: A Review of 25 Years of Laboratory Experiments on Cloud Physics and Chemistry, edited by: Pereira, J. D., Nova Science Publishers, Inc., Hauppauge, NY, USA, 2011.
Diehl, K., Debertshäuser, M., Eppers, O., Schmithüsen, H., Mitra, S. K., and Borrmann, S.: Particle surface area dependence of mineral dust in immersion freezing mode: investigations with freely suspended drops in an acoustic levitator and a vertical wind tunnel, Atmos. Chem. Phys., 14, 12343–12355, https://doi.org/10.5194/acp-14-12343-2014, 2014.
Diehl, K. and Mitra, S. K.: New particle-dependent parameterizations of heterogeneous freezing processes: sensitivity studies of convective clouds with an air parcel model, Atmos. Chem. Phys., 15, 12741–12763, https://doi.org/10.5194/acp-15-12741-2015, 2015.
Dittenber, D. B. and GangaRao, H. V. S.: Critical review of recent publications on use of natural composites in infrastructure, Compos. Part A-Appl. S., 43, 1419–1429, https://doi.org/10.1016/j.compositesa.2011.11.019, 2012.
Dreischmeier, K., Budke, C., Wiehemeier, L., Kottke, T., and Koop, T.: Boreal pollen contain ice-nucleating as well as ice-binding “anti-freeze” polysaccharides, Sci. Rep., 7, 41890, https://doi.org/10.1038/srep41890, 2017.
Emersic, C., Connolly, P. J., Boult, S., Campana, M., and Li, Z.: Investigating the discrepancy between wet-suspension- and dry-dispersion-derived ice nucleation efficiency of mineral particles, Atmos. Chem. Phys., 15, 11311–11326, https://doi.org/10.5194/acp-15-11311-2015, 2015.
Fernández, I., Cabaneiro, A., and Carballas, T.: Organic matter changes immediately after a wildfire in an Atlantic forest soil and comparison with laboratory soil heating, Soil Biol. Biochem., 29, 1–11, https://doi.org/10.1016/S0038-0717(96)00289-1, 1997.
Friedman, B., Kulkarni, G., Beránek, J., Zelenyuk, A., Thornton, J. A., and Cziczo, D. J.: Ice nucleation and droplet formation by bare and coated soot particles, J. Geophys. Res., 116, D17203, https://doi.org/10.1029/2011JD015999, 2011.
Garimella, S., Rothenberg, D. A., Wolf, M. J., David, R. O., Kanji, Z. A., Wang, C., Rösch, M., and Cziczo, D. J.: Uncertainty in counting ice nucleating particles with continuous flow diffusion chambers, Atmos. Chem. Phys., 17, 10855–10864, https://doi.org/10.5194/acp-17-10855-2017, 2017.
Grawe, S., Augustin-Bauditz, S., Hartmann, S., Hellner, L., Pettersson, J. B. C., Prager, A., Stratmann, F., and Wex, H.: The immersion freezing behavior of ash particles from wood and brown coal burning, Atmos. Chem. Phys., 16, 13911–13928, https://doi.org/10.5194/acp-16-13911-2016, 2016.
Hartmann, S., Niedermeier, D., Voigtländer, J., Clauss, T., Shaw, R. A., Wex, H., Kiselev, A., and Stratmann, F.: Homogeneous and heterogeneous ice nucleation at LACIS: operating principle and theoretical studies, Atmos. Chem. Phys., 11, 1753–1767, https://doi.org/10.5194/acp-11-1753-2011, 2011.
Hiranuma, N., Hoffmann, N., Kiselev, A., Dreyer, A., Zhang, K., Kulkarni, G., Koop, T., and Möhler, O.: Influence of surface morphology on the immersion mode ice nucleation efficiency of hematite particles, Atmos. Chem. Phys., 14, 2315–2324, https://doi.org/10.5194/acp-14-2315-2014, 2014.
Hiranuma, N., Möhler, O., Yamashita, K., Tajiri, T., Saito, A., Kiselev, A., Hoffmann, N., Hoose, C., Jantsch, E., Koop, T., and Murakami, M.: Ice nucleation by cellulose and its potential contribution to ice formation in clouds, Nat. Geosci., 8, 273–277, https://doi.org/10.1038/ngeo2374, 2015a.
Hiranuma, N., Augustin-Bauditz, S., Bingemer, H., Budke, C., Curtius, J., Danielczok, A., Diehl, K., Dreischmeier, K., Ebert, M., Frank, F., Hoffmann, N., Kandler, K., Kiselev, A., Koop, T., Leisner, T., Möhler, O., Nillius, B., Peckhaus, A., Rose, D., Weinbruch, S., Wex, H., Boose, Y., DeMott, P. J., Hader, J. D., Hill, T. C. J., Kanji, Z. A., Kulkarni, G., Levin, E. J. T., McCluskey, C. S., Murakami, M., Murray, B. J., Niedermeier, D., Petters, M. D., O'Sullivan, D., Saito, A., Schill, G. P., Tajiri, T., Tolbert, M. A., Welti, A., Whale, T. F., Wright, T. P., and Yamashita, K.: A comprehensive laboratory study on the immersion freezing behavior of illite NX particles: a comparison of 17 ice nucleation measurement techniques, Atmos. Chem. Phys., 15, 2489–2518, https://doi.org/10.5194/acp-15-2489-2015, 2015b.
Hoffmann, N., Duft, D., Kiselev, A., and Leisner, T.: Contact freezing efficiency of mineral dust aerosols studied in an electrodynamic balance: quantitative size and temperature dependence for illite particles, Faraday Discuss., 165, 383–390, https://doi.org/10.1039/C3FD00033H, 2013a.
Hoffmann, N., Kiselev, A., Rzesanke, D., Duft, D., and Leisner, T.: Experimental quantification of contact freezing in an electrodynamic balance, Atmos. Meas. Tech., 6, 2373–2382, https://doi.org/10.5194/amt-6-2373-2013, 2013b.
Hoose, C. and Möhler, O.: Heterogeneous ice nucleation on atmospheric aerosols: a review of results from laboratory experiments, Atmos. Chem. Phys., 12, 9817–9854, https://doi.org/10.5194/acp-12-9817-2012, 2012.
Kanji, Z. A., Ladino, L. A., Wex, H., Boose, Y., Burkert-Kohn, M., Cziczo, D. J., and Krämer, M.: Ice formation and evolution in clouds and precipitation: Measurement and modeling challenges, Chapter 1: Overview of ice nucleating particles, Meteor. Mon., 58, 1–33, https://doi.org/10.1175/AMSMONOGRAPHS-D-16-0006.1, 2017. Khalil, H. P. S. A., Bhat, A. H., and Yusra, A. F. I.: Green composites from sustainable cellulose nanofibrils: A review, Carbohyd. Polym., 87, 963–979, https://doi.org/10.1016/j.carbpol.2011.08.078, 2012.
Kiselev, A., Bachmann, F., Pedevilla, P., Cox, S. J., Michaelides, A., Gerthsen, D., and Leisner, T.: Active sites in heterogeneous ice nucleation – the example of K-rich feldspars, Science, 355, 367–371, https://doi.org/10.1126/science.aai8034, 2017.
KIT-INK-AAF (Karlsruhe Institute of Technology: The Institute of Meteorology and Climate Research, the Atmospheric Aerosol Research): INUIT (Ice Nuclei research UnIT) WebSQL database, available at: https://imk-aaf-s1.imk-aaf.kit.edu:8081/inuit/, last access: 17 February 2019.
Knopf, D. A., Alpert, P. A., and Wang, B.: The role of organic aerosol in atmospheric ice nucleation: A review, ACS Earth Space Chem., 2, 168–202, https://doi.org/10.1021/acsearthspacechem.7b00120, 2018.
Knopf, D. A., Alpert, P. A., and Wang, B.: The role of organic aerosol in atmospheric ice nucleation: A review, ACS Earth Space Chem., 2, 168–202, https://doi.org/10.1021/acsearthspacechem.7b00120, 2018.
Legrand, M., Preunkert, S., Schock, M., Cerqueira, M., Kasper-Giebl, A., Afonso, J., Pio, C., Gelencser, A., and Dombrowski-Etchevers, L.: Major 20th century changes of carbonaceous aerosol components (EC, WinOC, DOC, HULIS, carboxylic acids, and cellulose) derived from Alpine ice cores, J. Geophys. Res.-Atmos., 112, D23S11, https://doi.org/10.1029/2006JD008080, 2007.
Möhler, O., Stetzer, O., Schaefers, S., Linke, C., Schnaiter, M., Tiede, R., Saathoff, H., Krämer, M., Mangold, A., Budz, P., Zink, P., Schreiner, J., Mauersberger, K., Haag, W., Kärcher, B., and Schurath, U.: Experimental investigation of homogeneous freezing of sulphuric acid particles in the aerosol chamber AIDA, Atmos. Chem. Phys., 3, 211–223, https://doi.org/10.5194/acp-3-211-2003, 2003.
Murray, B. J., O'Sullivan, D., Atkinson, J. D., and Webb, M. E.: Ice nucleation by particles immersed in supercooled cloud droplets, Chem. Soc. Rev., 41, 6519–6554, https://doi.org/10.1039/c2cs35200a, 2012.
Niemand, M., Möhler, O., Vogel, B., Vogel, H., Hoose, C., Connolly, P., Klein, H., Bingemer, H., DeMott, P., and Skrotzki, J.: A particle-surface-area-based parameterization of immersion freezing on desert dust particles, J. Atmos. Sci., 69, 3077–3092, https://doi.org/10.1175/JAS-D-11-0249.1, 2012.
Nishiyama, Y., Langan, P., and Chanzy, H.: Crystal structure and hydrogen-bonding system in Cellulose Iβ from synchrotron X-ray and neutron fiber diraction, J. Am. Chem. Soc. 124, 9074–9082, https://doi.org/10.1021/ja0257319, 2002.
O'Sullivan, D., Murray, B. J., Ross, J. F., Whale, T. F., Price, H. C., Atkinson, J. D., Umo, N. S., and Webb, M. E.: The relevance of nanoscale biological fragments for ice nucleation in clouds, Sci. Rep., 5, 8082, https://doi.org/10.1038/srep08082, 2015.
Paukert, M. and Hoose, C.: Modeling immersion freezing with aerosol-dependent prognostic ice nuclei in Arctic mixed-phase clouds, J. Geophys. Res.-Atmos., 119, 9073–9092, https://doi.org/10.1002/2014JD021917, 2014.
Polen, M., Lawlis, E., and Sullivan, R. C.: The unstable ice nucleation properties of Snomax® bacterial particles, J. Geophys. Res., 121, 11666–11678, https://doi.org/10.1002/2016JD025251, 2016.
Polen, M., Brubaker, T., Somers, J., and Sullivan, R. C.: Cleaning up our water: reducing interferences from nonhomogeneous freezing of “pure” water in droplet freezing assays of ice-nucleating particles, Atmos. Meas. Tech., 11, 5315–5334, https://doi.org/10.5194/amt-11-5315-2018, 2018.
Pruppacher, H. R. and Klett, J. D.: Microphysics of Clouds and Precipitation, Kluwer Acad., Norwell, Mass., 954 pp, https://doi.org/10.1007/978-0-306-48100-0, 2010.
Pummer, B. G., Bauer, H., Bernardi, J., Bleicher, S., and Grothe, H.: Suspendable macromolecules are responsible for ice nucleation activity of birch and conifer pollen, Atmos. Chem. Phys., 12, 2541–2550, https://doi.org/10.5194/acp-12-2541-2012, 2012.
Puxbaum, H. and Tenze-Kunit, M.: Size distribution and seasonal variation of atmospheric cellulose, Atmos. Environ., 37, 3693–3699, https://doi.org/10.1016/S1352-2310(03)00451-5, 2003.
Quiroz-Castañeda, R. E. and Folch-Mallol, J. L.: Hydrolysis of Biomass Mediated by Cellulases for the Production of Sugars, in: Sustainable Degradation of Lignocellulosic Biomass – Techniques, Applications and Commercialization, edited by: Chandel, A., InTech, ISBN: 978-953-51-1119-1, https://doi.org/10.5772/53719, 2013.
Reicher, N., Segev, L., and Rudich, Y.: The WeIzmann Supercooled Droplets Observation on a Microarray (WISDOM) and application for ambient dust, Atmos. Meas. Tech., 11, 233–248, https://doi.org/10.5194/amt-11-233-2018, 2018.
Richardson, M. S., DeMott, P. J., Kreidenweis, S. M., Petters, M. D., and Carrico, C. M.: Observations of ice nucleation by ambient aerosol in the homogeneous freezing regime, Geophys. Res. Lett., 37, L04806, https://doi.org/10.1029/2009GL041912, 2010.
Samaké, A., Jaffrezo, J.-L., Favez, O., Weber, S., Jacob, V., Albinet, A., Riffault, V., Perdrix, E., Waked, A., Golly, B., Salameh, D., Chevrier, F., Oliveira, D. M., Bonnaire, N., Besombes, J.-L., Martins, J. M. F., Conil, S., Guillaud, G., Mesbah, B., Rocq, B., Robic, P.-Y., Hulin, A., Le Meur, S., Descheemaecker, M., Chretien, E., Marchand, N., and Uzu, G.: Polyols and glucose particulate species as tracers of primary biogenic organic aerosols at 28 French sites, Atmos. Chem. Phys., 19, 3357–3374, https://doi.org/10.5194/acp-19-3357-2019, 2019.
Sánchez-Ochoa, A., Kasper-Giebl, A., Puxbaum, H., Gelencserm, A., Legrand, M., and Pio, C.: Concentration of atmospheric cellulose: a proxy for plant debris across a west-east transect over Europe, J. Geophys. Res., 112, D23S08, https://doi.org/10.1029/2006JD008180, 2007.
Santachiara, G., Di Matteo, L., Prodi, F., and Belosi, F.: Atmospheric particles acting as ice forming nuclei in different size ranges, Atmos. Res., 96, 266–272, https://doi.org/10.1016/j.atmosres.2009.08.004, 2010.
Schiebel, T.: Ice Nucleation Activity of Soil Dust Aerosols, Thesis, Karlsruhe Institute of Technology, 20 October, https://doi.org/10.5445/IR/1000076327, 2017.
Schnell, R. and Vali, G.: Atmospheric ice nuclei from decomposing vegetation, Nature, 236, 163–165, https://doi.org/10.1038/236163a0, 1972.
Schnell, R. and Vali, G.: World-wide source of leaf-derived freezing nuclei, Nature, 246, 212–213, https://doi.org/10.1038/246212a0, 1973.
Schnell, R. and Vali, G.: Biogenic Ice Nuclei: Part I, Terrestrial and Marine Sources, J. Atmos. Sci., 33, 1554–1564, 1976.
Schrod, J., Danielczok, A., Weber, D., Ebert, M., Thomson, E. S., and Bingemer, H. G.: Re-evaluating the Frankfurt isothermal static diffusion chamber for ice nucleation, Atmos. Meas. Tech., 9, 1313–1324, https://doi.org/10.5194/amt-9-1313-2016, 2016.
Schütze, K., Wilson, J. C., Weinbruch, S., Benker, N., Ebert, M., Günther, G., Weigel, R., and Borrmann, S.: Sub-micrometer refractory carbonaceous particles in the polar stratosphere, Atmos. Chem. Phys., 17, 12475–12493, https://doi.org/10.5194/acp-17-12475-2017, 2017.
Stopelli, E., Conen, F., Zimmermann, L., Alewell, C., and Morris, C. E.: Freezing nucleation apparatus puts new slant on study of biological ice nucleators in precipitation, Atmos. Meas. Tech., 7, 129–134, https://doi.org/10.5194/amt-7-129-2014, 2014.
Suski, K. J., Hill, T. C. J., Levin, E. J. T., Miller, A., DeMott, P. J., and Kreidenweis, S. M.: Agricultural harvesting emissions of ice-nucleating particles, Atmos. Chem. Phys., 18, 13755–13771, https://doi.org/10.5194/acp-18-13755-2018, 2018.
Szakáll, M., Mitra, S. K., Diehl, K., and Borrmann, S.: Shapes and oscillations of falling raindrops: A review, Atmos. Res., 97, 416–425, https://doi.org/10.1016/j.atmosres.2010.03.024, 2010.
Tajiri, T., Yamashita, K., Murakami, M., Orikasa, N., Saito, A., Kusunoki, K., and Lilie, L.: A novel adiabatic-expansion-type cloud simulation chamber, J. Meteor. Soc. Jpn, 91, 687–704, https://doi.org/10.2151/jmsj.2013-509, 2013.
Thakur, V. K. and Thakur, M. K.: Processing and characterization of natural cellulose fibers/thermoset polymer composites, Carbohydr. Polym., 109, 102–117, https://doi.org/10.1016/j.carbpol.2014.03.039, 2014.
Timko, M. T., Yu, Z., Kroll, J., Jayne, J. T., Worsnop, D. R., Miake-Lye, R. C., Onasch, T. B., Liscinsky, D., Kirchstetter, T. W., Destaillats, H., Holder, A. L., Smith, J. D., and Wilson, K. R.: Sampling artifacts from conductive silicone tubing, Aerosol. Sci. Tech., 43, 855–865, 2009.
Tobo, Y.: An improved approach for measuring immersion freezing in large droplets over a wide temperature range, Sci. Rep., 6, 32930, https://doi.org/10.1038/srep32930, 2016.
Ullrich, R., Hoose, C., Möhler, O., Niemand, M., Wagner, R., Höhler, K., Hiranuma, N., Saathoff, H., and Leisner, T.: A new ice nucleation active site parametrization for desert dust and soot, J. Atmos. Sci., 74, 699–717, https://doi.org/10.1175/JAS-D-16-0074.1, 2017.
Vali, G.: Quantitative evaluation of experimental results on the heterogeneous freezing nucleation of supercooled liquids, J. Atmos. Sci., 28, 402–409, https://doi.org/10.1175/1520-0469(1971)028<0402:QEOERA>2.0.CO;2, 1971.
Vali, G., DeMott, P. J., Möhler, O., and Whale, T. F.: Technical Note: A proposal for ice nucleation terminology, Atmos. Chem. Phys., 15, 10263–10270, https://doi.org/10.5194/acp-15-10263-2015, 2015.
Vergara-Temprado, J., Miltenberger, A. K., Furtado, K., Grosvenor, D. P., Shipway, B. J., Hill, A. A., Wilkinson, J. M., Field, P. R., Murray, B. J., and Carslaw, K. S.: Strong control of Southern Ocean cloud reflectivity by ice-nucleating particles, P. Natl. Acad. Sci. USA, 115, 2687–2692, https://doi.org/10.1073/pnas.1721627115, 2018.
Vlachou, A., Daellenbach, K. R., Bozzetti, C., Chazeau, B., Salazar, G. A., Szidat, S., Jaffrezo, J.-L., Hueglin, C., Baltensperger, U., Haddad, I. E., and Prévôt, A. S. H.: Advanced source apportionment of carbonaceous aerosols by coupling offline AMS and radiocarbon size-segregated measurements over a nearly 2-year period, Atmos. Chem. Phys., 18, 6187–6206, https://doi.org/10.5194/acp-18-6187-2018, 2018.
Wex, H., DeMott, P. J., Tobo, Y., Hartmann, S., Rösch, M., Clauss, T., Tomsche, L., Niedermeier, D., and Stratmann, F.: Kaolinite particles as ice nuclei: learning from the use of different kaolinite samples and different coatings, Atmos. Chem. Phys., 14, 5529–5546, https://doi.org/10.5194/acp-14-5529-2014, 2014.
Wex, H., Augustin-Bauditz, S., Boose, Y., Budke, C., Curtius, J., Diehl, K., Dreyer, A., Frank, F., Hartmann, S., Hiranuma, N., Jantsch, E., Kanji, Z. A., Kiselev, A., Koop, T., Möhler, O., Niedermeier, D., Nillius, B., Rösch, M., Rose, D., Schmidt, C., Steinke, I., and Stratmann, F.: Intercomparing different devices for the investigation of ice nucleating particles using Snomax® as test substance, Atmos. Chem. Phys., 15, 1463–1485, https://doi.org/10.5194/acp-15-1463-2015, 2015.
Whale, T. F., Murray, B. J., O'Sullivan, D., Wilson, T. W., Umo, N. S., Baustian, K. J., Atkinson, J. D., Workneh, D. A., and Morris, G. J.: A technique for quantifying heterogeneous ice nucleation in microlitre supercooled water droplets, Atmos. Meas. Tech., 8, 2437–2447, https://doi.org/10.5194/amt-8-2437-2015, 2015.
Wright, T. P. and Petters, M. D.: The role of time in heterogeneous freezing nucleation, J. Geophys. Res.-Atmos., 118, 3731–3743, https://doi.org/10.1002/jgrd.50365, 2013.
Yttri, K. E., Simpson, D., Bergström, R., Kiss, G., Szidat, S., Ceburnis, D., Eckhardt, S., Hueglin, C., Nøjgaard, J. K., Perrino, C., Pisso, I., Prevot, A. S. H., Putaud, J.-P., Spindler, G., Vana, M., Zhang, Y.-L., and Aas, W.: The EMEP Intensive Measurement Period campaign, 2008–2009: Characterizing the carbonaceous aerosol at nine rural sites in Europe, Atmos. Chem. Phys. Discuss., https://doi.org/10.5194/acp-2018-1151, in review, 2018.