the Creative Commons Attribution 4.0 License.
the Creative Commons Attribution 4.0 License.
 | 08 Apr 2019
On the fine vertical structure of the low troposphere over the coastal margins of East Antarctica
Olivier Traullé
Alexis Berne
In this study, 8 years of high-resolution radiosonde data at nine Antarctic stations are analysed to provide the first large-scale characterization of the fine vertical structure of the low troposphere up to 3 km altitude over the coastal margins of East Antarctica. Radiosonde data show a large spatial variability of wind, temperature and humidity profiles, with different features between stations in katabatic regions (e.g., Dumont d'Urville and Mawson stations), stations over two ice shelves (Neumayer and Halley stations) and regions with complex orography (e.g., McMurdo). At the Dumont d'Urville, Mawson and Davis stations, the yearly median wind speed profiles exhibit a clear low-level katabatic jet. During precipitation events, the low-level flow generally remains of continental origin and its speed is even reinforced due to the increase in the continent–ocean pressure gradient. Meanwhile, the relative humidity profiles show a dry low troposphere, suggesting the occurrence of low-level sublimation of precipitation in katabatic regions but such a phenomenon does not appreciably occur over the ice shelves near Halley and Neumayer. Although ERA-Interim and ERA5 reanalyses assimilate radiosoundings at most stations considered here, substantial – and sometimes large – low-level wind and humidity biases are revealed but ERA5 shows overall better performance. A free simulation with the regional polar version of the Weather Research and Forecasting model (Polar WRF) (at a 35 km resolution) over the entire continent shows too-strong and too-shallow near-surface jets in katabatic regions especially in winter. This may be a consequence of an underestimated coastal cold air bump and associated sea–continent pressure gradient force due to the coarse 35 km resolution of the Polar WRF simulation. Beyond documenting the vertical structure of the low troposphere over coastal East Antarctica, this study gives insights into the reliability and accuracy of two major reanalysis products in this region on the Earth. The paper further underlines the difficulty of modeling the low-level flow over the margins of the ice sheet with a state-of-the-art atmospheric model.
- Article
(13476 KB) - Full-text XML
-
Supplement
(4672 KB) - BibTeX
- EndNote


The margins of East Antarctica are a region of great interest in meteorology particularly due to the fierce katabatic winds that fascinated and severely tested the pioneering scientific expeditions in the far south. These so-called katabatic winds that flow over the sloping surfaces of the ice sheet can attain very high speeds in confluence regions such as the Adélie Land (Mawson, 1915; Wendler et al., 1993; Parish and Walker, 2006) or the Lambert Glacier (Parish and Bromwich, 1987).
In winter, the strong radiative deficit of the surface leads to persistent, intense and directionally constant near-surface winds from the interior of the continent. Beyond the coastal slopes the atmospheric boundary-layer flow considerably thickens in response to a piling up of cold air downstream over the sea ice or the ice shelves. This accumulation of cold air is responsible for a pressure gradient force opposing the katabatic wind that is particularly intense under weak synoptic forcing (Van den Broeke et al., 2002; Van den Broeke and Van Lipzig, 2003). In some regions of the ice sheet, like in Adélie Land or in Coats Land, the flow regime transition can be abrupt (Pettré and André, 1991; Gallée et al., 1996; Gallée and Pettré, 1998; Renfrew, 2004) and is therefore interpreted as a hydraulic jump, often referred to as a katabatic jump or Loewe's phenomenon. Such jumps are however rarely important in other sectors of the Antarctic periphery like Terra Nova Bay (Parish and Bromwich, 1989).
In summer, the absorption of shortwave radiation by the surface diminishes the katabatic forcing and the large-scale pressure gradient force dominates the overall momentum budget of the boundary layer (Van den Broeke et al., 2002; Parish and Cassano, 2003). The lower sea-ice concentration and sea-ice extent generally diminish the offshore extent of the land flow due to the development of diurnal sea breezes (Pettré et al., 1993) and because of the thermal and mechanical erosion of the flow at the ocean surface. In Adélie Land and in Queen Maud Land, a typical summertime diurnal cycle of the low-level flow has been evidenced. Nocturnal katabatic forcing alternates with a combination of thermal wind forcing and surface radiative heating that leads to a weakening of downslope diurnal flow or even to a diurnal anabatic flow (Gallée and Pettré, 1998; Parish et al., 1993; Bintanja, 2000).
The interactions between the low-level atmospheric flow from the interior of the ice sheet and the oceanic air masses over – or coming from – the austral ocean are varied and complex. For instance, it has been shown that katabatic winds are stronger when an anticyclone sets over the plateau or when the pressure over the ocean is low as during the approach of deep cyclones (Parish and Bromwich, 1998; Naithani et al., 2003; Orr et al., 2014). On the other hand, katabatic winds have been shown to be a key driver of the mesoscale cyclogenesis off Adélie Land and the Ross Sea (Gallée and Schayes, 1994; Bromwich et al., 2011) or over the Weddell Sea (Carrasco et al., 2003).
From a meteorological and climate perspective, the low-level atmospheric dynamics over the coastal margins of Antarctica plays a key role for the energy and mass budgets of the atmosphere over the ice sheet. The low-level horizontally diverging and northward drainage flow from Antarctica drives a thermally direct zonal circulation. Subsidence – and associated upper cyclonic vorticity – takes place over the central ice sheet, while rising motions occur over the ocean, leading to an active mass exchange between Antarctica and subpolar latitudes (Parish and Bromwich, 1998, 2007). Moreover, the low-level circulation over coastal Antarctica is critical for the surface mass balance of the ice sheet. While transient eddies are responsible for the moisture transport towards the continent, the export of moisture by the mean circulation mostly occurs in the low troposphere (Connolley and King, 1993; Van Lipzig and Van Den Broeke, 2002; Genthon and Krinner, 1998; Dufour et al., 2019). This export can be even more pronounced when considering the moisture export due to blowing snow in the boundary layer (Lenaerts et al., 2012). Using radar measurements and model simulations, Grazioli et al. (2017b) further show that katabatic winds significantly diminish the precipitation amount that actually reaches the ice sheet surface. As katabatic winds are relatively dry, they sublimate an important part of the precipitation before it reaches the ground surface. This dry layer manifests with low values of relative humidity in the boundary layer during snowfall events. From a model simulation with the Integrated Forecast Model (IFS), the authors estimate that sublimation corresponds to 17 % of the precipitation over the entire continent. This term reaches up to 35 % when considering only the margins of the ice sheet.
The reliable representation of the Antarctic climate in regional and global climate models as well as atmospheric reanalyses therefore strongly depends on their ability to reproduce the low-level atmospheric flow at the Antarctic periphery. A significant body of literature has focused on the near-surface atmosphere in Antarctica (Parish and Bromwich, 2007; Nicolas and Bromwich, 2014; Bracegirdle and Marshall, 2012) and its representation in meteorological reanalyses and models. In particular, Wille et al. (2017) have highlighted an excessive wind speed and a dry bias in the boundary layer over the Ross Ice Shelf in the Antarctic Mesoscale Prediction System (AMPS; http://www2.mmm.ucar.edu/rt/amps, last access: 1 April 2019), which is based on simulations from the polar version of the Weather Research and Forecasting model (Polar WRF). Sanz Rodrigo et al. (2013) have further stressed that the near-surface wind speed in escarpment areas is strongly underestimated in ERA40 and ERA-Interim reanalyses, and to a lesser extent in model simulations with the Regional Atmospheric Climate Model (RACMO). The simulations with the EC-Earth global climate model in Bintanja et al. (2014) and in the LMDZ general circulation model in Vignon et al. (2018) concur with these conclusions, especially at low horizontal resolutions due to the coarse representation of terrain slopes.
The vertical structure of the atmosphere over the coastal regions of the ice sheet and its representation in models have been less documented. Using radiosonde data, Streten (1990) and König-Langlo et al. (1998) study the climatological structure of the whole troposphere and low stratosphere at the Mawson and Dumont d'Urville (hereafter DDU), Neumayer and Halley stations, respectively. However, they do not give specific details on the structure of the boundary layer or on the low troposphere. Significant advances in our understanding of the low-level flow have been achieved due to the case studies – often in summer – using a combination of tethersonde and radiosonde observations (e.g., Sorbjan et al., 1986; Bintanja, 2000) and thanks to the deployment of sodars in Coats Land (Renfrew and Anderson, 2007), in Adélie Land (Argentini et al., 1996; Gera et al., 1998) and in the Terra Nova Bay area (Argentini and Mastrantonio, 1994). A climatological perspective has been provided by Zhang et al. (2011) and Nygård et al. (2013), who investigated the frequent temperature and specific humidity surface-based inversions over Antarctica using radiosonde data from the Integrated Global Radiosonde Archive (IGRA). In particular, Nygård et al. (2013) show that over coastal regions, roughly half of the humidity inversions are associated with temperature inversions, while the other half is due to a horizontal advection of water vapor increasing with height.
Nonetheless, little is known about the spatial and temporal variability of the fine vertical structure of the temperature, humidity and wind over the coastal margins of Antarctica. Although the lower tropospheric dynamics in this region is critical for the global climate, its representation in state-of-the-art climate models and atmospheric reanalyses has not been assessed hitherto.
The aim of the present paper is twofold: to characterize the vertical structure of the low atmosphere over several locations of coastal East Antarctica and to present a first multi-station evaluation of model simulations and meteorological reanalyses in this region. More specifically, the main objectives are to
-
document and decipher the fine vertical structure of the lower tropospheric temperature, humidity and wind over coastal East Antarctica using radiosonde data; and
-
evaluate the ability of the ERA-Interim and ERA5 reanalysis products and of the Polar WRF regional atmospheric model to reproduce the observed mean structure and its variability.
The paper is structured as follows: Sect. 2 introduces the data sets and details the methodology. Section 3 presents the results, and the latter are further discussed in Sect. 4. Section 5 closes the paper with a conclusion.
2.1 Radiosonde data at nine Antarctic stations
The low troposphere over coastal East Antarctica has been sampled for a few decades by daily radiosoundings at several stations1. In this study, we analyze daily radiosonde data at seven permanent Antarctic stations on the coast – McMurdo, Mawson, Davis, Casey, DDU, Neumayer and Halley – and at two summer stations – Mario Zucchelli and Princess Elizabeth stations (hereafter MZ and PE stations, respectively) – over the 8-year period (2010–2017). The specific locations of all the stations are indicated in Fig. 1, and the exact coordinates and altitudes are given in Table S1 in the Supplement. The landscape surrounding the different stations shows a great morphological diversity.
McMurdo station lies on the southwestern edge of Ross Island, close to the interface between the Ross Ice Shelf – that extends over 900 km to the south with a slight rise in elevation – and the Ross Sea to the north. The topography of the Ross Island region is complex, with steeply rising terrains corresponding to the two main mountains: Mount Erebus and Mount Terror. Black Island and White Island with respective maximum elevation of 1040 and 740 m are located 30 km south of McMurdo. The Transantarctic Mountains, whose altitude can exceed 2000 m, are located west of Ross Island at a distance of about 80 km. Mario Zucchelli station is located on the coast of Terra Nova Bay, 355 km north of McMurdo, at the northeastern side of the confluence zone of the Priestley and Reeves glaciers and at the south of an orographic jump of more than 1200 m associated with the abrupt slopes of the Transantarctic Mountains. Mawson station is situated on the coast of an isolated horseshoe-shaped rocky area. The ice sheet surface steeply rises from the coastal ice cliffs surrounding the station towards the plateau. Davis is a coastal station that lies to the east of the Amery Ice Shelf in the Vestfold Hills, the largest coastal ice-free area of Antarctica. The land rises progressively to the southwest towards the ice sheet, and a ridgeline in the ice topography is located around 60 km to the northeast of the station (Alexander and Murphy, 2015). Casey station is located on the coast of the Wilkes Land, at 12 m altitude. The Law Dome, which lies to the east of Casey and which rises to an altitude of 1395 m, shields the base from the easterly winds that predominate in the region. Dumont d'Urville station is located at 41 m altitude on Petrel Island, approximately 5 km off Adélie Land and the ice sheet proper. The climate at the station is very influenced by strong katabatic winds blowing from the interior of the ice sheet. Neumayer station lies on the Ekström Ice Shelf, at a few kilometers from the shoreline. The shelf extends more than 100 km to the south with an inclination of approximately 0.1 ‰. Halley station is situated towards the seaward edge of the Brunt Ice Shelf, Coats Land, on the southeastern shore of the Weddell Sea at about 30 m altitude. The Brunt Ice Shelf extends to the southeast of the station for over 40 km, and the uniform surface rises very gradually over this distance until the hinge zone where the land steeply rises up to the continental plateau. Unlike all the other stations of interest here – that are located close to the coast and near sea level – PE is 220 km away from the coast at 1382 m altitude. The station has been built on a small granite ridge just north of the Sør Rondane Mountains in the Dronning Maud Land and it is located at approximately 1 km north of the Utsteinen Nunatak that culminates at an elevation of 1564 m.
Although fairly short for a climatological study, the 2010–2017 analysis period was chosen because it fits the period for which ERA5 reanalysis was available at the time of carrying out the analysis (see Sect. 2.2) and because it corresponds to the period for which the model of radiosonde used at most stations was Vaisala RS-92. The RS-92 sonde is currently the most used sonde type over the globe and it is considered the reference radiosonde by the Global Climate Observing System Reference Upper-Air Network. This model has also been shown to be slightly affected by common dry biases in cold and dry environments (Milosevich et al., 2004) particularly due to its two humidity sensors being heated alternately (Tomasi et al., 2006; Ingleby, 2017). Note that at the DDU and PE stations, the types of radiosonde are Modem M2K2-DC and Graw DFM-09, respectively. Bock et al. (2013) showed a low bias in relative humidity between 2 % and 10 % in Modem M2K2-DC measurements compared to those obtained with RS-92 at the Observatoire de Haute-Provence, southern France. Since 2013, a correction algorithm on moisture measurements from DDU has therefore been applied, but this has limited impacts on the statistics shown in the present paper. Technical information on all the radiosonde types can be found at https://www.graw.de (last access: 1 April 2019), https://www.vaisala.com (last access: 1 April 2019) and http://www.meteomodem.com (last access: 1 April 2019). The specifics of the radiosoundings at each station including the sounding times are summarized in Table 1. As the aim of this study is to characterize the fine vertical structure of the low troposphere, we could not make use of data from IGRA, which are subsets restricted to the so-called “mandatory” pressure levels completed by a few additional levels with significant deviation from linearity of temperature and dew point between mandatory levels (so-called “significant levels”). Here, we rather use data sets provided by local meteorological organizations or polar institutes that have a higher vertical resolution. The sole treatment made on the raw data is a 15 s – ≈75 m – smoothing (applied twice) of the wind data, 15 s being the averaged period of oscillation of the sonde in the first 3000 m above the surface. This allows to remove the oscillations in the data due to the natural pendulum motion of the payload after launching. Temperature, humidity and wind measurements in the first 100 m are also excluded from the data sets for two main reasons. First, the analysis of temperature and humidity data potentially affected by thermal lag error – if the radiosonde was not perfectly equilibrated outdoor before launching, for instance – is avoided. Second, below an altitude of 100 m, the balloon may have not reached the flow velocity yet and may thus be still in a transitory state. Yurchak (2013) shows that, for a typical balloon with an ambient wind speed of 20 m s−1 (5 m s−1), the adaptation timescale is approximately 5 s (20 s) corresponding to an altitude range of 25 m (100 m).
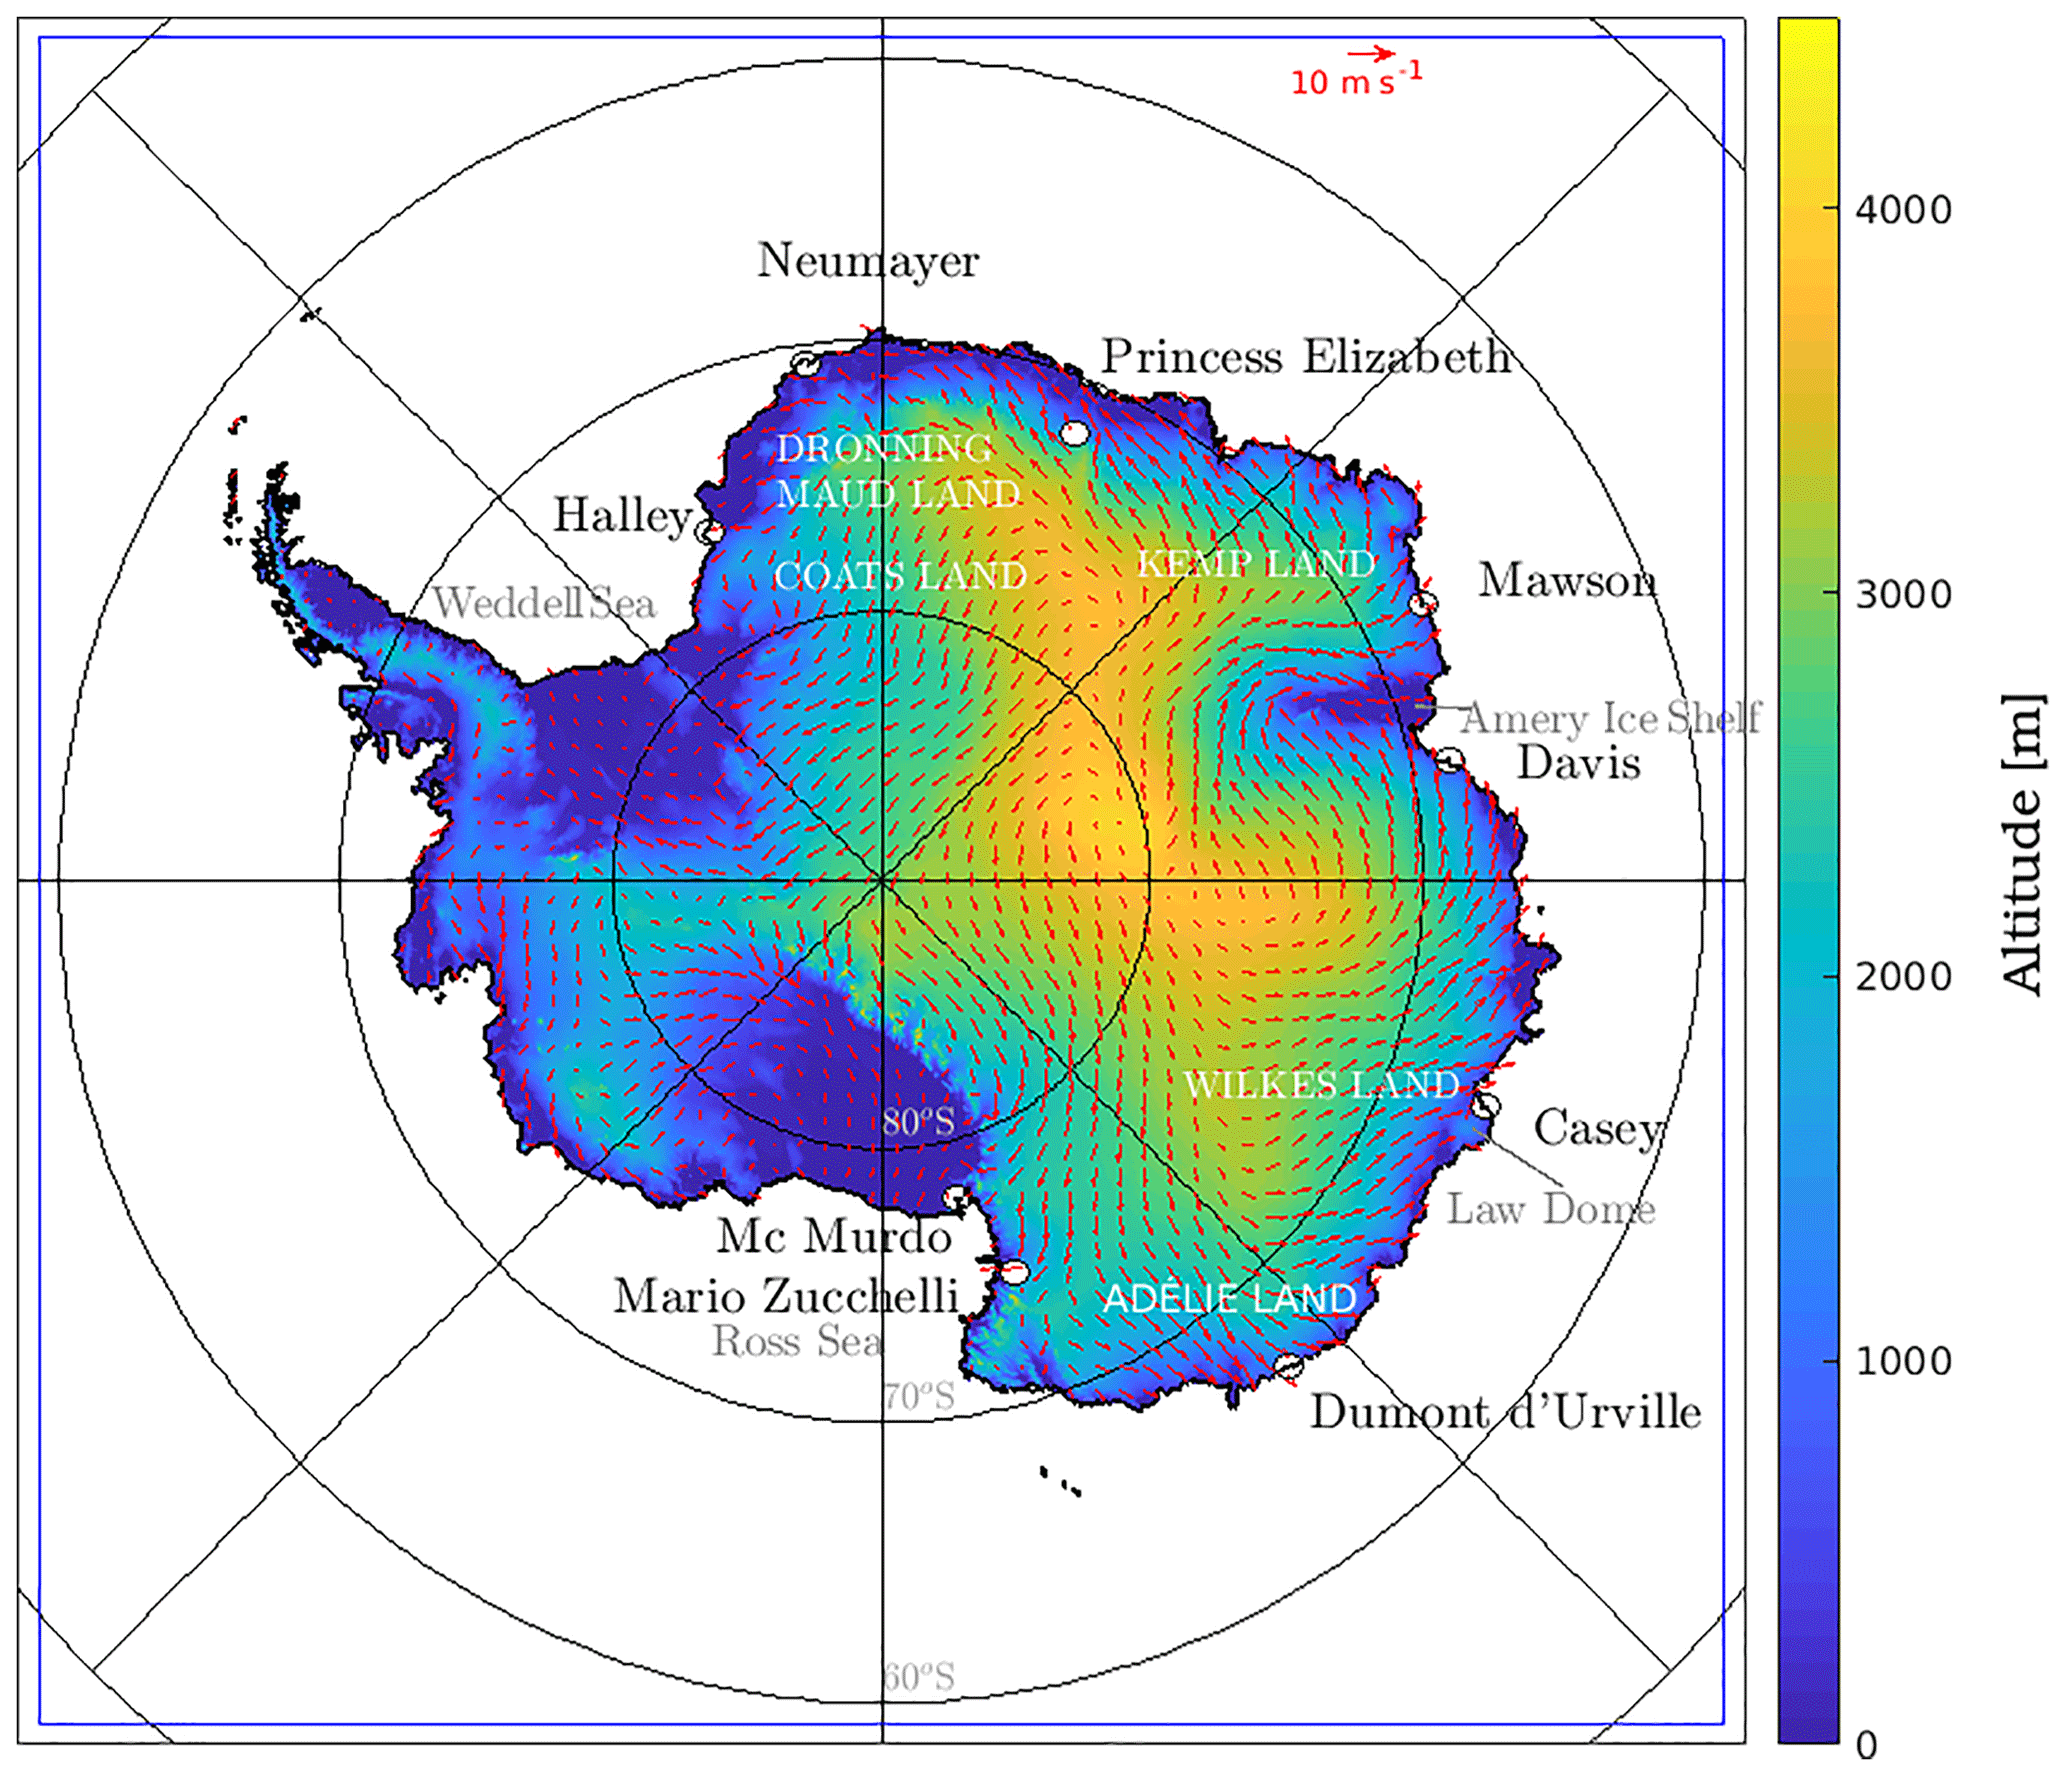
Figure 1Topography of the Antarctic continent from the Bedmap2 data set at 10 km resolution (Fretwell et al., 2013). Black dots indicate stations from which radiosonde data are used in this study. The blue line delimits the Polar WRF simulation domain. Red arrows show the 2010–2017 mean wind vector from ERA5 reanalyses.
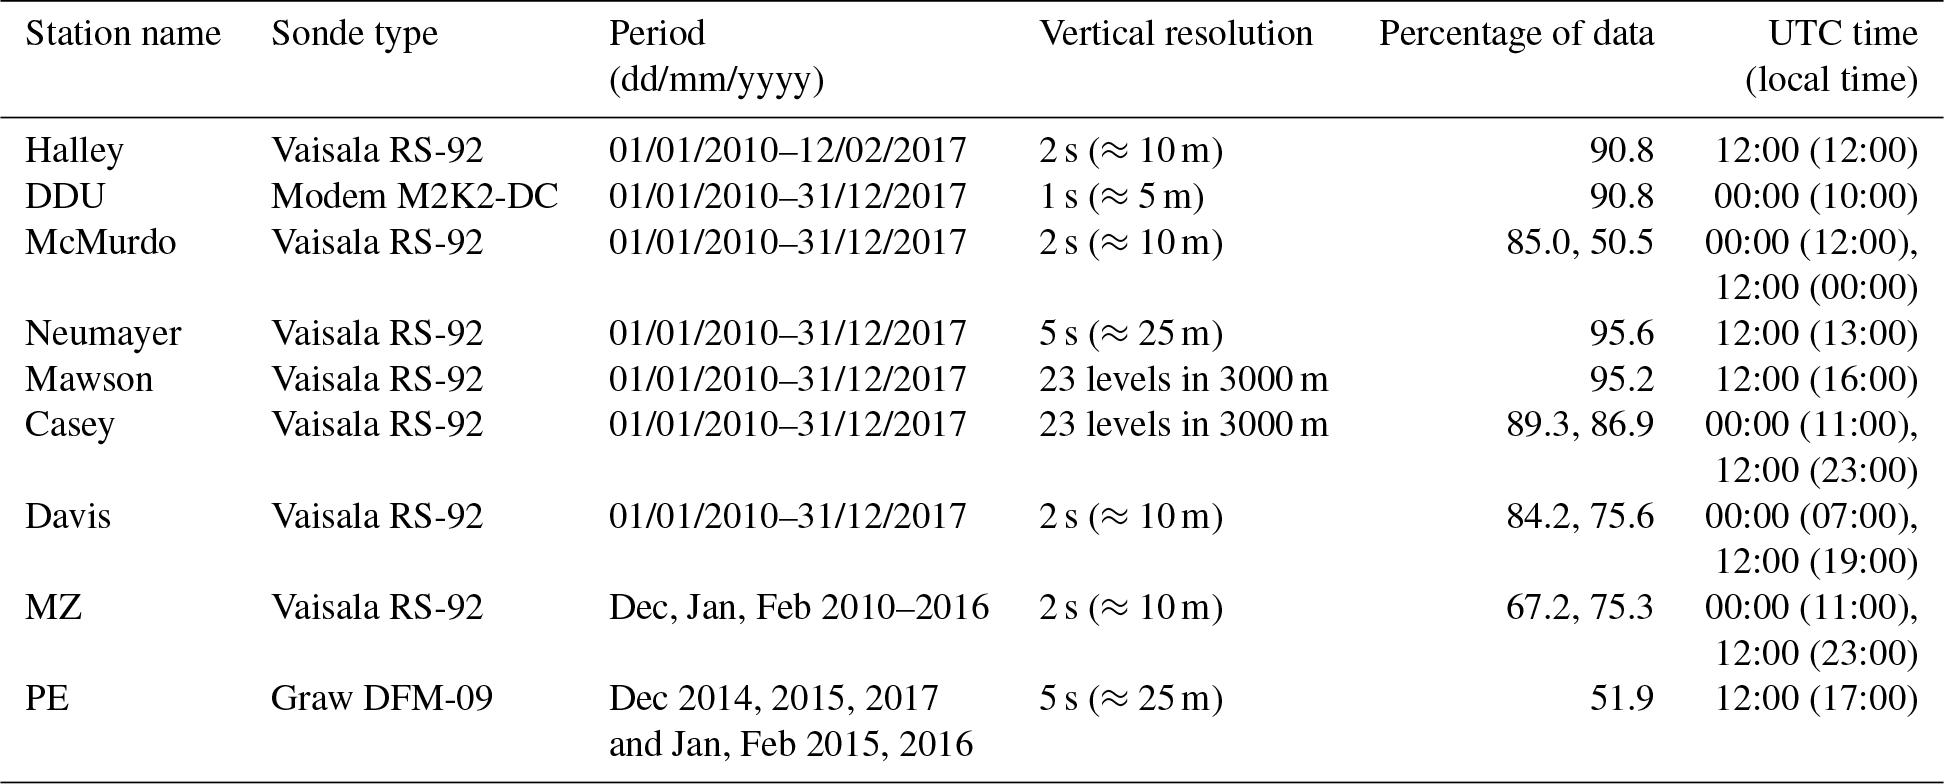
Table 1Characteristics of radiosonde data used in this study. “DDU” refers to Dumont d'Urville, “MZ” to Mario Zucchelli and “PE” to Princess Elizabeth station. The indicated time corresponds to the official observation time. Note that sondes are usually launched 45 min or 1 h before. For each station, the percentage of data indicates the percentage of available radiosoundings in the corresponding period. When two numbers are indicated, the first (second) one corresponds to the percentage of sounding at 00:00 UTC (12:00 UTC). In the Casey and Mawson data sets, measurements are not provided at constant time or vertical resolution. Subsequently, the averaged number of vertical levels in the first 3000 m a.g.l. is indicated in the “resolution” column.
2.2 ECMWF reanalysis products
Two reanalysis data sets from the European Centre for Medium-Range Weather Forecasts (ECMWF) will be compared to radiosonde data over the period 1 January 2010–31 December 2017. Firstly, the ERA-Interim (ERA-I; Dee et al., 2011) reanalysis is a third-generation reanalysis product with an averaged horizontal resolution of 79 km and 60 vertical levels up to 0.1 hPa, among which 17 are in the first 3000 m a.g.l. The reanalysis is based on simulations with the IFS model cycle 31r2 using a 4D-Var assimilation. Comparing second- and third-generation reanalysis products with Antarctic station observations, Bracegirdle and Marshall (2012) show that ERA-I is the most reliable for mean sea level pressure and 500 hPa geopotential height values and trends. ERA-I analyses are available at four times per day: 00:00, 06:00, 12:00 and 18:00 UTC. Secondly, we will use the last-generation reanalysis product from the ECMWF: ERA5. Major improvements from ERA-I include a better spatial resolution (31 km on average on the horizontal, 137 vertical levels up to 0.01 hPa among which 33 are in the first 3000 m a.g.l.), a more elaborated model physics (IFS cycle 41r2), more consistent sea surface temperature, sea-ice cover and additional model inputs from observations. A summary of the changes between ERA-I and ERA5 can be found at https://confluence.ecmwf.int/pages/viewpage.action?pageId=74764925 and the physics of the IFS model used for ERA5 is described in the technical notes on the ECMWF website (https://www.ecmwf.int). ERA5 analyses are available at a 1 h granularity.
It is worth mentioning that radiosonde data at all the considered Antarctic sites – except PE – have been assimilated by the IFS model to make both ERA-I and ERA5. The reanalysis data sets are therefore not purely independent from radiosonde data. Nevertheless, only the meteorological fields at mandatory and significant levels are assimilated. Hence, the fine-scale vertical structure of the boundary layer in ERA-I and ERA5 is expected to remain strongly dependent on the model configuration.
2.3 Polar WRF simulations
Numerical simulations were carried out with the regional model Polar WRF v3.9.1 (e.g., Bromwich et al., 2013). The simulation domain size is 5810 km × 5810 km (see blue square in Fig. 1). It is centered over the South Pole and encompasses the whole Antarctic continent. Simulations are run at 35 km horizontal resolution over the period (2010–2017) (with a 1-week spinup). Initial conditions and lateral boundary forcings, as well as sea-ice cover and sea surface temperature are provided by the ERA5 reanalysis data set. As recommended in Deb et al. (2016), we use the Bedmap2 topography from Fretwell et al. (2013). The model is run with 66 vertical levels, among which 23 are located in the first 3000 m above the ground surface. As in the standard configuration of the AMPS, the shortwave and longwave radiation schemes are the Rapid Radiative Transfer Model for general circulation models (RRTMG) scheme (updated every 15 min) and the cumulus scheme is the Kain–Fritsch scheme. We use the two-moment microphysical scheme of Morrison et al. (2009) that leads to the best Polar WRF simulations compared to cloud and radiation measurements over the Antarctic Peninsula (Listowski and Lachlan-Cope, 2017). For the turbulent diffusion in the boundary layer, we use the 2.5-level Mellor–Yamada–Nakanishi–Niino (MYNN) turbulent kinetic energy (TKE) scheme (Nakanishi and Niino, 2006) coupled with the MYNN surface layer scheme, as in Bromwich et al. (2013). Notwithstanding that MYNN is an advanced version of the Mellor–Yamada–Janjic (MYJ) scheme – with improved formulation of mixing length – Deb et al. (2016) noticed better WRF performance in terms of surface temperature over West Antarctica using the original MYJ parameterization. To assess the sensitivity to the turbulence scheme and the vertical resolution, we have also carried out a simulation with the MYJ scheme coupled with the η-similarity surface layer scheme and one simulation with a refined vertical resolution close to the surface (see Sect. 4.3).
2.4 Analysis methods
Our analysis will focus on the low troposphere that we delimit as the layer between 0 and 3000 m a.g.l. This atmospheric layer was chosen because it includes the boundary layer at all stations and because it is slightly deeper than the mean depth of the equatorward mass flux layer (Van Lipzig and Van Den Broeke, 2002). Note also that z=3000 m a.g.l. corresponds approximately to the altitude from which the zonal mean circulation over coastal Antarctica reverses (from anticyclonic to cyclonic; see Van Lipzig and Van Den Broeke, 2002).
We will compare radiosoundings at each Antarctic station with the simulated and reanalyzed profiles at the nearest model grid point. Details about the geographical characteristics of the specific grid points are given in Table S1. Otherwise mentioned, reanalysis and model profiles will be compared to radiosonde data at each station at the same time as sonde launchings, i.e., at 00:00 and/or 12:00 UTC, depending on the station (see Table 1). It is worth mentioning that the World Meteorological Organisation guidelines state that sondes should be launched at a time such that they reach the tropopause at the synoptic hour (00:00 or 12:00 UTC). To achieve this in the Antarctic, where tropopause height is typically between 8000 and 9000 m, sondes are launched around 45 min before the targeted hour. In the lowest 3000 m a.g.l., one might expect the best comparison with model data 1 h before the notional synoptic hour. However, the statistical evaluation in Sect. 3.2 is not appreciably sensitive to a ±1 h shift in the time sampling of reanalyses and Polar WRF data sets (not shown).
Three atmospheric variables will be analysed: the wind (speed and direction), the temperature and the relative humidity calculated with respect to ice, as temperatures are most of the time below freezing at all stations. We will mostly focus on the relative humidity and less on the specific humidity (or mixing ratio) for four reasons. First, the relative humidity is the variable directly measured by radiosondes. Second, the specific humidity is a variable that spans several orders of magnitude during the year due to its strong dependency upon temperature making the annual statistics dominated by high summer values. The third reason is that the critical variable for cloud and precipitation formation and subsequently for the surface energy and mass balance is the relative humidity. Last, the low-level sublimation process – which is a crucial process over coastal East Antarctica – mostly manifests in the relative humidity profiles. Information about the specific humidity profiles will be nevertheless given in Fig. S1 in the Supplement.
In addition to yearly and seasonal statistics, we will consider for each station a “precipitation events” ensemble, which gathers all profiles for which substantial precipitation reaches the ground surface (precipitation rate is greater than 0.1 mm h−1). For radiosounding profiles, the precipitation conditioning is made using ERA5 reanalyses.
The statistics of wind, humidity and temperature profiles in reanalyses and Polar WRF have been evaluated by comparing the median profiles as well as the 80–20th and 95–5th interquartiles at every model or reanalyses level height. The ERA-I and ERA5 performance at the sounding time have also been evaluated using mean bias and root mean square error calculations at their respective vertical level heights. The variability in wind direction has also been evaluated using the directional constancy parameter (DC), defined as
where u and v are the zonal and meridional components of the wind, respectively, and the overbar indicates the time average.
In this section, we present the main features of the vertical structure of the low troposphere over coastal East Antarctica using radiosonde data and we assess the ability of reanalyses and Polar WRF in reproducing the profiles statistics.
3.1 General features of the vertical structure of the low troposphere from radiosonde data at nine Antarctic coastal stations
3.1.1 Annual statistics
A broad view of the yearly vertical structure of the wind speed (U), temperature (T) and relative humidity with respect to ice (RHi) in the low troposphere from radiosonde data at each station is depicted in Fig. 2. The reader can refer to Fig. S2 for separate statistics of the zonal and meridional wind components and for further information about the wind direction. It is worth remembering that only summer data are available for MZ and PE stations. One particularly striking feature in Fig. 2 is the diversity of profiles around the coast of East Antarctica. In the Ross Sea sector (McMurdo and MZ stations), one can notice the low and nearly constant wind speed. As shown in Seefeldt et al. (2003) and Monaghan et al. (2005), the atmospheric flow at McMurdo is strongly influenced by orographic effects like the blocking of the dominant katabatic southerly flow by the Ross Island. At the MZ station, the observed profiles are often the results of the confluence of katabatic flows from the Reeves and Priestley glaciers affected by local mountains (Bromwich et al., 1993). Moving westward (from left to right in the Fig. 2) to Adélie Land and DDU station, a clear katabatic layer can be seen in the profiles. This layer is characterized by high wind speeds (with an annual median around 10 m s−1) with a southeasterly direction and capped by a temperature inversion at about 1000–1500 m altitude. Figure S2 also shows a clear transition from a low-level easterly flow to a mid-tropospheric westerly flow at an altitude of about 2300 m. Still more to the west in Fig. 2, Casey station generally experiences light outflow from the northeast, off Law Dome (Adams, 2005). This is visible in radiosonde data with a median wind speed between 4 and 10 m s−1 monotonically increasing with increasing height. Note the relatively high value of the 90th percentile in the first 500 m a.g.l. This observation recalls the results of Turner et al. (2001) that explained one extraordinarily very strong wind event (10 m speed exceeded 50 m s−1) at Casey associated with a deep low north of the coast in concert with a high surface pressure inland. At the Davis station, the yearly median wind profile reveals a deep katabatic layer with a moderate median wind speed maximum of 7 m s−1 at approximately 800 m altitude and with a northeasterly direction. At the Mawson station, Fig. 2 shows that both the median wind speed and the variability is maximum close to the surface. This observation echoes the conclusions of Dare and Budd (2001) stating that the near-surface wind at Mawson is driven by shallow surface drainage flows – thereby explaining the low-level maximum and its northeasterly direction (Fig. S2) – and modulated by the vertical transfer of momentum from the mid-troposphere that largely depends on the synoptic pressure gradient which can strengthen or weaken the surface drainage flow. Surface-based temperature inversions are a common climatological feature of the Antarctic troposphere. Interestingly, for all the stations considered, no surface-based inversion can be pointed out in the yearly median profiles from radiosoundings. However, surface-based temperature inversions are present in the first 100 m above the surface in ERA-I, ERA5 and Polar WRF (see Sect. 3.2). As the first 100 m of radiosonde data are not analysed here due to the low reliability of radiosonde data in this layer, this may explain the absence of inversion in the yearly median temperature profiles at the McMurdo, DDU, Casey, Davis and Mawson stations.
At the DDU, Casey, Davis and Mawson stations, one can further point out that the yearly median RHi profiles show lower values in the first kilometer above the ground surface. This bottom layer of drier air corresponds to the advection of absolutely dry air masses by katabatic winds that adiabatically warm during their descent from the interior of the continent. At DDU, this process is sufficiently strong to exhibit a clear signature in the yearly statistical profiles of specific humidity (Fig. S1). Moving westward and inland towards PE station, radiosonde data reveal nearly constant median profiles of wind speed and RHi in summer. Pattyn et al. (2010) underline that the PE station site is sheltered by the Sør Rondane Mountains in the south and it is thus protected from strong katabatic jets. Albeit deflected, the flow originating from the plateau shows a high directional constancy (>0.8) over a depth exceeding 2000 m (see Sect. 3.2). While the median temperature linearly decreases with increasing height, the 80th and 90th percentiles of temperature show constant and slightly increasing values close to the surface, respectively, evidencing the occurrence of surface-based inversions in summer during calm wind conditions (not shown). Neumayer and Halley stations are both located on ice shelves and the respective vertical structures of the low troposphere are reasonably similar. King (1989) shows that the low-level flow at Halley is forced by both synoptic-scale pressure gradients and the pressure gradient due to the stable air over the gently sloping surface of the Brunt Ice Shelf. Kottmeier (1986) draw similar conclusions for Neumayer station over the Ekström Ice Shelf, emphasizing the role of baroclinicity via the thermal wind effect in shaping the wind structure. Figure 2 shows that the median wind speed at both stations exhibits a shallow maximum close to the surface that corresponds to a northeasterly flow. The wind speeds show a large intra-annual variability and they are slightly stronger at Neumayer than at Halley, with medians at z=200 m close to 11 and 8 m s−1, respectively. RHi is nearly constant or slightly decreasing with increasing height. Unlike stations in coastal katabatic regions, the median temperature profiles reveal a surface-based inversion in the first kilometer above the ground.
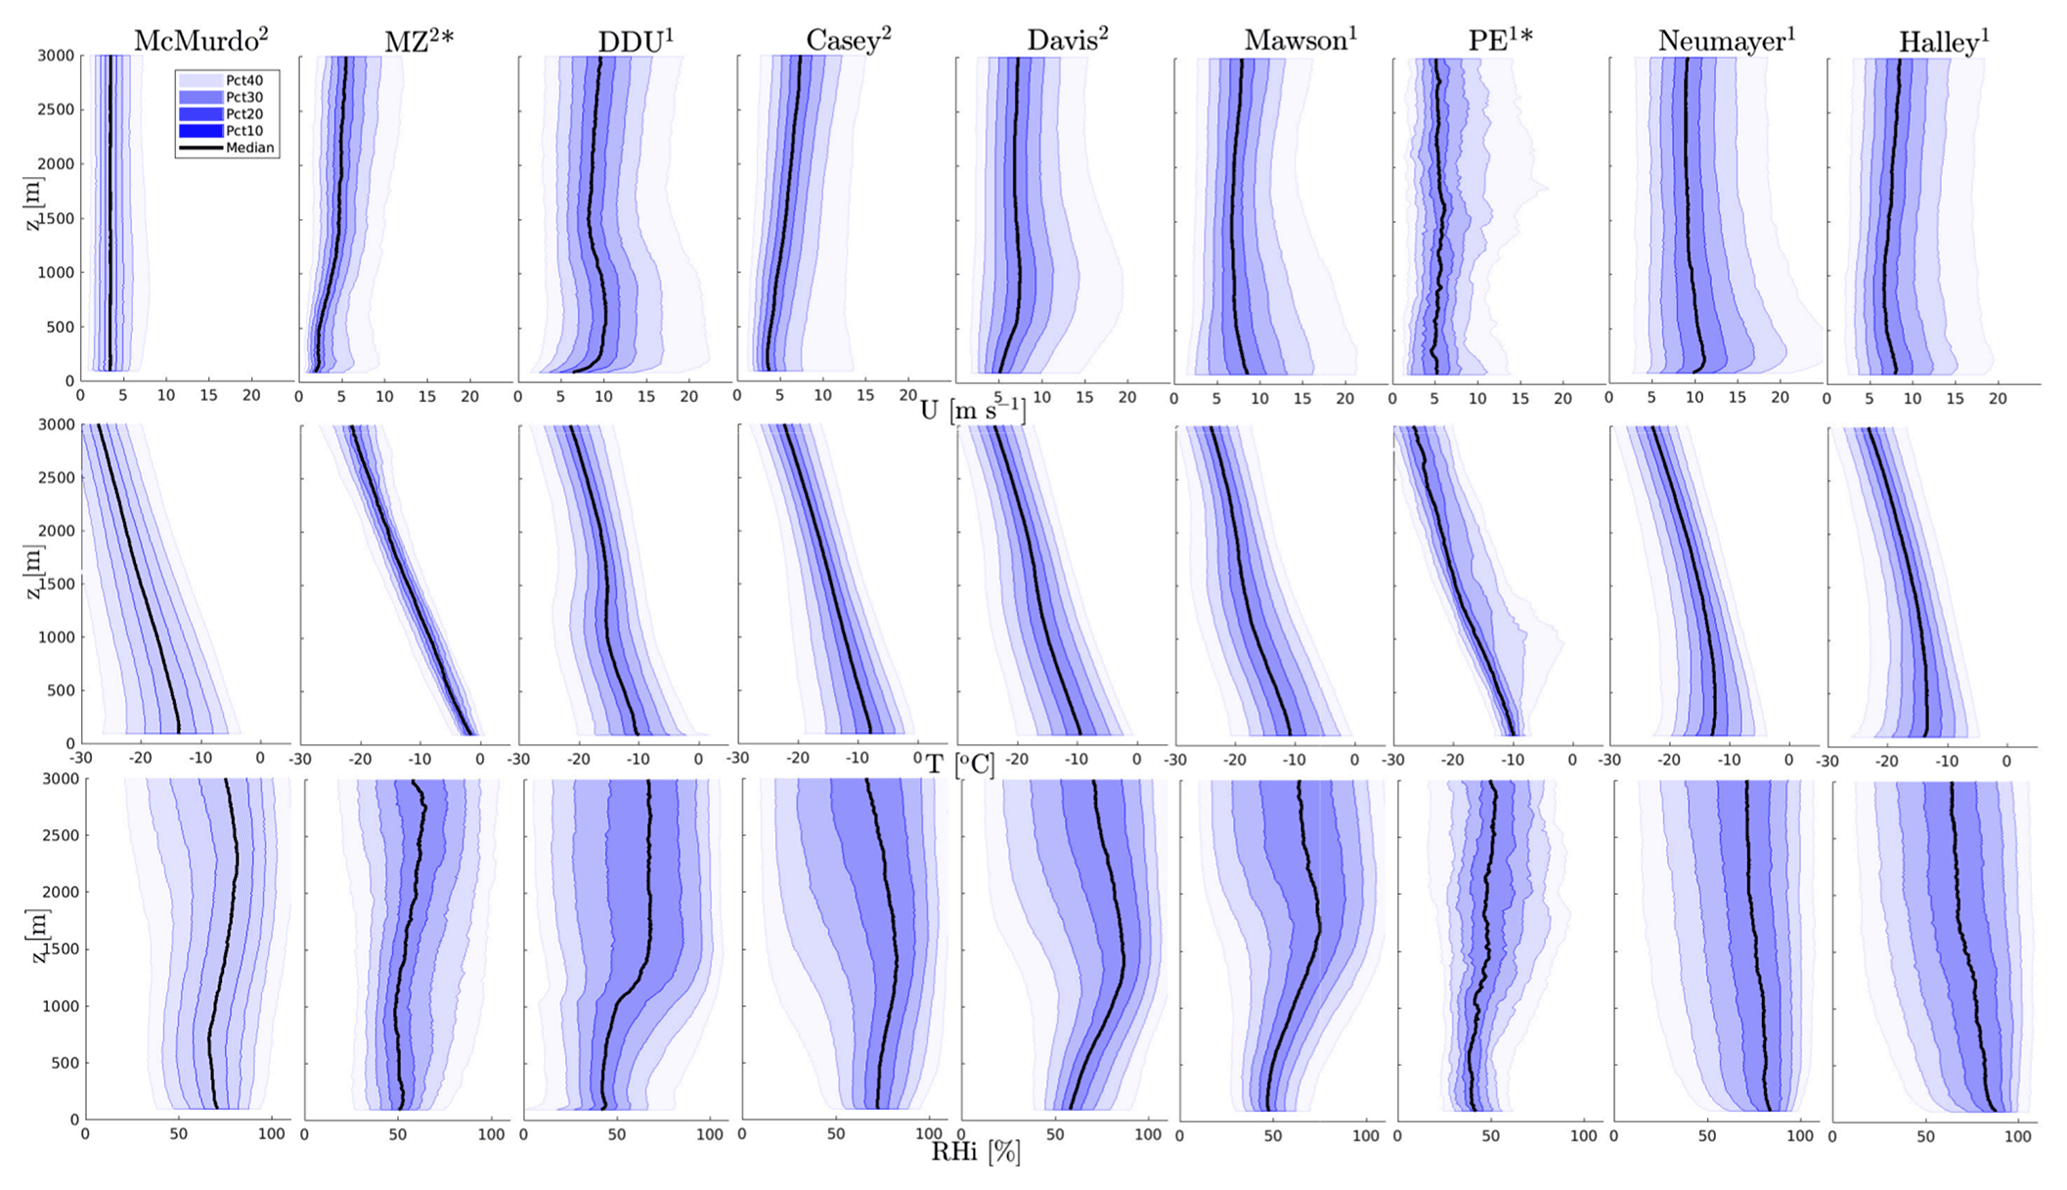
Figure 2Vertical profiles of the annual wind speed (top row), temperature (middle row) and relative humidity with respect to ice (bottom row) from radiosonde measurements at nine Antarctic stations. Black lines are the medians, colored lines refer to the 10th, 20th, 30th, 40th, 60th, 70th, 80th and 90th percentiles. In the legend, “Pctx” refers to the shaded area that covers x percent of the data greater than the median and x percent of the data lower than it. The altitude z is above ground level. Numbers in exponential form next to station names in the title indicate the number of radiosoundings per day at the corresponding station. The “*” symbol labels the two stations for which only data from December to February are shown.
3.1.2 Seasonal statistics
A comparison of the wind, temperature and relative humidity profiles between the two extreme seasons – summer (December–January–February, DJF) and winter (June–July–August, JJA) – is depicted in Fig. 3. We consider here two stations at which the typical flow is katabatic – DDU and Mawson – one station over an ice shelf – Halley – and the McMurdo station where the vertical structure of the troposphere is influenced by the complex terrain at the foot of the Transantarctic Mountains. One can point out stronger wind speed at low levels in winter than in summer at the Mawson and Halley stations, consistent with more stable boundary layers on the plateau and subsequent stronger katabatic winds as well as stronger large-scale pressure gradients (Van den Broeke and Van Lipzig, 2003). Such an increase is not visible at the DDU station neither in the median nor in the percentiles. The absence of strong seasonality in the low-level wind speed at DDU is in agreement with surface observations in König-Langlo et al. (1998), while measurements at meteorological stations a few tens of kilometers further inland reveal significantly stronger wind speed in winter than in summer (e.g., Vignon et al., 2018). This suggests that a slowing down mechanism at the coast that should be particularly active in winter – like the pressure gradient force associated with the piling up of cold air over sea ice – may damp the seasonal cycle. At the Halley, Mawson and DDU stations, the wind direction at z=500 m is almost constant throughout the year, reflecting the strong orographic influence in shaping the low-level flow at these three locations. It is also worth noting that, unlike in summer, the JJA median profile of wind speed at DDU, Mawson and Halley show a significant increase with increasing height above 2000 m. This may be explained by the location of the edge of the polar vortex – which is stronger in winter – that lies closer to edge of the continent in winter and can be responsible for a significant vertical gradient of the wind speed even in the mid-troposphere (König-Langlo et al., 1998).
At the McMurdo station, the wind speed is slightly stronger in winter and it is vertically homogeneous over the first 3000 m in both DJF and JJA seasons. Temperatures at the four stations are naturally warmer in summer than in winter, but the capping inversion at DDU and Mawson above the katabatic layer is more pronounced in JJA. Likewise, the surface-based temperature inversion over Halley is not present in summer. Note that, due to the diurnal cycle of the insolation during the summer season, summer vertical profiles may depend on the local time of the sounding and may not be considered as climatologically representative. The temporal representativity of radiosoundings will be further discussed in Sect. 4.1. The relative humidity profile at McMurdo shows a clear seasonality, with more humid air (relatively) above 2000 m in summer. This is consistent with the summer wind rose at z=2000 m with more frequent flow from the east compared to the winter season. Easterly winds at McMurdo generally correspond to the advection of air masses that transit over the Ross Ice Shelf or Ross Sea and that do not directly come from the dry atmosphere over the ice sheet. The relatively dry katabatic layer at the DDU and Mawson stations is well visible in the summer and winter RHi profiles, with an especially pronounced “dry concavity” in winter at DDU. Interestingly, the winter median profile of RHi at the DDU station slightly increases with decreasing height in the first few hundred meters above the surface. Stronger water turbulent fluxes at the surface in winter are hardly probable since there is no open ocean close to the station in winter, while it is often the case in summer. This local maxima in the profiles may thus be attributed to the presence of blowing snow in the near-surface flow, which is more frequent in winter due to stronger katabatic winds on the ice sheet and to a better snow surface erodibility (Amory et al., 2017).
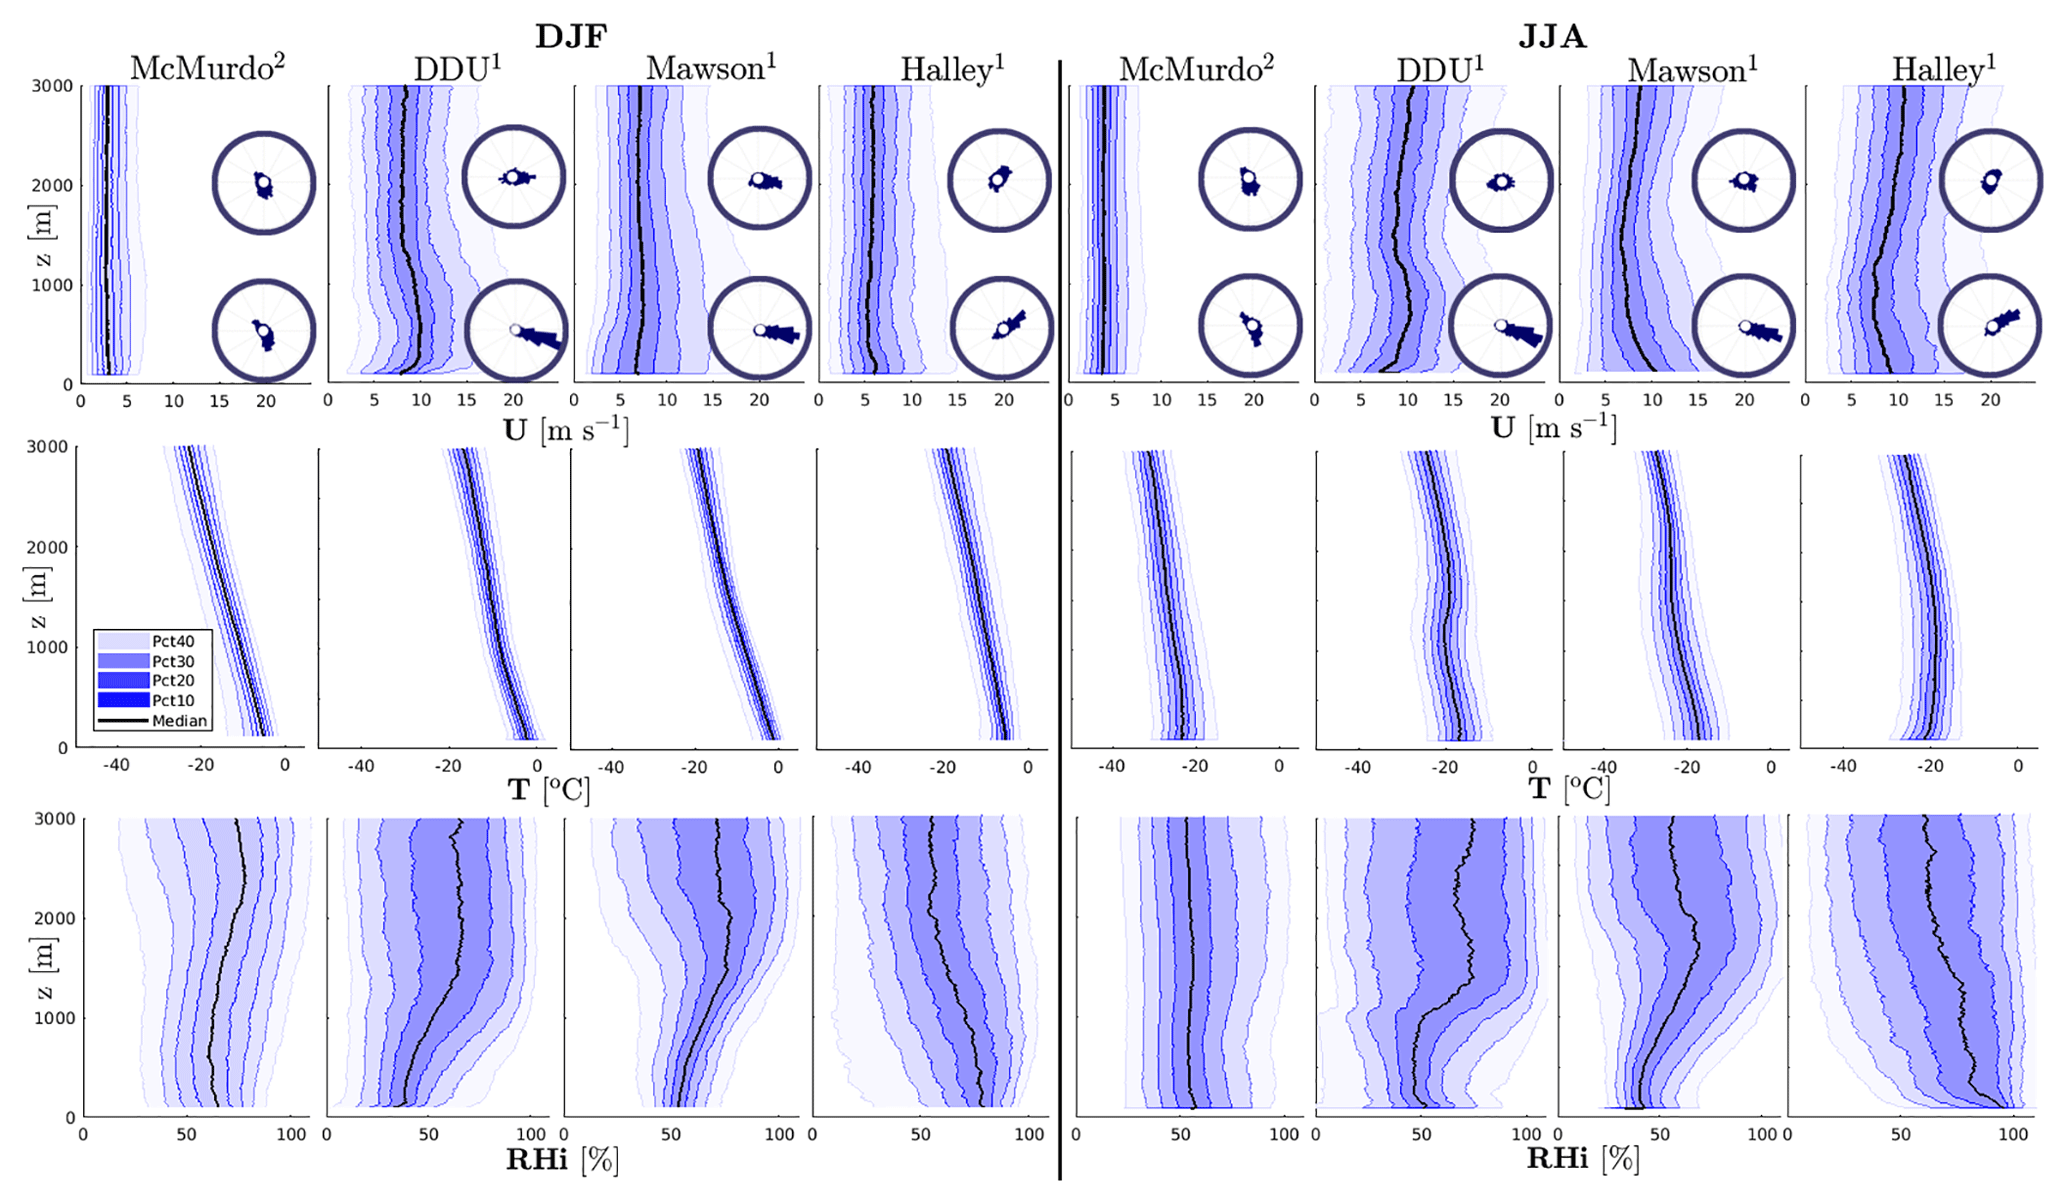
Figure 3DJF (left panels) and JJA (right panels) vertical profiles of the of the wind speed (top row), temperature (middle row) and relative humidity with respect to ice (bottom row) from radiosonde measurements at four Antarctic stations. Black lines are the medians, colored shadings refer to the 10th, 20th, 30th, 40th, 60th, 70th, 80th and 90th percentiles. In the legend, “Pctx” refers to the shaded area that covers x percent of the data greater than the median and x percent of the data lower than it. The altitude z is above ground level. Wind roses at z=500 and at z=2000 m are also plotted in the top row panels. Numbers in exponential form next to station names in the title indicate the number of radiosoundings per day at the corresponding station.
3.1.3 Statistics during precipitation events
Grazioli et al. (2017b) have stressed the role of katabatic winds in sublimating a significant part of the precipitation falling on the margins of the ice sheet. In this section, we examine the vertical structure of the wind and relative humidity during precipitation events at the six stations with the most intense winds. In agreement with Grazioli et al. (2017b), the second row of Fig. 4 shows that even during precipitation events, the atmosphere is unsaturated close to the surface at DDU, Casey, Davis and Mawson. The first row of Fig. 4 also shows that the wind is generally enhanced during precipitation events at the latter four stations (in comparison with the climatology in Fig. 2). Moreover, wind roses at z=500 m in the bottom row of Fig. 4 show that the flow at this altitude is mostly southeasterly, northeasterly, easterly and northeasterly at DDU, Casey, Mawson and Davis, respectively. This means that the low-level flow remains of continental origin during most of the precipitation events (see map in Fig.1). The strengthening of the continental low-level flow at the Antarctic coast during precipitation events is consistent with the general picture of moisture advection by synoptic cyclones documented in Naithani et al. (2002, 2003). As a synoptic weather system transits eastward off the Antarctic coast and approaches a station, it advects oceanic air with clouds towards the continent at its eastern flank. Note that largest amounts of moisture and precipitation are brought by large frontal systems not necessarily associated with very intense cyclones but with low-pressure systems with a large radius (Uotila et al., 2011). Meanwhile, the surface pressure over the ocean decreases, the downslope pressure difference increases, and subsequently the near-surface wind flow from the continent increases. Strong near-surface winds and low relative humidity are thus very favorable conditions for the occurrence of the mechanism of low-level sublimation of precipitation (LSP; Grazioli et al., 2017a) at the DDU, Mawson, Davis and Casey stations. Note that even during precipitation events, the relative humidity can be as low as 25 % (26 %) above z=2000 m (below z=500 m) at the DDU station. These situations often correspond to precipitation from clouds – associated with northerly warm advection – above 3000 m and moving above a remaining deep layer of continental flow from the interior of the ice sheet. The low near-surface humidity values could be partially attributed to the precipitation conditioning by ERA5 data that may lead to the inclusion of spurious profiles (i.e., not corresponding to actual precipitation at the station) in the “precipitation subset”. However, Durán-Alarcón et al. (2019) also show low values of RHi in the first 3000 m a.g.l. at DDU when conditioning the radiosonde profiles to precipitation and virga events from in situ radar data, confirming the actual concomitant occurrences of precipitation and low near-surface relative humidity at DDU.
Figure 4 shows that, despite enhanced wind speed at the Neumayer and Halley stations, the first 3000 m of atmosphere are completely saturated during precipitation events, reflecting the likely absence of the LSP mechanism at these stations. For instance, the wind rose at z=500 m at Halley shows that the wind at this station during precipitation events is northeasterly, indicating a flow from the coastal edge of the Brunt Ice Shelf and not from the interior of the ice sheet. This observation sheds light on the geographical discrepancies of the LSP around the coast of East Antarctica.
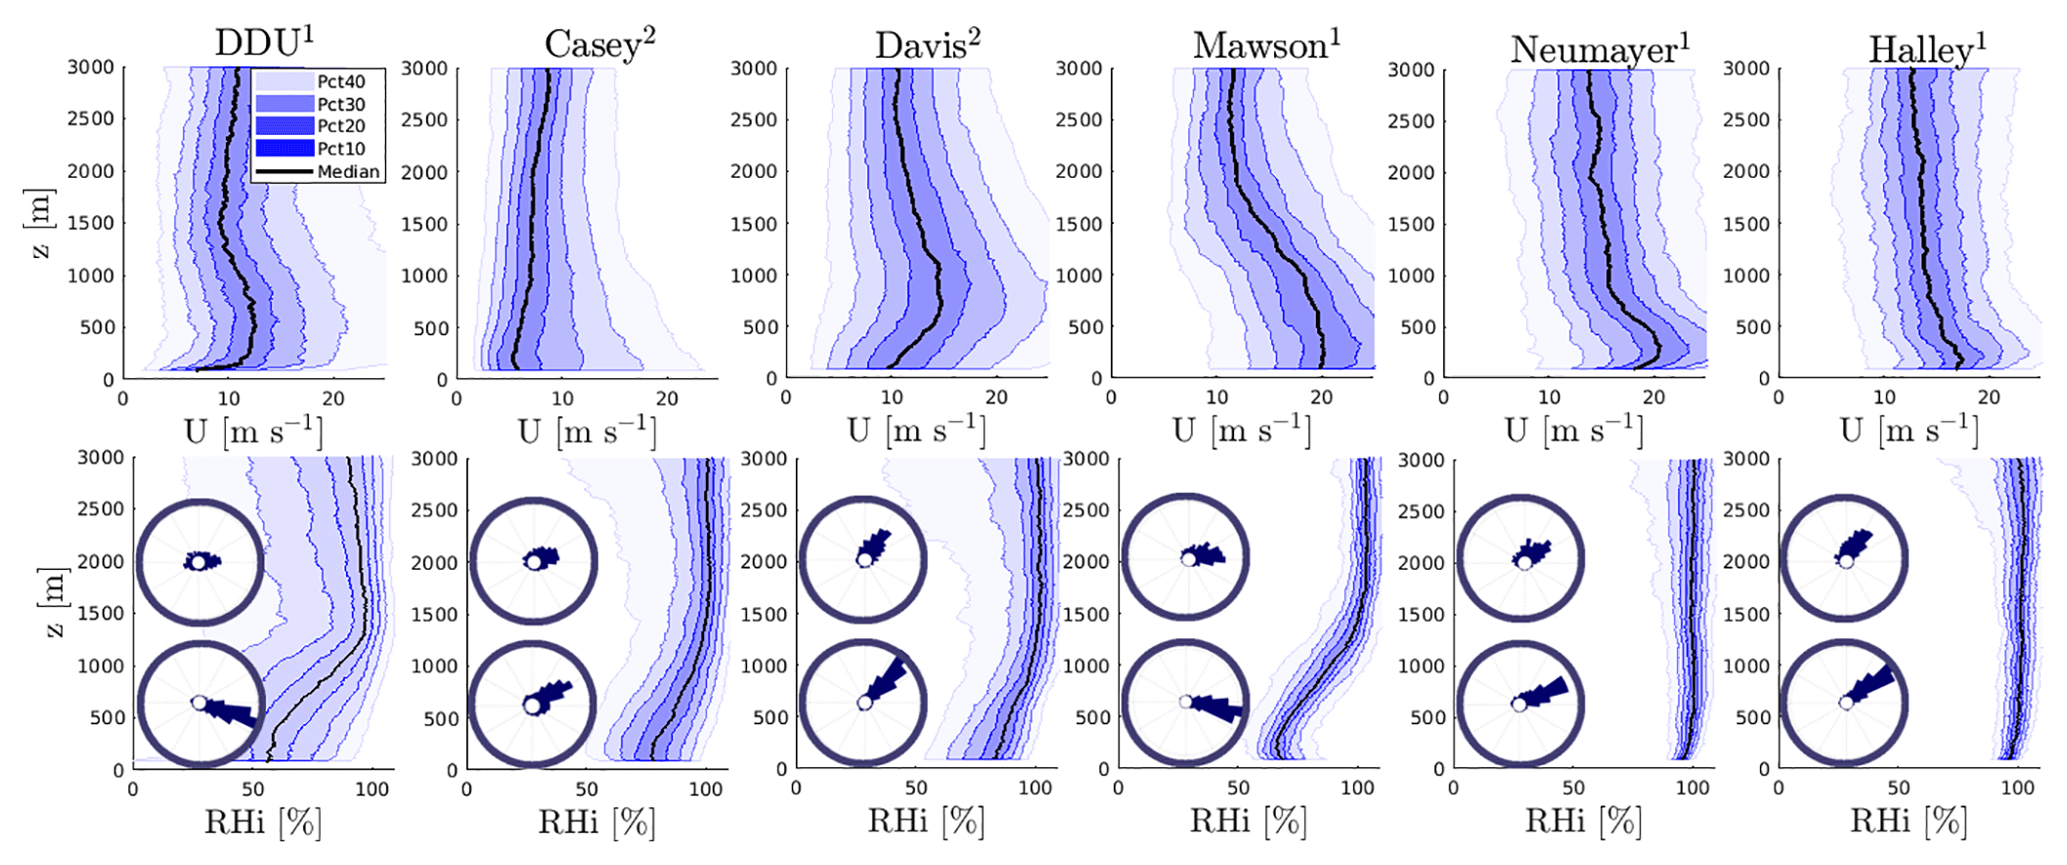
Figure 4Vertical profiles of the wind speed (top row) and relative humidity with respect to ice (bottom row) from radiosonde measurements at five Antarctic stations along the eastern Antarctic coast. Data sets are restricted to precipitation cases. Black lines are the medians, colored lines refer to the 10th, 20th, 30th, 40th, 60th, 70th, 80th and 90th percentiles. In the legend, “Pctx” refers to the shaded area that covers x percent of the data greater than the median and x percent of the data lower than it. The altitude z is above ground level. Wind roses (conditioned to precipitation events) at z=500 and z=2000 m are plotted in the lower row panels. Numbers in exponential form next to station names indicate the number of radiosoundings per day at the corresponding station.
3.2 Evaluation of the vertical profile statistics in ERA-I, ERA5 and Polar WRF
In this section, we assess the ability of ERA-I, ERA5 and Polar WRF to accurately reproduce the vertical structure of the low troposphere at the nine Antarctic stations. It is worth remembering that, unlike the free-running Polar WRF simulation, ERA-I and ERA5 reanalyses are not fully independent from radiosoundings since they frequently assimilate them at low vertical resolution (except at the PE station). Note also that for complementing the figures presented in this section, the reader can refer to figures similar to Fig. 2 for the ERA-I, ERA5 and Polar WRF data sets as well as a figure showing median and interquartile differences for all stations and all variables in the Supplement (Figs. S3, S4, S5, S6 and S7).
3.2.1 Wind
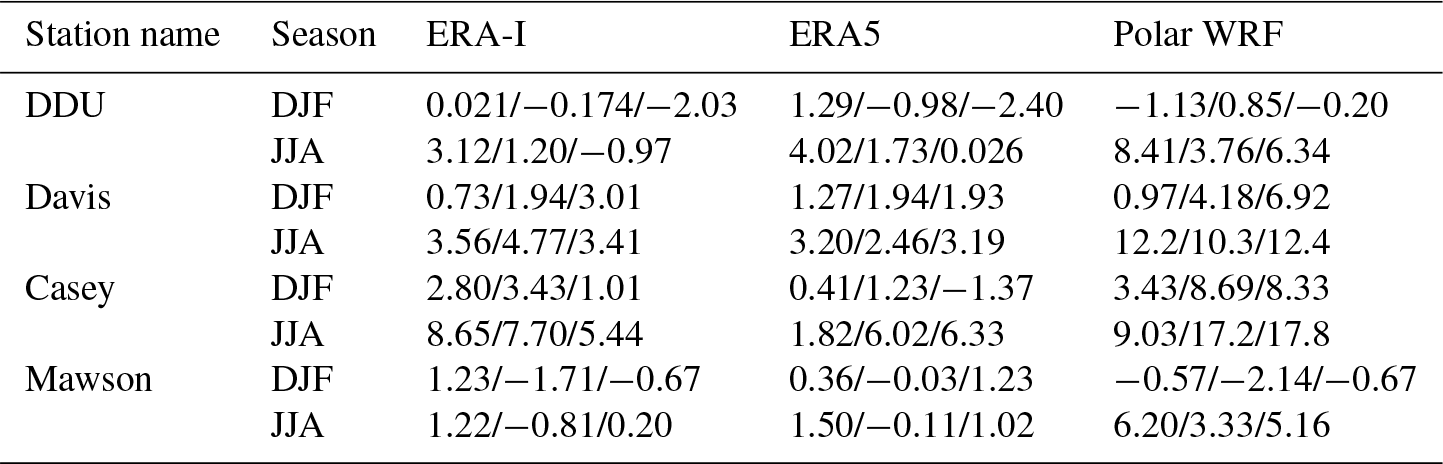
Figure 5 shows the differences of yearly median, 80–20th interquartile and 95–5th interquartile of wind speed with respect to radiosonde data at the nine stations. This figure can be analysed in parallel with Fig. 6, which compares the directional constancy at z=500 m (dotted axes) and z=2000 m (solid axes) in the different data sets. Figure S6 also provides the comparison of the statistics for the zonal and meridional components of the wind separately. Above 2000 m a.g.l., the median and interquartile absolute differences of the wind speed are generally less than 3 m s−1 in ERA-I and ERA5. The mid-troposphere circulation and its variability are thus reasonably well reproduced over the coastal East Antarctic margins in the reanalyses. Polar WRF often shows slightly higher values of the interquartile differences and it significantly overestimates the directional constancy at z=2000 m at all stations and especially in the Ross sector (McMurdo and MZ stations; see Fig. 6). This too directionally constant flow combined with an overestimation of the variability of the wind speed at McMurdo (Fig. 7a) particularly questions the ability of a model running at 35 km resolution to represent the local flow, even at z=2000 m, in Antarctic regions with complex orography. This also suggests that in reanalyses with similar or coarser horizontal resolution, the data assimilation may play a substantial role in reproducing the wind statistics at the McMurdo and MZ stations. In katabatic regions, Polar WRF and reanalyses represent reasonably well the sharp increase in directional constancy from z=2000 to z=500 m that shows the contrast between the synoptic and the katabatic flows. However, significant deficiencies can be noted for the low-level wind speed, especially at DDU, Casey and Davis stations. At these three stations, the median and the interquartiles are overestimated in the three data sets. At the Davis and Casey stations, the simulated median low-level flow has an excessive westward velocity, while at DDU the median low-level wind has a too-pronounced southward component (Fig. S6). Smallest differences are generally observed for ERA5, even though large values of the 95–5th interquartile differences are noticeable, for instance, at Casey, where the value exceeds 5 m s−1 at z=500 m in the two ERA reanalyses. The largest differences are noticeable for Polar WRF, especially near the ground surface. These differences actually reflect a too-shallow and too-strong katabatic jet. Albeit observed in both summer and winter seasons, the near-surface wind speed overestimation is more pronounced in winter at the three stations and it only occurs in winter at the Mawson station (see Table 2). Section 4.3 will investigate the possible underlying causes of this strong katabatic wind deficiencies in Polar WRF. At the Neumayer and Halley stations, the statistics of the wind structure are well reproduced by the ERA5 reanalysis, while ERA-I underestimates the variability in the first 500 m above the surface with interquartile differences around −4 m s−1. Polar WRF shows correct statistics at Neumayer, but it overestimates the interquartiles as well as the directional constancy at Halley at both z=500 and z=2000 m (Fig. 6). This suggests an underestimation of the synoptic variability in the Halley region in the model and particularly an underestimation of large-scale southwesterly flows from the Weddell Sea (not shown). At the PE station, the summer distribution of the wind speed in reanalyses and Polar WRF significantly differs from the one from radiosonde data. At z=1000 m, the median difference is close to 8 m s−1 for the three data sets and Polar WRF shows a much stronger median wind speed overestimated by 4–8 m s−1 up to 3000 m. ERA-I shows a very excessive median wind speed in the first 1000 m, while in ERA5, the wind speed and variability are strongly overestimated between z=300 and z=1500 m. Note that these deficiencies are mostly due to an overestimation (in absolute value) of the westward component of the flow (Fig. S6). As PE is the sole station from which radiosonde data are not assimilated, these strong biases question the ability of the free IFS model at the considered horizontal resolution in reproducing the dynamics of Antarctic boundary layer, at least in the PE region where the air flow is strongly affected by the topography of the Sør Rondane Mountains.
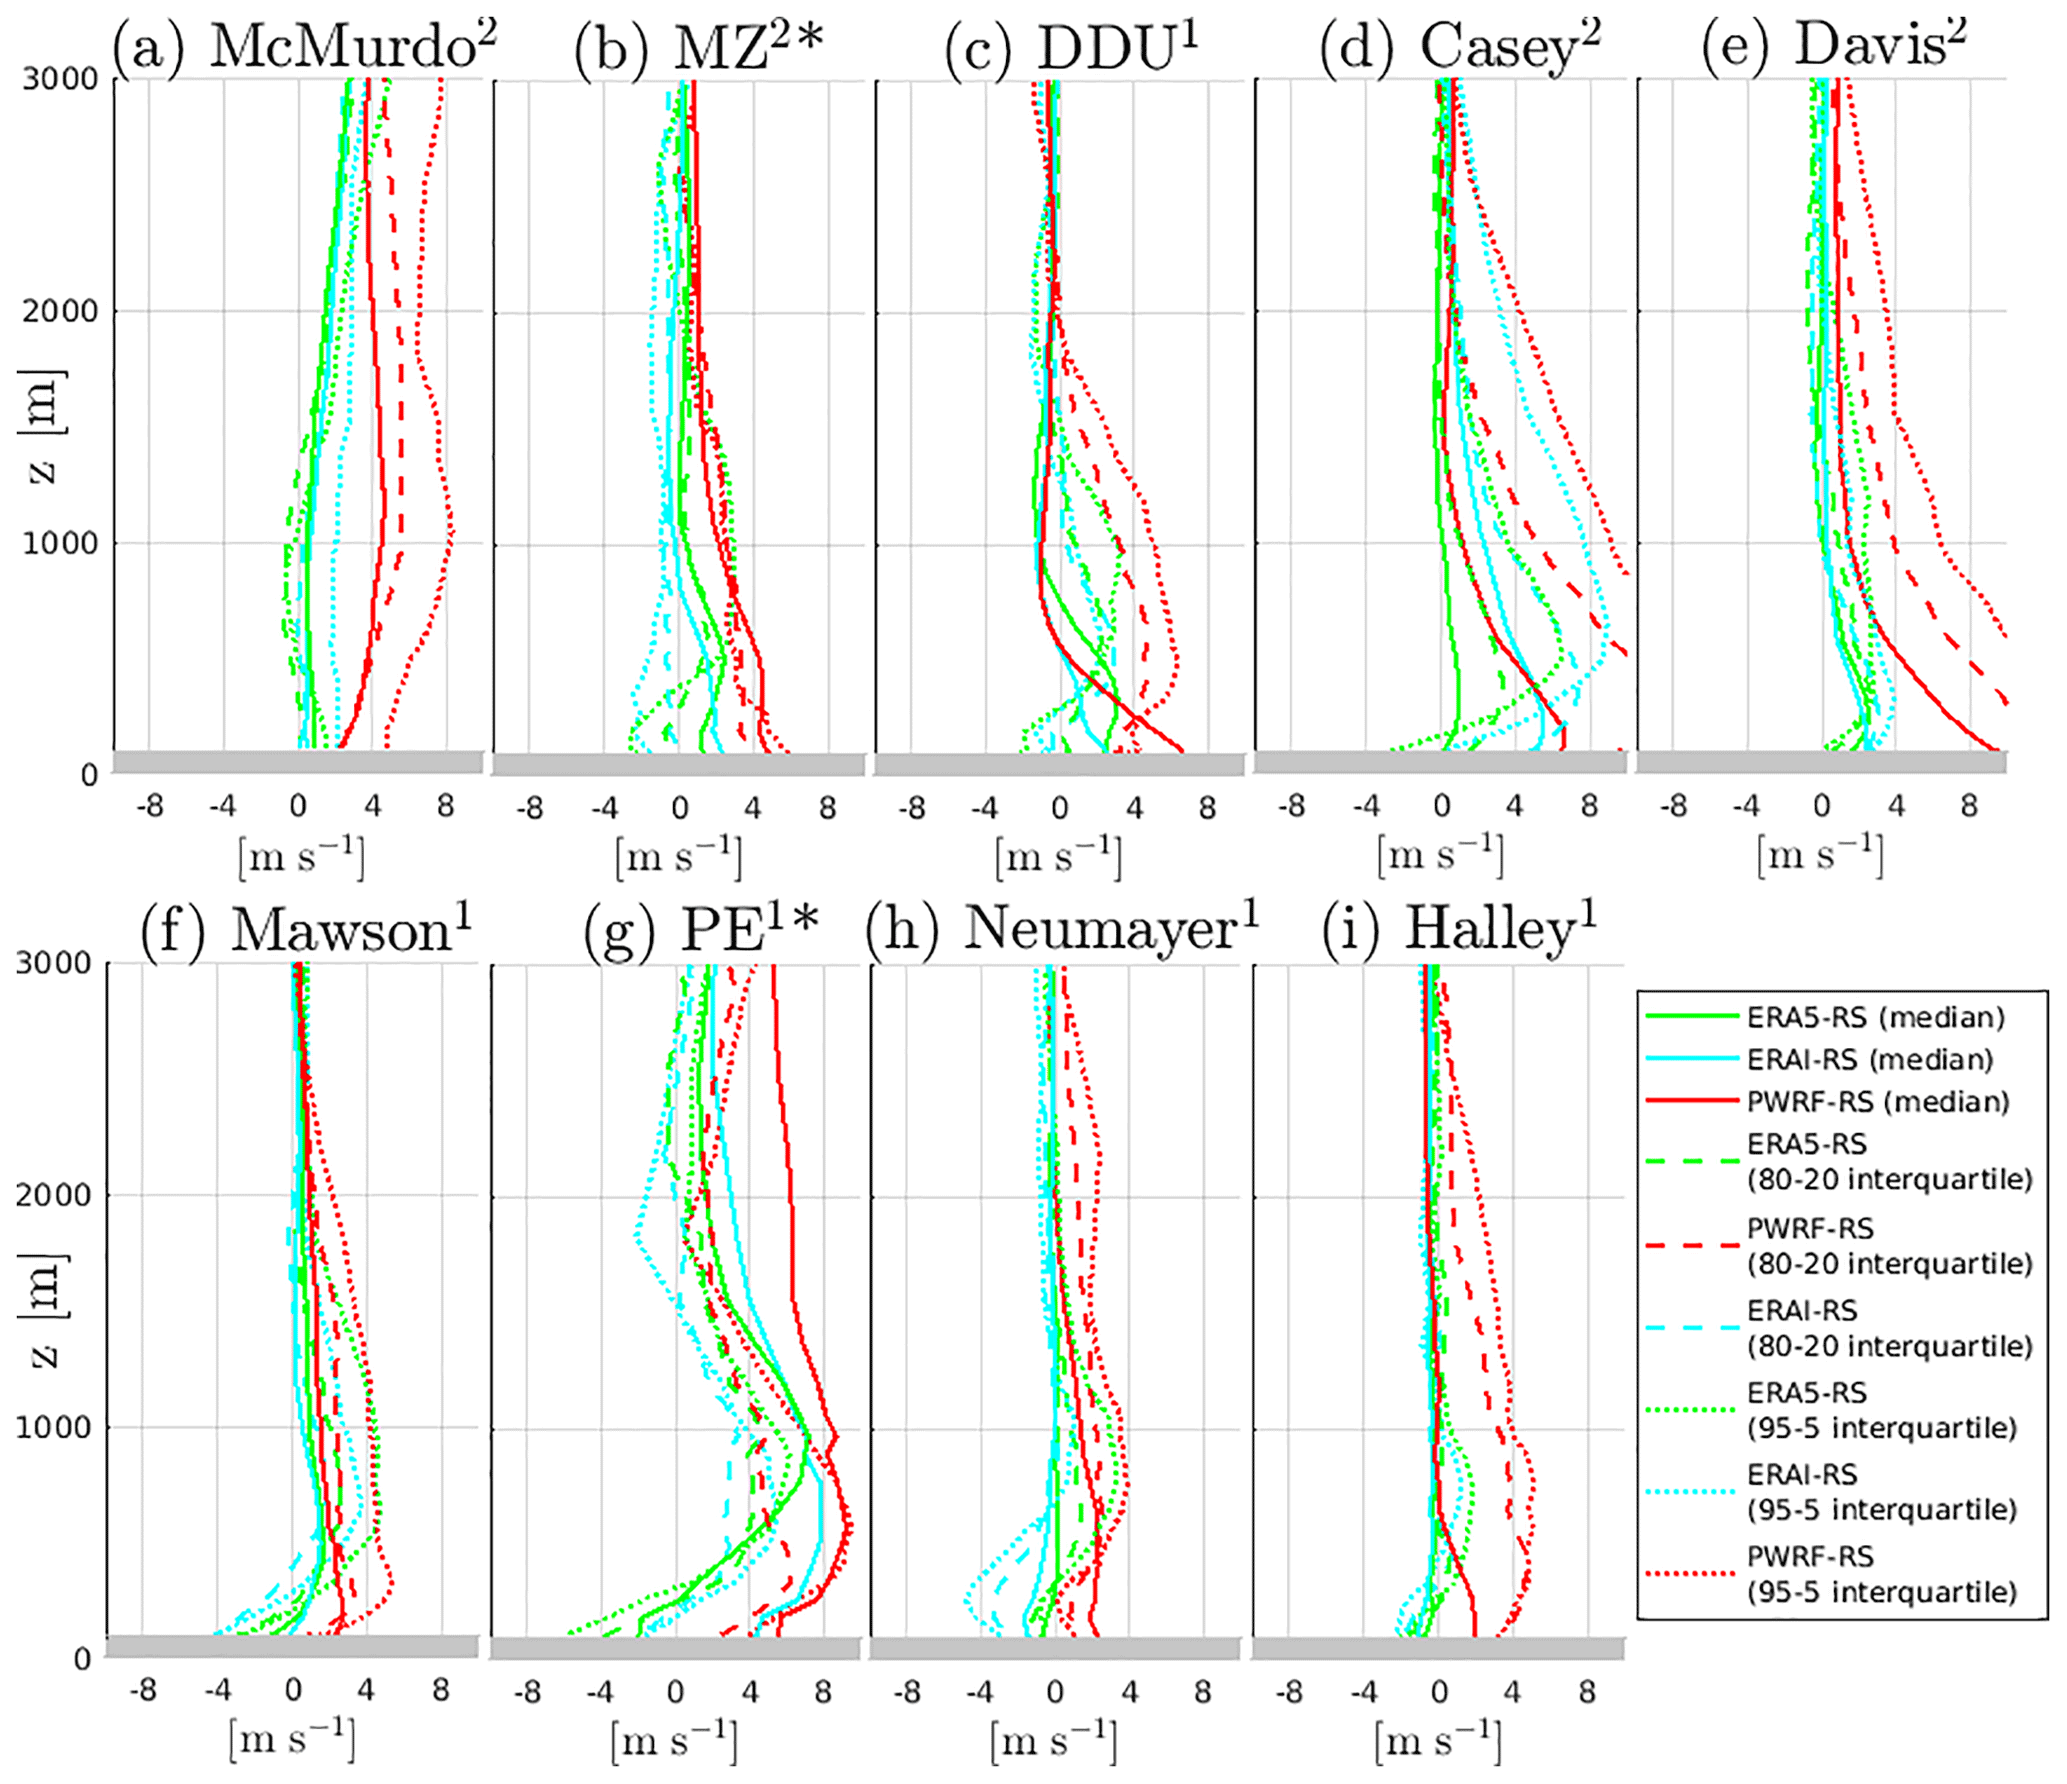
Figure 5Yearly median differences (solid lines), 80–20th interquartile difference (dashed lines) and 95–5th interquartile difference (dotted lines) with respect to radiosoundings for wind speed at nine Antarctic stations. Red, green and cyan lines refer to Polar WRF, ERA5 and ERA-I, respectively. Grey strips delimit the first 100 m above the ground surface. Polar WRF and ERA reanalyses are conditioned to radiosounding times. Numbers in exponential form next to station names in the title indicate the number of radiosoundings per day at the corresponding station. The “*” symbol labels the two stations for which only data from December to February are shown.
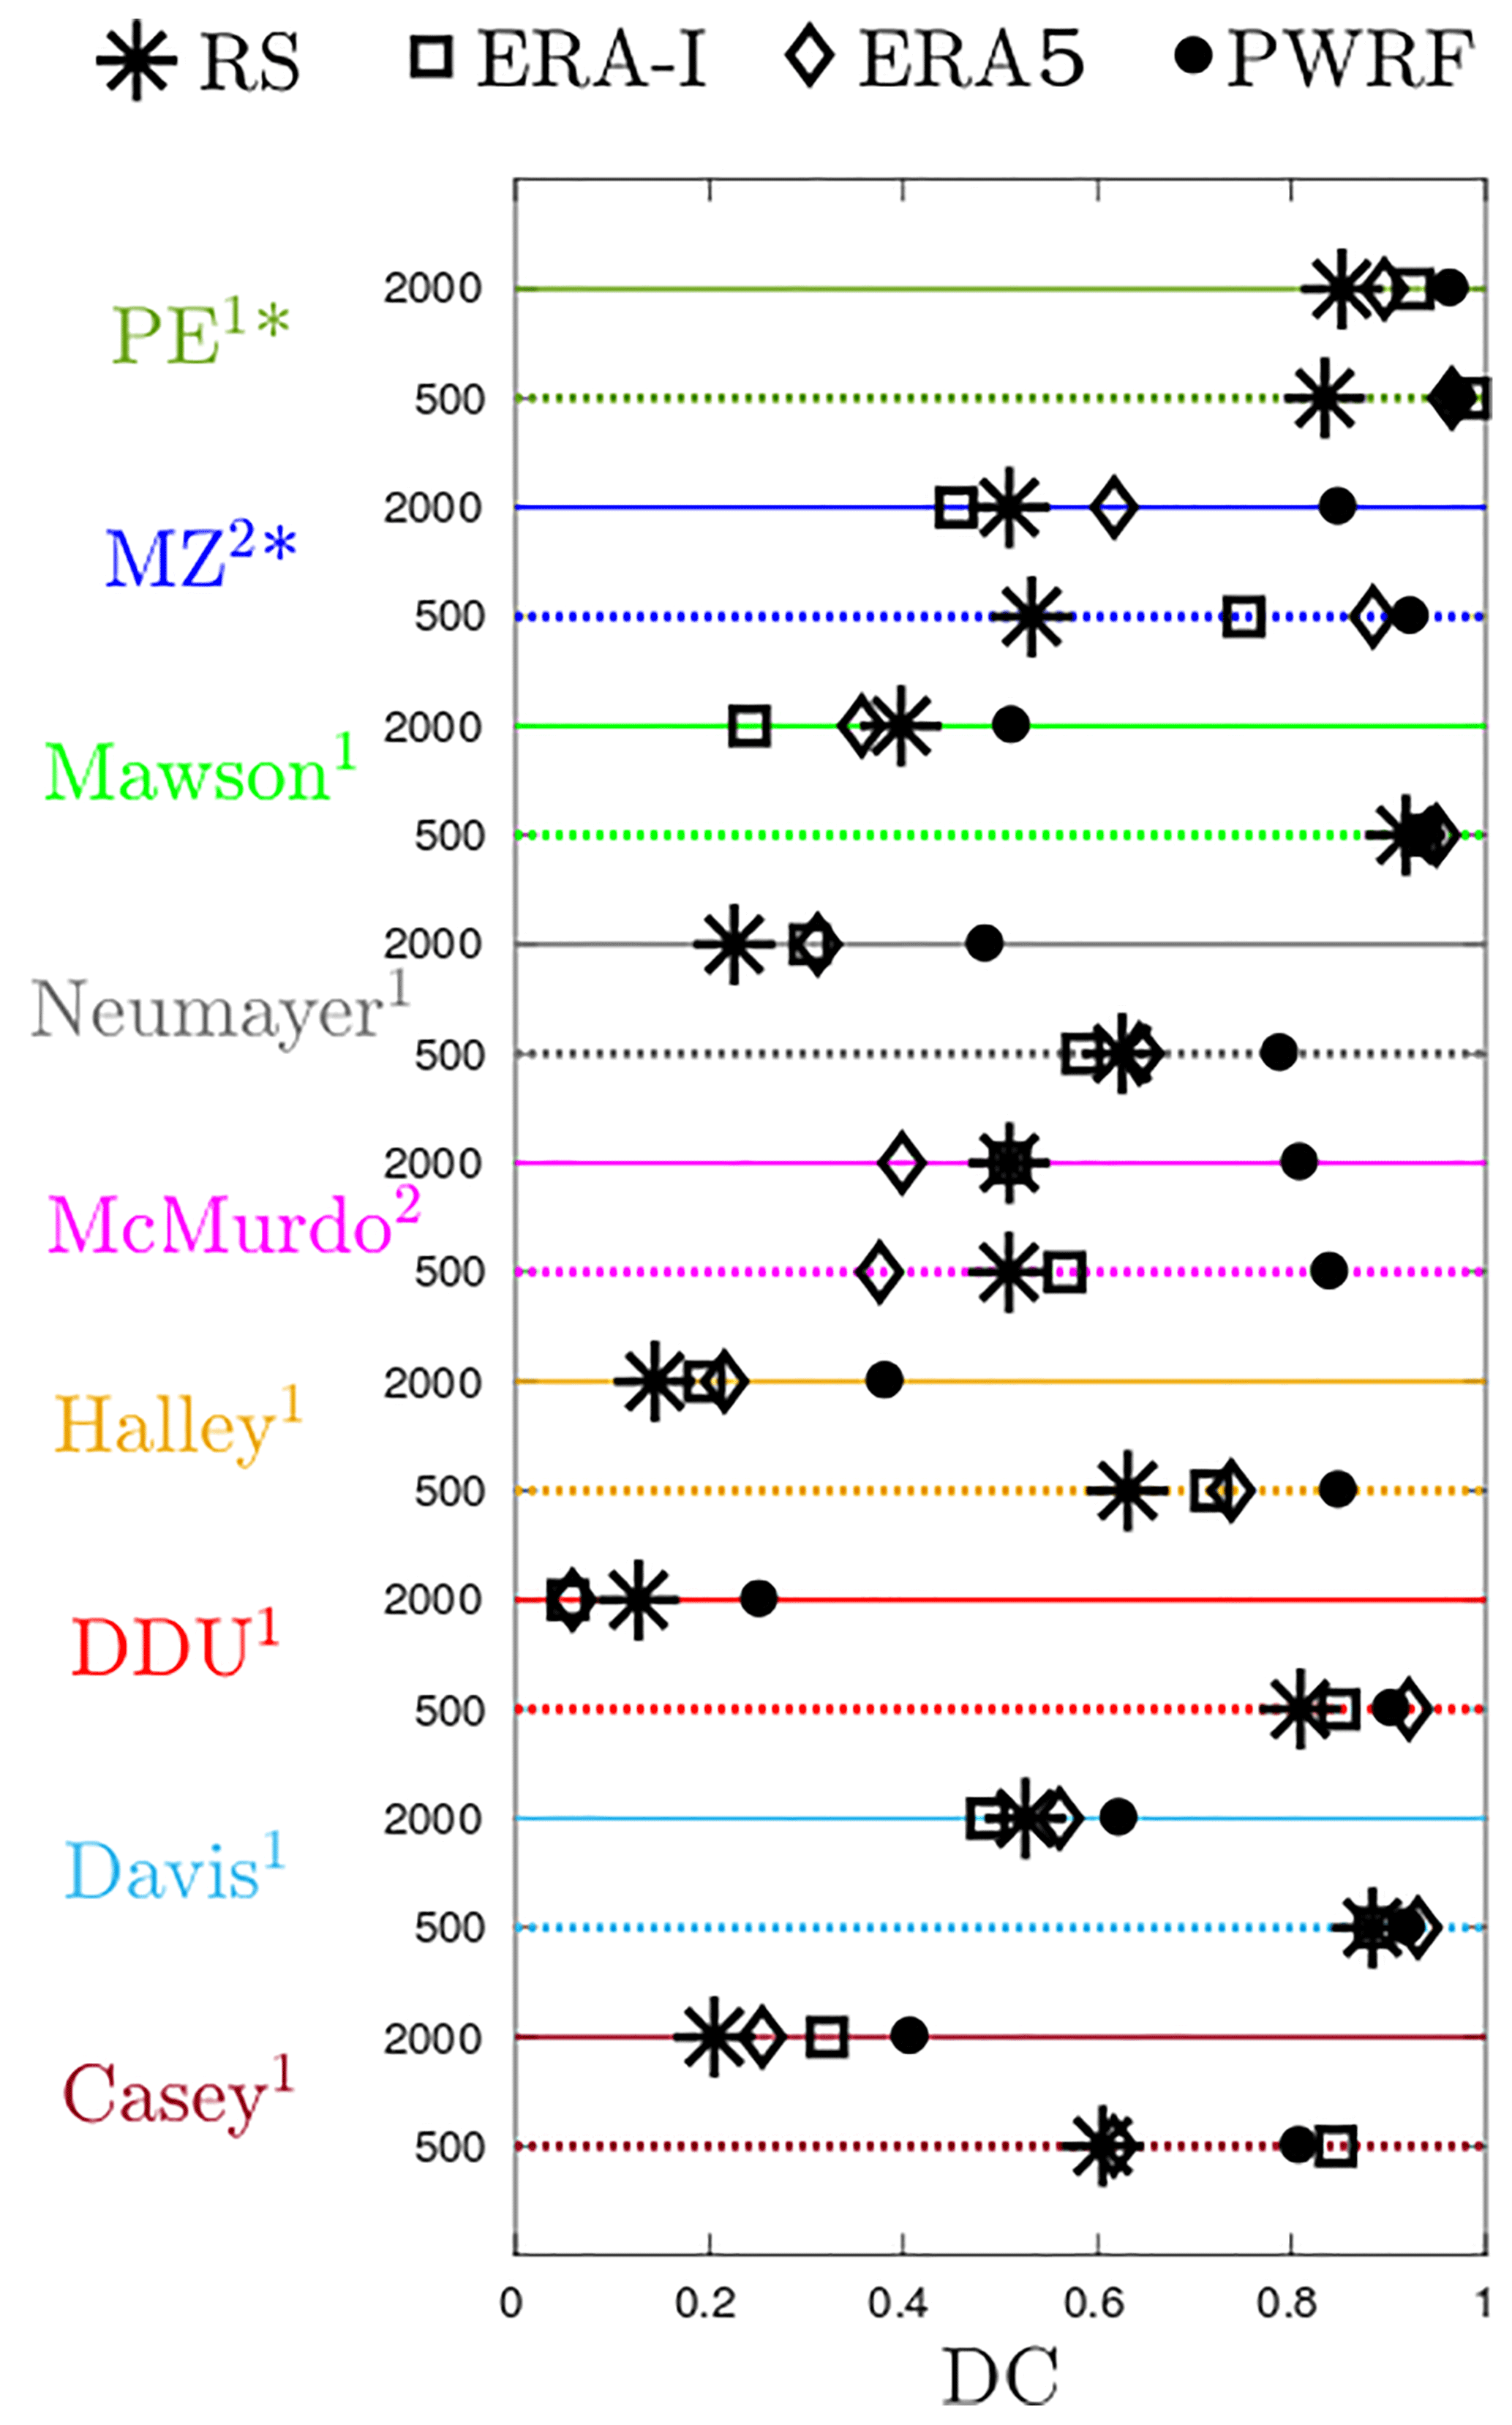
Figure 6Yearly directional constancy at z=500 m (dotted axes) and z=2000 m (solid axes) at nine Antarctic stations. Polar WRF (PWRF), ERA-I and ERA5 data are conditioned to radiosounding (RS) times. Numbers in exponential form next to station names indicate the number of radiosoundings per day at the corresponding station. The “*” symbol labels the two stations for which only data from December to February are shown.
Table 2Values of the median difference/80–20th interquartile difference/95–5th interquartile difference with respect to radiosonde wind speed data at z=250 m (in m s−1) at four Antarctic stations in katabatic regions. DJF and JJA subsets are distinguished.
3.2.2 Temperature
Figure 7 is similar to Fig. 5 but for temperature profiles at four stations with very different yearly temperature statistics (see Fig. 2). At Davis, not only the median but also the variability is well reproduced by ERA-I, ERA5 and Polar WRF. This result can be extended to the stations in katabatic regions: Mawson, DDU and Casey. A cold median bias between 2 and 4 ∘C can however be noticed at Mawson in ERA-I (see Fig. S7), which can be partly explained by the more inland location of the nearest ERA-I grid point. At the Halley station, ERA-I and ERA5 profiles are very close to those from radiosonde data. Polar WRF also shows realistic median profiles, but it overestimates the interquartiles in the first 2000 m. Similar observations can be made for Neumayer station (Fig. S7). These two results are actually a consequence of a warm (and moist) bias in summer and a cold bias in winter that compensate on average over the year (not shown). The cold winter bias can be explained by too-frequent low-level easterly flows in the model, whereas the warm summer bias is probably due to the location of the nearest grid point in Polar WRF, which is closer to the ocean. The model is hence more prone to oceanic influences when the ocean is free of ice. At the McMurdo station, ERA-I and ERA5 also show realistic temperature median profiles and variability, consistently with the bi-daily assimilation of radiosonde at this station. Polar WRF shows a reasonable median profile, but it overestimates the variability. This overestimation can be explained by too-frequent warm (and moist) oceanic influences in spring and autumn (not shown).
The strongest temperature differences between reanalyses and Polar WRF with respect to radiosonde data are at the PE station (in summer). Low-level median profiles are too cold by ≈2 ∘C in reanalyses and too warm by slightly higher values in Polar WRF. The interquartile difference – especially the 95–5th interquartile difference – are underestimated with absolute values exceeding 10 ∘C at z≈1000 m (out of graph limits). This observation actually reflects the absence of deep surface-based inversions in Polar WRF and reanalyses at PE in summer at radiosonde launching time. In radiosonde data, the summer inversions are mostly observed in February, i.e., at the end of the summer period, when the length of the day period has already been reduced. Note that reanalyses and Polar WRF do reproduce surface-based inversions at the PE station during calm summer nights, but their timing does not exactly correspond to radiosounding times.
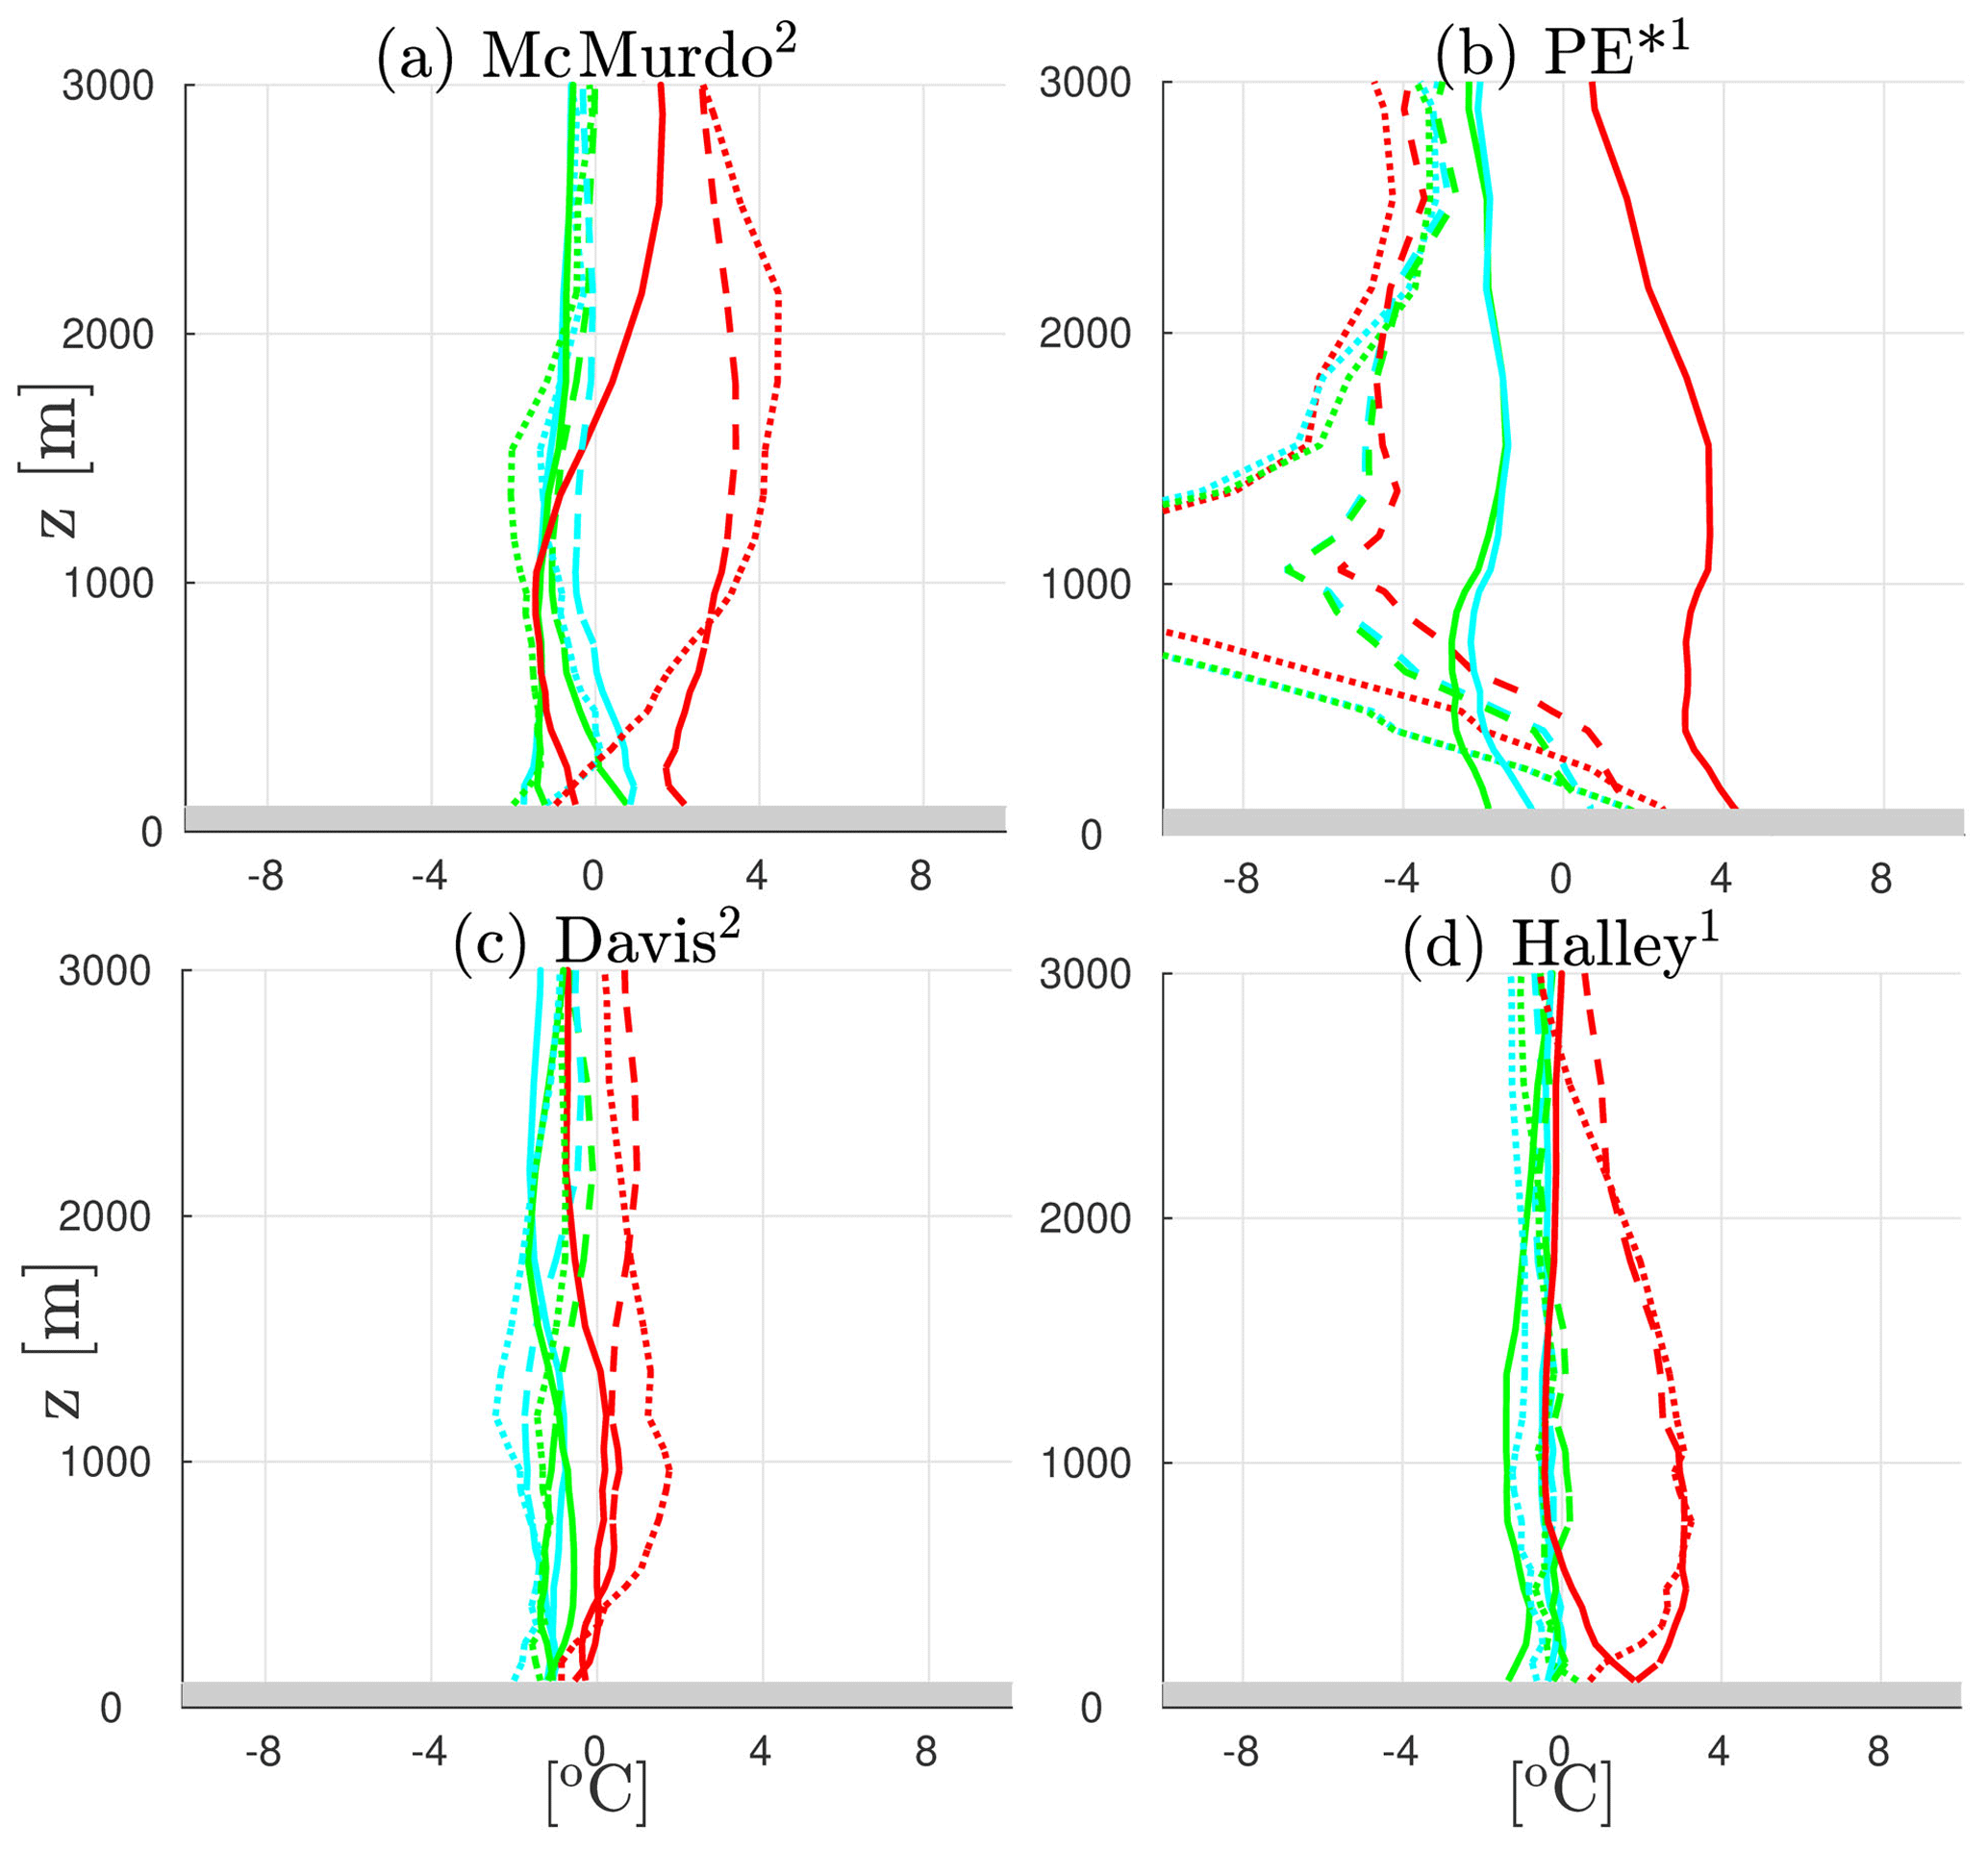
Figure 7Yearly median differences (solid lines), 80–20th interquartile difference (dashed lines) and 95–5th interquartile difference (dotted lines) with respect to radiosoundings for temperature at four Antarctic stations. Red, green and cyan lines refer to Polar WRF, ERA5 and ERA-I, respectively. Grey strips delimit the first 100 m above the ground surface. Polar WRF and ERA reanalyses are conditioned to radiosounding times. Numbers in exponential form next to station names in the title indicate the number of radiosoundings per day at the corresponding station. The “*” symbol labels the station for which only DJF data are shown.
3.2.3 Humidity
ERA reanalyses generally represent well the water vapor content in the low troposphere at all stations. One exception is at the MZ station, where ERA-I and ERA5 significantly underestimate the specific humidity in the first kilometer above the surface in summer, with median differences reaching approximately −0.50 and −0.85 g kg−1, respectively. Polar WRF show reasonable yearly median profiles of specific humidity, but the interquartiles are overestimated in the first 1000 m at almost all stations (see Fig. S1). This is actually explained by a summertime (DJF) overestimation of the water vapor content near the surface, with values reaching, for instance, 0.5, 1.1 and 0.65 g kg−1 at the Davis, DDU and Mawson stations, respectively. One likely cause for this moist bias is an overestimation of the surface water fluxes due to overestimated near-surface wind speed at most stations (see Sect. 3.2.1). It should also be noted that near the surface, balloons often sample air coming from the ice sheet or air in the local boundary layer, i.e., above the station terrain. However, in the model, meshes encompassing coastal stations are heterogeneous; i.e., they contain a fraction of land, sometimes sea ice and/or open ocean (see Table S1). As surface fluxes in a mesh are calculated as the weighted sum of fluxes over each subsurface, the comparison of surface water fluxes with those at an isolated station may thus be flawed. The same conclusion can be drawn for the near-surface specific humidity. Note that the comparison of observed summer near-surface humidity with that from the nearest fully continental model grid points is generally more satisfactory (not shown). It is also worth mentioning that in the versions of IFS used to make ERA-I and ERA5, grid boxes with a land fraction value above 0.5 are wholly treated as land, while those with a value below 0.5 are treated as ocean. Subsequently, when ERA grid boxes encompassing Antarctic stations are continental, the reanalyzed near-surface humidity profiles are not directly affected by fluxes from the ocean.
Regarding the relative humidity, the performance of both reanalyses and Polar WRF is a little less satisfactory. Generally, yearly median and interquartile differences are comprised between −25 % and +25 % (see Fig. S7). Figure 8 depicts the difference of RHi statistics at four stations in four distinct sectors along the East Antarctic rim. At the Halley station (Fig. 8b), the median and 80–20th interquartile profiles in the three data sets are reasonable but the 95–5th interquartile is underestimated in the two reanalysis products. Similar conclusions hold for Neumayer station. At the DDU station (Fig. 8c), one can point out the overestimation of the median RHi and an underestimation of the interquartiles at z=1000 m in particular in ERA-I and Polar WRF. The dry layer corresponding to the katabatic flow is therefore too shallow in the reanalyses and in Polar WRF. At the Mawson station (Fig. 8d), the three data sets show reasonable median RHi values. However, the interquartiles in the first 1000–1500 m above the surface are overestimated likely due to an of excess of water vapor in the lowest atmospheric layers during the summer season. Above 2000 m, the interquartiles are underestimated in the three data sets reaching values up to −23 % in ERA-I and ERA5 for the 95–5th interquartile. This is explained by an underestimation of very dry conditions (RHi < 30 %) compared to radiosonde data. Note that the performance of reanalyses and Polar WRF at the Davis and Casey stations is relatively similar (see Fig. S7).
At the McMurdo station (Fig. 8a), the three data sets overestimate the near-surface RHi close to the surface, and this occurs both in the summer and winter seasons (not shown). Indeed ERA-I, ERA5 and Polar WRF show a significant increase in RHi (median and percentiles) with decreasing height in the first 500 m above the surface while this feature is much less pronounced in radiosonde data.
A critical point to investigate for the surface mass balance of the ice sheet is the ability of reanalyses and Polar WRF to represent the RHi profiles during precipitation events. Figure 9 shows the median and interquartile differences of RHi during precipitation cases at the Mawson and DDU stations – i.e., the two stations with the most significant decrease in RHi in the katabatic layer (see Fig. 4) – as well as at the Neumayer and Halley stations where the lowest layers saturate or are close to saturation during precipitation events. At Halley and Neumayer, the median RHi values from ERA-I, ERA5 and Polar WRF are close to radiosonde data. The variability is also correct, but a significant underestimation of the 95–5th interquartile can be pointed out in the reanalyses above 1500 m. At the Mawson station, ERA5 shows a correct representation of the median profiles and of the variability of RHi, but ERA-I and Polar WRF slightly overestimate the median in the first 1000 m. At the DDU station, this overestimation is even further marked, with median differences reaching −12 %, −23 % and −29% in ERA5, ERA-I and Polar WRF, respectively. Another striking feature at DDU is the very strong underestimation of the interquartiles in the three data sets. Indeed, during precipitation events, the simulated and reanalyzed atmospheres above the katabatic layer is completely, or almost, saturated, leading to an unrealistically weak RHi variability.
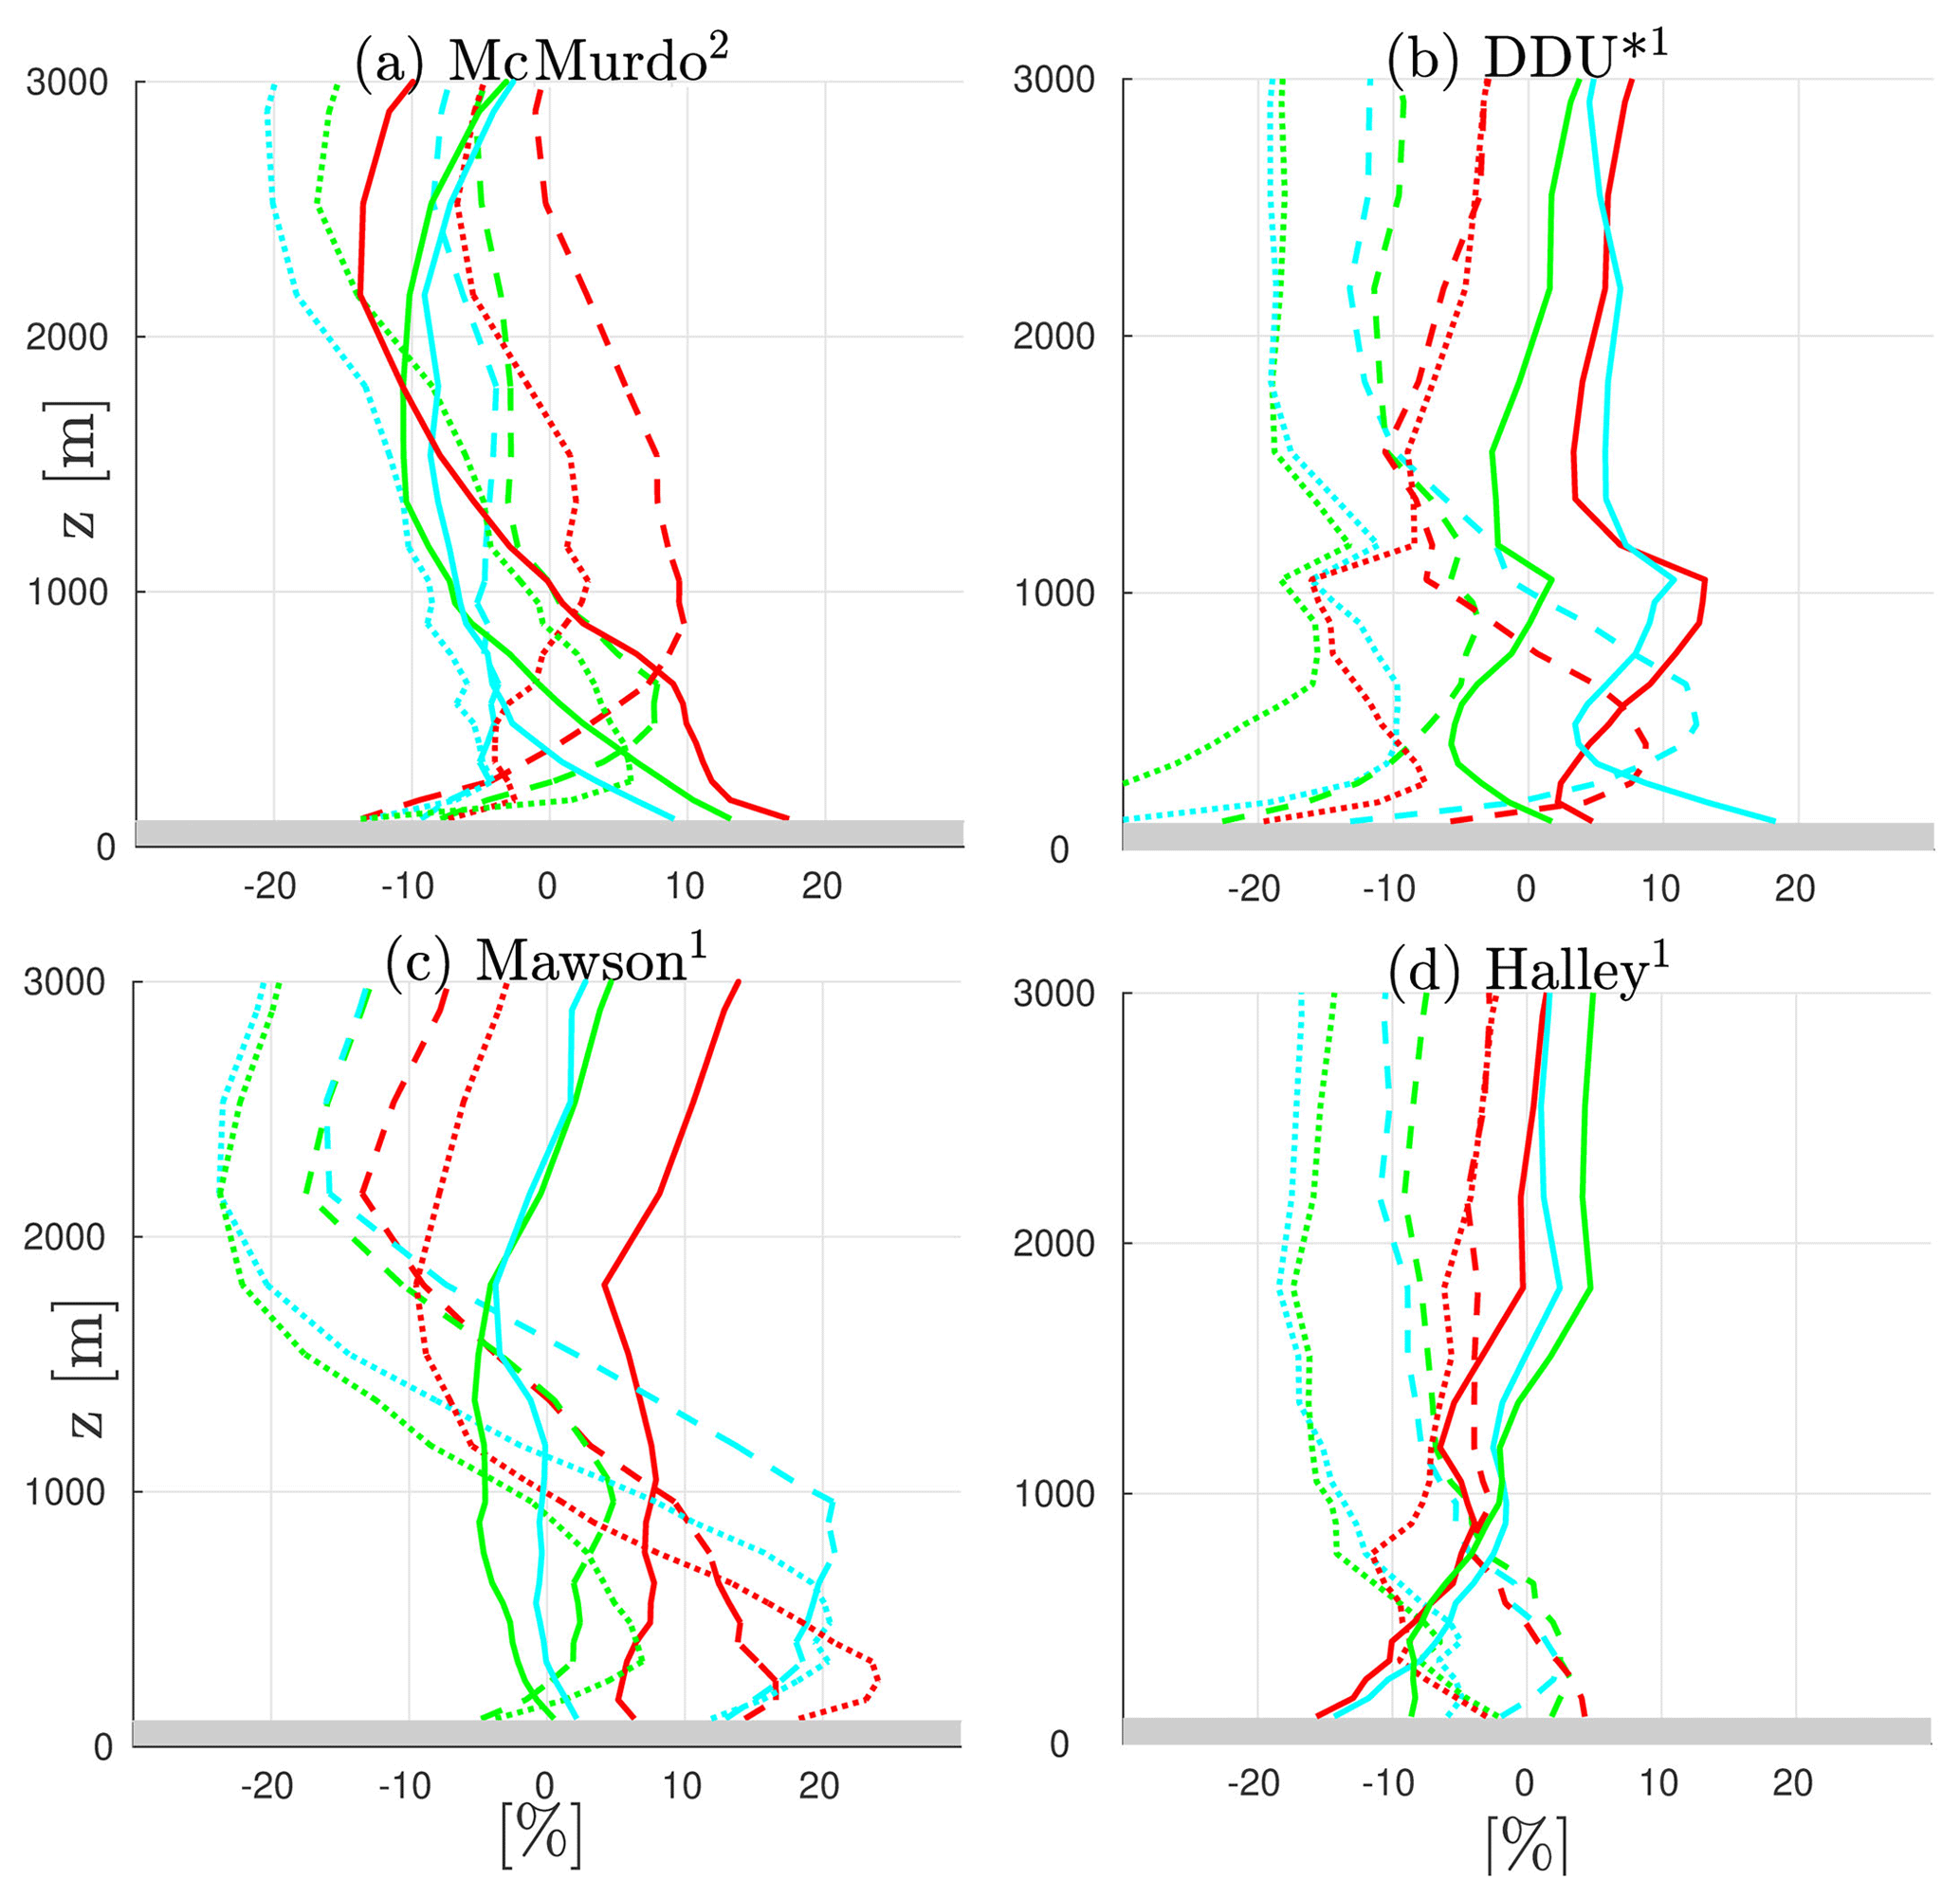
Figure 8Yearly median differences (solid lines), 80–20th interquartile difference (dashed lines) and 9–5th interquartile difference (dotted lines) with respect to radiosoundings of RHi at four Antarctic stations. Panels (a, b) show the DJF subset, panels (c, d) the JJA subset. Red, green and cyan lines refer to Polar WRF, ERA5 and ERA-I, respectively. Grey strips delimit the first 100 m above the ground surface. Numbers in exponential form next to station names in the title indicate the number of radiosoundings per day at the corresponding station.
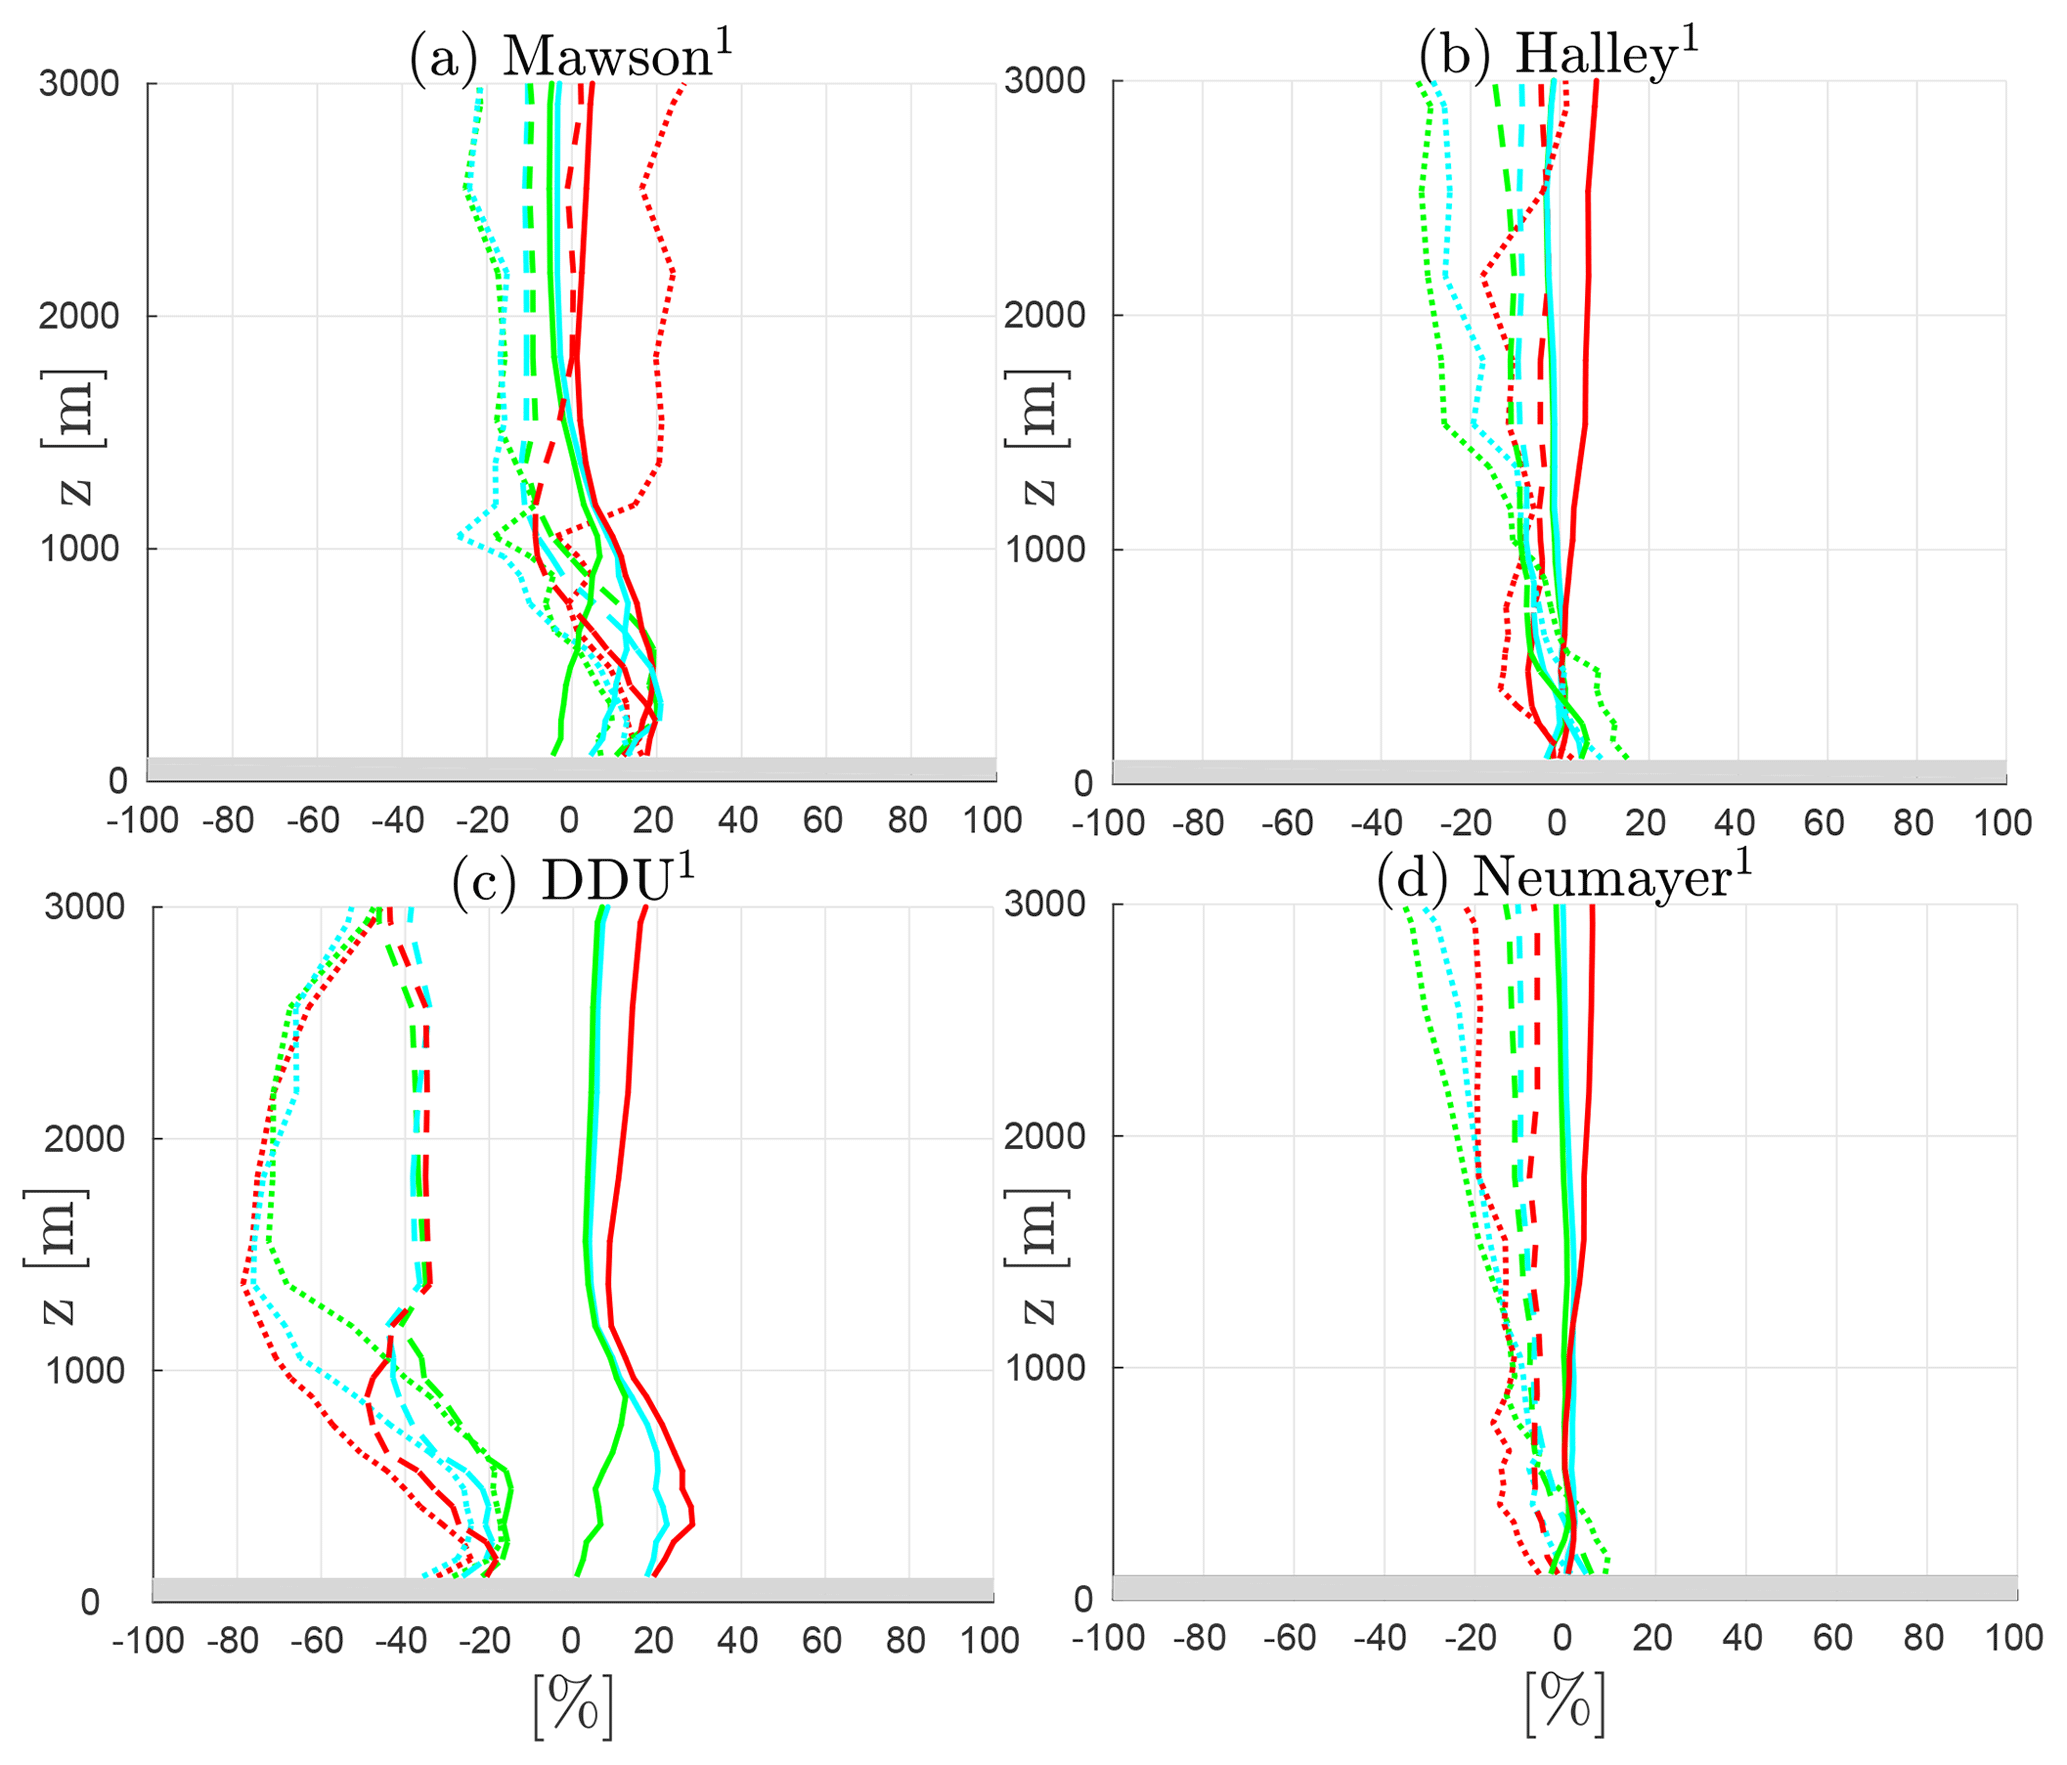
Figure 9Yearly median differences (solid lines), 80–20th interquartile difference (dashed lines) and 95–5th interquartile difference (dotted lines) with respect to radiosoundings for RHi during precipitation events at the Mawson, DDU, Halley and Neumayer stations. Red, green and cyan lines refer to Polar WRF, ERA5 and ERA-I, respectively. Grey strips delimit the first 100 m above the ground surface. Polar WRF and ERA reanalyses are conditioned to radiosounding times. Mind the different horizontal axis compared to Fig. 8.
4.1 Spatial and temporal representativity of radiosonde data
As radiosoundings sample the atmosphere once or twice a day at a given specific location, one can question the temporal and spatial representativity of the statistics presented in Sect. 3.1. One can indeed wonder to what extent an analysis based on radiosonde profiles provide a realistic picture of the whole – i.e., including the daily variability – temporal statistics at a given station and to what spatial extent the profiles at the nine Antarctic stations are representative of the full coastal rim of East Antarctica.
Figure 10 provides some elements of response about the temporal representativity by comparing the statistical profiles of wind speed and temperature at four stations from ERA5 reanalyses considering the full data set (magenta profiles) or the subset conditioned to radiosonde times (green profiles). During winter (Fig. 10c, d, g and h), median and 20–80th interquartile profiles are almost superimposed, suggesting that the 8-year period considered here is sufficiently long so that subsampling at radiosonde time does not significantly change the winter statistics.
In summer, one could expect a larger difference between both data sets since the insolation evolves with a diurnal cycle which may affect the diurnal variability of the boundary layer. At McMurdo (Fig. 10a), almost no difference between magenta and green profiles can be underlined, reflecting that the bi-daily sampling (00:00 and 12:00 UTC) is sufficient to capture most of the variability at the multi-annual scale. At the Mawson station, the wind and temperature profiles slightly differ in the first 1000 m above the surface. Wind and temperature subsampled at sounding times exhibit a lower variability and they are both higher. This is in agreement with the fact that sondes at Mawson are launched at 16:00 LT, i.e., during the diurnal warm phase of the boundary layer. At the Halley station, King et al. (2006) underlines the very weak summer diurnal cycle of near-surface temperature and the absence of diurnal variations of wind speed and boundary-layer height. This is due to the great partitioning of incoming radiative energy at the surface into latent heat flux. This leads to a clear diurnal cycle in near-surface relative humidity (King and Anderson, 1999) which also acts to damp the near-surface air temperature variations and the thermal mixing in the boundary layer. The superimposition of green and magenta curves in Fig. 10d is consistent with these conclusions. At the DDU station, the summer boundary layer does evolve with a diurnal cycle (Gallée and Pettré, 1998) in particular due to the alternation of daytime sea breezes and nocturnal katabatic winds. Particularly when the DDU island and the nearby ocean are free of snow/ice, convection can even occur (Argentini et al., 1996) during daytime in calm wind conditions. In the ERA5 data set, the DDU summer profiles show a diurnal cycle with warmer near-surface temperatures and weaker wind speed during daytime than during nighttime. However, Fig. 10b shows that the 8-year summer statistics conditioned to the sonde launching time (12:00 UTC, 10:00 LT) are very close to the full summer statistics. This apparent coincidence may be explained by the timing of the sonde launching which does not correspond either to the middle part of the nocturnal katabatic phase or to the most pronounced phase of the diurnal boundary layer.
To assess the spatial representativity of radiosoundings, we have identified spatial “footprints” of each station using ERA5 data. In other words, we have estimated for each station the spatial neighborhood over which the structure of the low troposphere is similar to that at the station. For this purpose, we have calculated the overlaps of the 8-year distributions of wind speed and temperature at two representative vertical levels at every grid point with those at the station grid point (see details in Appendix A). We have then made maps associated with each station showing for every grid point the minimum value among the four independent overlaps (see Fig. 11). We can point out that the statistical properties of the low troposphere at the nine stations can be reasonably extended to a significant part of coastal Antarctica. In particular, the structure of the low troposphere over Halley and Neumayer is representative of those over many ice shelves and coastal margins, with regions for which the overlap exceeds 85 % even thousands of kilometers away from the stations. On the other hand, the “footprint” of MZ, PE, Casey and McMurdo is limited to relatively small areas, indicating that the shape of the profiles at these stations is quite regional. Dumont d'Urville, Mawson and Davis seem reasonably representative of a significant part of the coastal edge, but the percentage overlap rarely exceeds 80 %, indicating that part of their wind and temperature and wind distributions are explained by regional effects. Note that our method of footprint determination does not consider the full profiles but only two representative vertical levels (z=500 and z=2000 m). Further studies are therefore needed to more precisely characterize the spatial variability of the full profiles along the Antarctic rim, making use, for instance, of radiosonde data at extra coastal stations like Syowa or Novolazarevskaya.

Figure 10Vertical statistics of temperature (left part of panels) and wind speed (right part of panels) in DJF (top row) and JJA (bottom row) from ERA5 reanalyses at four Antarctic stations. Dashed green lines (solid magenta lines) show the medians of the ERA5 data set restricted to radiosonde launching times (of the full ERA5 data set). Color shadings delimit the associated 80–20th interquartiles. Numbers in exponential form next to station names in the title indicate the number of radiosoundings per day at the corresponding station.
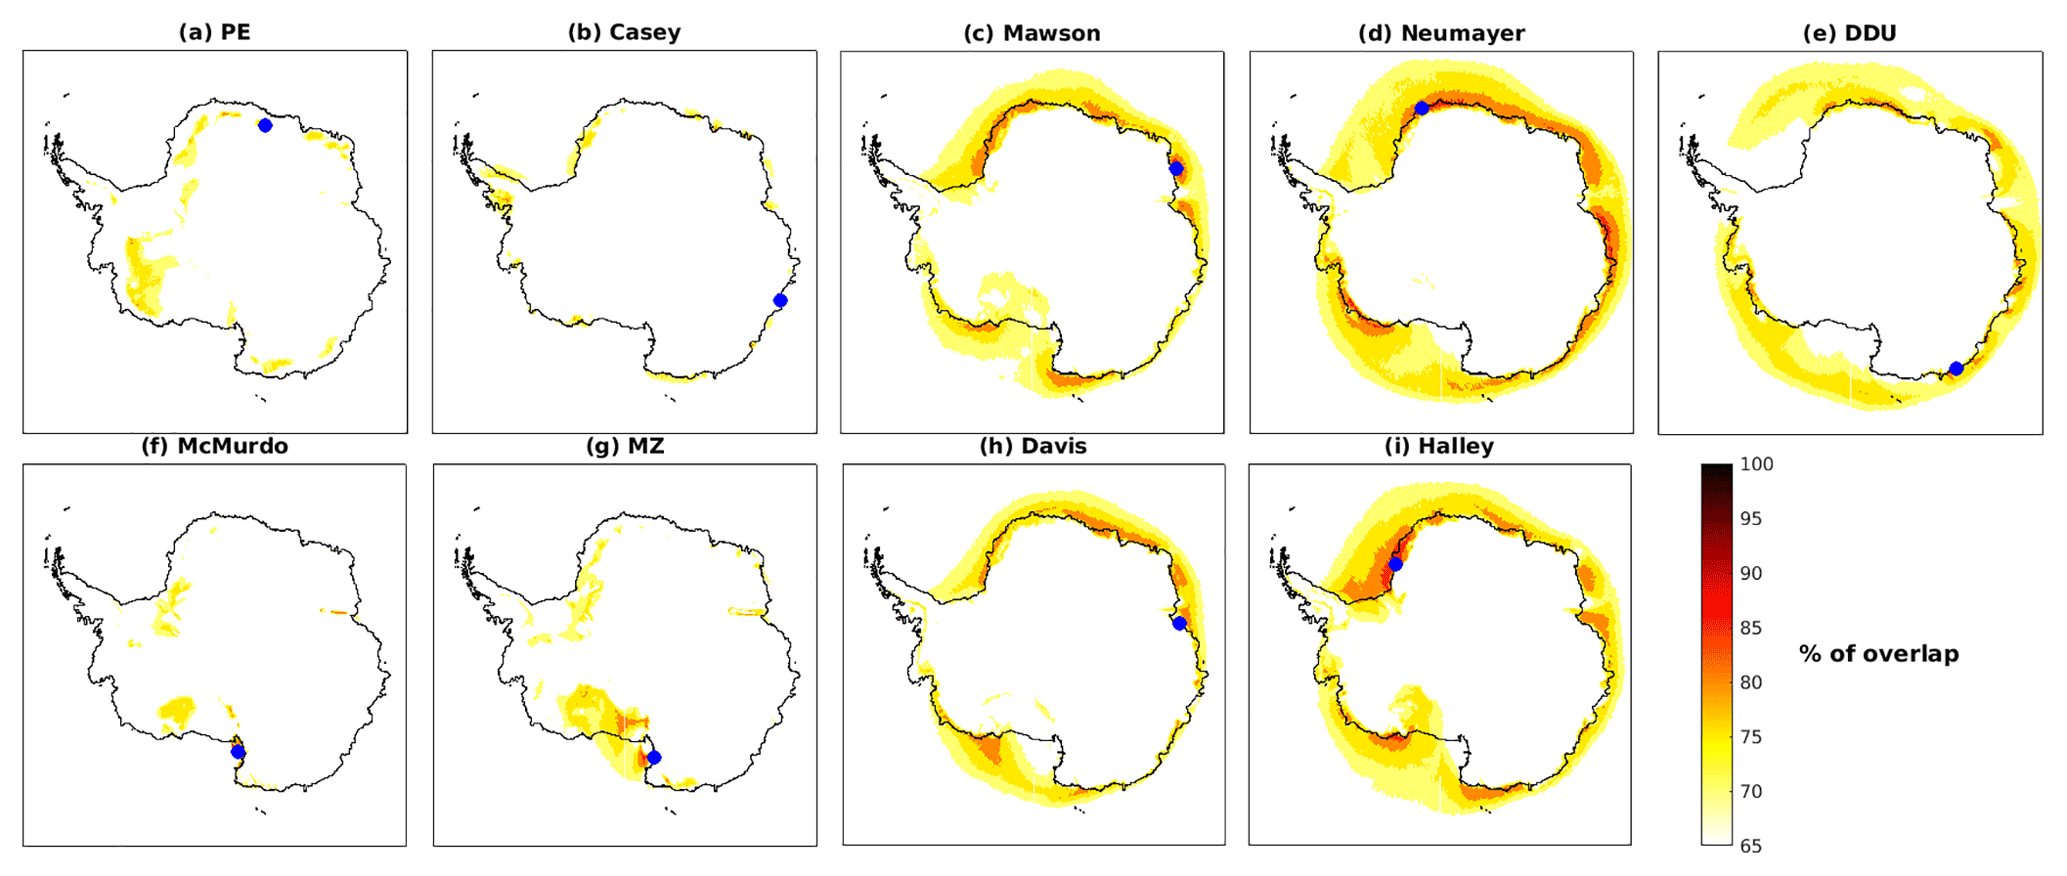
Figure 11Spatial representativity of the low troposphere at the nine Antarctic stations. For each station (panel), colors indicate the minimum value reached by all the four overlaps between the independent distributions of the 500 m temperature, 2000 m temperature, 500 m wind speed and 2000 m wind speed at the ERA5 grid point with those at the station. In each panel, the location of the corresponding station is indicated with a blue dot.
4.2 From ERA-Interim to ERA5: additional insights into the performance of reanalyses
In Sect. 3.2, we evaluated the performance of ERA-I and ERA5 reanalyses using median and interquartile differences. With this method, it could be shown that both reanalysis products have reasonable and comparable performance in terms of temperature profiles. In terms of wind speed, both reanalyses show similar results, even though ERA5 was slightly closer to radiosonde data near the surface at Neumayer and Casey. The comparison of the performance for the two data sets is more complex for the relative humidity because of very strong discrepancies from one station to another.
To better discriminate ERA-I and ERA5, we have plotted the mean biases and the root mean square errors (RMSEs) with respect to radiosoundings at seven stations in Fig. 12. The concomitant comparison inherent to the use of mean bias and RMSE scores is relevant for these two products since the timing of the real circulation and the one in reanalyses should be in principle close to each other, especially near stations where radiosonde data are assimilated. One can notice that mean bias and RMSE curves are generally closer to the zero line for the ERA5 data set (bottom row), shedding light on the overall improvement from ERA-I to ERA5. It is beyond the scope of the present study to pinpoint the specific changes between the two reanalyses data sets that led to the reduction of errors. However, one may assume that the refinement of both horizontal and vertical grids has significantly contributed to this improvement. However, Fig. 12 also highlights substantial deficiencies still present in ERA5, particularly the large RMSE of RHi – exceeding 20 % at Neumayer, McMurdo, Davis and DDU – and of wind speed that can exceed 5 m s−1 at DDU, Casey and Davis.
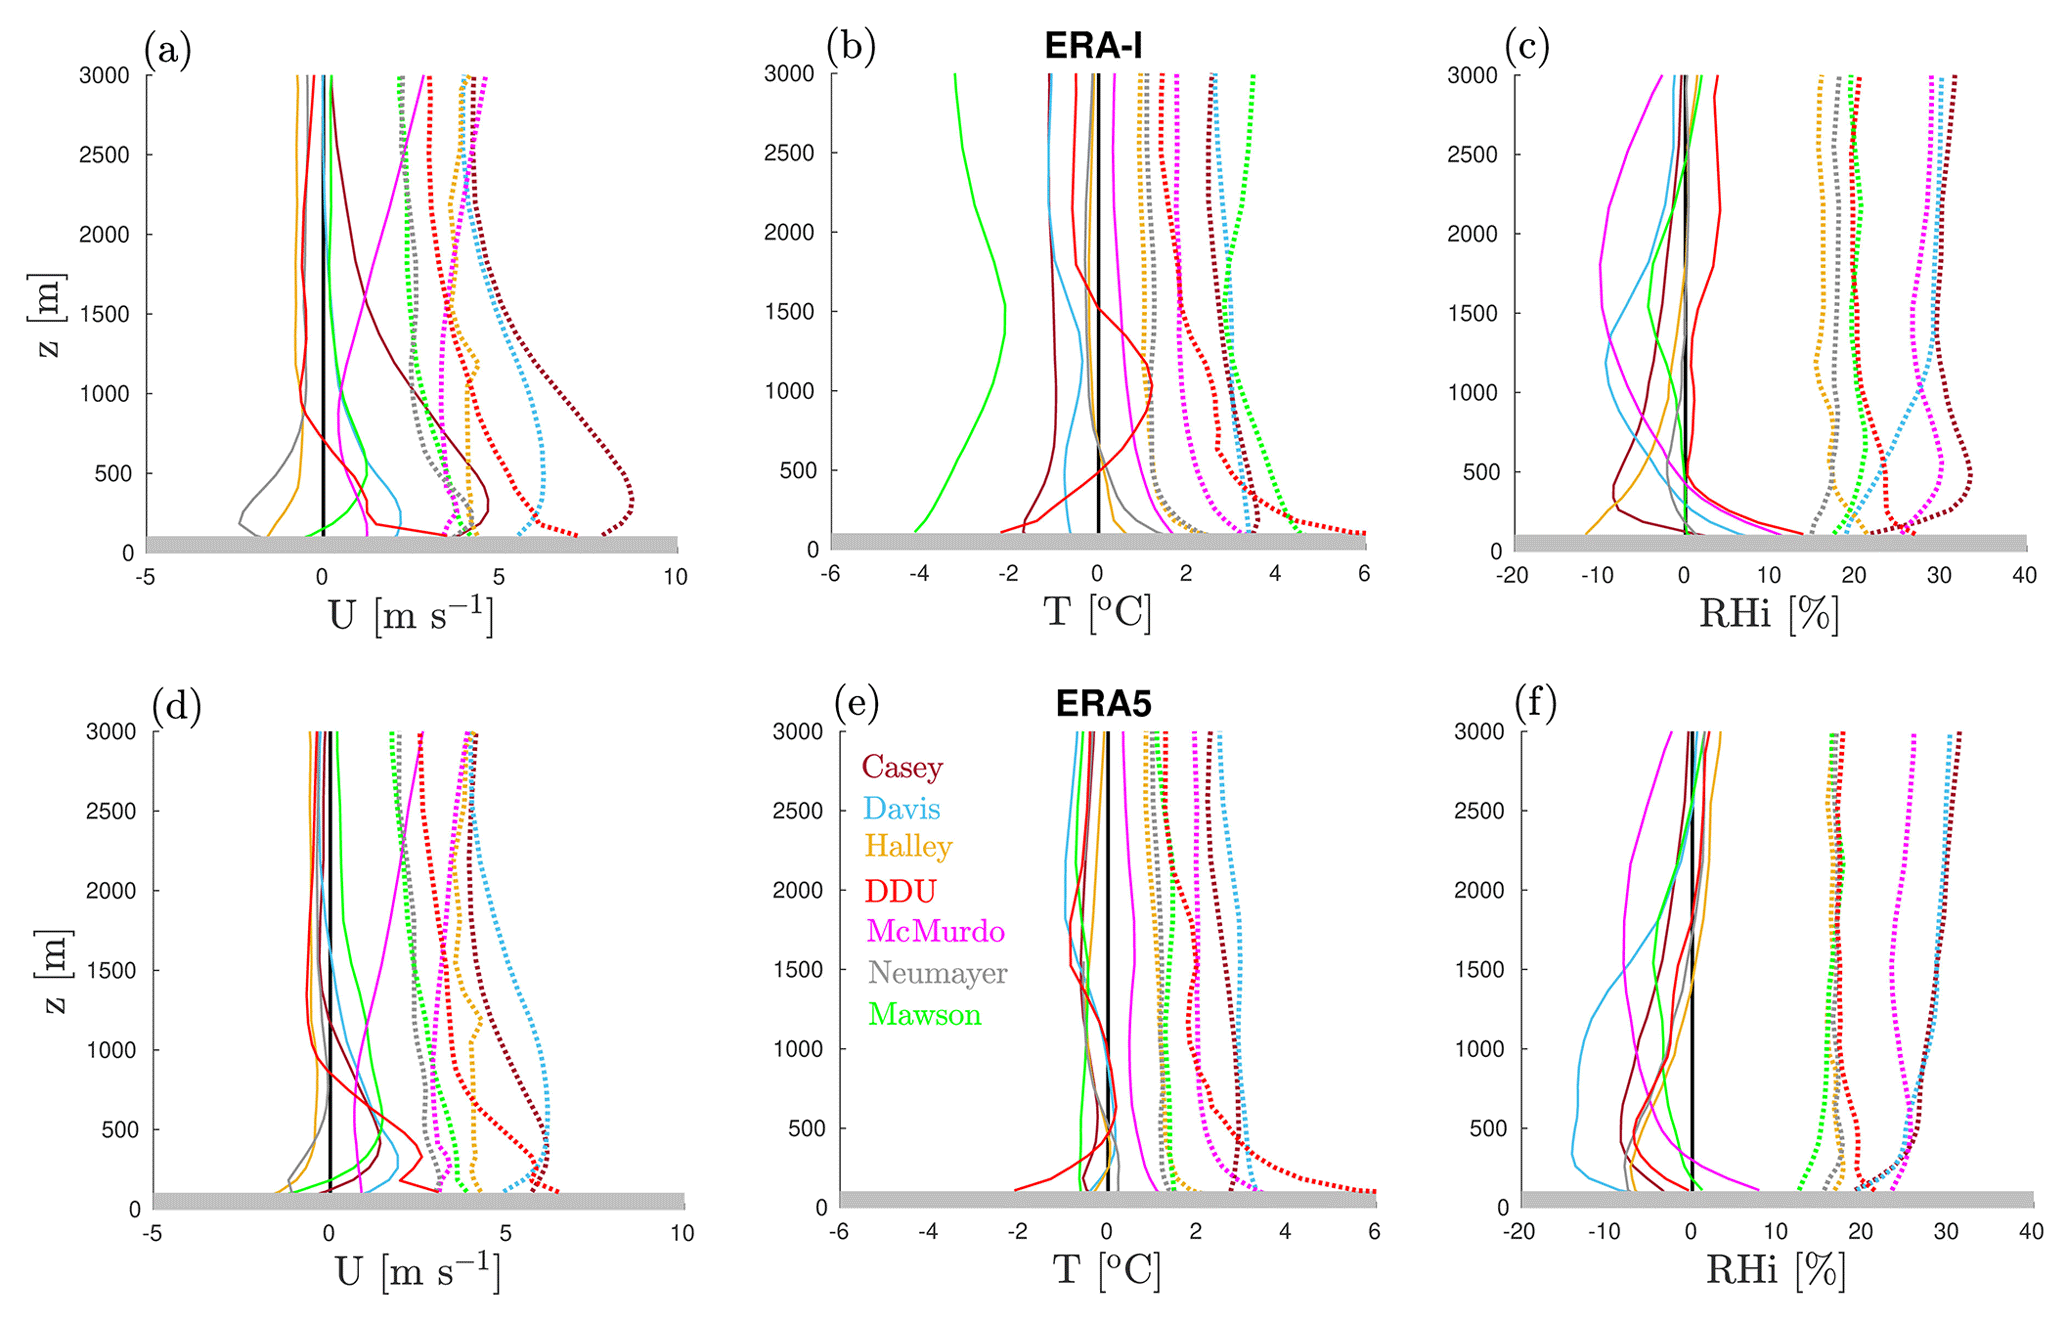
Figure 12Mean bias (solid lines) and root mean square errors (dotted lines) in ERA-I (top row) and ERA5 (bottom row) with respect to radiosoundings at seven permanent Antarctic stations. Panels (a) and (d) show results for the wind speed, panels (b) and (e) results for the temperature, and panels (c) and (f) results for the relative humidity with respect to ice.
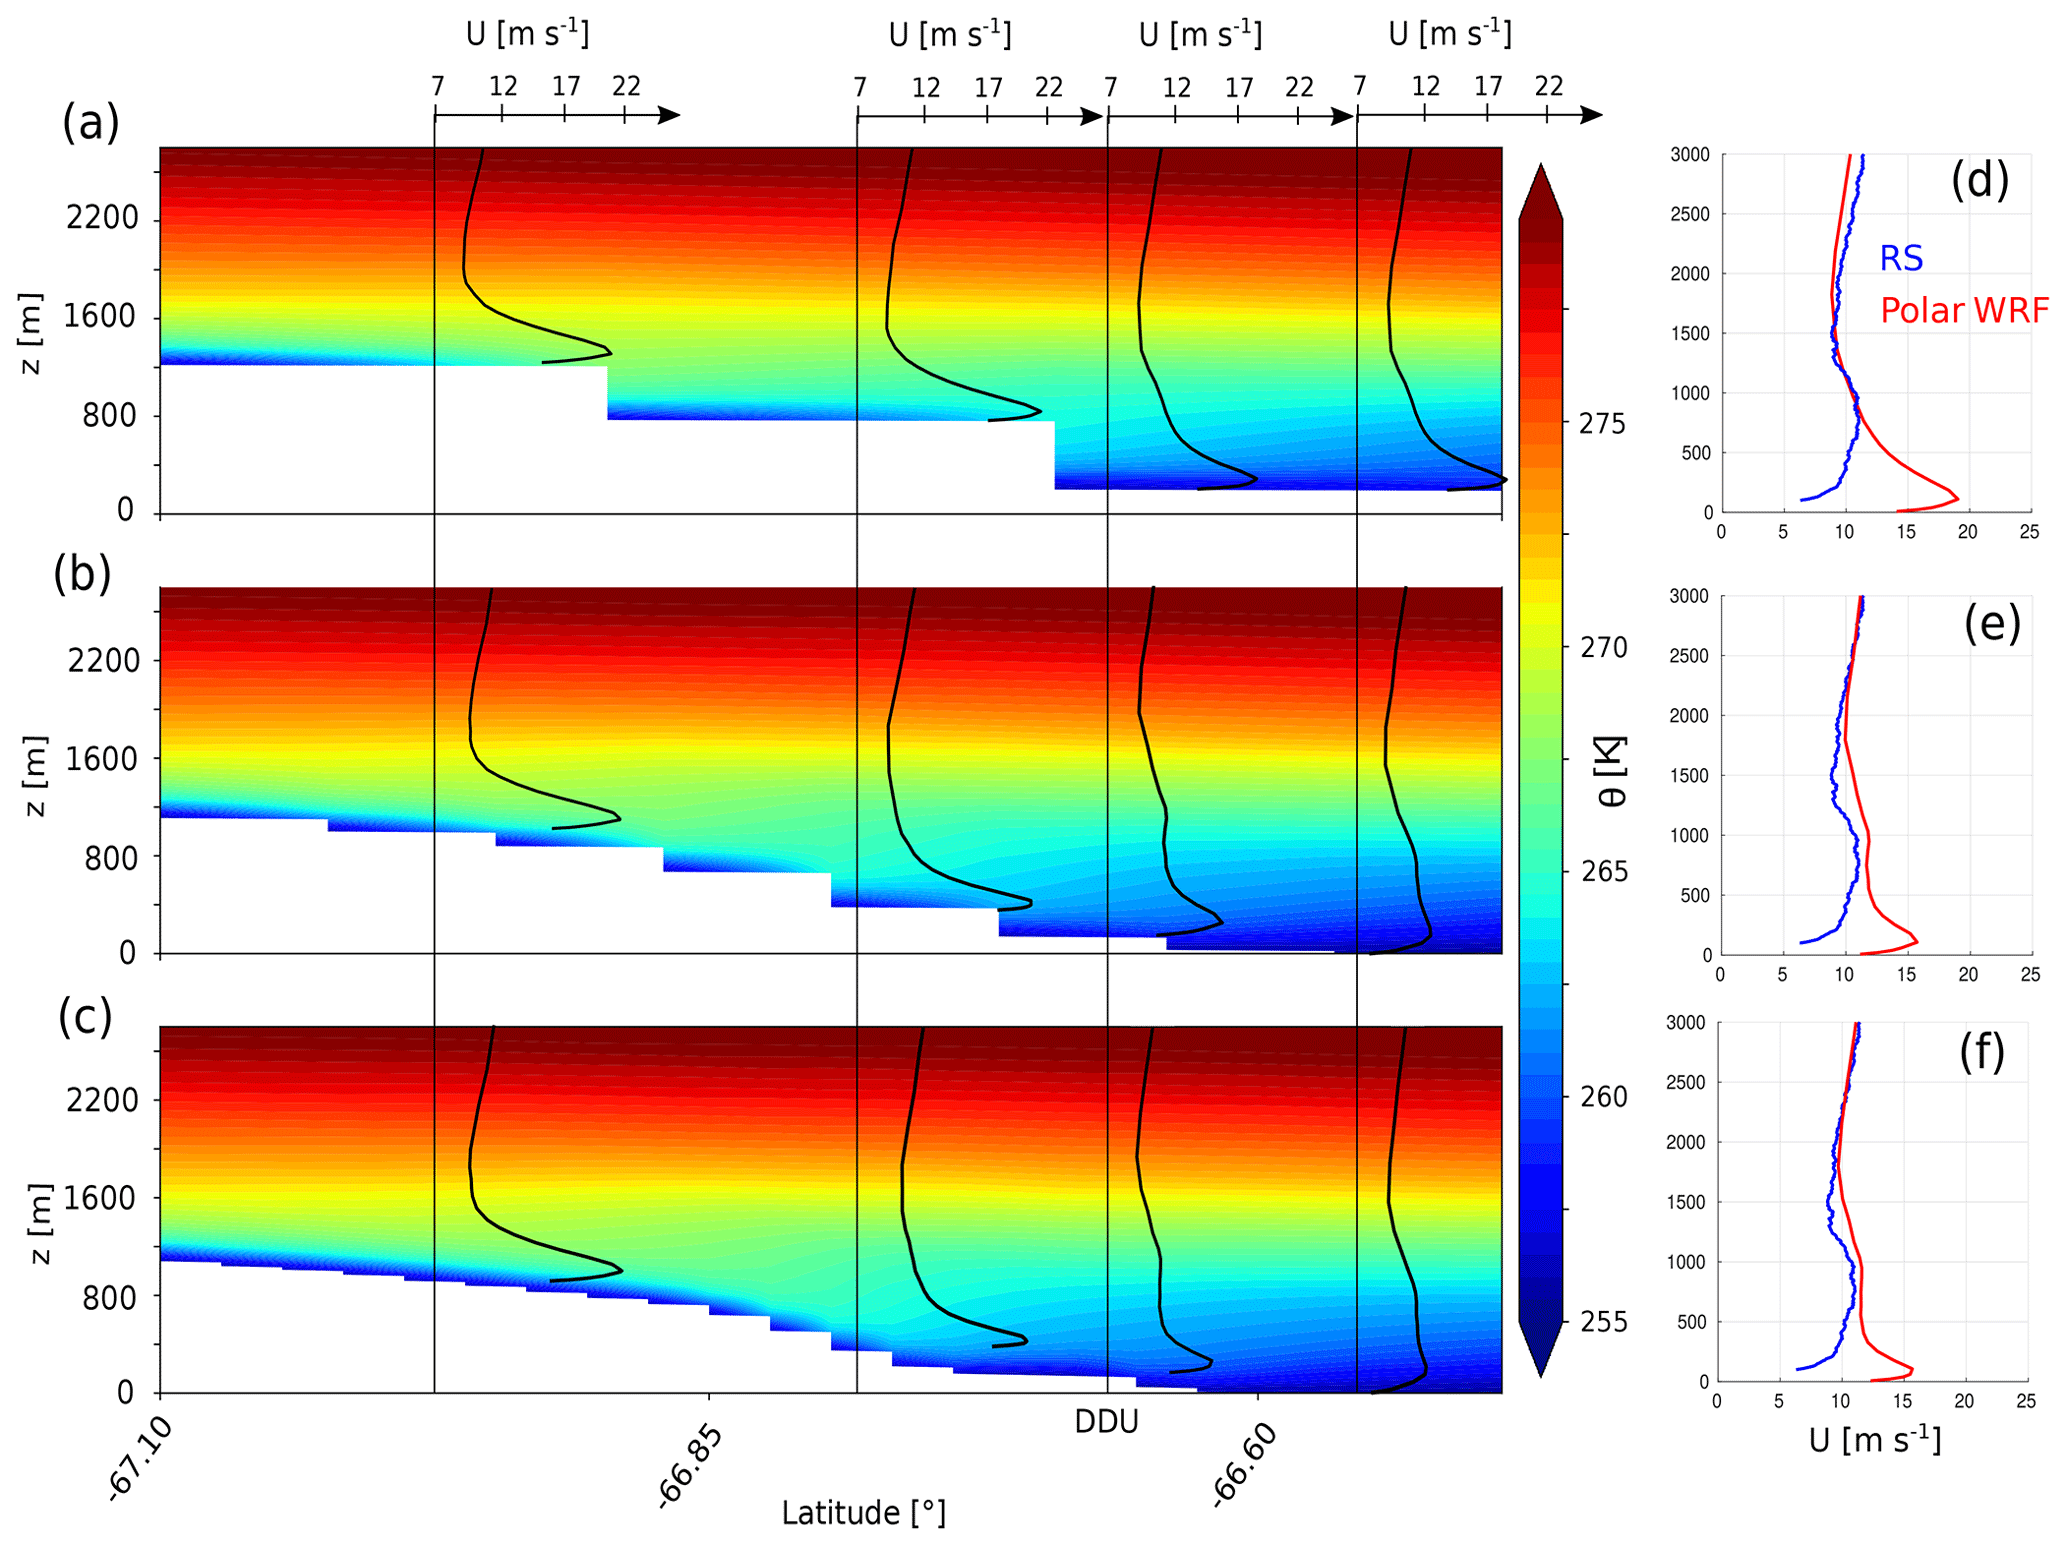
Figure 13(a–c) Meridional cross section (longitude: 140.00∘) of the June–July–August mean potential temperature around DDU in Polar WRF simulations at 27 km resolution (a), 9 km resolution (b) and 3 km resolution (c). June–July–August mean vertical profiles of the wind speed at four locations along a continent–ocean transect are also plotted. (d–f) Mean JJA vertical profiles of wind speed at the DDU station. Blue lines refers to the 2010–2017 radiosonde (RS) data set, red lines to Polar WRF simulations at 27 km resolution (d), 9 km resolution (e) and 3 km resolution (f). In panels (e) and (f), Polar WRF vertical profiles are computed following the method in Appendix C for more consistent comparison with radiosonde data.
4.3 Sensitivity of Polar WRF simulations
Among the deficiencies identified in Polar WRF in Sect. 3.2, the overly shallow and strong low-level jet at the DDU, Casey, Mawson, Davis, Neumayer and Halley stations was particularly striking. To gain insights into the ability of Polar WRF to reproduce the low-level wind profiles over coastal East Antarctica, we carried out sensitivity tests to the turbulence scheme and to the vertical resolution with the same setup as the one described in Sect. 2.3. Using the more diffusive MYJ turbulence scheme instead of MYNN produces a slightly weaker and thicker wind jet but does not lead to major changes in the simulation. Moreover, increasing the vertical resolution from 23 to 40 levels in the first 3000 m a.g.l. does not significantly improve the annual or seasonal statistics of the simulated profiles (not shown). Van den Broeke and Van Lipzig (2003) and Gallée and Pettré (1998) have stressed the importance of the slowing down of katabatic winds at the Antarctic edges by thermal wind effects due to either sea breezes or the piling up of cold air over ice shelves or sea ice, leading to a ocean–continent pressure gradient force. In order to evaluate the ability of Polar WRF to reproduce this effect and to assess the sensitivity of the model's horizontal resolution, we have set up a new simulation (see Appendix B) that focuses on the DDU region. As seen in Sect. 4.1, the regional dynamics at DDU is not completely representative of the whole East Antarctic coast but Van den Broeke and Van Lipzig (2003) showed that the thermal wind effect occurs along almost all the edge of Antarctica (see their Fig. 11). This suggests that if Polar WRF fails in reproducing this process in Adélie Land, it may fail over many other regions along the ice sheet. The winter latitude–height cross section of the potential temperature is shown in Fig. 13 for simulations at 27, 9 and 3 km resolution. The wind speed profiles at four locations on the continent–ocean transect (among which DDU) are also plotted. The wind speed profiles at −66.97∘ latitude are relatively similar for the three resolutions. This suggests that a 27 km resolution (Fig. 13a) may be sufficient for modeling the wind over the slopes of this region of the ice sheet, but further comparison with in situ data is needed to ascertain this assumption. Moving towards the edge of the continent, one can also point out that at a resolution of 27 km (Fig. 13a) the cold air bump is shallower and does not extend inland. Indeed, at low resolution, the flow from the ice sheet spreads out over the sea ice or ocean rather than vertically accumulating particularly due to the size of the meshes. As a consequence, the associated pressure gradient force towards the ice sheet, the slowing down of the near-surface jet over the margins and the subsequent damping and thickening of the katabatic layer are much weaker in coarse-resolution simulations. Mean vertical profiles at 3 and 9 km resolution thus compare better with radiosonde observations (Fig. 13d, e and f; see also the specific methodology for high-resolution simulations and radiosonde data in Appendix C). However, Fig. 13c and f also show that there is a shallow wind jet very close to the surface in the mean wind profile at the DDU station even at 3 km resolution. This jet disappears a few kilometers downstream. Increasing the horizontal resolution up to 3 km has helped to reproduce the general behavior of the flow over the coastal margin, but a near-surface wind bias remains at the specific location of DDU. As DDU is located on a small rocky island (Petrel Island), one may suspect local orographic effects on the near-surface flow that cannot be reproduced even at a resolution of 3 km. This issue should be addressed in the future.
Even though this short analysis does not provide a full explanation of the wind biases in the Polar WRF simulation over the whole Antarctic coast, it suggests that the 35 km horizontal resolution is not sufficient to reproduce the sharp gradients of temperature, pressure and wind at the coastal edge. This point questions the ability of current general circulation model but also regional models that run at resolutions of several tens of kilometers (e.g., van Wessem et al., 2018; Agosta et al., 2019) to correctly reproduce the structure of the low troposphere over coastal Antarctic margins, the horizontal extent of katabatic winds and the LSP process.
This study employs high-vertical-resolution data sets of radiosonde data at nine Antarctic stations to characterize the fine vertical structure of the low troposphere over the coastal margins of East Antarctica and to assess the performance of ERA-I, ERA5 and Polar WRF. The examination of radiosonde data has revealed a large spatial variability of the vertical profiles along the East Antarctic coast, in particular with strong differences between profiles at stations over ice shelves, stations in katabatic regions and stations in the Ross Sea sector with complex orographic influences. The seasonal variations have been portrayed here by comparing DJF and JJA ensembles. The analysis has revealed higher wind speeds in winter than in summer at most stations. This can be explained by more stable boundary layers over the plateau – and subsequently more intense katabatic flows – and to a lesser extent by stronger synoptic pressure gradients during winter. However, the wind profiles at DDU show similar speeds in both winter and summer. This point underlines the critical role of slowing down mechanisms probably associated with thermal wind effects, which are particularly intense in Adélie Land during winter. During precipitation events, winds are generally stronger due to the increase in the pressure gradient force associated with the passing synoptic weather system. The inspection of relative humidity profiles suggests that the LSP frequently occurs at DDU, Casey, Davis and Mawson stations, but this phenomenon does not appreciably affect precipitation at Neumayer and Halley. Both reanalysis products, as well as Polar WRF, overestimate the low-level wind speed in katabatic regions. Additional Polar WRF simulations at different resolutions over DDU suggest that this may be a consequence of an underestimated coastal thermal wind effect associated with the piling up of cold air when the resolution is too coarse. ERA5 reanalysis overall better compares with radiosonde data than ERA-I but significant biases remain, particularly for the wind speed and relative humidity in katabatic regions. Moreover, large wind and temperature differences with similar amplitude as Polar WRF have been noticed in both reanalyses at the PE station during summer. This may suggest that the reasonably correct performance of reanalyses at several stations is in a significant part due to the assimilation of the local radiosoundings, inviting a further evaluation of the free IFS model.
Overall, the 8-year radiosounding-based climatology and the thorough evaluation of reanalyses presented in this article may be relevant for future climate model evaluations in this extremely important region of the Earth where intense air mass exchanges between polar and midlatitudes occur and where atmosphere–ocean interactions control globally relevant processes such as sea ice and bottom water formation. Although the statistics calculated from ERA5 vertical profiles at a daily or bi-daily frequency provide a reasonable view of the complete statistics at the yearly and seasonal scales, the present paper has not discussed the diurnal evolution of the coastal low troposphere, which can be particularly marked in summer due to the diurnal cycle of insolation. The intensive observational campaign associated with the Year Of Polar Prediction project that took place in the summer of 2018–2019 should provide an unprecedented set of radiosonde data with more than 2000 extra sonde launches. In complement to existing literature on this subject, these additional radiosoundings could allow us to gain insights into the subdaily variations of the vertical structure of the low troposphere at many Antarctic locations.
Finally, the paper has also emphasized the importance of correctly representing the meridional gradient of temperature and the cold air bump at the bottom of the ice sheet to satisfactorily simulate the horizontal extent of the continental flow in atmospheric models. To improve the cyclogenesis on the shore of the ice sheet (Bromwich et al., 2011), the formation of sea ice and the creation of oceanic bottom waters in coupled climate models (e.g., Barthélemy et al., 2012), observational and modeling efforts should be made in the future to evaluate and improve horizontal structure of the coastal Antarctic boundary layer, in line with the IAGO campaign, for instance (Pettré and André, 1991).
ERA Interim and ERA5 reanalyses are freely distributed on the ECMWF website (https://www.ecmwf.int, last access: 1 April 2019) and on the Climate Data Store (https://climate.copernicus.eu, last access: 1 April 2019). Radiosonde data are either freely distributed or should be requested to the polar institutes or meteorological services. Details are given in the Acknowledgments section.
To assess the spatial representativity of the temperature and wind in the low troposphere above given Antarctic stations, we have calculated the spatial “footprint” of each station. In other words, we have determined the neighborhoods over which the 8-year statistics of temperature and wind speed are close to those at the corresponding stations. The method we have employed is the following. We have calculated the 8-year distributions of wind speed and temperature at z=500 and z=2000 m a.g.l. (the four variables are taken separately) at each grid point in the hourly ERA5 reanalyses. The two heights (z=500 and z=2000 m) were chosen because they correspond to one level in the core of the boundary layer and to one level slightly above. Then, overlaps of the distributions of each of the four variables at each grid point with those at the Antarctic stations were computed. We then quantify the statistical similarity between one grid point and a station by the minimum value among the four overlaps corresponding to the four independent variables. Note that adding the humidity in this method does not have a significant impact on the definition of the footprints.
To investigate the sensitivity of the Polar WRF model over coastal East Antarctica to the horizontal resolution, we have set up a second simulation. The model has been run with a downscaling method where a 27 km resolution domain contains a 9 km resolution nest, which itself contains a smaller nest at 3 km resolution centered over DDU (see Fig. B1). The nesting is one way; i.e., no information is passed in return from one domain to its parent. The simulation has been run over the entire year 2016 with a 3-day spinup. External and initial conditions are provided by ERA5 reanalyses. The same physical package as the one used for the Antarctic-scale simulations (see Sect. 2.3) has been used, except that the cumulus scheme has been turned off in the 3 km resolution domain.
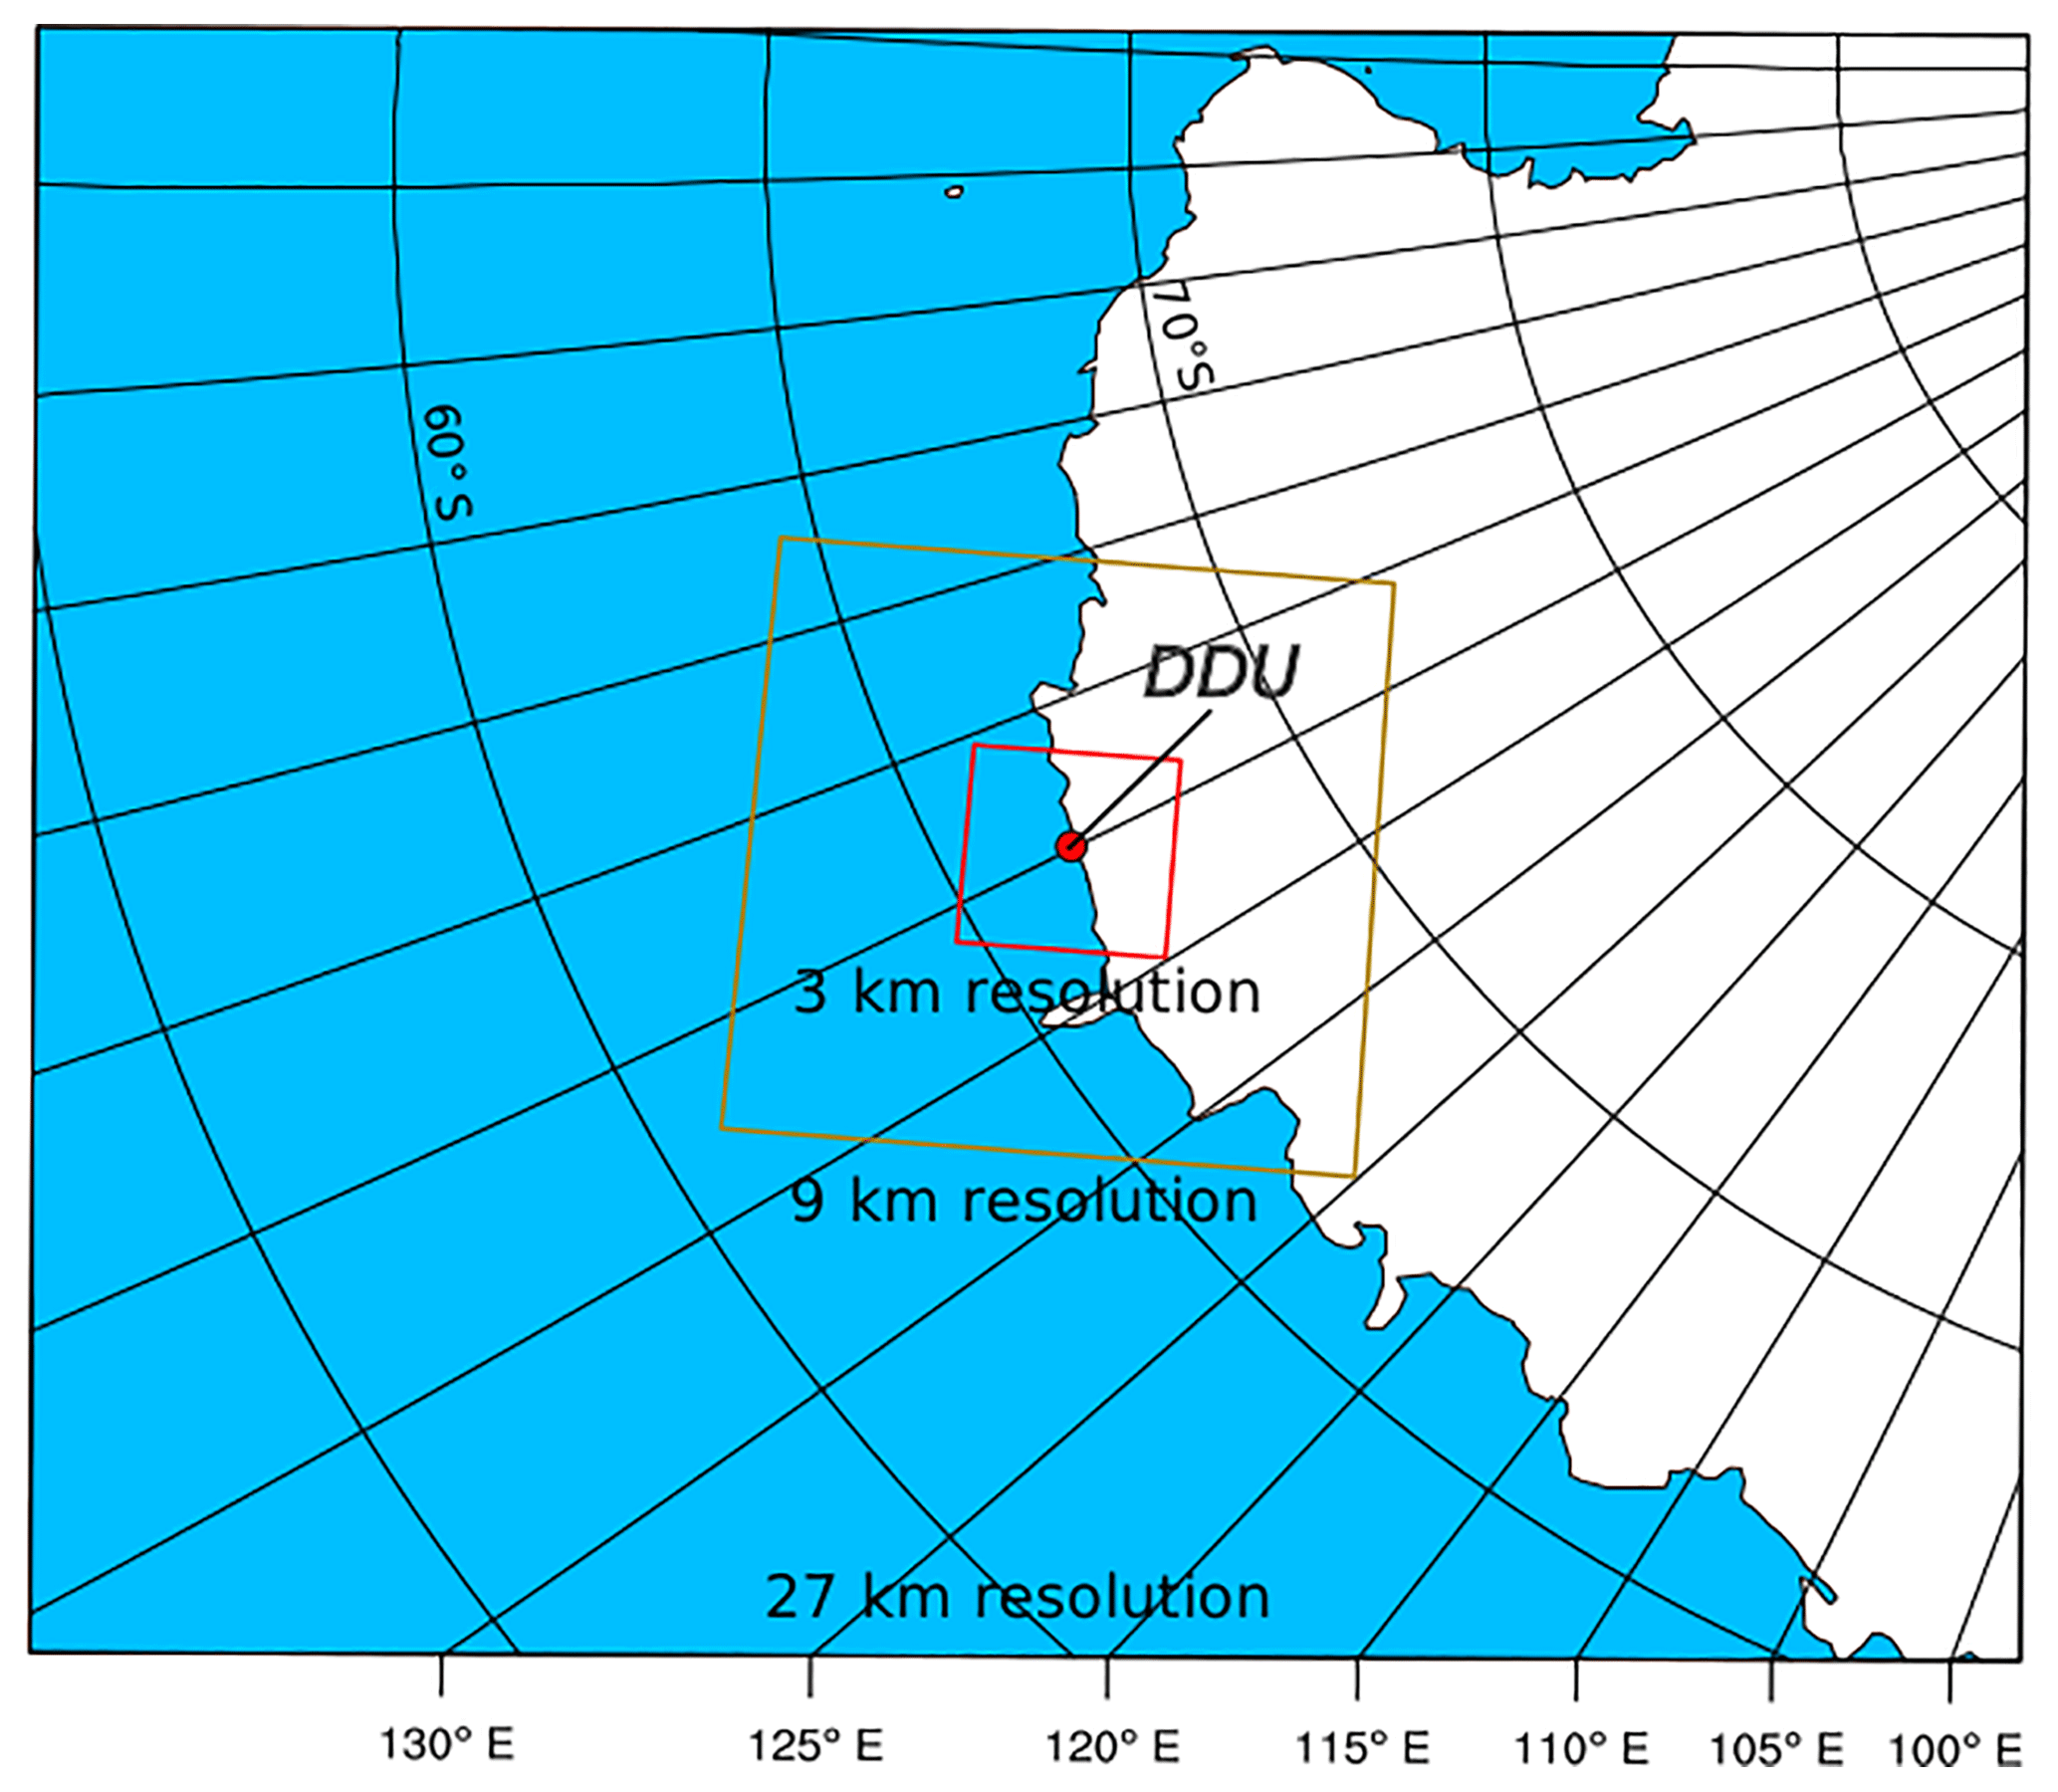
Figure B1Map of the three domains of the Polar WRF simulation for the specific case study over the DDU region.
At high horizontal resolution, it is not appropriate to evaluate the vertical profiles over a single model grid point with a radiosounding due to the horizontal drift of the sonde. To make a more consistent comparison, we simulate the motion of a virtual sonde in the model space. The sonde takes off at the station and is supposed to rise with a constant vertical velocity of 5 m s−1. The horizontal advection of the sonde in the model space is accounting for assuming the stationarity of the horizontal flow during the ascent. Then, we create an artificial sounding by sampling the model atmosphere following the trajectory of the virtual sonde (using the nearest model grid point at each height during the ascent). In Fig. 13e and f, the model profiles are generated with this method. It is however worth noting that, in the first 3000 m above the ground surface, the virtual balloon has not had the time to drift over a large distance from its original position (about 15 km at the very maximum). As a consequence, the new profiles remain relatively close to those right above the station, especially close to the surface.
The supplement related to this article is available online at: https://doi.org/10.5194/acp-19-4659-2019-supplement.
EV and AB designed the study, analysed the results and wrote the manuscript. EV carried out the Polar WRF simulations, processed reanalyses and radiosonde data and produced the figures. OT provided technical expertise and contributed to the scientific interpretation of the results.
The authors declare that they have no conflict of interest.
This work was funded by the EPFL-LOSUMEA project. We thank Christophe Genthon and Paul Pettré for insightful comments on a preliminary version of the manuscript. We also thank Micheal Lehning, Varun Sharma, Josué Gehring, Lionel Cortes and Richard Forbes for helpful discussions, and Constantino Listowski for providing the topography data for Polar WRF. We are grateful to Steve Colwell and the British Antarctic Survey for providing radiosonde data at the Halley station. For the provision of the radiosounding data at PE, we thank the Royal Meteorological Institute of Belgium and the respective operators of the PE station. Radiosoundings during the 2013/2014 summer season were done with the Vaisala Marwin ground receiving system, provided by the Swiss Federal Institute for Forest, Snow and Landscape Research. We thank Météo France, the DSO/DOA service for the acquisition and distribution of radiosonde data at the DDU station. MZ radiosonde data and information were obtained from the “Meteo Climatological Observatory at MZS and Victoria Land” of PNRA (http://www.climantartide.it, last access: 1 April 2019), with the help of Claudio Scarchilli. Radiosonde measurements at the Neumayer station have been made freely available on the PANGAEA platform (https://doi.org/10.1594/PANGAEA.874564) and technical information was provided by Holger Schmithuesen. Simon Alexander and the Australian Bureau of Meteorology are also gratefully acknowledged for distributing the radiosonde data at the Mawson, Davis and Casey stations. The authors appreciate the support of the University of Wisconsin-Madison Antarctic Meteorological Research Center and the help of Matthew Lazzara for acquiring and distributing radiosonde data at McMurdo (http://amrc.ssec.wisc.edu). The authors also thank John King, Jonathan Wille and one anonymous referee for their insightful comments on the manuscript. Last but not least, we are grateful to the scientific and winter-over staffs at Antarctic stations for acquiring radiosonde data every day in the harsh Antarctic conditions.
This paper was edited by Jayanarayanan Kuttippurath and reviewed by John King, Jonathan Wille, and one anonymous referee.
Adams, N.: Identifying the Characteristics of Strong Southerly Wind Events at Casey Station in East Antarctica Using a Numerical Weather Prediction System, Mon. Weather Rev., 133, 3548–3561, https://doi.org/10.1175/MWR3050.1, 2005. a
Agosta, C., Amory, C., Kittel, C., Orsi, A., Favier, V., Gallée, H., van den Broeke, M. R., Lenaerts, J. T. M., van Wessem, J. M., van de Berg, W. J., and Fettweis, X.: Estimation of the Antarctic surface mass balance using the regional climate model MAR (1979–2015) and identification of dominant processes, The Cryosphere, 13, 281–296, https://doi.org/10.5194/tc-13-281-2019, 2019. a
Alexander, S. and Murphy, D.: The Seasonal Cycle of Lower-Tropospheric Gravity Wave Activity at Davis, Antarctica (69∘ S, 78∘ E), J. Atmos. Sci., 72, 1010–1021, https://doi.org/10.1175/JAS-D-14-0171.1, 2015. a
Amory, C., Gallée, H., Naaim-Bouvet, F., Favier, V., Vignon, E., Picard, G., Trouvilliez, A., Piard, L., Genthon, C., and Bellot, H.: Seasonal variations in drag coefficients over a sastrugi-covered snowfield of coastal East Antarctica, Bound.-Lay. Meteorol., 164, 107–133, https://doi.org/10.1007/s10546-017-0242-5, 2017. a
Argentini, S. and Mastrantonio, G.: Barrier winds recorded during two summer Antarctic campaigns and their interaction with the katabatic flows as observed by a tri-axial Doppler sodar, Int. J. Remote Sens., 15, 455–466, https://doi.org/10.1080/01431169408954086, 1994. a
Argentini, S., Mastrantonio, G., Viola, A., Pettre, P., and Dargaud, G.: Sodar performance and preliminary results after one year of measurements at Adelie land coast, east Antarctica, Bound.-Lay. Meteorol., 81, 75–103, https://doi.org/10.1007/BF00119401, 1996. a, b
Barthélemy, A., Goose, H., Mathiot, P., and Fichefet, T.: Inclusion of a katabatic wind correction in a coarse-resolution global coupled climate model, Ocean Modell., 48, 45–54, https://doi.org/10.1007/s10546-017-0304-8, 2012. a
Bintanja, R.: Mesoscale Meteorological Conditions in Dronning Maud Land, Antarctica, during Summer: A Qualitative Analysis of Forcing Mechanisms, J. Appl. Meteorol., 39, 2348–2370, 2000. a, b
Bintanja, R., Severijns, C., Haarsma, R., and Hazeleger, W.: The future of Antarctica's surface winds simulated by a high-resolution global climate model: 1. Model description and validation, J. Geophys. Res.-Atmos., 119, 7136–7159, https://doi.org/10.1002/2013JD020847, 2014. a
Bock, O., Bosser, P., Bourcy, T., David, L., Goutail, F., Hoareau, C., Keckhut, P., Legain, D., Pazmino, A., Pelon, J., Pipis, K., Poujol, G., Sarkissian, A., Thom, C., Tournois, G., and Tzanos, D.: Accuracy assessment of water vapour measurements from in situ and remote sensing techniques during the DEMEVAP 2011 campaign at OHP, Atmos. Meas. Tech., 6, 2777–2802, https://doi.org/10.5194/amt-6-2777-2013, 2013. a
Bracegirdle, T. J. and Marshall, G. J.: The Reliability of Antarctic Tropospheric Pressure and Temperature in the Latest Global Reanalyses, J. Clim., 25, 7138–7146, https://doi.org/10.1175/JCLI-D-11-00685.1, 2012. a, b
Bromwich, D. H., Parish, T., Pellegrini, A., Stearns, C. R., and Weidner, G. A.: Spatial and temporal variations of the intense katabatic winds at Terra Nova Bay, Antarctica, Antarctic Meteorology and Climatology: Studies Based on Automatic Weather Stations, Amer. Geophys. Union, 47–68, 1993. a
Bromwich, D. H., Steinhoff, D. F., Simmonds, I., Keay, K., and Fogt, R. L.: Climatological aspects of cyclogenesis near Adélie Land Antarctica, Tellus A, 63, 921–938, https://doi.org/10.1111/j.1600-0870.2011.00537.x, 2011. a, b
Bromwich, D. H., Otieno, F. O., Hines, K. M., Manning, K. W., and Shilo, E.: Comprehensive evaluation of polar weather research and forecasting model performance in the Antarctic, J. Geophys. Res.-Atmos., 118, 274–292, https://doi.org/10.1029/2012JD018139, 2013. a, b
Carrasco, J. F., Bromwich, D. H., and Monaghan, A. J.: Distribution and Characteristics of Mesoscale Cyclones in the Antarctic: Ross Sea Eastward to the Weddell Sea, Mon. Weather Rev., 131, 289–301, https://doi.org/10.1175/1520-0493(2003)131<0289:DACOMC>2.0.CO;2, 2003. a
Climate Change Service: ERA Interim and ERA5 reanalyses, available at: https://climate.copernicus.euTS2, last access: 1 April 2019.
Connolley, W. M. and King, J. C.: Atmospheric water-vapour transport to Antarctica inferred from radiosonde data, Q. J. Roy. Meteorol. Soc., 119, 325–342, https://doi.org/10.1002/qj.49711951006, 1993. a
Dare, R. A. and Budd, W. F.: Analysis of Surface Winds at Mawson, Antarctica, Weather Forecast., 16, 416–431, https://doi.org/10.1175/1520-0434(2001)016<0416:AOSWAM>2.0.CO;2, 2001. a
Deb, P., Andrew, O., Scott, H. J., Tony, P., John, T., Daniel, B., O., P. J., and Steve, C.: An assessment of the Polar Weather Research and Forecasting (WRF) model representation of near-surface meteorological variables over West Antarctica, J. Geophys. Res.-Atmos., 121, 1532–1548, https://doi.org/10.1002/2015JD024037, 2016. a, b
Dee, D., Uppala, S., Simmons, A., Berrisford, P., Poli, P., Kobayashi, S., Andrae, U., Balmaseda, M., Balsamo, G., Bauer, P., Bechtold, P. , Beljaars, A. C., van de Berg, L. , Bidlot, J. , Bormann, N., Delsol, C., Dragani, R., Fuentes, M. , Geer, A. J., Haimberger, L., Healy, S. B., Hersbach, H., Hólm, E. V., Isaksen, L., Kållberg, P., Köhler, M., Matricardi, M., McNally, A. P.,Monge-Sanz, B. M., Morcrette, J., Park, B., Peubey, C., de Rosnay, P., Tavolato, C., Thépaut, J., and Vitart, F.: The ERA-Interim reanalysis: Configuration and performance of the data assimilation system, Q. J. R. Meteorol. Soc., 137, 553–597, 2011. a
Dufour, A., Charrondière, C., and Zolina, O.: Moisture transport in observations and reanalyses as a proxy for snow accumulation in East Antarctica, The Cryosphere, 13, 413–425, https://doi.org/10.5194/tc-13-413-2019, 2019. a
Durán-Alarcón, C., Boudevillain, B., Genthon, C., Grazioli, J., Souverijns, N., van Lipzig, N. P. M., Gorodetskaya, I. V., and Berne, A.: The vertical structure of precipitation at two stations in East Antarctica derived from micro rain radars, The Cryosphere, 13, 247–264, https://doi.org/10.5194/tc-13-247-2019, 2019. a
ECMWF: Advancing global NWP through international collaboration, available at: https://www.ecmwf.int, last access: 1 April 2019.
Fretwell, P., Pritchard, H. D., Vaughan, D. G., Bamber, J. L., Barrand, N. E., Bell, R., Bianchi, C., Bingham, R. G., Blankenship, D. D., Casassa, G., Catania, G., Callens, D., Conway, H., Cook, A. J., Corr, H. F. J., Damaske, D., Damm, V., Ferraccioli, F., Forsberg, R., Fujita, S., Gim, Y., Gogineni, P., Griggs, J. A., Hindmarsh, R. C. A., Holmlund, P., Holt, J. W., Jacobel, R. W., Jenkins, A., Jokat, W., Jordan, T., King, E. C., Kohler, J., Krabill, W., Riger-Kusk, M., Langley, K. A., Leitchenkov, G., Leuschen, C., Luyendyk, B. P., Matsuoka, K., Mouginot, J., Nitsche, F. O., Nogi, Y., Nost, O. A., Popov, S. V., Rignot, E., Rippin, D. M., Rivera, A., Roberts, J., Ross, N., Siegert, M. J., Smith, A. M., Steinhage, D., Studinger, M., Sun, B., Tinto, B. K., Welch, B. C., Wilson, D., Young, D. A., Xiangbin, C., and Zirizzotti, A.: Bedmap2: improved ice bed, surface and thickness datasets for Antarctica, The Cryosphere, 7, 375–393, https://doi.org/10.5194/tc-7-375-2013, 2013. a, b
Gallée, H. and Pettré, P.: Dynamical Constraints on Katabatic Wind Cessation in Adélie Land, Antarctica, J. Atmos. Sci., 55, 1755–1770, https://doi.org/10.1175/1520-0469(1998)055<1755:DCOKWC>2.0.CO;2, 1998. a, b, c, d
Gallée, H. and Schayes, G.: Development of a three-dimensional meso-gamma primitive equation model, katabatic winds simulation in the area of Terra Nova Bay, Antarctica, Mon. Weather Rev., 12, 671–685, 1994. a
Gallée, H., Pettré, P., and Schayes, G.: Sudden cessation of katabatic winds in Adélie Land, Antarctica, J. Appl. Meteorol., 35, 1142–1152, 1996. a
Genthon, C. and Krinner, G.: Convergence and disposal of energy and moisture on the Antarctic polar cap from ECMWFreanalyses and forecasts, J. Clim., 11, 1703–1716, 1998. a
Gera, B. S., Argentini, S., Mastrantonio, G., Viola, A., and Weill, A.: Characteristics of the boundary layer thermal structure at a coastal region of Adélie Land, East Antarctica, Ant. Sci., 10, 89–98, https://doi.org/10.1017/S0954102098000121, 1998. a
Grazioli, J., Genthon, C., Boudevillain, B., Duran-Alarcon, C., Del Guasta, M., Madeleine, J.-B., and Berne, A.: Measurements of precipitation in Dumont d'Urville, Adélie Land, East Antarctica, The Cryosphere, 11, 1797–1811, https://doi.org/10.5194/tc-11-1797-2017, 2017a. a
Grazioli, J., Madeleine, J.-B., Gallée, H., Forbes, R. M., Genthon, C., Krinner, G., and Berne, A.: Katabatic winds diminish precipitation contribution to the Antarctic ice mass balance, P. Natl. Acad. Sci. USA, 114, 10858–10863, https://doi.org/10.1073/pnas.1707633114, 2017b. a, b, c
Ingleby, B.: An assessment of different radiosonde type 2015/2016, ECMWF Technical Memorandum, p. 807, 2017. a
King, J. C.: Low-level wind profiles at an Antarctic coastal station, Antarct. Sci., 1, 169–178, 1989. a
King, J. C. and Anderson, P. S.: A humidity climatology for Halley, Antarctica, based on frost-point hygrometer measurements, Antarct. Sci., 11, 100–104, 1999. a
King, J. C., Argentini, S. A., and Anderson, P. S.: Contrasts between the summertime surface energy balance and boundary layer structure at Dome C and Halley stations, Antarctica, J. Geophys. Res., 111, D02105, https://doi.org/10.1029/2005JD006130, 2006. a
Kottmeier, C.: The influence of baroclinicity and stability on the wind and temperature conditions at the Georg von Neumayer Antarctic station, Tellus A, 38, 263–276, 1986. a
König-Langlo, G., King, J. C., and Pettré, P.: Climatology of the three coastal Antarctic stations Dumont d'Urville, Neumayer, and Halley, J. Geophys. Res.-Atmos., 103, 10935–10946, https://doi.org/10.1029/97JD00527, 1998. a, b, c
Lenaerts, J. T. M., van den Broeke, M. R., Déry, S. J., van Meijgaard, E., van de Berg, W. J., Palm, S. P., and Sanz Rodrigo, J.: Modeling drifting snow in Antarctica with a regional climate model: 1. Methods and model evaluation, J. Geophys. Res.-Atmos., 117, D05108, https://doi.org/10.1029/2011JD016145, d05108, 2012. a
Listowski, C. and Lachlan-Cope, T.: The microphysics of clouds over the Antarctic Peninsula – Part 2: modelling aspects within Polar WRF, Atmos. Chem. Phys., 17, 10195–10221, https://doi.org/10.5194/acp-17-10195-2017, 2017. a
Mawson, S. D.: The home of the blizzard, Unabridged, 1915. a
Milosevich, L. M., Paukkunen, A., Vömel, H., and Oltmans, S. J.: Development and Validation of a Time-Lag Correction for Vaisala Radiosonde Humidity Measurements, J. Atmos. Ocean. Technol., 21, 1305–1327, https://doi.org/10.1175/1520-0426(2004)021<1305:DAVOAT>2.0.CO;2, 2004. a
Monaghan, A. J., Bromwich, D. H., Powers, J. G., and Manning, K. W.: The Climate of the McMurdo, Antarctica, Region as Represented by One Year of Forecasts from the Antarctic Mesoscale Prediction System, J. Clim., 18, 1174–1189, https://doi.org/10.1175/JCLI3336.1, 2005. a
Morrison, H., Thompson, G., and Tatarskii, V.: Impact of Cloud Microphysics on the Development of Trailing Stratiform Precipitation in a Simulated Squall Line: Comparison of One- and Two-Moment Schemes, Mon. Weather Rev., 137, 991–1007, https://doi.org/10.1175/2008MWR2556.1, 2009. a
Naithani, J., Gallée, H., and Schayes, G.: Marine air intrusion into the Adelie Land sector of East Antarctica: A study using the regional climate model (MAR), J. Geophys. Res.-Atmos., 107, https://doi.org/10.1029/2000JD000274, 2002. a
Naithani, J., Argentini, S., and Schayes, G.: Analysis of strong wind events around Adelie land, East Antarctica, Ann. Geophys., 46, 2003. a, b
Nakanishi, M. and Niino, H.: An Improved Mellor–Yamada Level-3 Model: Its Numerical Stability and Application to a Regional Prediction of Advection Fog, Bound.-Lay. Meteorol., 119, 397–407, https://doi.org/10.1007/s10546-005-9030-8, 2006. a
Nicolas, J. P. and Bromwich, D. H.: New Reconstruction of Antarctic Near-Surface Temperatures: Multidecadal Trends and Reliability of Global Reanalyses, J. Clim., 27, 8070–8093, https://doi.org/10.1175/JCLI-D-13-00733.1, 2014. a
Nygård, T., Valkonen, T., and Vihma, T.: Antarctic Low-Tropospheric Humidity Inversions: 10-Yr Climatology, J. Clim., 26, 5205–5219, https://doi.org/10.1175/JCLI-D-12-00446.1, 2013. a, b
Orr, A., Phillips, T., Webster, S., Elvidge, A., Weeks, M., Hosking, S., and Turner, J.: Met Office Unified Model high-resolution simulations of a strong wind event in Antarctica, Q. J. Roy. Meteorol. Soc., 140, 2287–2297, https://doi.org/10.1002/qj.2296, 2014. a
Parish, T. R. and Bromwich, D. H.: The surface windfield over the Antarctic ice sheets, Nature, 328, 51–54, 1987. a
Parish, T. R. and Bromwich, D. H.: Instrumented aircraft observations of the katabatic regime near Terra Nova Bay, Mon. Weather Rev., 117, 1570–1585, 1989. a
Parish, T. R. and Bromwich, D. H.: A Case Study of Antarctic Katabatic Wind Interaction with Large-Scale Forcing, Mon. Weather Rev., 126, 199–209, https://doi.org/10.1175/1520-0493(1998)126<0199:ACSOAK>2.0.CO;2, 1998. a, b
Parish, T. R. and Bromwich, D. H.: Reexamination of the Near-Surface Airflow over the Antarctic Continent and Implications of Atmospheric Circulations at High Southern Latitudes, Mon. Weather Rev., 135, 1961–1973, https://doi.org/10.1175/MWR3374.1, 2007. a, b
Parish, T. R. and Cassano, J. J.: The Role of Katabatic Winds on the Antarctic Surface Wind Regime, Mon. Weather Rev., 131, 317–333, https://doi.org/10.1175/1520-0493(2003)131<0317:TROKWO>2.0.CO;2, 2003. a
Parish, T. R. and Walker, R.: A re-examination of the winds of Adelie Land, Antarctica, Aust. Meteorol. Mag., 55, 105–107, 2006. a
Parish, T. R., Pettré, P., and Wendler, G.: A numerical study of the diurnal variation of the Adelie Land katabatic wind regime, J. Geophys. Res.-Atmos., 98, 12933–12947, https://doi.org/10.1029/92JD02080, 1993. a
Pattyn, F., Matsuoka, K., and Berte, J.: Glacio-meteorological conditions in the vicinity of the Belgian Princess Elisabeth Station, Antarctica, Antarct. Sci., 22, 79–85, https://doi.org/10.1017/S0954102009990344, 2010. a
Pettré, P. and André, J.-C.: Surface-Pressure Change through Loewe's Phenomena and Katabatic Flow Jumps: Study of Two Cases in Adélie Land, Antarctica, J. Atmos. Sci., 48, 557–571, https://doi.org/10.1175/1520-0469(1991)048<0557:SPCTLP>2.0.CO;2, 1991. a, b
Pettré, P., Payan, C., and Parish, T. R.: Interaction of katabatic flow with local thermal effects in a coastal region of Adelie Land, east Antarctica, J. Geophys. Res.-Atmos., 98, 10429–10440, https://doi.org/10.1029/92JD02969, 1993. a
Renfrew, I. A.: The dynamics of idealized katabatic flow over a moderate slope and ice shelf, Q. J. Roy. Meteorol. Soc., 130, 1023–1045, https://doi.org/10.1256/qj.03.24, 2004. a
Renfrew, I. A. and Anderson, P. S.: Profiles of katabatic flow in summer and winter over Coats Land, Antarctica, Q. J. Roy. Meteorol. Soc., 132, 779–802, https://doi.org/10.1256/qj.05.148, 2007. a
Sanz Rodrigo, J., Buchlin, J.-M., van Beeck, J., Lenaerts, J. T. M., and van den Broeke, M. R.: Evaluation of the Antarctic surface wind climate from ERA reanalyses and RACMO2/ANT simulations based on automatic weather stations, Clim. Dynam., 40, 353–376, https://doi.org/10.1007/s00382-012-1396-y, 2013. a
Seefeldt, M. W., Tripoli, G. J., and Stearns, C. R.: A High-Resolution Numerical Simulation of the Wind Flow in the Ross Island Region, Antarctica, Mon. Weather Rev., 131, 435–458, https://doi.org/10.1175/1520-0493(2003)131<0435:AHRNSO>2.0.CO;2, 2003. a
Sorbjan, Z., Kodama, Y., and Wendler, G.: Observational Study of the Atmospheric Boundary Layer over Antarctica, J. Clim. Appl. Meteorol., 25, 641–651, https://doi.org/10.1175/1520-0450, 1986. a
Streten, N. A.: A review of the climate of Mawson – a representative strong wind site in East Antarctica, Antarct. Sci., 2, 79–89, 1990. a
Tomasi, C., Petkov, B., Benedetti, E., Vitale, V., Pellegrini, A., Dargaud, G., De Silvestri, L., Grigioni, P., Fossat, E., Roth, W. L., and Valenziano, L.: Characterization of the atmospheric temperature and moisture conditions above Dome C (Antarctica) during austral summer and fall months, J. Geophys. Res., 111, D20305, https://doi.org/10.1029/2005JD006976, 2006. a
Turner, J., Lachlan-Cope, T. A., Marshall, G. J., Pendlebury, S., and Adams, N.: An extreme wind event at Casey Station, Antarctica, J. Geophys. Res., 106, 7291–7311, 2001. a
Uotila, P., Vihma, T., Pezza, A. B., Simmonds, I., Keay, K., and Lynch, A. H.: Relationships between Antarctic cyclones and surface conditions as derived from high-resolution numerical weather prediction data, J. Geophys. Res.-Atmos., 116, D07109, https://doi.org/10.1029/2010JD015358, 2011. a
Van den Broeke, M. and Van Lipzig, N. P. M.: Factors Controlling the Near-Surface Wind Field in Antarctica, Mon. Weather Rev., 21, 1417–1431, 2003. a, b, c, d
Van den Broeke, M. R., Van Lipzig, N. P. M., and Van Meijgaard , E.: Momentum Budget of the East Antarctic Atmospheric Boundary Layer: Results of a Regional Climate Model, J. Atmos. Sci., 59, 3117–3129, https://doi.org/10.1175/1520-0469(2002)059<3117:MBOTEA>2.0.CO;2, 2002. a, b
Van Lipzig, N. P. M. and Van Den Broeke, M. R.: A model study on the relation between atmospheric boundary-layer dynamics and poleward atmospheric moisture transport in Antarctica, Tellus A, 54, 497–511, https://doi.org/10.3402/tellusa.v54i5.12168, 2002. a, b, c
van Wessem, J. M., van de Berg, W. J., Noël, B. P. Y., van Meijgaard, E., Amory, C., Birnbaum, G., Jakobs, C. L., Krüger, K., Lenaerts, J. T. M., Lhermitte, S., Ligtenberg, S. R. M., Medley, B., Reijmer, C. H., van Tricht, K., Trusel, L. D., van Ulft, L. H., Wouters, B., Wuite, J., and van den Broeke, M. R.: Modelling the climate and surface mass balance of polar ice sheets using RACMO2 – Part 2: Antarctica (1979–2016), The Cryosphere, 12, 1479–1498, https://doi.org/10.5194/tc-12-1479-2018, 2018. a
Vignon, E., Hourdin, F., Genthon, C., Van de Wiel, B. J. H., Gallée, H., Madeleine, J.-B., and Beaumet, J.: Modeling the Dynamics of the Atmospheric Boundary Layer Over the Antarctic Plateau With a General Circulation Model, J. Adv. Model Earth Sy., 10, 98–125, https://doi.org/10.1002/2017MS001184, 2018. a, b
Wendler, G., André, J. C., Pettré, P., Gosink, J., and Parish, T.: Katabatic winds in Adélie Coast, Antarctica Meteorology and Climatology: Studies Based on Automatic Weather Stations, american Geophysical Union, Washington, DC, https://doi.org/10.1029/AR061p0023, 1993. a
Wille, J. D., Bromwich, D. H., Cassano, J. J., Nigro, M. A., Mateling, M. E., and Lazzara, M. A.: Evaluation of the AMPS Boundary Layer Simulations on the Ross Ice Shelf, Antarctica, with Unmanned Aircraft Observations, J. Appl. Meteorol. Clim., 56, 2239–2258, https://doi.org/10.1175/JAMC-D-16-0339.1, 2017. a
Yurchak, B. S.: An Assessment of Radiosonde Launch Conditions Affected by the Surface Wind, Russ. Meteorol. Hydrol., 38, 159–167, 2013. a
Zhang, Y., Seidel, D. J., Golaz, J.-C., Deser, C., and Tomas, R. A.: Climatological Characteristics of Arctic and Antarctic Surface-Based Inversions, J. Clim., 24, 5167–5186, https://doi.org/10.1175/2011JCLI4004.1, 2011. a
See http://amrc.ssec.wisc.edu (last access: 1 April 2019) for a complete list of Antarctic stations with a continuous radiosounding program.
- Abstract
- Introduction
- Data and methods
- Results
- Discussion
- Conclusions
- Data availability
- Appendix A: Spatial representativity of temperature and wind at coastal Antarctic stations
- Appendix B: Polar WRF simulation over Dumont d'Urville
- Appendix C: Radiosonde-following profiles from high-resolution Polar WRF simulations
- Author contributions
- Competing interests
- Acknowledgements
- Review statement
- References
- Supplement