the Creative Commons Attribution 4.0 License.
the Creative Commons Attribution 4.0 License.
 | 05 Apr 2019
Intra-regional transport of black carbon between the south edge of the North China Plain and central China during winter haze episodes
Huang Zheng
Shaofei Kong
Fangqi Wu
Yi Cheng
Zhenzhen Niu
Shurui Zheng
Guowei Yang
Liquan Yao
Qin Yan
Jian Wu
Mingming Zheng
Nan Chen
Ke Xu
Yingying Yan
Dantong Liu
Delong Zhao
Tianliang Zhao
Yongqing Bai
Shuanglin Li
Shihua Qi
Black carbon (BC), which is formed from the incomplete combustion of fuel sources (mainly fossil fuel, biofuel and open biomass burning), is a chemically inert optical absorber in the atmosphere. It has significant impacts on global climate, regional air quality and human health. During transportation, its physical and chemical characteristics as well as its sources change dramatically. To investigate the properties of BC (i.e., mass concentration, sources and optical properties) during intra-regional transport between the southern edge of the North China Plain (SE-NCP) and central China (CC), simultaneous BC observations were conducted in a megacity (Wuhan – WH) in CC, in three borderline cities (Xiangyang – XY, Suixian – SX and Hong'an – HA; from west to east) between the SE-NCP and CC, and in a city (Luohe – LH) in the SE-NCP during typical winter haze episodes. Using an Aethalometer, the highest equivalent BC (eBC) mass concentrations and the highest aerosol absorption coefficients (σabs) were found in LH in the SE-NCP, followed by the borderline cities (XY, SX and HA) and WH. The levels, sources, optical properties (i.e., σabs and absorption Ångström exponent, AAE) and geographic origins of eBC were different between clean and polluted periods. Compared with clean days, higher eBC levels (26.4 %–163 % higher) and σabs (18.2 %–236 % higher) were found during pollution episodes due to the increased combustion of fossil fuels (increased by 51.1 %–277 %), which was supported by the decreased AAE values (decreased by 7.40 %–12.7 %). The conditional bivariate probability function (CBPF) and concentration-weighted trajectory (CWT) results showed that the geographic origins of biomass burning (BCbb) and fossil fuel (BCff) combustion-derived BC were different. Air parcels from the south dominated for border sites during clean days, with contributions of 46.0 %–58.2 %, whereas trajectories from the northeast showed higher contributions (37.5 %–51.2 %) during pollution episodes. At the SE-NCP site (LH), transboundary influences from the south (CC) exhibited a more frequent impact (with air parcels from this direction comprising 47.8 % of all parcels) on the ambient eBC levels during pollution episodes. At WH, eBC was mainly from the northeast transport route throughout the observation period. Two transportation cases showed that the mass concentrations of eBC, BCff and σabs all increased, from upwind to downwind, whereas AAE decreased. This study highlights that intra-regional prevention and control for dominant sources at each specific site should be considered in order to improve the regional air quality.
- Article
(8296 KB) - Full-text XML
-
Supplement
(2485 KB) - BibTeX
- EndNote


Black carbon (BC), a distinct type of carbonaceous material, has attracted wide attention over past decades mainly due to its climate effect (Hansen et al., 2000; Jacobson, 2000; Bond et al., 2013). BC can strongly absorb but reflects less light, with the direct radiative forcing of BC estimated to be +0.88 W m−2 (Bond et al., 2013). It is composed of small carbon spherules and has a large specific surface area, which allows it to absorb aerosol and provide a substrate for atmospheric chemical reactions (Y. Liu et al., 2018). BC also has adverse human health effects due to its absorption of carcinogenic pollutants (Jansen et al., 2005; Cao et al., 2012). Additionally, recent studies have shown that BC can strongly impact the ambient air quality. For instance, in urban areas, BC can enhance haze pollution by modifying the planetary boundary layer height, which is unfavorable with respect to the vertical dispersion of air pollutants (Ding et al., 2016). This “dome effect” is more substantial in rural areas under the same BC conditions (Q. Wang et al., 2018). BC particles, coated with other materials can markedly amplify absorption and direct radioactive forcing, which can further worsen the air quality (Peng et al., 2016; Liu et al., 2017a; Zhang et al., 2018). In short, the properties of BC at rural and suburban sites needed to be emphasized, as they have generally been ignored in former field campaigns.
BC is only formed from the combustion processes of carbon-based materials such as biomass and fossil fuels. The broadly reported BC sources can be grouped into stationary sources (e.g., industrial emission), area sources (e.g., residential coal/wood combustion, open burning) and mobile sources (e.g., diesel engines) (Chow et al., 2011; Bond et al., 2013). To identify BC sources, several methods including the Aethalometer model, diagnosis ratios and radioactive carbon isotope analysis have been developed (Sandradewi et al., 2008; Verma et al., 2010; Zotter et al., 2017). Chow et al. (2011) summarized the ratios of elemental carbon to PM2.5 (expressed as percentage, %) from various sources, and these ratios have since been used to qualitatively describe BC sources (Y. Liu et al., 2018). The radiocarbon method can give quantified results regarding BC sources, as the abundances of 14C∕12C in fossil fuels and modern carbon sources (i.e., biogenic sources) are different. The radiocarbon method coupled with levoglucosan, a tracer of biomass burning, has also been adopted in BC source apportionment (X. Zhang et al., 2015; Liu et al., 2017b; Mouteva et al., 2017; Salma et al., 2017). However, the technical limitations and the high cost of 14C measurement limit the application of the radiocarbon method in BC source apportionment. The Aethalometer model is an alternative method, which can attribute BC to fossil fuel combustion and biomass burning. The source apportionment can be conducted using multi-wavelength BC data (Sandradewi et al., 2008; Y. Liu et al., 2018), and the validity of this method has been proven by comparison to the 14C method (Zotter et al., 2017). Compared with other methods, the Aethalometer model can provide the high time resolution variations of BC source contributions (Kalogridis et al., 2018; Y. Liu et al., 2018), which can help with understanding the atmospheric behavior of BC, especially regarding the temporal variation.
The atmospheric lifetime of BC varies from a few days to weeks; therefore, BC undergoes both regional and intercontinental transport (Bond et al., 2013). During transport, its mixing state, morphology and optical properties change (China et al., 2015). As a result, BC has been observed in remote areas such as the polar regions (Huang et al., 2010; Weller et al., 2013; Qi et al., 2017; Xu et al., 2017) and the Tibetan Plateau (Cong et al., 2013). Qi et al. (2017) found that Asian anthropogenic activities and biomass burning emissions from Siberia contributed 35 %–45 % and 46 %–64 %, respectively, to the sources of BC in the Arctic in April 2008 using GEOS-Chem modeling. Xu et al. (2017) also used a global transport model to conclude that the anthropogenic emissions from eastern and southern Asia contributed most to the Arctic BC column loading with percentages of 56 % and 37 % for the spring and annual contributions, respectively. To study the regional transport of BC, backward trajectory and concentration-weighted trajectory (CWT) analyses have also been employed (Huang et al., 2010; J. Wang et al., 2017). However, previous studies have mostly focused on the impact of BC transportation on its physical and chemical properties at a given site (e.g., a megacity or a remote background site). A recent study indicated that higher BC loading in summer in southern Ontario was partly due to trans-boundary fossil fuel-derived BC emissions in the US (Healy et al., 2017). To our knowledge, the interaction of BC transportation among various sites for a specific region has rarely been reported, which may limit the understanding of regional joint air pollution control.
After continuous efforts, particularly over the last 5 years, the spatial distribution pattern of air pollution has changed notably in China. A positive result of these efforts is that the average annual PM2.5 concentration in the Pearl River Delta (PRD) has reached the national secondary standard level (http://www.zhb.gov.cn/hjzl/zghjzkgb/lnzghjzkgb/, last access: 21 March 2018). Currently the North China Plain (NCP), the Yangtze River Delta (YRD), the Sichuan Basin (SB), the Fen-Wei River basin and central China (CC) are the key regions suffering from severe PM2.5 pollution. Lin et al. (2018)found that the air pollution areas on the southern edge of the North China Plain (SE-NCP) and central China were connected, and that obvious transportation routes exist between the SE-NCP and CC. The spatial distribution of the aerosol optical depth (AOD) across China also verified that high PM2.5 values existed in central China (Tao et al., 2017). As an important chemical component of PM2.5, BC accounts for 7.1 %–25.3 % of PM2.5 mass (Huang et al., 2014). A lot of observations of ambient BC have been conducted (Tables S1–S2 in the Supplement), although these measurements have mainly been focused on the NCP (Zhao et al., 2013; Ji et al., 2018; Y. Liu et al., 2018; J. Wang et al., 2017), YRD (Zhuang et al., 2014, 2015, 2017), PRD (Cheng et al., 2008; Wu et al., 2009; Y. Wang et al., 2017) and the Tibetan Plateau (TP) (Zhu et al., 2017; Niu et al., 2018; Z. Wang et al., 2018). However, no studies have concerned themselves with the BC transportation and interaction between these key regions. The BC emission inventory suggested that there were differences in source categories between the NCP and CC (R. Wang et al., 2014; Qiu et al., 2016), especially with respect to residential coal combustion (Qin and Xie, 2012). It should be emphasized that during the winter period, central-heating activities occur in the NCP, whereas no heating activities occur in central China. This implies that the sources of BC should be different. Therefore, the specific geographic locations and terrains of central China chosen in this study (Fig. 1) provide an ideal opportunity to understand BC levels, optical properties, and their sources and variation during intra-regional transportation between these two polluted regions. To our knowledge, no corresponding research has been undertaken.
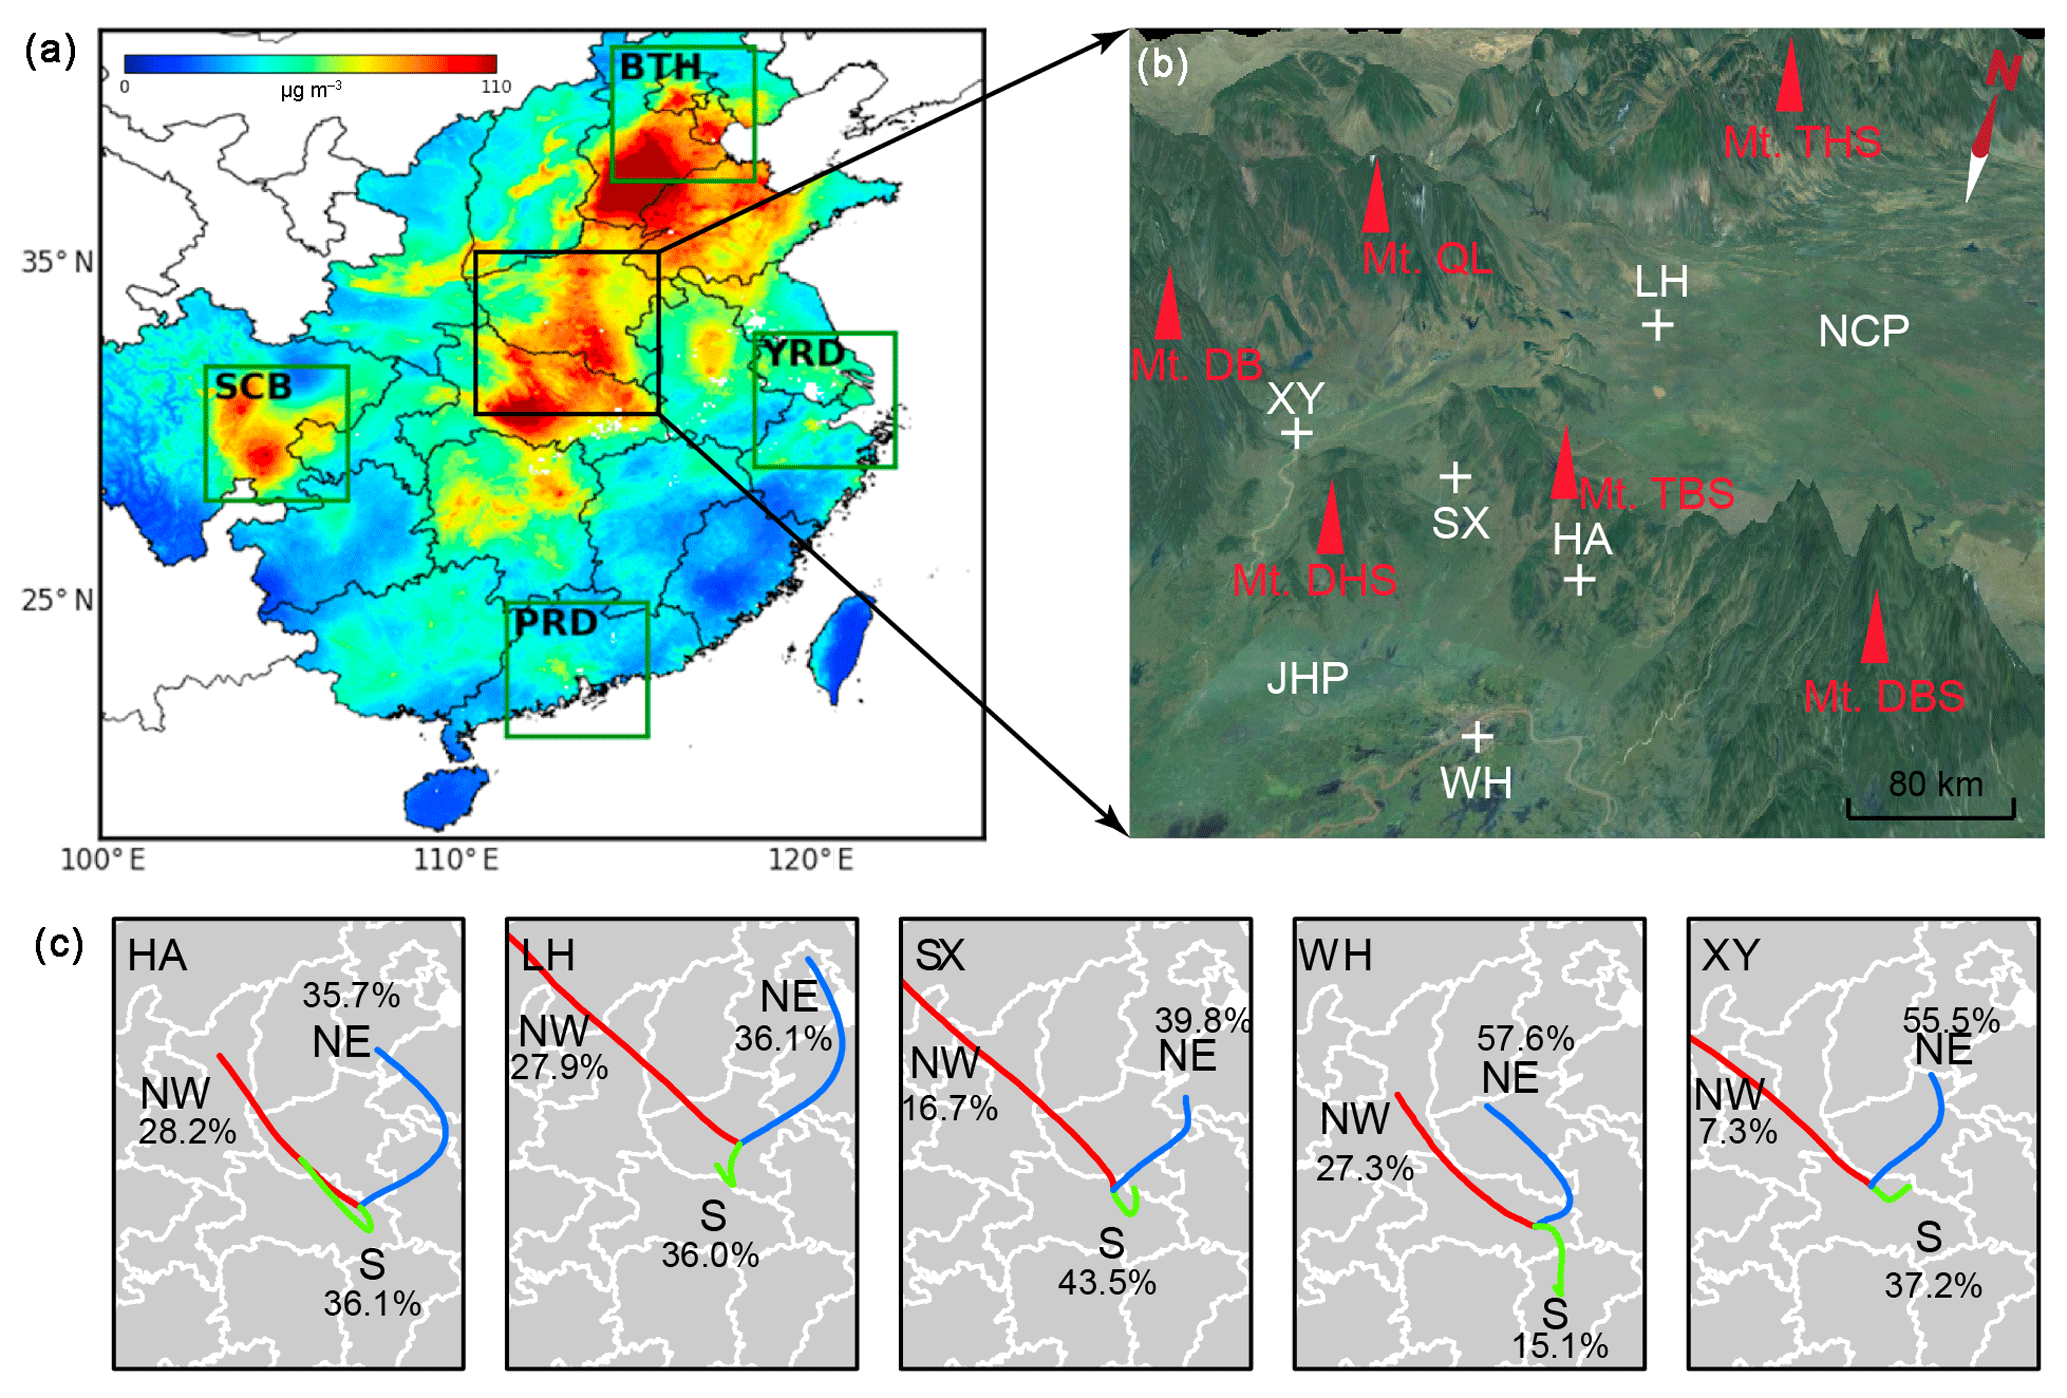
Figure 1The locations and terrain of the study areas and clusters of backward trajectories reaching each observation site. Panel (a) shows the spatial distribution of the 15-year average PM2.5 concentrations at a resolution of 1 km (Lin et al., 2018). Panel (b) shows that the study area is surrounded by mountains, and that the Dabie Mountains (Mt. DBS) and the Tongbai Mountains (Mt. TBS) separate the North China Plain (NCP) and Jianghan Plain (JHP). Panel (c) shows that air masses reaching the five sites, including Hong'an (HA), Luohe (LH), Suixian(SX), Wuhan (WH) and Xiangyang (XY), mainly originated from the north (northwest and northeast) during the observation period.
Therefore, the aims of this study were as follows: (1) to study the differences in BC levels, sources and optical properties under different air quality conditions in the abovementioned region; and (2) to quantify the regional transportation of BC at multiple observation sites in CC and the SE-NCP. To study BC sources, diagnosis ratios and the Aethalometer model were used. Backward trajectory-based methods were employed to quantify the potential regional transport contribution. This paper first reports the sources of BC in central China and then provides direct evidence regarding the variation in BC properties during regional transport between two key regions in China; this information is helpful with regard to developing effective countermeasures for mitigating regional air pollution.
2.1 Observation plan
When selecting the study sites, we referred to the trajectories of air masses reaching Wuhan in January 2017 (Fig. S1 in the Supplement) and found that the north and northwest directions were dominant. Regarding the northerly direction, the air masses originated from the SE-NCP and Luohe and moved south along routes that are close to heavy polluted regions (Fig. 1). As seen in Fig. 1, there are two obvious channels that allow for the movement of PM2.5 between the SE-NCP and CC, which are differentiated by the mountains dividing the two regions. Therefore, in order to investigate the regional transport of air pollutants and also answer the question regarding whether the pollutants in CC can be transported to the SE-NCP in winter, five sites including Wuhan (WH), three borderline cities (Xiangyang – XY, Suixian – SX, and Hong'an – HA; from west to east in Fig. 1) between the NCP and CC, and a city (Luohe, LH) in the SE-NCP were selected. The observation site at WH is located on a rooftop at the Hubei Environmental Monitoring Centre, which is an urban site with no industrial emission sources nearby. The LH and XY sites are located in suburban areas, whereas the HA and SX sites belong to rural areas. The observation instruments were placed near the local environmental monitoring stations. Measurements from six routinely monitored air pollutants including PM2.5, PM10, NO2, SO2, CO and O3 were available. Black carbon measurement instruments including Magee Scientific-AE31, AE33 and AE51 devices were deployed (Table 1). The observation periods began on 8 January after a regional snowfall event and ended on 25 January 2018 before another snowfall event began. The durations of the observations at the five sites are summarized in Table 1.
Table 1Information on the observation sites, periods and instruments.

2.2 Instrument description
The AE31 instrument continuously collects ambient BC on a quartz tape and measures light transmitted through a “sampled spot” (I) and a “reference spot” (I0) on the tape. The light attenuation (ATN) is then defined as
This assumes a linear relation between the BC mass loading and the delta of the ATN as a result of BC deposited on the tape. The BC mass concentration is calculated as follows:
where MAC is the mass specific attenuation cross section (m2 g−1), A is the area of the sampled spot (1.67 cm2) and V is the volume of the sampled air passing through the tape. An disadvantage of the AE31 is the filter loading effect, which needs to be compensated for via a correction (Petit et al., 2015). The BC absorption coefficient (babs, Mm−1) is calculated as
where C is the calibration factor (2.14 for quartz material tape), and R (ATN) is a correction factor for the shadowing effect; this correction factor is empirically determined using the following compensation parameter f (Weingartner et al., 2003):
To overcome the limitation of the loading effect, the AE33 (dual spot) was developed. This instrument also simultaneously measures the ATN at seven wavelengths. In contrast to the AE31, the AE33 measures BC on two parallel spots on the (Teflon-coated) fibre tape at a different flow rate:
The loading compensation k is calculated according to Eqs. (5) and (6), whereas the BC mass concentration is calculated as follows:
For the AE33, the sample spot area (A) is 0.785 cm2, and the enhancement parameter (C) is 1.57 for the Teflon-coated fibre. The absorption coefficient (σabs, Mm−1) for the AE33 is estimated by multiplying the BC mass concentration by the MAC. More details regarding the BC concentration calculation, parameters (i.e., f and MAC for different wavelengths) and the differences between the AE31 and AE33 instruments can be found in a previous study (Rajesh and Ramachandran, 2018). The AE51 measures the absorbance (ATN) of the loaded spot (3 mm diameter) and the reference portion of a Teflon-coated borosilicate glass fiber using a stabilized 880 nm LED light source. The flow rate of the AE51 was set to 100 mL min−1; more information about AE51 can be found online (https://aethlabs.com/microaeth/ae51/tech-specs, last access: 20 June 2018).
2.3 Data processing
2.3.1 BC source apportionment
BC efficiently absorbs the solar spectrum with a weak dependence on wavelength; the absorption Ångström exponent (AAE) is used to describe this spectral dependence on absorption (Zhu et al., 2017). The AAE value varies significantly from one source to another, i.e., the AAE values for fossil fuel combustion and biomass burning-derived BC are 1.0 and 2.0, respectively (Sandradewi et al., 2008). The BC source apportionment method was established based on the AAE (Sandradewi et al., 2008) and was verified using the 14C method (Zotter et al., 2017).
Black carbon source apportionment using the Aethalometer model is based on the assumption that the aerosol absorption coefficient is different from fossil fuel combustion-derived BC (BCff) and biomass burning-derived BC (BCbb). Because the absorption coefficients at different wavelengths are different and the absorption of BCff and BCbb follow different spectral dependencies. The Ångström exponents, αff and αbb, are used to describe the dependencies of fossil fuel and biomass burning, respectively; the following equations are used (Sandradewi et al., 2008):
Here babs (470 nm) and babs (950 nm) are the BC absorption coefficients at 470 and 950 nm wavelengths, respectively. Due to the single channel (λ=880 nm) of the AE51 instrument, BC source apportionment results were not available at SX and XY.
2.3.2 Assessment of surface transport
Generally, the northerly wind dominates in winter in CC, and air pollutants in the region can be transported downwind (north–south). In order to evaluate the effects of regional transport, the surface transport under specific wind directions and the wind speeds per unit time were calculated according to the methods used in a previous study (Z. Wang et al., 2018):
where f stands for the surface flux intensity of BC (µg s−1 m−2); n is the sum of the observation hours; WSi and Ci stand for the hourly average of wind speeds (m s−1) and BC mass concentrations (µg m−3) in the ith observation duration, respectively; θi represents the angle differences between the hourly wind direction and the defined transport directions (i.e., northwest–southeast for HA, SX and WH, and north–south for LH and XY).
2.4 Potential geographic origins
The concentration-weighted trajectory (CWT) analysis is always used to assess the regional transport of air pollutants (Kong et al., 2018; Zheng et al., 2018). This method is based on backward trajectory analysis. Prior to CWT analyses, the calculation of backward trajectories was firstly carried out for each sampling site. The input wind data sets for HYSPLIT were downloaded from the Nation Oceanic Atmospheric Administration (NOAA) (ftp://arlftp.arlhq.noaa.gov/pub/archives/gdas1/, last access: 25 April 2018). For backward trajectory analysis, the air masses reaching each observation site during the sampling period were calculated 24 times with a 1 h resolution each day (starting from 00:00 to 23:00) at 200 m a.g.l. (Fig. S2). These trajectories were than clustered according to their geographic origins (Fig. 1). For CWT analysis, a user-friendly Igor-based tool “ZeFir” was used (Petit et al., 2017a). The domain covered by the trajectories was divided into thousands of cells with a 0.2∘ × 0.2∘ resolution. More details regarding the CWT analysis can be found in the Supplement (Text S1).

Figure 2Time series and box plots of eBC, BCbb, BCff and the absorption Ångström exponent (AAE) at five sites including Hong'an (HA), Luohe (LH), Suixian(SX), Wuhan (WH) and Xiangyang (XY) during the observation period.
2.5 Auxiliary data set
An hourly meteorological data set including sea level pressure, temperature, relative humidity, wind speed, wind direction and visibility was acquired form the China Meteorological Data Service Centre (CMDC) (http://data.cma.cn, last access: 26 January 2018). The 3-hourly boundary layer height (BLH) was acquired from the NOAA's READY Archived Meteorology online calculating program (http://ready.arl.noaa.gov/READYamet.php, last access: 8 April 2018). Figure S3 shows the hourly averaged meteorological parameters at the five sites. Meteorological conditions at the five sites followed similar trends, although significant differences (p<0.01) between these parameters were found (Table S3). For instance, the average pressure, temperature and relative humidity at WH were significant higher (p<0.01) than those at LH. Regarding the BLH, the mean values of the five sites showed no significant differences.
Information regarding six air pollutants (PM10, PM2.5, SO2, NO2, CO and O3) was available, and the data were downloaded from the China Environmental Monitoring Centre (http://www.cnemc.cn, last access: 10 April 2018). Figure S4 shows the hourly variations in these species during the observation period. The major air pollutant throughout the observation campaign was PM2.5. According to the ambient air quality standards (GB3095-2012), the air quality can be classified as clean, lightly polluted or heavily polluted when PM2.5 mass concentrations are less than 75, between 75 and 250, and greater than 250 µg m−3, respectively. Similar air quality classifications have also been reported elsewhere (Zheng et al., 2015; Zhang et al., 2018). Detailed information regarding the daily air quality of each site is shown in Fig. S5.
3.1 General characteristics
Time series and box plots of the eBC concentrations (measured at 880 nm) at the five sites are shown in Fig. 2. The highest eBC concentration was observed at LH (8.48±4.83 µg m−3), followed by XY (7.35±3.45 µg m−3), HA (5.54±2.59 µg m−3), SX (4.47±2.90 µg m−3) and WH (3.91±1.86 µg m−3). As shown in Table S1, BC was generally higher in North China, whereas lower BC levels were found in remote and coastal areas (Fig. 3a). Q. Wang et al. (2014) analyzed ambient BC at an urban site in Xi'an during winter and found that the average mass concentration was 8.8±3.7 µg m−3, which was higher than concentrations observed in this study. Compared with other regions, BC levels in this study were higher than those in a remote area of Lulang in the southeastern part of the Tibetan Plateau (0.31±0.55 µg m−3; Q. Wang et al., 2018) as well as coastal areas, such as Hong Kong (1.4±1.1 µg m−3; J. Wang et al., 2017), and a rural site in Shenzhen (2.6±1.0 µg m−3; Huang et al., 2012). Based on the BC emission inventory, northern and central China display higher BC emission intensity (Qin and Xie, 2012; Yang et al., 2017). Emission values in Hubei and Henan provinces were about 0.6–1.0 g C m−2 yr−1, which makes them higher than values in other regions (Yang et al., 2017). Simulation results also suggested that the near-surface concentrations of BC (6–8 µg m−3) in Hubei and Henan were higher than those in southern China (4–6 µg m−3) during winter (Yang et al., 2017). Compared with the data from other countries (Table S1), BC levels in this study were higher than those in Finland (Hyvärinen et al., 2011), France (Petit et al., 2017b), Canada (Ontario – Healy et al., 2017) and South Africa (Chiloane et al., 2017).

Figure 3Spatial distribution of BC mass concentration (a) and absorption coefficients (b) in China. More details can be found in Tables S1 and S2 in the Supplement.
For the aerosol absorption properties measured at seven wavelengths using an Aethalometer, the characteristics (i.e., temporal variation) are generally consistent with one another; however the properties are mostly discussed at a wavelength of 520 nm (Zhuang et al., 2015, 2017; Y. Wang et al., 2017). Then, we only discussed the absorption properties at λ=520 nm. Figure 4a shows the frequency distribution of absorption coefficients (σabs) at three sites. σabs measured at HA, LH, and WH exhibited a single peak pattern. The average values of σabs measured at HA, LH and WH were 86.0, 132 and 60.6 Mm−1, respectively. Similar to the spatial distribution of the BC level, higher σabs values were found in northern and central China, whereas lower values were observed in coastal areas and the Tibetan Plateau (Fig. 3b and Table S2).
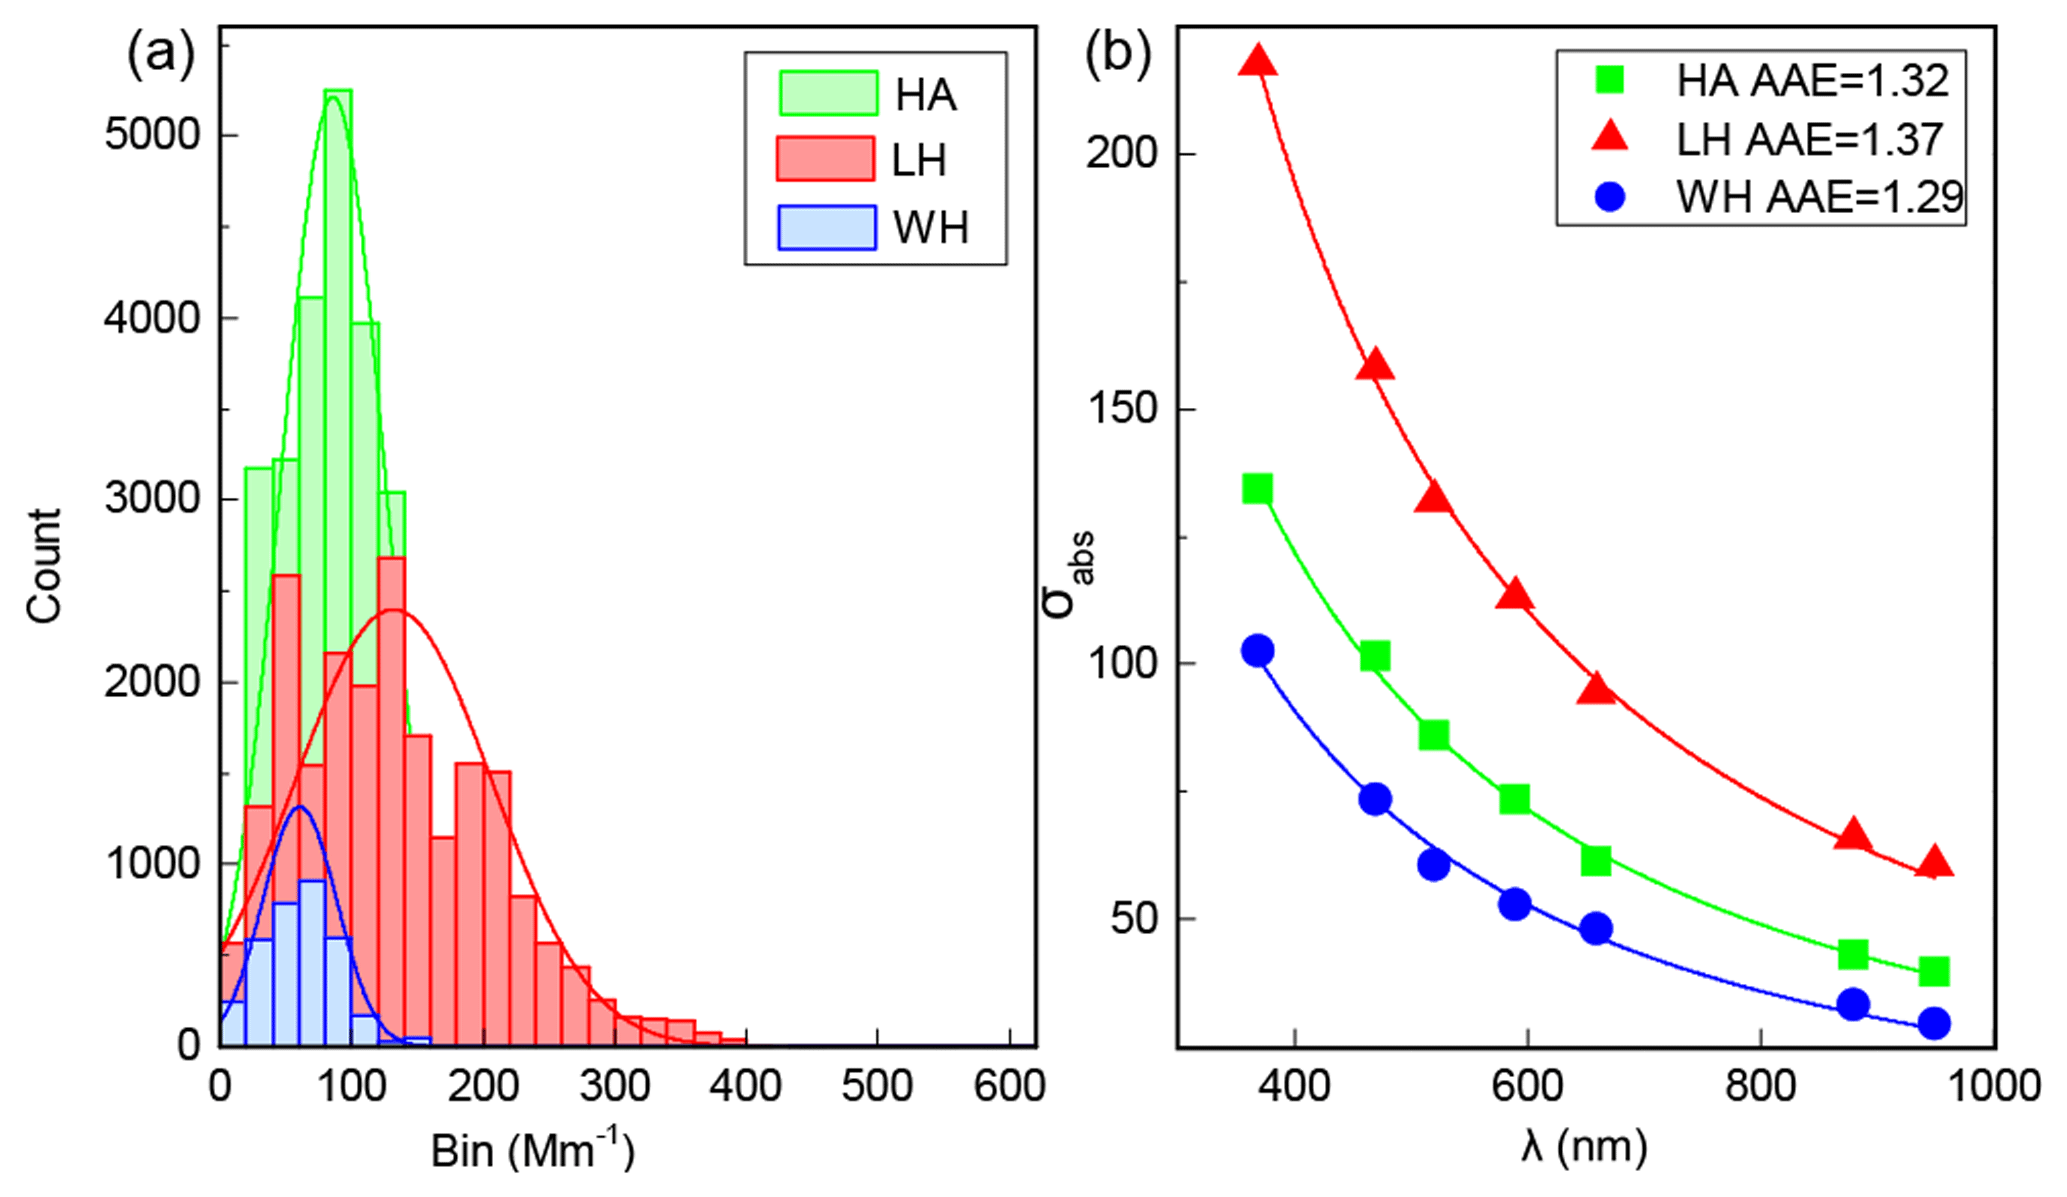
Figure 4Frequency distribution of absorption coefficients (σabs) at a wavelength of 520 nm (a) and power fit of σabs at the seven wavelengths (b) for HA, LH and WH.
Figure 4b also shows the average absorption spectra measured at seven wavelengths for different sites. The power law fit was used to calculate the AAE (Zhu et al., 2017). The highest average AAE value was found at LH (1.37), followed by HA (1.32) and WH (1.29). These results indicated that the AAE was different at urban, suburban and rural sites. Generally, the AAE values from coal combustion (2.11–3.18; Sun et al., 2017) and biomass burning (1.85–2.0; Petit et al., 2017b) were higher than those from traffic sources (0.8–1.1; Sandradewi et al., 2008; Olson et al., 2015). Therefore, the AAE at different sites suggested a different energy consumption structure, and that more coal or biomass was burned in North China (i.e., LH in this study).
3.2 Clean days vs. pollution episodes
Figure 5 displays the eBC concentrations under different air quality conditions. It clearly shows that the eBC concentrations increased with the deterioration of air quality. At LH, the average eBC concentrations were 3.39±2.06, 8.31±4.55 and 13.0±4.59 µg m−3 when the air quality was clean, lightly polluted and heavily polluted, respectively. The average values of eBC increased by 163 %, 139 %, 96.2 %, 51.8 % and 26.4 % at SX, XY, LH, HA and WH, respectively, from clean to polluted periods. eBC enhancement along with air quality deterioration has also been reported elsewhere (Q. Wang et al., 2014; H. Wang et al., 2014; Liu et al., 2016; Y. Liu et al., 2018). At LH and HA, the enhancement of the eBC level from clean to polluted periods was due to both elevated BC emissions from biomass burning (BCbb) and fossil fuel combustion (BCff) (Fig. 5b, c). BCff accounted for a higher contribution to eBC and the percentages of BCbb to eBC decreased during the haze episodes (Fig. 4d). At WH, both the concentration and percentage contribution of BCbb decreased from clean to polluted conditions, which suggested that more BCff was emitted during haze episodes. This finding was different to those of a previous study conducted in Beijing, which reported that the absolute concentration and percentage contribution of biomass burning and coal combustion to eBC were higher than those from traffic sources and increased from clean conditions to polluted episodes (Y. Liu et al., 2018). These difference suggest that the control of fossil fuel combustion (vehicle emissions), not coal or biomass burning, should be the priority during haze episodes at WH, whereas biomass burning and coal combustion control should be made a priority in North China to prevent air pollution.
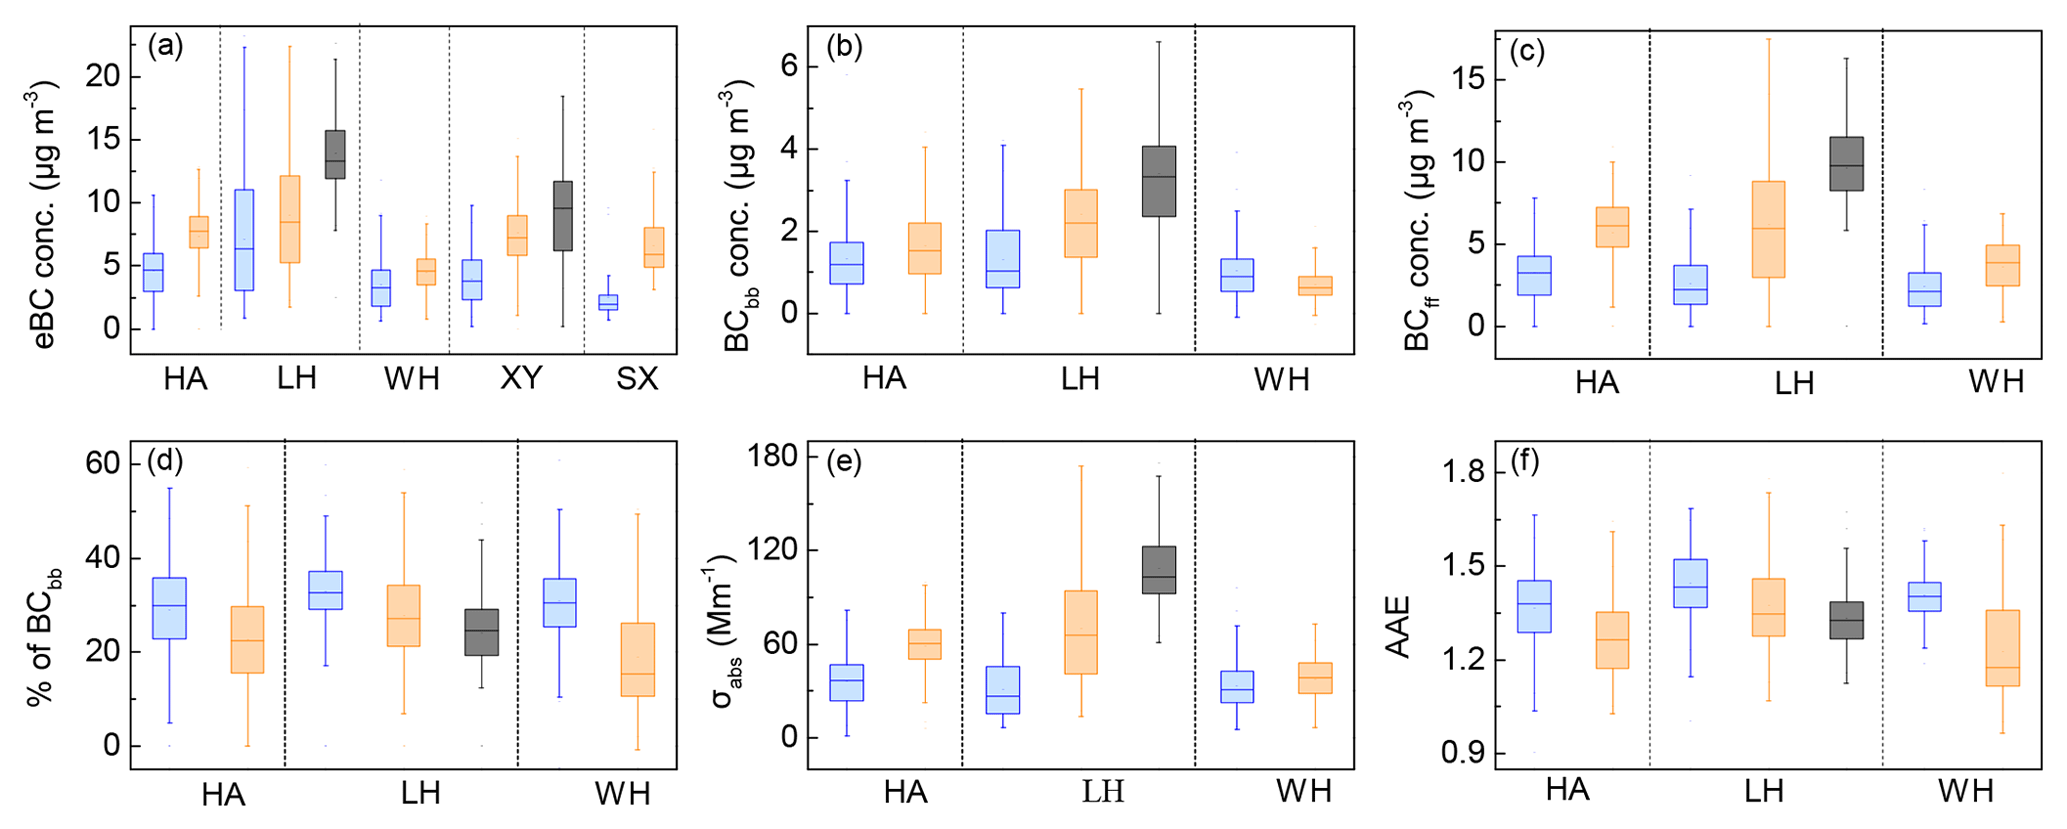
Figure 5Box (25th–75th percentiles) and whisker (5th–95th percentiles) plots of eBC concentrations (a), BCbb (b), BCff (c), percentages of BCbb (d), aerosol absorption coefficients (e) and the absorption Ångström exponent (AAE) under different air pollution conditions. Blue, orange and black represent clean (PM2.5 < 75 µg m−3), lightly polluted (75 < PM2.5 < 250 µg m−3) and heavily polluted conditions (PM2.5 > 250 µg m−3), respectively. The number of data used for the different air quality parameters can be found in the Supplement (Table S4).
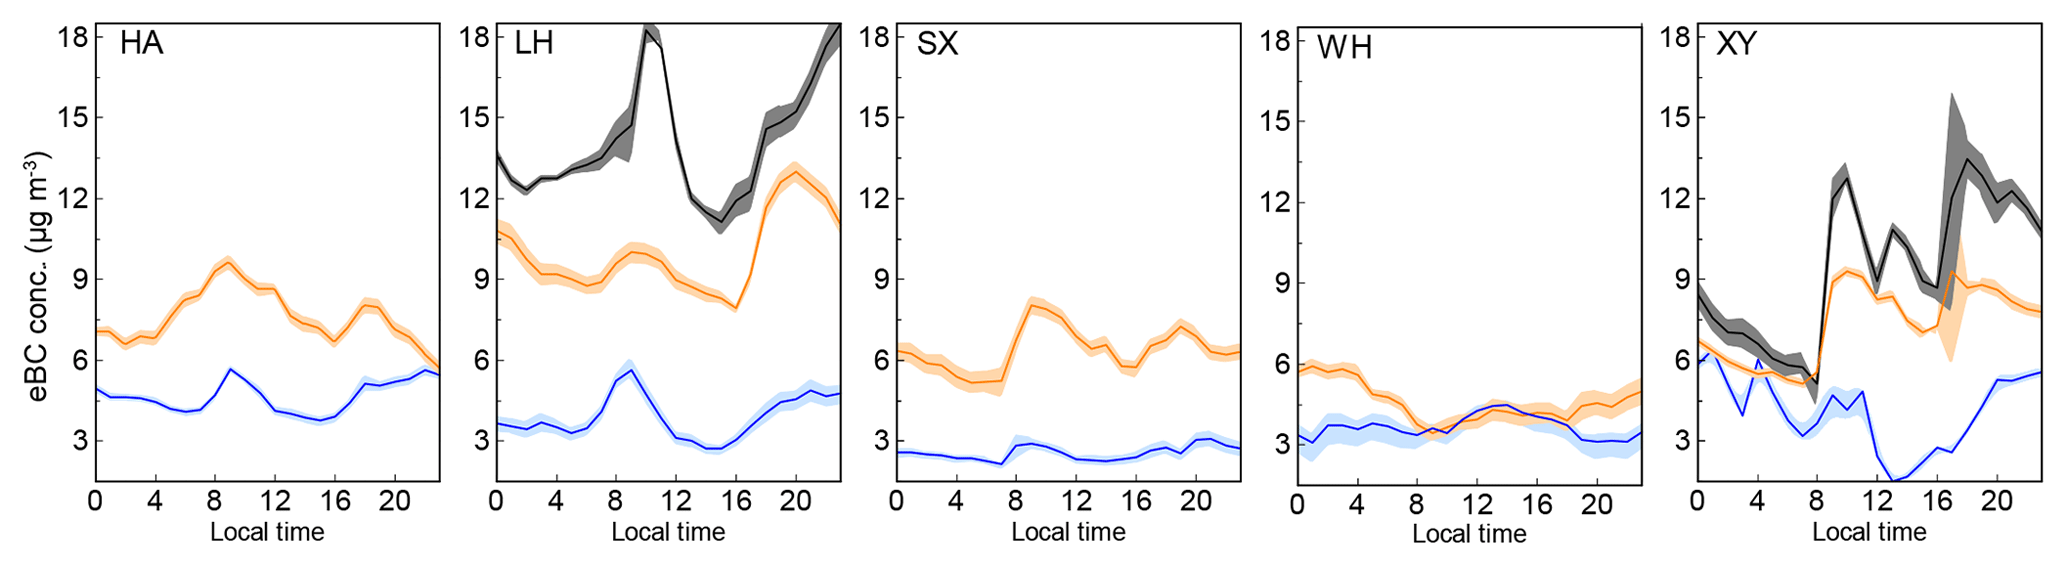
Figure 6Diurnal variations of eBC under different air pollution conditions (blue: clean; orange: lightly polluted; dark: heavily polluted) at the five observation sites. The solid lines are the average values, and the shading represents the 95th percentile confidential intervals of the average value.
Additionally, the aerosol optical properties (σabs and AAE) also exhibited different levels under different air quality conditions. Similar to the eBC levels, the σabs increased by 11.7 %–254 % as the air quality switched from clean to polluted conditions (Fig. 5e). Our observation (Fig. S6) and previous research both found that there are more secondary aerosols (i.e., sulfate and nitrate) during pollution episodes (Huang et al., 2014). The increase in secondary aerosols would result in more of these secondary aerosol species being adsorbed onto (coating) BC particles, which would enhance the absorption properties of BC via the lens effects of these coating materials (Jacobson, 2000; Moffet and Prather, 2009). On the contrary, the AAE showed higher values during clean days compared with polluted periods (Fig. 5f). This decrease in the AAE from clean to polluted days has also been reported elsewhere (Y.-L. Zhang et al., 2015), and it can be partly attributed to source variation. The AAE for biomass burning is about 2.0, whereas the AAE for fossil fuel combustion is about 1.0 (Sandradewi et al., 2008). Higher AAE values during clean periods suggested that more BC may be from biomass burning, whereas lower AAE values indicated the dominance of fossil fuel combustion during the polluted periods (Fig. 5c). The AAE is also sensitive to other factors such as the particle size. Previous studies have suggested that the particle diameter and number concentration increases from clean to polluted conditions due to several factors such as coagulation, hygroscopic growth, emissions and meteorological conditions, i.e., planetary boundary layer and wind speed (Guo et al., 2014; Zhang et al., 2017). These studies have also suggested that the particle diameter is generally larger during polluted periods. Furthermore, lab combustion experiments and numerical simulations have proven that BC particles with larger geometric median diameters have lower AAE values (Singh et al., 2016; C. Liu et al., 2018); hence, a lower AAE value was observed during pollution episodes in this study.
Figures 6 and S7 show the diurnal variations of eBC and absorption coefficients under different air quality conditions. The diurnal cycles of black carbon and absorption showed similar variation patterns. The BC mass concentrations are discussed here. At HA, LH and SX, after sunrise, an increase and a peak value were observed at about 09:00 local time (LT). This variation was more obvious during polluted periods due to the higher eBC levels. The morning peak may have been related to the combined effects of increased biomass burning and fossil fuel combustion emissions (Fig. S7). Additionally, the low mixing layer height in the morning also favored the accumulation of eBC. After sunrise, with the elevation of the BLH, the eBC levels decreased and a minimum occurred at about 15:00 LT. In the evening, eBC showed an increasing trend and peaked at about 21:00 LT. Similar diurnal patterns of eBC have also been reported in other areas (Verma et al., 2010; Ji et al., 2017; Y. Liu et al., 2018). In contrast, the diurnal variations of eBC at WH and XY exhibited different patterns during clean and polluted periods. The diurnal pattern of eBC at WH was likely not controlled by the development of the mixing layer height, which generally leads to the maximum and minimum values of air pollutants occurring at sunrise and in the afternoon, respectively. Hence, the unexpected lower value in the morning (about 09:00 LT) and a higher value in the afternoon (15:00 LT) at WH require further research.
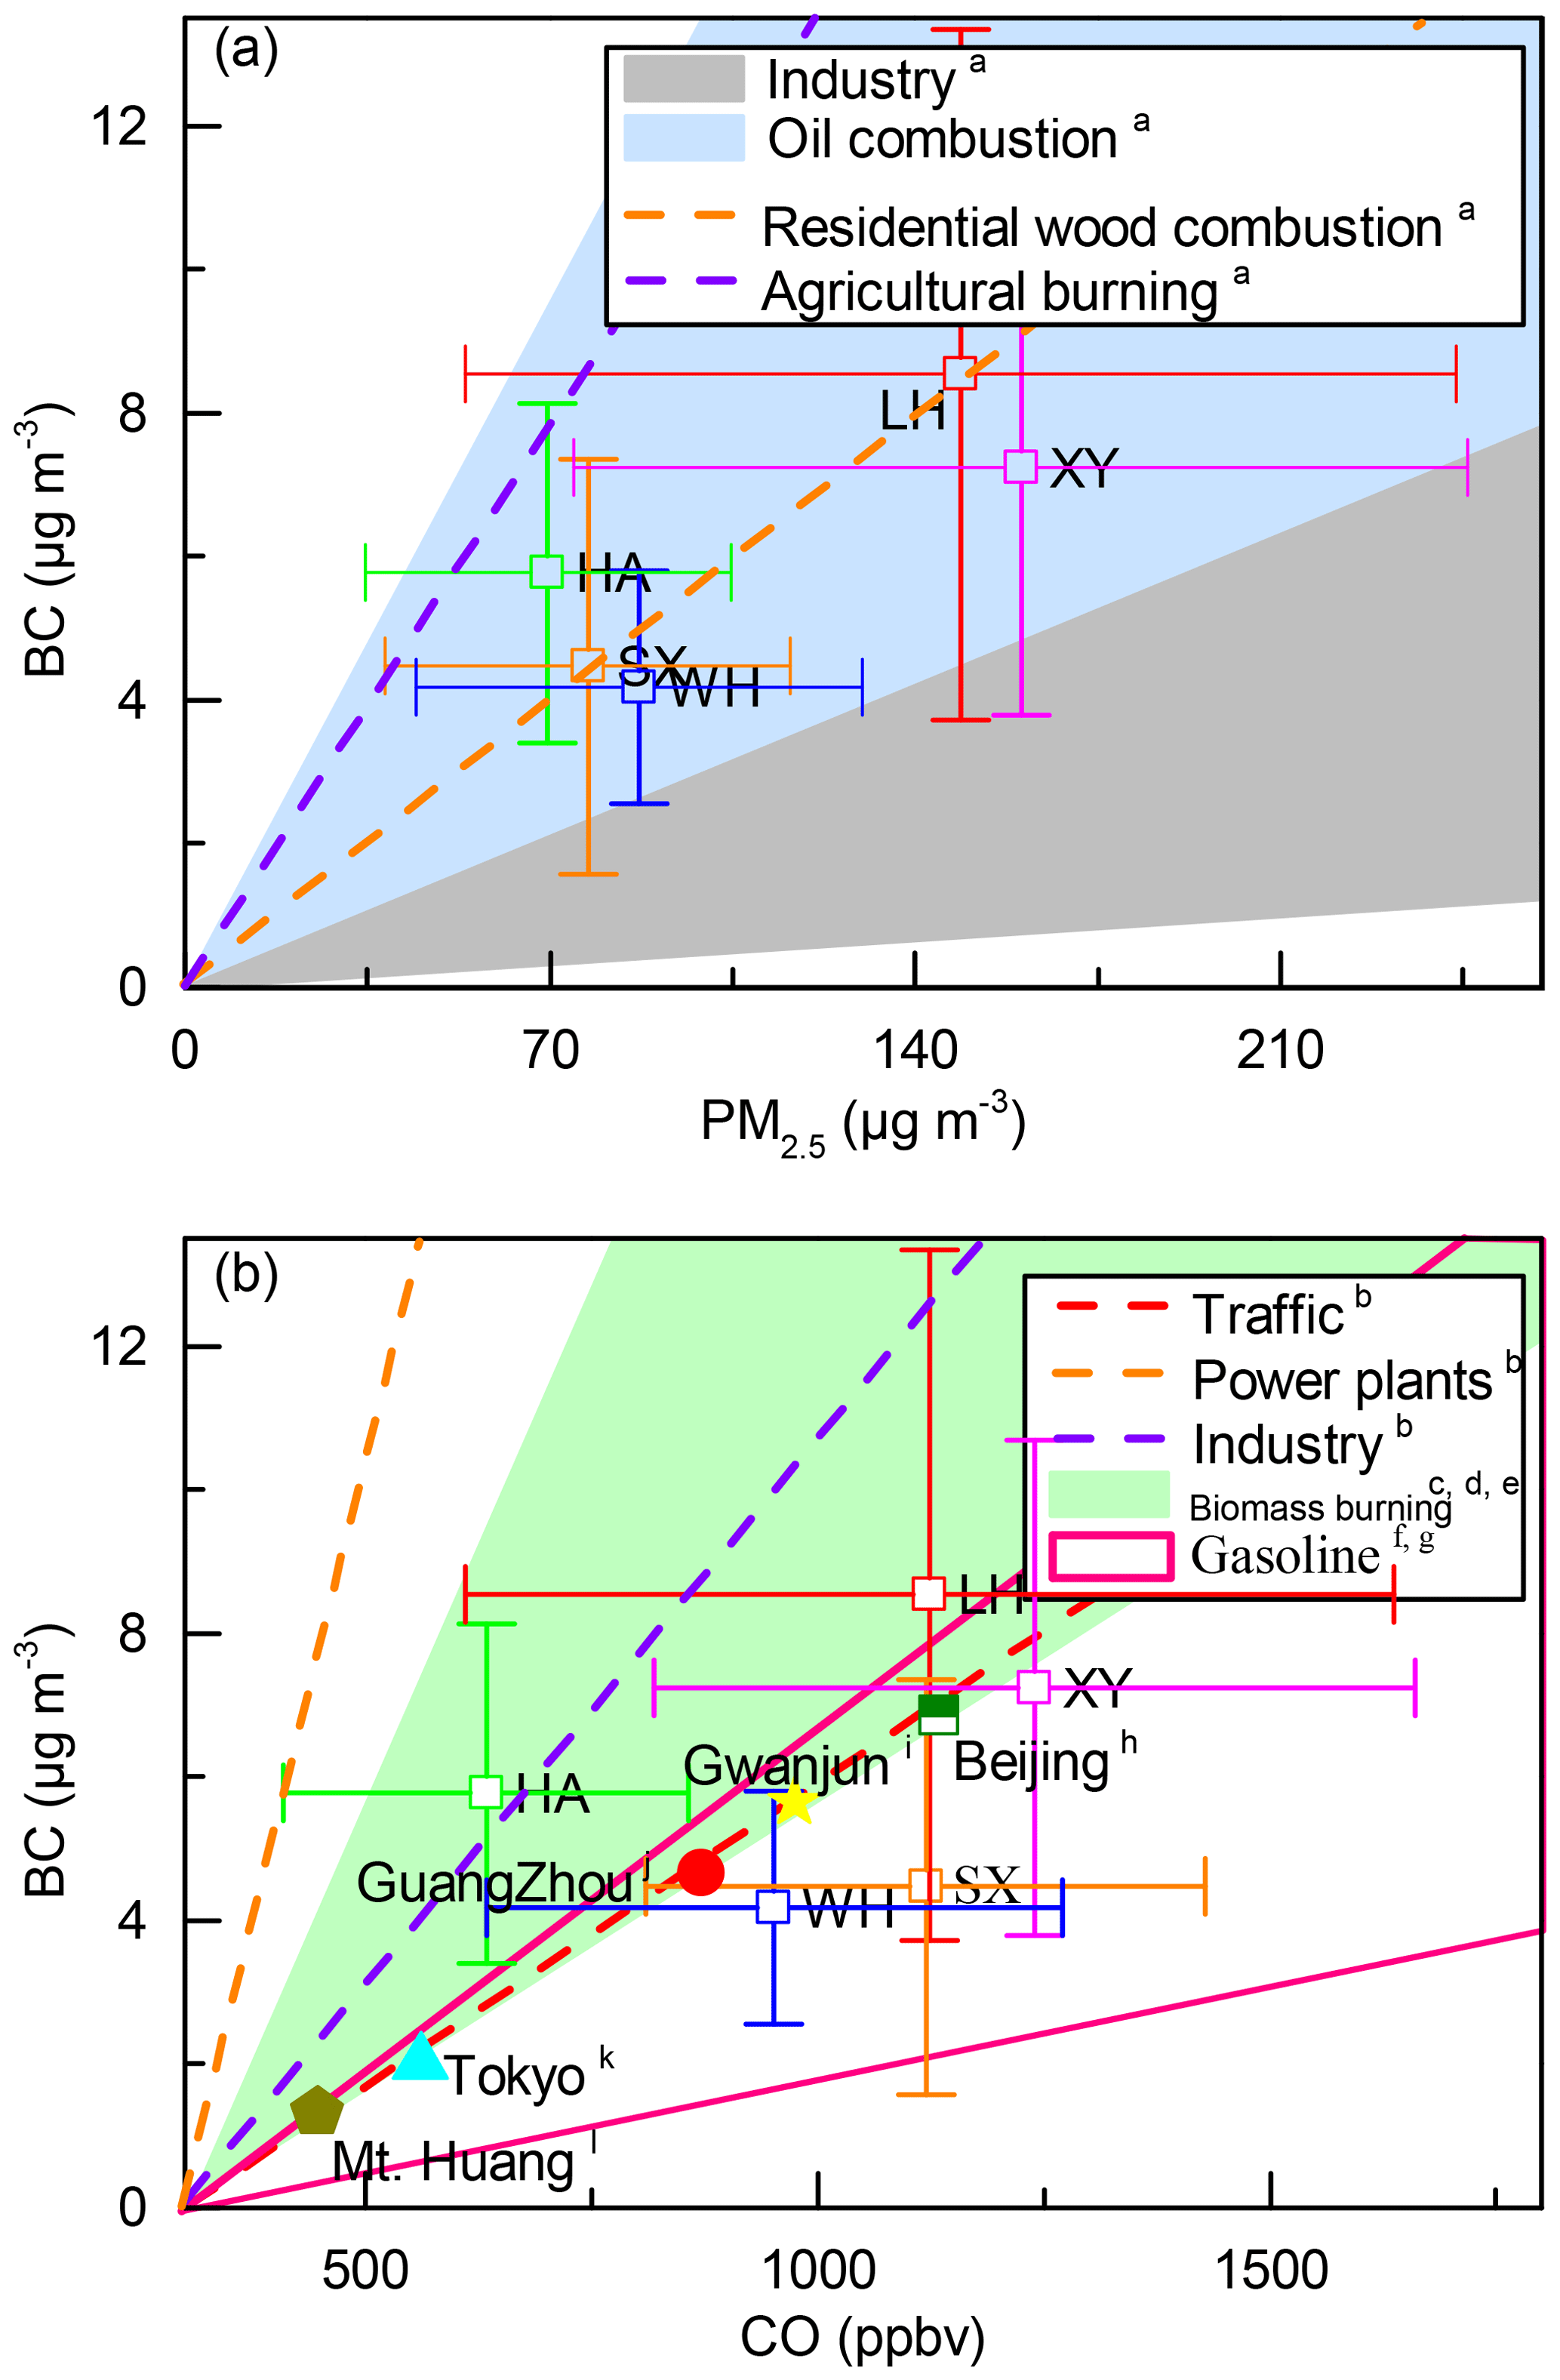
Figure 7Ratios of BC∕PM2.5 (a) and BC∕CO (b) in this study and those from previous research: a Chow et al. (2011); b Zhang et al. (2009); c Dhammapala et al. (2007); d Cao et al. (2008); e Andreae and Merlet (2001); f Streets et al. (2003); g Westerdahl et al. (2009); h Y. Liu et al. (2018); i Park et al. (2005); j Verma et al. (2010); k Kondo et al. (2006); and l Pan et al. (2011).
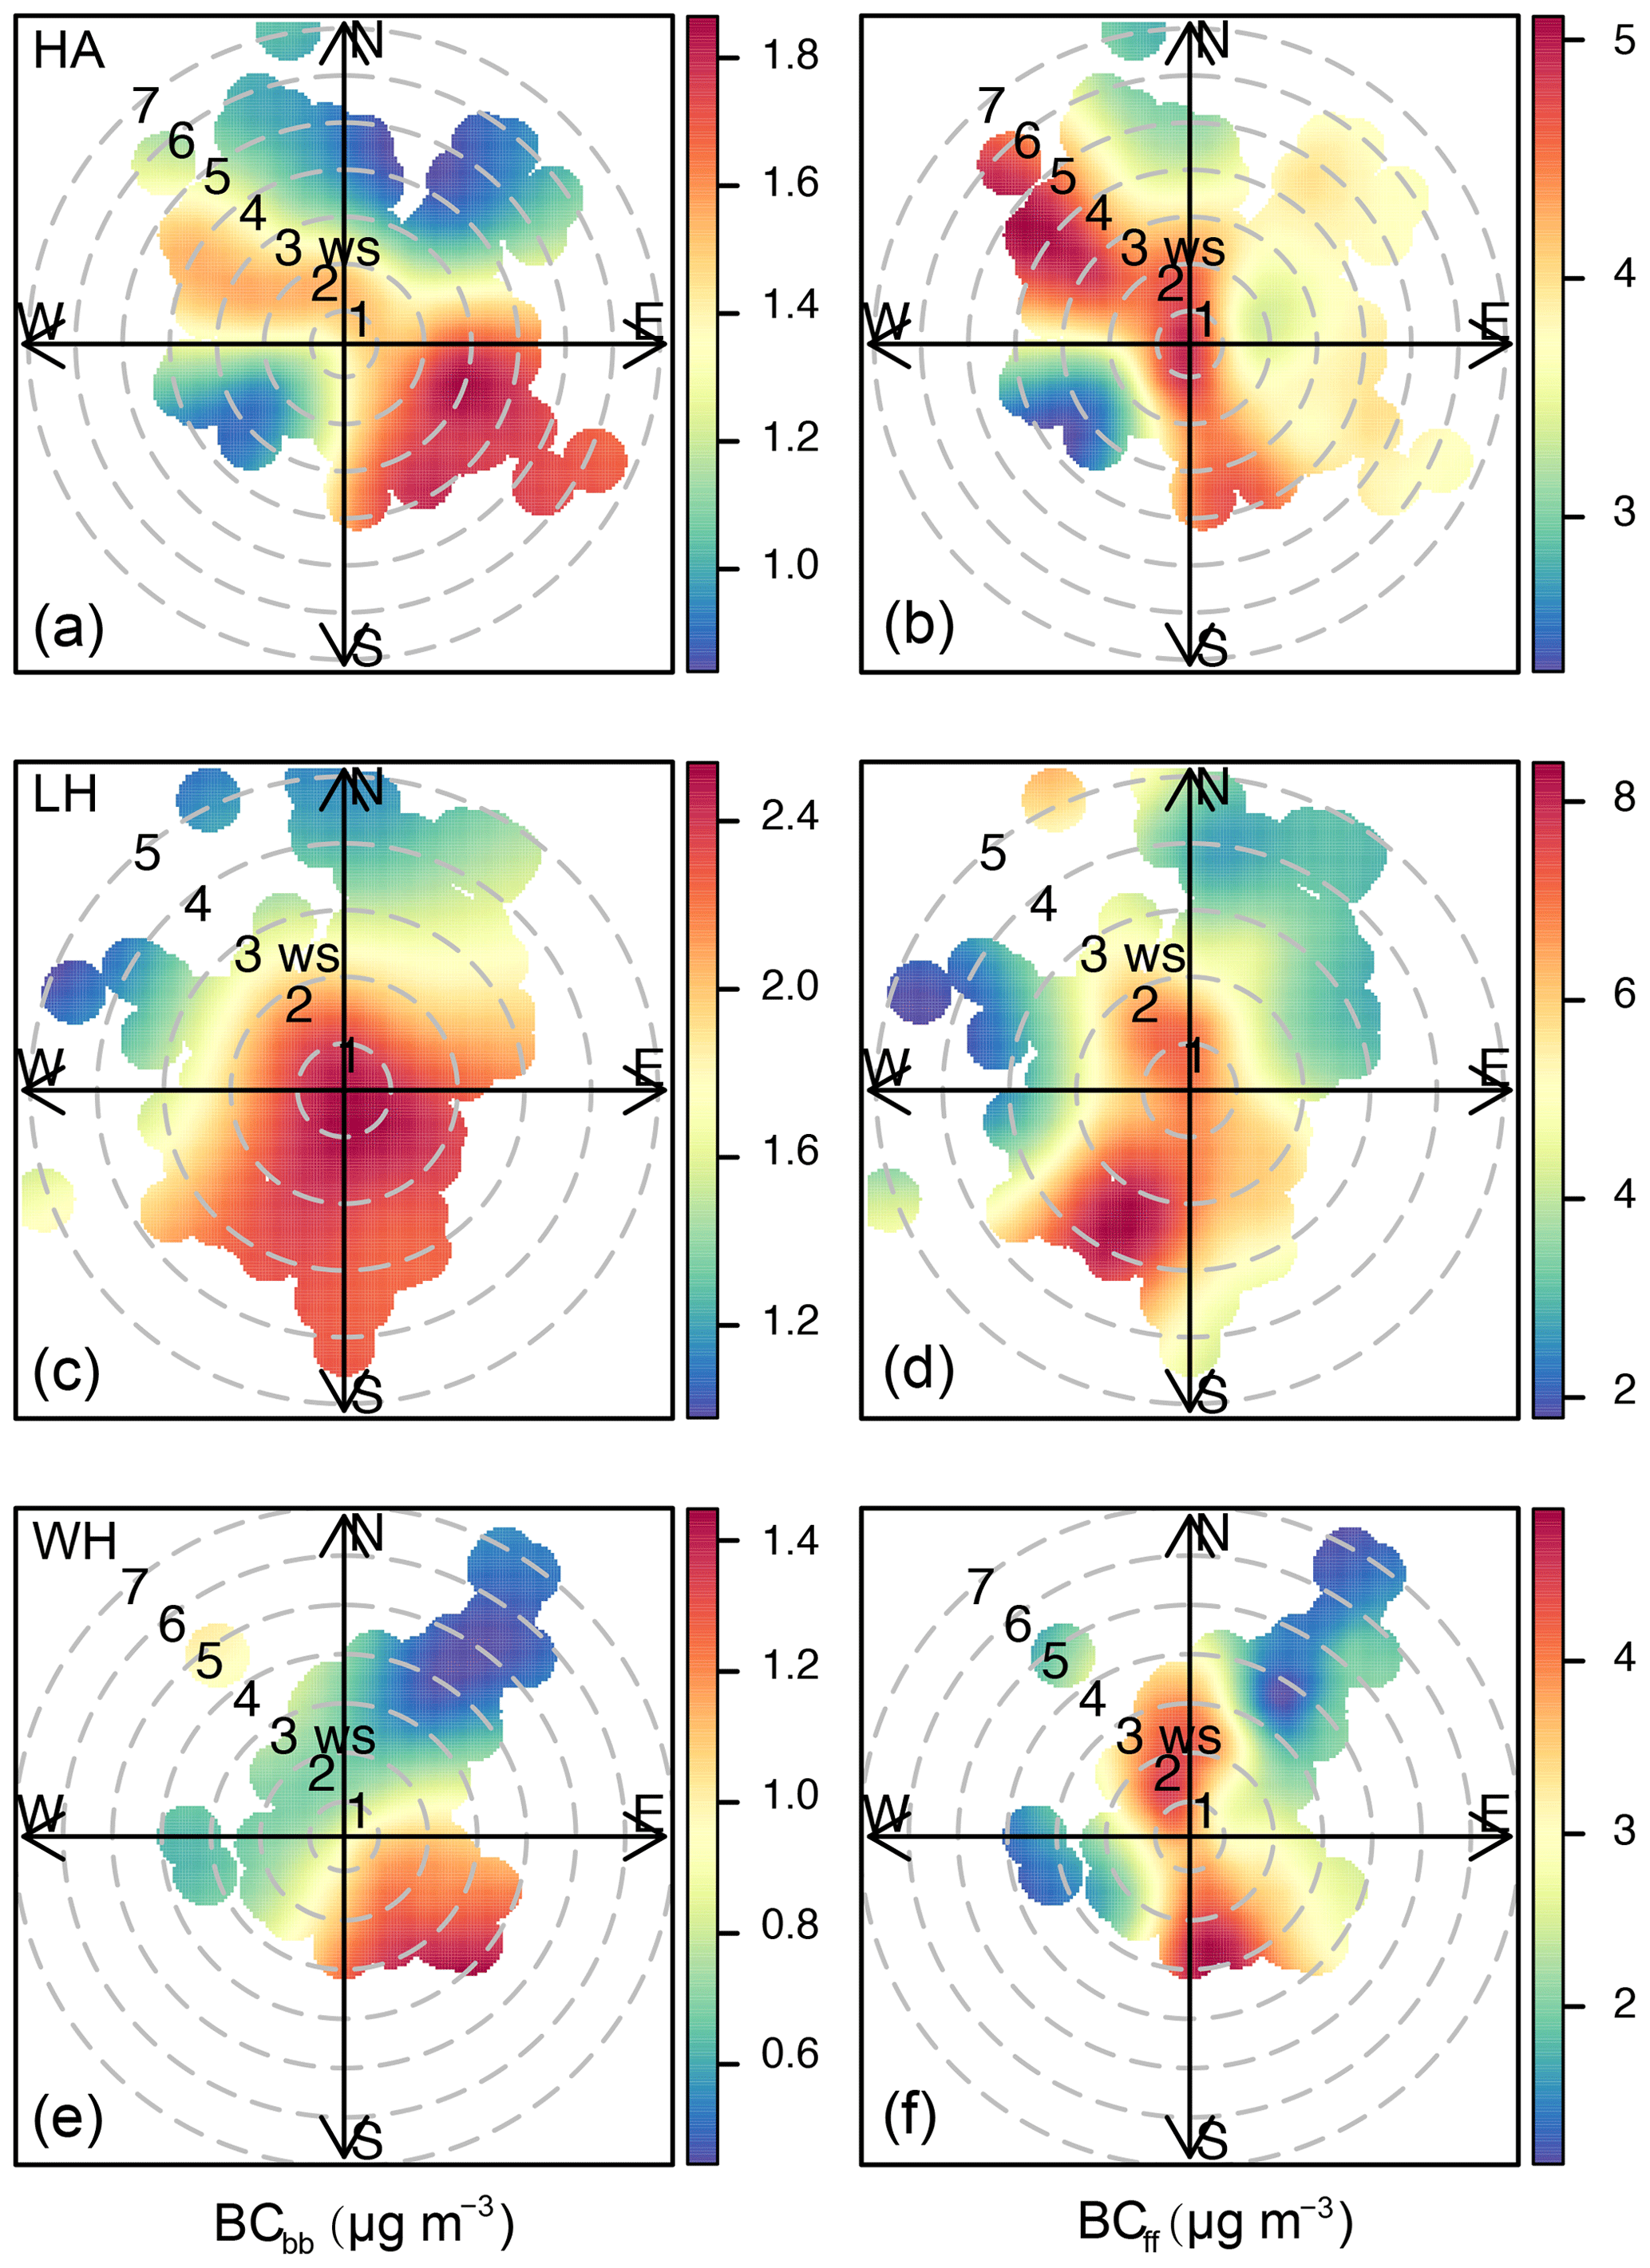
Figure 8Conditional bivariate probability function (CBPF) plots of BCbb (a, c, e) and BCff (b, d, f) at HA (a, b), LH (c, d) and WH (e, f).
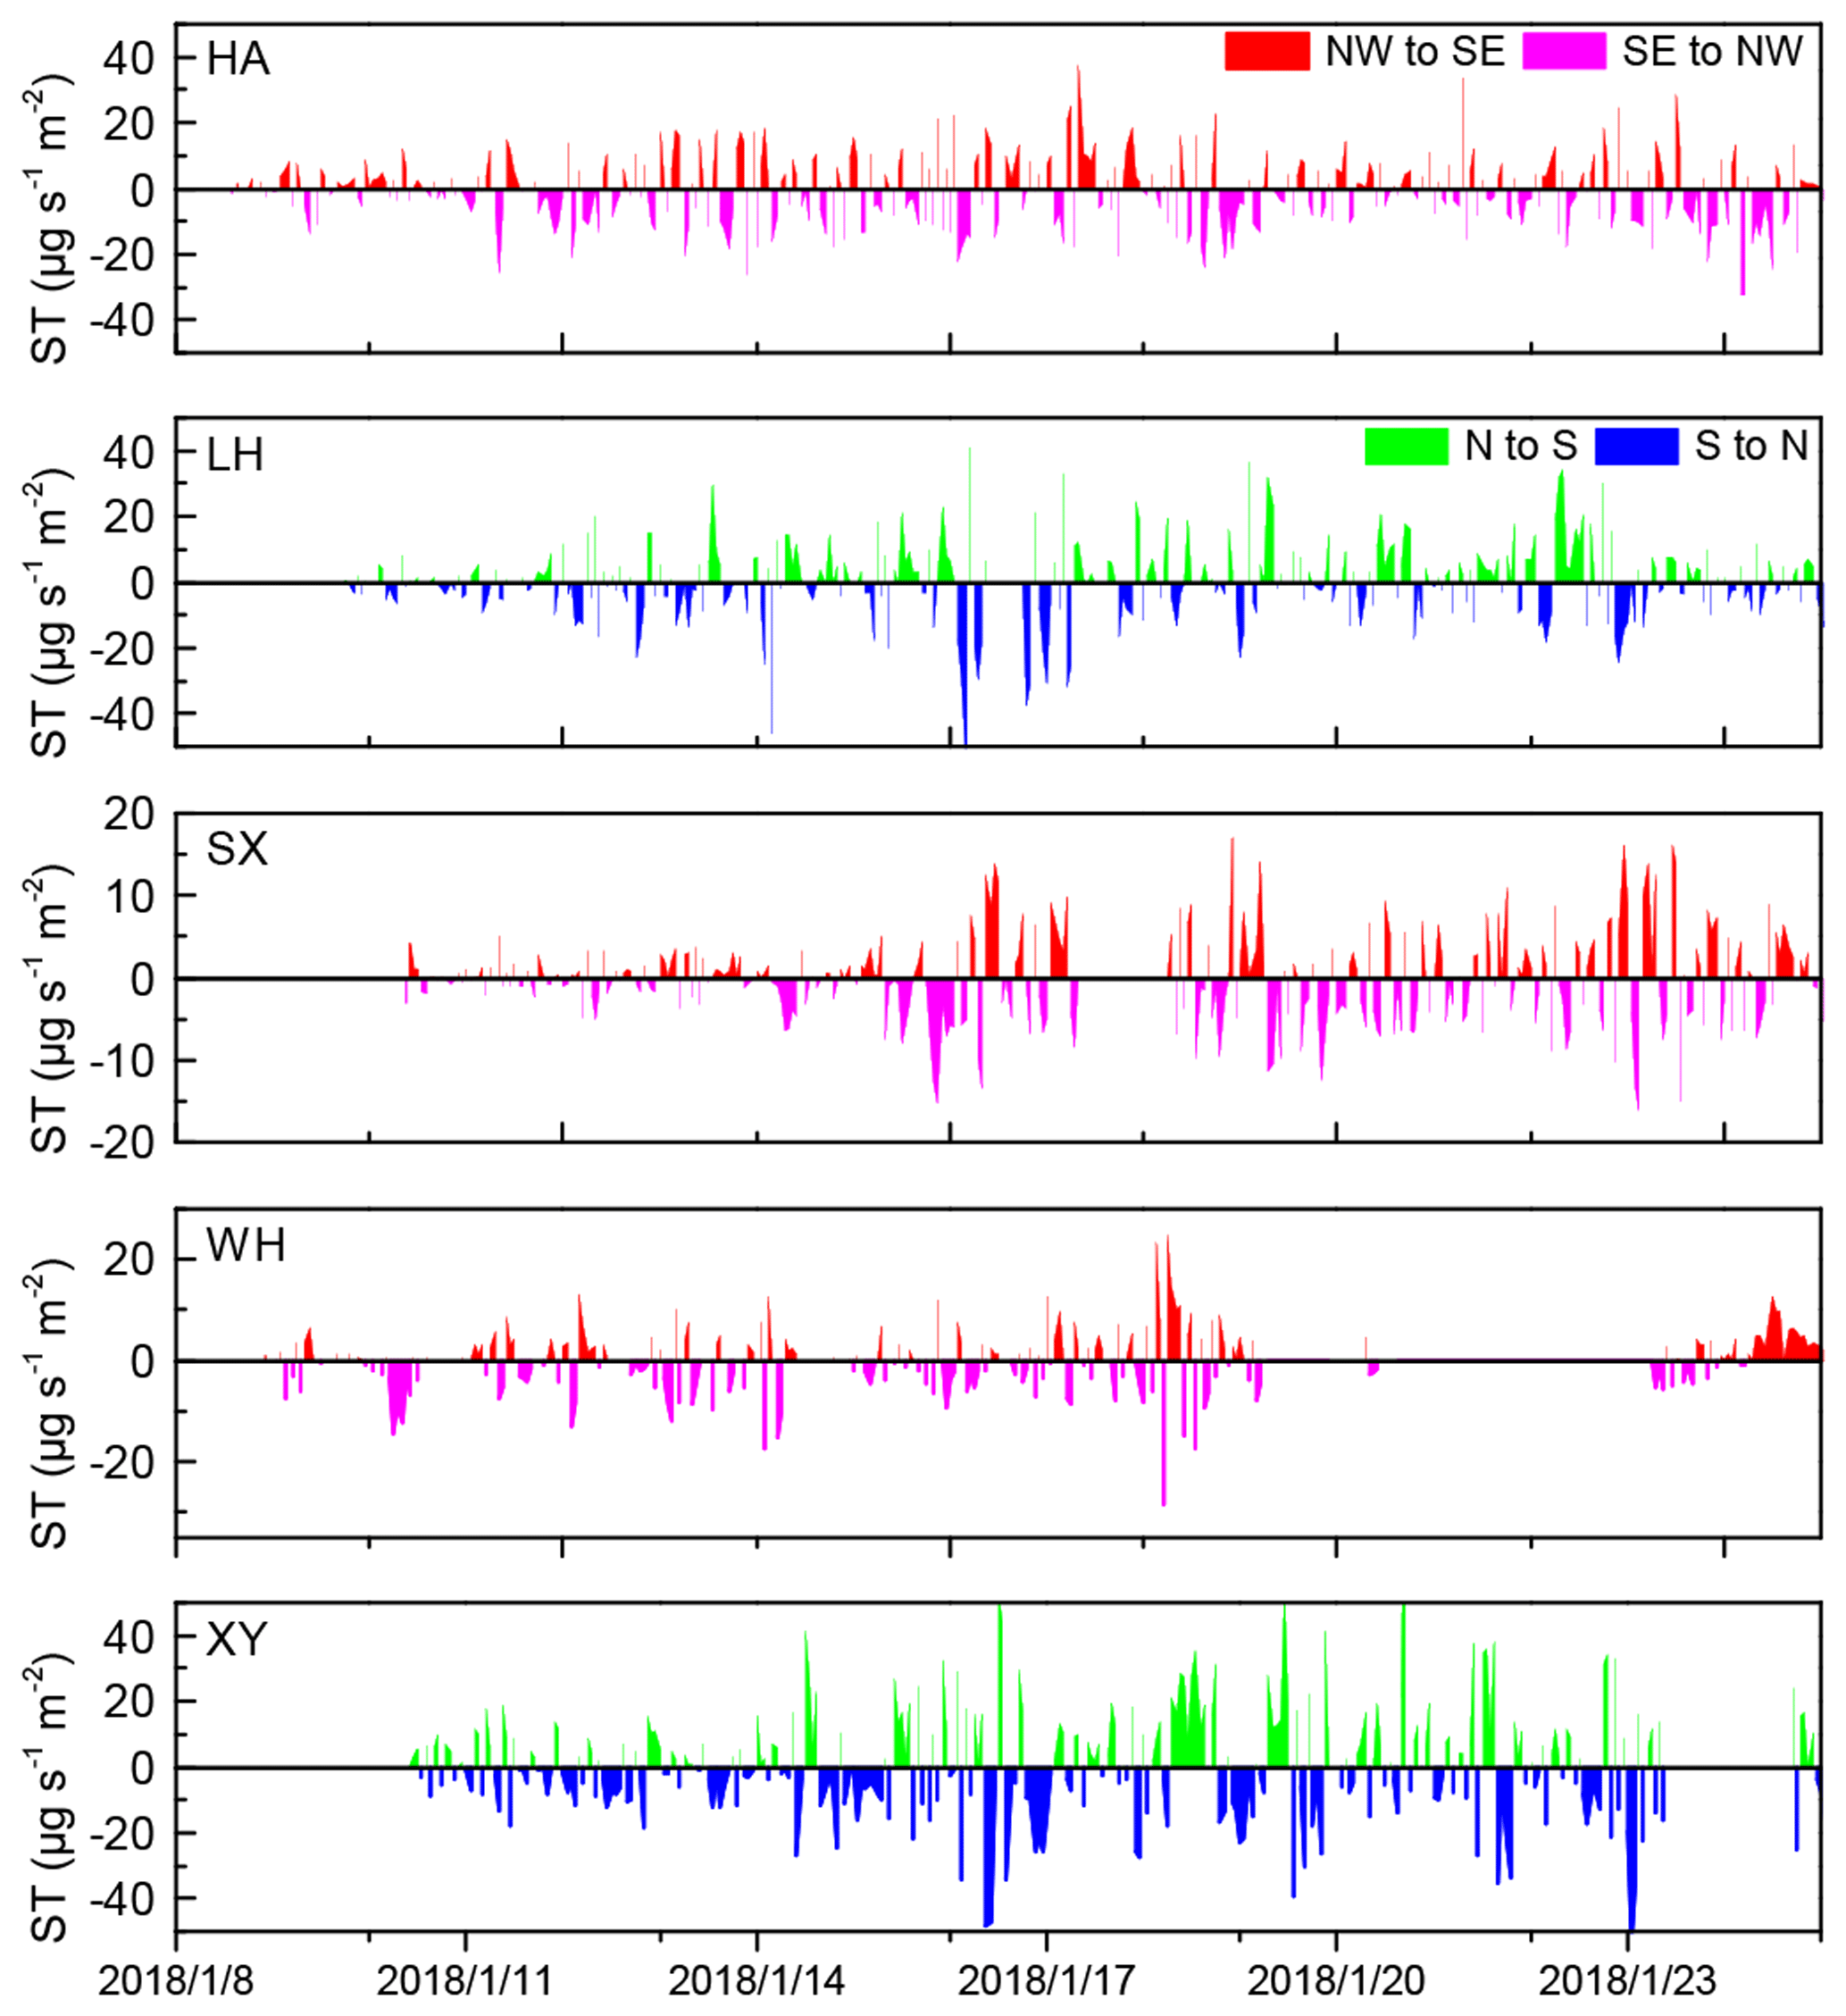
Figure 9Time series of surface transport (ST) intensity for BC at the five observation sites. Positive values for HA and LH indicated that the transport direction was north–south, and negative values indicated the transport direction was south–north. Positive values for SX, WH and XY indicated that the transport directions were northwest–southeast, and negative values indicated the transport directions were southeast–northwest.
3.3 BC∕PM2.5 and BC∕CO ratios
BC∕PM2.5 and BC∕CO ratios are widely used to identify the sources of BC (Zhang et al., 2009; Wang et al., 2011; Verma et al., 2010; Chow et al., 2011). Generally, ratios of BC∕PM2.5 from mobile sources (0.059–0.74) and area sources (0.032–0.33) are higher than those from industrial sources (0.0046–0.03). For instance, mobile sources present the highest ratios of BC∕PM2.5 (0.33–0.77) and cement kilns show lower ratios (0.03) (Chow et al., 2011). The BC∕CO ratios (µg m−3 ∕ ppbv) also vary for different sources, i.e., traffic (0.0052), industry (0.0072), power plants (0.0177) and residential (0.0371) (Zhang et al., 2009). In this study, the BC, PM2.5 and CO were well correlated with one another (Fig. S8). The correlation coefficients (r2) between BC and PM2.5 were 0.67, 0.30, 0.44, 0.37 and 0.48 at LH, HA, WH, SX and XY, respectively. Significant correlations (p<0.05) between BC and CO were found with r2 values ranging from 0.27 (XY) to 0.71 (LH). These good correlations indicated that BC, PM2.5 and CO may be from similar sources (except at HA where r values as low as 0.06 were observed).
Overall, the BC observed in this study was likely not from industrial emissions (Fig. 7a), as the BC∕PM2.5 ratios (µg m−3 ∕ µg m−3) (0.045–0.083) were higher than those typically seen from industry (0.0046–0.03) (Chow et al., 2011). Instead, BC∕PM2.5 ratios at the five sites were all within the range of oil combustion (0.03–0.136). Additionally, the BC∕PM2.5 ratios at LH and SX were in line with the ratio values seen from residential wood combustion. With respect to BC∕CO ratios, BC was more likely from biomass burning (crop residue: 0.0056–0.016) at HA and LH, whereas it was mainly from gasoline combustion at SX, WH, and XY (Fig. 7b). Quantified calculation results using the equations in Sect. 2.3.1 also suggested that the fractions of BC from biomass burning at HA (27.6±9.40 %) and LH (29.5±9.14 %) were significantly higher (p<0.01) than those at WH (25.4±11.8 %). Compared with other urban areas, the ratios of BC∕CO (µg m−3 ∕ ppbv) at SX (0.004) and WH (0.0044) were lower than those in Beijing (0.0058) (Han et al., 2009), Guangzhou (0.0054) (Verma et al., 2010), Gwanjun (0.006) (Park et al., 2005) and Tokyo (0.0057) (Kondo et al., 2006) as well as Mt. Huang (0.0065) (Pan et al., 2011), whereas ratios at HA (0.0091) and LH (0.0076) were higher than the values observed in these studies.
3.4 BC under different wind direction and speed
A conditional bivariate probability function (CBPF) plot was used to identify and quantify the impact of likely source regions of air pollutants as defined by wind direction and speed (Carslaw and Ropkins, 2012). Figure S9 shows the eBC levels under different wind speeds and directions at the five sites. As shown in Fig. 1, SX and HA are located northwest of WH, and high eBC levels were found northwest of SX, HA and WH when northerly winds dominated. In contrast, when southerly winds dominated, BC was blown from south to north, and high levels were found in the south at WH and HA. However, at LH and XY, higher levels of BC were only found from the south. In addition to eBC levels, BCbb and BCff concentrations under different wind speeds and directions are also discussed at HA, LH and WH (Fig. 8). At HA, the CBPF plot of BCff was in line with eBC, and high levels were observed from both the northwest and the south, whereas high levels of BCbb (>1.8 µg m−3) were only found in the southeast. Similar results were also found at WH. This high level of BCbb was due to more biomass burning southeast of HA and WH (Fig. S10). At LH, the CBPF plots of BCbb and BCff were the same as those for eBC, as discussed above.
In order to describe the downwind (from upwind to downwind) BC transportation, we used Eq. (13) in Sect. 2.3.3 to calculate the surface transport (ST) of eBC (Fig. 9). The calculated average ST values of BC were , , , 0.29±6.14 and 0.99±17.8 µg s−1 m−2 for HA, LH, SX, WH and XY, respectively . The negative values at HA, LH and SX suggested that the transportation intensity of BC from the south (southeast) to the north (northwest) was higher, whereas the positive values observed at WH and XY indicated that more BC was transported from north to south. The large standard deviation in surface transport (ST), as mentioned above, reflected strong fluctuations in transport, which were due to wind speed, wind directions and BC levels (Z. Wang et al., 2018).
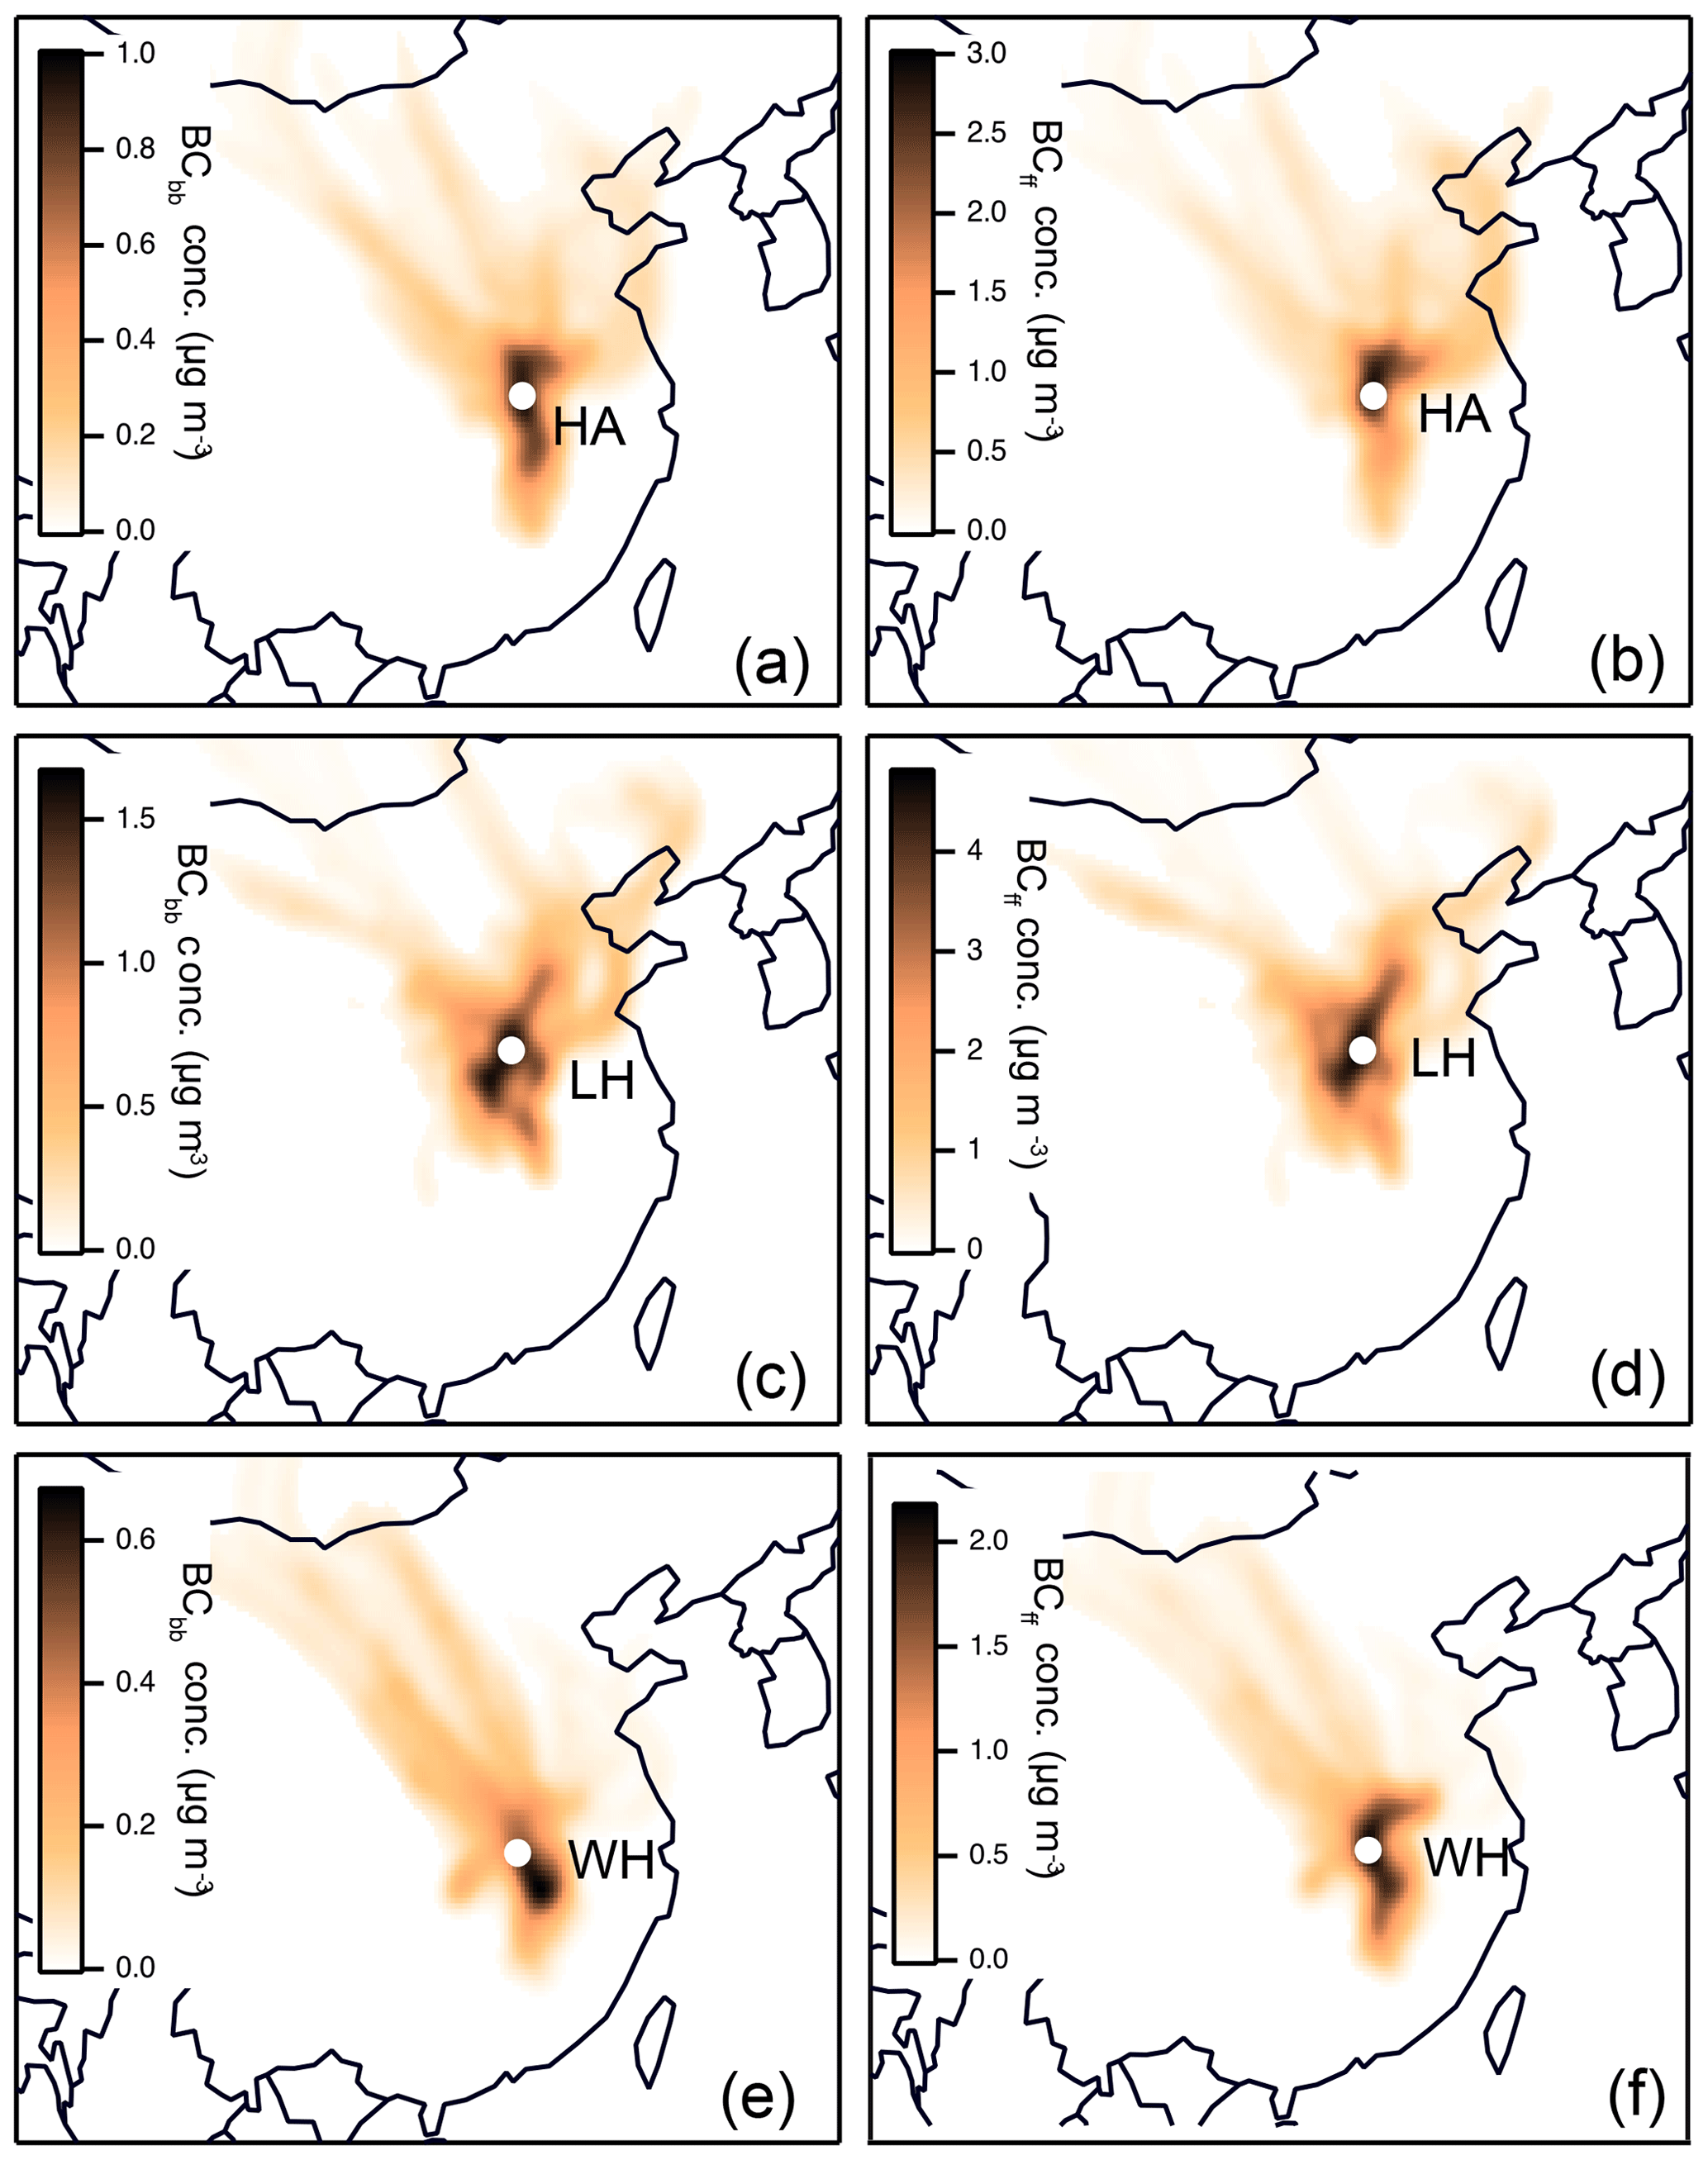
Figure 10Concentration-weighted trajectory (CWT) plots of BCbb (a, c, e) and BCff (b, d, f) at HA, LH and WH during the whole observation period. The white dots represents the observation sites.
3.5 Potential geographic origins
Employing the CWT method, the potential geographic origins of eBC for the five sites were explored (Fig. S11). Overall, the CWT results of eBC at the five sites suggested that high eBC levels were found both north and south of LH and WH, whereas the high levels (i.e., >4 µg m−3) of eBC were only found northeast of HA, SX and XY (Fig. S11). Additionally, the potential geographic source regions of BCbb and BCff at HA, LH and WH are also discussed as shown in Fig. 10. At HA, the CWT results showed that high levels of eBC (i.e., >3 µg m−3) were from north/northeast. However, the hot spots of BCbb and BCff were different, with higher levels of BCbb from both the south and north and higher levels of BCff from the north. Furthermore, higher levels of BCbb and BCff were found south of LH. In contrast to the CWT results at HA, the hot spots of BCbb were only found southeast of WH, and high levels of BCff were found north and south of WH. The CWT results at WH were in line with the CBPF plots in Sect. 3.4. The unity of the CWT and CBPF results at WH suggested that there were intensive biomass burning activities south of WH during the observation period, which was verified by the MODIS fire points distribution map (Fig. S10).
We also discussed the source region differences of BC under different air quality conditions (Fig. 11). The higher levels (>1 µg m−3) of eBC, BCbb and BCff mainly originated south of three sites when the air was clean, whereas during pollution episodes, air parcels from the north contributed high concentrations of these species. For instance, at WH, high levels of eBC (>2.5 µg m−3) were found from the south, whereas the source regions with high levels of eBC (>3 µg m−3) switched to northeast as the air quality deteriorated. Figure 12 shows the semiquantitative results of the transportation contribution results during clean and pollution periods. At the boundary sites (HA, SX and XY), BC was mainly from the south (accounting for 46.0 %–58.2 %) when the air quality was good (clean), and it was mainly from northeast/northwest (51.2 %–76.5 %) when the air quality deteriorated. At the SE-NCP site (LH), BC was dominantly from the south (47.8 %) during pollution episodes. At the CC site (WH), BC was mainly from the northeast (49.3 %–71.1 %). These results suggested that the northwest and northeast directions were the main transport pathways for air pollutants reaching WH during pollution episodes. Furthermore, to control local emissions during haze episodes, the emission sources (i.e., industry and open biomass burning) in the upwind direction should also be controlled to prevent the further deterioration of air quality in downwind areas.
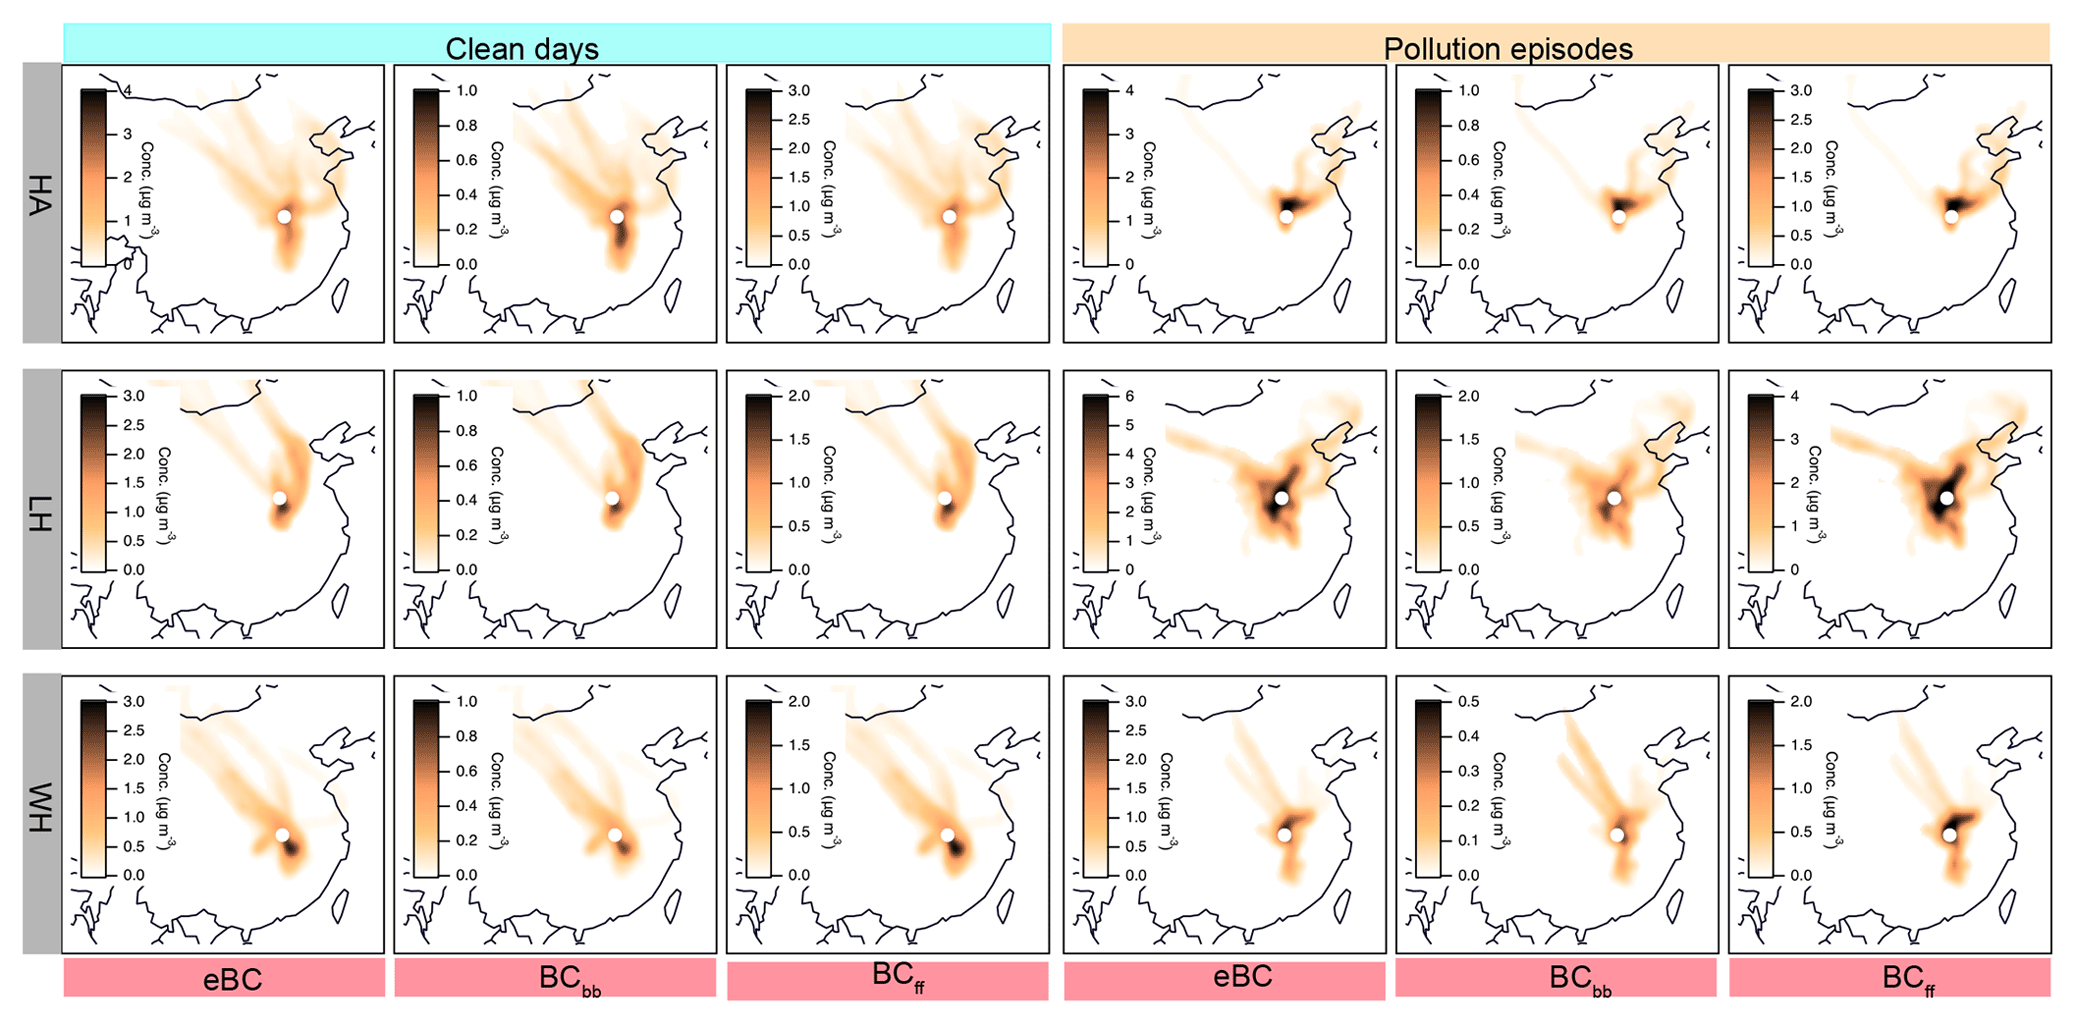
Figure 11Concentration-weighted trajectory (CWT) plots of eBC, BCbb and BCff during clean and pollution periods at HA, LH and WH. The white dots represents the observation sites.
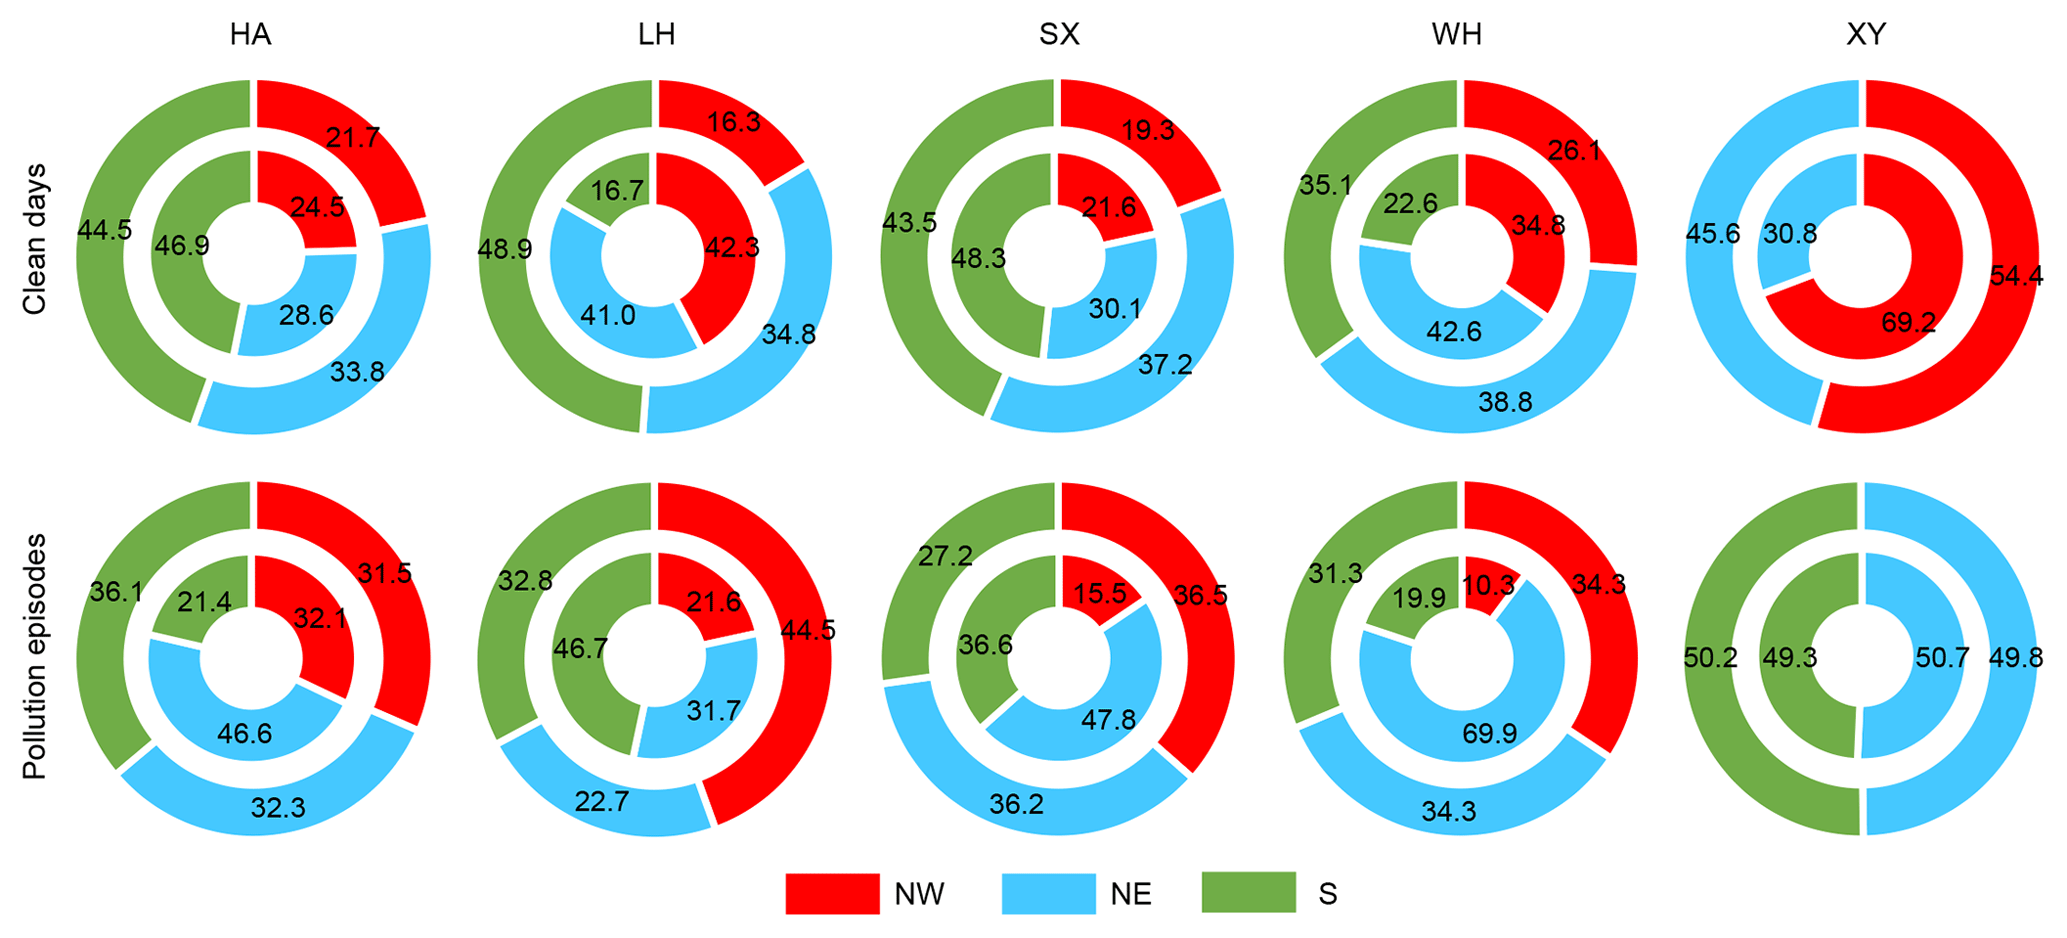
Figure 12Cluster results of air masses reaching the five sites (inner pie plots), and the eBC percentage contributions from different clusters (external pie plots) during the clean days (upper panels) and pollution episodes (lower panels). NW, NE and S denote northwestern, northeastern and southern clusters, as shown in Fig. 1.
3.6 Case studies of the variation of BC properties during transportation
To explore BC variations (i.e., mass concentration, sources and AAE) during transportation, we chose two case studies. LH and HA were selected due to the fact that the same instruments (AE33) were deployed at the sites, and the sites are representative of both the SE-NCP and CC. BC transportation from HA to LH and from LH to HA were both considered. Figure 13a shows the hourly backward trajectories reaching HA on 12 January 2018 and the trajectory at 13:00 (GMT; black line) as it was observed passing through LH (28 h prior). Therefore, the eBC mass concentration (including BCff and BCbb), σabs and AAE at the upwind site, LH, at 08:00 on 11 January 2018 (GMT) and the downwind site, HA, at 13:00 on 13 January 2018 (GMT) were compared (Fig. 13b). In Case 1, eBC, BCff and BCbb significantly increased (p<0.01) during the air transport from LH to HA. A BC absorption enhancement from 25.6±0.81 Mm−1 (LH) to 61.8±12.5 Mm−1 (HA) was also observed, whereas the AAE significantly decreased from 1.49±0.02 to 1.42±0.02 (p<0.01). Similarly, in Case 2, the air masses reaching LH at 07:00 on 13 January 2018 (GMT) had also passed through HA (black line) 31 h prior (Fig. 13c). The eBC, BCff and σabs increased during transport from upwind (HA) to downwind (LH), whereas BCbb and AAE decreased from 2.37±0.23 and 1.43±0.02 to 2.14±0.14 and 1.32±0.01 µg m−3, respectively (Fig. 13d). The eBC mass concentrations were enhanced during transportation regardless of the transport direction (CC to NCP or NCP to CC). Atmospheric removal of BC generally occurs in a few days to weeks via wet and dry deposition or contact with surfaces (Bond et al., 2013). In the two abovementioned cases, there were no precipitation events and the transport time was short (i.e., 28 and 31 h, respectively), which suggested lower removal rates. Therefore, new emission inputs along the trajectory enhanced the eBC mass concentration during transport. However, slight differences were found with respect to BCbb transport: BCbb increased from north (LH: 1.28±0.06 µg m−3) to south (HA: 2.57±0.47 µg m−3), whereas BCbb decreased from HA (2.37±0.23 µg m−3) to LH (2.14±0.14 µg m−3). This difference suggested that there were more intensive biomass burning emissions in Henan Province than in Hubei Province, which was also verified by the BC emission inventory (Qin and Xie, 2012; Qiu et al., 2016).
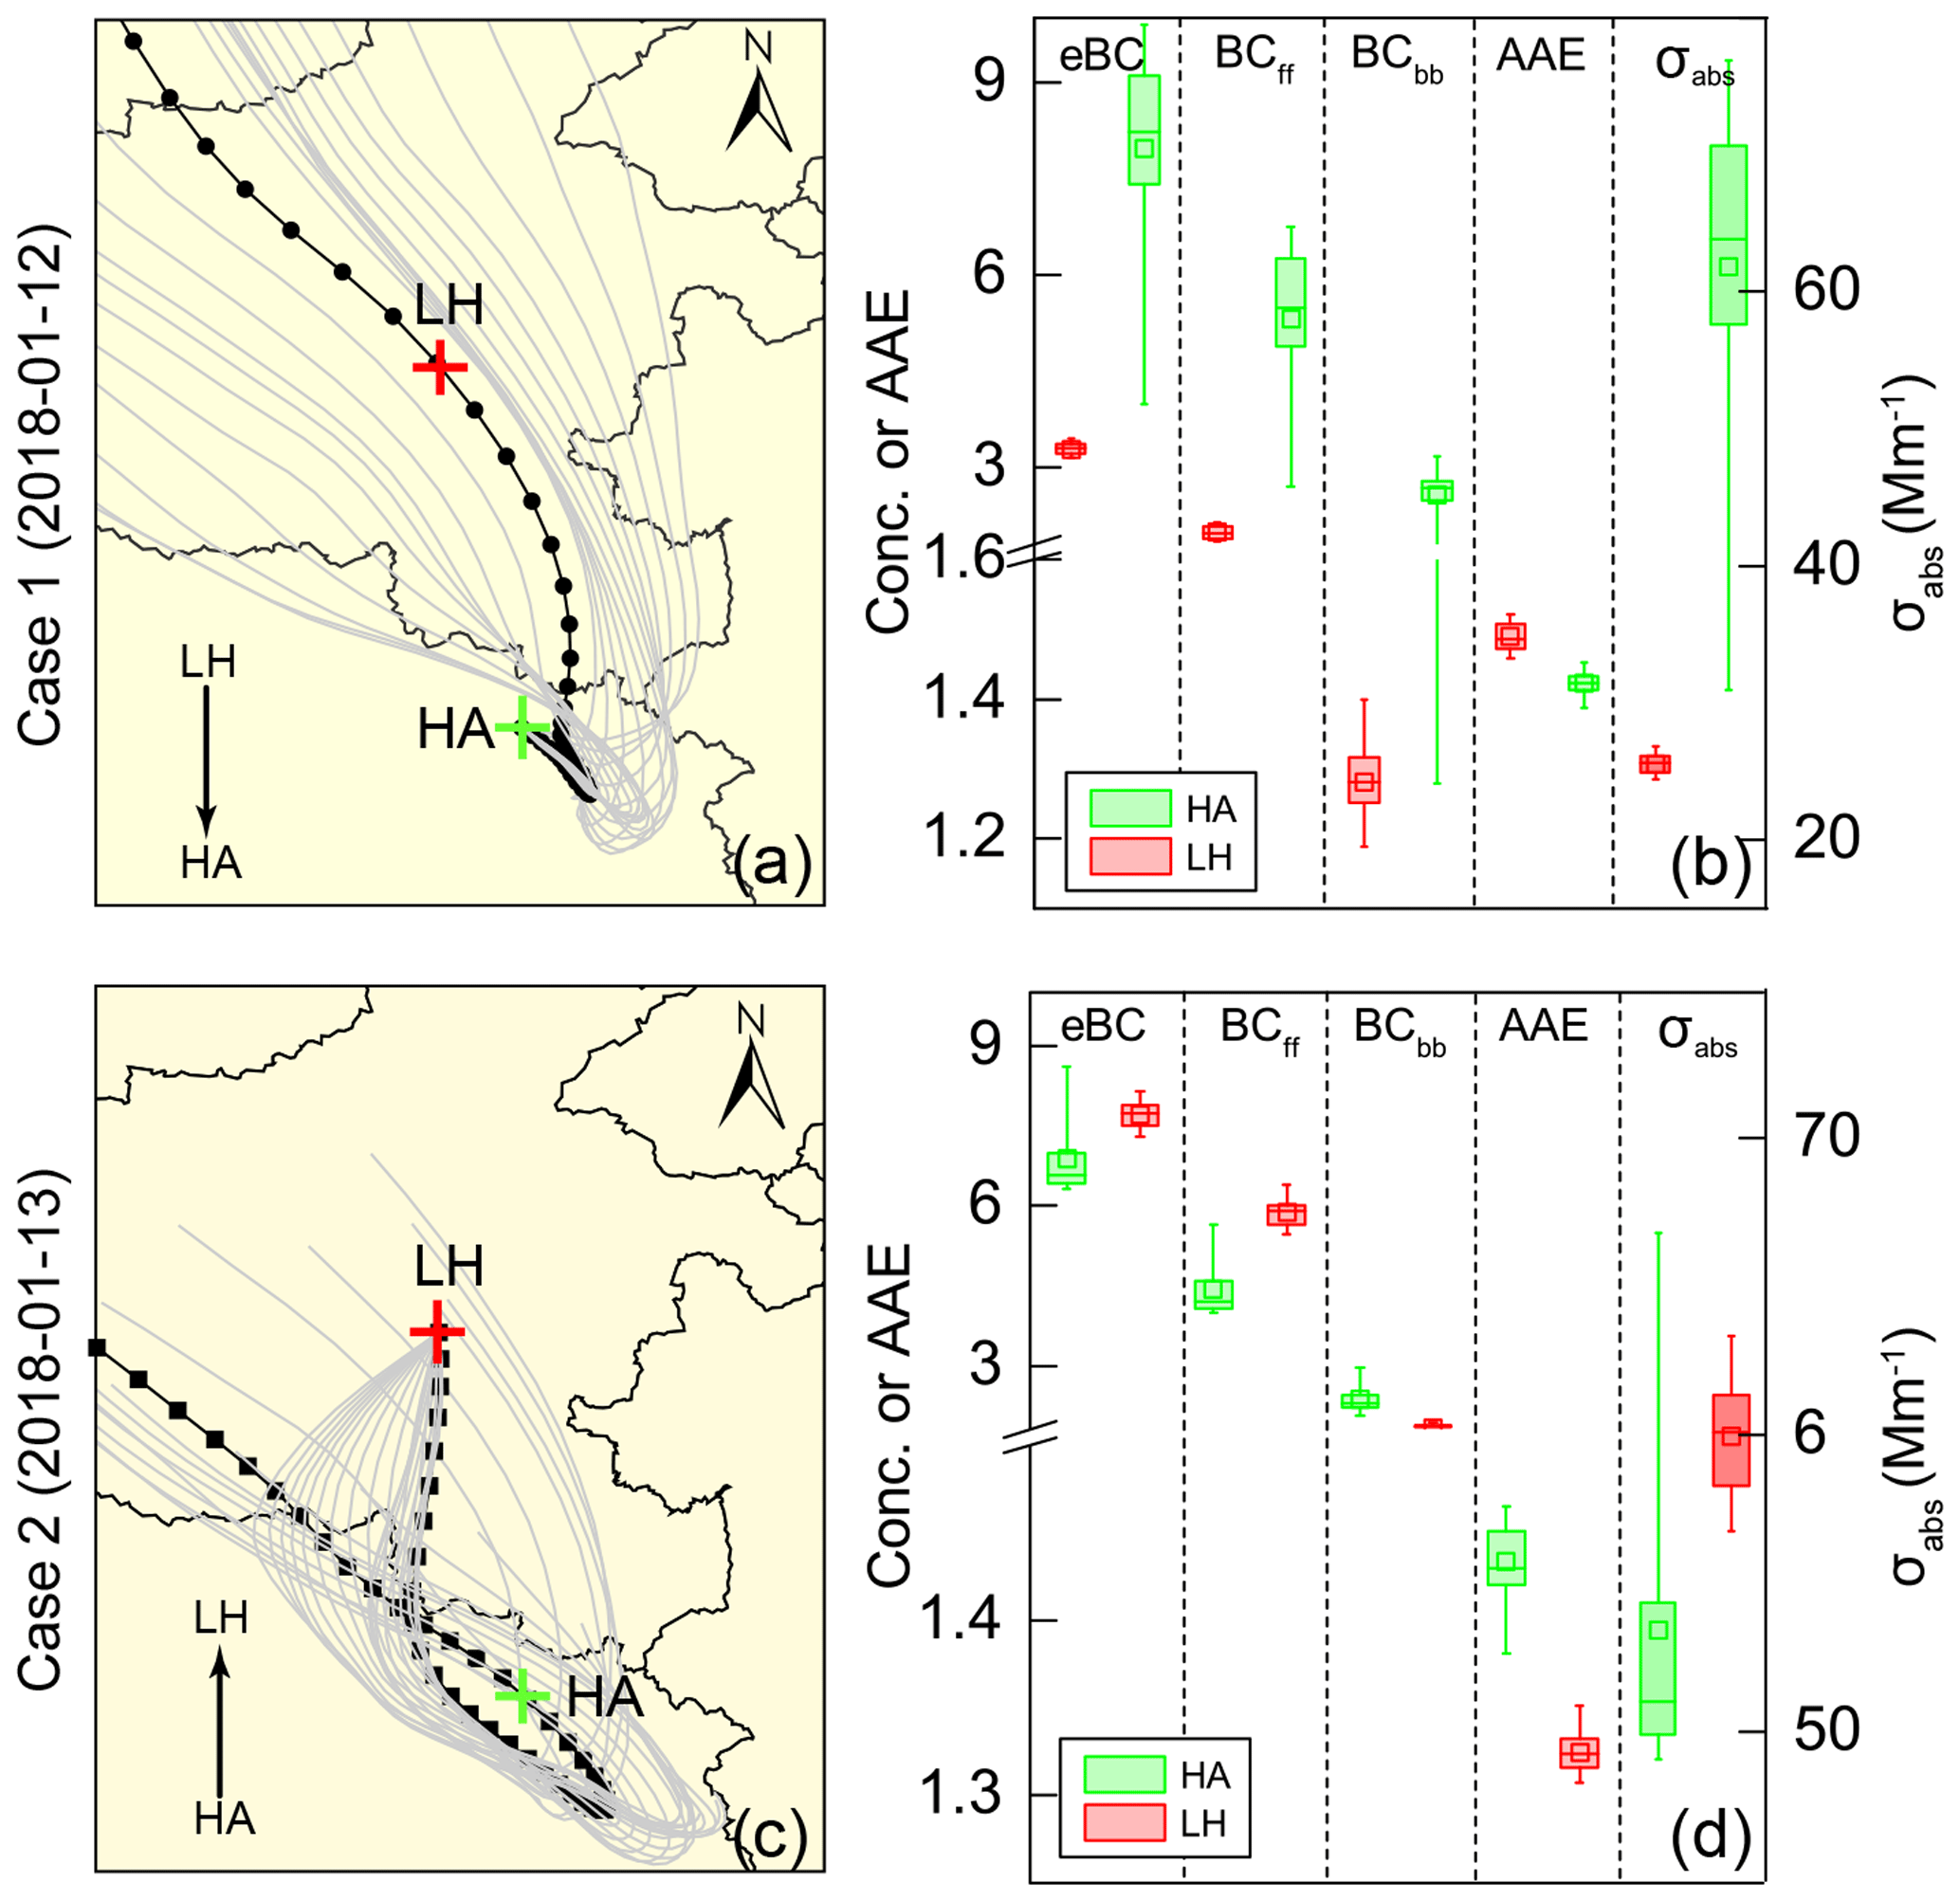
Figure 13Case studies of BC variation during downwind transportation (from upwind to downwind). (a, Case 1) Hourly backward trajectories (grey line) reaching HA on 12 January 2018, and the trajectory at 13:00 (GMT; black line) that had passed through LH 28 h prior. (c, Case 2) Trajectory reaching LH on 13 January 2018 at 07:00 (GMT; black line) that had been observed passing through HA 31 h prior. Box (25th–75th percentiles) and whisker (5th–95th percentiles) plots of eBC, BCff, BCbb, σabs and AAE variations during the transport from LH to HA (b) and from HA to LH (d).
A previous study found that BC coagulation with nonrefractory materials becomes more significant when the aging timescale is greater than 10 h (Riemer et al., 2004). Chamber studies and field observations have also found that BC absorption is enhanced under polluted urban ambient air (Peng et al., 2016; Zhang et al., 2018; Y. Wang et al., 2018), suggesting that aging plays a role in modifying BC optical properties. In these two cases, the traveling time (aging time) from LH to HA and from HA to LH was 28 and 31 h, respectively, which suggested that the BC particles would have been coagulated through complex atmospheric processes. Therefore, the σabs was found to be higher in the downward direction. On the contrary, AAE values were found to decreased during transport. The AAE is sensitive to the particle size. A lab combustion experiment showed that particles with smaller diameters from fresh biomass burning have higher AAE values than larger particles (Singh et al., 2016). Simulations have also confirmed that the AAE of BC particles decrease with increasing geometric median diameter (C. Liu et al., 2018). Therefore, the diameter of BC particles increases during transportation due to the aging processes supported by the increased absorption coefficients and decreased AAE as discussed above.
In order to understand the levels, optical properties, sources, regional transportation and aging of BC in central China and the south edge of North China Plain during winter haze episodes, simultaneous observations were conducted at rural (HA and SX), suburban (LH and XY) and megacity (WH) sites during January 2018. Using diagnosis ratios, the Aethalometer model, backward trajectory analysis and the concentration-weighted trajectory (CWT) method, the following conclusions were drawn:
-
The highest ambient eBC was generally found at northern sites (8.48±4.83 and 7.35±3.45 µg m−3 at LH and XY, respectively), followed by sites on the transport route (5.54±2.59 and 4.47±2.90 µg m−3 for and HA and SX, respectively) and the southern site (3.91±1.86 µg m−3 for WH).
-
Levels, sources, optical properties and the diurnal variation of eBC were different under different air quality. eBC concentrations and absorption coefficients (σabs) increased by 26.4 %–163 % and 11.7 %–254 %, respectively, from clean to polluted conditions. This increase may have been due to higher fossil fuel combustion emissions during pollution episodes, which were supported by lower Ångström exponent (AAE) values and higher BCff concentrations.
-
BC∕PM2.5 and BC∕CO ratios suggested that BC was mainly from oil combustion and residential wood or biomass combustion in this region.
-
The conditional bivariate probability function results of BCbb and BCff showed different dominant source regions for BCbb (mainly from the southeast) and BCff (from both the northwest and southeast) of WH and HA. However, BCbb and BCff emissions were mainly from south of LH.
-
At the boundary sites (HA, SX and XY), eBC was dominantly from the south (46.0 %–58.2 %) when the air was clean, and it was mainly from northeast/northwest (51.2 %–76.5 %) during pollution episodes. At the SE-NCP site, air masses from the south accounted for 47.8 % of the ambient BC level when the air was polluted. At the CC site, air parcels from the northeast contributed 49.3 %–71.1 % to the BC loading during the entire observation period.
-
During downwind air transportation (from upwind to downwind), the BC mass concentration and absorption coefficients increased, while the AAE decreased.
This study firstly revealed the differences of levels, optical properties and sources of BC at five sites on the south edge of the North China Plain and in central China during winter haze episodes and discussed the interaction of BC between two key polluted regions. It was intended to be a demonstration for corresponding research into the regional interactions of BC transportation during winter haze episodes for other regions.
Data are available on request from kongshaofei@cug.edu.cn.
The supplement related to this article is available online at: https://doi.org/10.5194/acp-19-4499-2019-supplement.
HZ, SK, TZ, and SQ designed the study; HZ and SK wrote the paper; YY, DL, DZ, TZ, YB, and SL commented on this paper; MZ, NC and KX provided the routine air pollutant data; others helped the field observation.
The authors declare that they have no conflict of interest.
This article is part of the special issue “Regional transport and transformation of air pollution in eastern China”. It does not belong to a conference.
This study was financially supported by the Key Program of Ministry of Science and Technology of the People's Republic of China (grant nos. 2016YFA0602002 and 2017YFC0212602), the Key Program for Technical Innovation of Hubei Province (grant no. 2017ACA089) and the Program for Environmental Protection in Hubei Province (grant no. 2017HB11). The research was also funded by the Start-up Foundation for Advanced Talents (grant no. 201616) and the Fundamental Research Funds for the Central Universities (grant no. 201802), China University of Geosciences, Wuhan.
This paper was edited by Yuan Wang and reviewed by two anonymous referees.
Andreae, M. O. and Merlet, P.: Emission of trace gases and aerosols from biomass burning, Globa; Biogeochem. Cy., 15, 955–966, https://doi.org/10.1029/2000GB001382, 2001.
Bond, T. C., Doherty, S. J., Fahey, D. W., Forster, P. M., Berntsen, T., DeAngelo, B. J., Flanner, M. G., Ghan, S., Kärcher, B., Koch, D., Kinne, S., Kondo, Y., Quinn, P. K., Sarofim, M. C., Schultz, M. G., Schulz, M., Venkataraman, C., Zhang, H., Zhang, S., Bellouin, N., Guttikunda, S. K., Hopke, P. K., Jacobson, M. Z., Kaiser, J. W., Klimont, Z., Lohmann, U., Schwarz, J. P., Shindell, D., Storelvmo, T., Warren, S. G., and Zender, C. S.: Bounding the role of black carbon in the climate system: A scientific assessment, J. Geophys. Res.-Atmos., 118, 5380–5552, https://doi.org/10.1002/jgrd.50171, 2013.
Cao, G., Zhang, X., Gong, S., and Zheng, F.: Investigation on emission factors of particulate matter and gaseous pollutants from crop residue burning, J. Environ. Sci., 20, 50–55, https://doi.org/10.1016/S1001-0742(08)60007-8, 2008.
Cao, J., Xu, H., Xu, Q., Chen, B., and Kan, H.: Fine particulate matter constituents and cardiopulmonary mortality in a heavily polluted Chinese city, Environ. Health. Persp., 120, 373–378, https://doi.org/10.1289/ehp.1103671, 2012.
Carslaw, D. C. and Ropkins, K.: openair – An R package for air quality data analysis, Environ. Modell. Softw., 27–28, 52–61, https://doi.org/10.1016/j.envsoft.2011.09.008, 2012.
Cheng, Y. F., Wiedensohler, A., Eichler, H., Su, H., Gnauk, T., Brüggemann, E., Herrmann, H., Heintzenberg, J., Slanina, J., and Tuch, T.: Aerosol optical properties and related chemical apportionment at Xinken in Pearl River Delta of China, Atmos. Environ., 42, 6351–6372, https://doi.org/10.1016/j.atmosenv.2008.02.034, 2008.
Chiloane, K. E., Beukes, J. P., van Zyl, P. G., Maritz, P., Vakkari, V., Josipovic, M., Venter, A. D., Jaars, K., Tiitta, P., Kulmala, M., Wiedensohler, A., Liousse, C., Mkhatshwa, G. V., Ramandh, A., and Laakso, L.: Spatial, temporal and source contribution assessments of black carbon over the northern interior of South Africa, Atmos. Chem. Phys., 17, 6177–6196, https://doi.org/10.5194/acp-17-6177-2017, 2017.
China, S., Scarnato, B., Owen, R. C., Zhang, B., Ampadu, M. T., Kumar, S., Dzepina, K., Dziobak, M. P., Fialho, P., Perlinger, J. A., Hueber, J., Helmig, D., Mazzoleni, L. R., and Mazzoleni, C.: Morphology and mixing state of aged soot particles at a remote marine free troposphere site: implications for optical properties, Geophys. Res. Lett., 42, 1243–1250, https://doi.org/10.1002/2014GL062404, 2015.
Chow, J. C., Watson, J. G., Lowenthal, D. H., Antony Chen, L. W., and Motallebi, N.: PM2.5 source profiles for black and organic carbon emission inventories, Atmos. Environ., 45, 5407–5414, https://doi.org/10.1016/j.atmosenv.2011.07.011, 2011.
Cong, Z., Kang, S., Gao, S., Zhang, Y., Li, Q., and Kawamura, K.: Historical trends of atmospheric black carbon on Tibetan Plateau as reconstructed from a 150-year lake sediment record, Environ. Sci. Technol., 47, 2579–2586, https://doi.org/10.1021/es3048202, 2013.
Dhammapala, R., Claiborn, C., Simpson, C., and Jimenez, J.: Emission factors from wheat and Kentucky bluegrass stubble burning: comparison of field and simulated burn experiments, Atmos. Environ., 41, 1512–1520, https://doi.org/10.1016/j.atmosenv.2006.10.008, 2007.
Ding, A. J., Huang, X., Nie, W., Sun, J. N., Kerminen, V. M., Petäjä, T., Su, H., Cheng, Y. F., Yang, X.-Q., Wang, M. H., Chi, X. G., Wang, J. P., Virkkula, A., Guo, W. D., Yuan, J., Wang, S. Y., Zhang, R. J., Wu, Y. F., Song, Y., Zhu, T., Zilitinkevich, S., Kulmala, M., and Fu, C. B.: Enhanced haze pollution by black carbon in megacities in China, Geophys. Res. Lett., 43, 2873–2879, https://doi.org/10.1002/2016GL067745, 2016.
Guo, S., Hu, M., Zamora, M. L., Peng, J., Shang, D., Zheng, J., Du, Z., Wu, Z., Shao, M., Zeng, L., Molina, M. J., and Zhang, R.: Elucidating severe urban haze formation in China, P. Natl. Acad. Sci. USA, 111, 17373–17378, https://doi.org/10.1073/pnas.1419604111, 2014.
Han, S., Kondo, Y., Oshima, N., Takegawa, N., Miyazaki, Y., Hu, M., Lin, P., Deng, Z., Zhao, Y., Sugimoto, N., and Wu, Y.: Temporal variations of elemental carbon in Beijing, J. Geophys. Res., 114, D23202, https://doi.org/10.1029/2009JD012027, 2009.
Hansen, J., Sato, M., Ruedy, R., Lacis, A., and Oinas, V.: Global warming in the twenty-first century: an alternative scenario, P. Natl. Acad. Sci. USA, 97, 9875–9880, https://doi.org/10.1073/pnas.170278997, 2000.
Healy, R. M., Sofowote, U., Su, Y., Debosz, J., Noble, M., Jeong, C. H., Wang, J. M., Hilker, N., Evans, G. J., Doerksen, G., Jones, K., and Munoz, A.: Ambient measurements and source apportionment of fossil fuel and biomass burning black carbon in Ontario, Atmos. Environ., 161, 34–47, https://doi.org/10.1016/j.atmosenv.2017.04.034, 2017.
Huang, L., Gong, S. L., Sharma, S., Lavoué, D., and Jia, C. Q.: A trajectory analysis of atmospheric transport of black carbon aerosols to Canadian high Arctic in winter and spring (1990–2005), Atmos. Chem. Phys., 10, 5065–5073, https://doi.org/10.5194/acp-10-5065-2010, 2010.
Huang, X.-F., Sun, T.-L., Zeng, L.-W., Yu, G.-H., and Luan, S.-J.: Black carbon aerosol characterization in a coastal city in South China using a single particle soot photometer, Atmos. Environ., 51, 21–28, https://doi.org/10.1016/j.atmosenv.2012.01.056, 2012.
Huang, R. J., Zhang, Y., Bozzetti, C., Ho, K. F., Cao, J. J., Han, Y., Daellenbach, K. R., Slowik, J. G., Platt, S. M., Canonaco, F., Zotter, P., Wolf, R., Pieber, S. M., Bruns, E. A., Crippa, M., Ciarelli, G., Piazzalunga, A., Schwikowski, M., Abbaszade, G., Schnelle-Kreis, J., Zimmermann, R., An, Z., Szidat, S., Baltensperger, U., Haddad, I. E., and Prévôt, A. S. H.: High secondary aerosol contribution to particulate pollution during haze events in China, Nature, 514, 218–222, https://doi.org/10.1038/nature13774, 2014.
Hyvärinen, A. P., Kolmonen, P., Kerminen, V. M., Virkkula, A., Leskinen, A., Komppula, M., Hatakka, J., Burkhart, J., Stohl, A., Aalto, P., Kulmala, M., Lehtinen, K. E. J., Viisanen, Y., and Lihavainen, H.: Aerosol black carbon at five background measurement sites over Finland, a gateway to the Arctic, Atmos. Environ., 45, 4042–4050, https://doi.org/10.1016/j.atmosenv.2011.04.026, 2011.
Jacobson, M. Z.: A physically-based treatment of elemental carbon optics: implications for global direct forcing of aerosols, Geophys. Res. Lett., 27, 217–220, https://doi.org/10.1029/1999GL010968, 2000.
Jansen, K. L., Larson, T. V., Koenig, J. Q., Mar, T. F., Fields, C., Stewart, J., and Lippmann, M.: Associations between health effects and particulate matter and black carbon in subjects with respiratory disease, Environ. Health Persp., 113, 1741–1746, https://doi.org/10.1289/ehp.8153, 2005.
Ji, D., Li, L., Pang, B., Xue, P., Wang, L., Wu, Y., Zhang, H., and Wang, Y.: Characterization of black carbon in an urban-rural fringe area of Beijing, Environ. Pollut., 223, 524–534, https://doi.org/10.1016/j.envpol.2017.01.055, 2017.
Ji, D., Yan, Y., Wang, Z., He, J., Liu, B., Sun, Y., Gao, M., Li, Y., Cao, W., Cui, Y., Hu, B., Xin, J., Wang, L., Liu, Z., Tang, G., and Wang, Y.: Two-year continuous measurements of carbonaceous aerosols in urban Beijing, China: temporal variations, characteristics and source analyses, Chemosphere, 200, 191–200, https://doi.org/10.1016/j.chemosphere.2018.02.067, 2018.
Kalogridis, A.-C., Vratolis, S., Liakakou, E., Gerasopoulos, E., Mihalopoulos, N., and Eleftheriadis, K.: Assessment of wood burning versus fossil fuel contribution to wintertime black carbon and carbon monoxide concentrations in Athens, Greece, Atmos. Chem. Phys., 18, 10219–10236, https://doi.org/10.5194/acp-18-10219-2018, 2018.
Kondo, Y., Komazaki, Y., Miyazaki, Y., Moteki, N., Takegawa, N., Kodama, D., Deguchi, S., Nogami, M., Fukuda, M., Miyakawa, T., Morino, Y., Koike, M., Sakurai, H., and Ehara, K.: Temporal variations of elemental carbon in Tokyo, J. Geophys. Res., 111, D12205, https://doi.org/10.1029/2005JD006257, 2006.
Kong, S., Yan, Q., Zheng, H., Liu, H., Wang, W., Zheng, S., Yang, G., Zheng, M., Wu, J., Qi, S., Shen, G., Tang, L., Yin, Y., Zhao, T., Yu, H., Liu, D., Zhao, D., Zhang, T., Ruan, J., and Huang, M.: Substantial reductions in ambient PAHs pollution and lives saved as a co-benefit of effective long-term PM2.5 pollution controls, Environ. Int., 114, 266–279, https://doi.org/10.1016/j.envint.2018.03.002, 2018.
Lin, C. Q., Liu, G., Lau, A. K. H., Li, Y., Li, C. C., Fung, J. C. H., and Lao, X. Q.: High-resolution satellite remote sensing of provincial PM2.5 trends in China from 2001 to 2015, Atmos. Environ., 180, 110–116, https://doi.org/10.1016/j.atmosenv.2018.02.045, 2018.
Liu, C., Chung, C. E., Yin, Y., and Schnaiter, M.: The absorption Ångström exponent of black carbon: from numerical aspects, Atmos. Chem. Phys., 18, 6259–6273, https://doi.org/10.5194/acp-18-6259-2018, 2018.
Liu, D., Whitehead, J., Alfarra, M. R., Reyes-Villegas, E., Spracklen, D. V., Reddington, C. L., Kong, S., Williams, P. I., Ting, Y. C., Haslett, S., Taylor, J. W., Flynn, M. J., Morgan, W. T., McFiggans, G., Coe, H., and Allan, J. D.: Black-carbon absorption enhancement in the atmosphere determined by particle mixing state, Nat. Geosci., 10, 184–188, https://doi.org/10.1038/ngeo2901, 2017a.
Liu, D., Li, J., Cheng, Z., Zhong, G., Zhu, S., Ding, P., Shen, C., Tian, C., Chen, Y., Zhi, G., and Zhang, G.: Sources of non-fossil-fuel emissions in carbonaceous aerosols during early winter in Chinese cities, Atmos. Chem. Phys., 17, 11491–11502, https://doi.org/10.5194/acp-17-11491-2017, 2017b.
Liu, Q., Ma, T., Olson, M. R., Liu, Y., Zhang, T., Wu, Y., and Schauer, J. J.: Temporal variations of black carbon during haze and non-haze days in Beijing, Sci. Rep.-UK, 6, 33331, https://doi.org/10.1038/srep33331, 2016.
Liu, Y., Yan, C., and Zheng, M.: Source apportionment of black carbon during winter in Beijing, Sci. Total Environ., 618, 531–541, https://doi.org/10.1016/j.scitotenv.2017.11.053, 2018.
Moffet, R. C. and Prather, K. A.: In-situ measurements of the mixing state and optical properties of soot with implications for radiative forcing estimates, P. Natl. Acad. Sci. USA, 106, 11872–11877, https://doi.org/10.1073/pnas.0900040106, 2009.
Mouteva, G. O., Randerson, J. T., Fahrni, S. M., Bush, S. E., Ehleringer, J. R., Xu, X., Santos, G. M., Kuprov, R., Schichtel, B. A., and Czimczik, C. I.: Using radiocarbon to constrain black and organic carbon aerosol sources in Salt Lake City, J. Geophys. Res.-Atmos., 122, 9843–9857, https://doi.org/10.1002/2017JD026519, 2017.
Niu, H., Kang, S., Wang, H., Zhang, R., Lu, X., Qian, Y., Paudyal, R., Wang, S., Shi, X., and Yan, X.: Seasonal variation and light absorption property of carbonaceous aerosol in a typical glacier region of the southeastern Tibetan Plateau, Atmos. Chem. Phys., 18, 6441–6460, https://doi.org/10.5194/acp-18-6441-2018, 2018.
Olson, M. R., Victoria Garcia, M., Robinson, M. A., Van Rooy, P., Dietenberger, M. A., Bergin, M., and Schauer, J. J.: Investigation of black and brown carbon multiple-wavelength-dependent light absorption from biomass and fossil fuel combustion source emissions, J. Geophys. Res.-Atmos., 120, 6682–6697, https://doi.org/10.1002/2014JD022970, 2015.
Pan, X. L., Kanaya, Y., Wang, Z. F., Liu, Y., Pochanart, P., Akimoto, H., Sun, Y. L., Dong, H. B., Li, J., Irie, H., and Takigawa, M.: Correlation of black carbon aerosol and carbon monoxide in the high-altitude environment of Mt. Huang in Eastern China, Atmos. Chem. Phys., 11, 9735–9747, https://doi.org/10.5194/acp-11-9735-2011, 2011.
Park, R. J., Jacob, D. J., Palmer, P. I , Clarke, A. D., Weber, R. J., Zondlo, M. A., Eisele, F. L., Bandy, A. R., Thornton, D. C., Sachse, G. W., and Bond, T. C.: Export efficiency of black carbon aerosol in continental outflow: global implications, J. Geophys. Res., 110, D11205, https://doi.org/10.1029/2004JD005432, 2005.
Peng, J., Hu, M., Guo, S., Du, Z., Zheng, J., Shang, D., Levy Zamora, M., Zeng, L., Shao, M., Wu, Y. S., Zheng, J., Wang, Y., Glen, C. R., Collins, D. R., Molina, M. J., and Zhang, R.: Markedly enhanced absorption and direct radiative forcing of black carbon under polluted urban environments, P. Natl. Acad. Sci. USA, 113, 4266–4271, https://doi.org/10.1073/pnas.1602310113, 2016.
Petit, J.-E., Favez, O., Sciare, J., Crenn, V., Sarda-Estève, R., Bonnaire, N., Mocnik, G., Dupont, J.-C., Haeffelin, M., and Leoz-Garziandia, E.: Two years of near real-time chemical composition of submicron aerosols in the region of Paris using an Aerosol Chemical Speciation Monitor (ACSM) and a multi-wavelength Aethalometer, Atmos. Chem. Phys., 15, 2985–3005, https://doi.org/10.5194/acp-15-2985-2015, 2015.
Petit, J. E., Favez, O., Albinet, A., and Canonaco, F.: A user-friendly tool for comprehensive evaluation of the geographical origins of atmospheric pollution: wind and trajectory analyses, Environ. Modell. Softw., 88, 183–187, https://doi.org/10.1016/j.envsoft.2016.11.022, 2017a.
Petit, J. E., Amodeo, T., Meleux, F., Bessagnet, B., Menut, L., Grenier, D., Pellan, Y., Ockler, A., Rocq, B., Gros, V., Sciare, J., and Favez, O.: Characterising an intense PM pollution episode in March 2015 in France from multi-site approach and near real time data: climatology, variabilities, geographical origins and model evaluation, Atmos. Environ., 155, 68–84, https://doi.org/10.1016/j.atmosenv.2017.02.012, 2017b.
Qi, L., Li, Q., Henze, D. K., Tseng, H.-L., and He, C.: Sources of springtime surface black carbon in the Arctic: an adjoint analysis for April 2008, Atmos. Chem. Phys., 17, 9697–9716, https://doi.org/10.5194/acp-17-9697-2017, 2017.
Qin, Y. and Xie, S. D.: Spatial and temporal variation of anthropogenic black carbon emissions in China for the period 1980–2009, Atmos. Chem. Phys., 12, 4825–4841, https://doi.org/10.5194/acp-12-4825-2012, 2012.
Qiu, X., Duan, L., Chai, F., Wang, S., Yu, Q., and Wang, S.: Deriving high-resolution emission inventory of open biomass burning in China based on satellite observations, Environ. Sci. Technol., 50, 11779–11786, https://doi.org/10.1021/acs.est.6b02705, 2016.
Rajesh, T. A. and Ramachandran, S.: Black carbon aerosol mass concentration, absorption and single scattering albedo from single and dual spot aethalometers: radiative implications, J. Aerosol Sci., 119, 77–90, https://doi.org/10.1016/j.jaerosci.2018.02.001, 2018.
Riemer, N., Vogel, H., and Vogel, B.: Soot aging time scales in polluted regions during day and night, Atmos. Chem. Phys., 4, 1885–1893, https://doi.org/10.5194/acp-4-1885-2004, 2004.
Salma, I., Németh, Z., Weidinger, T., Maenhaut, W., Claeys, M., Molnár, M., Major, I., Ajtai, T., Utry, N., and Bozóki, Z.: Source apportionment of carbonaceous chemical species to fossil fuel combustion, biomass burning and biogenic emissions by a coupled radiocarbon–levoglucosan marker method, Atmos. Chem. Phys., 17, 13767–13781, https://doi.org/10.5194/acp-17-13767-2017, 2017.
Sandradewi, J., Prévôt, A. S. H., Szidat, S., Perron, N., Alfarra, M. R., Lanz, V. A., Weingartner, E., and Baltensperger, U.: Using aerosol light absorption measurements for the quantitative determination of wood Burning and traffic emission contributions to particulate matter, Environ. Sci. Technol., 42, 3316–3323, https://doi.org/10.1021/es702253m, 2008.
Singh, S., Fiddler, M. N., and Bililign, S.: Measurement of size-dependent single scattering albedo of fresh biomass burning aerosols using the extinction-minus-scattering technique with a combination of cavity ring-down spectroscopy and nephelometry, Atmos. Chem. Phys., 16, 13491–13507, https://doi.org/10.5194/acp-16-13491-2016, 2016.
Streets, D. G., Bond, T. C., Carmichael, G. R., Fernandes, S. D., Fu, Q., He, D., Klimont, Z., Nelson, S. M., Tsai, N. Y., Wang, M. Q., Woo, J. H., and Yarber, K. F.: An inventory of gaseous and primary aerosol emissions in Asia in the year 200, J. Geophys. Res.-Atmos., 108, 8809, https://doi.org/10.1029/2002JD003093, 2003.
Sun, J., Zhi, G., Hitzenberger, R., Chen, Y., Tian, C., Zhang, Y., Feng, Y., Cheng, M., Zhang, Y., Cai, J., Chen, F., Qiu, Y., Jiang, Z., Li, J., Zhang, G., and Mo, Y.: Emission factors and light absorption properties of brown carbon from household coal combustion in China, Atmos. Chem. Phys., 17, 4769–4780, https://doi.org/10.5194/acp-17-4769-2017, 2017.
Tao, J., Zhang, L., Cao, J., and Zhang, R.: A review of current knowledge concerning PM2.5 chemical composition, aerosol optical properties and their relationships across China, Atmos. Chem. Phys., 17, 9485–9518, https://doi.org/10.5194/acp-17-9485-2017, 2017.
Verma, R. L., Sahu, L. K., Kondo, Y., Takegawa, N., Han, S., Jung, J. S., Kim, Y. J., Fan, S., Sugimoto, N., Shammaa, M. H., Zhang, Y. H., and Zhao, Y.: Temporal variations of black carbon in Guangzhou, China, in summer 2006, Atmos. Chem. Phys., 10, 6471–6485, https://doi.org/10.5194/acp-10-6471-2010, 2010.
Wang, H., He, Q., Chen, Y., and Kang, Y.: Characterization of black carbon concentrations of haze with different intensities in Shanghai by a three-year field measurement, Atmos. Environ., 99, 536–545, https://doi.org/10.1016/j.atmosenv.2014.10.025, 2014.
Wang, J., Virkkula, A., Gao, Y., Lee, S., Shen, Y., Chi, X., Nie, W., Liu, Q., Xu, Z., Huang, X., Wang, T., Cui, L., and Ding, A.: Observations of aerosol optical properties at a coastal site in Hong Kong, South China, Atmos. Chem. Phys., 17, 2653–2671, https://doi.org/10.5194/acp-17-2653-2017, 2017.
Wang, R., Tao, S., Balkanski, Y., Ciais, P., Boucher, O., Liu, J., Piao, S., Shen, H., Vuolo, M. R., Valari, M., Chen, H., Chen, Y., Cozic, A., Huang, Y., Li, B., Li, W., Shen, G., Wang, B., and Zhang, Y.: Exposure to ambient black carbon derived from a unique inventory and high-resolution model, P. Natl. Acad. Sci. USA, 111, 2459–2463, https://doi.org/10.1073/pnas.1318763111, 2014.
Wang, Q., Huang, R.-J., Cao, J., Han, Y., Wang, G., Li, G., Wang, Y., Dai, W., Zhang, R., and Zhou, Y.: Mixing state of black carbon aerosol in a heavily polluted urban area of China: implications for light absorption enhancement, Aerosol. Sci. Tech., 48, 689–697, https://doi.org/10.1080/02786826.2014.917758, 2014.
Wang, Q., Cao, J., Han, Y., Tian, J., Zhu, C., Zhang, Y., Zhang, N., Shen, Z., Ni, H., Zhao, S., and Wu, J.: Sources and physicochemical characteristics of black carbon aerosol from the southeastern Tibetan Plateau: internal mixing enhances light absorption, Atmos. Chem. Phys., 18, 4639–4656, https://doi.org/10.5194/acp-18-4639-2018, 2018.
Wang, Y., Wang, X., Kondo, Y., Kajino, M., Munger, J. W., and Hao, J.: Black carbon and its correlation with trace gases at a rural site in Beijing: top-down constraints from ambient measurements on bottom-up emissions, J. Geophys. Res.-Atmos., 116, D24304, https://doi.org/10.1029/2011JD016575, 2011.
Wang, Y., de Foy, B., Schauer, J. J., Olson, M. R., Zhang, Y., Li, Z., and Zhang, Y.: Impacts of regional transport on black carbon in Huairou, Beijing, China, Environ. Pollut., 221, 75–84, https://doi.org/10.1016/j.envpol.2016.11.006, 2017.
Wang, Y., Ma, P.-L., Peng, J., Zhang, R., Jiang, J. H., Easter, R. C., and Yung, Y. L.: Constraining aging processes of black carbon in the community atmosphere model using environmental chamber measurements, J. Adv. Model Earth Sy., 10, 2514–2526, https://doi.org/10.1029/2018MS001387, 2018.
Wang, Z., Huang, X., and Ding, A.: Dome effect of black carbon and its key influencing factors: a one-dimensional modelling study, Atmos. Chem. Phys., 18, 2821–2834, https://doi.org/10.5194/acp-18-2821-2018, 2018.
Weingartner, E., Saathoff, H., Schnaiter, M., Streit, N., Bitnar, B., and Baltensperger, U.: Absorption of light by soot particles: determination of the absorption coefficient by means of aethalometers, J. Aerosol Sci., 34, 1445–1463, https://doi.org/10.1016/S0021-8502(03)00359-8, 2003.
Weller, R., Minikin, A., Petzold, A., Wagenbach, D., and König-Langlo, G.: Characterization of long-term and seasonal variations of black carbon (BC) concentrations at Neumayer, Antarctica, Atmos. Chem. Phys., 13, 1579–1590, https://doi.org/10.5194/acp-13-1579-2013, 2013.
Westerdahl, D., Wang, X., Pan, X., and Zhang, K. M.: Characterization of on-road vehicle emission factors and microenvironmental air quality in Beijing, China, Atmos. Environ., 43, 697–705, https://doi.org/10.1016/j.atmosenv.2008.09.042, 2009.
Wu, D., Mao, J., Deng, X., Tie, X., Zhang, Y., Zeng, L., Li, F., Tan, H., Bi, X., Huang, X., Chen, J., and Deng, T.: Black carbon aerosols and their radiative properties in the Pearl River Delta region, Sci. China Ser. D, 52, 1152–1163, https://doi.org/10.1007/s11430-009-0115-y, 2009.
Xu, J.-W., Martin, R. V., Morrow, A., Sharma, S., Huang, L., Leaitch, W. R., Burkart, J., Schulz, H., Zanatta, M., Willis, M. D., Henze, D. K., Lee, C. J., Herber, A. B., and Abbatt, J. P. D.: Source attribution of Arctic black carbon constrained by aircraft and surface measurements, Atmos. Chem. Phys., 17, 11971–11989, https://doi.org/10.5194/acp-17-11971-2017, 2017.
Yang, Y., Wang, H., Smith, S. J., Ma, P.-L., and Rasch, P. J.: Source attribution of black carbon and its direct radiative forcing in China, Atmos. Chem. Phys., 17, 4319–4336, https://doi.org/10.5194/acp-17-4319-2017, 2017.
Zhang, K., Wang, D., Bian, Q., Duan, Y., Zhao, M., Fei, D., Xiu, G., and Fu, Q.: Tethered balloon-based particle number concentration, and size distribution vertical profiles within the lower troposphere of Shanghai, Atmos. Environ., 154, 141–150, https://doi.org/10.1016/j.atmosenv.2017.01.025, 2017.
Zhang, Q., Streets, D. G., Carmichael, G. R., He, K. B., Huo, H., Kannari, A., Klimont, Z., Park, I. S., Reddy, S., Fu, J. S., Chen, D., Duan, L., Lei, Y., Wang, L. T., and Yao, Z. L.: Asian emissions in 2006 for the NASA INTEX-B mission, Atmos. Chem. Phys., 9, 5131–5153, https://doi.org/10.5194/acp-9-5131-2009, 2009.
Zhang, X., Rao, R., Huang, Y., Mao, M., Berg, M. J., and Sun, W.: Black carbon aerosols in urban central China, J. Quant. Spectrosc. Ra., 150, 3–11, https://doi.org/10.1016/j.jqsrt.2014.03.006, 2015.
Zhang, Y., Zhang, Q., Cheng, Y., Su, H., Li, H., Li, M., Zhang, X., Ding, A., and He, K.: Amplification of light absorption of black carbon associated with air pollution, Atmos. Chem. Phys., 18, 9879–9896, https://doi.org/10.5194/acp-18-9879-2018, 2018.
Zhang, Y.-L., Huang, R.-J., El Haddad, I., Ho, K.-F., Cao, J.-J., Han, Y., Zotter, P., Bozzetti, C., Daellenbach, K. R., Canonaco, F., Slowik, J. G., Salazar, G., Schwikowski, M., Schnelle-Kreis, J., Abbaszade, G., Zimmermann, R., Baltensperger, U., Prévôt, A. S. H., and Szidat, S.: Fossil vs. non-fossil sources of fine carbonaceous aerosols in four Chinese cities during the extreme winter haze episode of 2013, Atmos. Chem. Phys., 15, 1299–1312, https://doi.org/10.5194/acp-15-1299-2015, 2015.
Zhao, P., Dong, F., Yang, Y., He, D., Zhao, X., Zhang, W., Yao, Q., and Liu, H.: Characteristics of carbonaceous aerosol in the region of Beijing, Tianjin, and Hebei, China, Atmos. Environ., 71, 389–398, https://doi.org/10.1016/j.atmosenv.2013.02.010, 2013.
Zheng, G. J., Duan, F. K., Su, H., Ma, Y. L., Cheng, Y., Zheng, B., Zhang, Q., Huang, T., Kimoto, T., Chang, D., Pöschl, U., Cheng, Y. F., and He, K. B.: Exploring the severe winter haze in Beijing: the impact of synoptic weather, regional transport and heterogeneous reactions, Atmos. Chem. Phys., 15, 2969–2983, https://doi.org/10.5194/acp-15-2969-2015, 2015.
Zheng, H., Kong, S., Xing, X., Mao, Y., Hu, T., Ding, Y., Li, G., Liu, D., Li, S., and Qi, S.: Monitoring of volatile organic compounds (VOCs) from an oil and gas station in northwest China for 1 year, Atmos. Chem. Phys., 18, 4567–4595, https://doi.org/10.5194/acp-18-4567-2018, 2018.
Zhu, C. S., Cao, J. J., Hu, T. F., Shen, Z. X., Tie, X. X., Huang, H., Wang, Q. Y., Huang, R. J., Zhao, Z. Z., Močnik, G., and Hansen, A. D. A.: Spectral dependence of aerosol light absorption at an urban and a remote site over the Tibetan Plateau, Sci. Total Environ., 590–591, 14–21, https://doi.org/10.1016/j.scitotenv.2017.03.057, 2017.
Zhuang, B., Wang, T., Liu, J., Li, S., Xie, M., Han, Y., Chen, P., Hu, Q., Yang, X.-Q., Fu, C., and Zhu, J.: The surface aerosol optical properties in the urban area of Nanjing, west Yangtze River Delta, China, Atmos. Chem. Phys., 17, 1143–1160, https://doi.org/10.5194/acp-17-1143-2017, 2017.
Zhuang, B. L., Wang, T. J., Liu, J., Li, S., Xie, M., Yang, X. Q., Fu, C. B., Sun, J. N., Yin, C. Q., Liao, J. B., Zhu, J. L., and Zhang, Y.: Continuous measurement of black carbon aerosol in urban Nanjing of Yangtze River Delta, China, Atmos. Environ., 89, 415–424, https://doi.org/10.1016/j.atmosenv.2014.02.052, 2014.
Zhuang, B. L., Wang, T. J., Liu, J., Ma, Y., Yin, C. Q., Li, S., Xie, M., Han, Y., Zhu, J. L., Yang, X. Q., and Fu, C. B.: Absorption coefficient of urban aerosol in Nanjing, west Yangtze River Delta, China, Atmos. Chem. Phys., 15, 13633–13646, https://doi.org/10.5194/acp-15-13633-2015, 2015.
Zotter, P., Herich, H., Gysel, M., El-Haddad, I., Zhang, Y., Mocnik, G., Hüglin, C., Baltensperger, U., Szidat, S., and Prévôt, A. S. H.: Evaluation of the absorption Ångström exponents for traffic and wood burning in the Aethalometer-based source apportionment using radiocarbon measurements of ambient aerosol, Atmos. Chem. Phys., 17, 4229–4249, https://doi.org/10.5194/acp-17-4229-2017, 2017.