the Creative Commons Attribution 4.0 License.
the Creative Commons Attribution 4.0 License.
 | 03 Apr 2019
The EMEP Intensive Measurement Period campaign, 2008–2009: characterizing carbonaceous aerosol at nine rural sites in Europe
David Simpson
Robert Bergström
Gyula Kiss
Sönke Szidat
Darius Ceburnis
Sabine Eckhardt
Christoph Hueglin
Jacob Klenø Nøjgaard
Cinzia Perrino
Ignazio Pisso
Andre Stephan Henry Prevot
Jean-Philippe Putaud
Gerald Spindler
Milan Vana
Yan-Lin Zhang
Wenche Aas
Carbonaceous aerosol (total carbon, TCp) was source apportioned at nine European rural background sites, as part of the European Measurement and Evaluation Programme (EMEP) Intensive Measurement Periods in fall 2008 and winter/spring 2009. Five predefined fractions were apportioned based on ambient measurements: elemental and organic carbon, from combustion of biomass (ECbb and OCbb) and from fossil-fuel (ECff and OCff) sources, and remaining non-fossil organic carbon (OCrnf), dominated by natural sources.
OCrnf made a larger contribution to TCp than anthropogenic sources (ECbb, OCbb, ECff, and OCff) at four out of nine sites in fall, reflecting the vegetative season, whereas anthropogenic sources dominated at all but one site in winter/spring. Biomass burning (OCbb + ECbb) was the major anthropogenic source at the central European sites in fall, whereas fossil-fuel (OCff + ECff) sources dominated at the southernmost and the two northernmost sites. Residential wood burning emissions explained 30 %–50 % of TCp at most sites in the first week of sampling in fall, showing that this source can be the dominant one, even outside the heating season. In winter/spring, biomass burning was the major anthropogenic source at all but two sites, reflecting increased residential wood burning emissions in the heating season. Fossil-fuel sources dominated EC at all sites in fall, whereas there was a shift towards biomass burning for the southernmost sites in winter/spring.
Model calculations based on base-case emissions (mainly officially reported national emissions) strongly underpredicted observational derived levels of OCbb and ECbb outside Scandinavia. Emissions based on a consistent bottom-up inventory for residential wood burning (and including intermediate volatility compounds, IVOCs) improved model results compared to the base-case emissions, but modeled levels were still substantially underestimated compared to observational derived OCbb and ECbb levels at the southernmost sites.
Our study shows that natural sources are a major contributor to carbonaceous aerosol in Europe, even in fall and in winter/spring, and that residential wood burning emissions are equally as large as or larger than that of fossil-fuel sources, depending on season and region. The poorly constrained residential wood burning emissions for large parts of Europe show the obvious need to improve emission inventories, with harmonization of emission factors between countries likely being the most important step to improve model calculations for biomass burning emissions, and European PM2.5 concentrations in general.
- Article
(2016 KB) - Full-text XML
- BibTeX
- EndNote


Atmospheric aerosol particles play an important role in a number of environmental topics, such as the radiation transfer of the Earth's atmosphere and the hydrological cycle, as well as air quality, and thus have a substantial impact on the biosphere, including human health (Pope and Dockery, 2006; Andreae and Ramanathan, 2013). Carbonaceous matter is an important component of aerosol particles that has been found to account for 10 %–40 % of PM10 in the European rural background environment, 20 %–50 % of PM2.5 in urban and rural locations, and up to 70 % of PM1 (Zappoli et al., 1999; Putaud et al., 2010; Yttri et al., 2007a; Zhang et al., 2007; Querol et al., 2009). The carbonaceous matter is the least understood fraction of atmospheric aerosol particles due to its complexity in terms of composition, sources, and formation mechanisms (Gelencsér, 2004; Pöschl, 2005; Hallquist et al., 2009; Ziemann and Atkinson, 2012). Nevertheless, it is considered to have specific impacts on global climate (Novakov and Penner, 1993; Kanakidou et al., 2005) and on human health (Bell et al., 2009; Rohr and Wyzga, 2012; Cassee et al., 2013).
Particulate carbonaceous matter covers a wide range of organic components from low molecular weight hydrocarbons, through complex mixtures of humic-like substances and high molecular weight biopolymers containing also oxygen, nitrogen and sulfur, to tar balls or particles consisting of graphene layers. This continuum in chemical composition is also reflected in its thermochemical and optical properties (Pöschl, 2003). The carbonaceous fraction is usually quantified by its carbon content (total carbon, TCp), which can be operationally divided into carbonate, organic carbon (OC), and elemental (EC) or black carbon (BC).
The complexity of carbonaceous aerosol originates from the diversity of its sources and formation processes. Carbonaceous particles are emitted both from anthropogenic (e.g., fossil fuel and biomass combustion) and biogenic sources (e.g., primary biological aerosol particles, PBAPs, such as fungal spores, bacteria, and degraded plant material). In addition to primary aerosol (emitted in particle form), carbonaceous aerosol can form by atmospheric oxidation of volatile precursors emitted by vegetation or anthropogenic sources. Because of its influence on climate forcing and adverse health effects, as well as its considerable contribution to particulate mass, source apportionment of carbonaceous aerosol is of key importance. Through 14C analysis, carbonaceous aerosol from fossil and modern sources can be distinguished and quantified (Szidat et al., 2004, 2009; Heal et al., 2011), and whereas fossil carbon is only emitted as a consequence of human activities, modern carbon originates from both biogenic and anthropogenic sources. Thus, source-specific tracers are necessary to apportion the modern carbon content. Levoglucosan, characteristic for wood burning emission, is the most commonly used macrotracer, whereas arabitol, mannitol, and cellulose are used to distinguish different types of PBAPs, another source of contemporary carbon. The combination of 14C and source-specific organic tracer analysis has proved to be an efficient method for source apportionment of carbonaceous aerosol (Gelencsér et al., 2007; Gilardoni et al., 2011; Yttri et al., 2011a, b; Liu et al., 2016). Studies combining 14C and 13C analysis for source apportionment are also reported (Ceburnis et al., 2011).
Globally, biomass burning is the major source of carbonaceous aerosol (Crutzen and Andreae, 1990; Gelencsér, 2004), but the form and volume combusted (savanna fires, tropical forest fires, agricultural waste burning, residential wood burning, etc.) depend highly on the geographical position, climate, and economic situation. In Europe, wood burning for residential heating, wild fires, and agricultural waste burning are the dominant forms of biomass burning, and thus significant sources of carbonaceous aerosol, although these sources were hardly recognized for large parts of Europe, until recently. Reviewing source apportionment studies of particulate matter in Europe between 1987 and 2007, Viana et al. (2008) stated that in spite of its importance at certain locations, biomass combustion had rarely been identified as a substantial contributor to PM levels. Gelencsér et al. (2007) and May et al. (2009) studied anthropogenic versus natural contribution to the total organic carbon content in aerosol samples collected at six non-urban sites along a west–east transect over Europe from the Azores (Portugal) to K-puszta (Hungary) and found biogenic sources to dominate at all sites in summer. In winter most of the carbonaceous aerosol was emitted from anthropogenic sources, but there was a considerable difference in the contribution of biomass burning and fossil-fuel combustion, depending on the geographical location (primarily altitude) of the sampling sites. Recently, a number of measurement-based studies have discussed the role of residential wood burning as a source of air pollution in European urban and rural environments. As an example, road traffic and wood combustion contributed equally to the annual mean PM10 concentrations at various sites in Switzerland (Gianini et al., 2012). In the rural environment of the Alps, the contribution of wood burning to PM10 even exceeded that of road traffic (Gianini et al., 2012), and in Alpine valleys wood burning was the dominant source of carbonaceous particles in wintertime (Szidat et al., 2007; Gilardoni et al., 2011; Herich et al., 2014; Zotter et al., 2014). Similar results were found both in rural and urban environments in Norway by Yttri et al. (2011a), who concluded that 80 %–90 % of the wintertime carbonaceous aerosol was emitted from anthropogenic sources and that wood burning contributed slightly more than fossil-fuel sources. In summer, however, 70 % of TC was attributed to natural sources in the rural environment, whereas the corresponding number for the urban environment was 50 %.
Modeling studies from recent years confirm that wood burning emissions are important in wintertime Europe and that such emissions seem to be severely underestimated in many regions (Simpson et al., 2007; Bergström et al., 2012; Genberg et al., 2013). Denier van der Gon et al. (2015) pointed at inconsistent emission factors as a major problem (some countries report mainly solid emissions, whereas others include substantial amounts of condensed semi-volatile OC, SVOC) and produced a new bottom-up emission inventory for residential wood burning emissions of OC and EC, using a consistent methodology across Europe (see also Genberg et al., 2013). Modeling work based upon this inventory, and also including associated intermediate volatility compounds (IVOCs), improved model results for both EC and OC at European regional background sites (Genberg et al., 2013; Denier van der Gon et al., 2015), but, so far, only limited comparisons to source apportionment data have been made with model simulations using the new inventory.
The EMEP (European Measurement and Evaluation Programme) Task Force on Measurements and Modelling (TFMM) periodically arranges Intensive Measurement Periods (IMPs) as a supplement to the continuous monitoring in EMEP (Aas et al., 2012). The present study is part of the second EMEP IMP, which was organized in cooperation with the EU-funded project EUCAARI (European Integrated project on Aerosol, Cloud, Climate, and Air Quality Interactions; Kulmala et al., 2009; Crippa et al., 2014) in fall 2008 and winter/spring 2009. In this study, a collection of aerosol filter samples and measurements of 14C, levoglucosan, and OC∕EC were harmonized using common protocol and analysis in centralized laboratories. The objective was to provide quantitative estimates of carbonaceous aerosol from fossil-fuel, biomass burning, and natural sources in the European rural background environment and to study their relative contribution in two transition periods, in which a noticeable signal from all the considered sources was expected. The carbonaceous aerosol apportioned to biomass burning was used to evaluate model-simulated ECbb and OCbb with both a base-case emission inventory, based mainly on official nationally reported emissions, and a recent, consistent, bottom-up estimate of residential combustion emissions. In the current paper we present the main findings from our study.
2.1 Site description and measurement period
Aerosol filter samples were collected at nine European rural background sites (Table 1, Fig. 1) for a fall period (17 September–15 October 2008; denoted fall) and a winter/spring period (25 February–25 March 2009; denoted winter/spring). For a description of the sampling sites, see Appendix A.
Table 1Location of the nine European rural background sites that participated in the fall 2008 and winter/spring 2009 sampling periods. The sites are ordered by latitude from south to north. NA denotes data that are not available.

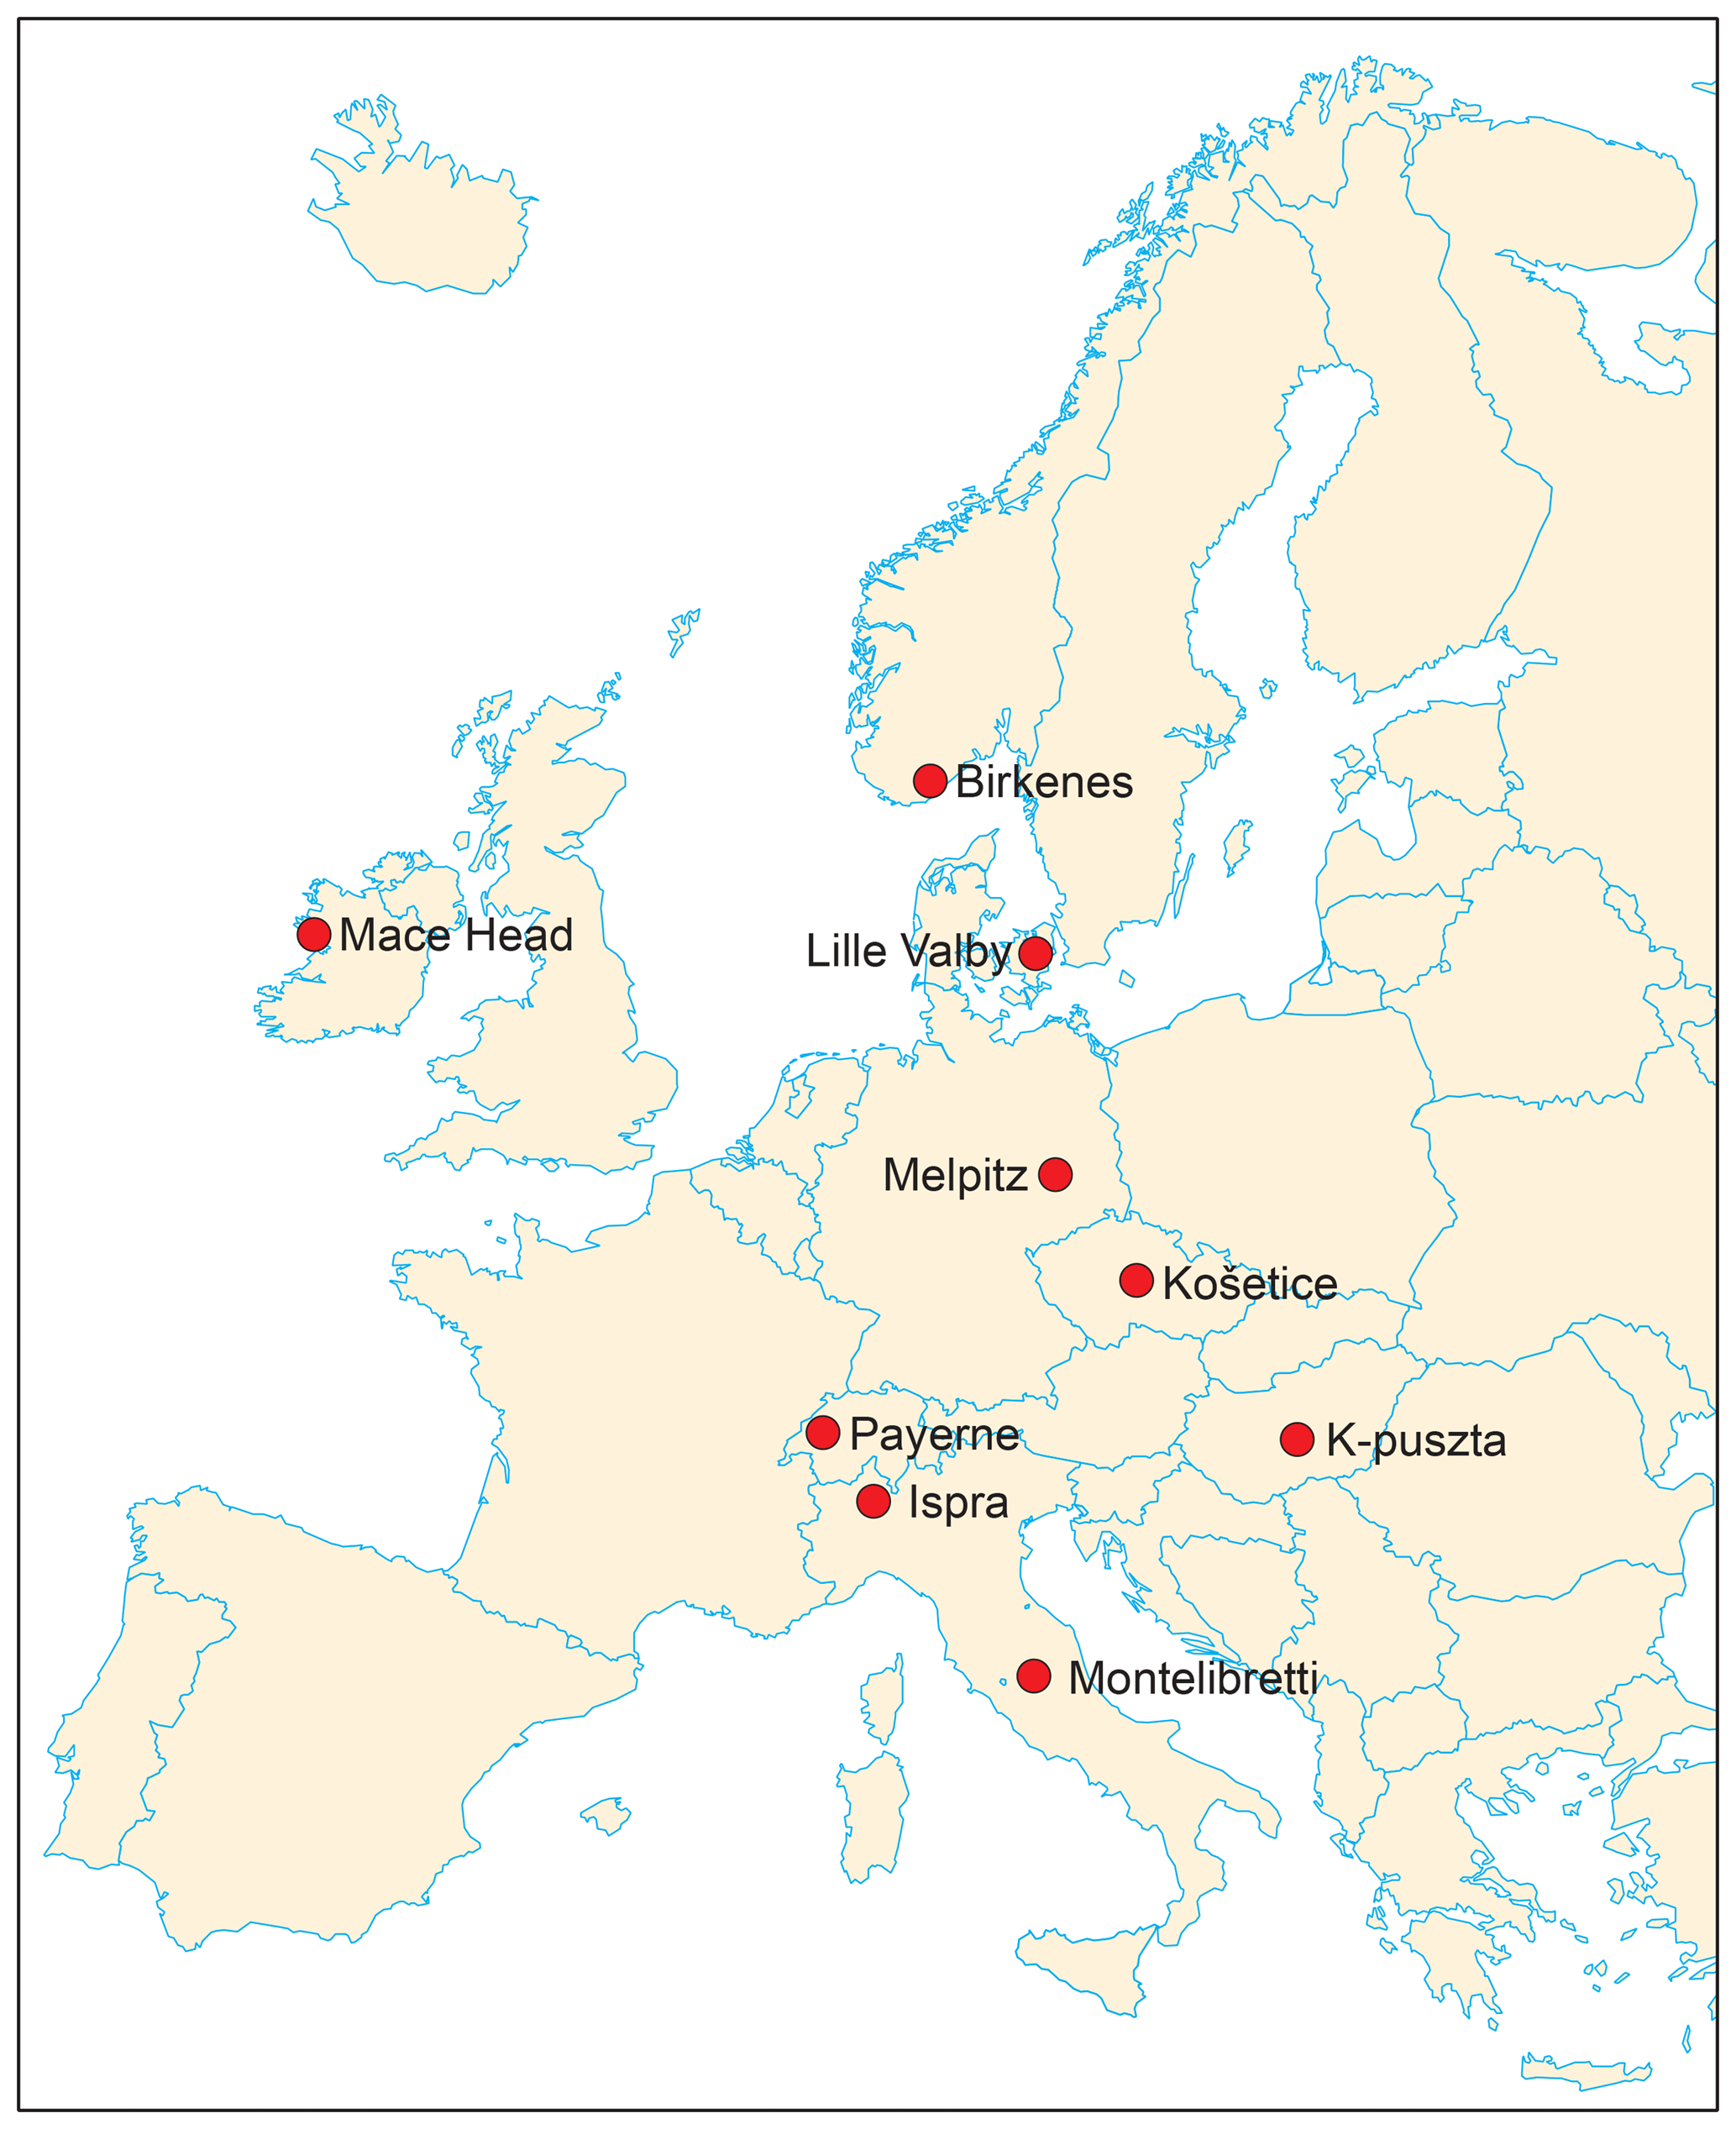
Figure 1Overview of sampling sites participating in the carbonaceous aerosol source apportionment study in the EMEP Intensive Measurement Periods (IMPs) in fall 2008 and winter/spring 2009.
2.2 Aerosol sampling
Ambient aerosol filter samples were obtained using various low volume filter samplers equipped with a PM10 inlet, collecting aerosol on pre-fired (850∘ C; 3 h) quartz fiber filters (Whatman QMA; 47 mm in diameter, batch number 11415138). The only exception was for samples collected at the Mace Head station, which used a high-volume sampler with a PM2.5 inlet. The samplers were operated at a flow rate ranging from 16.7 L min−1 to 1.71 m3 min−1, corresponding to a filter face velocity ranging from 20 to 69 cm s−1 (Table 1). The filter samples were collected according to the quartz fiber filter behind quartz fiber filter (QBQ) approach to provide a quantitative estimate of the positive sampling artefact of organic carbon (OC); thus the impact of the different filter face velocities at the various sites should be minimized. The sampling time was 1 week, and four samples were collected at each site for each of the two periods. At Mace Head, the collection of filter samples deviated slightly from the protocol in fall 2008, as the second week of sampling was divided into two to separate polluted air masses passing over the European continent for the first three days of the week and clean marine air masses for the last four days of the week. The sampling inlets were installed approximately 4 m above ground level, except at Mace Head (10 m). Post-exposure filter samples were placed in PetriSlides and stored in a freezer (−18 ∘C) to prevent degradation or evaporation of the analytes.
2.3 Thermal-optical analysis
Total carbon (TC), elemental carbon (EC), and organic carbon (OC) were quantified using the Sunset Lab OC-EC Aerosol Analyzer (Birch and Cary, 1996), using transmission for charring correction and operated according to the EUSAAR-2 temperature program (Cavalli et al., 2010)
2.4 Determination of non-fossil TC from 14C analysis
For the measurement of 14C(TCp) (14C of particulate TC), 0.2–2 cm2 punches, corresponding to 4–40 µg TC, were transferred into preheated quartz tubes (4 mm outer diameter) filled with ∼0.1 g cupric oxide. The tubes were connected to a vacuum line, cooled to −70 ∘C, evacuated to hPa within 1 min, and then sealed. The sealed ampoules were heated to 850 ∘C for 4 h for oxidation of TC to carbon dioxide (Fahrni et al., 2010). 14C measurements were performed at the Laboratory of Ion Beam Physics of ETH Zurich, using the accelerator mass spectrometer MICADAS, equipped with a gas ion source (Ruff et al., 2007), which allowed a direct injection of the carbon dioxide after dilution with helium (Wacker et al., 2013). 14C results for the front filters were corrected for SVOC contributions using the TC mass of the corresponding back filters and the mean 14C result of the four back filters for the respective site and season. 14C(TCp) values are given as fractions modern (F14C), i.e., as the 14C∕12C ratios of the samples related to the isotopic ratio of the reference year 1950 (Reimer et al., 2004). For determination of the non-fossil fraction of TCp (i.e., fnf(TCp) from 14C(TCp) determinations, a reference F14C value of pure non-fossil emissions of 1.08±0.04 was used to consider the different impacts of excess 14C from atmospheric nuclear bomb tests to fresh biomass and tree wood (Mohn et al., 2008). This is based on the assumptions that 50 % of non-fossil TC originates from fresh biomass and 50 % from burning of wood, whereof the latter includes 10-, 20-, 40-, 70-, and 85-year old trees with weights of 0.2, 0.2, 0.4, 0.1, and 0.1, respectively.
2.5 Measurement of levoglucosan, mannosan, and galactosan
Quantification of the monosaccharide anhydrides (MAs) levoglucosan, mannosan, and galactosan was performed according to the method described by Dye and Yttri (2005), which has been successfully applied for aerosol samples ranging from the urban (e.g., Fuller et al., 2014) to the remote environment (e.g., Yttri et al., 2014).
For the analysis, punches (1.5 cm2) of the filter were spiked with 13C6 levoglucosan and 13C6 galactosan and extracted twice with 2 mL tetrahydrofuran under ultrasonic agitation (30 min). The filtered extracts (Teflon syringe filter, 0.45 µm) were evaporated to a total volume of 1 mL in a nitrogen atmosphere. Before analysis the sample solvent elution strength was adapted to the mobile phase by adding Milli-Q water (0.8 mL). The concentrations of the MAs were determined using high-performance liquid chromatography (HPLC) (Agilent model 1100) in combination with HRMS-TOF (high-resolution time-of-flight mass spectrometry; Micromass model LCT) operated in the negative ESI mode. Levoglucosan, mannosan, and galactosan were identified on the basis of retention time and mass spectra of authentic standards. Quantification was performed using isotope labeled standards of levoglucosan and galactosan. The mass traces at m∕z 161.0455 and 167.0657 were used for quantification (approximately 50 mDa peak width).
The method described has been subject to intercomparison (Yttri et al., 2015).
2.6 Measurement uncertainties
2.6.1 Estimating the positive sampling artefact of OC
Table 2a and b show the OCBack∕OCFront ratios for the various sites. OCBack is gaseous OC present on the back filter, and OCFront is the sum of gaseous and particulate OC on the front filter. This ratio provides an estimate of the magnitude of the positive sampling artefact (i.e., adsorption of semi-volatile organic species on the filter/collected particles) of OC when using tandem filter sampling. When subtracting OCBack from OCFront, positive-artefact-corrected particulate organic carbon (OCp) is obtained.
Table 2(a) Mean (± SD; standard deviation) concentrations of carbonaceous sub-fractions and levoglucosan in PM during winter/spring 2009. The EC∕TCp ratio, the OCBack∕OCFront ratio, and non-fossil fractions of TCp (fnf(TCp)) are also listed. The sites are ordered by latitude from south to north. (b) Mean (± SD; standard deviation) concentrations of carbonaceous sub-fractions and levoglucosan in PM during fall 2008. The EC∕TCp ratio, the OCBack∕OCFront ratio, and non-fossil fractions of TCp (fnf(TCp)) are also listed. The sites are ordered from by latitude from south to north.
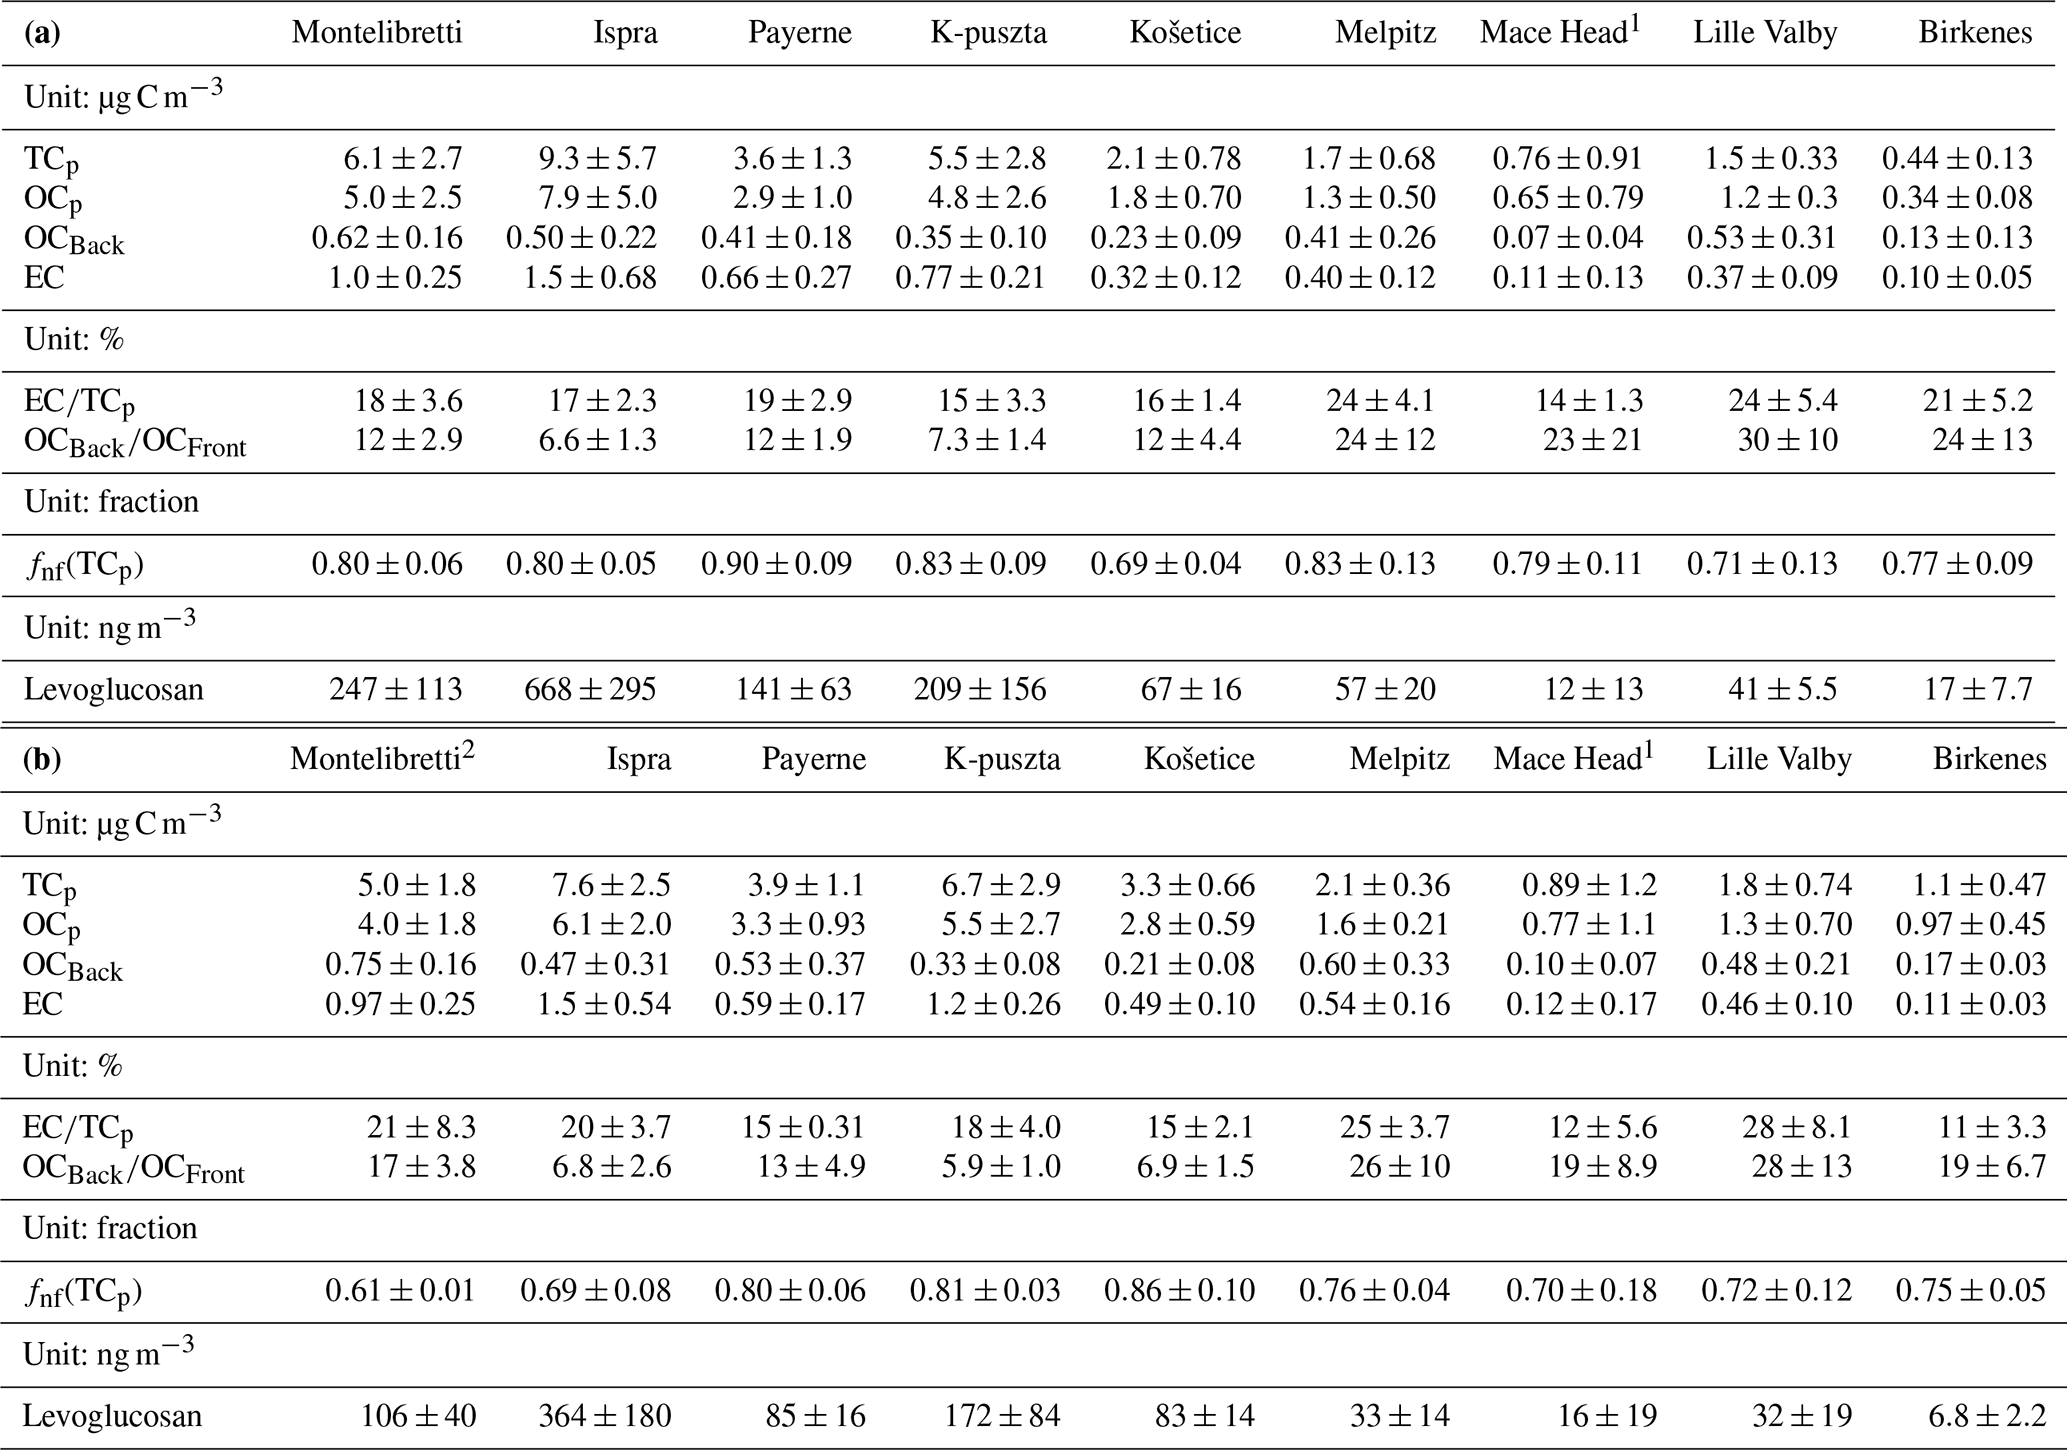
1 For Mace Head, PM2.5 was used. 2 The sampler at Montelibretti was run in an alternating on/off mode, collecting ambient air 15 min every 1 h.
The positive artefact of OC ranged from 5.9±1.0 % (K-puszta, HU) to 28±13 % (Lille Valby, DK) in fall, whereas the corresponding range in winter/spring was 6.6±1.3 % (Ispra, IT) to 30±10 % (Lille Valby, DK). This shows that OCp could be severely overestimated if the positive artefact was not accounted for. Note that the QBQ approach does not account for any negative artefacts (i.e., release of semi-volatile organic species from collected particles); thus the OCp levels should be considered conservative estimates. There was typically a minor difference in the magnitude of the positive artefact between fall and winter/spring. No seasonal pattern consistent for all sites was observed.
2.6.2 Uncertainties in OC∕EC measurements
An amount of ∼15 µg EC cm−2 is considered the upper limit for the Sunset Lab OC-EC Aerosol Analyzer (Subramanian et al., 2006; Wallén et al., 2010) and should not be exceeded in order to obtain a correct OC∕EC split. A non-biased OC∕EC split also requires that either pyrolytic carbon (PC) evolves before EC or that PC and EC have the same light absorption coefficient, which we know is not always the case (Yang and Yu, 2002). In fall 2008, 11 out of 36 samples exceeded 15 µg EC cm−2, whereas the corresponding number for winter/spring 2009 was 3 out of 36. For most of these samples the concentration just barely exceeded 15 µg EC cm−2; nevertheless there is an added, non-quantifiable, uncertainty for these samples compared to those for which EC <15 µg C cm−2.
2.6.3 Uncertainties in levoglucosan analysis
Yttri et al. (2015) reported that the analytical method used to quantify levoglucosan in the current study had a bias of % compared to the assigned value, being the median value of levoglucosan based on the values reported by all participating laboratories in the actual intercomparison.
2.6.4 Uncertainties of the fnf (TCp) determination from 14C analysis
Uncertainties of 14C(TC) measurements were 1 %–4 % for the front filters and 2 %–10 % for the pooled back filters. The uncertainties of the front filters increased upon calculation of 14C(TCp), especially for filters with high SVOC contributions. A further increase occurred when determining fnf(TCp) (fnf = non-fossil fraction) due to the uncertainty of the reference fM value of pure non-fossil emissions; therefore the final uncertainties of the non-fossil fraction of TCp given in Table 2a and b ranged from 0.03 to 0.09.
Two samples from Birkenes and two from Košetice had unrealistically high 14C values, for unknown reasons. This finding was confirmed when rerunning the samples at another research institute. There are other examples showing that super-modern carbon can be an issue for TC measured at European rural background sites (e.g., Glasius et al., 2018). Several hypotheses were suggested with respect to what the sources of super-modern carbon in the atmosphere are, e.g., emissions from nuclear power plants, waste incinerators taking care of waste from laboratories and hospitals, and crematoriums (Buchholz et al., 2013; Zotter et al., 2014). Although samples highly contaminated with super-modern 14C are easily observed, it is not possible to determine if reasonable looking samples are free from such contamination. 14C-contaminated measurements may lead to an overestimation of sources that emit modern carbon when performing source apportionment of the carbonaceous aerosol, as described in the current paper.
2.7 Chemical transport modeling
An important use of the carbonaceous aerosol Latin hypercube sampling (LHS)-based source apportionment is to evaluate and constrain model systems for simulating particulate matter in the atmosphere. The EMEP MSC-W model (Simpson et al., 2012, 2017 and references therein) is an open-source chemical transport model widely used for research, within the EMEP and elsewhere (e.g., Simpson et al., 2007; Bergström et al., 2012, 2014; Dore et al., 2015; Ots et al., 2016; Vieno et al., 2016). In the present study, we run the EMEP model with a horizontal resolution of 50 km × 50 km across Europe, using 21 vertical levels, the lowest level being approximately 50 m thick. Meteorological data from the Integrated Forecast System model (IFS; Cycle 40r1) of the European Centre for Medium-Range Weather Forecasts (ECMWF) were used to drive the model. For this study, version rv4.15 of the model was used with some modifications: the OC emissions from all sources (except wildfires and open agricultural fires, which were treated as non-volatile in order to provide a tracer of these emissions but without adding the considerable uncertainties associated with aging of any assumed volatility basis set (VBS) components) were treated as semi-volatile and subject to evaporation and oxidation in the gas phase (aging), using a VBS approach, similar to the VBS PAA scheme in Bergström et al. (2012; the PAA scheme includes gas-particle partitioning of primary organic aerosol emissions and aging of all semi-volatile OA components in the gas phase). The model was run for the years 2008 and 2009, with two different emission setups (see Sect. 2.7.1) in order to evaluate model performance for biomass-burning-derived OC and EC with these inventories. Initial and lateral boundary conditions for the EMEP model are specified for most pollutants, as in Simpson et al. (2012). For organic matter (OM), the model assumes a background level of organic matter to represent OM transported into the modeling domain or otherwise not accounted for (e.g., marine aerosol, some primary biological aerosol particles, or very aged aerosol from outside the domain). In the initial setup of Bergström et al. (2012) and Simpson et al. (2012), we used 1.0 µg m−3 OM, but results presented in Bergström et al. (2012) and later studies suggested that this was too high. As in Bergström et al. (2014), we assume a background concentration of particulate OM of 0.4 µg m−3 (with an OM∕OC ratio of 2.0) near the ground.
2.7.1 Emissions
European residential wood burning inventories have substantial inconsistencies between countries (Denier van der Gon et al., 2015; Simpson and Denier van der Gon, 2015), and several assumptions concerning volatility and oxidation-processes for such emissions are possible (e.g., Robinson et al., 2007; Grieshop et al., 2009; Bergström et al., 2012; May et al., 2013a; Jathar et al., 2014; Ciarelli et al., 2017). To illustrate some of the uncertainties associated with this, two different emission setups were applied in the present study: a base-case run using the widely used MACC-III emission inventory and an alternative run, denoted DT+IVOC.
In both cases, anthropogenic emissions (except as noted below) were based on the TNO MACC emission inventory for 2011 (Kuenen et al., 2014; Hugo A. C. Denier van der Gon, Jeroen J. P. Kuenen, and Antoon J. H. Visschedijk, TNO, Netherlands, personal communication, 2015) with emission categories following the SNAP system, in which SNAP-2 includes nonindustrial combustion, such as residential wood burning. Emissions from vegetation fires and agricultural burning were taken from the Fire INventory from NCAR version 1.5 (FINNv1.5; Wiedinmyer et al., 2014), and OC emissions from these types of fires were treated as non-volatile.
Base case
For SNAP-2, the MACC-III emissions were split into biomass burning sources (mainly wood and woody fuels) and fossil-fuel sources (coal, oil, etc.), using data from Jeroen J. P. Kuenen (TNO, Netherlands, personal communication, 2017). The emissions in MACC-III were split into five volatility bins, with saturation concentrations (, in the range 0.01–1000 µg m−3) as shown in Table 3.
Table 3Volatility distributions of the primary organic aerosol (POA) emissions from anthropogenic sources.
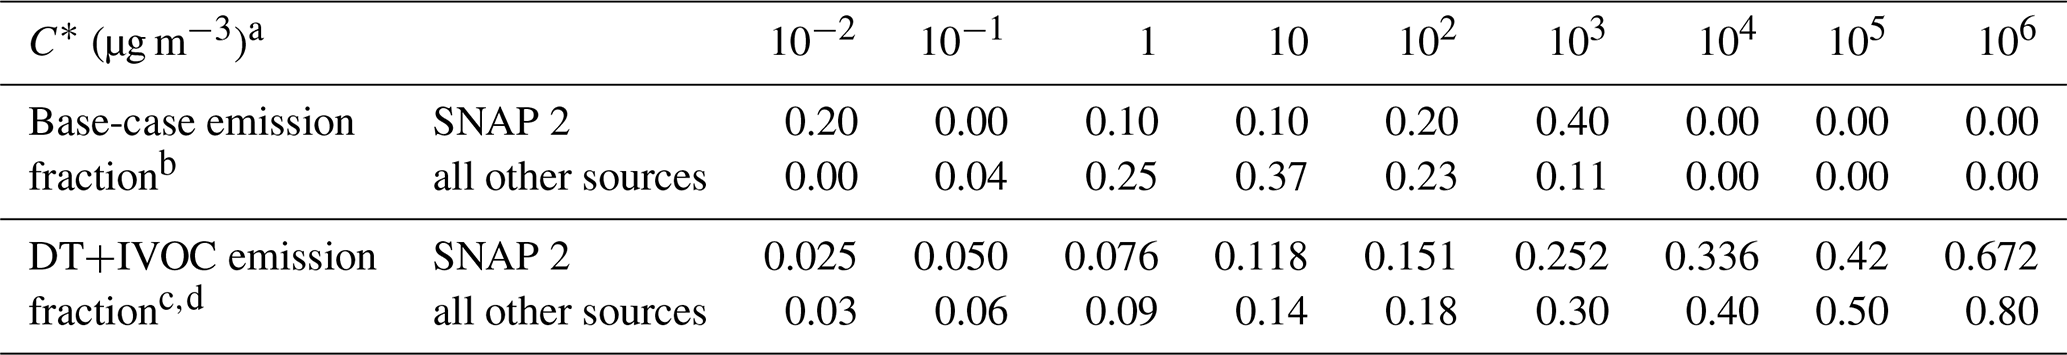
a C∗: saturation concentration at 298 K; enthalpies of vaporization were taken from May et al. (2013a, b) for the base case (MACC-III) and from Shrivastava et al. (2008) for the DT+IVOC case. b The volatility distribution in the MACC-III model run is based on the recommended volatility distributions from May et al. (2013a, b) for biomass burning emissions (for SNAP sector 2; nonindustrial stationary combustion) and for diesel exhaust (for all the other emission sectors) but moving the emissions in the –106 µg m−3 bins to the 103 µg m−3 bin. c The volatility distributions in the DT+IVOC case are based on Shrivastava et al. (2008) for all emission sectors except SNAP-2, for which it is based on the distribution used for the EMEP model in Denier van der Gon et al. (2015). Note that this scenario assumes that there are substantial IVOC emissions that are not included in the emission inventories (see Bergström et al., 2012; Denier van der Gon et al., 2015). d Since the DT emission inventory by Denier van der Gon et al. (2015) was constructed to include a larger fraction of SVOCs from residential wood burning emissions, we apply a slightly different emission split for the SNAP-2 primary organic aerosol (POA) compared to other SNAP sectors. Considering both SVOCs and IVOCs within the POA class, the total POA emissions are assumed to be 2.1 times the inventory (compared to the factor of 2.5 for the other emission sectors).
DT+IVOC case
POA and EC SNAP-2 emissions from MACC-III were scaled (except for Russia, for which the MACC_III emissions were used also in the DT+IVOC runs) to better match the bottom-up inventory “DT” from Denier van der Gon et al. (2015), where DT refers to data from dilution tunnels, which capture condensables (SVOC) in addition to solid particles. This causes a substantial increase in POA emissions for some countries (e.g., by more than a factor of 3 for Germany) but only minor for others (e.g., Norway), as discussed by Denier van der Gon et al. (2015). The DT+IVOC case adds extra emissions of intermediate volatility compounds (IVOCs) for all primary OA (POA) sources, as in Denier can der Gon et al. (2015). The split between biomass burning (non-fossil) emissions and fossil-fuel-based emissions for SNAP-2 was taken from the inventory of Denier van der Gon et al. (2015). Table 3 details the volatility assumptions used for the DT+IVOC case. EC emissions from wood combustion are also different in the two different inventories (see Genberg et al., 2013, for a detailed discussion of the EC emissions in the DT emission inventory).
Source apportionment of TC into different source categories of fossil fuel, biomass burning, and remaining non-fossil carbon for OC and EC has been done with chemical and 14C tracers. This methodology, which is very similar to that used in Yttri et al. (2011a), was originally developed for the CARBOSOL project (Gelencsér et al., 2007) and has been refined over the years and applied in several Nordic studies (Szidat et al., 2009; Yttri et al., 2011a, b; Glasius et al., 2018). In summary, measurements of levoglucosan are used as a tracer of wood-burning emissions (TC; OCbb includes primary and secondary OC) and the 14C isotopic ratio (F14C), along with measured OC and EC, and assumed emission ratios (e.g., TCbb∕levoglucosan and OCbb∕TCbb from wood combustion, or OC∕EC ratios from fossil-fuel combustion), to assign the remaining carbon between fossil-fuel sources and secondary organic aerosol sources. When available (as in Yttri et al., 2011a), mannitol and cellulose can be used as tracers of primary biological aerosol particles (OCPBAP) derived from fungal spores (OCpbs) and plant debris (OCpbc), respectively. Total carbon is in this way split into TCbb, OCPBAP, and TCff (i.e., OCff+ECff, from fossil-fuel sources; OCff includes primary and secondary OC), and finally, any remaining modern carbon is labeled OCrnf, which typically is dominated by OCBSOA (biogenic secondary organic aerosol) but might also include other sources, such as SOA from biomass burning and emissions related to cooking (Mohr et al., 2009; Crippa et al., 2014). Note that Crippa et al. (2014) did not find any influence of cooking at European rural background sites doing a source apportionment study of the carbonaceous aerosol based on aerosol mass spectrometer (AMS) measurements. The relationship between any tracer and its derived TC component is very uncertain; thus an uncertainty distribution of allowed parameter values for all important emission ratios or measurement inputs is assigned. In order to solve the system of equations, allowing for the multitude of possible combinations of parameters, an effective statistical approach known as Latin hypercube sampling is used, which is comparable to Monte Carlo calculations. In brief, central values with low and high limits are associated with all uncertain input parameters. These factors are combined using LHS in order to generate thousands of solutions for the source apportionment. All valid combinations of parameters (i.e., excluding those producing negative solutions) are condensed in frequency distributions of possible solutions. Extensive discussion of the choices behind the factors used, and their uncertainties, can be found in earlier related studies (Yttri et al., 2011a; Szidat et al., 2009; Gelencsér et al., 2007; Simpson et al., 2007). The results of this analysis consist of so-called central estimates of the TC components (i.e., the 50th percentile), as well as the range of possibilities allowed by the LHS calculation, e.g., expressed as the 10th and 90th percentiles of the solutions.
There are two major differences in the data available for this study compared to Yttri et al. (2011a, b), requiring modification of the methodology and factors used: (i) for the present study, we have no data to estimate the fractions of PBAPs and BSOA; thus OCrnf comprises OCBSOA, OCPBAP, and indeed all other non-fossil sources of OC. (ii) The geographical scope of the current study is wider, and in particular biomass burning in southern Europe involves different tree species than those used in the northern European studies of Yttri et al. (2011a, b) or Szidat et al. (2009).
Concerning item (i), we require a range of values of the F14C value associated with OCrnf. In Yttri et al. (2011a, b) we used 1.055 for BSOA and PBAPs associated with plant debris but allowed F14C for spores to vary between 1.055 and 1.25, reflecting the utilization of older carbon stocks by fungi. As noted above, we have no direct tracers for BSOA or PBAPs, but a few studies allow a general estimate. Winiwarter et al. (2009) suggested that fungal spores were likely the dominant contributor to PBAPs across Europe. Results scaled for Europe indicated a contribution of PBAPs to PM10 concentrations in the low percentage range, with a maximum in summer when PM10 concentration levels are small. Similarly, Bauer et al. (2008) had spores contributing 6 % to OC in spring and 14 % in summer at a suburban site, whereas the corresponding contribution to PM10 was 3 % (spring) and 7 % (summer). In Norway, Yttri et al. (2011a) found spores and debris contributing 18 % and 6 %, respectively, to TC at a rural site in summer, with 0.5 % and 7 %, respectively, in winter. For comparison, BSOA contributed 56 % and 11 % of TC in summer and winter at the actual site. Hence, spores and plant debris are likely to make a certain contribution but are unlikely to dominate OCrnf. In order to account for this, we allow F14C to vary between 1.055 to 1.100 in the present study.
Concerning item (ii), the main effect is likely to be on the assumed TC∕levoglucosan ratios used in the LHS method. In Yttri et al. (2011a, b) we used low, central, and high values of 11, 15, and 17 for PM10, or 7.6, 12, and 14 for PM2.5, factors derived from ambient Norwegian data and modified to be appropriate for the QBQ sampling used for the LHS. These values also seem to be consistent with the study of Elsasser et al. (2012), which reported OC∕levoglucosan values from filter samples of about 10–17 for Augsburg, Germany. Inclusion of EC would give TCbb∕levoglucosan values at the high end of our assumed range.
We have no equivalent data for southern Europe, but a simple examination of the data in Table 2 suggests that levoglucosan levels can be high at the Italian sites, and assuming high ratios of (TC∕levoglucosan)bb in emissions would result in LHS-estimated TCbb higher than observed TC, which clearly is impossible. Gilardoni et al. (2011) used (OC∕levoglucosan)bb of 4 to 13, then (OC∕EC)bb of 1 to 20, whereas Zotter et al. (2014) observed (OC∕levoglucosan)bb of 7.8±2.7 and (OC∕EC)bb of 8.6±2.9 for southern Switzerland, which is close to the Italian site Ispra. It is not obvious how to derive (TC∕levoglucosan)bb from these values, but low values are clearly suggested by these choices.
In order to allow for this possibility, we have extended the lower range of our (TC∕levoglucosan)bb ratio to be 5, thus using low, central, and high values of 5, 15, and 17 for PM10. This actually made very little difference to the LHS solutions for central and northern Europe but allowed more solutions for the Italian sites.
No attempts to run LHS were possible for samples with unrealistically high 14C(TC) values, affecting two samples each from Birkenes and Košetice. No valid solution was obtained for five of the samples collected at Ispra, two at Melpitz, one at Birkenes, and one at Payerne. This may be an indication of problems with the samples (e.g., artefacts or contaminated 14C(TC) values) or with the assumptions underlying LHS breaking down. Nevertheless, LHS-based source apportionment was obtained for 29 our of 35 samples in fall and for 29 out of 36 in winter/spring.
4.1 Ambient concentrations of the carbonaceous aerosol
Concentrations of elemental carbon (EC), positive-artefact-corrected particulate organic carbon (OCp), organic carbon on back filters (OCB), positive-artefact-corrected particulate total carbon (TCp), and levoglucosan, as well as the EC∕TCp ratio and the fnf(TCp) fraction observed during the fall 2008 and the winter/spring 2009 Intensive Measurement Periods, are presented in Table 2.
4.1.1 EC and OCp
The mean (± SD; standard deviation) EC concentration (0.64±0.58 µg C m−3 in fall; 0.58±0.50 µg C m−3 in winter/spring) was quite similar to the annual mean (± SD) concentration reported for 12 European rural background (EMEP) sites in 2002–2003 (0.66±0.39 µg m−3; Yttri et al., 2007a) but slightly less than the wintertime mean (0.79±0.83 µg C m−3; ibid.). Although thermal-optical analysis was used both in the present study and in that by Yttri et al. (2007a), different temperature protocols can cause substantial differences in the OC∕EC split. However, only a minor difference was observed with respect to the EC∕TC ratio when analyzing the “8785 Air Particulate Matter On Filter Media” reference material from NIST using the EUSAAR-2 protocol and the NIOSH-derived protocol (Yttri et al., 2007a). The mean EC concentration varied by a factor of ∼15 between sites both in fall and in winter/spring, with concentrations at Birkenes and Mace Head (northwestern Europe) being substantially lower than for continental European sites, particularly compared to the southern sites (Montelibretti, Ispra, and K-puszta). A pronounced north–south gradient for EC, and OC, has previously been reported by Yttri et al. (2007a), reflecting diluted emissions from major source regions in continental Europe reaching distant and less polluted sites on the outskirts of Europe. In addition, the proximity to the coast causes efficient ventilation and air mass mixing at the sites Birkenes and Mace Head.
The mean (± SD) OCp concentrations in fall (2.9±3.1 µg C m−3) and winter/spring (2.8±2.3 µg C m−3) were almost identical. A few, high-concentration samples at the sites Montelibretti, Ispra, and K-puszta influenced the winter/spring mean, as evident from the mean-to-median ratio of 1.6 compared to 1.2 in fall. Mean (± SD) OCp concentrations reported here were slightly lower than the annual (3.4±3.6 µg C m−3) and wintertime (3.7±4.4 µg C m−3) mean OC concentrations reported for EMEP sites in 2002–2003 (Yttri et al., 2007a). Differences in sampling time, temperature protocol, and sampling approach (the current study accounted for the positive sampling artefact of OC, whereas Yttri et al., 2007a, did not), are likely to explain the (minor) differences in the OC concentration between the two studies. If we allow for a positive artefact of similar magnitude as that observed in the present study, 16±8 % in fall and 17±9 % in winter/spring, also for the Yttri et al. (2007a) study, levels would be fairly similar.
A north–south gradient was observed for OCp as for EC, which was less prominent in fall compared to winter/spring.
4.1.2 EC∕TC ratio
The EC∕TCp ratio ranged from 11 % to 28 % in fall and from 14 % to 24 % in winter/spring. No pronounced shift in the EC∕TCp ratio was observed between the two periods, except for the Norwegian site Birkenes, for which the EC∕TCp ratio was 11 % in fall and 21 % in winter/spring.
4.1.3 Levoglucosan
The mean concentration of the wood burning tracer levoglucosan varied by more than a factor of 50 between sites, both in fall and in winter/spring. There was a pronounced north–south gradient, as for OCp and EC, and the mean concentration was higher in winter/spring than in fall at all sites, except Košetice and Mace Head. The levoglucosan level is within the range reported for six European rural background sites (2.7–1220 ng m−3) by Puxbaum et al. (2007), and for Montelibretti, Ispra, and K-puszta, levels equaled the concentration range reported for urban areas in winter (Szidat et al., 2009).
4.1.4 fnf (TCp) from 14C analysis
The non-fossil fraction of TCp (i.e., fnf(TCp)) of individual aerosol filter samples varied from 0.51 to >1.00. Two samples from Birkenes and two samples from Košetice showed such high 14C(TC) results that the corresponding fnf(TCp) resulted in levels as high as 1.68. These unreasonable values point to an anthropogenic bias of local 14C emissions, which distort the source apportionment. Similar cases have occasionally been observed at other sites, mainly caused by local pharmaceutical facilities with incineration units for 14C-labeled waste (Buchholz et al., 2013; Zotter et al., 2014). In some cases, the specific source could not be identified, as for Birkenes and Košetice. Consequently, the biased values were excluded from further analysis. The remaining results from these two sites were included, as they correspond well with values from the other sites, although their reliability remains unclear.
Mean fnf(TCp) values ranged from 0.61 to 0.91 for the individual sites, including both fall and winter/spring. These values correspond to those reported at five European rural and remote sites in summer and winter by Gelencsér et al. (2007) and to an urban and a rural site in Norway (Yttri et al., 2011a) but are higher compared to rural and urban sites in Switzerland and Sweden during summer and winter (Szidat et al., 2009). The seasonal variation was typically not pronounced, although most sites experienced the highest fnf(TCp) values in winter/spring. The exceptions were Montelibretti, at which fnf(TCp) was noticeably higher in winter/spring (0.80) compared to fall (0.61), and Košetice, at which fnf(TCp) was higher in fall 2008 (0.86) compared to winter/spring 2009 (0.69).
Results from the carbonaceous aerosol source apportionment (Fig. 2; Table 4) show a variability in the carbonaceous aerosol source composition, both as a function of season and location. The results from the source apportionment analyses are discussed in detail in Sect. 5.1–5.6. Calculated concentrations and relative contributions typically showed little variability between samples collected within each season for each of the nine sites. Hence, comparing results based on calculated mean values can be argued for. The results presented are complementary to those of Gelencsér et al. (2007), Genberg et al. (2011), and Yttri et al. (2011a, b), as the same (or similar in the case of Genberg et al., 2011) software and/or methodology is applied but for a wider range of sites and with updated emission ratios (Zotter et al., 2014) for the central and southern European sites.
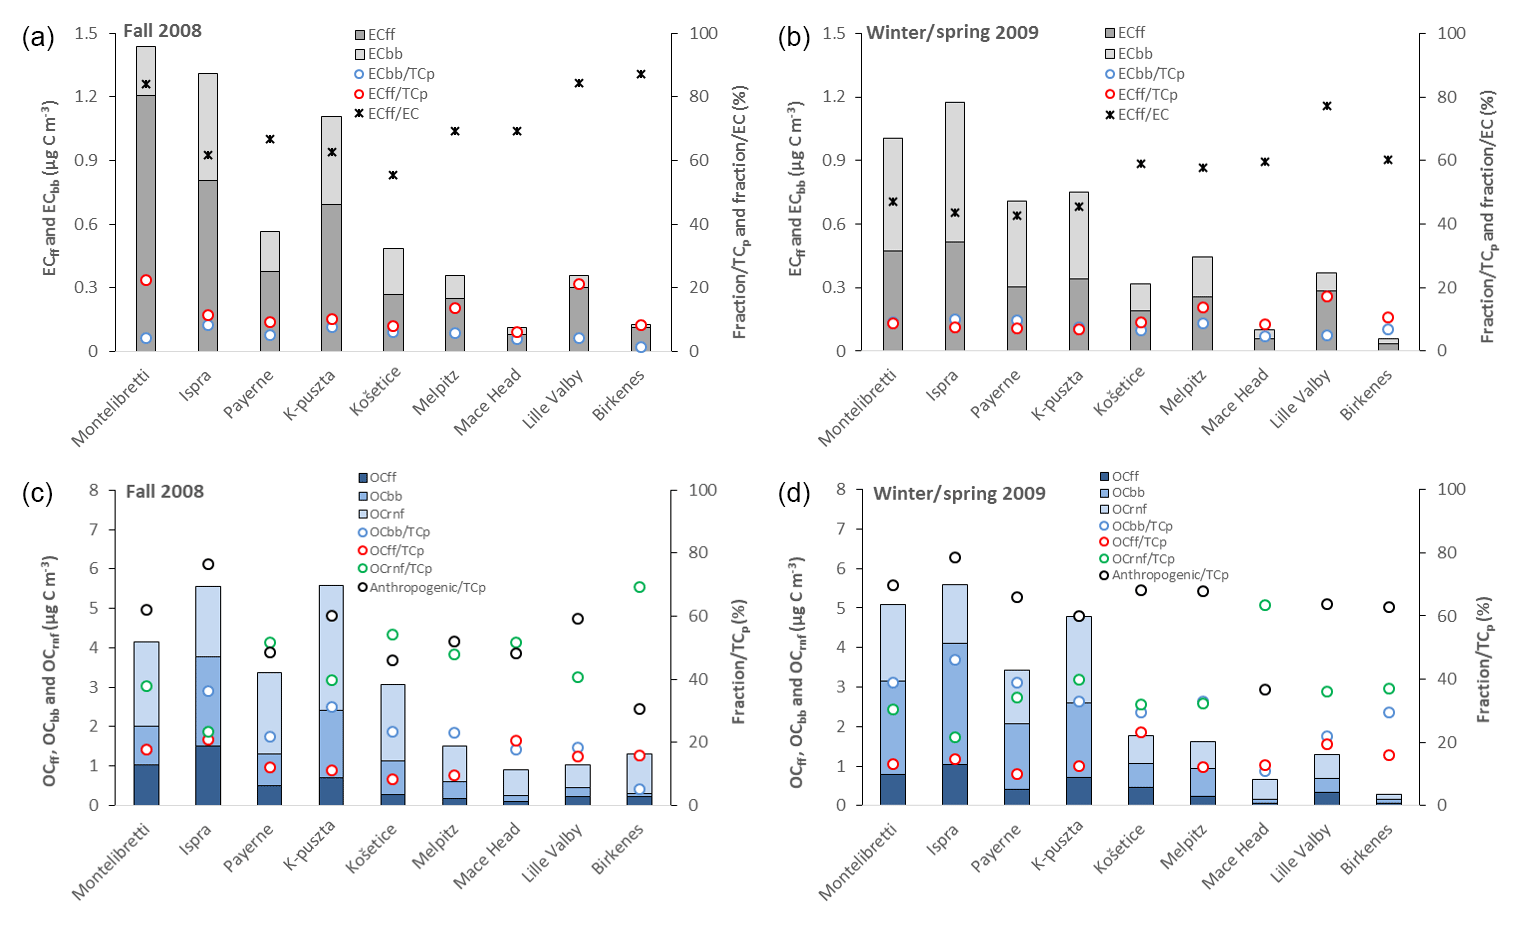
Figure 2Mass concentrations of EC from fossil-fuel (ECff) and biomass burning (ECbb) sources, their fraction of particulate total carbon (TCp), and the fraction of ECff to EC for fall 2008 (a) and winter/spring 2009 (b). Mass concentrations of OC from fossil-fuel (OCff), biomass burning (OCbb), and remaining non-fossil (OCrnf) sources, their fraction of TCp, and the fraction of anthropogenic (OCff, OCbb, ECff, and ECbb) to TCp for fall 2008 (c) and winter/spring 2009 (d). The sites are listed by latitude from south to north. Note that the ECff∕TCp marker is superimposed on the ECbb∕TCp marker for Montelibretti and K-puszta in (b), and that the OCff∕TCp marker is superimposed on the OCbb∕TCp marker for Montelibretti in (c).
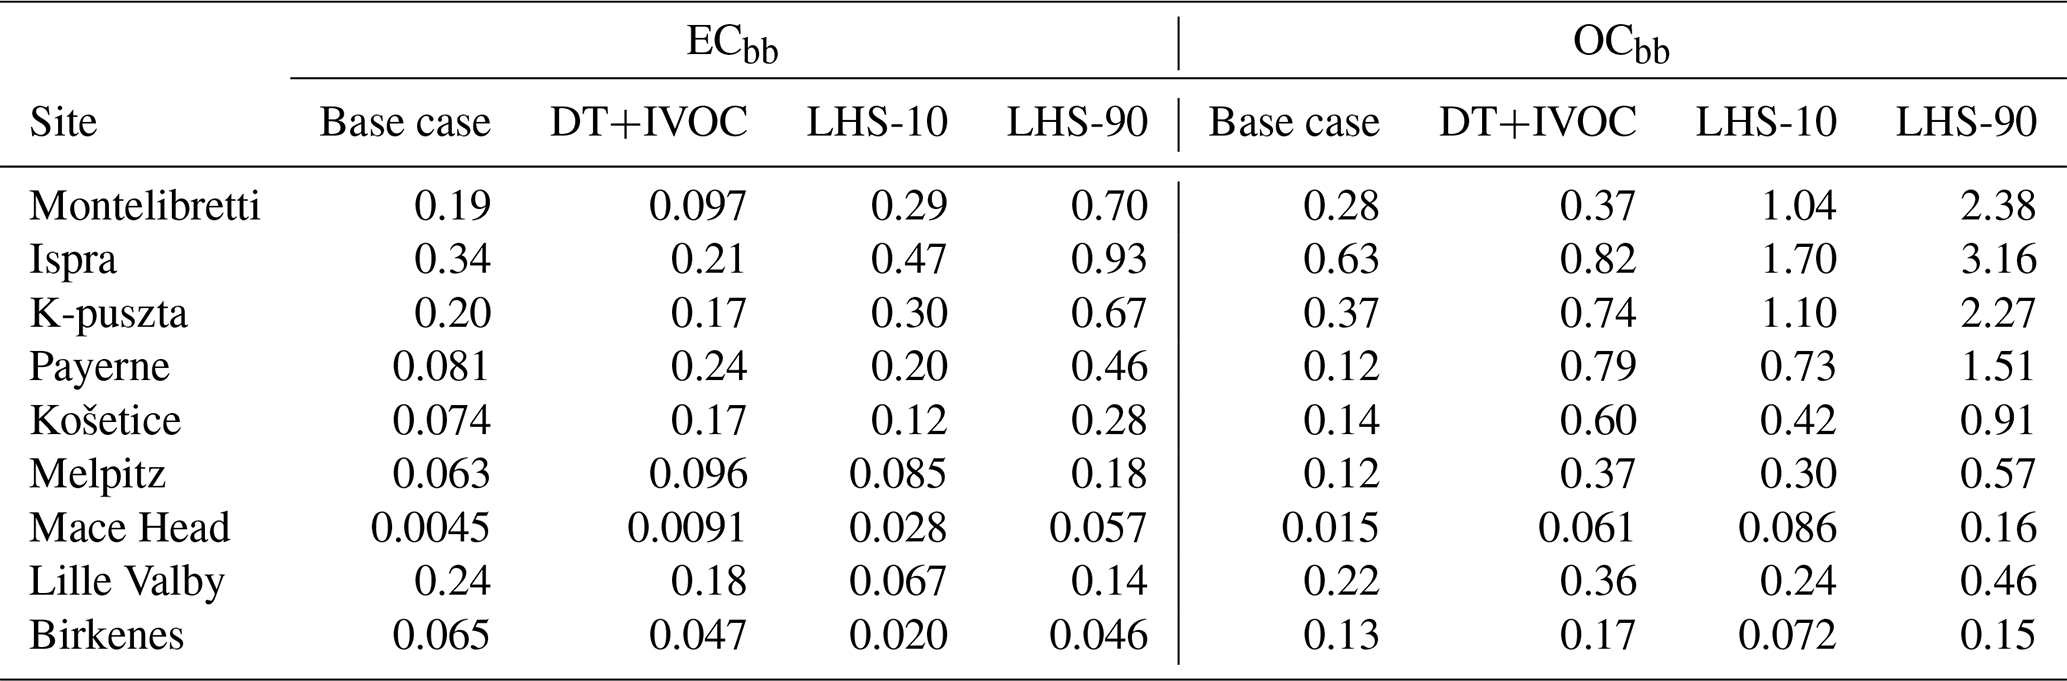
Table 4Model and source-apportioned (LHS-derived) concentrations of elemental carbon (ECbb) and organic carbon (OCbb) from biomass burning. Model results are averages over both measurement periods (fall 2008 and winter/spring 2009). For the LHS results the means of the 10th and 90th percentiles are shown. Unit: µg C m−3.
A major difficulty for all modeling work is the complexity of organic aerosol, in terms of emissions, formation mechanisms, and deposition processes (e.g., Hallquist et al., 2009; Hodzic et al., 2016). Considering emissions, we can note that Denier van der Gon et al. (2015) utilized a specially developed map of residential wood combustion sources, which however was specific to that study and not utilized in subsequent spatial mapping of emissions. Studies in the UK and Norway have also cast doubt on the accuracy of spatial distributions of emissions (Ots et al., 2016; López-Aparicio et al., 2017), which inevitably causes problems for modeling. Compounding the difficulties, different SOA schemes give different answers, as we explored in detail in Bergström et al. (2012). However, sensitivity tests performed as part of the studies by Bergström et al. (2012), Simpson et al. (2012), and Denier van der Gon et al. (2015) have shown that differences in OM caused by emissions assumptions are larger than those caused by, e.g., volatility assumptions. We have used two sets of assumptions (base case and DT+IVOC) in our work, which we believe span a reasonable range of possibilities. Given these difficulties, it is not surprising that model results can show large scatter compared to measured values. However, we have also shown in several studies (Bergström et al., 2012; Genberg et al., 2011, 2013; Denier van der Gon et al., 2015) that the model results do improve compared to observations when condensables are treated in a more uniform matter, and the current study is consistent with this.
5.1 Carbonaceous aerosol from fossil-fuel sources and biomass burning
Fossil-fuel combustion was the major source of EC at all sites in fall, accounting for 6 % to 22 % of TCp, whereas EC from biomass burning was <8 % at all sites. The influence of ECff was particularly pronounced at the sites Montelibretti (22 %) and Lille Valby (21 %), which for Montelibretti could be due to the proximity of the Rome metropolitan area, with 3.7 million inhabitants. Lille Valby is a semi-rural site, and thus could be more influenced by, e.g., vehicular particulate emissions. Fossil-fuel combustion continued to be the most important source of EC in winter/spring for the five northernmost sites, whereas there was a shift towards biomass burning for the four southernmost sites. The relative contribution of ECbb and ECff to TCp in winter/spring was ≤10 %, except at the sites Lille Valby, Melpitz, and Birkenes, which experienced relative contributions of ECff exceeding 10 %. ECbb was a more abundant fraction of TCp in winter/spring compared to fall at all sites. The picture was less consistent for ECff, with a higher relative contribution in fall at the four southernmost sites and for Lille Valby and a higher fraction in winter/spring for the four other sites.
Biomass burning was the major anthropogenic source of OC at most sites in fall, accounting from 5 % to 36 % of TCp, whereas OC from fossil fuel ranged from 8 % to 21 %. The exceptions were Birkenes and Mace Head for which OCff dominated with 16 % and 21 %, respectively. At Montelibretti, OCbb and OCff made equally large contributions to TCp (18 % each).
In winter/spring, biomass burning was the major anthropogenic source of OC at all sites except at Mace Head, constituting 11 % to 46 % of TCp, whereas the range for OCff was 10 % to 23 %. OCbb was more abundant in winter/spring compared to fall for all sites but Mace Head, whereas there was no consistent pattern observed for OCff. There was a general tendency that OCbb became less abundant along a south–north transect, as seen for ECbb.
Biomass burning had a pronounced influence at most sites already in the first week of sampling in fall (17–24 September): ECbb and OCbb contributed a substantial 57 % of TCp at K-puszta and 54 % at Ispra and 34 % and 37 % at Melpitz and Payerne, respectively, whereas it ranged from 21 % to 29 % for the sites Mace Head, Košetice, and Lille Valby. Birkenes was the only site where wood burning made a minor contribution (6 %) in this first week. Model calculations suggest that wild and agricultural fires were of minor importance at all sites for the week, with the highest model-calculated concentration (0.02 µg C m−3) at Ispra and Lille Valby, corresponding to 3 % and 5 % of the modeled TCbb (see Sect. 5.2). Hence, residential wood burning appears to be the source of ECbb and OCbb, although given the uncertainties of emission estimates for wild and agricultural fires, such sources cannot be ruled out. The mean temperature during the first week of sampling was not noticeably lower than for the rest of the sampling period. Still, it was the week with the lowest mean temperature for the sites K-puszta, Payerne, and Košetice.
5.2 Wild and agricultural fire contribution
Wild and agricultural fires are major sources of carbonaceous aerosol (Bond et al., 2004) but with large regional, seasonal, and annual differences in emissions and occurrence (Hao et al., 2016; Korontzi et al., 2006). Agricultural waste burning is banned in most European countries; nevertheless, remote sensing data show such fire events in several countries, including those with a ban (Korontzi et al., 2006), and they appear to be particularly frequent in eastern Europe (e.g., Belarus and the Ukraine), in western parts of Russia, and in Central Asia. In most cases when natural vegetation catches fire in Europe, this is due to human activity (Winiwarter et al., 1999).
Incidences of wild and agricultural fires that severely deteriorate air quality in large parts of Europe are regularly reported, e.g., by Yttri et al. (2007a) for 2002, by Stohl et al. (2007) for 2006, and Diapouli et al. (2014) for 2010. The two periods discussed in the present study partly coincide with the time when concentrations from wild and agricultural fires peak in Europe (Korontzi et al., 2006). Levoglucosan by itself cannot differentiate between emissions from residential wood burning and wild and agricultural fires. Hence, we have used modeled concentrations to address the relative contribution of TC from wild fires and agricultural fires (TCwf) to the sum of TC from residential wood burning (TCbb) and TCwf for the two sampling periods.
There was an influence from wild and agricultural fires at all sites, with a higher mean contribution in fall (TCwf=0.05 µg C m−3), corresponding to 9 %–16 % (for base case or DT+IVOC) of modeled TCbb, than in winter/spring (TCwf=0.015 µg C m−3), corresponding to 2 %–4 % of modeled TCbb. TCwf was also typically low on a weekly basis, but for the last week of sampling in fall, a noticeable contribution was calculated for Ispra (34 %), K-puszta (31 %), and Montelibretti (16 %).
The major conclusion to be drawn from these results is that the model predicts that wild and agricultural fires make minor contributions to the biomass burning carbonaceous aerosol at the sites addressed and that residential wood burning is the major source.
5.3 Remaining non-fossil sources of organic carbon
Remaining non-fossil sources of OC (OCrnf) are typically associated with biogenic secondary organic aerosol (OCBSOA) and primary biological aerosol particles (OCPBAP); however there are anthropogenic sources of modern carbon as well, as discussed in detail by Yttri et al. (2011a). Here, we discuss the results obtained for OCrnf as if natural sources are dominating.
The OCrnf level varied more widely in winter (0.1–2.2 µg C m−3) than in fall (0.6–3.0 µg C m−3) (Fig. 2) and corresponds well with levels reported for the European rural background environment (Gelencsér et al., 2007; Genberg et al., 2011; Yttri et al., 2011a, b). The spatial distribution of OCrnf equaled that of OCp, with high concentrations at the southernmost sites and decreasing levels along a south–north transect.
OCrnf levels were higher in fall compared to winter/spring for all sites, but the difference varied between minor at most sites, moderate at the continental sites Košetice and Payerne, and substantial at the Norwegian site Birkenes. Studies consistently point towards BSOA as the major contributor to OCrnf in Europe (e.g., Simpson et al., 2007; Bessagnet et al., 2008; Yttri et al., 2011a); e.g., Gelencsér et al. (2007) showed that BSOA in PM2.5 was 1.6–12 times higher in summer than in winter for six European rural background sites. Hence, the observed pattern could partly be explained by a higher formation rate of BSOA in fall, propelled by larger emissions of BSOA precursors and a higher ambient temperature (see Table 1 ambient temperature values). In the present study, PM10 filter samples were collected (except at Mace Head, where PM2.5 was collected). Consequently, primary biological aerosol particles (PBAPs), typically residing in the coarse fraction of PM10 (e.g., Yttri et al., 2007b; Kourtchev et al., 2009; Bozzetti et al., 2016), could contribute to OCrnf as well. In Scandinavia, PBAPs peak in summer and fall, reflecting the vegetative season and the absence/presence of a snow cover (Yttri et al., 2007a, b, 2011a, b), and summertime OCPBAP concentrations (PM10), being 7–8 times higher than in winter, have been reported for two Norwegian sites (Yttri et al., 2011a). In continental Europe, the vegetative season is longer than in Scandinavia and a permanent snow cover is associated with high-altitude regions and rare occasions, lasting for short periods, in low-altitude regions. Hence, one could speculate that there is a PBAP emission flux in continental Europe in the heating season, which is comparatively larger than that observed in Scandinavia. We find support of this view in the study by Waked et al. (2014), which showed a tail of PBAPs and episodes with high PBAP concentrations in winter for an urban background site in northern France. Knowledge of PBAP concentrations in Europe is limited; thus we can only speculate about how much of OCrnf in the present study is due to PBAPs. A noticeable 20 %–32 % contribution of OCPBAP to TCp was found at four Nordic rural background sites in late summer (Yttri et al., 2011b). Similar figures (OC from primary biogenics constituting up to 33 % of OC in PM10) were reported for the densely populated region of Berlin in northeastern Germany (Wagener et al., 2012) in late summer and fall. Gelencsér et al. (2007) and Gilardoni et al. (2011) both reported levels of OC associated with PBAPs for an entire year for the European rural background environment, finding that the relative contribution to total carbon was <5 % in summer and <8 % in winter. However, both studies relied on PM2.5 samples, likely excluding the majority of PBAPs. Further, Gelencsér et al. (2007) accounted for plant debris only when measuring cellulose, whereas Gilardoni et al. (2011) only accounted for fungal spores, measuring arabitol and mannitol. Waked et al. (2014) found that 17 % of the OC was attributed to OCPBAP on an annual basis for an urban background site, with substantially higher concentrations in summer (37 %) and fall (20 %) compared to winter (7 %) and spring (6 %). At the rural background site Payerne, Bozzetti et al. (2016) found that PBAPs, mainly from plant debris, equaled the contribution of SOA to organic matter in PM10 in summer.
The non-fossil signal was typically most pronounced in fall, with the highest relative share (52 %–69 %) observed for the two low loading sites situated on the outskirts of Europe (Birkenes and Mace Head) and the lowest for the highest loading site, Ispra (23 %). Note that OCrnf obtained for Mace Head is a conservative estimate, as PBAPs typically residing in the coarse fraction are not accounted for, as PM2.5 filter samples were collected at this site. Nevertheless, OCrnf was the major fraction at Mace Head, regardless of season; hence, our conclusions would not change if the filter samples had PM10 cutoff size. A pronounced non-fossil signal (52 %–54 %) was seen for the continental sites Košetice and Payerne as well, whereas the relative share ranged between 38 % and 48 % for the remaining sites. Non-fossil OC was by far the major source of OC at all sites in fall, except at Ispra, for which biomass burning dominated. The non-fossil signal decreased, or remained unchanged, for all but one site going from fall to winter/spring, but the reduction was substantial only at the Norwegian site Birkenes (a factor of ∼2), at Payerne and Košetice (a factor of 1.5–1.7), and at Melpitz (a factor of 1.5). Still, non-fossil OC was the major source of OC at five sites, even in winter/spring, K-puszta, Košetice, Lille Valby, Mace Head, and Birkenes. It has been suggested that increased condensation due to lower temperatures could be an efficient way of forming BSOA, even in winter (Simpson et al., 2007). It is however difficult to argue for such a hypothesis only by looking at the observed ambient air temperatures during the winter/spring period. Another possibility is that some of the remaining non-fossil OC may be secondary organic aerosol formed from volatile or semi-volatile OC emitted from wood burning. OCbb determined based on levoglucosan may not include all SOA formed after aging of the gas-phase emissions, even if the emission ratios were derived from ambient measurements and likely include condensed vapors and secondary products.
5.4 Natural versus anthropogenic sources of carbonaceous aerosol
In the current study, results obtained for OCrnf are discussed as if natural sources are dominating, despite the fact that anthropogenic sources can make a certain contribution, e.g., from cooking emissions and by anthropogenic enhancement of BSOA formation. EC and OC emitted from combustion of fossil fuel and biomass are considered entirely anthropogenic, as we define wild fires as anthropogenic.
In fall, the anthropogenic and natural influences were of comparable magnitude at most sites. Exceptions were Birkenes, with a clearly larger natural contribution (69 %), and Ispra, with a larger anthropogenic contribution (77 %), the latter affected by regional air pollution in the strongly polluted Po Valley region. For the other sites, the anthropogenic fraction ranged from 46 % to 62 % and from 38 % to 54 % for the natural fraction. Increased condensation due to lower temperatures can be an important source of BSOA in fall and winter, which could outweigh the effect of high temperature and increased terpene emissions in summer (Andersson-Sköld and Simpson, 2001; Simpson et al., 2007). Further, PBAPs can make a pronounced contribution in fall both in Scandinavia (Yttri et al., 2007a, b, 2011a, b) and in continental Europe (Waked et al., 2014; Bozzetti et al., 2016), and the fall peak of the northeastern Atlantic Ocean phytoalgal bloom takes place during the period in question, likely contributing with marine PBAPs at Mace Head (Ceburnis et al., 2011).
In winter/spring, anthropogenic sources dominated at all sites (60 %–78 % anthropogenic), except for Mace Head (37 %). Ispra also had the most pronounced anthropogenic contribution of all sites in winter/spring (78 %), and it was largely unchanged from that observed in fall. Three of the four sites experiencing a high natural influence in fall (Birkenes, Košetice, and Payerne) saw a major increase in the anthropogenic contribution going from fall to winter/spring. This was attributed to a substantial reduction in natural sources, accompanied by an increase in the anthropogenic sources, being primarily biomass burning at Payerne and Birkenes and fossil-fuel sources at Košetice. Residential wood burning is considered a decentralized source in Europe, and emissions from local sources can be substantial in winter (Szidat et al., 2007). A certain local contribution could also be speculated for Košetice, as small coal-fired ovens are still common in rural areas in eastern Europe (Spindler et al., 2012).
5.5 Modeling contributions from biomass burning
The EMEP MSC-W model was run with two different emission and SOA modeling setups (a base case and DT+IVOC) in order to reflect (to some extent) the very large uncertainties in both emissions and atmospheric processing of the primary organic aerosol (POA) (see Sect. 2.7). The model results were compared with that of the LHS analysis discussed above. In the following, model results that are within the 10th–90th percentile range of the LHS analysis are considered as being in agreement with the measurements. Results outside this (fairly wide) concentration range are considered as under- or overestimations.
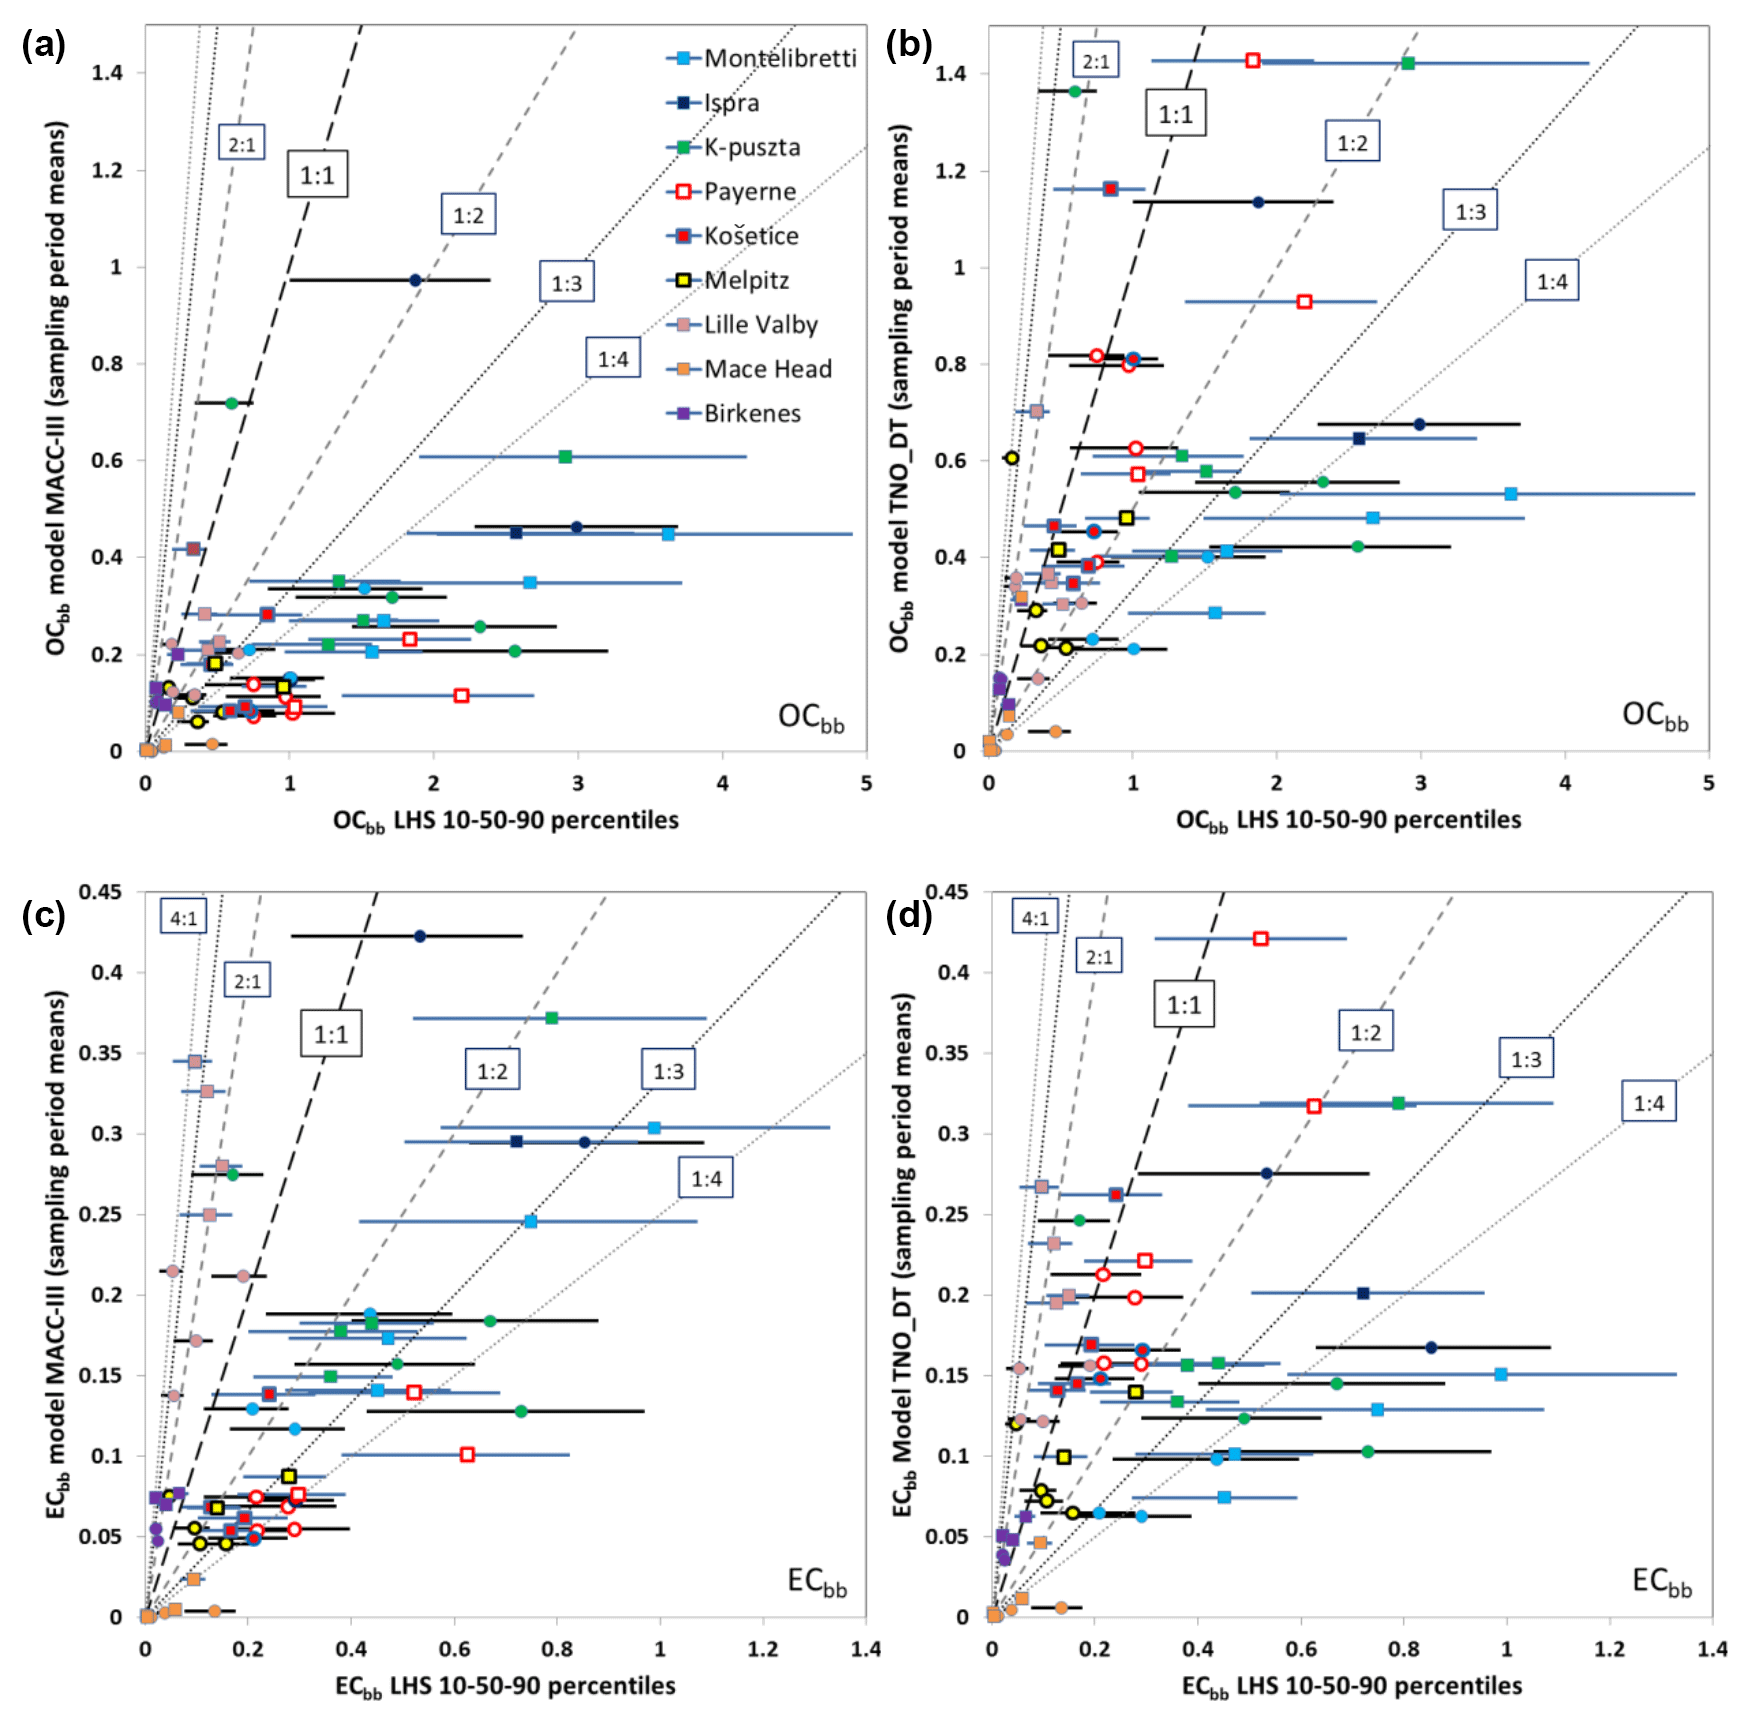
Figure 3Comparison of modeled and measurement-/LHS-based concentrations of organic and elemental carbon from biomass burning emissions (OCbb and ECbb). Panels (a) and (c) show model-calculated OCbb (a) and ECbb (c) with the base-case model setup, and panels (b) and (d) show the corresponding results using the DT+IVOC model setup. Each point (and horizontal line) represents the results from a single site and week. The lines illustrate the range from the LHS 10th percentile to the 90th percentile, and the circles and squares show the LHS median values. Circles and black horizontal lines show results for fall 2008, and squares and blue lines show results from winter/spring 2009. The different sites are identified as follows: light blue – Montelibretti; dark blue – Ispra; green – K-puszta; white with red border – Payerne; red with blue border – Košetice; yellow with black border – Melpitz; pink – Lille Valby; orange – Mace Head; purple – Birkenes. Units: µg C m−3.
Modeled OCbb and ECbb concentrations were compared to the LHS source apportionment results for each sample individually in Fig. 3 and as averages over the measurement periods in Table 4. The base-case model simulations underestimated OCbb severely at most sites (Fig. 3a). The only exception was Birkenes, for which the model slightly overestimated the LHS-derived estimates (the modeled OCbb were within the LHS 10th–90th percentile range for 3 out of 5 weeks, whereas 2 out of 5 weeks were overestimated). For the other sites, the mean underestimation of the LHS 10th percentile for OCbb ranged from −26 % at Lille Valby to −84 % at Payerne.
The model results for OCbb were clearly better with the DT+IVOC emission setup (Fig. 3b) than for the base case, at all sites except Birkenes and Lille Valby. For Košetice and Payerne, the modeled OCbb was within the LHS range for the majority of the samples, and the underestimation of OCbb was smaller than with the base case for Ispra, Montelibretti, K-puszta, and Melpitz. A few individual OCbb measurements were, however, clearly overestimated with the DT+IVOC setup (one sample each for Melpitz, K-puszta, and Lille Valby).
The results for ECbb roughly split in two groups for the base case (Fig. 3c): at Birkenes and Lille Valby, the ECbb concentrations were overestimated by the model most of the time; only for one sample at each site did the model ECbb fall within the LHS range. The average overestimation of the LHS 90th percentile was 69 % at Lille Valby and 43 % at Birkenes. At the other sites, ECbb was underestimated (with a few exceptions), with an average underestimation ranging from −34 % compared to the LHS 10th percentile at Melpitz to −84 % at Mace Head. For the two Italian sites the average underestimation was −38 %, whereas it was −39 % at K-puszta and Košetice and −60 % at Payerne.
The DT+IVOC model results were clearly better for ECbb, except for the Italian sites and K-puszta where the ECbb underestimation was larger due to lower emissions in the inventory of Denier van der Gon et al. (2015). ECbb was largely overestimated at the Scandinavian sites but not as much as for the base-case emissions. The modeled ECbb was within the 10th–90th percentile LHS range for five of the weeks at Košetice and Payerne using the DT+IVOC emissions, but there was still a tendency that levels were underestimated (one week was underestimated at Košetice, two at Payerne). For Melpitz the modeled ECbb was within the LHS range for 3 out of 6 weeks (2 weeks were underestimated and 1 overestimated).
The present comparison of modeled and LHS-derived biomass burning carbonaceous aerosol concentrations indicates that the base-case setup with the TNO MACC-III emission inventory, which is similar to official EMEP PM2.5 emissions estimates, likely underestimates emissions from residential wood burning substantially in large parts of Europe. This is in line with the findings of Denier van der Gon et al. (2015) and reflects that emissions are established following national practice that is inconsistent between countries. Note that the inventory POA emissions were distributed across different volatility classes for the DT+IVOC emissions, as for a typical VBS treatment, whereas we did not add IVOCs to the MACC-III emissions in our base case. Although the DT+IVOC emission setup with updated wood burning emissions and extra IVOCs improved the model results, large uncertainties still remain, and it cannot be excluded that wood burning emissions in some parts of Europe may be considerably larger than those estimated by Denier van der Gon et al. (2015).
5.6 Influence of long-range transport
The issue of long-range transport into Europe is important for some pollutants (especially ozone, e.g., Fiore et al., 2009, or carbon monoxide from forest fires, e.g., Forster et al., 2001). However, many years of measurements and modeling analyses support our assumption that the most likely sources of carbonaceous aerosols in our study are from Europe. For example, many years of analysis of aerosols at Mace Head on the west coast of Ireland give little evidence for aerosol transport from North America, with most organic matter (OM) assigned to marine or European sources (O'Dowd et al., 2014). Emissions from major wildfires in eastern Europe explained the highest OC and EC concentrations at Birkenes in 2001–2015 as did episodes of air pollution carrying the hallmark of long-range transport, i.e., elevated levels of secondary inorganic aerosol and air masses transported at low altitude over major emission regions in central and eastern Europe (Yttri et al., 2019). Meanwhile, elevated concentrations of equivalent black carbon (eBC) from fossil-fuel sources (eBCff) and from biomass burning (eBCff) at Birkenes were associated exclusively with source regions in continental Europe (Yttri et al., 2019). Consequently, long-range transport is of major importance for elevated concentrations of carbonaceous aerosol at Birkenes, but sources are confined to the European continent.
Further, modeling by Simpson et al. (2007) showed that observed levels of OC and EC could be reproduced quite well over a 2-year period (CARBOSOL study) at two sites on the western coast of Europe, Mace Head in Ireland, and Aveiro in Portugal, with no suggestion of missing background sources in the model. Tsyro et al. (2007) examined the EC concentrations for the same study and showed that European forest fires only had significant impacts for a few samples. We note that the modeling domain we use is rather large, covering all of Europe from approximately 40∘ W to 60∘ E and 30–90∘ N, such that we capture all major sources and air mass circulations within several days of transport. Global model results from the EMEP model (e.g., McFiggans et al., 2019) also suggest that OM generated over North America only makes a small contribution to European particulate matter levels.
Source apportionment of carbonaceous aerosol was conducted at nine European rural background sites for a fall period in 2008 and a winter/spring period in 2009. The approach separated the carbonaceous aerosol into a natural and an anthropogenic fraction and divided the anthropogenic fraction into fossil fuel and biomass burning origin, which is a prerequisite for targeted abatement strategies. The fraction apportioned to biomass burning was compared with calculated concentrations using the EMEP model, applying a base case and an alternative emission set up with intermediate volatility compounds (IVOCs).
The total carbonaceous aerosol concentration, as well as the carbonaceous aerosol apportioned to biomass burning, fossil-fuel, and natural sources, decreased from south to north. Natural sources typically accounted for a larger fraction of the carbonaceous aerosol in fall compared to winter/spring, likely because the fall sampling period partly took place in the vegetative season. The seasonal differences of the natural sources varied from minor at most sites, moderate at two of the continental sites, to substantial at the northernmost Scandinavian site. Biomass burning aerosol had an opposite seasonal behavior to that of natural sources, following the increased emissions from residential wood burning in the heating season. No consistent seasonal pattern was observed for fossil-fuel aerosol and their contribution to the carbonaceous aerosol, possibly because domestic heating is a minor source of fossil-fuel carbon compared to, e.g., vehicular traffic.
Anthropogenic sources (60 %–78 %) dominated at all but the most remote site in winter/spring, and residential wood burning (36 %–56 %) was typically the major anthropogenic source of TC. In fall, anthropogenic and natural influence were of comparable magnitude at most sites, except at Birkenes (69 % natural) and Ispra (77 % anthropogenic). Biomass burning was the major anthropogenic source at central European sites in fall (29 %–44 %), whereas fossil fuel dominated at the southernmost (40 %) and the three northernmost sites (29 %–37 %).
Model-calculated concentrations of carbonaceous aerosol from biomass burning were severely underestimated, except for the Scandinavian sites, when using the base-case MACC-III emission inventory. Model results improved when an alternative bottom-up approach with added IVOCs was used. However, OCbb and ECbb levels were still substantially underestimated at the southernmost sites.
The current study shows that natural sources are major contributors to the carbonaceous aerosol at background sites in Europe even in fall and in winter/spring and that residential wood burning emissions can be equally as large as or larger than those of fossil-fuel sources, depending on season and region. Although the results of this particular study are for two relatively short periods, the general conclusions are consistent with those from multiple studies, which have pointed out the problems with European residential wood combustion (RWC) inventories for both OC and EC (Simpson et al., 2007; Genberg et al., 2011, 2013; Bergström et al., 2012; Denier van der Gon et al., 2015). The conclusions of the current study complement and reinforce these earlier results. Our combined results suggest that residential wood burning emissions are poorly constrained for large parts of Europe and that the need to improve emission inventories is obvious, with harmonized emission factors between countries likely being the most important step to improve model calculations. Revised wood burning emissions will also improve model predictions of PM2.5 concentrations in Europe, particularly in the heating season. EMEP Intensive Measurement Periods are essential for the real-world evaluation of model results, especially when the underlying emission data are so uncertain, as are future EMEP Intensive Measurement Periods focused on the wood burning source.
Underlying research data can be accessed by request to the corresponding author.
The Montelibretti EMEP station is situated in central Italy (42∘06′ N, 12∘38′ E; 48 m a.s.l.), 45 km from the coast of the Tyrrhenian Sea. Most of the land surrounding the station is meadows and low-intensity agricultural areas. The nearest village (Monterotondo, 30 000 inhabitants) is situated approximately 5 km from the station, whereas the city of Rome lies 20 km to the southwest. Transport of air masses from the urban area of Rome is typically associated with a sea breeze taking place in the early afternoon.
The Ispra station (45∘49′ N, 8∘38′ E; 209 m a.s.l.) is situated on the edge of the Po Valley in the northwestern part of Italy and is representative of the regional background of this densely populated part of Italy. Major anthropogenic emission sources are situated >10 km from the site, with the city of Milan, 60 km to the southeast, being the most pronounced one. According to Henne et al. (2010), Ispra is categorized as a typical background site in an environment generally strongly affected by anthropogenic emissions.
The Payerne measurement station (46∘48′ N, 6∘56′ E; 489 m a.s.l.) is part of the Swiss National Air Pollution Monitoring Network as well as the EMEP monitoring network and is regarded as a rural site. The station is located 1 km southeast of the small town of Payerne (8000 inhabitants). The site is surrounded by agricultural land (grassland and crops), forests, and small villages. The nearest larger cities are Fribourg (15 km east, 35 000 inhabitants), Bern (40 km northeast, 125 000 inhabitants), and Lausanne (40 km southwest, 120 000 inhabitants).
The K-puszta station (46∘58′ N, 19∘33′ E; 130 m a.s.l.) is situated in a forest clearing on the Great Hungarian Plain and is representative of the central eastern European regional background environment. The vegetation is dominated by coniferous wood (60 %), but deciduous wood (30 %) and grassland are also present. The nearest city (Kecskemét) is situated ca. 15 km to the SE of K-puszta. The station is part of the Global Atmospheric Watch (GAW) network and the European Monitoring and Evaluation Programme (EMEP) and is also a EUSAAR supersite. The climate is typically continental with low temperatures in winter, mild temperatures in spring and fall, and hot and sunny weather in summer.
The Košetice observatory (49∘35′ N, 15∘05′ E; 534 m a.s.l.) is a joint EMEP and GAW site located in the Czech-Moravian Highlands, approximately 80 km southeast of Prague. Air samples collected at the observatory represent the background level of air quality in the Czech Republic. Forests dominated by conifer trees account for approximately 50 % of the land use in the vicinity of the site; the remaining 50 % is attributed to meadow (25 %) and agricultural areas (25 %). The nearest city (Pelhřimov, 15 000 inhabitants) is located 25 km south of the station. The prevailing wind direction is westerly.
The Melpitz research station (51∘32′ N, 12∘54′ E; 87 m a.s.l.) is located in a flat meadow surrounded by agricultural land near the river Elbe. The major city of Leipzig is situated 41 km to the southwest of the site. Forested areas are located no closer than 1 km from the site. The two dominating wind directions are southwest to west, which brings air masses from the Atlantic that pass across western Europe, and east to southeast, which brings air masses from source regions such as Poland, Belarus, Ukraine, and the north of the Czech Republic.
The Mace Head atmospheric research station (53∘19′ N, 9∘53′ W; 15 m a.s.l.) is a GAW supersite situated on the west coast of Ireland, facing the North Atlantic Ocean. The station is located 100 m from the coastline and is surrounded by bare land (rocks, grass, and peat bog). A few scattered single houses are located at a distance of 1 km or further away. The nearest city (Galway, 80 000 inhabitants) is located 60 km to the east/southeast of the station. The site experiences clean marine air masses from the western sector nearly 50 % of the time, whereas polluted air masses are associated with atmospheric transport from the UK and continental Europe.
Lille Valby (55∘41′ N, 12∘07′ E; 12 m a.s.l.) is a semi-rural monitoring station in the Sjælland region of Denmark, which has a humid continental climate. The surrounding area is characterized by agricultural land, small villages, and the Roskilde Fjord (1 km west of the monitoring site). The station is located 30 km to the west of Copenhagen (1.2 million inhabitants) and 7 km northeast of central Roskilde (46 000 inhabitants). The nearest major road (A6) is located about 800 m west of the station.
The Birkenes atmospheric research station (58∘23′ N, 8∘15′ E; 190 m a.s.l.) is a joint supersite for EMEP and GAW situated approximately 20 km from the Skagerrak coast in southern Norway. The station is located in the boreal forest, with mixed conifer and deciduous trees accounting for 65 % of the land use in the vicinity of the site; the remaining 35 % is attributed to meadow (10 %), low-intensity agricultural areas (10 %), and freshwater lakes (15 %). The nearest city (Kristiansand, 65 000 inhabitants) is located 25 km south/southwest of the station and is known to have minor or even negligible influence on the air quality at the site.
KEY was responsible for the main design, coordination of the study, the synthesis of the results, the writing of most of the paper, the centralized analysis of levoglucosan, and provision of OC∕EC data for Birkenes. DS did the Latin hypercube sampling (LHS), as well as the EMEP modeling part together with RB. DS wrote the text on LHS, and DS and RB together wrote the text on the modeling, as well as thoroughly reviewing the paper. GK wrote the introduction, provided OC∕EC data for K-puszta, and wrote the description of the site, as well as thoroughly reviewing the paper. SS and YLZ were responsible for and performed the centralized 14C analysis, wrote the text on this topic, and thoroughly reviewed the paper. WA and ASHP contributed to the coordination of the study and thoroughly reviewed the paper. CH provided OC∕EC data for Payerne, wrote the description of the site, and thoroughly reviewed the paper. CP provided OC∕EC data for Montelibretti, wrote the description of the site, and thoroughly reviewed the paper. DC provided OC∕EC data for Mace Head, wrote the description of the site, and thoroughly reviewed the paper. GS provided OC∕EC data for Melpitz, wrote the description of the site, and thoroughly reviewed the paper. JPP provided OC∕EC data for Ispra, wrote the description of the site, and thoroughly reviewed the paper. JKN provided OC∕EC data for Lille Valby and wrote the description of the site. MV provided OC∕EC data for Košetice and wrote the description of the site. SE and IP thoroughly reviewed the paper.
The authors declare that they have no conflict of interest.
This work was supported by the Co-operative Programme for Monitoring and Evaluation of the Long-range Transmission of Air pollutants in Europe (EMEP) under UNECE, the European Union Seventh Framework Programme (FP7/2007–2013) under the ACTRIS project (grant agreement no. 262254), and the European Union Seventh Framework Programme (FP7/2007–2013) under the ECLIPSE project (grant agreement no. 282688). Computer time for EMEP model runs was supported by the Research Council of Norway through the NOTUR project EMEP (NN2890K), and this work was also supported by the Swedish Strategic Research Project MERGE (http://www.merge.lu.se; last access: 23 March 2019). We are grateful to the Laboratory of Ion Beam Physics of ETH Zurich for providing the accelerator mass spectrometer MICADAS for 14C measurements. We thank ECMWF and http://met.no (last access: 23 March 2019) for granting access to ECMWF analysis data. Hugo Denier van der Gon and Jeroen Kuenen from TNO are acknowledged for useful discussions and data concerning OM emissions.
This paper was edited by James Allan and reviewed by two anonymous referees.
Aas, W., Tsyro, S., Bieber, E., Bergström, R., Ceburnis, D., Ellermann, T., Fagerli, H., Frölich, M., Gehrig, R., Makkonen, U., Nemitz, E., Otjes, R., Perez, N., Perrino, C., Prévôt, A. S. H., Putaud, J.-P., Simpson, D., Spindler, G., Vana, M., and Yttri, K. E.: Lessons learnt from the first EMEP intensive measurement periods, Atmos. Chem. Phys., 12, 8073–8094, https://doi.org/10.5194/acp-12-8073-2012, 2012.
Andersson-Sköld, Y. and Simpson, D.: Secondary organic aerosol formation in Northern Europe: a model study, J. Geophys. Res., 106, 7357–7374, 2001.
Andreae, M. O. and Ramanathan, V.: Climate's dark forcings, Science, 340, 280–281, 2013.
Bauer, H., Schueller, E., Weinke, G., Berger, A., Hitzenberger, R., Marr, I. L., and Puxbaum, H.: Significant contributions of fungal spores to the organic carbon and to the aerosol mass balance of the urban atmospheric aerosol, Atmos. Environ., 42, 5542–5549, 2008.
Bell, M. L., Ebisu, K., Peng, R. D., Samet, J. M., and Dominici, F.: Hospital Admissions and Chemical Composition of Fine Particle Air Pollution, Am. J. Resp. Crit. Care, 179, 1115–1120, https://doi.org/10.1164/rccm.200808-1240OC, 2009.
Bergström, R., Denier van der Gon, H. A. C., Prévôt, A. S. H., Yttri, K. E., and Simpson, D.: Modelling of organic aerosols over Europe (2002–2007) using a volatility basis set (VBS) framework: application of different assumptions regarding the formation of secondary organic aerosol, Atmos. Chem. Phys., 12, 8499–8527, https://doi.org/10.5194/acp-12-8499-2012, 2012.
Bergström, R., Hallquist, M., Simpson, D., Wildt, J., and Mentel, T. F.: Biotic stress: a significant contributor to organic aerosol in Europe?, Atmos. Chem. Phys., 14, 13643–13660, https://doi.org/10.5194/acp-14-13643-2014, 2014.
Bessagnet, B., Menut, L., Curci, G., Hodzic, A., Guillaume, B., Liousse, C., Moukhtar, S., Pun, B., Seigneur, C., and Schulz, M.: Regional modeling of carbonaceous aerosols over Europe-focus on secondary organic aerosols, J. Atmos. Chem., 61, 175–202, 2008.
Birch, M. E. and Cary, R. A.: Elemental carbon-based method for monitoring occupational exposures to particulate diesel exhaust, Aerosol Sci. Tech., 25, 221–241, 1996.
Bond, T. C., Streets, D. G., Yarber, K. F., Nelson, S. M., Woo, J.-H., and. Klimont, Z: A technology-based global inventory of black and organic carbon emissions from combustion, J. Geophys. Res., 109, D14203, https://doi.org/10.1029/2003JD003697, 2004.
Bozzetti, C., Daellenbach, K. R., Hueglin, C., Fermo, P., Sciare, J., Kasper-Giebl, A., Mazar, Y., Abbaszade, G., El Kazzi, M., Gonzalez, R., Shuster-Meiseles, T., Flasch, M., Wolf, R., Křepelová, A., Canonaco, F., Schnelle-Kreis, J., Slowik, J. G., Zimmermann, R., Rudich, Y., Baltensperger, U., El Haddad, I., and Prévôt, A. S. H.: Size-resolved identification, characterization, and quantification of primary biological organic aerosol at a European rural site, Environ. Sci. Technol., 50, 3425–3434, 2016.
Buchholz, B. A., Fallon, S. J., Zermeno, P., Bench, G., and Schichtel, B. A.,: Anomalous elevated radiocarbon measurements of PM2.5, Nucl. Instrum. Methods Phys. Res. B, 294, 631–635, https://doi.org/10.1016/j.nimb.2012.05.021, 2013.
Cassee, F. R., Heroux, M.-E., Gerlofs-Nijland, M. E., and Kelly, F. J.: Particulate matter beyond mass: recent health evidence on the role of fractions, chemical constituents and sources of emission, Inhal Toxicol., 14, 802–812, https://doi.org/10.3109/08958378.2013.850127, 2013.
Ceburnis, D., Garbaras, A., Szidat, S., Rinaldi, M., Fahrni, S., Perron, N., Wacker, L., Leinert, S., Remeikis, V., Facchini, M. C., Prevot, A. S. H., Jennings, S. G., Ramonet, M., and O'Dowd, C. D.: Quantification of the carbonaceous matter origin in submicron marine aerosol by 13C and 14C isotope analysis, Atmos. Chem. Phys., 11, 8593–8606, https://doi.org/10.5194/acp-11-8593-2011, 2011.
Cavalli, F., Viana, M., Yttri, K. E., Genberg, J., and Putaud, J.-P.: Toward a standardised thermal-optical protocol for measuring atmospheric organic and elemental carbon: the EUSAAR protocol, Atmos. Meas. Tech., 3, 79–89, https://doi.org/10.5194/amt-3-79-2010, 2010.
Ciarelli, G., El Haddad, I., Bruns, E., Aksoyoglu, S., Möhler, O., Baltensperger, U., and Prévôt, A. S. H.: Constraining a hybrid volatility basis-set model for aging of wood-burning emissions using smog chamber experiments: a box-model study based on the VBS scheme of the CAMx model (v5.40), Geosci. Model Dev., 10, 2303–2320, https://doi.org/10.5194/gmd-10-2303-2017, 2017.
Crippa, M., Canonaco, F., Lanz, V. A., Äijälä, M., Allan, J. D., Carbone, S., Capes, G., Ceburnis, D., Dall'Osto, M., Day, D. A., DeCarlo, P. F., Ehn, M., Eriksson, A., Freney, E., Hildebrandt Ruiz, L., Hillamo, R., Jimenez, J. L., Junninen, H., Kiendler-Scharr, A., Kortelainen, A.-M., Kulmala, M., Laaksonen, A., Mensah, A. A., Mohr, C., Nemitz, E., O'Dowd, C., Ovadnevaite, J., Pandis, S. N., Petäjä, T., Poulain, L., Saarikoski, S., Sellegri, K., Swietlicki, E., Tiitta, P., Worsnop, D. R., Baltensperger, U., and Prévôt, A. S. H.: Organic aerosol components derived from 25 AMS data sets across Europe using a consistent ME-2 based source apportionment approach, Atmos. Chem. Phys., 14, 6159–6176, https://doi.org/10.5194/acp-14-6159-2014, 2014.
Crutzen, P. J. and Andreae, M. O.: Biomass burning in the tropics: impact on atmospheric chemistry and biogeochemical cycles, Science, 250, 1669–1678, 1990.
Denier van der Gon, H. A. C., Bergström, R., Fountoukis, C., Johansson, C., Pandis, S. N., Simpson, D., and Visschedijk, A. J. H.: Particulate emissions from residential wood combustion in Europe – revised estimates and an evaluation, Atmos. Chem. Phys., 15, 6503–6519, https://doi.org/10.5194/acp-15-6503-2015, 2015.
Diapouli, E., Popovicheva, O., Kistler, M., Vratolis, S, Persiantseva, N., Timofeev M., Kasper-Giebl, A., and Eleftheriadis, K.: Physicochemical characterization of aged biomass burning aerosol after long-range transport to Greece from large scale wildfires in Russia and surrounding regions, Summer 2010, Atmos. Environ., 96, 393–404, 2014.
Dore, A. J., Carslaw, D. C., Braban, C., Cain, M., Chemel, C., Conolly, C., Derwent, R. G., Griffiths, S. J., Hall, J., Hayman, G., Lawrence, S., Metcalfe, S. E., Redington, A., Simpson, D., Sutton, M. A., Sutton, P., Tang, Y. S., Vieno, M., Werner, M., and Whyatt, J. D.: Evaluation of the performance of different atmospheric chemical transport models and inter-comparison of nitrogen and sulphur deposition estimates for the UK, Atmos. Environ., 119, 131–143, 2015.
Dye, C. and Yttri, K. E.: Determination of monosaccharide anhydrides in atmospheric aerosols by use of high-resolution mass spectrometry combined with high performance liquid chromatography, Anal. Chem., 77, 1853–1858, 2005.
Elsasser, M., Crippa, M., Orasche, J., DeCarlo, P. F., Oster, M., Pitz, M., Cyrys, J., Gustafson, T. L., Pettersson, J. B. C., Schnelle-Kreis, J., Prévôt, A. S. H., and Zimmermann, R.: Organic molecular markers and signature from wood combustion particles in winter ambient aerosols: aerosol mass spectrometer (AMS) and high time-resolved GC-MS measurements in Augsburg, Germany, Atmos. Chem. Phys., 12, 6113–6128, https://doi.org/10.5194/acp-12-6113-2012, 2012.
Fahrni, S. M., Gäggeler, H. W., Hajdas, I., Ruff, M., Szidat, S., and Wacker, L.: Direct measurements of small 14C samples after oxidation in quartz tubes, Nucl. Instrum. Meth. Phys. Res. B., 268, 787–789, https://doi.org/10.1016/j.nimb.2009.10.031, 2010.
Fiore, A., Dentener, F., Wild, O., Cuvelier, C., Schultz, M., Textor, C., Schulz, M., Atherton, C., Bergmann, D., Bey, I., Carmichael, G., Doherty, R., Duncan, B., Faluvegi, G., Folberth, G., Garcia Vivanco, M., Gauss, M., Gong, S., Hauglustaine, D., Hess, P., Holloway, T., Horowitz, L., Isaksen, I., Jacob, D., Jonson, J., Kaminski, J., keating , T., Lupu, A., MacKenzie, I., Marmer, E., Montanaro, V., Park, R., Pringle, K., Pyle, J., Sanderson, M., Schroeder, S., Shindell, D., Stevenson, D., Szopa, S., Van Dingenen, R., Wind, P., Wojcik, G., Wu, S., Zeng, G., and Zuber, A.: Multi-model estimates of intercontinental source-receptor relationships for ozone pollution, J. Geophys. Res., 114, D04301, https://doi.org/10.1029/2008JD010816, 2009.
Forster, C., Wandinger, U., Wotawa, G., James, P., Mattis, I., Althausen, D., Simmonds, P., O'Doherty, S., Jennings, S. G., Kleefeld, C., Schneider, J., Trickl, T., Kreipl, S., Jager, H., and Stohl, A.: Transport of boreal forest fire emissions from Canada to Europe, J. Geophys. Res., 106, 22887–22906, 2001.
Fuller, G. W., Tremper, A. H., Baker, T. D., Yttri, K. E., and Butterfield, D.: Contribution of wood burning to PM10 in London, Atmos. Environ., 87, 87–94, https://doi.org/10.1016/j.atmosenv.2013.12.037, 2014.
Gelencsér, A.: Carbonaceous Aerosol, Atmospheric and Oceanographic Science Library Series, vol. 30, Springer, New York, USA, 2004.
Gelencsér, A., May, B., Simpson, D., Sánchez-Ochoa, A., Kasper-Giebl, A., Puxbaum, H., Caseiro, A., Pio, C., and Legrand, M.: Source apportionment of PM2.5 organic aerosol over Europe: primary/secondary, natural/anthropogenic, fossil/biogenic origin, J. Geophys. Res., 112, D23S04, https://doi.org/10.1029/2006JD008094, 2007.
Genberg, J., Hyder, M., Stenström, K., Bergström, R., Simpson, D., Fors, E. O., Jönsson, J. Å., and Swietlicki, E.: Source apportionment of carbonaceous aerosol in southern Sweden, Atmos. Chem. Phys., 11, 11387–11400, https://doi.org/10.5194/acp-11-11387-2011, 2011.
Genberg, J., Denier van der Gon, H. A. C., Simpson, D., Swietlicki, E., Areskoug, H., Beddows, D., Ceburnis, D., Fiebig, M., Hansson, H. C., Harrison, R. M., Jennings, S. G., Saarikoski, S., Spindler, G., Visschedijk, A. J. H., Wiedensohler, A., Yttri, K. E., and Bergström, R.: Light-absorbing carbon in Europe – measurement and modelling, with a focus on residential wood combustion emissions, Atmos. Chem. Phys., 13, 8719–8738, https://doi.org/10.5194/acp-13-8719-2013, 2013.
Gianini, M. F. D., Fischer, A., Gehrig, R., Ulrich, A., Wichser, A., Piot, C., Besombes, J.-L., and Hueglin, C.: Sources of PM10 in Switzerland: an analysis for 2008/2009 and changes since 1998/1999, Atmos. Environ., 54, 149–158, 2012.
Gilardoni, S., Vignati, E., Cavalli, F., Putaud, J. P., Larsen, B. R., Karl, M., Stenström, K., Genberg, J., Henne, S., and Dentener, F.: Better constraints on sources of carbonaceous aerosols using a combined 14C – macro tracer analysis in a European rural background site, Atmos. Chem. Phys., 11, 5685–5700, https://doi.org/10.5194/acp-11-5685-2011, 2011.
Glasius, M., Hansen, A. M. K., Claeys, M., Henzing, J. S., Jedynska, A. D., Kasper-Giebl, A., Kistler, M., Kristensen, K., Martinsson, J., Maenhaut, W., Nøjgaard, J. K., Spindler, G., Stenström, K. E., Swietlicki, E., Szidat, S., Simpson, D., and Yttri, K. E.: Composition and sources of carbonaceous aerosols in Northern Europe during winter, Atmos. Environ., 173, 127–141, https://doi.org/10.1016/j.atmosenv.2017.11.005, 2018.
Grieshop, A. P., Logue, J. M., Donahue, N. M., and Robinson, A. L.: Laboratory investigation of photochemical oxidation of organic aerosol from wood fires 1: measurement and simulation of organic aerosol evolution, Atmos. Chem. Phys., 9, 1263–1277, https://doi.org/10.5194/acp-9-1263-2009, 2009.
Hallquist, M., Wenger, J. C., Baltensperger, U., Rudich, Y., Simpson, D., Claeys, M., Dommen, J., Donahue, N. M., George, C., Goldstein, A. H., Hamilton, J. F., Herrmann, H., Hoffmann, T., Iinuma, Y., Jang, M., Jenkin, M. E., Jimenez, J. L., Kiendler-Scharr, A., Maenhaut, W., McFiggans, G., Mentel, Th. F., Monod, A., Prévôt, A. S. H., Seinfeld, J. H., Surratt, J. D., Szmigielski, R., and Wildt, J.: The formation, properties and impact of secondary organic aerosol: current and emerging issues, Atmos. Chem. Phys., 9, 5155–5236, https://doi.org/10.5194/acp-9-5155-2009, 2009.
Hao, W. M., Petkov, A., Nordgren, B. L., Corley, R. E., Silverstein, R. P., Urbanski, S. P., Evangeliou, N., Balkanski, Y., and Kinder, B. L.: Daily black carbon emissions from fires in northern Eurasia for 2002–2015, Geosci. Model Dev., 9, 4461–4474, https://doi.org/10.5194/gmd-9-4461-2016, 2016.
Heal, M. R., Naysmith, P., Cook, G. T., Xu, S., Duran, T. R., and Harrison, R. M.: Application of 14C analyses to source apportionment of carbonaceous PM2.5 in the UK, Atmos. Environ., 45, 2341–2348, 2011.
Henne, S., Brunner, D., Folini, D., Solberg, S., Klausen, J., and Buchmann, B.: Assessment of parameters describing representativeness of air quality in-situ measurement sites, Atmos. Chem. Phys., 10, 3561–3581, https://doi.org/10.5194/acp-10-3561-2010, 2010.
Herich, H., Gianini, M. F. D., Piot, C., Mocnik, G., Jaffrezo, J.-L., Besombes, J.-L., Prévôt, A. S. H., and Hueglin, C.: Overview of the impact of wood burning emissions on carbonaceous aerosols and PM in large parts of the Alpine region, Atmos. Environ., 89, 64–75, 2014.
Hodzic, A., Kasibhatla, P. S., Jo, D. S., Cappa, C. D., Jimenez, J. L., Madronich, S., and Park, R. J.: Rethinking the global secondary organic aerosol (SOA) budget: stronger production, faster removal, shorter lifetime, Atmos. Chem. Phys., 16, 7917–7941, https://doi.org/10.5194/acp-16-7917-2016, 2016.
Jathar, S. H., Gordon, T. D., Hennigan, C. J., Pye, H. O. T., Pouliot, G., Adams, P. J., Donahue, N. M., and Robinson, A. L.: Unspeciated organic emissions from combustion sources and their influence on the secondary organic aerosol budget in the United States, P. Natl. Acad. Sci. USA, 111, 10473–10478, 2014.
Kanakidou, M., Seinfeld, J. H., Pandis, S. N., Barnes, I., Dentener, F. J., Facchini, M. C., Van Dingenen, R., Ervens, B., Nenes, A., Nielsen, C. J., Swietlicki, E., Putaud, J. P., Balkanski, Y., Fuzzi, S., Horth, J., Moortgat, G. K., Winterhalter, R., Myhre, C. E. L., Tsigaridis, K., Vignati, E., Stephanou, E. G., and Wilson, J.: Organic aerosol and global climate modelling: a review, Atmos. Chem. Phys., 5, 1053–1123, https://doi.org/10.5194/acp-5-1053-2005, 2005.
Korontzi, S., McCarty, J., Loboda, T., Kumar, S., and Justice, C.: Global distribution of agricultural fires in croplands from 3 years of Moderate Resolution Imaging Spectroradiometer (MODIS) data, Global Biogeochem. Cy., 20, GB2021, https://doi.org/10.1029/2005GB002529, 2006.
Kourtchev, I., Copolovici, L., Claeys, M., and Maenhaut, W.: Characterization of atmospheric aerosols at a forested site in central Europe, Environ. Sci. Technol., 43, 4665–4671, 2009.
Kuenen, J. J. P., Visschedijk, A. J. H., Jozwicka, M., and Denier van der Gon, H. A. C.: TNO-MACC_II emission inventory; a multi-year (2003–2009) consistent high-resolution European emission inventory for air quality modelling, Atmos. Chem. Phys., 14, 10963–10976, https://doi.org/10.5194/acp-14-10963-2014, 2014.
Kulmala, M., Asmi, A., Lappalainen, H. K., Carslaw, K. S., Pöschl, U., Baltensperger, U., Hov, Ø., Brenquier, J.-L., Pandis, S. N., Facchini, M. C., Hansson, H.-C., Wiedensohler, A., and O'Dowd, C. D.: Introduction: European Integrated Project on Aerosol Cloud Climate and Air Quality interactions (EUCAARI) – integrating aerosol research from nano to global scales, Atmos. Chem. Phys., 9, 2825–2841, https://doi.org/10.5194/acp-9-2825-2009, 2009.
Liu, J., Li, J., Vonwiller, M., Liu, D., Cheng, H., Shen, K., Salazar, G., Agrios, K., Zhang, Y., Hea, Q., Ding, X., Zhong, G., Wang, X., Szidat, S., and Zhang, G.: The importance of non-fossil sources in carbonaceous aerosols in a megacity of central China during the 2013 winter haze episode: A source apportionment constrained by radiocarbon and organic tracers, Atmos. Environ., 144, 60–68, https://doi.org/10.1016/j.atmosenv.2016.08.068, 2016.
López-Aparicio, S., Guevara, M., Thunis, P., Cuvelier, K., and Tarrasón, L.: Assessment of discrepancies between bottom-up and regional emission inventories in Norwegian urban areas, Atmos. Environ., 154, 285–296, 2017.
May, A. A., Levin, E. J. T., Hennigan, C. J., Riipinen, I., Lee, T., Collett Jr., J. L., Jimenez, J. L., Kreidenweis, S. M., and Robinson, A. L.: Gas-particle partitioning of primary organic aerosol emissions: 3. Biomass burning, J. Geophys. Res.-Atmos., 118, 11327–11338, https://doi.org/10.1002/jgrd.50828, 2013a.
May, A. A., Presto, A. A., Hennigan, C. J., Nguyenm N. T., Gordon, T. D., and Robinson, A. L.: Gas-Particle Partitioning of Primary Organic Aerosol Emissions: (2) Diesel Vehicles, Environ. Sci. Technol., 47, 8288–8296, https://doi.org/10.1021/es400782j, 2013b.
May, B., Wagenbach, D., Hammer, S., Steier, P., Puxbaum, H., and Pio, C.: The anthropogenic influence on carbonaceous aerosol in the European background, Tellus B, 61, 464–472, 2009.
McFiggans, G., Mentel, T., Wildt, J., Pullinen, I., Kang, S., Kleist, E., Schmitt, S., Springer, M., Tillmann, R., Wu, C., Zhao, D., Hallquist, M., Faxon, C., Le Breton, M., Hallquist, A. M., Simpson, D., Bergström, R., Jenkin, M. E., Ehn, M., Thornton, J. A., Alfarra, M. R., Bannan, T. J., Percival, C. J., Priestley, M., Topping, D., and Kiendler-Scharr, A.: Secondary organic aerosol reduced by mixture of atmospheric vapours, Nature 565, 587–593, 2019.
Mohn, J., Szidat, S., Fellner, J., Rechberger, H., Quartier, R., Buchmann, B., and Emmenegger, L.: Determination of biogenic and fossil CO2 emitted by waste incineration based on 14CO2 and mass balances, Bioresour. Technol., 99, 6471–6479, https://doi.org/10.1016/j.biortech.2007.11.042, 2008.
Mohr, C., Huffman, J. A., Cubison, M. J., Aiken, A. C., Docherty, K. S., Kimmel, J. R., Ulbrich, I. M., Hannigan, M., and Jimenez, J. L.: Characterization of primary organic aerosol emissions from meat cooking, trash burning, and motor vehicles with high resolution aerosol mass spectrometry and comparison with ambient and chamber observations, Environ. Sci. Technol., 43, 2443–2449, https://doi.org/10.1021/es8011518, 2009.
Novakov, T. and Penner, J.: Large contribution of organic aerosols to cloud condensation nuclei concentrations, Nature, 365, 823–826, 1993.
O'Dowd, C., Ceburnis, D., Ovadnevaite, J., Vaishya, A., Rinaldi, M., and Facchini, M. C.: Do anthropogenic, continental or coastal aerosol sources impact on a marine aerosol signature at Mace Head?, Atmos. Chem. Phys., 14, 10687–10704, https://doi.org/10.5194/acp-14-10687-2014, 2014.
Ots, R., Young, D. E., Vieno, M., Xu, L., Dunmore, R. E., Allan, J. D., Coe, H., Williams, L. R., Herndon, S. C., Ng, N. L., Hamilton, J. F., Bergström, R., Di Marco, C., Nemitz, E., Mackenzie, I. A., Kuenen, J. J. P., Green, D. C., Reis, S., and Heal, M. R.: Simulating secondary organic aerosol from missing diesel-related intermediate-volatility organic compound emissions during the Clean Air for London (ClearfLo) campaign, Atmos. Chem. Phys., 16, 6453–6473, https://doi.org/10.5194/acp-16-6453-2016, 2016.
Pope, C. A. and Dockery, D. W.: Health effects of fine particulate air pollution: lines that connect, J. Air Waste Manag. Assoc., 56, 709–742, 2006.
Pöschl, U.: Aerosol particle analysis: challenges and progress, Anal. Bioanal. Chem., 375, 30–32, 2003.
Pöschl, U.: Atmospheric aerosols: Composition, transformation, climate and health effects, Angew. Chem. Int. Ed., 44, 7520–7540, 2005.
Putaud, J.-P., Van Dingenen, R., Alastuey, A., Bauer, H., Birmili, W., Cyrys, J., Flentje, H., Fuzzi, S., Gehrig, R., Hansson, H. C., Harrison, R. M., Hermann, H., Hitzenberger, R., Hüglin, C., Jones, A. M., Kasper-Giebl, A., Kiss, G., Kousa, A., Kuhlbusch, T. A. J., Löschau, G., Maenhaut, W., Molnar, A., Moreno, T., Pekkanen, J., Perrino, C., Pitz, M., Puxbaum, H., Querol, X., Rodriguez, S., Salma, I., Schwarz, J., Smolik, J., Schneider, J., Spindler, G., ten Brink, H., Tursic, J., Viana, M., Wiedensohler, A., and Raes, F.: A European Aerosol Phenomenology – 3: physical and chemical characteristics of particulate matter from 60 rural, urban, and kerbside sites across Europe, Atmos. Environ., 44, 1308–1320, 2010.
Puxbaum, H., Caseiro, A., Sánchez-Ochoa, A., Kasper-Giebl, A., Claeys, M., Gelencsér, A., Legrand, M., Preunkert, S., and Pio, C. A.: Levoglucosan levels at background sites in Europe for assessing the impact of biomass combustion on the European, aerosol background, J. Geophys. Res., 112, D23S05, https://doi.org/10.1029/2006JD008114, 2007.
Querol, X., Alastuey, A., Pey, J., Cusack, M., Pérez, N., Mihalopoulos, N., Theodosi, C., Gerasopoulos, E., Kubilay, N., and Koçak, M.: Variability in regional background aerosols within the Mediterranean, Atmos. Chem. Phys., 9, 4575–4591, https://doi.org/10.5194/acp-9-4575-2009, 2009.
Reimer, P. J., Brown, T. A., and Reimer, R. W.: Discussion: Reporting and Calibration of PostBomb 14C Data, Radiocarbon, 46, 1299–1304, 2004.
Robinson, A. L., Donahue, N. M., Shrivastava, M. K., Weitkamp, E. A., Sage, A. M., Grieshop, A. P., Lane, T. E., Pierce, J. R., and Pandis, S. N.: Rethinking Organic Aerosols: Semivolatile Emissions and Photochemical Aging, Science, 315, 1259–1262, 2007.
Rohr, A. C. and Wyzga, R. E.: Attributing health effects to individual particulate matter constituents, Atmos. Environ., 62, 130–152, https://doi.org/10.1016/j.atmosenv.2012.07.036, 2012.
Ruff, M., Wacker, L., Gäggeler, H. W., Suter, M., Synal, H. A., and Szidat, S.: A gas ion source for radiocarbon measurements at 200 kV, Radiocarbon, 49, 307–314, 2007.
Shrivastava, M. K., Lane, T. E., Donahue, N. M., Pandis, S. N., and Robinson, A. L.: Effects of gas particle partitioning and aging of primary emissions on urban and regional organic aerosol concentrations, J. Geophys. Res., 113, D18301, https://doi.org/10.1029/2007JD009735, 2008.
Simpson, D. and Denier van der Gon, H.: Problematic emissions – particles or gases?, in: Transboundary particulate matter, photo-oxidants, acidifying and eutrophying components, EMEP Status Report 1/2015, The Norwegian Meteorological Institute, Oslo, Norway, 87–96, 2015.
Simpson, D., Yttri, K. E., Klimont, Z., Kupiainen, K., Caseiro, A., Gelencsér, A., Pio, C., and Legrand, M.: Modeling carbonaceous aerosol over Europe. Analysis of the CARBOSOL and EMEP EC∕OC campaigns, J. Geophys. Res., 112, D23S14, https://doi.org/10.1029/2006JD008114, 2007.
Simpson, D., Benedictow, A., Berge, H., Bergström, R., Emberson, L. D., Fagerli, H., Flechard, C. R., Hayman, G. D., Gauss, M., Jonson, J. E., Jenkin, M. E., Nyíri, A., Richter, C., Semeena, V. S., Tsyro, S., Tuovinen, J.-P., Valdebenito, Á., and Wind, P.: The EMEP MSC-W chemical transport model – technical description, Atmos. Chem. Phys., 12, 7825–7865, https://doi.org/10.5194/acp-12-7825-2012, 2012.
Simpson, D., Bergström, R., Imhof, H., and Wind, P.: Updates to the EMEP/MSC-W model, 2016–2017, in: Transboundary particulate matter, photo-oxidants, acidifying and eutrophying components, Status Report 1/2017, The Norwegian Meteorological Institute, Oslo, Norway, 115–122, 2017.
Spindler, G., Gnauk, T., Grüner, A., Iinuma, Y., Müller, K., Scheinhardt, S., and Herrmann, H.: Size-segregated characterization of PM10 at the EMEPsite Melpitz (Germany) using a five-stage impactor: a six year study, J. Atmos. Chem., 69, 127–157, 2012.
Stohl, A., Berg, T., Burkhart, J. F., Fjæraa, A. M., Forster, C., Herber, A., Hov, Ø., Lunder, C., McMillan, W. W., Oltmans, S., Shiobara, M., Simpson, D., Solberg, S., Stebel, K., Ström, J., Tørseth, K., Treffeisen, R., Virkkunen, K., and Yttri, K. E.: Arctic smoke – record high air pollution levels in the European Arctic due to agricultural fires in Eastern Europe in spring 2006, Atmos. Chem. Phys., 7, 511–534, https://doi.org/10.5194/acp-7-511-2007, 2007.
Subramanian, R., Khlystov, A. Y., and Robinson, A. L.: Effect of Peak Inert-Mode Temperature on Elemental Carbon Measured Using Thermal-Optical Analysis, Aerosol Sci. Tech., 40, 763–780, https://doi.org/10.1080/02786820600714403, 2006.
Szidat, S., Jenk, T. M., Gäggeler, H. W., Synal, H. A., Fisseha, R., Baltensperger, U., Kalberer, M., Samburova, V., Reimann, S., Kasper-Giebl, A., and Hajdas, I.: Radiocarbon (14C)-deduced biogenic and anthropogenic contributions to organic carbon (OC) of urban aerosols from Zurich, Switzerland, Atmos. Environ., 38, 4035–4044, 2004.
Szidat, S., Prevot, A. S. H., Sandradewi, J., Alfarra, M. R., Synal, H.-A., Wacker, L., and Baltensperger, U.: Dominant impact of residential wood burning on particulate matter in Alpine valleys during winter, Geophys. Res. Lett., 34, L05820, https://doi.org/10.1029/2006GL028325, 2007.
Szidat, S., Ruff, M., Perron, N., Wacker, L., Synal, H.-A., Hallquist, M., Shannigrahi, A. S., Yttri, K. E., Dye, C., and Simpson, D.: Fossil and non-fossil sources of organic carbon (OC) and elemental carbon (EC) in Göteborg, Sweden, Atmos. Chem. Phys., 9, 1521–1535, https://doi.org/10.5194/acp-9-1521-2009, 2009.
Tsyro, S., Simpson, D., Tarrasón, L., Kupiainen, K., Klimont, Z., Yttri, K., and Pio, C.: Modelling of elemental carbon over Europe, J. Geophys. Res., 112, D23S19, https://doi.org/10.1029/2006JD008164, 2007.
Viana, M., Kuhlbusch, T. A., Querol, X., Alastuey, A., Harrison, R. M., Hopke, P. K., Winiwarter, W., Vallius, M., Szidat, S., Prevot, A. S. H., Hueglin, C., Bloemen, H., Wahlin, Pl, Vecchi, R., Miranda, A. I., Kasper-Giebl, A., Maenhaut, W., and Hitzenberger, R.: Source apportionment of particulate matter in Europe: a review of methods and results, J. Aerosol Sci., 39, 827–849, https://doi.org/10.1016/j.jaerosci.2008.05.007, 2008.
Vieno, M., Heal, M. R., Williams, M. L., Carnell, E. J., Nemitz, E., Stedman, J. R., and Reis, S.: The sensitivities of emissions reductions for the mitigation of UK PM2.5, Atmos. Chem. Phys., 16, 265–276, https://doi.org/10.5194/acp-16-265-2016, 2016.
Wacker, L., Fahrni, S. M., Hajdas, I., Molnar, M., Synal, H.-A., Szidat, S., and Zhang, Y. L.: A versatile gas interface for routine radiocarbon analysis with a gas ion source, Nucl. Instr. Meth. Phys. Res. B, 294, 315–319, https://doi.org/10.1016/j.nimb.2012.02.009, 2013.
Wagener, S., Langner, M., Hansen, U., Moriske, H. J., Endlicher, W. R., and Wilfried, R.: Spatial and seasonal variations of biogenic tracer compounds in ambient PM10 and PM1 samples in Berlin, Germany, Atmos. Environ., 47, 33–42, https://doi.org/10.1016/j.atmosenv.2011.11.044, 2012.
Waked, A., Favez, O., Alleman, L. Y., Piot, C., Petit, J.-E., Delaunay, T., Verlinden, E., Golly, B., Besombes, J.-L., Jaffrezo, J.-L., and Leoz-Garziandia, E.: Source apportionment of PM10 in a north-western Europe regional urban background site (Lens, France) using positive matrix factorization and including primary biogenic emissions, Atmos. Chem. Phys., 14, 3325–3346, https://doi.org/10.5194/acp-14-3325-2014, 2014.
Wallén, A., Lidén, G., and Hansson H. C.: Measured Elemental Carbon by Thermo-Optical Transmittance Analysis in Water-Soluble Extracts from Diesel Exhaust, Woodsmoke, and Ambient Particulate Samples, J. Occup. Environ. Med., 7, 35–41, https://doi.org/10.1080/15459620903368859, 2010.
Wiedinmyer, C., Yokelson, R. J., and Gullett, B. K.: Global Emissions of Trace Gases, Particulate Matter, and Hazardous Air Pollutants from Open Burning of Domestic Waste, Environ. Sci. Technol., 48, 9523–9530, 2014.
Winiwarter, W., Haberl, H., and Simpson, D.: On the boundary between man-made and natural emissions: Problems in defining European ecosystems, J. Geophys. Res., 104, 8153–8159, 1999.
Winiwarter, W., Bauer, H., Caseiro, A., and Puxbaum, H.: Quantifying emissions of primary biological aerosol particle mass in Europe, Atmos. Environ., 43, 1403–1409, 2009.
Yang, H. and Yu, J. Z.: Uncertainties in Charring Correction in the Analysis of Elemental and Organic Carbon in Atmospheric Particles by Thermal/Optical Methods, Environ Sci Technol., 36, 5199–5204, 2002.
Yttri, K. E., Aas, W., Bjerke, A., Cape, J. N., Cavalli, F., Ceburnis, D., Dye, C., Emblico, L., Facchini, M. C., Forster, C., Hanssen, J. E., Hansson, H. C., Jennings, S. G., Maenhaut, W., Putaud, J. P., and Tørseth, K.: Elemental and organic carbon in PM10: a one year measurement campaign within the European Monitoring and Evaluation Programme EMEP, Atmos. Chem. Phys., 7, 5711–5725, https://doi.org/10.5194/acp-7-5711-2007, 2007a.
Yttri, K. E., Dye, C., and Kiss, G.: Ambient aerosol concentrations of sugars and sugar-alcohols at four different sites in Norway, Atmos. Chem. Phys., 7, 4267–4279, https://doi.org/10.5194/acp-7-4267-2007, 2007b.
Yttri, K. E., Simpson, D., Stenström, K., Puxbaum, H., and Svendby, T.: Source apportionment of the carbonaceous aerosol in Norway –quantitative estimates based on 14C, thermal-optical and organic tracer analysis, Atmos. Chem. Phys., 11, 9375–9394, https://doi.org/10.5194/acp-11-9375-2011, 2011a.
Yttri, K. E., Simpson, D., Nøjgaard, J. K., Kristensen, K., Genberg, J., Stenström, K., Swietlicki, E., Hillamo, R., Aurela, M., Bauer, H., Offenberg, J. H., Jaoui, M., Dye, C., Eckhardt, S., Burkhart, J. F., Stohl, A., and Glasius, M.: Source apportionment of the summer time carbonaceous aerosol at Nordic rural background sites, Atmos. Chem. Phys., 11, 13339–13357, https://doi.org/10.5194/acp-11-13339-2011, 2011b.
Yttri, K. E., Lund Myhre, C., Eckhardt, S., Fiebig, M., Dye, C., Hirdman, D., Ström, J., Klimont, Z., and Stohl, A.: Quantifying black carbon from biomass burning by means of levoglucosan – a one-year time series at the Arctic observatory Zeppelin, Atmos. Chem. Phys., 14, 6427–6442, https://doi.org/10.5194/acp-14-6427-2014, 2014.
Yttri, K. E., Schnelle-Kreis, J., Maenhaut, W., Abbaszade, G., Alves, C., Bjerke, A., Bonnier, N., Bossi, R., Claeys, M., Dye, C., Evtyugina, M., García-Gacio, D., Hillamo, R., Hoffer, A., Hyder, M., Iinuma, Y., Jaffrezo, J.-L., Kasper-Giebl, A., Kiss, G., López-Mahia, P. L., Pio, C., Piot, C., Ramirez-Santa-Cruz, C., Sciare, J., Teinilä, K., Vermeylen, R., Vicente, A., and Zimmermann, R.: An intercomparison study of analytical methods used for quantification of levoglucosan in ambient aerosol filter samples, Atmos. Meas. Tech., 8, 125–147, https://doi.org/10.5194/amt-8-125-2015, 2015.
Yttri, K. E., et al.: 15 years of carbonaceous aerosol measurement at the Birkenes Observatory – Norway, in preparation, 2019.
Zappoli, S., Andracchio, A., Fuzzi, S., Facchini, M. C., Gelencsér, A., Kiss, G., Krivácsy, Z., Molnár, Á., Mészáros, E., Hansson, H. -C., Rosman, K., and Zebühr, Y.: Inorganic, organic and macromolecular components of fine aerosol in different areas of Europe in relation to their water solubility, Atmos. Environ., 33, 2733–2743, https://doi.org/10.1016/S1352-2310(98)00362-8, 1999.
Zhang, Q., Jimenez, J. L., Canagaratna, M. R., Allan, J. D., Coe, H., Ulbrich, I., Alfarra, M. R., Takami, A., Middlebrook, A. M., Sun, Y. L., Dzepina, K., Dunlea, E., Docherty, K., DeCarlo, P. F., Salcedo, D., Onasch, T., Jayne, J. T., Miyoshi, T., Shimono, A., Hatakeyama, Takegawa, N., Kondo, Y., Schneider, J., Drewnick, F., Borrmann, S., Weimer, S., Demerjian, K., Williams, P., Bower, K., Bahreini, R., Cottrell, L., Griffin, R. J., Rautiainen, J., Sun, J. Y., Zhang, Y. M., and Worsnop, D. R.: Ubiquity and dominance of oxygenated species in organic aerosols in anthropogenically-influenced Northern Hemisphere midlatitudes, Geophys. Res. Lett., 34, L13801, https://doi.org/10.1029/2007GL029979, 2007.
Ziemann, P. J. and Atkinson, R.: Kinetics, products, and mechanisms of secondary organic aerosol formation, Chem. Soc. Rev., 41, 6582–6605, https://doi.org/10.1039/c2cs35122f, 2012.
Zotter, P., Ciobanu, V. G., Zhang, Y. L., El-Haddad, I., Macchia, M., Daellenbach, K. R., Salazar, G. A., Huang, R.-J., Wacker, L., Hueglin, C., Piazzalunga, A., Fermo, P., Schwikowski, M., Baltensperger, U., Szidat, S., and Prévôt, A. S. H.: Radiocarbon analysis of elemental and organic carbon in Switzerland during winter-smog episodes from 2008 to 2012 – Part 1: Source apportionment and spatial variability, Atmos. Chem. Phys., 14, 13551–13570, https://doi.org/10.5194/acp-14-13551-2014, 2014.