the Creative Commons Attribution 4.0 License.
the Creative Commons Attribution 4.0 License.
 | 22 Mar 2019
Model simulation of ammonium and nitrate aerosols distribution in the Euro-Mediterranean region and their radiative and climatic effects over 1979–2016
Thomas Drugé
Pierre Nabat
Marc Mallet
Samuel Somot
Aerosols play an important role in Europe and the Mediterranean area where different sources of natural and anthropogenic particles are present. Among them ammonium and nitrate (A&N) aerosols may have a growing impact on regional climate. In this study, their representation in coarse and fine modes has been introduced in the prognostic aerosol scheme of the ALADIN-Climate regional model. This new aerosol scheme is evaluated over Europe and the Mediterranean Sea, using two twin simulations over the period 1979–2016 with and without A&N aerosols. This evaluation is performed at local and regional scales, using surface stations and satellite measurements. Despite an overestimate of the surface nitrate concentration, the model is able to reproduce its spatial pattern including local maxima (Benelux, Po Valley). Concerning the simulated aerosol optical depth (AOD), the inclusion of A&N aerosols significantly reduces the model bias compared to both AERONET stations and satellite data. Our results indicate that A&N aerosols can contribute up to 40 % of the total AOD550 over Europe, with an average of 0.07 (550 nm) over the period 2001–2016. Sensitivity studies suggest that biases still present are related to uncertainties associated with the annual cycle of A&N aerosol precursors (ammonia and nitric acid). The decrease in sulfate aerosol production over Europe since 1980 produces more free ammonia in the atmosphere leading to an increase in A&N concentrations over the studied period. Analyses of the different aerosol trends have shown for the first time to our knowledge that, since 2005 over Europe, A&N AOD550 and A&N shortwave (SW) direct radiative forcing (DRF) are found to be higher than sulfate and organics, making these the species with the highest AOD and the highest DRF. On average over the period 1979–2016, the A&N DRF is found to be about −1.7 W m−2 at the surface and −1.4 W m−2 at the top of the atmosphere (TOA) in all sky conditions over Europe, with regional maxima located at the surface over the Po Valley (−5 W m−2). Finally, the dimming effect of A&N aerosols is responsible for a cooling of about −0.2∘ C over Europe (summer), with a maximum of −0.4 ∘C over the Po Valley. Concerning precipitation, no significant impact of A&N aerosols has been found.
- Article
(8035 KB) - Full-text XML
- BibTeX
- EndNote


Aerosols are known to have an important role in the regional and global climate system because they affect cloud properties, the radiative balance and the hydrological cycle (Forster et al., 2007; Tang et al., 2018). They modify the radiative budget of the Earth through different effects, which are the direct, semi-direct and indirect effects. The direct radiative effect corresponds to the absorption and scattering of the solar incident radiation (Mitchell, 1971; Coakley Jr. et al., 1983) that generally produce a cooling effect both at the surface and at the top of the atmosphere (TOA). The consequences of the direct radiative effect on the atmospheric dynamics is defined as the semi-direct effect (Hansen et al., 1997; Allen and Sherwood, 2010). Finally, the indirect effect represents the modification of the microphysical cloud properties, which has consequences on cloud albedo and lifetime in particular (Twomey, 1977; Albrecht, 1989; Lohmann and Feichter, 2005).
Over Europe, among the different anthropogenic aerosol species, atmospheric nitrate particles represent approximatively 10 %–20 % of the total dry aerosol mass at the end of the 20th century (Putaud et al., 2004; Schaap et al., 2004). Ammonium and nitrate (A&N) aerosols (NH4NO3) are mainly formed by reactions in the atmosphere from ammonia (NH3) and nitric acid (HNO3), a photochemical product of nitric oxide (NOx) oxidation (Hauglustaine et al., 2014). The most important sources of ammonia are agricultural excreta from domestic and wild animals, as well as synthetic fertilizers (Bouwman et al., 1997; Paulot et al., 2014). Nitric acid has anthropogenic and natural sources that come mainly from fossil fuel combustion (40 %), land use practices (15 %) and soil emissions (10 %) (Olivier et al., 1998). The NH3, present in the troposphere is the main neutralizing agent for the sulfuric acid (H2SO4) and nitric acid (HNO3) (Hauglustaine et al., 2014). Firstly, the NH3 will react instantaneously and irreversibly with H2SO4 to produce ammonium sulfate ((NH4)HSO4) (Hauglustaine et al., 2014). The less abundant of the two species is the only limitation. This reaction takes priority over ammonium nitrate formation due to the low vapour pressure of sulfuric acid. Secondly, if all NH3 is consumed by the previous reactions with H2SO4, no ammonium nitrate is formed. If there is still some NH3, it will neutralize the HNO3 to create NH4NO3. After the small particles reach equilibrium, coarse particles of NH4NO3 are produced by heterogeneous uptake of HNO3 on calcite (part of mineral dust) and sea-salt particles (Zhuang et al., 1999; Jacobson, 1999; Jordan et al., 2003; Hauglustaine et al., 2014).
Because of the difficulty to quantify the A&N effects and the high variability of these aerosols, it is difficult to simulate their climatic effects (Bian et al., 2017). Several global climate models (GCMs) have now implemented the formation of A&N aerosols (Bian et al., 2017) to quantify their impact on the present-day climate. In that context, eight global climate models from the AeroCom (Aerosol Comparisons between Observations and Models) phase II project have quantified a present-day direct radiative forcing of nitrate aerosols, at the TOA, ranging from −0.12 to −0.02 W m−2 with a mean of W m−2 (Myhre et al., 2013). In parallel, the different climate models involved in the Atmospheric Chemistry and Climate Model Intercomparison Project (ACCMIP) indicate a present-day direct radiative forcing ranging from −0.03 to −0.41 W m−2 with a mean of W m−2 (Shindell et al., 2013). Concerning the nitrate-related aerosol optical depth (AOD), several studies have shown a global annual estimation ranging from 0.0023 to 0.025 at 550 nm (Bellouin et al., 2011; Shindell et al., 2013; Myhre et al., 2013; Hauglustaine et al., 2014). Many reasons could explain the significant diversity in the global simulations of nitrate concentrations among climate models. First, nitrate aerosols are involved in a very complicated chemistry and the system sometimes cannot even be solved using the thermodynamic equilibrium approach when coarse mode, from dust and sea-salt particles, is present. Furthermore, nitrate simulation also depends on temperature, relative humidity and on various precursors such as NH3, HNO3, dust and sea salt. Indeed, concerning dust, recent studies indicate that the tropospheric burden of nitrate aerosol increases by 44 % when interactions of nitrate with mineral dust are considered (Karydis et al., 2017). Finally, the different global climate models account for impacts on nitrate formation of dust and sea salt very differently (Bian et al., 2017).
By the end of the twenty-first century, some climate scenarios project an increase in NH3 emissions (O'Neill et al., 2016) that could offset some of the decline in SO2 and NOx emissions for the anthropogenic aerosol radiative forcing (Hauglustaine et al., 2014). With the reduction in SO2 emissions, less atmospheric NH3 is required to neutralize the strong acid H2SO4. The excess of NH3 will form A&N aerosols so that their importance is likely to increase over this century. Several global models predict an overall increase in atmospheric nitrate burden during this century based on current available emission inventories (Bauer et al., 2007, 2016; Hauglustaine et al., 2014; Li et al., 2014). Finally, NH4NO3 will probably become the largest contributor to anthropogenic AOD by the end of this century (Hauglustaine et al., 2014). Nevertheless, the predicted trend in surface nitrate concentration is mixed. Indeed, despite a global increase in surface nitrate concentration, some studies estimate a decrease over some regional urban areas, as in North America or in the Mediterranean region, due to the decline in NOx emissions (Bauer et al., 2016; Hauglustaine et al., 2014; Trail et al., 2014).
The Mediterranean region, with an alternating climate between hot and dry summers and mild and wet winters, is very sensitive to climate change (Nabat et al., 2016). Furthermore, this region is a crossroads of air masses carrying natural (dust, sea salt, etc.) and anthropogenic (black carbon, sulfate, nitrate, etc.) particles. Indeed, these aerosols come from different sources such as the Sahara desert, industries, European cities, forest fires and even the Mediterranean Sea itself (Lelieveld et al., 2002; Nabat et al., 2013). This region is therefore very interesting to study the role of the different aerosols on the climate. However, the issue of the aerosol representation in regional climate models (RCMs) has only rarely been discussed, particularly in this region, although this scale is the most adapted to the spatio-temporal variability of these aerosols (Nabat et al., 2015a). In addition, the majority of regional climate simulations carried out at the Mediterranean basin scale used a very simplified representation of aerosols, not taking A&N aerosols into account (Nabat et al., 2016).
The objective of this study is to present the implementation and the evaluation of a simplified A&N module in the TACTIC aerosol scheme (Michou et al., 2015; Nabat et al., 2015a) used in the ALADIN regional climate model and to assess the direct radiative effect and climatic impact of the A&N aerosols over the Euro-Mediterranean region. Note that the ALADIN-Climate model is not very suitable for studying the impact of aerosols on particulate air quality (bulk approach for anthropogenic aerosols). After a description of the new aerosol scheme in Sects. 2 and 3, an evaluation of this scheme will be presented in Sect. 4. The radiative and climatic effects of A&N aerosols are studied in Sect. 5 before the concluding remarks in Sect. 6.
2.1 The ALADIN-Climate regional climate model
ALADIN-Climate is a regional climate model developed at CNRM used in the present study over the Euro-Mediterranean region. It includes an interactive aerosol scheme described thereafter, and the SURFEX land surface module (Masson et al., 2013) with the ISBA scheme (Noilhan and Mahfouf, 1996). Land surface hydrology and river flow are simulated by the TRIP model (Decharme et al., 2010).
ALADIN-Climate is used here in its version 6.2 similar to in Daniel et al. (2018). It is a bi-spectral, hydrostatic limited-area regional climate model with a semi-Lagrangian advection and a semi-implicit scheme. ALADIN-Climate has a 50 km horizontal resolution and 91 vertical levels. As the regional domain is not periodic, an extension zone used only for Fourier transforms has been added in order to achieve the bi-periodization. ALADIN-Climate uses the FMR shortwave (SW) radiation scheme (Fouquart and Bonnel, 1980; Morcrette et al., 2008) with six spectral bands, and a longwave radiation scheme (RRTM, Rapid Radiative Transfer Model) presented in Mlawer et al. (1997).
The Euro-Mediterranean domain used for this study is presented in Fig. 1. It includes the official Med-CORDEX domain and has been extended to take into account the main aerosol sources potentially transported over the Euro-Mediterranean region. Indeed, the area is large enough to integrate the two main sources of dust, which are the Sahara (more precisely the Bodélé and the area covering eastern Mauritania, western Mali and southern Algeria) and the largest part of the Arabian Peninsula (Moulin et al., 1998; Prospero et al., 2002). The domain represents 128×180 points including 11 points (north and east) for a bi-periodization zone and 8 points (on each side) for the relaxation zone. Two regions have been defined in Fig. 1 (Europe and the Mediterranean Sea) for the needs of this study.
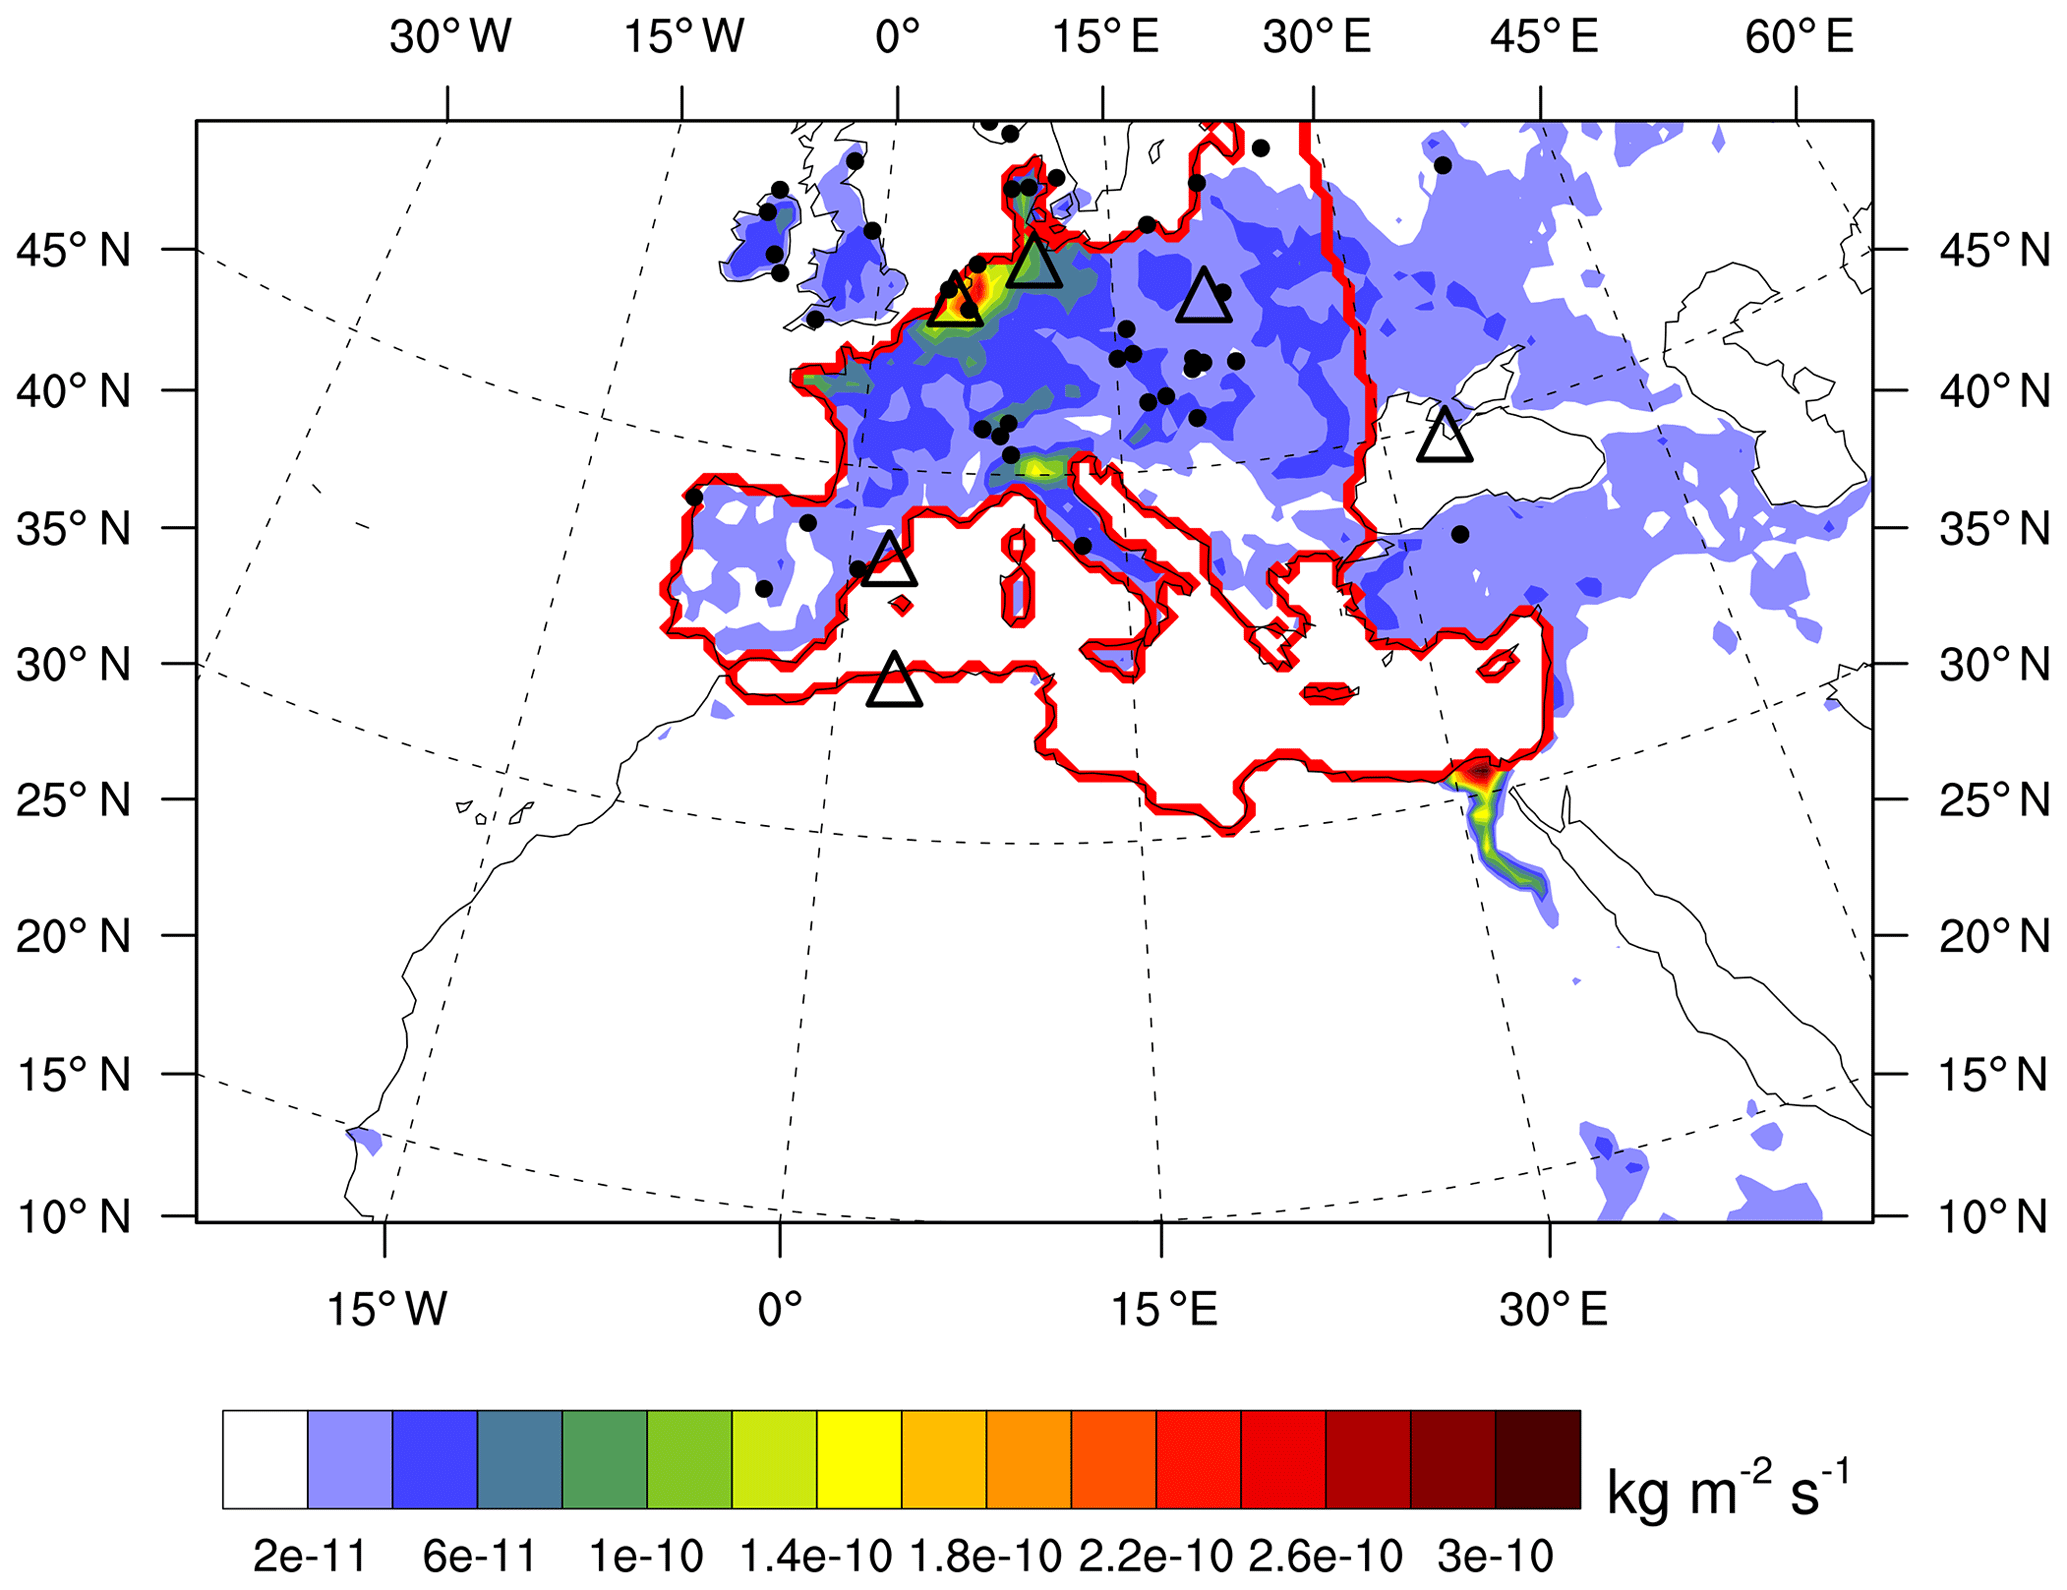
Figure 1NH3 emissions (CMIP6) over the period 1979–2016. The inner model domain represents 101×153 points (without the bi-periodization and the relaxation zone). The different zones studied (Europe, Mediterranean) are represented in red. The observation data are symbolized by a black dot (EMEP stations) and by a black triangle (AERONET stations). The projection type used here is the Lambert conformal projection.
In the ALADIN-Climate model, a prognostic aerosol scheme named TACTIC (Tropospheric Aerosols for ClimaTe In CNRM-CM) has been included as presented in Michou et al. (2015) and Nabat et al. (2015a). This aerosol scheme, originally adapted from the GEMS/MACC aerosol scheme (Morcrette et al., 2009), includes up to now five aerosol types (desert dust, sea salt, black carbon, organic matter and sulfate). These aerosols can be interactively emitted from the surface (dust, sea salt) or from external emission datasets (black carbon, organic matter and sulfate precursors from anthropogenic and/or biomass burning emission). In the present simulations, aerosols are not included in the lateral boundary forcing because the domain is supposed to be large enough to include all the sources of aerosols affecting the Mediterranean region.
The aerosol scheme includes 12 tracers, including 11 particulate tracers and sulfate gaseous precursors (SO2). For aerosol particles, 3 size bins are used for sea salt (0.03 to 0.5, 0.5 to 5 and 5 to 20 µm) and for dust (0.01 to 1.0, 1.0 to 2.5 and 2.5 to 20 µm), 2 bins (hydrophilic and hydrophobic particles) for organics and for black carbon, and 1 size bin for sulfate particles and for sulfate precursors (SO2). All these aerosols are transported in the atmosphere and submitted to the dry and wet (in and below clouds) deposition. TACTIC takes into account their interactions with radiation (direct effect for all species) and the cloud albedo (first indirect effect for sulfate, organic matter and sea salt). Aerosols do not interact with cloud microphysics (no second indirect effect). The radiative properties of each species, and notably those used as input for the radiative transfer scheme (mass extinction efficiencies, single scattering albedo and the asymmetry factor) at different wavelengths and different relative humidity are set for each aerosol type following Nabat et al. (2013). Moreover, it is worth underlining that the TACTIC aerosol scheme has been designed to perform multi-decadal simulations at reasonable computation cost.
2.2 Implementation of the ammonium and nitrate module in TACTIC
An A&N module has been recently implemented in TACTIC. This scheme was adapted from the one implemented in the INCA (Interaction with Chemistry and Aerosols) global model (Hauglustaine et al., 2014). Ammonium (NH4) and nitrate (NO3) particles are formed through gas-to-particle reactions involving the gaseous precursors sulfuric acid (H2SO4), ammonia (NH3) and nitric acid (HNO3). A sulfate–nitrate–ammonium thermodynamic equilibrium seems to be a reasonable assumption for a regional climate model. Nitrate particles can also be formed by heterogeneous uptake of nitric acid over calcite particles (CaCO3, component of dust) and sea salt (NaCl). A&N particles will therefore depend on their precursors but also on sulfates, dusts and sea salt as described below.
Two size bins for nitrates (fine and coarse modes) and one size bin for ammonium particles were added to the TACTIC aerosol scheme. The chemical formation of A&N particles by gas-to-particle reactions goes into the accumulation mode (fine mode, 0.03 to 0.9 µm). Particles from heterogeneous chemistry correspond to the coarse mode (0.9 to 2.0 µm). For the moment, only the direct effect is taken into account for A&N aerosols; the indirect effect will be taken into account in a future version. The aerosol scheme also contains a new passive tracer for NH3. These new species are subject to the same transport and mixing processes as the other tracers in the ALADIN-Climate model.
It has to be noted that organic nitrates, which might significantly contribute to the fine nitrate aerosol (Kiendler-Scharr et al., 2016), are not included in the model.
2.2.1 HNO3 and NH3 auxiliary data
As no full chemistry module is available in ALADIN for reasons of numeric cost, the climatology of HNO3 used in this study is taken from the CAMS Reanalysis (Flemming et al., 2017). A monthly climatology was built over the period 2003–2007 and the annual cycle is taken from the nitric acid climatology of Kasper and Puxbaum (1998), based on observations, in order to represent the annual cycle as well as possible. The study of Kasper and Puxbaum (1998) started in November 1991 and covers two annual cycles until November 1993. It is assumed that the nitric acid annual cycle reported in this study is representative of the study area as it was conducted at the Sonnblick Observatory (SBO), which is a high-alpine site in the centre of Europe, and hence relatively distant from pollution sources. To apply the annual cycle of Kasper and Puxbaum (1998) to the HNO3 climatology, we calculated the annual average of HNO3 from CAMS over the period 2003–2007; then we applied to it the new annual cycle, month by month, proportionally to the monthly averages of Kasper and Puxbaum (1998). The HNO3 annual cycle used in this work is presented in Fig. 3 (solid line). The HNO3 dataset is assumed constant, without change from year to year in its annual cycle over the period 1979–2016. Furthermore, there is not a day–night cycle, which can influences the HNO3 content because of a specific tropospheric chemistry during the night (Dimitroulopoulou and Marsh, 1997), in the HNO3 climatology used.
The NH3 used in this work is taken from CMIP6 data and its annual cycle was defined using the MACCity emissions dataset. MACCity emissions have been provided in the frame of two projects (MACC and CityZen) funded by the European Commission. To apply the annual cycle of MACCity data to the NH3 emissions dataset, we calculated the annual average of NH3 for each year over the period 1979–2016, then we applied to it the new annual cycle, month by month for each year and at each grid point, proportionally to the monthly averages of MACCity. The NH3 annual cycle used in this work is presented in Fig. 2 (red line). Contrary to the HNO3, the NH3 dataset has a year-to-year variability throughout the 1979–2016 period.
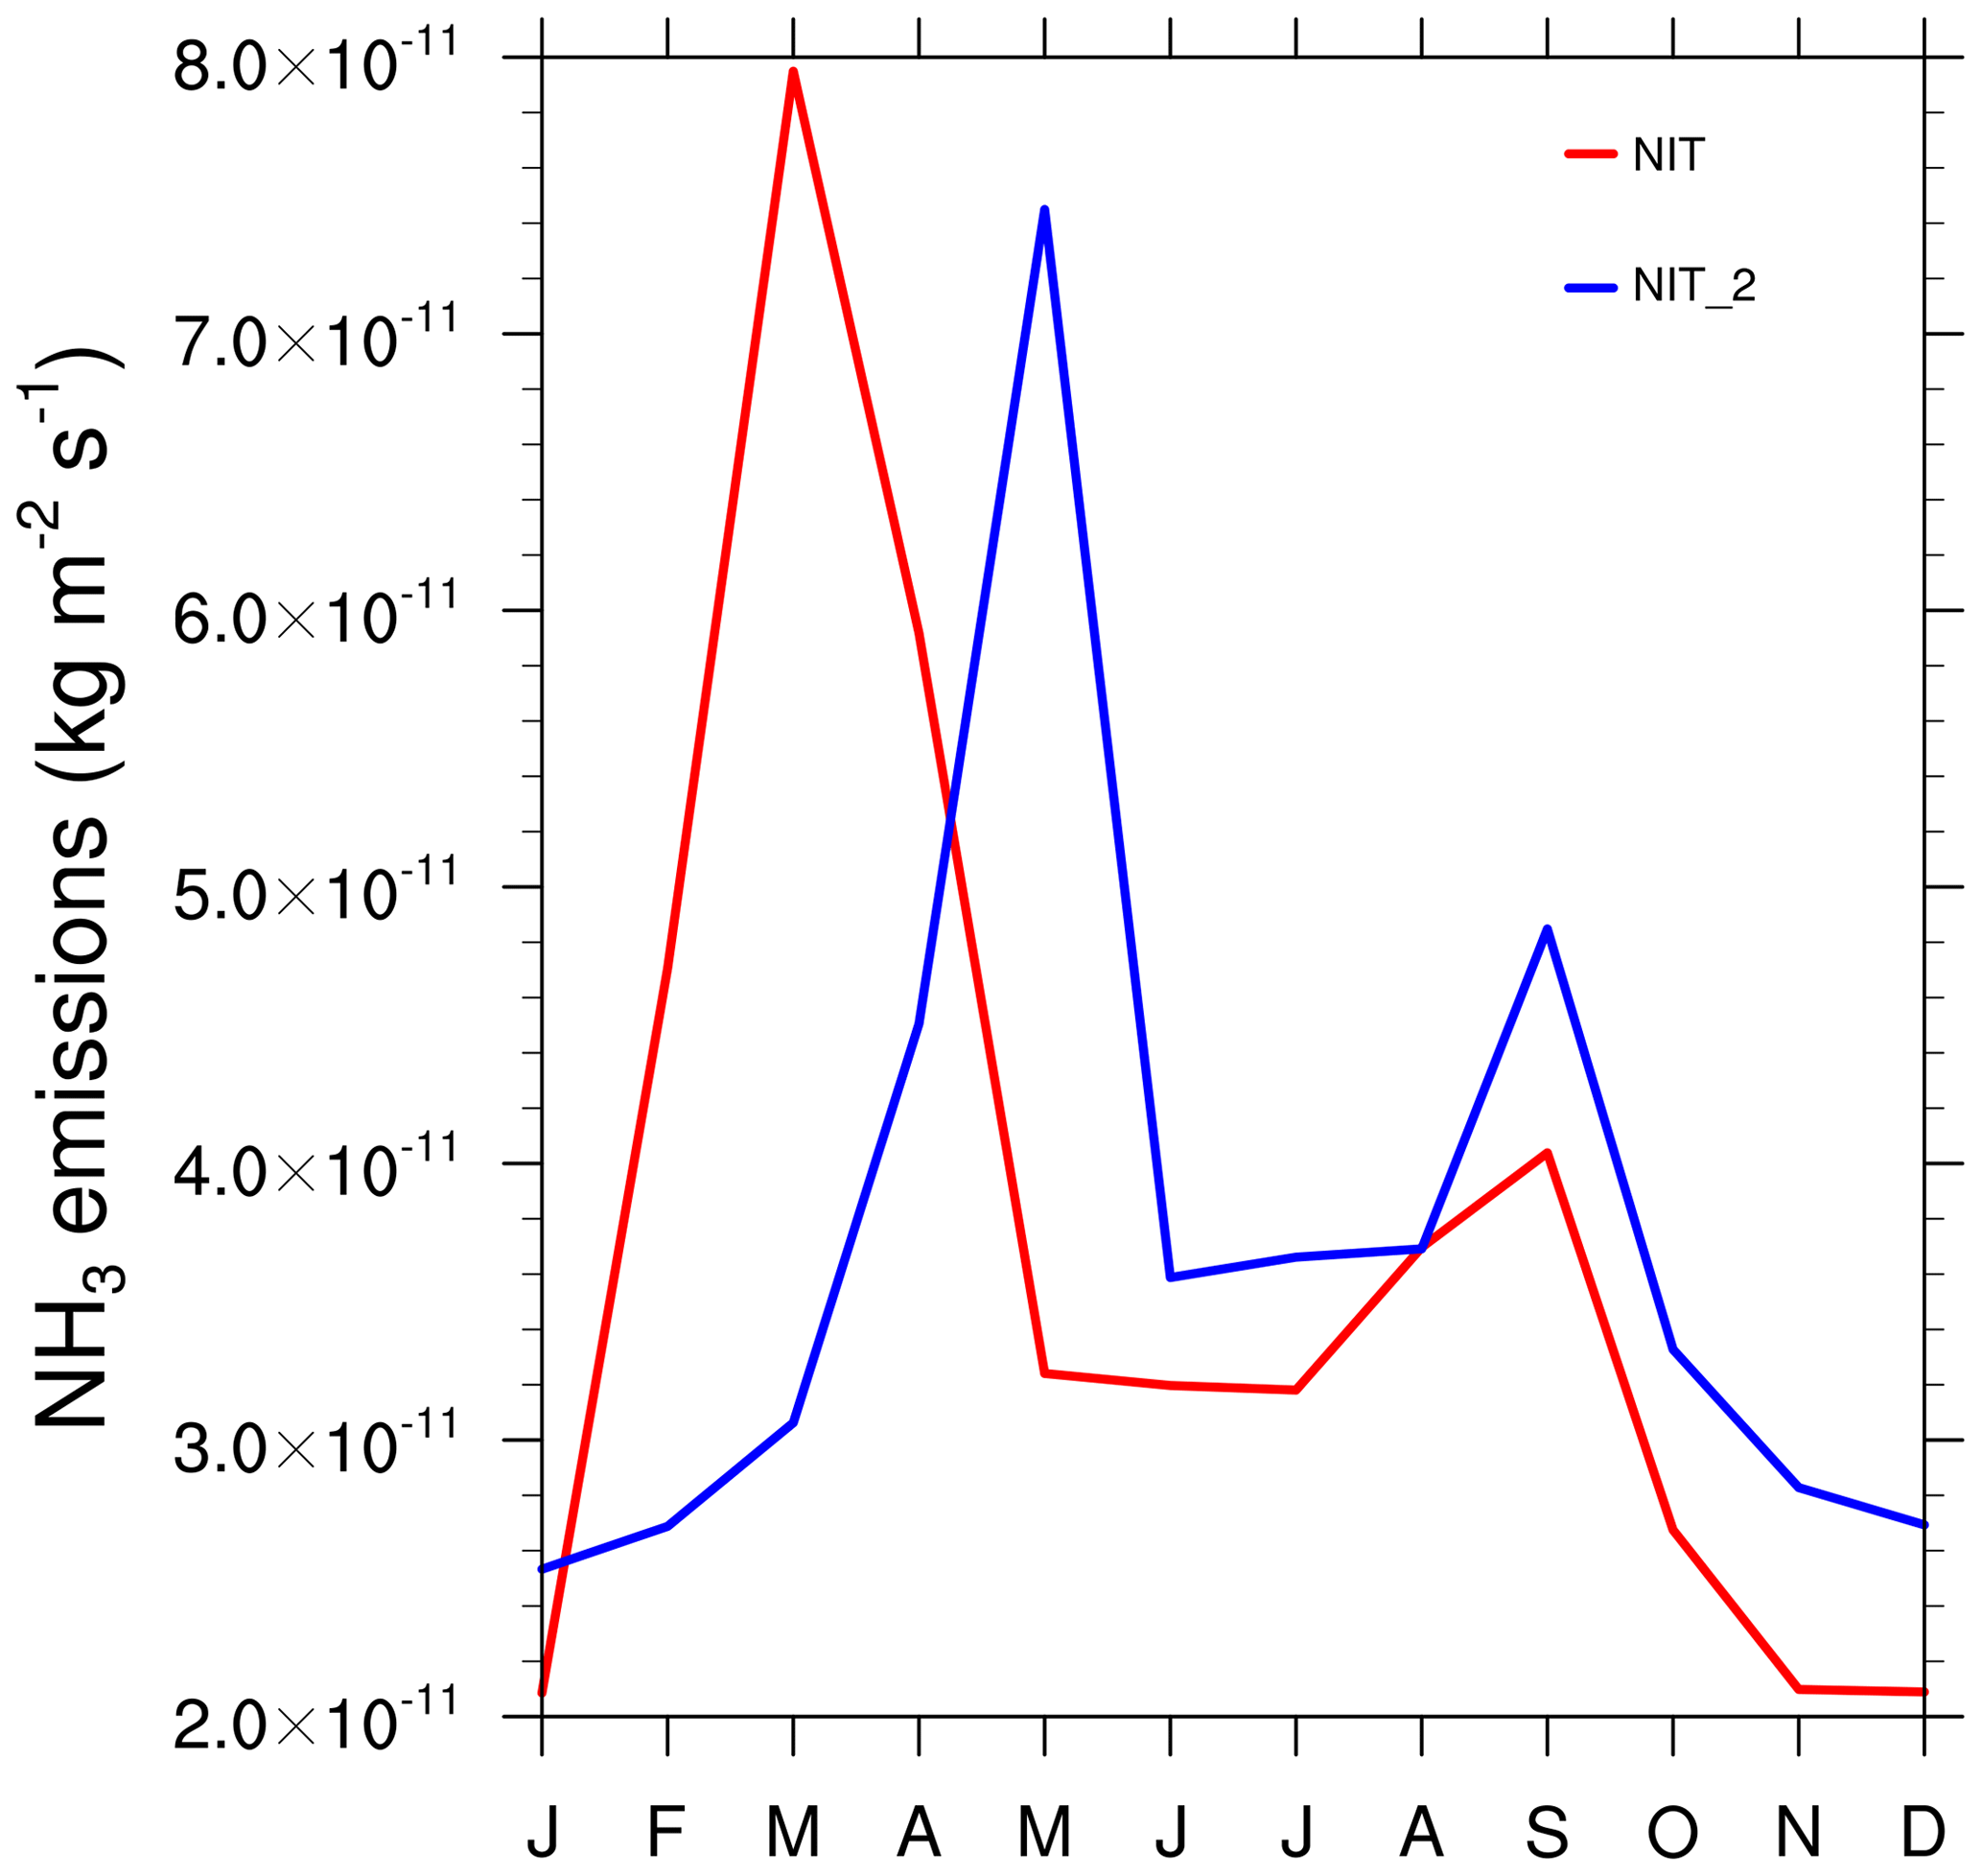
Figure 21979–2016 monthly means of NH3 emissions (kg m−2 s−1) over Europe as defined in Fig. 1, used for NIT (red, based on MACCity) and NIT_2 (blue, from CMIP6) simulations. The annual total is equal in the two versions ( kg m−2 s−1).

Figure 32003–2007 monthly mean of HNO3 surface concentration over Europe (as defined in Fig. 1).
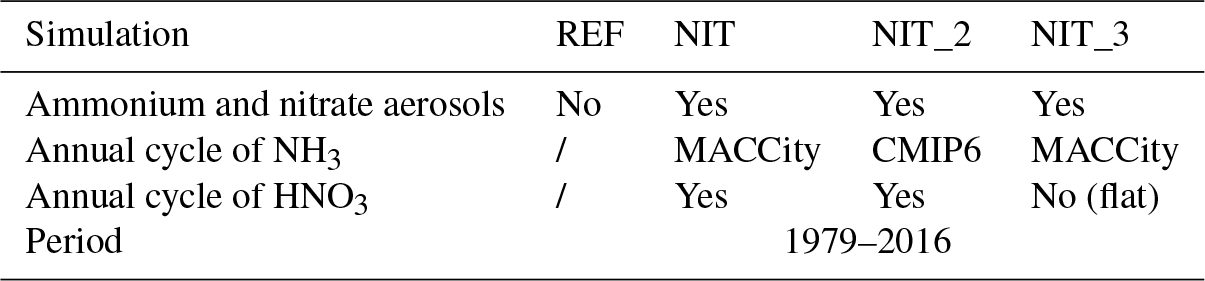
Different sensitivity studies (presented in Sect. 3.2), mostly focused on changes in NH3 emissions (NIT_2, with a different NH3 annual cycle) and HNO3 climatology (NIT_3, with a flat HNO3 annual cycle), will be used in this work.
2.2.2 Gas-to-particle reactions
A specific routine presented here aims at equilibrating the gaseous and particle forms of the nitrate and ammonium species. The following equations are based on the study of Mozurkewich (1993). More details about this dependence can also be found in Seinfeld et al. (1998).
Firstly, the NH3 present in the troposphere will react with H2SO4 to produce ammonium sulfate ((NH4)HSO4). Ammonium sulfate aerosols are not affected by ammonium nitrate production because the formation of ammonium sulfate takes priority over ammonium nitrate formation due to the low vapour pressure of sulfuric acid (Hauglustaine et al., 2014). The reaction for the ammonium sulfate formation will depend on the relative ammonia and sulfate concentrations (Metzger et al., 2002). The total ammonia (TA), total sulfate (TS) and total nitrate (TN) concentrations (kg m−3) are defined as follows:
Ammonium sulfate formation reactions will be different in very sulfate-rich (TS>TA), sulfate-rich () and ammonia-rich TA>2TS) conditions.
Secondly, if all NH3 is consumed by the ammonium sulfate formation, no A&N aerosols are formed but if there is still some NH3, it will neutralize the HNO3. Kp, the equilibrium constant of the reaction of A&N formation, is very dependent of relative humidity (RH) and temperature as detailed below. Its formulation is given by the following relations:
where T is the air temperature (K), and DRH is the deliquescence relative humidity (DRH, %) calculated by
with and p1, p2 and p3 provided by
The ammonia available to neutralize the HNO3 is defined as the total ammonia minus the ammonia required to neutralize the available sulfate:
With sulfate state Γ=1 in very sulfate-rich conditions, 1.5 in sulfate rich conditions and 2 in ammonia rich conditions. If , the A&N concentration (kg m−3) is calculated by the following:
If , A&N dissociate and [NH4NO3] = 0. The concentration of NH3 (kg m−3) at equilibrium can also be computed with this formula. The NH4 concentration (kg m−3) is calculated by the following:
The formation of the accumulation mode, by gas-to-particle reactions, is faster than the coarse mode because the equilibrium is reached faster by small particles.
This equilibrium leads to the formation of nitrate and ammonium aerosols. Note that this routine is run twice in the TACTIC scheme. Indeed, the first call can be seen as the way to remove the quantity of HNO3 used to form nitrate and ammonium particles in the previous time step, and the second call is the method to form them in the present time step. This is coherent with the fact that the HNO3 comes from the CAMS reanalysis which has no nitrate particles.
2.2.3 Heterogeneous chemistry
After the small particles are in equilibrium, the formation of coarse particles by reaction of HNO3 with calcite (part of mineral dust) and sea-salt particles occurs.
A standard first-order reactive uptake parametrization is used to represent the uptake of nitric acid on dust and sea-salt particles and therefore the formation of coarse nitrate particles (Dentener and Crutzen, 1993; Bauer et al., 2004; Fairlie et al., 2010). The loss of HNO3 from the gas phase is represented by the following rate constant k calculated by the following:
N is the number density of dust or sea-salt particles of radius [r, r+dr], MMD is the mass median diameter, Dg is the molecular diffusion coefficient that is pressure- and temperature-dependent, ϑ corresponds to the mean molecular speed that is also temperature-dependent and γ is the reactive uptake coefficient.
One of the limitations of this scheme is the lack of dependence of the uptake coefficient on the aerosol chemical composition, which is not available in ALADIN-Climate. To compensate for that, a Ca2+ limitation for the uptake of HNO3 on dust is introduced. Based on dust source maps published by Claquin et al. (1999), we make the assumption that Ca2+ represents 5 % of total dust mass. Another limitation is the dust parametrization. Indeed, the ALADIN-Climate model only uses three dust bins (0.01 to 1.0, 1.0 to 2.5 and 2.5 to 20 µm) to keep a relatively low computational cost. Foret et al. (2006) suggests that dust size should range from 0.09 to 63 µm with at least eight size bins for a good representation of dust. This limitation must be kept in mind when studying the results. No alkalinity limitation is taken into account for sea-salt particles.
2.2.4 Aerosol properties for A&N
The optical properties used as input for SW radiative transfer calculations of A&N particles (0.18–4.0 µm) have been computed using a Mie code (Toon and Ackerman, 1981). As such aerosols are known to be hydrophilic (Tang, 1979), their sizes, density and optical properties are dependent on ambient (grid-box mean) relative humidity (Hauglustaine et al., 2014). In the ALADIN-Climate model, values of the mass extinction efficiencies, asymmetry parameter and single scattering albedo are tabulated for 12 values of relative humidities: from 0 % to 80 % (10 % increments) and from 80 % to 100 % (5 % increments). The values of hygroscopic growth factor and optical properties for the fine mode of nitrates are the same as those used in GLOMAP (Manktelow et al., 2010). For coarse-mode nitrate, the optical properties are taken from Moffet et al. (2008) and the hygroscopic growth from Gibson et al. (2006). For ammonium aerosols, optical properties used for sulfate are adapted, using a different molar mass (NH4 against NH4(SO4)2 for sulfate). For computations of A&N particles of AOD550 to be compared with remote sensing data, we use mass extinction efficiencies (m2 g−1) as a function of the relative humidity in each model layer. Values for ammonium aerosols are comprised of between 4.3 m2 g−1 (dry state) and 34.9 m2 g−1 (with RH = 95 %). For fine (coarse) nitrates, values are comprised between 4.7 m2 g−1 (dry state) and 34.2 m2 g−1 (with RH = 95 %) (between 0.19 and 0.91).
For the fine mode of A&N, a deposition velocity of 0.15 cm s−1, close to the sulfate deposition velocity already used in the model, is set over all surfaces (ocean, sea ice, land and land ice) for the dry deposition. For the coarse mode of nitrate, the dry deposition is fixed at 1.5 cm s−1, which is close to the values used for coarse dust and sea salt in the model. Sulfate, dust and sea-salt deposition values are detailed in Michou et al. (2015). In ALADIN-Climate, NH3 has the same dry deposition velocity value as sulfur dioxide (between 0.1 and 1.5 cm s−1 according to the surfaces). The sedimentation is also applied for the coarse-mode nitrate (0.13 cm s−1). In terms of scavenging, the two bins of nitrate and ammonium have an efficiency for in-cloud scavenging of 0.8.
3.1 Observations
In this study, different datasets have been used to evaluate the ability of the ALADIN-Climate model at reproducing the A&N concentrations at the surface as well as the total AOD, before investigating the radiative and climatic impacts in present-day conditions. In that context, two monthly satellite datasets have been used to provide a regional estimate of the total AOD550.
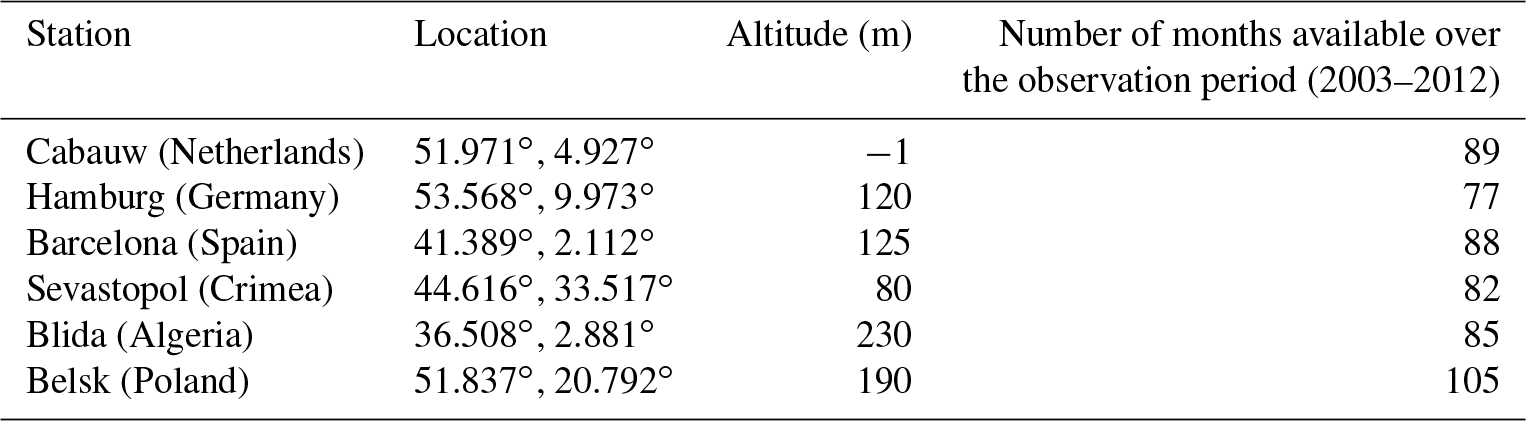
Table 1Station name, location, altitude and number of months available over the observation period (2003–2012) of the six AERONET stations.
Firstly, the MODerate resolution Imaging Spectroradiometer (MODIS, collection 6.1, 1∘ resolution; Tanré et al., 1997; Sayer et al., 2014) is used. MODIS is a 36-band polar orbiting radiometer aboard both EOS Aqua and Terra (both separately used in this work), with equatorial crossing times of about 10:30 and 13:30 UTC, respectively. The MODIS aerosol products are generated from different well-known algorithms, including the Dark Target (DT) algorithms over both the oceans and land and the Deep Blue (DB) algorithm over only land (Kaufman et al., 1997). In this work, the combined DT and DB aerosol product is used. The DT algorithm has an uncertainty in AOD at 550 nm of approximately ±0.05 over land and over ocean. The DB algorithm has an uncertainty of approximately ±0.03 (Georgoulias et al., 2016). MODIS Terra covers the 2001–2016 period and MODIS Aqua the 2003–2016 period.
Secondly, the Multiangle Imaging SpectroRadiometer (MISR, Level 3, 1∘ resolution; Kahn and Gaitley, 2015) has been used to provide a regional estimate of the total AOD550. MISR is a polar orbiting instrument aboard EOS Terra. The MISR aerosol product provides aerosol distributions over both land and oceans. The MISR dayside equator crossing is at about 10:30 a.m. local time. It has an uncertainty in AOD at 550 nm of approximately ±0.05 (Kahn et al., 2010). MISR dataset covers the 2001–2016 period. Both satellites (MODIS and MISR) are available at the NASA Earthdata portal.
In parallel, the measurements obtained from the AErosol RObotic NETwork (AERONET) network provide local column-integrated aerosol properties like the total AOD at different wavelengths (Holben et al., 2001). Six stations (Fig. 1, black triangles) with a long series of data (at least 5 years) were chosen to best represent the domain used: three in the north of Europe in Cabauw, Hamburg and Belsk (Netherlands, Germany and Poland), one in the south in Barcelona (Spain), one in the east in Sevastopol (Crimea) and one in northern Africa in Blida (Algeria). These stations are detailed in Table 1. These sun-photometer observations provide high-quality data. Version 2, Level 2 AOD data have been downloaded from the AERONET website (https://aeronet.gsfc.nasa.gov, last access: 19 March 2019). For comparison to our model results, all AOD data have been calculated at 550 nm using the Ångström coefficient between the closest available upper and lower wavelengths, and we made monthly averaging of original AERONET surface observations. The AOD uncertainty in version 2 (Level 2) AERONET data is ±0.01 in the visible (Eck et al., 1999).
Satellite and AERONET AOD data were obtained during daytime only (even at a given hour for satellites). On the other hand, our AOD averages from our simulations were obtained over the whole day (night plus day), which is therefore a source of uncertainty to take into account.
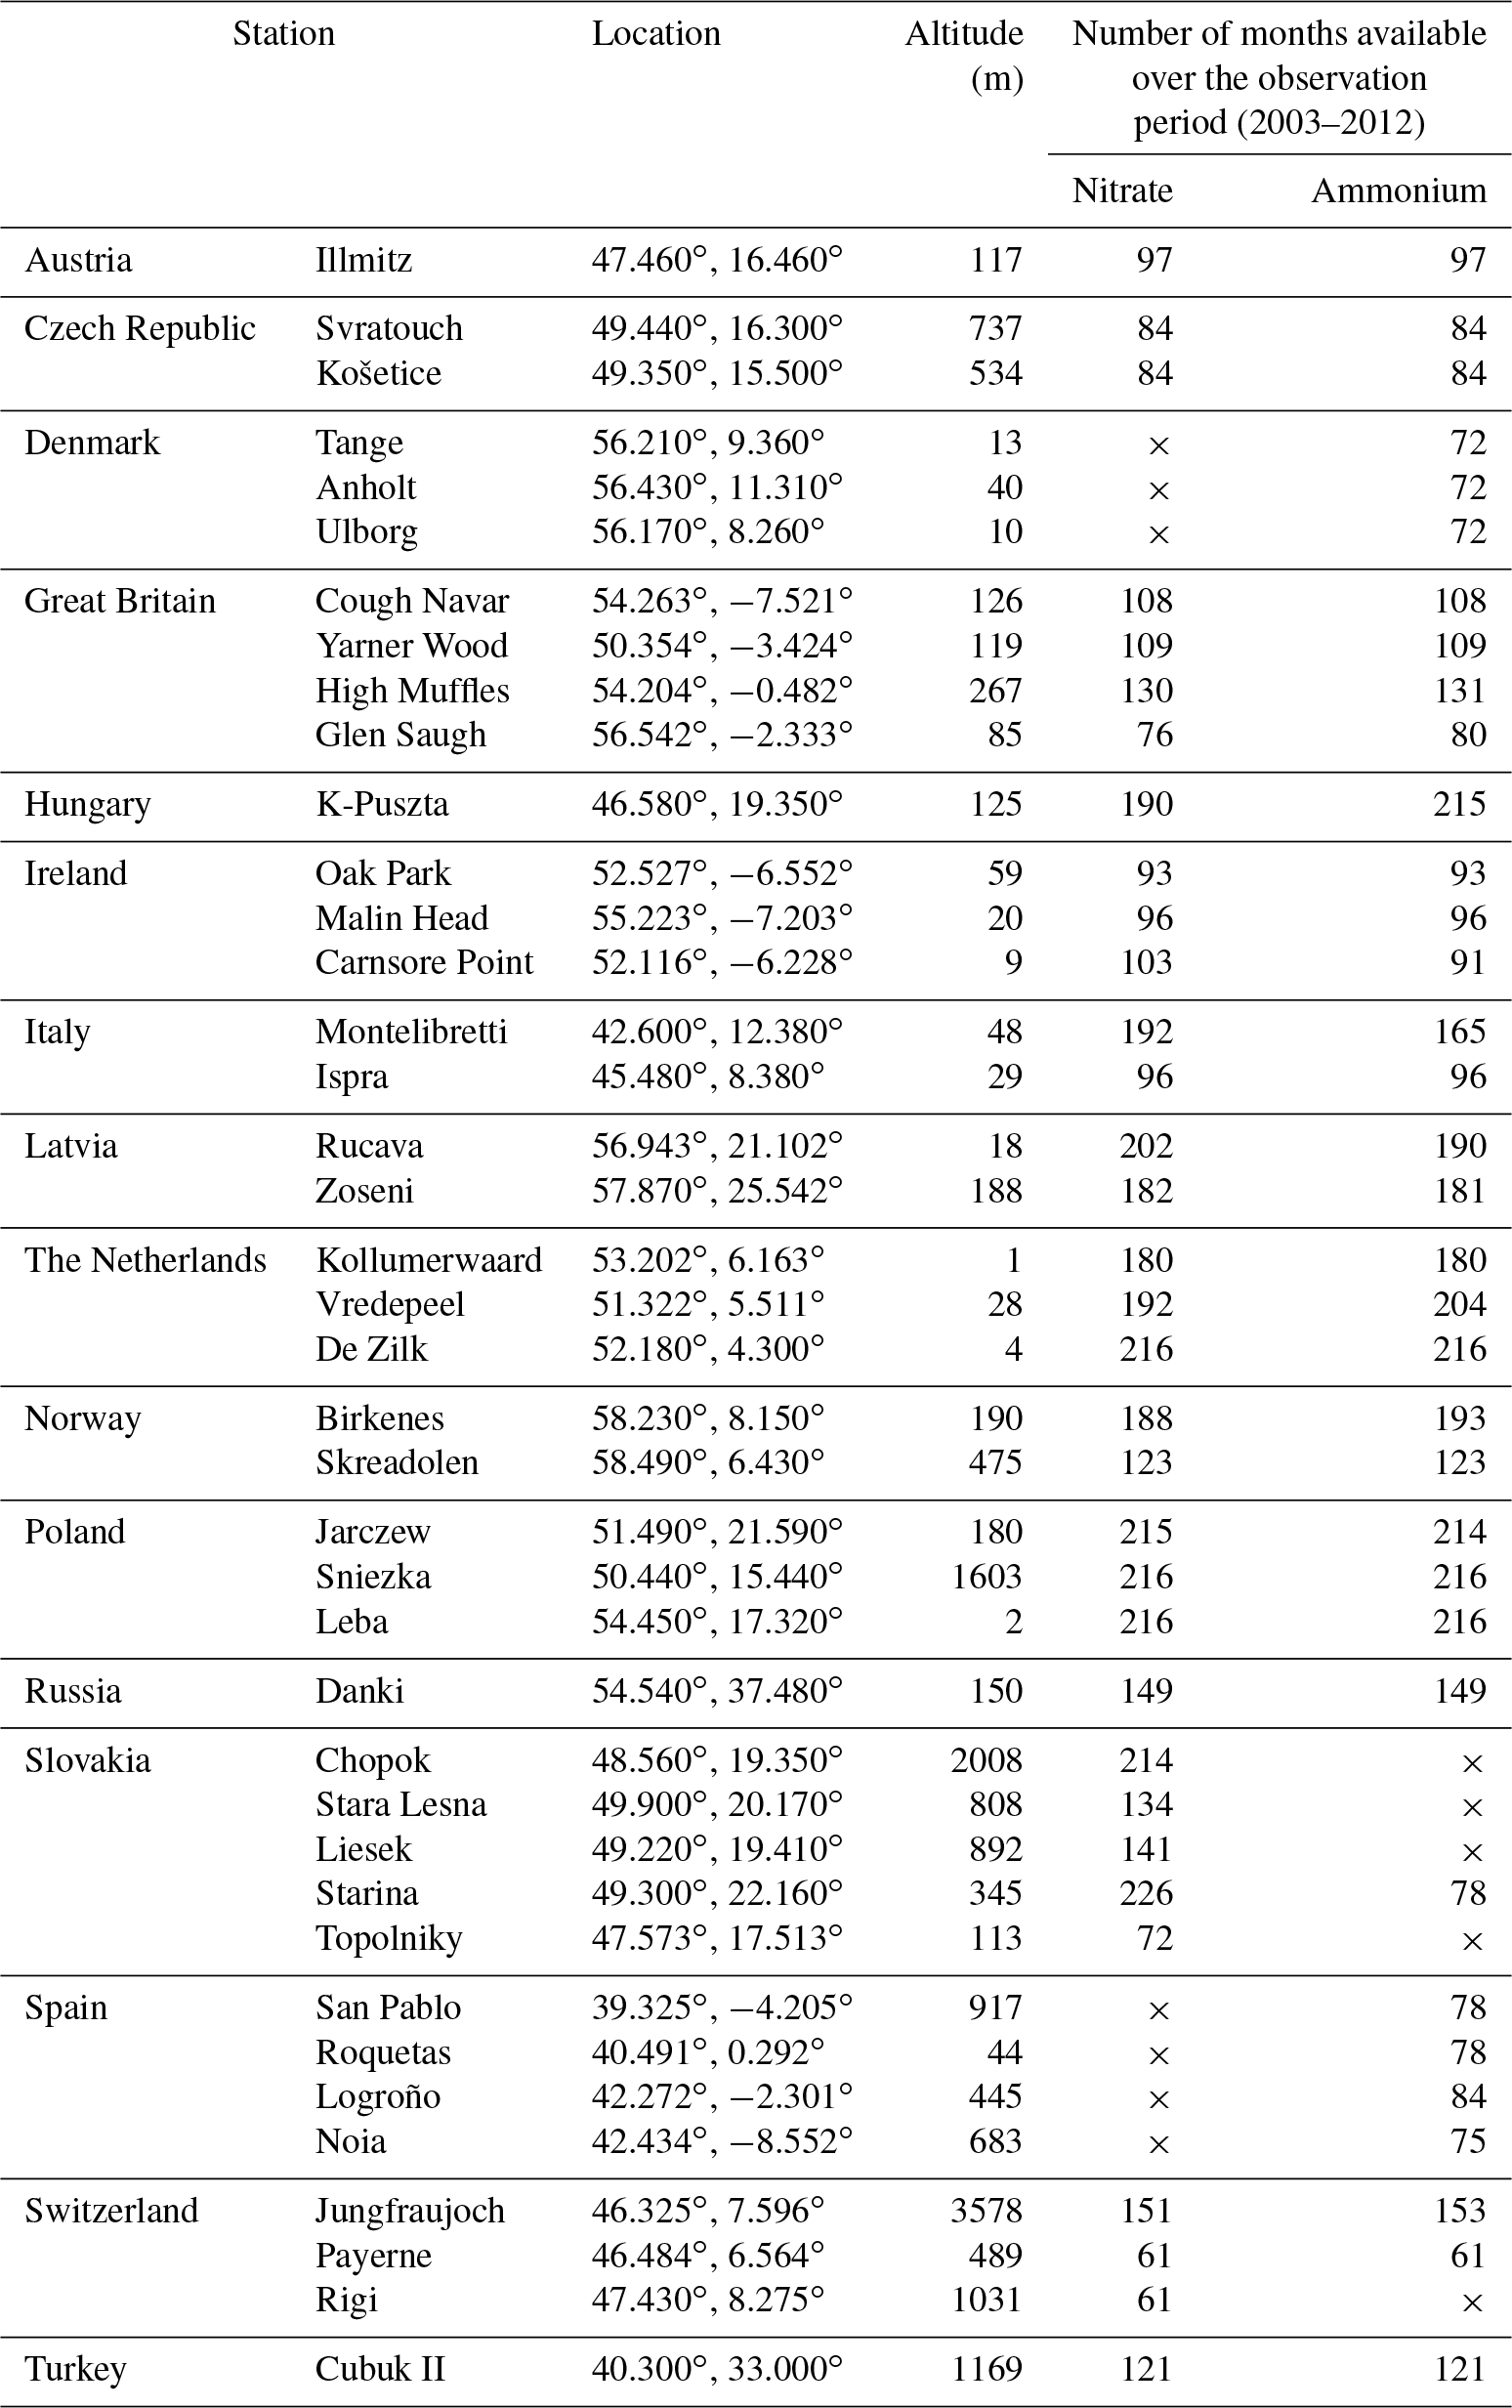
Concerning the evaluation of the A&N surface concentration, the ground-based station network EMEP (The European Monitoring and Evaluation Programme), using standardized monitoring methods and analytical techniques over Europe, has been used (Tørseth et al., 2012). Such surface in situ observations are very useful to evaluate regional climate models as the EMEP stations are located in remote areas representing a larger region, avoiding influences and contamination from local sources (Bian et al., 2017). Contrary to AOD, which is related to the total aerosol column load, they enable us to evaluate the A&N aerosols only with the surface concentration of the nitrate and ammonium aerosols (total suspended particulate). EMEP data are monthly data. The EMEP stations do not have continuous data over the period 1994–2014, and we selected those with a minimum of 5 years of data for each month. Finally, 33 stations were selected for nitrate and 35 for ammonium, symbolized by black dots in Fig. 1. These stations are detailed in Table 2. For comparison to our model results, we made monthly averaging of original EMEP surface observations.
Table 2Station name, location, altitude and number of months available over the observation period (1994–2014) of the 40 EMEP stations.
3.2 Simulations
Two main configurations have been used for the ALADIN-Climate simulations in the present work: one including or one not including A&N aerosols. The simulation defined as the reference for this study is called REF. It used the ALADIN-climate model described previously including all aerosols except A&N. The second simulation, called NIT, is the same simulation but including the new A&N aerosol module. Both of them cover the same period from 1979 to 2016. These two simulations are driven by the ERA-Interim reanalysis, both for the lateral boundary conditions and inside the domain, using the spectral nudging method described in Radu et al. (2008). This method allows us to better impose the large scales from the boundary forcing dataset and therefore better follow the true natural climate variability. The wind vorticity and divergence, the surface pressure, the temperature and the specific humidity are nudged. A constant rate above 700 hPa and a decreasing rate between 700 and 850 hPa are imposed, while the levels below 850 hPa are free. The spatial wavelengths are similarly nudged beyond 400 km, with a transition zone between 200 and 400 km. Finally, this method gives the model enough freedom to generate the aerosols at the surface while keeping the ERA-Interim large-scale conditions that are required to simulate the true chronology.
Additional simulations have been performed for different sensitivity studies, mostly focused on changes in NH3 emissions and HNO3 climatology. Firstly, the impact of NH3 emissions has been investigated using the NIT_2 simulation, which covers the 1979–2016 period. This additional run is similar to the NIT simulation and differs only in the annual cycle used for NH3 emissions. In that sense, NIT_2 uses NH3 emissions which are taken from CMIP6 data (as in the NIT simulation) but without the annual cycle of NH3 MACCity emissions. The annual cycle of NH3 emissions used for both simulations is shown in Fig. 2. NH3 emissions of the NIT simulation (MACCity annual cycle) present an earlier maximum (March) than the one observed for the NIT_2 simulation (CMIP6 raw data), which have a maximum in May. In a second case, we intend to estimate the impact of the seasonality of the HNO3 climatology. Indeed, the HNO3 of the NIT simulation presents a relatively strong peak in April and a second weaker peak in July–August (Fig. 3). In order to evaluate the impact of this annual cycle, the simulation NIT_3 has been realized using a flat annual cycle of HNO3. All the ALADIN-Climate simulations are summarized in Table 3.
4.1 Surface concentration
The A&N aerosol concentrations of the NIT simulation, simulated at the surface by ALADIN-Climate, are evaluated in this section against observations obtained at EMEP stations over the period 1994–2014. Figure 4 presents comparisons of A&N concentrations simulated by the model with the concentrations measured at EMEP stations. The nitrate concentration simulated by ALADIN-Climate corresponds to the cumulated concentration of the accumulation and the coarse mode.

Figure 4Nitrate (a) and ammonium (b) surface concentration (µg m−3) simulated by the ALADIN-Climate model (1994–2014) and measured at EMEP stations (coloured dots) using the same colour palette.
First, it should be mentioned that the model is able to reproduce some areas with high concentrations of nitrate particles (Benelux and Po Valley), with values of about 6 µg m−3 for Benelux and 10 µg m−3 for the Po Valley. Then, the spatial correlation calculated between the model and the EMEP stations is found to be about 0.82 for nitrate concentration. The patterns of the simulated surface nitrate concentrations are in general agreement with different global model results (Myhre et al., 2006; Bauer et al., 2007) and also with the chemistry-transport model LOTOS (Schaap et al., 2004), which show annual average nitrate concentration (year 1995) between 5 and 8 µg m−3 over Benelux. Schaap et al. (2004) also report elevated concentrations over the Po Valley, where the annual averaged concentrations exceed 4 µg m−3. Furthermore, Hauglustaine et al. (2014) showed maximum concentrations of the same order of magnitude as the ALADIN-Climate model of around 4–5 µg m−3 over northern Europe. Figure 4 also indicates that the concentrations calculated over regions near the source areas (Benelux and Po Valley) are generally overestimated by the model, especially in Italy and eastern Europe. For example, the Montelibretti station (near Rome) is characterized by nitrate concentrations of about 4 µg m−3 while the model simulates a surface concentration of about 8 µg m−3. Other stations, particularly in Italy, would be needed to confirm this overestimation by ALADIN-Climate. Furthermore, outside of Europe and more specifically over the western Mediterranean where surface A&N concentrations simulated by ALADIN-Climate are relatively high, there are no available stations for evaluating the simulations. These high concentrations might be due to strong concentrations of nitric acid in the CAMS climatology.
Concerning the ammonium concentration, the model is found to be generally close to in situ EMEP observations with a spatial correlation of 0.86. However, underestimates are detected over northern Europe and Benelux. The regional pattern of the surface ammonium concentrations is found to be in agreement with results shown by Hauglustaine et al. (2014) (2–3 µg m−3 in northern Europe) and also with results presented by Schaap et al. (2004), who show an annual average ammonium concentration (for the year 1995) of around 2–3 µg m−3 over the Po Valley. To summarize, the analyses of comparisons with the EMEP dataset demonstrate the ability of the model to reasonably reproduce the ammonium concentrations at the surface over the European–Mediterranean region, notably their spatial distribution. However, some regions such as eastern Europe or Italy are concerned with a positive bias in nitrate concentrations.
4.2 AOD at local scale (AERONET)
In addition to surface concentrations, comparisons have also been realized at local scale using different AERONET stations. These stations, with at least 5 years of data, were chosen to cover the domain used and include different contrasted aerosol regimes. These stations are represented in Fig. 1 by black triangles. Figure 5 reports comparisons of the average annual cycle of the total AOD measured at AERONET stations and by different satellites (MISR, MODIS Aqua and MODIS Terra) with the one simulated by ALADIN-Climate, including the contribution of each aerosol type. AOD data presented here have been calculated at 550 nm over the period 2003–2012. Certain areas like around Cabauw, represented by one AERONET station (Cabauw) and two EMEP stations (De Zilk and Vredepeel; 60 and 100 km respectively), show a good consistency between the total AOD and the surface A&N concentration, which are well reproduced by the model.
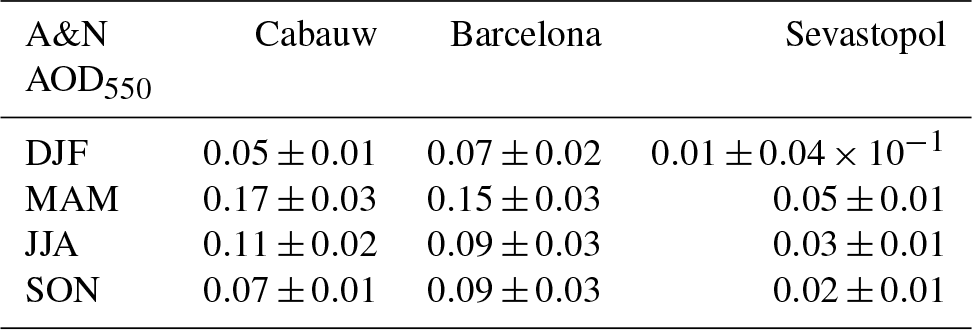
It is important to note that the total nitrate AOD is primarily influenced by the first nitrate bin, which has much higher extinction per mass (5–30 m2 g−1 at 550 nm depending on RH) than the second bin (0.20–0.90 m2 g−1). Previous studies have already shown the predominance of nitrates in the fine fraction of aerosols (Schaap et al., 2002). First, the AOD measured by AERONET stations, such as Sevastopol, Cabauw or Hamburg, is often included between satellites. On the other hand, in Barcelona the AOD measured by the AERONET station is underestimated compared to the different satellites. In addition, at Belsk and Hamburg stations, the AOD measured by the MODIS satellite (both Aqua and Terra) in summer (May, June and July) is considerably higher than that measured by the AERONET station and MISR. A second important point is that the A&N contribution to the total AOD550 is found to be significant, especially near source areas (Benelux, Po Valley) such as Cabauw, Belsk and the Hamburg stations. For example, for Cabauw, Belsk or Hamburg, A&N represents more than half of the total AOD550 during spring and summer, with values comprised of between 0.10 and 0.25. The maxima in A&N AOD550 is generally observed during spring (March, April, May) with values reaching 0.25 at the Cabauw or Hamburg AERONET stations. Indeed, the seasonal cycle of A&N AOD550 follows the same seasonal cycle of NH3 and HNO3 emissions, which are characterized by the highest values during spring. In parallel, stations far from the emission sources (Blida, Sevastopol) are characterized by low A&N AOD550 of 0.02 throughout the year, with a maximum in March (0.10). For all the stations, the minimum of A&N AOD550 is obtained in winter and the maximum in spring, as reported in Table 4 which presents the average seasonal values of the A&N AOD550 simulated by the model (NIT simulation) at three stations: Cabauw (northern Europe), Barcelona and Sevastopol (eastern Europe; far from the sources). Table 4 indicates clearly that the highest values occur in spring, with 0.17 for Cabauw (close from the sources) and 0.05 for Sevastopol (far from the sources). The minimum values are obtained in winter, with 0.05 for Cabauw and 0.01 for Sevastopol. Barcelona is characterized by intermediate values of 0.15 in spring and 0.07 in winter.
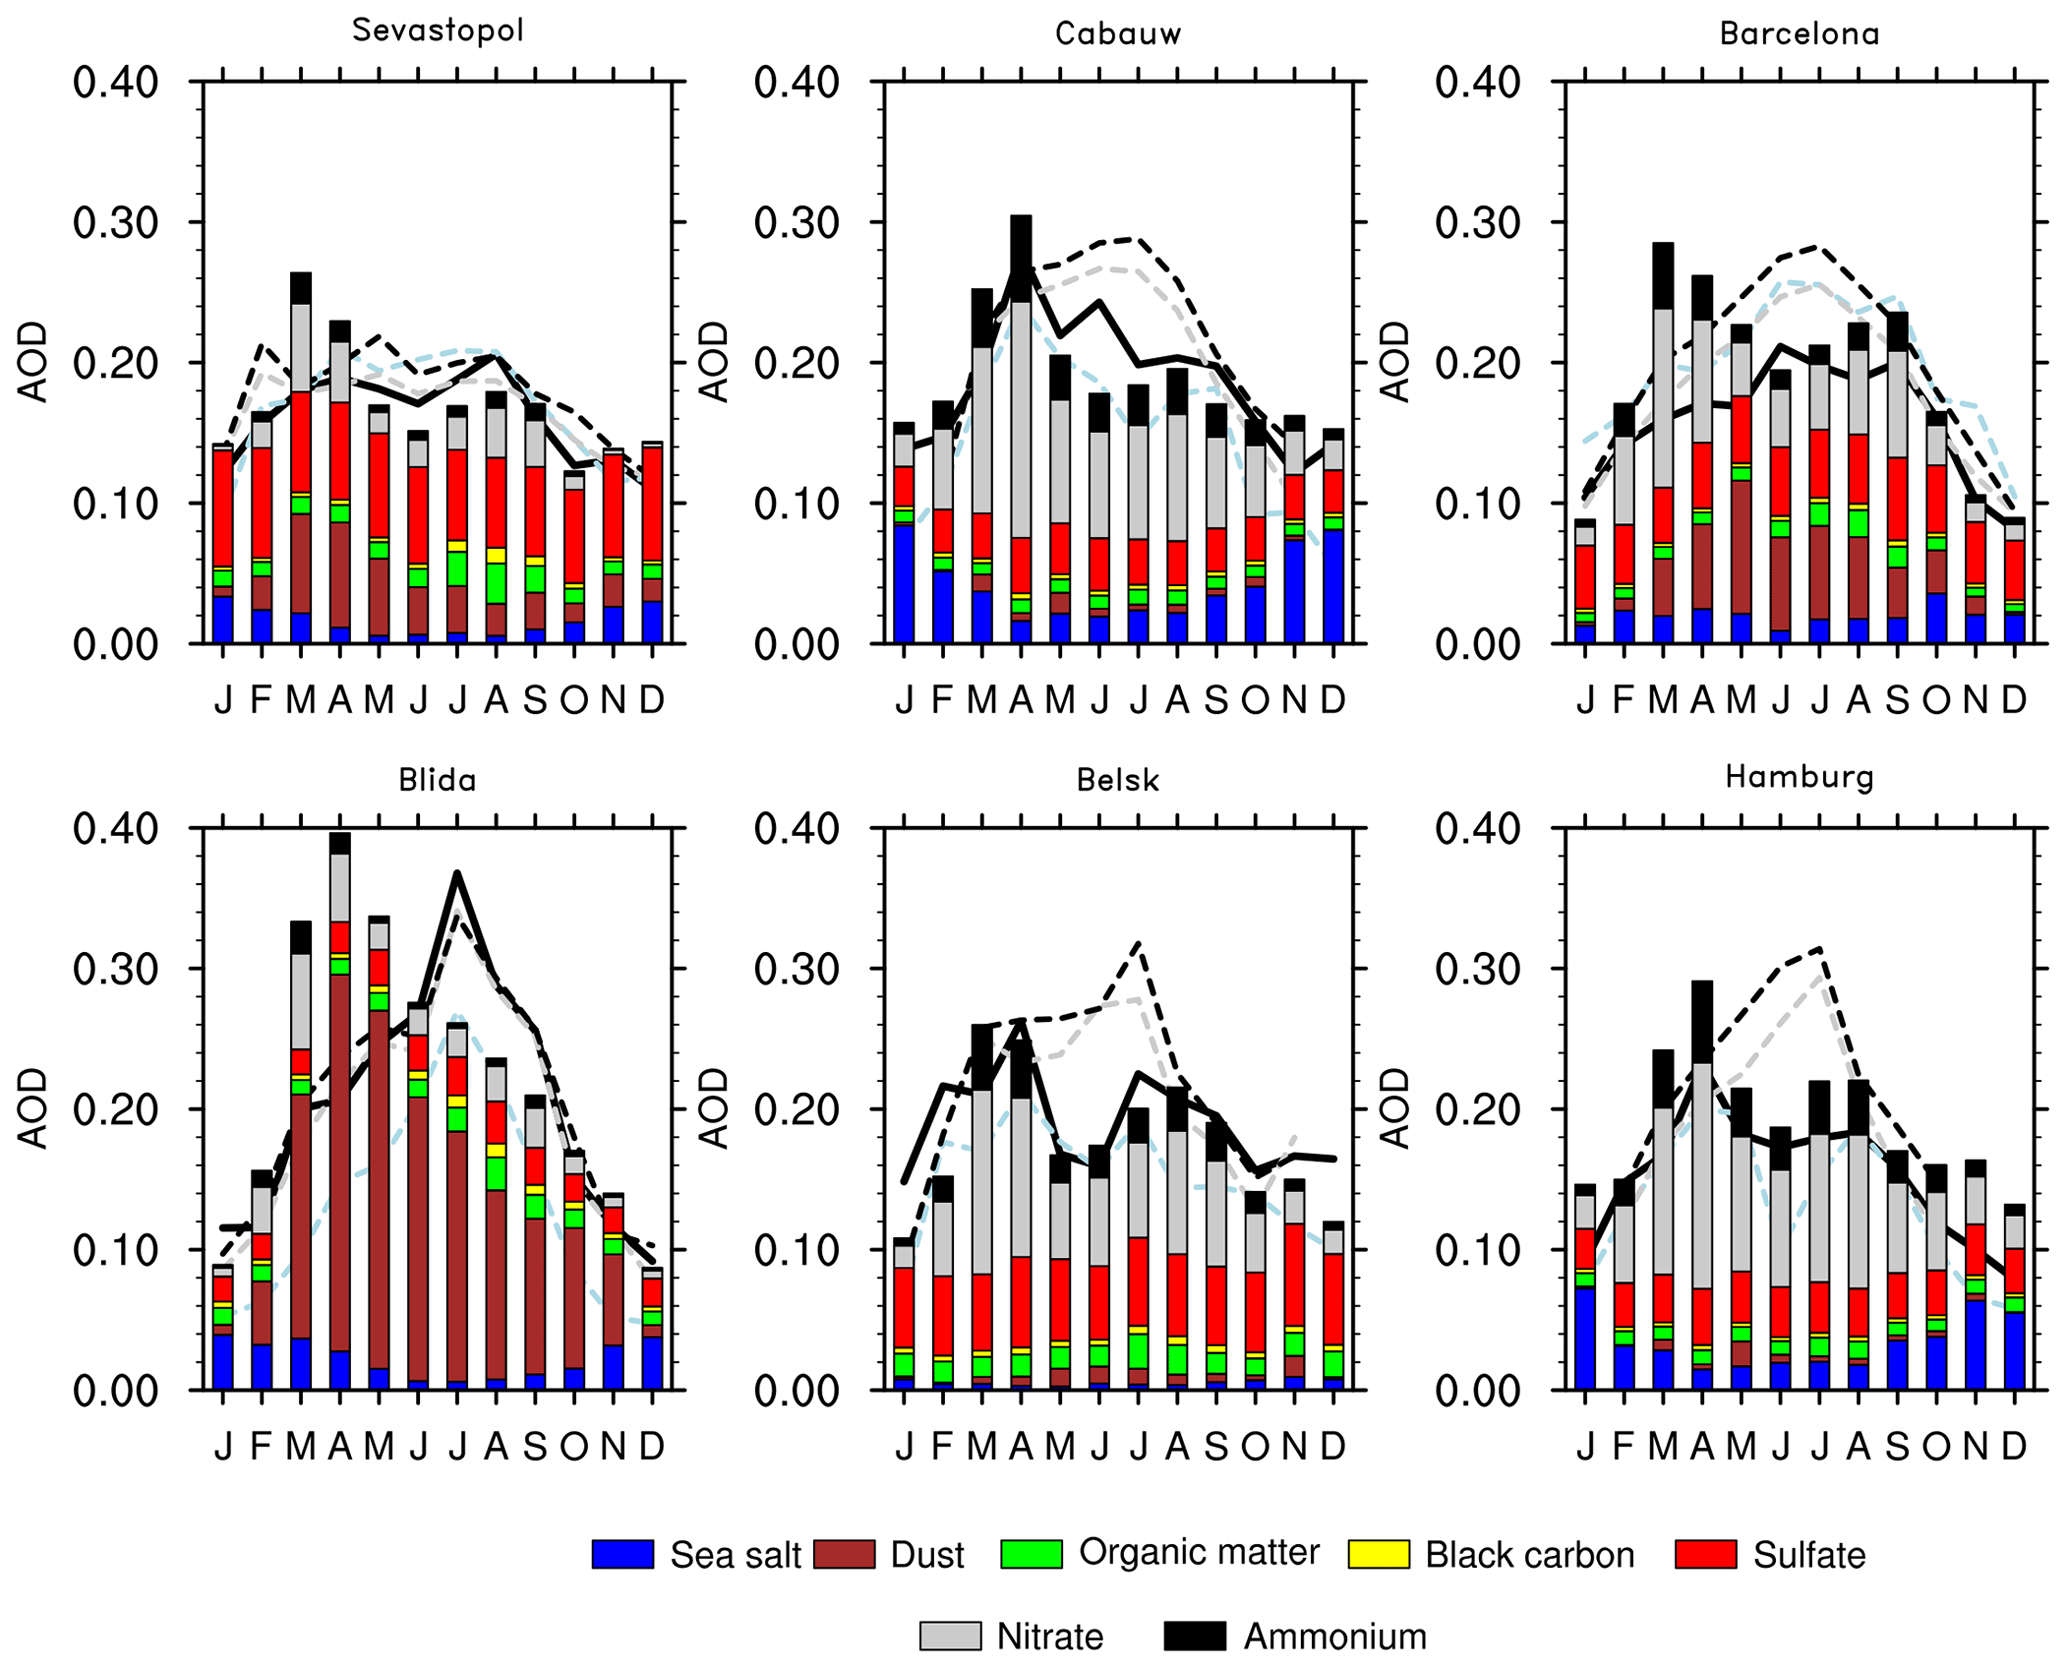
Figure 5Comparison of the average annual cycle (2003–2012) of aerosol optical depth (at 550 nm) simulated by the ALADIN-Climate model (bars), with measurements at six selected AERONET stations (black line) and measurements by MISR (light blue dotted line), MODIS Aqua (grey dotted line) and MODIS Terra (black dotted line). The model contribution of each aerosol type is indicated using different colour bars.
Table 4Mean seasonal A&N AOD550 simulated by the model (NIT simulation) at three AERONET stations (Cabauw, Barcelona and Sevastopol) over the period 2003–2012.
In the majority of cases, as shown in Fig. 5, the ALADIN-Climate simulations demonstrate that the contribution of A&N AOD550 improves the average AOD annual cycle, such as for Sevastopol, Cabauw or Barcelona AERONET stations. This result highlights that A&N aerosols are important to take into account for correctly simulating the spatial and temporal variability of the total AOD550 over the Euro-Mediterranean region. Nevertheless, some biases are identified and the total AOD550 simulated by the ALADIN-Climate model is sometimes too weak in summer, such as for the Cabauw station. This lack of aerosols in summer can be also explained by the absence of anthropogenic secondary organics aerosols (SOA) in the ALADIN-Climate model, since only the natural SOA are considered through the climatology of Dentener et al. (2006). It can be also explained by the absence of organic nitrates, which might significantly contribute to the fine nitrate aerosol (34 % to 44 % of submicron aerosol nitrate) in regions with high nitrate concentrations (Kiendler-Scharr et al., 2016). Furthermore, such local comparisons between the model (with an horizontal resolution of 50 km) and AERONET data are related to uncertainties due to the representativeness of sun-photometer observations when compared to the model grid point mean.
4.3 AOD at regional scale
In addition to local comparisons at EMEP and AERONET stations, we have extended our analyses to the regional AOD spatial distribution using different satellite products (MODIS and MISR). The average total AOD550 for the REF (without A&N particles), the NIT simulation (including A&N) and the satellite observations over the period 2001–2016 (2003–2016 for MODIS Aqua) are summarized in Fig. 6.

Figure 6Total aerosol optical depth (at 550 nm) simulated by the ALADIN-Climate model for the NIT and REF simulations and measured from MODIS and MISR, averaged over the period 2001–2016 (2003–2016 for MODIS Aqua).
First, Fig. 6 indicates that the regional spatial pattern of AOD550 simulated by the ALADIN-Climate model is improved over Europe in the NIT simulation relatively to the REF simulation when compared to satellite data (MODIS and MISR). As A&N aerosol concentrations are found to be less important over the Mediterranean Sea and Africa, there are logically few differences between the NIT and REF simulations in these regions. Over Europe, Fig. 7 shows that the additional AOD550 due to A&N aerosols can explain part of the negative bias in the REF simulation, especially concerning Benelux and the Po Valley. The REF simulation presents AOD550 equal to 0.09 (at 550 nm) on average over Europe while the NIT simulation presents higher values (0.16 at 550 nm) in a better agreement with satellite data, ranging from 0.13 to 0.19. It should be noted, however, that the different satellite data show large differences between themselves. Concerning the total AOD550 over the Mediterranean Sea, satellite data (MODIS and MISR) indicate values between 0.20 and 0.22. In this case, the NIT simulation shows a mean value of 0.22, producing a slight improvement compared to the REF simulation (mean of 0.19). All the results are summarized in Table 5 for the different ALADIN-Climate simulation and satellite data. Both domains (Europe and the Mediterranean Sea) are represented in Fig. 1. Compared to other modelling studies including A&N aerosols over the Euro-Mediterranean region, the simulated A&N AOD550 by the ALADIN-Climate model are found to be consistent with those reported by Hauglustaine et al. (2014) with values comprised between 0.15 and 0.25 over Europe. More specifically, Fig. 7 indicates highest values of A&N AOD550 over Benelux (0.07) and the Po Valley (0.09) which are a little bit higher than Hauglustaine et al. (2014), who report a maximum about 0.05 in northern Europe. Figure 7 also shows significant values over the Red Sea (near 0.1), which are certainly due to high HNO3 concentration over this region. It should be noted that Ammonium AOD550 presents the same spatial distribution as nitrates over Europe, with maxima over Benelux and the Po Valley but lower in magnitude than nitrates. Indeed, ammonium AOD550 reaches up to 0.06 over the Po Valley and 0.04 over Benelux.
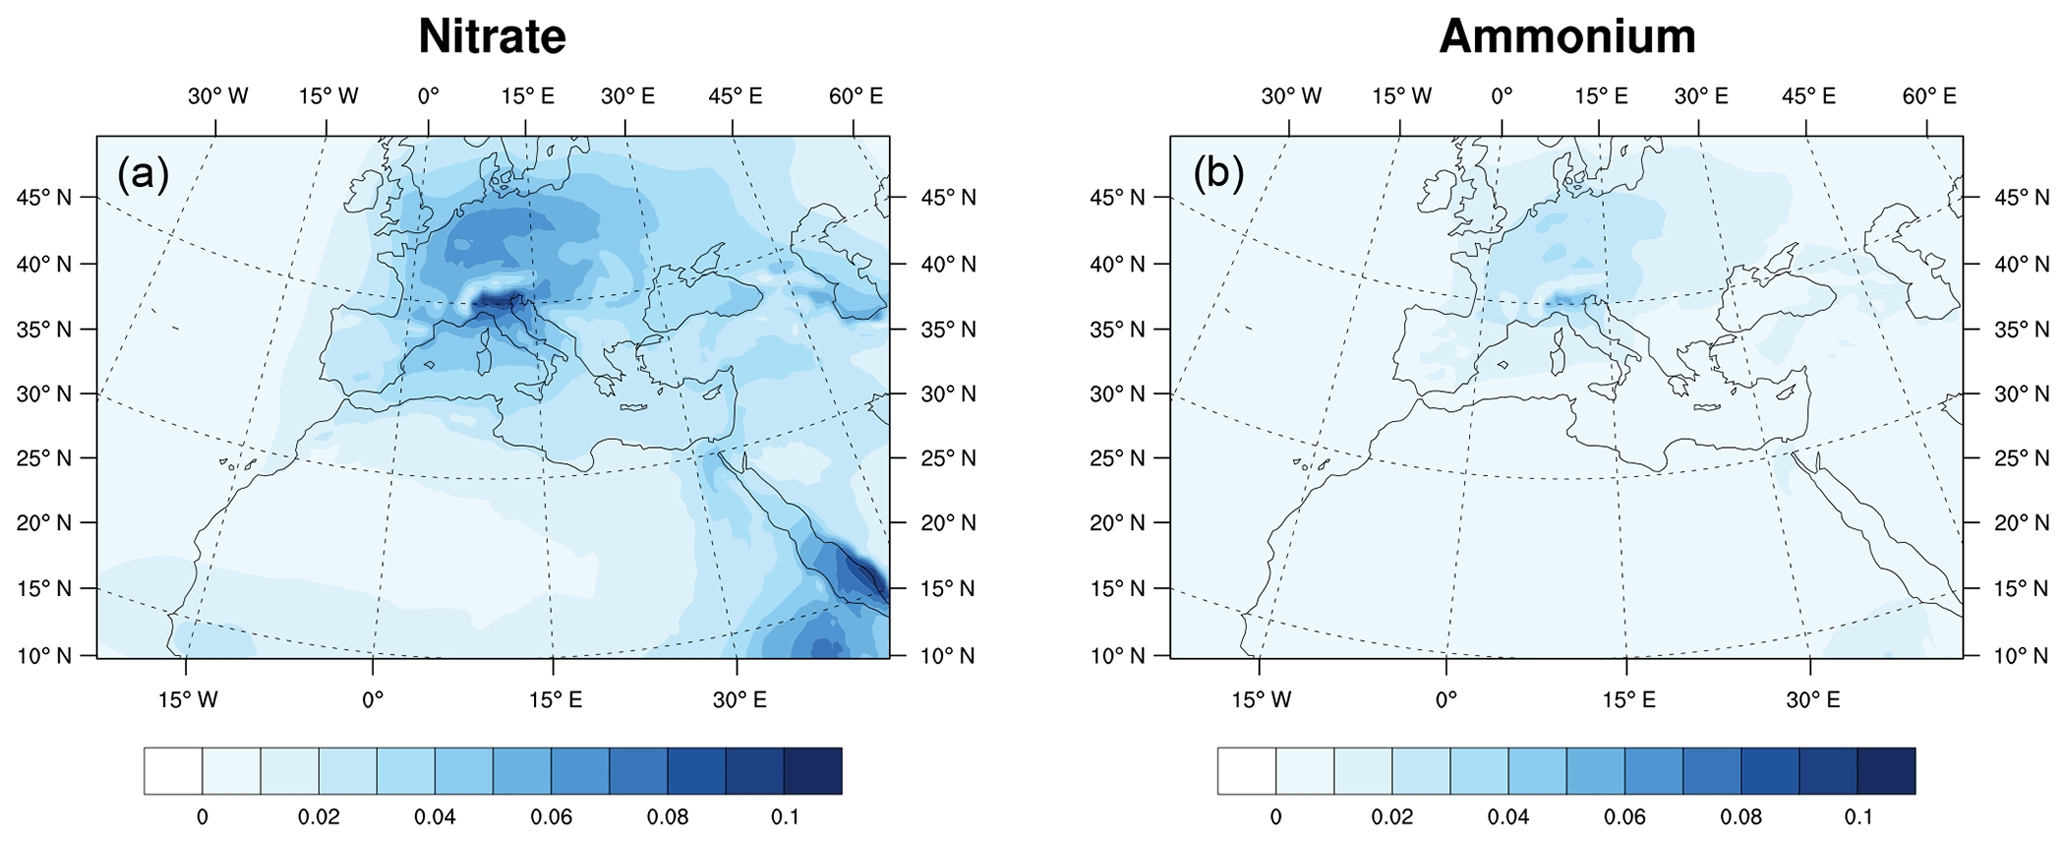
Figure 7Optical depth of nitrate (a) and ammonium (b) at 550 nm simulated by ALADIN-Climate over the period 2001–2016 (NIT simulation).
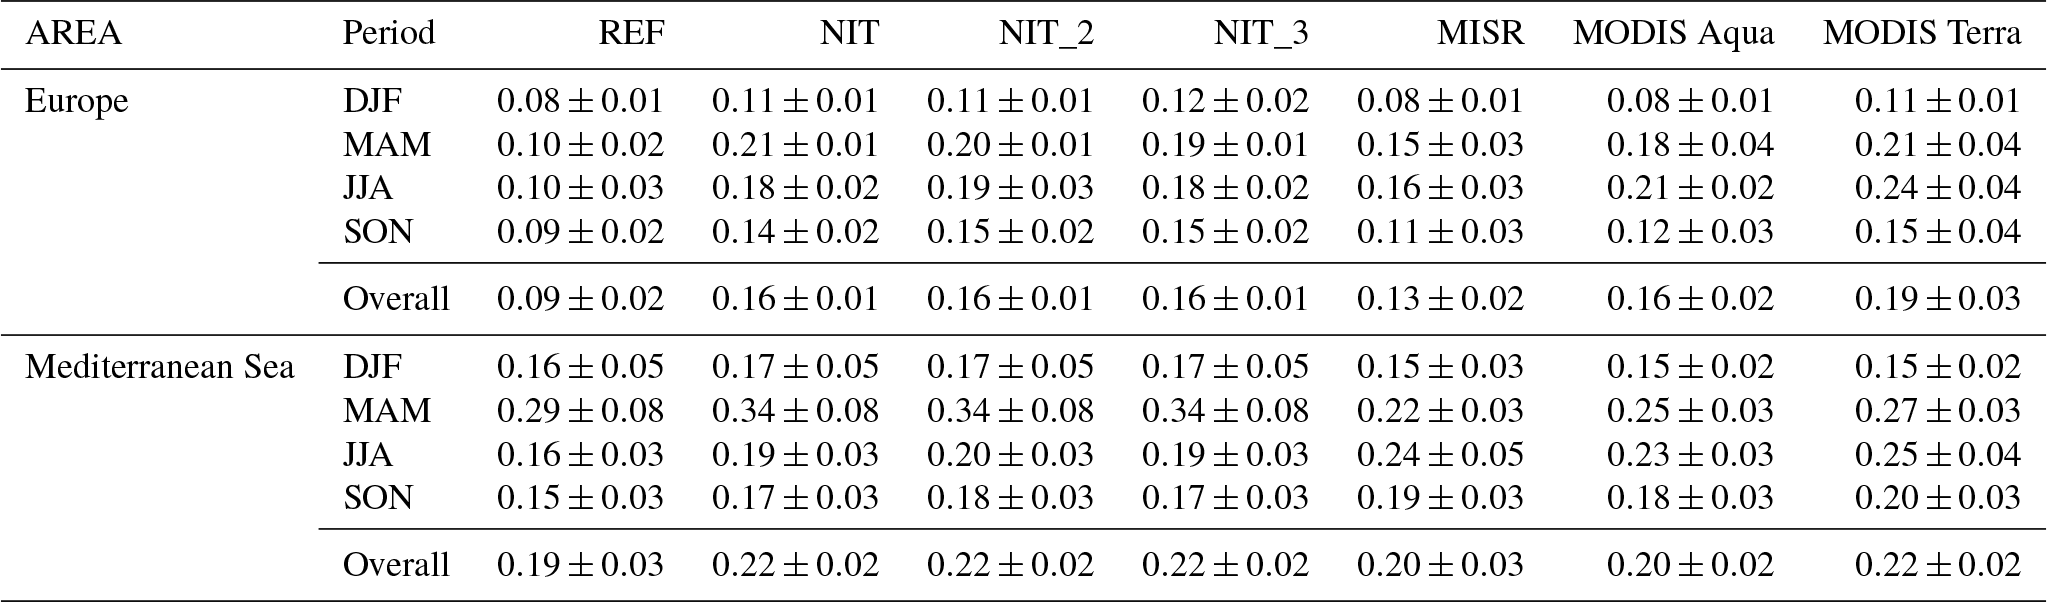
Table 5Seasonal averages and annual mean total AOD550 simulated by ALADIN-Climate for NIT and REF configurations and measured by MODIS and MISR over the period 2001–2016 (2003–2016 for MODIS Aqua).
4.4 AOD annual cycle at regional scale
The annual cycle of the total aerosol AOD550 (2001–2016) simulated by ALADIN-Climate and measured by satellite instruments (MODIS and MISR) over the two different domains considered (Europe and the Mediterranean Sea; see Fig. 1) is presented in Fig. 8. The model results indicate that the A&N AOD550 represent 40 % of the total AOD over Europe with an average of 0.07, demonstrating the importance of A&N particles in terms of radiative budget over this region. Unlike to REF, A&N AOD550 over Europe in the NIT simulation is found to be of the same order of magnitude as satellite observations. Over Europe, the NIT simulation in Fig. 6 also indicates that A&N aerosols significantly improve the simulated total AOD550 annual cycle compared to satellite observations. Indeed, the increase in AOD550 from winter to spring is now more important in NIT (0.11 to 0.21) than in REF (0.08 to 0.10), which is in better agreement with the different satellite datasets, ranging from 0.08–0.11 in winter to 0.15–0.21 in spring. Moreover, the NIT simulation presents two peaks in April and in August as in MISR data. However, the annual cycle of MODIS (Terra and Aqua) is found to be significantly different from MISR, with a single maximum during the summer period. The NIT simulation also presents a positive bias in spring (February, March and April) and a negative bias in summer (May, June and July) compared to MODIS data. Over the Mediterranean Sea, AOD550 is overestimated during spring (March, April and May) in both REF and NIT simulations, and underestimated during summer, probably due to discrepancies in the annual cycle of dust aerosols. This overestimate during spring and underestimate during summer can be seen in Fig. 5 with the Blida station located in northern Algeria near the Mediterranean Sea.
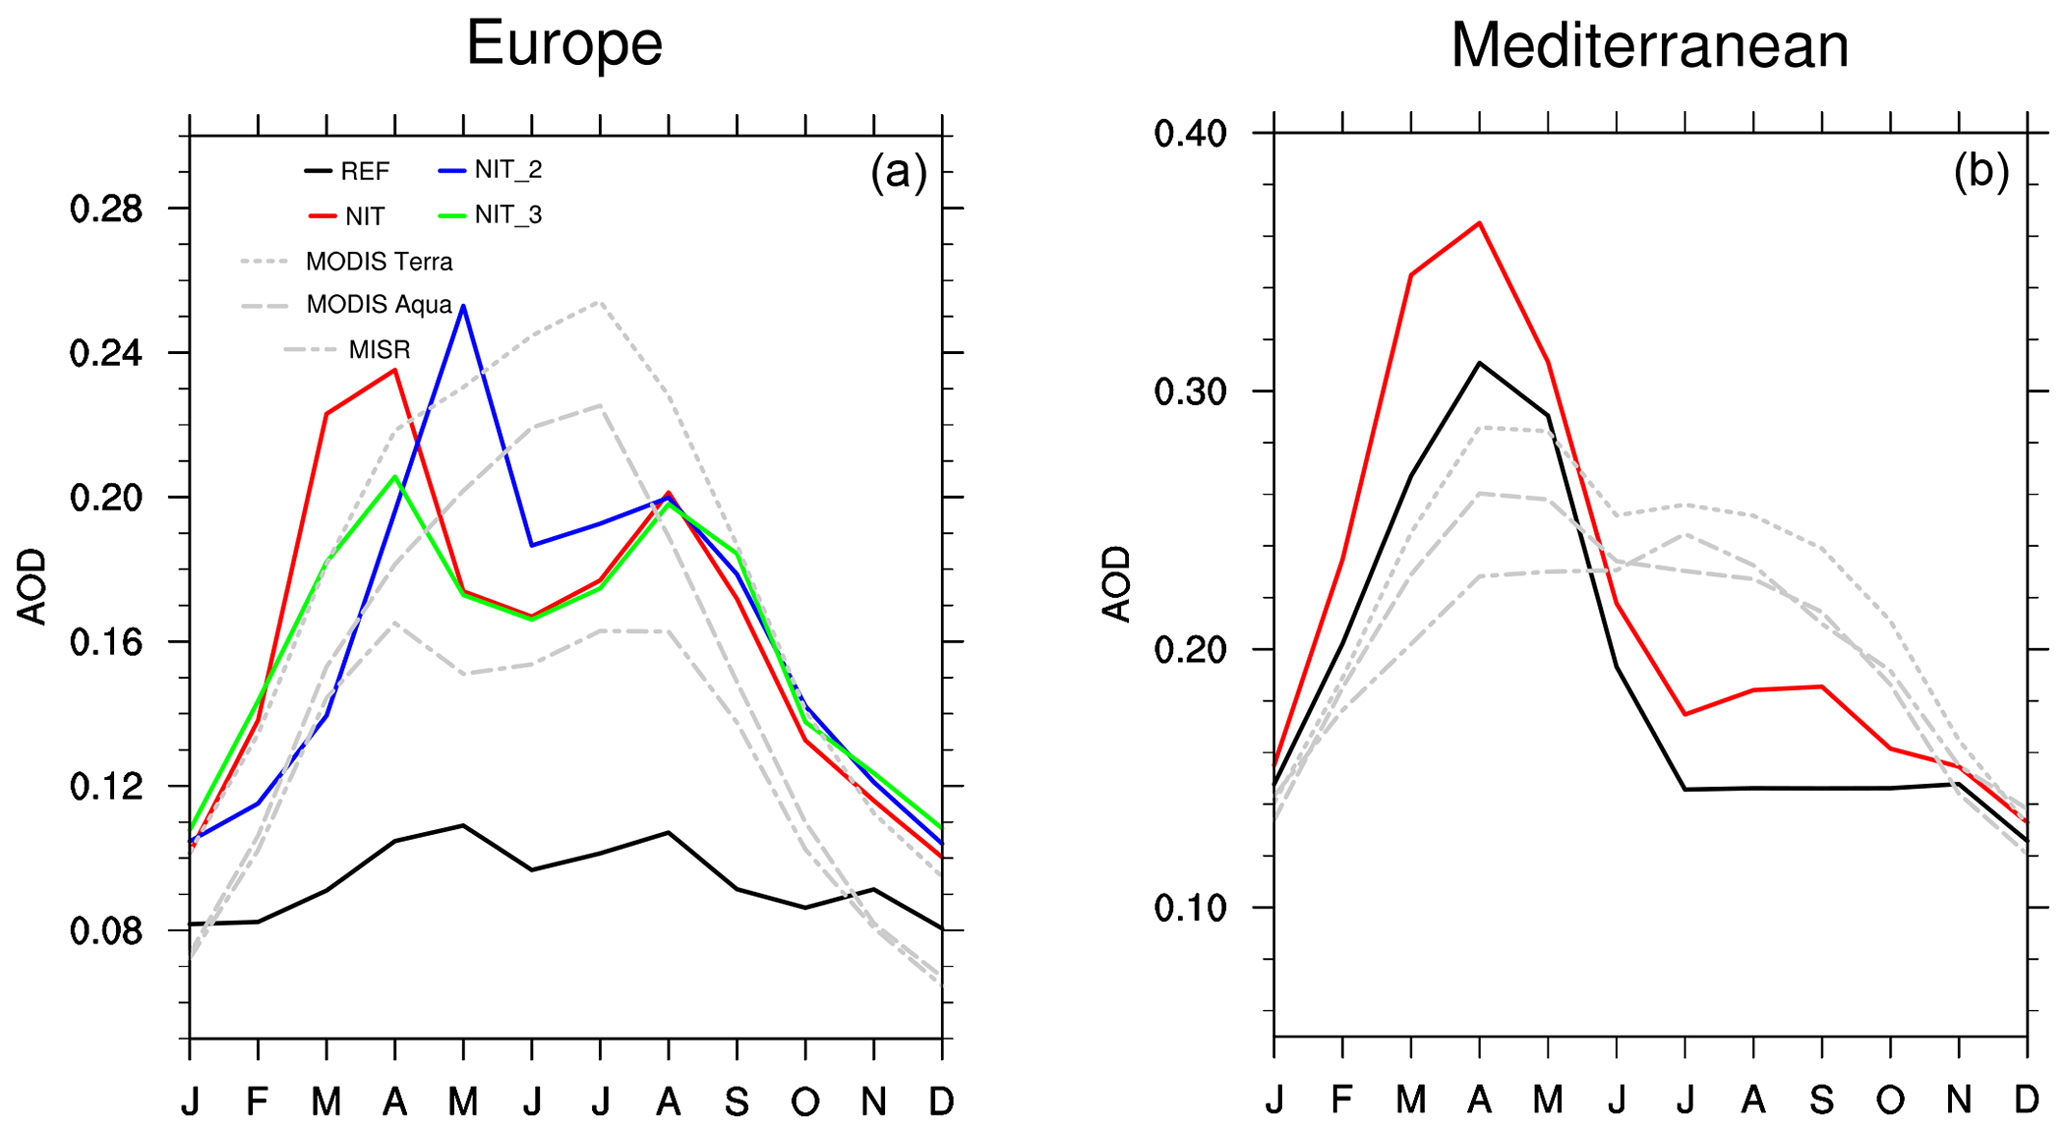
Figure 8Average total aerosol AOD550 annual cycle simulated by ALADIN-Climate, over the period 2001–2016 (2003–2016 for MODIS Aqua), with (NIT) and without (REF) A&N and measured by two satellite instruments (MODIS and MISR) over Europe (a) and the Mediterranean Sea (b).
Despite this bias, the peak present in MODIS datasets in April is well reproduced by ALADIN, and highlighted in the NIT simulation. Nevertheless there is no clear improvement in AOD550 over the Mediterranean Sea when adding nitrate aerosols.
4.5 Sensitivity tests
The different biases discussed previously can be due to numerous uncertainties, such as the dry or wet deposition, the hygroscopic and optical properties, and especially the precursor species of A&N aerosols (NH3 emissions or HNO3 concentrations). For this last reason, two sensitivity tests were carried out over Europe. The first concerns the annual cycle of NH3 emissions and the second the annual cycle of HNO3.
Figure 9 shows the impact of the change in NH3 emissions (NIT_2 simulation) and HNO3 concentration (NIT_3 simulation) at four EMEP stations. The confidence interval associated with observations (light blue spread) has been calculated using the number of years available for each station with a significance level of 95 %. The different stations, with continuous data over 16 years, are located in the Netherlands, Italy, Turkey and Russia to represent different aerosol regimes. At these stations, the nitrate concentration estimated from the EMEP network is fairly stable during the year with 6 µg m−3 at the beginning of the year and about 3–4 µg m−3 at the end at De Zilk where the amplitude is maximum. In the eastern part of the domain (Cubuk and Danki stations), the nitrate concentrations observed are very low and comprised between 0 and 1 µg m−3 throughout the year. The results indicate that the NIT simulation, as well as the two sensitivity tests (NIT_2 and NIT_3), are quite different from the observations at these four stations. Indeed, the ALADIN-Climate model presents an overestimate of the nitrate surface concentration especially with a high peak during the spring (March, April, May). Except at the De Zilk station, the NIT simulation presents an earlier peak in the spring than the NIT_2 simulation due to its annual cycle of NH_3 emissions (Fig. 2). At the De Zilk station, the NIT_3 simulation with a flat annual cycle of HNO3 shows nitrate concentrations at the surface closer to EMEP observations, with relatively constant values ranging from 5 to 8 µg m−3. For other stations, this simulation reveals overestimates of nitrate surface concentrations compared to EMEP data. Several parameters may explain this overestimate of the simulated nitrate concentration as excessive emissions of ammonia or too-high nitric acid concentration in the climatology used in the ALADIN-Climate model. Indeed, Bian et al. (2017) have shown that a good nitrate simulation depends on good simulations of precursors, such as NH3 and HNO3.
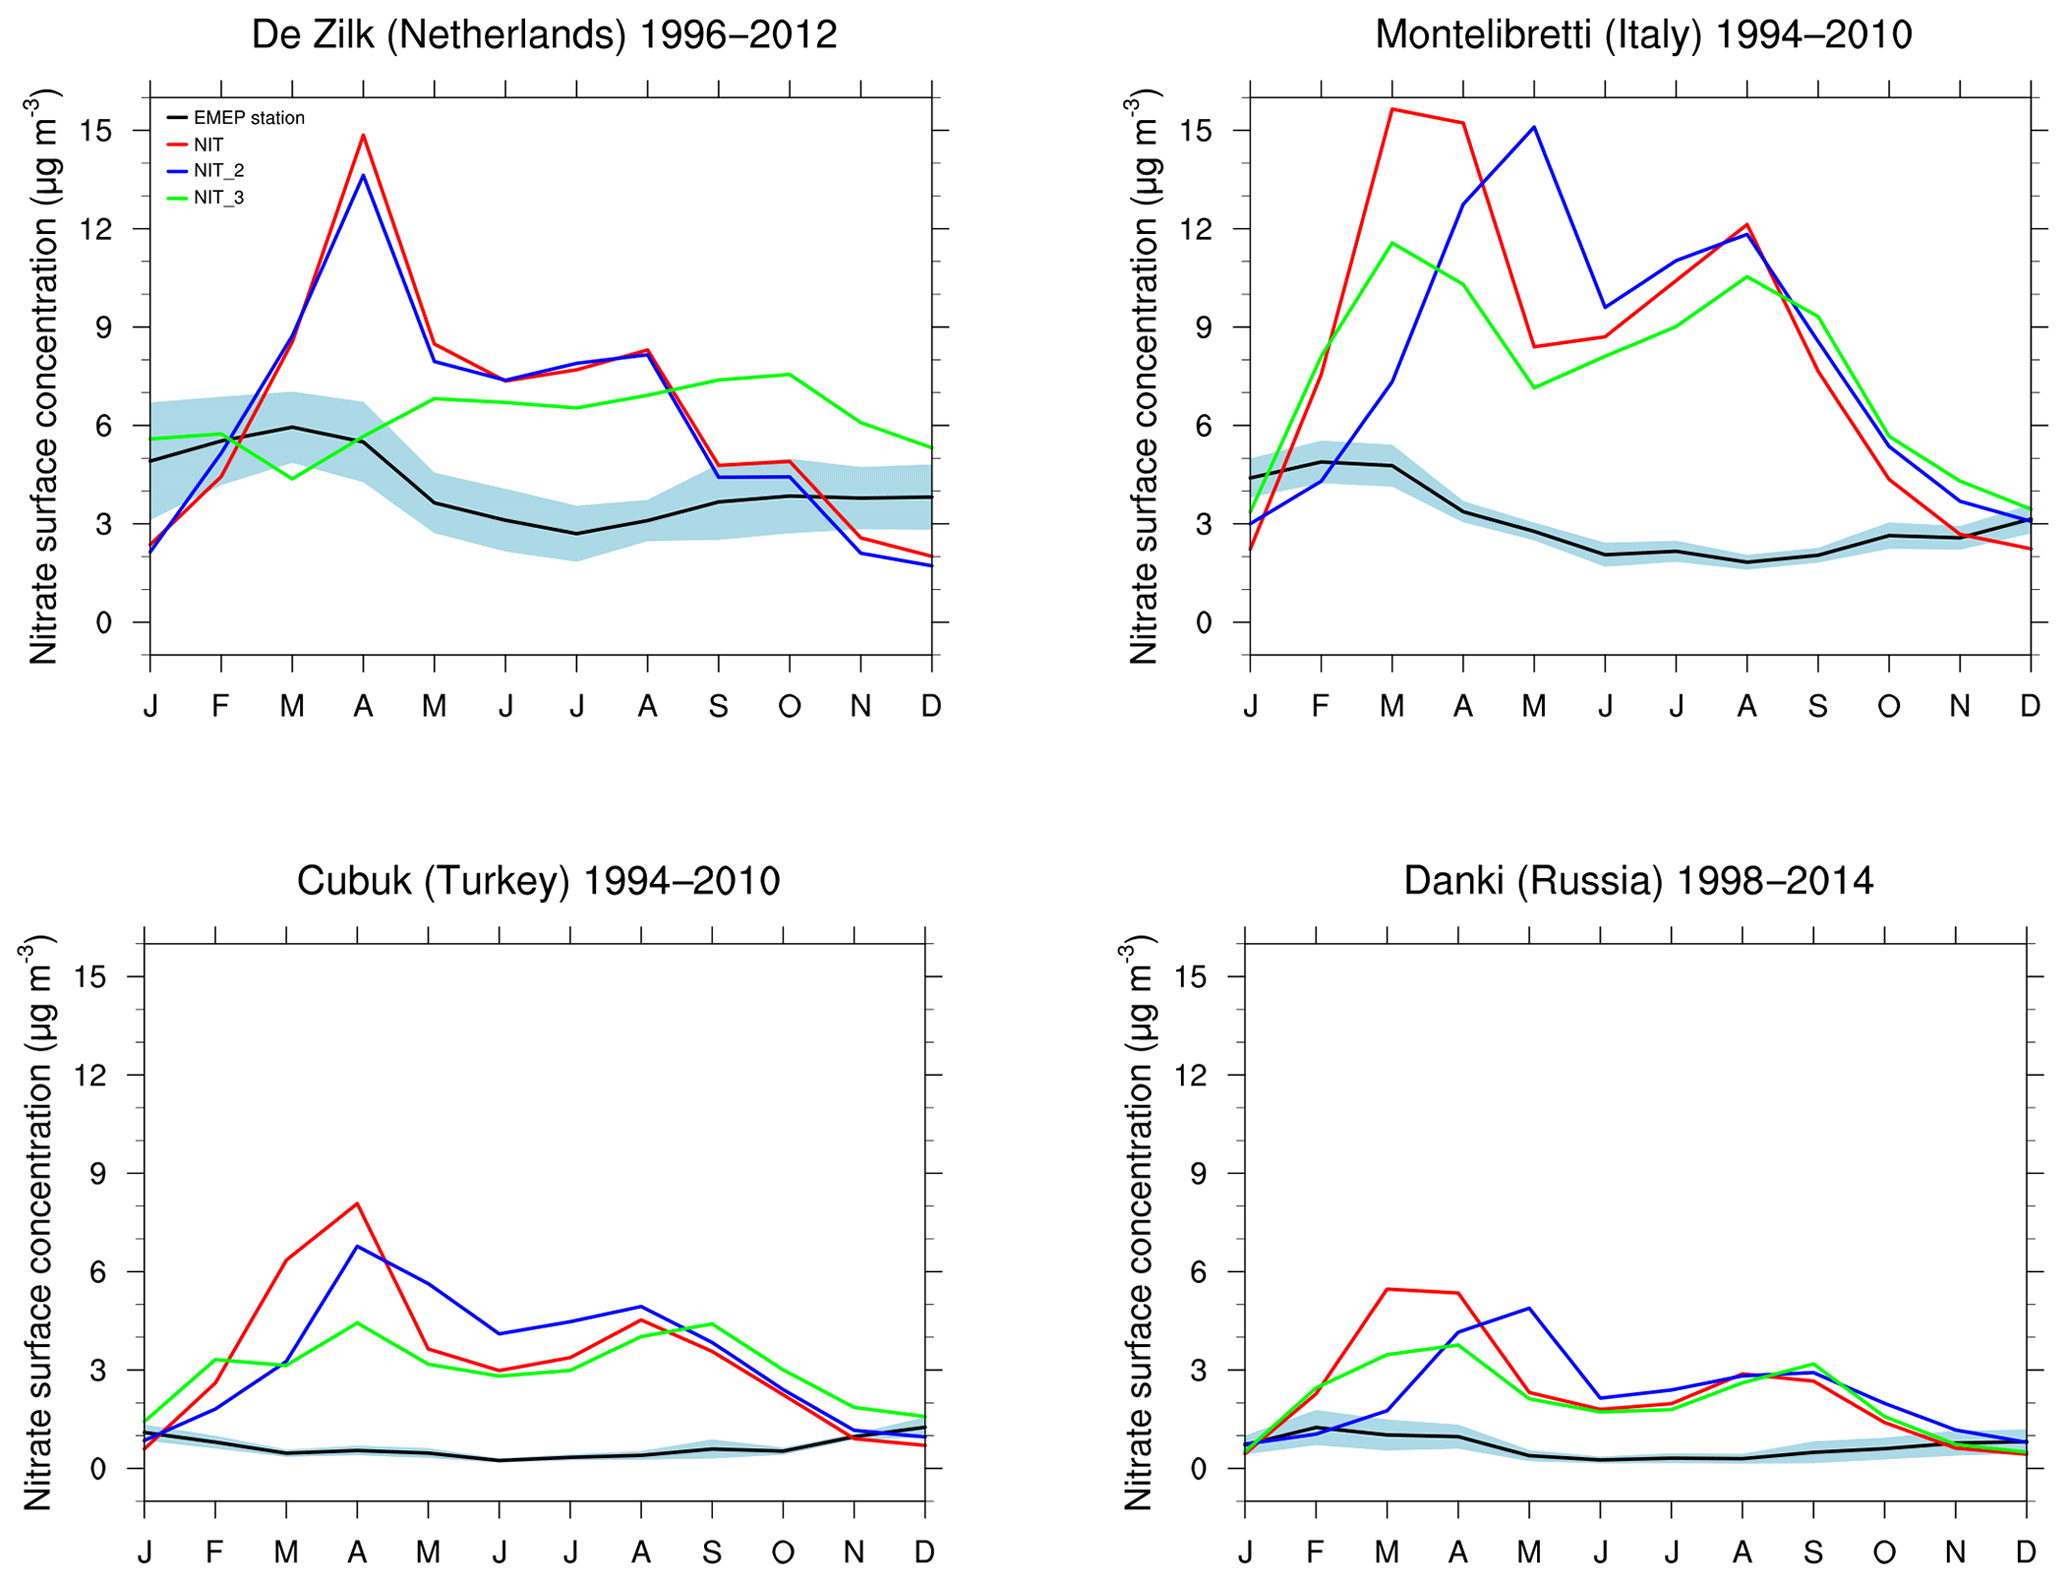
Figure 9Monthly means of the surface nitrate concentration (µg m−3) at the De Zilk, Montelibretti, Cubuk and Danki EMEP stations, for NIT (red), NIT_2 (blue) and NIT_3 (green) simulations. Observations are in black and the standard deviation associated with observations is in light blue.
Concerning the AOD, Fig. 10 presents the annual cycle of total AOD550 for NIT, NIT_2 and NIT_3 simulations compared at four AERONET sites with continuous data over 10 years (Netherlands, Spain, Crimea, Poland). Like before, the confidence interval with a significant level of 95 % is indicated for observations by the light blue spread. Differences between NIT, NIT_2 and NIT_3 simulations are therefore due to A&N AOD550 differences. Contrary to surface nitrate concentrations, the A&N AOD550 is found to be closed to AERONET observations, especially for the NIT simulation at the Cabauw or at the Belsk stations. Moreover, at Barcelona, the model shows an overestimate during spring (peak of 0.29 for NIT and NIT_3 and in May (maxima of 0.36 for NIT_2 simulation). For these periods, AERONET data indicate AOD of about 0.16.
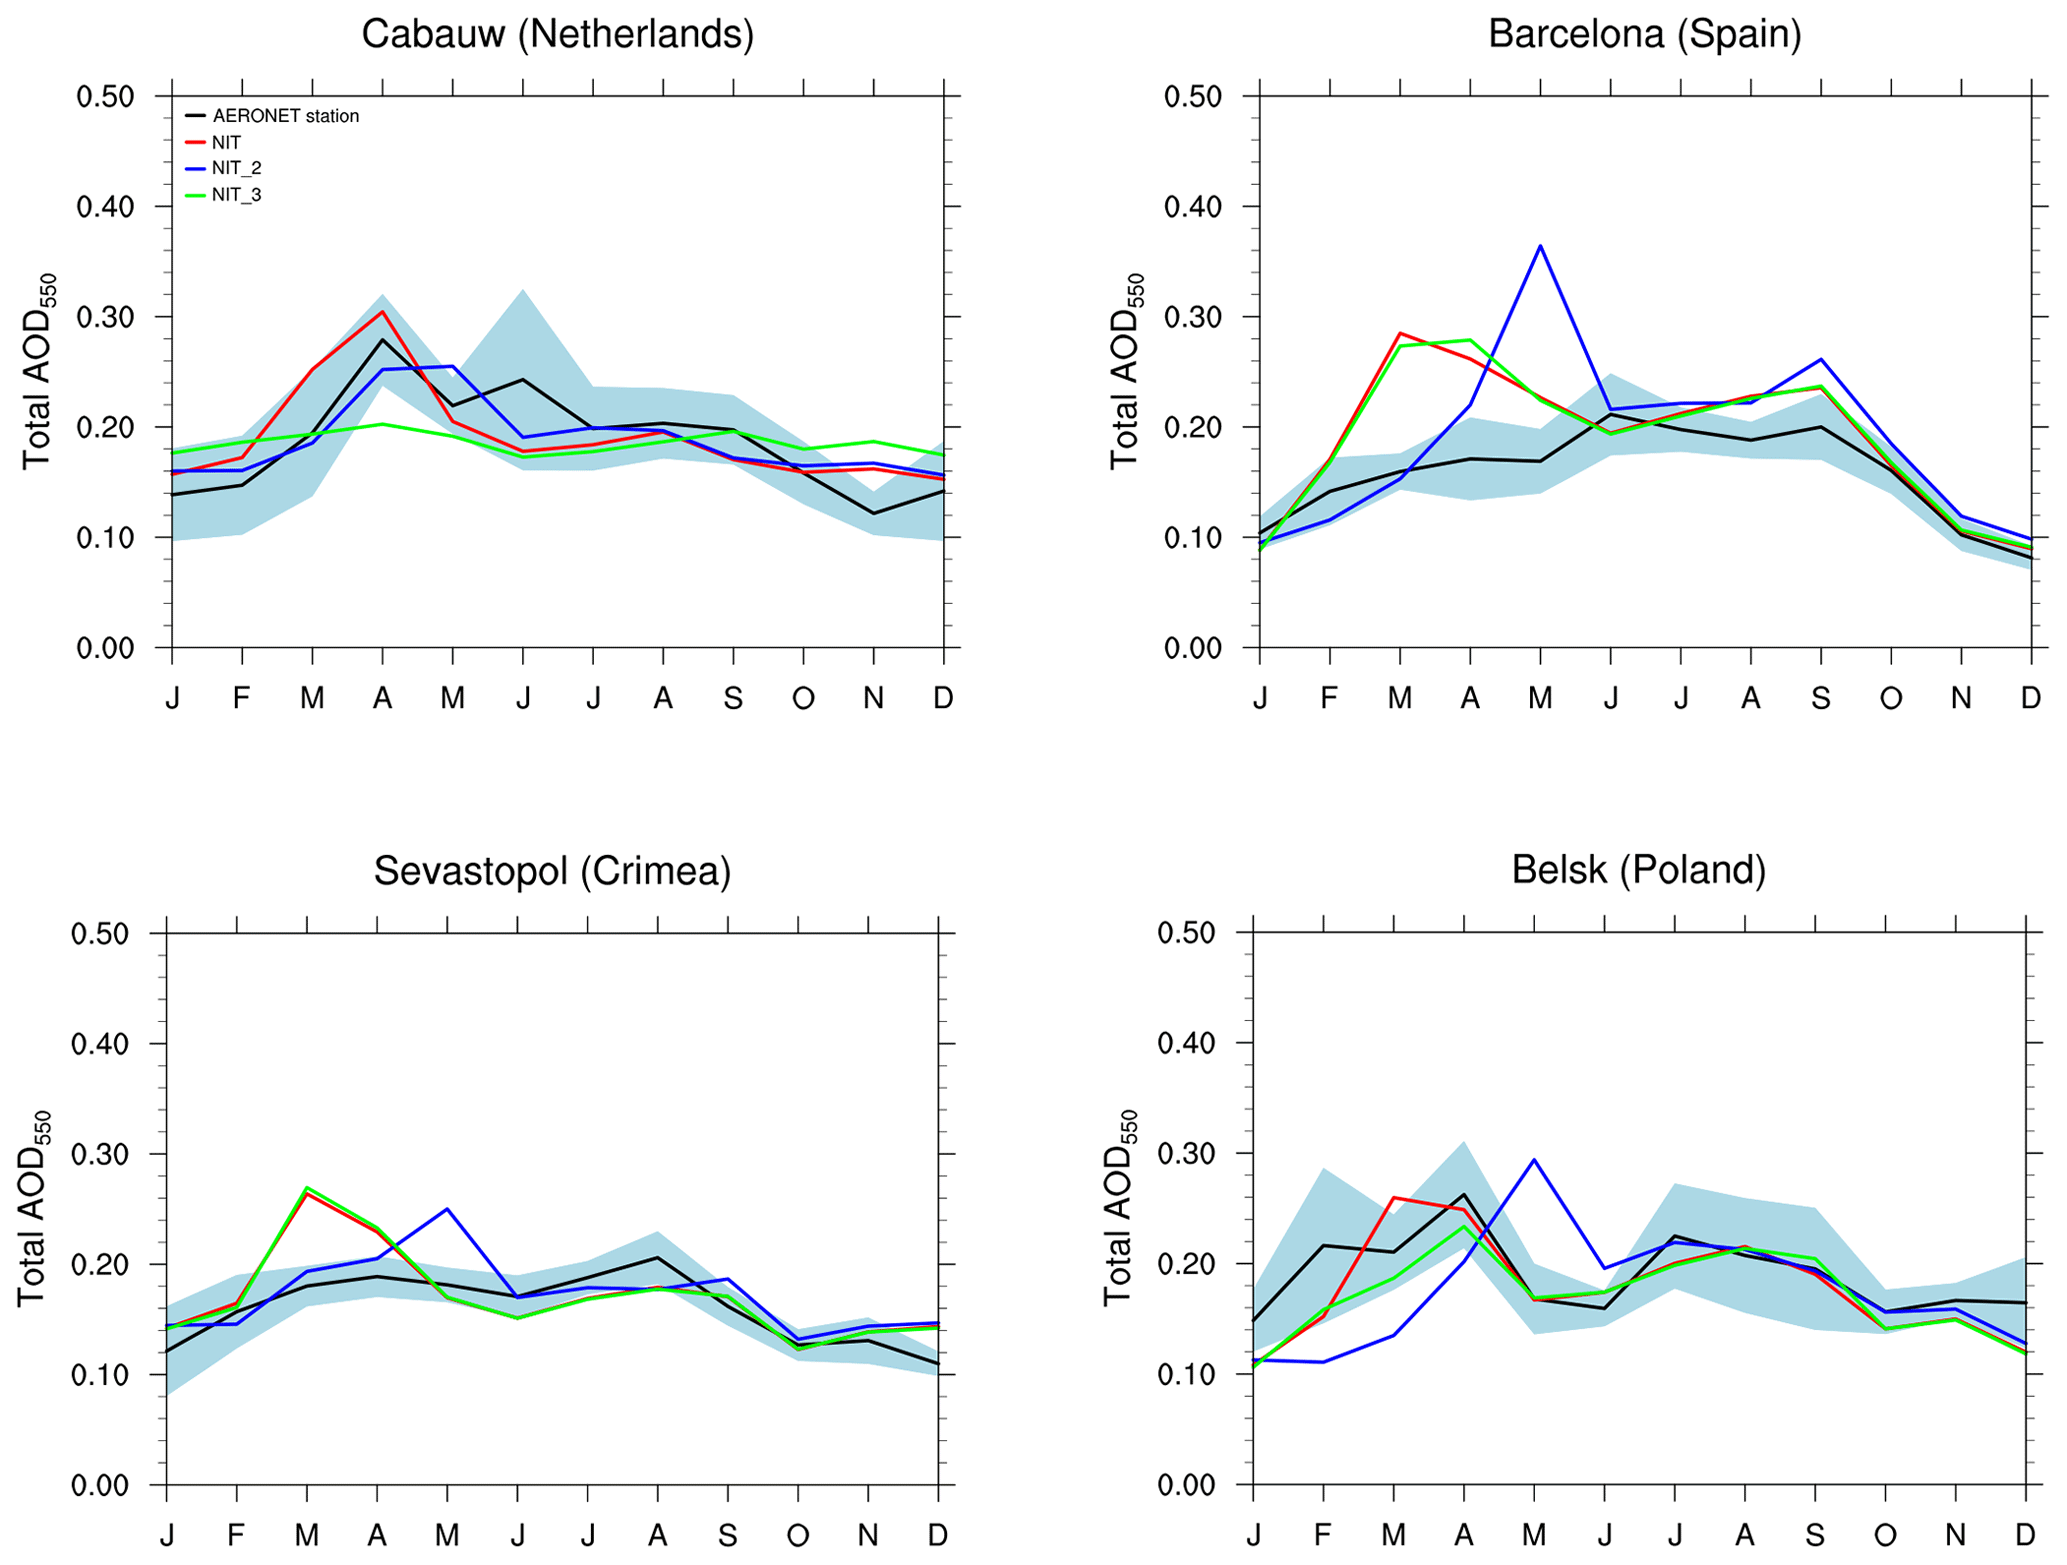
Figure 10Comparison of the monthly means (2003–2012) of aerosol optical depth (at 550 nm) simulated by the ALADIN-Climate model, with measurements at four AERONET stations for NIT (red), NIT_2 (blue) and NIT_3 (green) simulations. Observations are in black and the standard deviation associated with observations is in light blue.
In addition, Fig. 8 presents the total aerosol AOD550 simulated by NIT (red), NIT_2 (blue) and NIT_3 (green) simulations compared to satellite products (grey dots) over Europe (2001–2016). The three simulations are found to be close but NIT_2 simulation presents a higher and later peak of around 0.26 in May than the NIT simulation, which reaches maximum (0.24) in March–April over the Europe domain. During the May to July period, the NIT simulation shows lower values. The NIT_3 simulation shows a weaker peak in April (0.20) than the NIT simulation (0.24). For the rest of the year, NIT and NIT_3 simulations are very close. Table 6 presents the temporal correlation between mean annual cycles from different simulations (NIT, NIT_2 and NIT_3) and satellite products (MISR, MODIS Aqua and MODIS Terra). Table 6 indicates that NIT simulation, with a peak in April, is closer to MISR than NIT_2 simulation. NIT and NIT_2 simulations present a positive bias (0.04) compared to MISR dataset. In parallel, the NIT_2 simulation is found to be closer to MODIS Aqua and MODIS Terra than the NIT simulation. These simulations also present a positive bias (0.02 for NIT and 0.01 for NIT_2) compared to MODIS Aqua and a negative bias compared to MODIS Terra (−0.02). The annual cycle of the NH3 emissions has therefore a significant impact on the total aerosol AOD550, especially during the spring (March, April and May). Concerning NIT_3, as shown in the Table 6, this simulation presents high temporal correlation compared to MISR (0.95), associated with a bias of 0.03. This run also shows better correlations with MODIS Aqua (0.82) and MODIS Terra (0.85) than the NIT simulation (0.75 and 0.77 respectively).
Table 6Temporal correlation (and bias), over Europe, between mean annual cycles as plotted in Fig. 6 from simulations (NIT, NIT_2 and NIT_3) and satellite products (MISR, MODIS Aqua and MODIS Terra) over the period 2001–2016 (2003–2016 for MODIS Aqua).

Finally, it is shown here that the annual cycles of nitrate precursors, such as ammonia and nitric acid, have significant impacts on the A&N AOD550 and therefore on the total AOD, especially in spring. Hence, a poor representation of the annual cycle of nitrate precursors may therefore be one of the possible causes of the AOD bias observed in spring compared to satellite data (Fig. 8). Further studies related to the representation of the ammonia emissions and nitric acid annual cycle seem necessary to improve the simulated A&N concentrations and optical depth over Europe.
4.6 Aerosol trends
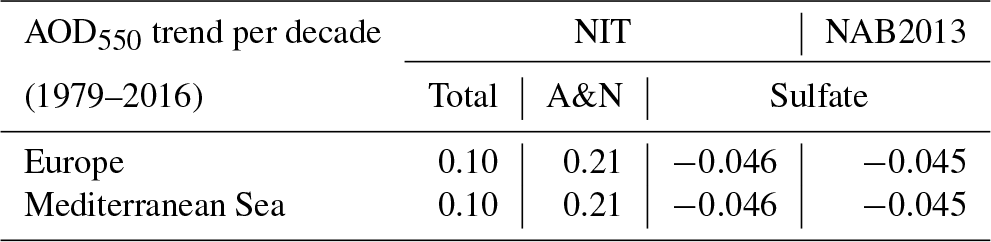
Figure 11 presents the total AOD550 evolution over Europe and the Mediterranean Sea for REF and NIT simulations. NAB2013 is an aerosol climatology developed by Nabat et al. (2013), which is based on MODIS data for total AOD over the period 2003–2009, and model data for the distinction in the contribution of the different aerosol types. Before 2003, this climatology is extended up to 1979 using the sulfate AOD trend coming from the LMDz-INCA model (which does not have AN aerosols), in agreement with the other ACCMIP models. Figure 11 indicates an important decrease over Europe of the total AOD550 from 1979 to 2016 in the REF (−0.047 decade−1) and NIT (−0.035 decade−1) simulations and also from NAB2013 (−0.045 decade−1). Figure 11 shows also a less pronounced decrease in the total AOD550 over the Mediterranean Sea. Such decreases are mainly due to the decline of sulfate particles over Europe during this period. The different trends obtained for the NIT simulation (Total, sulfate and A&N trends) and NAB2013_sulfate (sulfate trend) for the period 1979-2016 are summarized in Table 7. First, NAB2013_sulfate that does not take into account A&N particles is very close to the sulfate trend of NIT simulation over Europe (−0.046 for NIT and −0.045 for NAB2013) and the Mediterranean (−0.022 for NIT and −0.021 for NAB2013). On the other hand, over the period 1979–2016, the NAB2013_sulfate trend is found to be about 30 % stronger than the NIT total run over Europe and about 50 % stronger over the Mediterranean Sea, notably because of the positive A&N trend of 0.012 decade−1 over Europe (and 0.008 decade−1 over the Mediterranean Sea). For comparisons, the nitrate trend obtained from the GISS global model (Shindell et al., 2013) for the period 1980–2015 is found to be relatively similar to the NIT simulation, with lower values like 0.008 decade−1 over Europe (0.012 for the nitrate trend of the NIT simulation) and 0.005 decade−1 over the Mediterranean (0.008 for the nitrate trend of the NIT simulation).
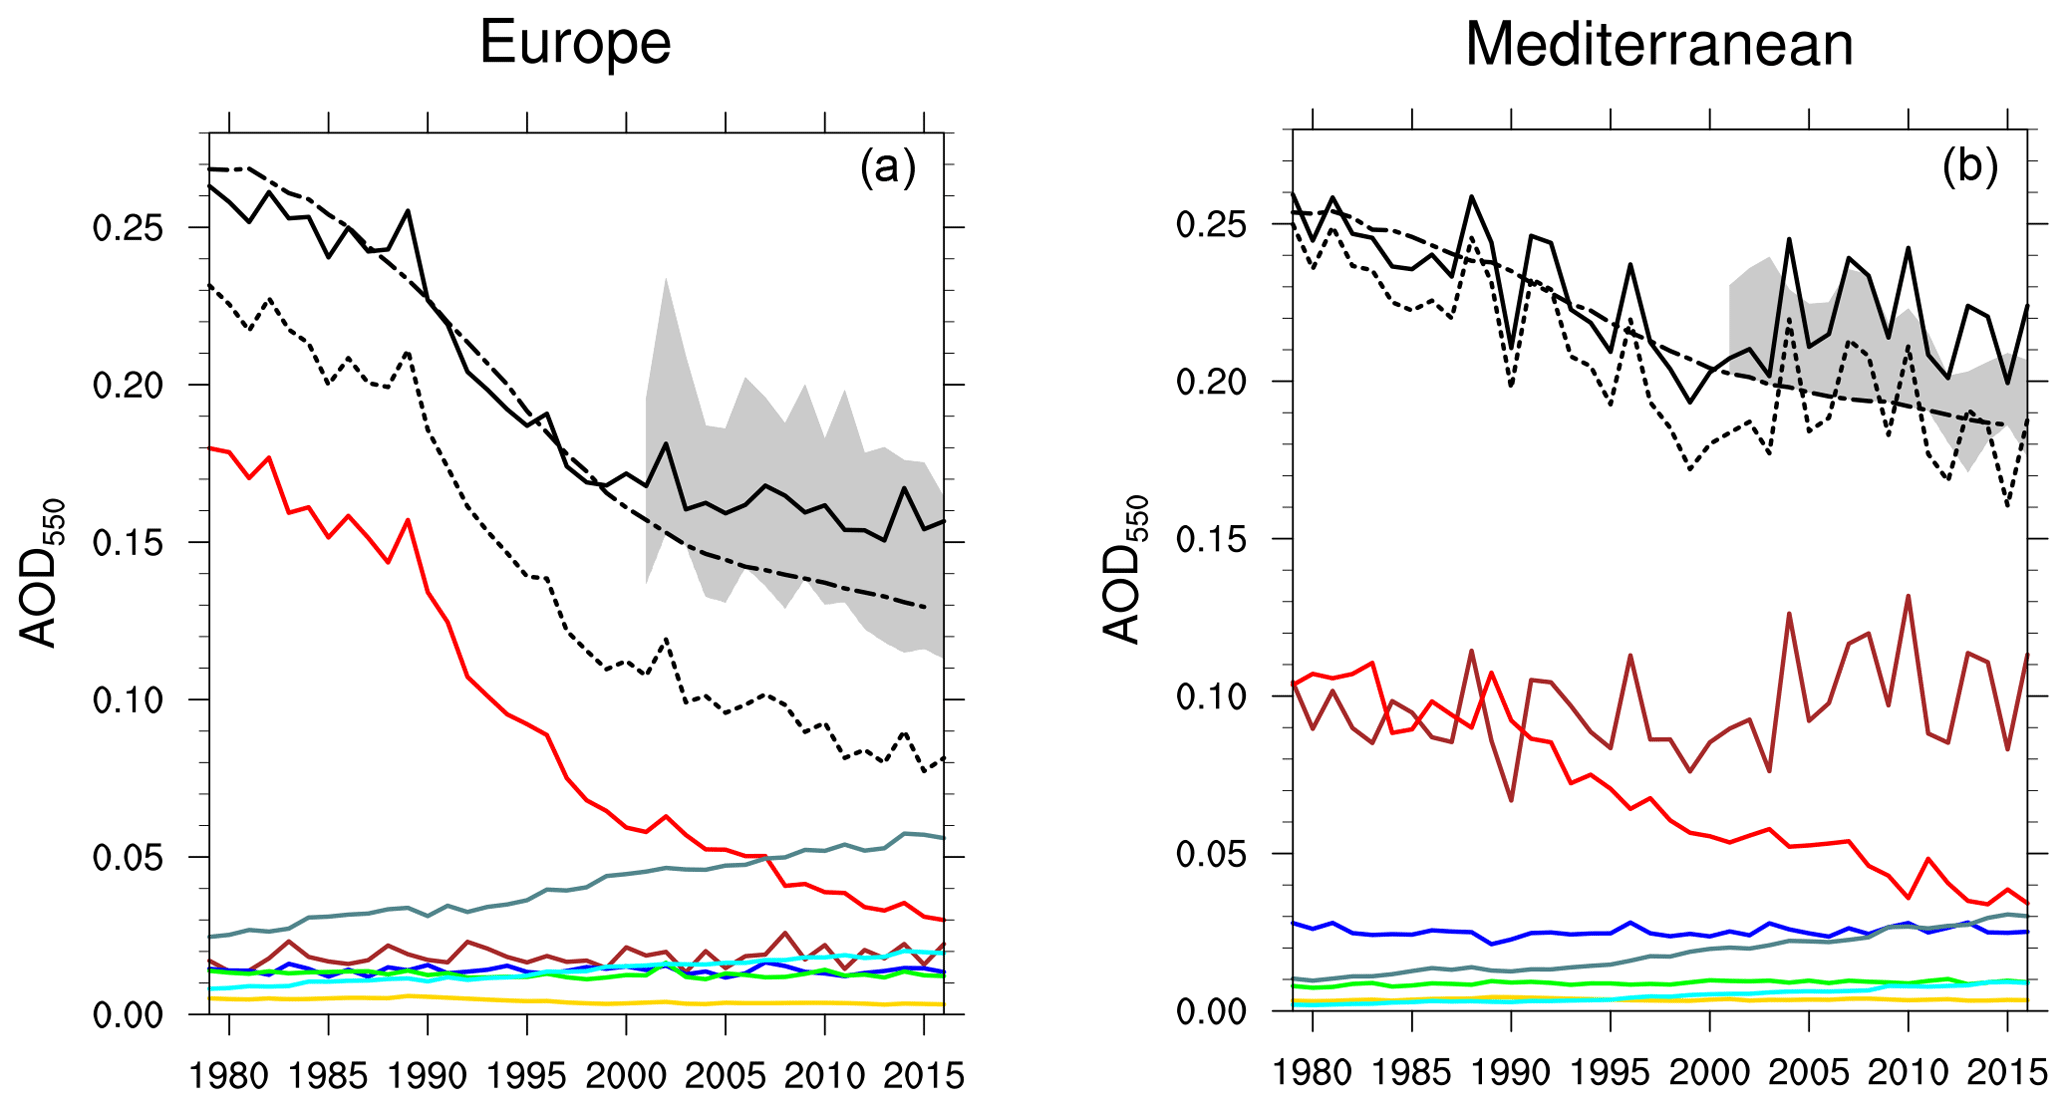
Figure 11Yearly means of AOD550 over Europe (a) and the Mediterranean Sea (b) as defined in Fig. 1 for the NIT simulation (solid black line), the REF simulation (dotted black line), the NAB2013 climatology (dotted dashed black line) and for each aerosol species in NIT (solid colour lines) over the period 1979–2016 compared to satellite products (grey area from 2001 on). Dust in brown, sea salt in blue, black carbon in gold, organic carbon in green, sulfate in red, ammonium in cyan and nitrate in sea green.
Table 7NIT simulation AOD550 trend per decade compared to NAB2013 (Nabat et al., 2013) over the period 1979–2016.
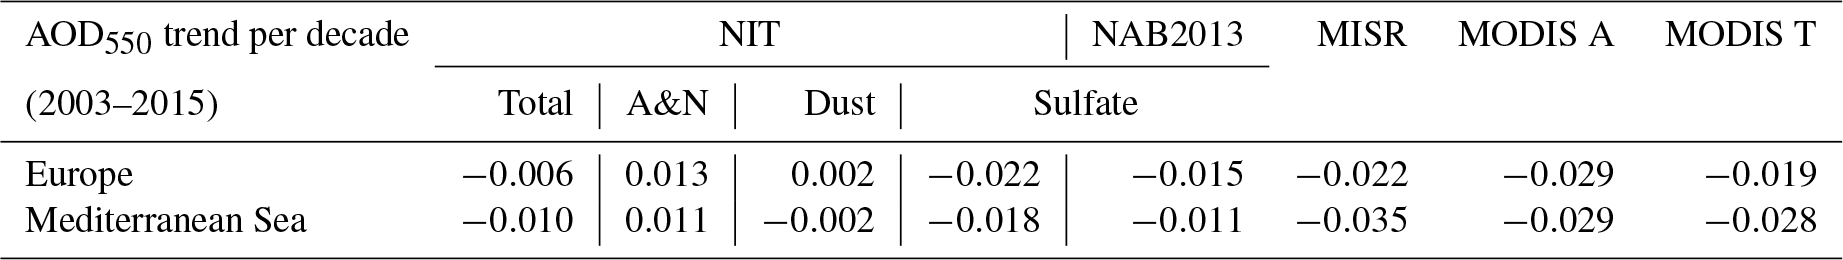
In Fig. 11, satellite data (MODIS and MISR), highlighted by the shaded area, also indicate a decrease in total AOD between 2003 and 2015, when averaged over Europe. Trends obtained for the different simulations and from satellite products, over the period 2003–2015, are also presented in Table 8. This decrease in total aerosol AOD is also due to the strong drop in sulfate aerosols. Over Europe, unlike REF simulation, NIT simulation is of the same order of magnitude as the satellite products. On the other hand, it is shown that over Europe but also over the Mediterranean Sea the trend of the NIT simulation is weaker than the REF simulation and all satellite data. The difference between NIT and REF is due to the positive trend of nitrate and ammonium (0.013 decade−1 over Europe and 0.011 decade−1 over the Mediterranean Sea). Differences between NIT and satellite products may be due to NH3 emission inventories or due to HNO3 climatology (uncertainties in NH3 emission inventories and HNO3 annual cycle averaged over 5 years). Furthermore, the AOD quantification by satellite products is difficult because the aerosol contribution to the reflectance is mixed with that of clouds and the surface (Bréon et al., 2011) and also because they do not take into account all the pixels (especially with MISR).
Table 8NIT simulation AOD550 trend per decade compared to NAB2013 (Nabat et al., 2013) and total AOD trend from different satellite products (MISR, MODIS Aqua and MODIS Terra) over the period 2003–2015.
The lower trend obtained for the NIT simulation compared to the REF run in Fig. 11 is therefore due to the continuous increase in nitrate aerosol concentrations between 1979 and 2016, from 0.025 (1979) to 0.06 (2016) over Europe and from 0.01 (1979) to 0.03 (2016) over the Mediterranean Sea. This increase in nitrate concentrations then partially compensates the sulfate concentration decrease. An interesting point is that the nitrate AOD550 rise is not due to an increase in its precursors (ammonia and nitric acid). Indeed, the nitric acid used in this study is constant over the years and ammonia emissions are also constant or even slightly lower since 1979 over Europe, as shown in Fig. 12. This drop in anthropogenic emissions is reflected by the decline in tropospheric NO2 over the western part of the Euro-Mediterranean domain shown by Hilboll et al. (2013) and Georgoulias et al. (2018). Figure 12 also shows that the decrease in sulfate aerosols observed over Europe is due to the decline of one of its precursors (sulfur dioxide). This decrease in sulfate aerosol production thus leaves more free ammonia in the lower atmosphere, allowing an increase in A&N aerosols over Europe but also over the Mediterranean. Figure 11 shows the relative importance of the A&N AOD550 over Europe, which is higher than sulfate AOD since 2005 in our NIT simulation. To our knowledge, this is the first report in which A&N aerosols appear as the most important species in terms of AOD550 over Europe from 2005 on.

Figure 12Yearly means of anthropogenic emissions over Europe as defined in Fig. 1 for black carbon (yellow), organic carbon (green), sulfur dioxide (red) and ammonia (blue-grey) over the period 1979–2016.
5.1 Direct SW radiative forcing
This final section aims at analysing the impact of A&N aerosols on the European–Mediterranean radiative budget and its climate, notably in terms of surface temperature. First, Fig. 13 presents the impact of A&N aerosols on the solar radiation at the surface and at the TOA for the period 1979–2016 for clear-sky and all sky conditions. Figure 13 indicates a moderate effect of A&N aerosols on the surface SW radiation over central Europe, of about −4 W m−2 in clear-sky and −2 W m−2 in all sky conditions, respectively. This direct radiative forcing (DRF) is consistent with the A&N AOD550 (0.1–0.15) simulated over this region. Ammonium represents about 35 % of the nitrate AOD over Europe and the Mediterranean Sea, their optical properties being relatively close, and we can estimate that ammonium represents about a third of the direct radiative forcing shown over the Euro-Mediterranean region. The most marked season is summer (June, July and August), shown at the top of Fig. 15, with values up to −5 W m−2 over central Europe and −10 W m−2 in the Po Valley at the surface in all sky conditions.
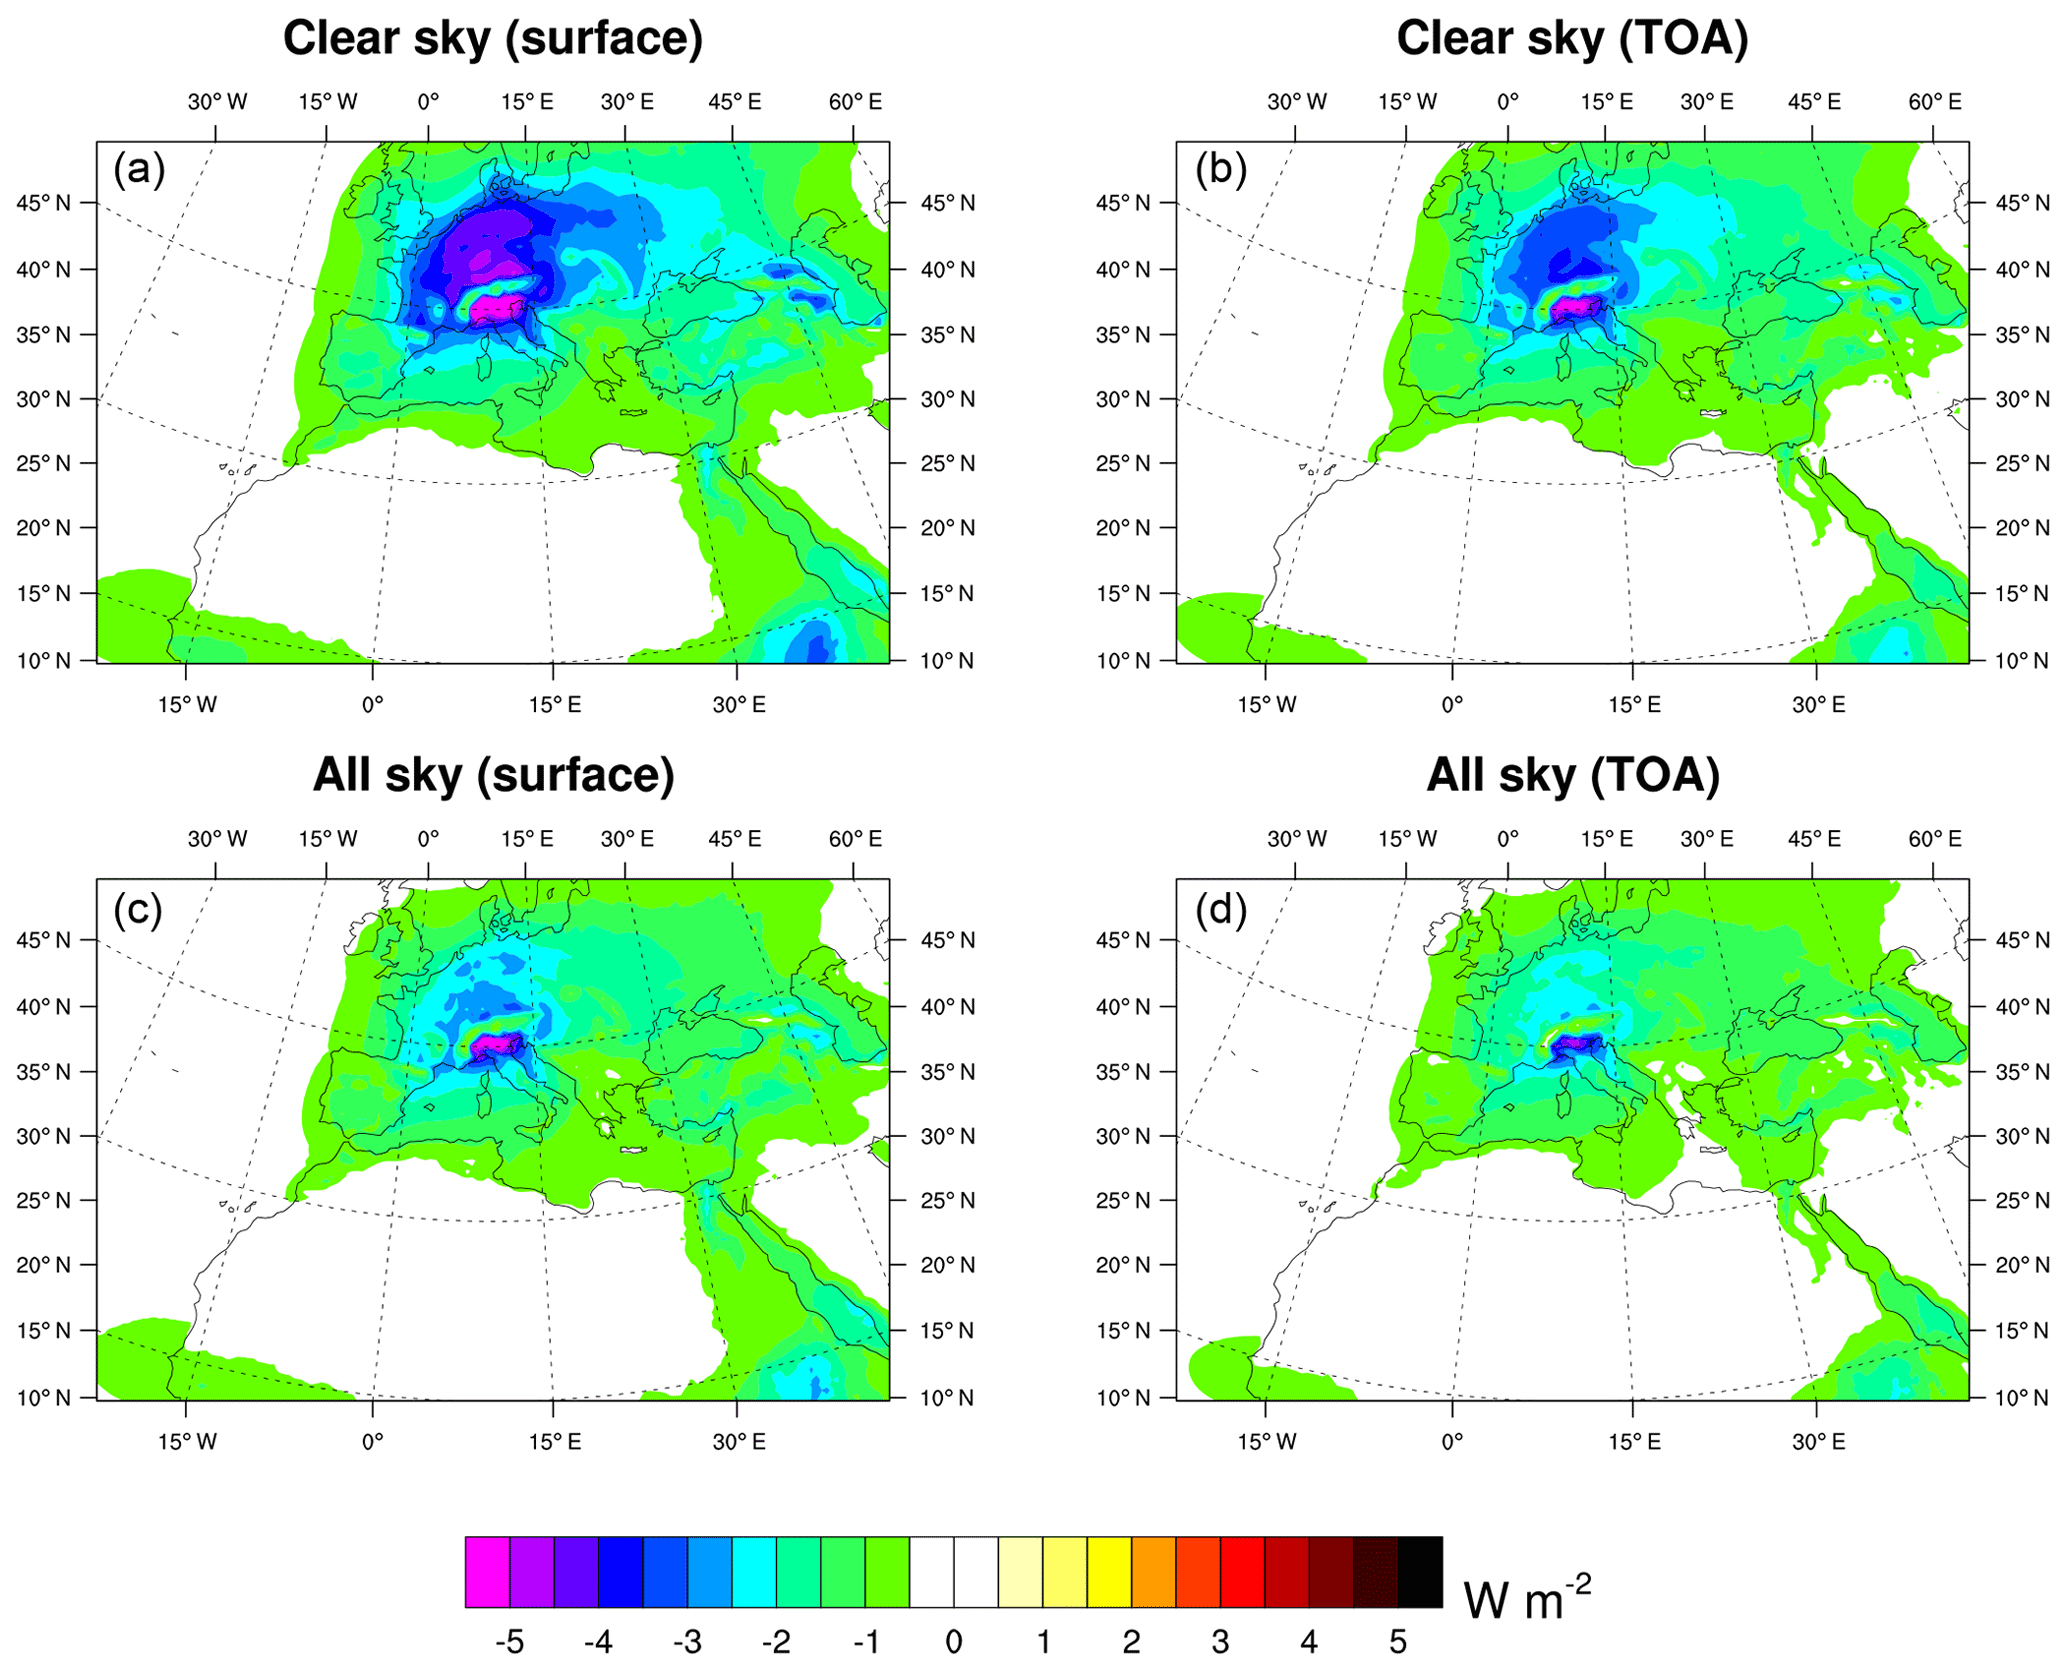
Figure 13Clear-sky (a, b) and all sky (c, d) SW direct radiative forcing (W m−2) due to A&N aerosols at the surface (a, c) and at the top of the atmosphere, TOA (b, d), estimated over the period 1979–2016 by difference between the REF and NIT simulations.
When averaged over Europe, A&N aerosols cause a surface DRF of around −1.7 W m−2 (all sky conditions). Figure 13 also reveals local maxima in the surface forcing (−5 W m−2) over Europe (all sky conditions), especially in the Po Valley and Benelux, certainly because of the presence of industrial pollution particles. Over the Po Valley, the A&N surface DRF represents 33 % (all sky conditions) of the total surface DRF. Finally, it should be noted that the maxima of DRF exerted by A&N aerosols is found to occur during summer.
Figure 13 also shows that A&N aerosols cause a mean TOA DRF over Europe of around −1.4 W m−2. Bauer et al. (2007) and Hauglustaine et al. (2014) also indicate a significant nitrate TOA DRF over Europe (−1 W m−2) consistent with the one estimated in this study. This forcing over Europe is 1 order of magnitude larger than the global average for present conditions (−0.11 W m−2; Bauer et al., 2007). At the TOA, local maxima (−5 W m−2) are detected over the Po Valley and Fig. 13 indicates important TOA DRF of around −2 W m−2 over Benelux (all sky conditions).
Table 9 summarizes the calculated annual-mean SW DRF exerted at the surface and at TOA for the REF and NIT simulations over the period 2000–2009, compared with those obtained by Nabat et al. (2015b) CNRM-RCSM4 simulations (period 2000–2009) and by Papadimas et al. (2012) using MODIS (period 2000–2007).
Table 9Aerosol SW DRF averages (W m−2) in all sky conditions at the surface and at TOA for different datasets over the Mediterranean basin (29∘ to 46.5∘, −10.5∘ to 38.5∘).
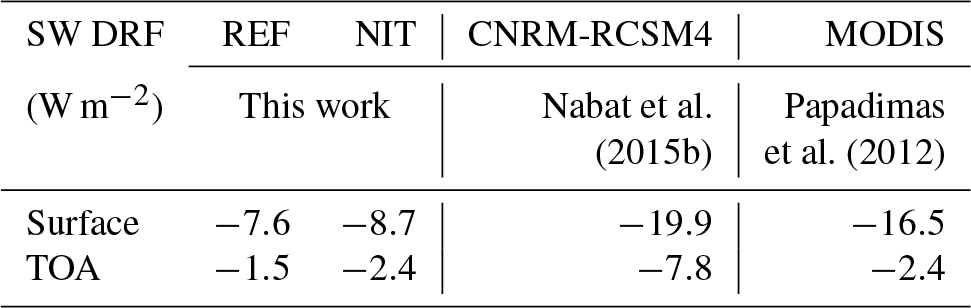
First, it should be mentioned that differences between REF and CNRM-RCSM4 simulations are mainly due to different versions of the atmospheric model (ALADIN-Climate). In addition, the CNRM-RCSM4 model did not use an interactive aerosol scheme but the Nabat et al. (2013) aerosol climatology. Table 9 also reveals that the NIT simulation improves the DRF estimates, compared to MODIS data. The aerosol DRF evolution over Europe and the Mediterranean Sea is presented in Fig. 14 in all sky and clear-sky conditions, at the surface and at the TOA, over the period 1979–2016. Despite an increase in the A&N DRF, the total surface DRF is found to decrease over Europe from −12 W m−2 in 1979 to −8 W m−2 in 2016 in clear-sky conditions and from −8 W m−2 (1979) to −5 W m−2 (2016) in all sky conditions. This trend is mainly due to the decrease in sulfate and organic DRF, which is not fully offset by the increase in A&N DRF (from −1.5 W m−2 in 1979 to −4 W m−2 in 2016 over Europe in clear-sky conditions). An important result here concerns the relative importance of the A&N DRF exerted over Europe, both at the surface and at TOA, which is found to be higher than sulfate and organic DRF since 2005. Hence, our simulations indicate, for the first time to our knowledge, that since this specific year (2005), A&N aerosols appear as the most important species in terms of DRF over Europe. Paulot et al. (2018) have estimated the DRF of these different aerosol from 2001 to 2015 using the GFDL chemistry-climate model AM3 driven by CMIP6 historical emissions. They have also shown a decrease in total aerosol DRF over western Europe driven by the decrease in sulfate associated with the decrease in sulfur dioxide emissions. On the other hand, they did not show an increase in A&N aerosols over Europe. In their study, sulfate aerosols always have a stronger AOD and a stronger DRF than nitrate aerosols. In parallel, Fig. 14 shows a moderate decrease in the total aerosol DRF over the Mediterranean (both at the surface and TOA), mainly due to the decrease in sulfate and organic DRF. The A&N DRF is also found to increase in this area from −1 W m−2 in 1979 to −2 W m−2 in 2016, with an equivalent DRF to sulfate and organic aerosols in 2016.

Figure 14Yearly means of aerosol DRF over Europe (a, c) and the Mediterranean Sea (b, d) for nitrate and ammonium (cyan), sulfate and organics (red), black carbon (yellow), dust (brown), sea salt (blue), and total (black) in all sky (solid lines) and clear-sky (dotted lines) conditions over the period 1979–2016.
5.2 Effects on the regional climate
We investigate here the consequences of the direct radiative forcing of A&N aerosols on near-surface air temperature at 2 m and precipitation over the model domain.
Figure 15 presents the differences (averaged over the period 1979–2016) between the NIT and REF simulations for 2 m temperature and surface DRF SW (all sky conditions) during summer (June, July and August). A t test has been applied to the Fig. 15 using the 38 years of the simulation with a significant level of 95 %. Furthermore, areas with high temperature differences are areas with high A&N AOD so the model's internal variability does not seem to be causing these differences. Figure 15 shows a moderate temperature impact due to A&N surface dimming of about −0.2 ∘C over Europe, due to the radiation drop (−1.7 W m−2 on average over Europe). A larger decline takes place (−0.4 ∘C) in regions with large A&N AOD550 associated with a significant DRF (Benelux, Po Valley). For other seasons, no significant drop in temperature has been found. As a comparison, Nabat et al. (2015b) reported that 2 m temperature could be reduced by 0.4 ∘C on average over Europe (−0.2 ∘C in winter and −0.4 ∘C for each other seasons) because of the presence of different aerosols (sea salt, desert dust, sulfate, black and organic carbon) over the period 2003–2009. Therefore, only for the summer, the A&N impact on 2 m temperature is about half as strong as the effect of all other aerosols. Zanis (2009) has also shown a negative surface radiative forcing associated with the anthropogenic aerosols (carbonaceous particles and sulfates), during the summer of 2000 throughout the European domain. Anthropogenic aerosols cause a temperature decrease at the lower troposphere of up to 1.2 ∘C over southeastern Europe and the Balkan Peninsula, about 3 times more than summer A&N impact on 2 m temperature. More recently, Zanis et al. (2012) have shown, over the period 1996–2007, a limited direct shortwave effect of anthropogenic aerosols (carbonaceous particles and sulfate) on the European climate with the greatest negative temperature difference of −0.2 ∘C over the Balkan Peninsula.
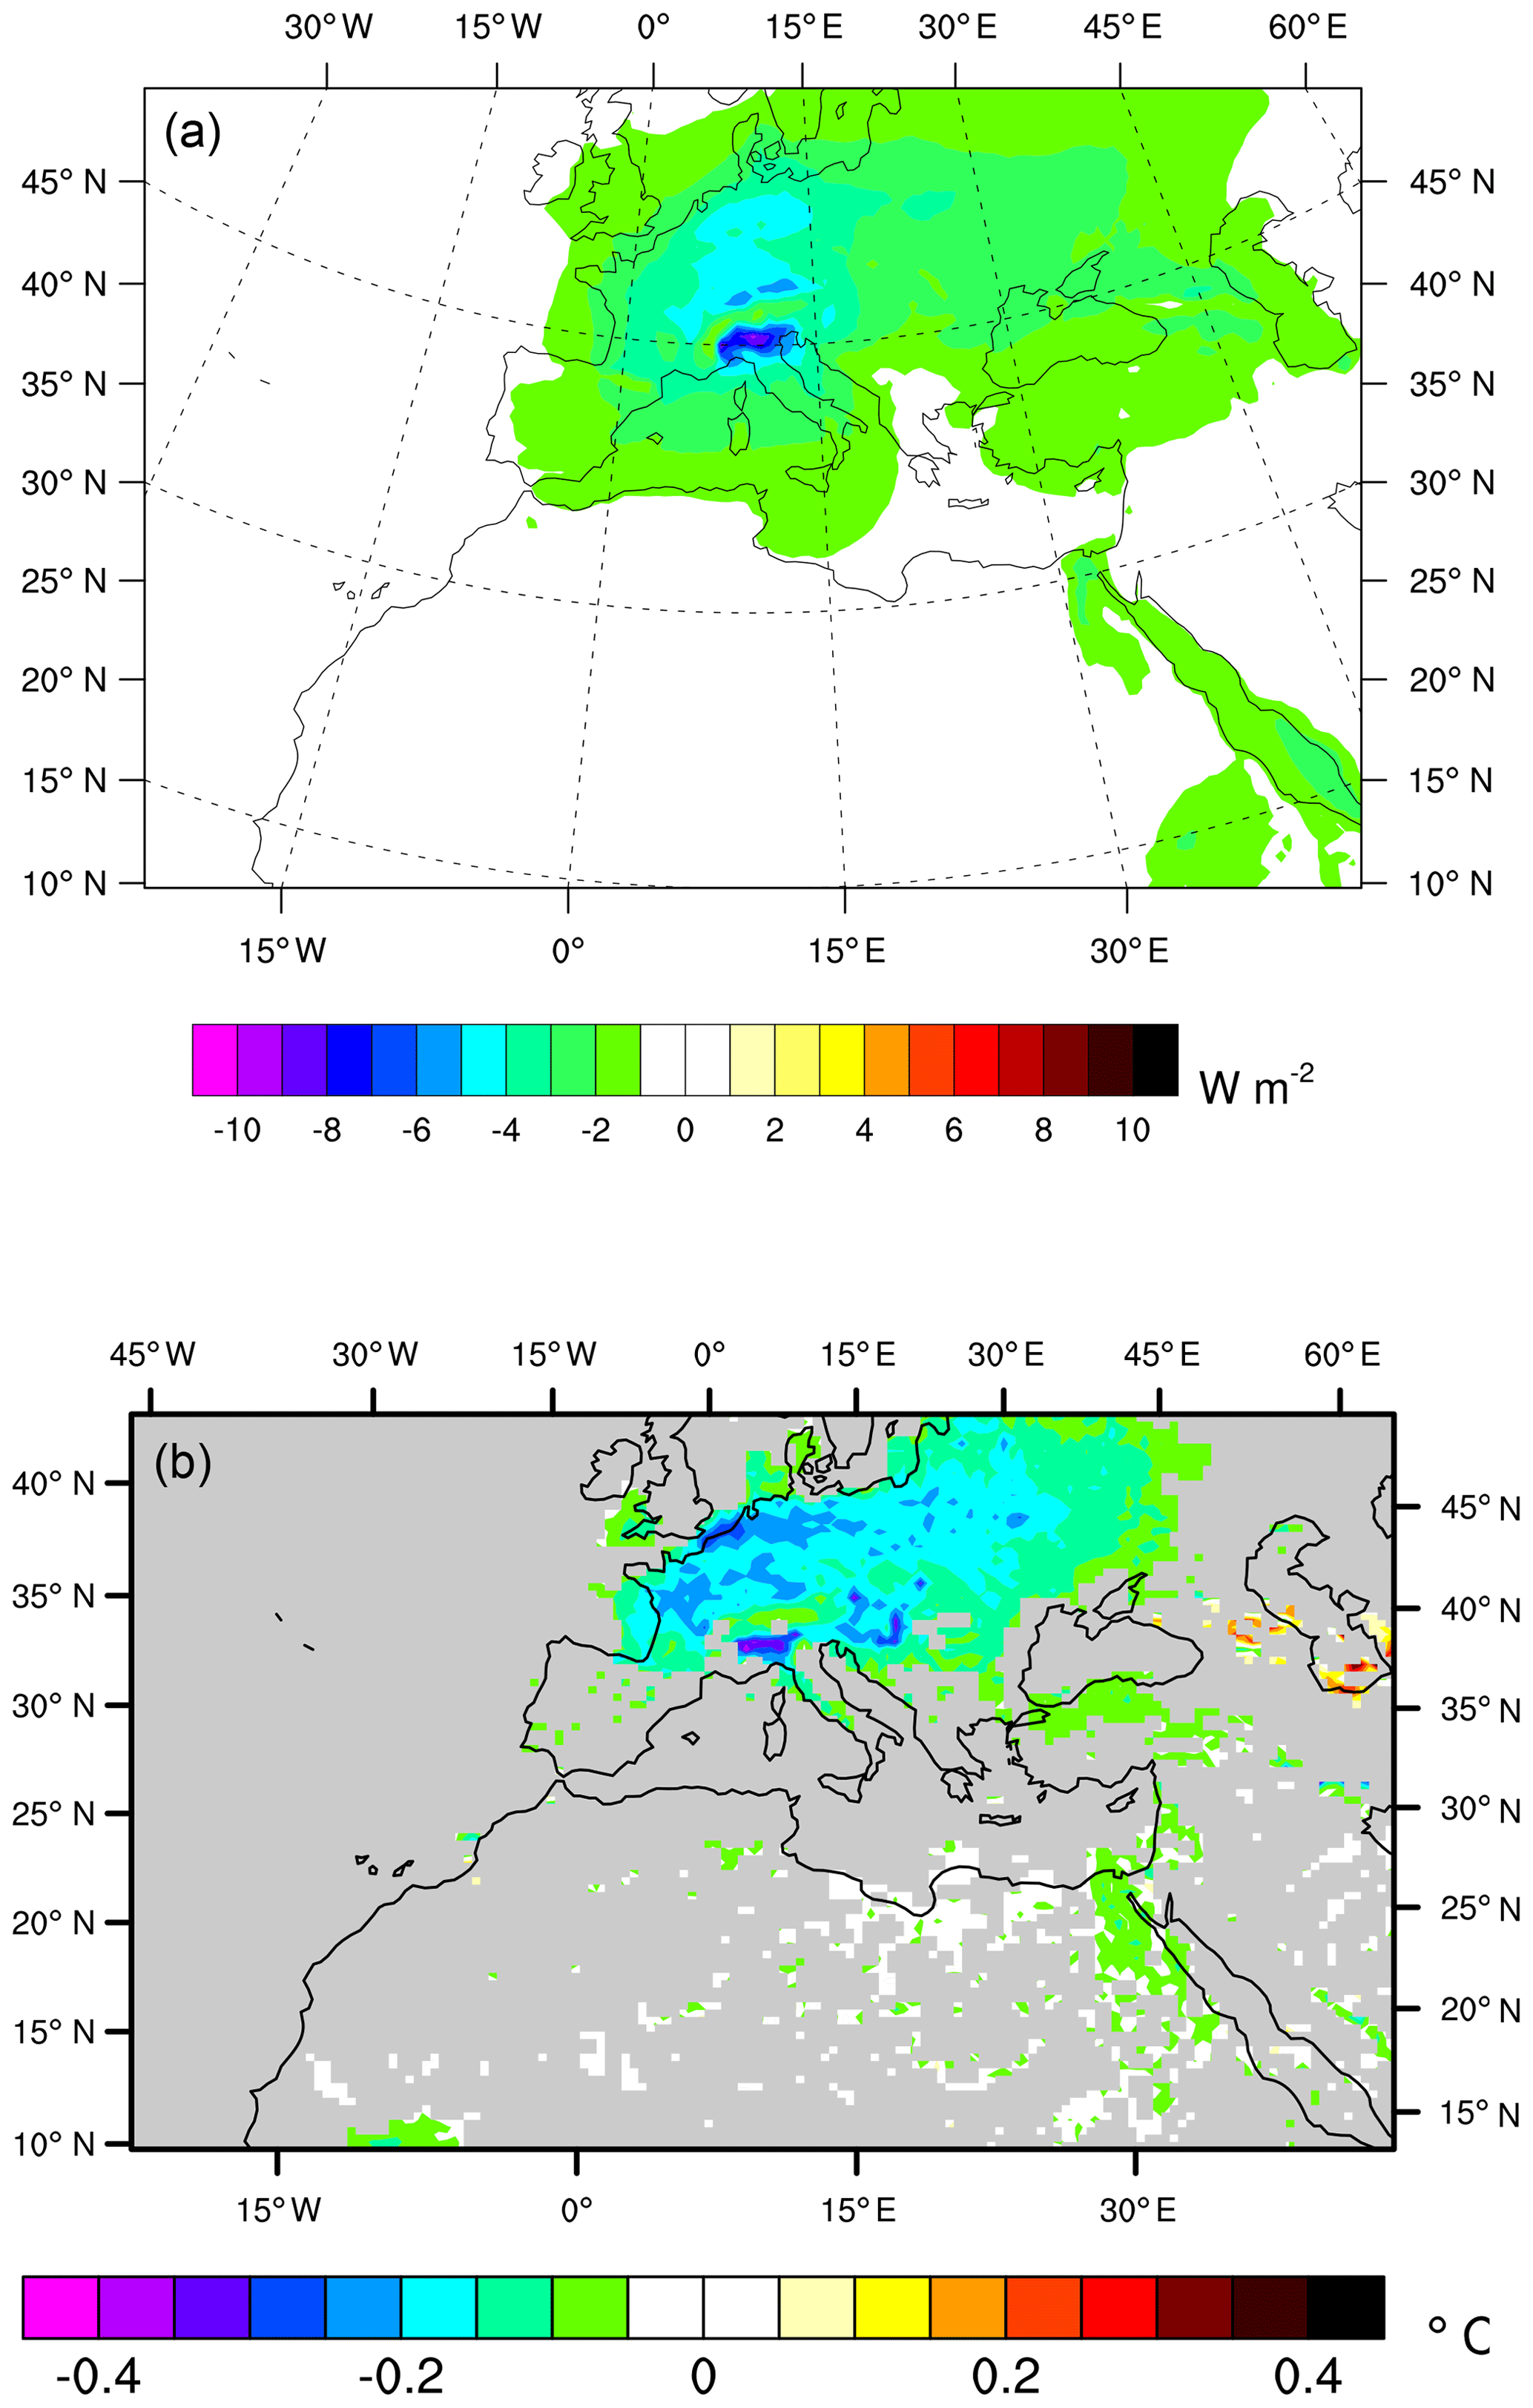
Figure 15DRF SW (W m−2, a) at the surface in all sky conditions and the A&N aerosols impact on the near-surface air temperature at 2 m (∘C, b) on average over the period 1979–2016 in summer (JJA) obtained by difference between the REF and NIT simulations. For the temperature map, the grey area is not statistically significant at the 0.05 level.
Finally, no significant difference has been found regarding precipitation between REF and NIT simulations (not shown).
In this work, we have developed a new configuration of the aerosol scheme TACTIC in ALADIN-Climate model, notably by adding ammonium and nitrate (A&N) aerosols. The objective is to present the implementation and the evaluation of this simplified A&N module and to assess the direct radiative effect and climatic impact of A&N aerosols over the Euro-Mediterranean region for past–present conditions. Two main parallel simulations have been realized: the REF simulation which includes all aerosols except A&N (dust, sea salt, black carbon, organic carbon and sulfate), and the NIT simulation also including A&N particles. Our results indicate that A&N surface concentrations are relatively well represented (maxima over Benelux and the Po Valley) but some important differences are detected with EMEP data (overestimates over Italy and eastern Europe notably). For total AOD550, A&N aerosols are shown to reduce the model low bias particularly over Europe, notably with the improvement of the annual cycle of total aerosol AOD550 (especially in some areas like Benelux). However, some biases have been identified as an overestimate during spring of total AOD550 over Europe and the Mediterranean and an underestimate during summer over the Mediterranean. Sensitivity studies suggest that such biases are related to uncertainties associated with the annual cycle of A&N aerosol precursors (ammonia and nitric acid). A lack of other aerosols such as secondary organic aerosols or organic nitrates is also possible in the model. Over Europe, the ALADIN-Climate simulation indicates that A&N aerosols are characterized by a positive trend over the period 1979–2015 (0.012) due to the increase in A&N aerosol production. This could be caused by more “free” ammonia in the lower troposphere due to the decrease in sulfate aerosols over the 38 years. The addition of A&N aerosols has allowed us to estimate the impact of A&N aerosols on SW radiations and surface temperatures. At the surface and for all sky conditions, A&N particles are found to represent about 26 % of the total aerosol DRF over Europe, yielding a decrease in surface. The presence of A&N aerosols is shown to cause a decrease in surface SW radiations of 5 W m−2 in all sky conditions in the Po Valley over the period 1979–2016. The analysis of the different aerosol trends over the period 1979–2016 indicates that since 2005, the DRF due to A&N particles over Europe has become more important than those exerted by sulfate and organic particles. Finally, our model results indicate that the impact of A&N aerosol on surface SW radiations causes a cooling of −0.2∘ during summer (June, July, August). But no significant effect of the DRF of A&N aerosols was found on precipitation. To go further, it would now be interesting to study the role of A&N aerosols over the Euro-Mediterranean region in future climate regional projections, as they are expected to have a larger contribution to anthropogenic AOD by the end of this century (Hauglustaine et al., 2014).
This study relies entirely on publicly available data. MISR and MODIS AOD products can be obtained from the NASA Earthdata portal at https://earthdata.nasa.gov/ (last access: 19 March 2019). AERONET data are available at AERONET: https://aeronet.gsfc.nasa.gov/ (last access: 28 November 2018). EMEP data are available at EMEP: http://ebas.nilu.no/ (last access: 28 November 2018). Model outputs are available upon request from the authors (thomas.druge@meteo.fr). The HNO3 comes from the CAMS Reanalysis (Flemming et al., 2017) and its annual cycle comes from Kasper and Puxbaum (1998). NH3 data come from CMIP6 data at https://esgf-node.llnl.gov/search/cmip6/ (last access: 19 March 2019) and its annual cycle was defined using the MACCity emissions dataset at http://eccad.aeris-data.fr/\#DatasetPlace: (last access: 19 March 2019).
All authors designed the simulations and TD carried them out. All authors provided input on data analysis shown in the paper. PN and TD developed the model code. TD prepared the paper with contributions from all co-authors.
The authors declare that they have no conflict of interest.
This article is part of the special issue “CHemistry and AeRosols Mediterranean EXperiments (ChArMEx) (ACP/AMT inter-journal SI)”. It is not associated with a conference.
We would like to thank Météo-France and the Occitania region for the financial support of the first author. This work is part of the Med-CORDEX initiative (http://www.medcordex.eu, last access: 19 March 2019) and a contribution to the MISTRALS/ChArMEx programme. We thank the principal investigators of the AERONET and EMEP networks and their staff for establishing and maintaining the different sites used in this investigation. NASA Atmosphere Archive and Distribution System (LAADS, http://ladsweb.nascom.nasa.gov, last access: 19 March 2019) is acknowledged for making available the MODIS/Terra and Aqua Collection 6.1 aerosol datasets, as well as the MISR/Terra dataset. We also acknowledge the Copernicus Climate Change and Atmosphere Monitoring Services for providing us with the CAMS reanalysis and Samuel Remy for his help in integrating the nitrate and ammonium module in our model.
This paper was edited by François Dulac and reviewed by two anonymous referees.
Albrecht, B. A.: Aerosols, cloud microphysics, and fractional cloudiness, Science, 245, 1227–1230, https://doi.org/10.1126/science.245.4923.1227, 1989. a
Allen, R. and Sherwood, S.: Aerosol-cloud semi-direct effect and land-sea temperature contrast in a GCM, Geophys. Res. Lett., 37, L07702, https://doi.org/10.1029/2010GL042759, 2010. a
Bauer, S., Balkanski, Y., Schulz, M., Hauglustaine, D., and Dentener, F.: Global modeling of heterogeneous chemistry on mineral aerosol surfaces: Influence on tropospheric ozone chemistry and comparison to observations, J. Geophys. Res.-Atmos., 109, D02304, https://doi.org/10.1029/2003JD003868, 2004. a
Bauer, S. E., Koch, D., Unger, N., Metzger, S. M., Shindell, D. T., and Streets, D. G.: Nitrate aerosols today and in 2030: a global simulation including aerosols and tropospheric ozone, Atmos. Chem. Phys., 7, 5043–5059, https://doi.org/10.5194/acp-7-5043-2007, 2007. a, b, c, d
Bauer, S. E., Tsigaridis, K., and Miller, R.: Significant atmospheric aerosol pollution caused by world food cultivation, Geophys. Res. Lett., 43, 5394–5400, https://doi.org/10.1002/2016GL068354, 2016. a, b
Bellouin, N., Rae, J., Jones, A., Johnson, C., Haywood, J., and Boucher, O.: Aerosol forcing in the Climate Model Intercomparison Project (CMIP5) simulations by HadGEM2-ES and the role of ammonium nitrate, J. Geophys. Res.-Atmos., 116, D20206, https://doi.org/10.1029/2011JD016074, 2011. a
Bian, H., Chin, M., Hauglustaine, D. A., Schulz, M., Myhre, G., Bauer, S. E., Lund, M. T., Karydis, V. A., Kucsera, T. L., Pan, X., Pozzer, A., Skeie, R. B., Steenrod, S. D., Sudo, K., Tsigaridis, K., Tsimpidi, A. P., and Tsyro, S. G.: Investigation of global particulate nitrate from the AeroCom phase III experiment, Atmos. Chem. Phys., 17, 12911–12940, https://doi.org/10.5194/acp-17-12911-2017, 2017. a, b, c, d, e
Bouwman, A., Lee, D., Asman, W., Dentener, F., Van Der Hoek, K., and Olivier, J.: A global high-resolution emission inventory for ammonia, Global Biogeochem. Cy., 11, 561–587, https://doi.org/10.1029/97GB02266, 1997. a
Bréon, F.-M., Vermeulen, A., and Descloitres, J.: An evaluation of satellite aerosol products against sunphotometer measurements, Remote Sens. Environ., 115, 3102–3111, https://doi.org/10.1016/j.rse.2011.06.017, 2011. a
Claquin, T., Schulz, M., and Balkanski, Y.: Modeling the mineralogy of atmospheric dust sources, J. Geophys. Res.-Atmos., 104, 22243–22256, https://doi.org/10.1029/1999JD900416, 1999. a
Coakley Jr., J. A., Cess, R. D., and Yurevich, F. B.: The effect of tropospheric aerosols on the Earth's radiation budget: A parameterization for climate models, J. Atmos. Sci., 40, 116–138, https://doi.org/10.1175/1520-0469(1983)040<0116:TEOTAO>2.0.CO;2, 1983. a
Daniel, M., Lemonsu, A., Deque, M., Somot, S., Alias, A., and Masson, V.: Benefits of explicit urban parametrization in regional climate modelling to study climate and city interactions, Clim. Dynam., 52, 2745–2764, https://doi.org/10.1007/s00382-018-4289-x, 2018. a
Decharme, B., Alkama, R., Douville, H., Becker, M., and Cazenave, A.: Global evaluation of the ISBA-TRIP continental hydrological system. Part II: Uncertainties in river routing simulation related to flow velocity and groundwater storage, J. Hydrometeorol., 11, 601–617, https://doi.org/10.1175/2010JHM1212.1, 2010. a
Dentener, F., Kinne, S., Bond, T., Boucher, O., Cofala, J., Generoso, S., Ginoux, P., Gong, S., Hoelzemann, J. J., Ito, A., Marelli, L., Penner, J. E., Putaud, J.-P., Textor, C., Schulz, M., van der Werf, G. R., and Wilson, J.: Emissions of primary aerosol and precursor gases in the years 2000 and 1750 prescribed data-sets for AeroCom, Atmos. Chem. Phys., 6, 4321–4344, https://doi.org/10.5194/acp-6-4321-2006, 2006. a
Dentener, F. J. and Crutzen, P. J.: Reaction of N2O5 on tropospheric aerosols: Impact on the global distributions of NOx, O3, and OH, J. Geophys. Res.-Atmos., 98, 7149–7163, https://doi.org/10.1029/92JD02979, 1993. a
Dimitroulopoulou, C. and Marsh, A.: Modelling studies of NO3 nighttime chemistry and its effects on subsequent ozone formation, Atmos. Environ., 31, 3041–3057, https://doi.org/10.1016/S1352-2310(97)00033-2, 1997. a
Eck, T., Holben, B., Reid, J., Dubovik, O., Smirnov, A., O'Neill, N., Slutsker, I., and Kinne, S.: Wavelength dependence of the optical depth of biomass burning, urban, and desert dust aerosols, J. Geophys. Res.-Atmos., 104, 31333–31349, https://doi.org/10.1029/1999JD900923, 1999. a
Fairlie, T. D., Jacob, D. J., Dibb, J. E., Alexander, B., Avery, M. A., van Donkelaar, A., and Zhang, L.: Impact of mineral dust on nitrate, sulfate, and ozone in transpacific Asian pollution plumes, Atmos. Chem. Phys., 10, 3999–4012, https://doi.org/10.5194/acp-10-3999-2010, 2010. a
Flemming, J., Benedetti, A., Inness, A., Engelen, R. J., Jones, L., Huijnen, V., Remy, S., Parrington, M., Suttie, M., Bozzo, A., Peuch, V.-H., Akritidis, D., and Katragkou, E.: The CAMS interim Reanalysis of Carbon Monoxide, Ozone and Aerosol for 2003–2015, Atmos. Chem. Phys., 17, 1945–1983, https://doi.org/10.5194/acp-17-1945-2017, 2017. a, b
Foret, G., Bergametti, G., Dulac, F., and Menut, L.: An optimized particle size bin scheme for modeling mineral dust aerosol, J. Geophys. Res.-Atmos., 111, D17310, https://doi.org/10.1029/2005JD006797, 2006. a
Forster, P., Ramaswamy, V., Artaxo, P., Berntsen, T., Betts, R., Fahey, D. W., Haywood, J., Lean, J., Lowe, D. C., Myhre, G., Nganga, J., Prinn, R., Raga, G., Schulz, M., and Van Dorland, R.: Changes in atmospheric constituents and in radiative forcing, in: Climate Change 2007. The Physical Science Basis. Contribution of Working Group I to the Fourth Assessment Report of the Intergovernmental Panel on Climate Change, Cambridge University Press, Cambridge, UK and New York, NY, USA, 2007. a
Fouquart, Y. and Bonnel, B.: Computations of solar heating of the earth's atmosphere – A new parameterization, Beitraege zur Physik der Atmosphaere, 53, 35–62, 1980. a
Georgoulias, A., Alexandri, G., Kourtidis, K., Lelieveld, J., Zanis, P., and Amiridis, V.: Differences between the MODIS Collection 6 and 5.1 aerosol datasets over the greater Mediterranean region, Atmos. Environ., 147, 310–319, https://doi.org/10.1016/j.atmosenv.2016.10.014, 2016. a
Georgoulias, A. K., van der A, R. J., Stammes, P., Boersma, K. F., and Eskes, H. J.: Trends and trend reversal detection in two decades of tropospheric NO2 satellite observations, Atmos. Chem. Phys. Discuss., https://doi.org/10.5194/acp-2018-988, in review, 2018. a
Gibson, E. R., Hudson, P. K., and Grassian, V. H.: Aerosol chemistry and climate: Laboratory studies of the carbonate component of mineral dust and its reaction products, Geophys. Res. Lett., 33, L13811, https://doi.org/10.1029/2006GL026386, 2006. a
Hansen, J., Sato, M., and Ruedy, R.: Radiative forcing and climate response, J. Geophys. Res.-Atmos., 102, 6831–6864, https://doi.org/10.1029/96JD03436, 1997. a
Hauglustaine, D. A., Balkanski, Y., and Schulz, M.: A global model simulation of present and future nitrate aerosols and their direct radiative forcing of climate, Atmos. Chem. Phys., 14, 11031–11063, https://doi.org/10.5194/acp-14-11031-2014, 2014. a, b, c, d, e, f, g, h, i, j, k, l, m, n, o, p, q, r
Hilboll, A., Richter, A., and Burrows, J. P.: Long-term changes of tropospheric NO2 over megacities derived from multiple satellite instruments, Atmos. Chem. Phys., 13, 4145–4169, https://doi.org/10.5194/acp-13-4145-2013, 2013. a
Holben, B. N., Tanré, D., Smirnov, A., Eck, T., Slutsker, I., Abuhassan, N., Newcomb, W., Schafer, J., Chatenet, B., Lavenu, F., Kaufman, Y. J., Vande Castle, J., Setzer, A., Markham, B., Clark, D., Frouin, R., Halthore, R., Karneli, A., O'Neill, N. T., Pietras, C., Pinker, R. T., Voss, K., and Zibordi, G.: An emerging ground-based aerosol climatology: Aerosol optical depth from AERONET, J. Geophys. Res.-Atmos., 106, 12067–12097, https://doi.org/10.1029/2001JD900014, 2001. a
Jacobson, M. Z.: Studying the effects of calcium and magnesium on size-distributed nitrate and ammonium with EQUISOLV II, Atmos. Environ., 33, 3635–3649, https://doi.org/10.1016/S1352-2310(99)00105-3, 1999. a
Jordan, C., Dibb, J. E., Anderson, B., and Fuelberg, H.: Uptake of nitrate and sulfate on dust aerosols during TRACE-P, J. Geophys. Res.-Atmos., 108, 8817, https://doi.org/10.1029/2002JD003101, 2003. a
Kahn, R. A. and Gaitley, B. J.: An analysis of global aerosol type as retrieved by MISR, J. Geophys. Res.-Atmos., 120, 4248–4281, https://doi.org/10.1002/2015JD023322, 2015. a
Kahn, R. A., Gaitley, B. J., Garay, M. J., Diner, D. J., Eck, T. F., Smirnov, A., and Holben, B. N.: Multiangle Imaging SpectroRadiometer global aerosol product assessment by comparison with the Aerosol Robotic Network, J. Geophys. Res.-Atmos., 115, D23209, https://doi.org/10.1029/2010JD014601, 2010. a
Karydis, V. A., Tsimpidi, A. P., Bacer, S., Pozzer, A., Nenes, A., and Lelieveld, J.: Global impact of mineral dust on cloud droplet number concentration, Atmos. Chem. Phys., 17, 5601–5621, https://doi.org/10.5194/acp-17-5601-2017, 2017. a
Kasper, A. and Puxbaum, H.: Seasonal variation of SO2, HNO3, NH3 and selected aerosol components at Sonnblick (3106 m a.s.l.), Atmos. Environ., 32, 3925–3939, https://doi.org/10.1016/S1352-2310(97)00031-9, 1998. a, b, c, d, e
Kaufman, Y. J., Tanré, D., Remer, L. A., Vermote, E., Chu, A., and Holben, B.: Operational remote sensing of tropospheric aerosol over land from EOS moderate resolution imaging spectroradiometer, J. Geophys. Res.-Atmos., 102, 17051–17067, https://doi.org/10.1029/96JD03988, 1997. a
Kiendler-Scharr, A., Mensah, A. A., Friese, E., Topping, D., Nemitz, E., Prévôt, A. S. H., Äijälä, M., Allan, J., Canonaco, F., Canagaratna, M., Carbone, S., Crippa, M., Dall Osto, M., Day, D. A., De Carlo, P., Di Marco, C. F., Elbern, H., Eriksson, A., Freney, E., Hao, L., Herrmann, H., Hildebrandt, L., Hillamo, R., Jimenez, J. L., Laaksonen, A., McFiggans, G., Mohr, C., O'Dowd, C., Otjes, R., Ovadnevaite, J., Pandis, S. N., Poulain, L., Schlag, P., Sellegri, K., Swietlicki, E., Tiitta, P., Vermeulen, A., Wahner, A., Worsnop, D., and Wu, H. C.: Ubiquity of organic nitrates from nighttime chemistry in the European submicron aerosol, Geophys. Res. Lett., 43, 7735–7744, https://doi.org/10.1002/2016GL069239, 2016. a, b
Lelieveld, J., Berresheim, H., Borrmann, S., Crutzen, P. J., Dentener, F. J., Fischer, H., Feichter, J., Flatau, P. J., Heland, J., Holzinger, R., Korrmann, R., Lawrence, M. G., Levin, Z., Markowicz, K. M., Mihalopoulos, N., Minikin, A., Ramanathan, V., de Reus, M., Roelofs, G. J., Scheeren, H.A., Sciare, J., Schlager, H., Schultz, M., Siegmund, P., Steil, B., Stephanou, E. G., Stier, P., Traub, M., Warneke, C., Williams, J., and Ziereis, H.: Global air pollution crossroads over the Mediterranean, Science, 298, 794–799, https://doi.org/10.1126/science.1075457, 2002. a
Li, J., Wang, W.-C., Liao, H., and Chang, W.: Past and future direct radiative forcing of nitrate aerosol in East Asia, Theor. Appl. Climatol., 121, 445–458, https://doi.org/10.1007/s00704-014-1249-1, 2014. a
Lohmann, U. and Feichter, J.: Global indirect aerosol effects: a review, Atmos. Chem. Phys., 5, 715–737, https://doi.org/10.5194/acp-5-715-2005, 2005. a
Manktelow, P. T., Carslaw, K. S., Mann, G. W., and Spracklen, D. V.: The impact of dust on sulfate aerosol, CN and CCN during an East Asian dust storm, Atmos. Chem. Phys., 10, 365–382, https://doi.org/10.5194/acp-10-365-2010, 2010. a
Masson, V., Le Moigne, P., Martin, E., Faroux, S., Alias, A., Alkama, R., Belamari, S., Barbu, A., Boone, A., Bouyssel, F., Brousseau, P., Brun, E., Calvet, J.-C., Carrer, D., Decharme, B., Delire, C., Donier, S., Essaouini, K., Gibelin, A.-L., Giordani, H., Habets, F., Jidane, M., Kerdraon, G., Kourzeneva, E., Lafaysse, M., Lafont, S., Lebeaupin Brossier, C., Lemonsu, A., Mahfouf, J.-F., Marguinaud, P., Mokhtari, M., Morin, S., Pigeon, G., Salgado, R., Seity, Y., Taillefer, F., Tanguy, G., Tulet, P., Vincendon, B., Vionnet, V., and Voldoire, A.: The SURFEXv7.2 land and ocean surface platform for coupled or offline simulation of earth surface variables and fluxes, Geosci. Model Dev., 6, 929–960, https://doi.org/10.5194/gmd-6-929-2013, 2013. a
Metzger, S., Dentener, F., Pandis, S., and Lelieveld, J.: Gas/aerosol partitioning: 1. A computationally efficient model, J. Geophys. Res.-Atmos., 107, 4312, https://doi.org/10.1029/2001JD001102, 2002. a
Michou, M., Nabat, P., and Saint-Martin, D.: Development and basic evaluation of a prognostic aerosol scheme (v1) in the CNRM Climate Model CNRM-CM6, Geosci. Model Dev., 8, 501–531, https://doi.org/10.5194/gmd-8-501-2015, 2015. a, b, c
Mitchell, J. M.: The effect of atmospheric aerosols on climate with special reference to temperature near the Earth's surface, J. Appl. Meteorol., 10, 703–714, https://doi.org/10.1175/1520-0450(1971)010<0703:TEOAAO>2.0.CO;2, 1971. a
Mlawer, E. J., Taubman, S. J., Brown, P. D., Iacono, M. J., and Clough, S. A.: Radiative transfer for inhomogeneous atmospheres: RRTM, a validated correlated-k model for the longwave, J. Geophys. Res.-Atmos., 102, 16663–16682, https://doi.org/10.1029/97JD00237, 1997. a
Moffet, R. C., Qin, X., Rebotier, T., Furutani, H., and Prather, K. A.: Chemically segregated optical and microphysical properties of ambient aerosols measured in a single-particle mass spectrometer, J. Geophys. Res.-Atmos., 113, D12213, https://doi.org/10.1029/2007JD009393, 2008. a
Morcrette, J., Barker, H., Cole, J., Iacono, M., and Pincus, R.: Impact of a new radiation package, McRad, in the ECMWF Integrated Forecasting System, Mon. Weather Rev., 136, 4773–4798, https://doi.org/10.1175/2008MWR2363.1, 2008. a
Morcrette, J.-J., Boucher, O., Jones, L., Salmond, D., Bechtold, P., Beljaars, A., Benedetti, A., Bonet, A., Kaiser, J. W., Razinger, M., Schulz, M., Serrar, S., Simmons, A. J., Sofiev, M., Suttie, M., Tompkins, A. M., and Untch, A.: Aerosol analysis and forecast in the European Centre for medium-range weather forecasts integrated forecast system: Forward modeling, J. Geophys. Res.-Atmos., 114, D06206, https://doi.org/10.1029/2008JD011235, 2009. a
Moulin, C., Lambert, C., Dayan, U., Masson, V., Ramonet, M., Bousquet, P., Legrand, M., Balkanski, Y., Guelle, W., Marticorena, B., Bergametti, G., and Dulac, F.: Satellite climatology of African dust transport in the Mediterranean atmosphere, J. Geophys. Res.-Atmos., 103, 13137–13144, https://doi.org/10.1029/98JD00171, 1998. a
Mozurkewich, M.: The dissociation constant of ammonium nitrate and its dependence on temperature, relative humidity and particle size, Atmos. Environ. A-Gen., 27, 261–270, https://doi.org/10.1016/0960-1686(93)90356-4, 1993. a
Myhre, G., Grini, A., and Metzger, S.: Modelling of nitrate and ammonium-containing aerosols in presence of sea salt, Atmos. Chem. Phys., 6, 4809–4821, https://doi.org/10.5194/acp-6-4809-2006, 2006. a
Myhre, G., Samset, B. H., Schulz, M., Balkanski, Y., Bauer, S., Berntsen, T. K., Bian, H., Bellouin, N., Chin, M., Diehl, T., Easter, R. C., Feichter, J., Ghan, S. J., Hauglustaine, D., Iversen, T., Kinne, S., Kirkevåg, A., Lamarque, J.-F., Lin, G., Liu, X., Lund, M. T., Luo, G., Ma, X., van Noije, T., Penner, J. E., Rasch, P. J., Ruiz, A., Seland, Ø., Skeie, R. B., Stier, P., Takemura, T., Tsigaridis, K., Wang, P., Wang, Z., Xu, L., Yu, H., Yu, F., Yoon, J.-H., Zhang, K., Zhang, H., and Zhou, C.: Radiative forcing of the direct aerosol effect from AeroCom Phase II simulations, Atmos. Chem. Phys., 13, 1853–1877, https://doi.org/10.5194/acp-13-1853-2013, 2013. a, b
Nabat, P., Somot, S., Mallet, M., Chiapello, I., Morcrette, J. J., Solmon, F., Szopa, S., Dulac, F., Collins, W., Ghan, S., Horowitz, L. W., Lamarque, J. F., Lee, Y. H., Naik, V., Nagashima, T., Shindell, D., and Skeie, R.: A 4-D climatology (1979–2009) of the monthly tropospheric aerosol optical depth distribution over the Mediterranean region from a comparative evaluation and blending of remote sensing and model products, Atmos. Meas. Tech., 6, 1287–1314, https://doi.org/10.5194/amt-6-1287-2013, 2013. a, b, c, d, e, f
Nabat, P., Somot, S., Mallet, M., Michou, M., Sevault, F., Driouech, F., Meloni, D., di Sarra, A., Di Biagio, C., Formenti, P., Sicard, M., Léon, J.-F., and Bouin, M.-N.: Dust aerosol radiative effects during summer 2012 simulated with a coupled regional aerosol–atmosphere–ocean model over the Mediterranean, Atmos. Chem. Phys., 15, 3303–3326, https://doi.org/10.5194/acp-15-3303-2015, 2015a. a, b, c
Nabat, P., Somot, S., Mallet, M., Sevault, F., Chiacchio, M., and Wild, M.: Direct and semi-direct aerosol radiative effect on the Mediterranean climate variability using a coupled regional climate system model, Clim. Dynam., 44, 1127–1155, https://doi.org/10.1007/s00382-014-2205-6, 2015b. a, b
Nabat, P., Somot, S., and Mallet, M.: Les aérosols, composants essentiels du système climatique régional: illustrations pour le climat méditerranéen (prix Prud'homme 2015), La météorologie, France, https://doi.org/10.4267/2042/60701, 2016. a, b
Noilhan, J. and Mahfouf, J.-F.: The ISBA land surface parameterisation scheme, Global Planet. Change, 13, 145–159, https://doi.org/10.1016/0921-8181(95)00043-7, 1996. a
Olivier, J. G. J., Bouwman, A. F., Van der Hoek, K. W., and Berdowski, J. J. M.: Global air emission inventories for anthropogenic sources of NOx, NH3 and N2O in 1990, Environ. Pollut., 102, 135–148, https://doi.org/10.1016/B978-0-08-043201-4.50024-1, 1998. a
O'Neill, B. C., Tebaldi, C., van Vuuren, D. P., Eyring, V., Friedlingstein, P., Hurtt, G., Knutti, R., Kriegler, E., Lamarque, J.-F., Lowe, J., Meehl, G. A., Moss, R., Riahi, K., and Sanderson, B. M.: The Scenario Model Intercomparison Project (ScenarioMIP) for CMIP6, Geosci. Model Dev., 9, 3461–3482, https://doi.org/10.5194/gmd-9-3461-2016, 2016. a
Papadimas, C. D., Hatzianastassiou, N., Matsoukas, C., Kanakidou, M., Mihalopoulos, N., and Vardavas, I.: The direct effect of aerosols on solar radiation over the broader Mediterranean basin, Atmos. Chem. Phys., 12, 7165–7185, https://doi.org/10.5194/acp-12-7165-2012, 2012. a
Paulot, F., Jacob, D. J., Pinder, R., Bash, J., Travis, K., and Henze, D.: Ammonia emissions in the United States, European Union, and China derived by high-resolution inversion of ammonium wet deposition data: Interpretation with a new agricultural emissions inventory (MASAGE_NH3), J. Geophys. Res.-Atmos., 119, 4343–4364, https://doi.org/10.1002/2013JD021130, 2014. a
Paulot, F., Paynter, D., Ginoux, P., Naik, V., and Horowitz, L. W.: Changes in the aerosol direct radiative forcing from 2001 to 2015: observational constraints and regional mechanisms, Atmos. Chem. Phys., 18, 13265–13281, https://doi.org/10.5194/acp-18-13265-2018, 2018. a
Prospero, J. M., Ginoux, P., Torres, O., Nicholson, S. E., and Gill, T. E.: Environmental characterization of global sources of atmospheric soil dust identified with the Nimbus 7 Total Ozone Mapping Spectrometer (TOMS) absorbing aerosol product, Rev. Geophys., 40, 2–1, https://doi.org/10.1029/2000RG000095, 2002. a
Putaud, J., Raes, F., van Dingenen, R., Brüggemann, E., Facchini, M. C., Decesari, S., Fuzzi, S., Gehrig, R., Hüglin, C., Laj, P., Lorbeer, G., Maenhaut, W., Mihalopoulos, N., Müller, K., Querol, X., Rodriguez, S., Schneider, J., Spindler, G., tenBrink, H., Torseth, K., and Wiedensohler, A.: A European aerosol phenomenology – 2: chemical characteristics of particulate matter at kerbside, urban, rural and background sites in Europe, Atmos. Environ., 38, 2579–2595, https://doi.org/10.1016/j.atmosenv.2004.01.041, 2004. a
Radu, R., Déqué, M., and Somot, S.: Spectral nudging in a spectral regional climate model, Tellus A, 60, 898–910, https://doi.org/10.1111/j.1600-0870.2008.00341.x, 2008. a
Sayer, A., Munchak, L., Hsu, N., Levy, R., Bettenhausen, C., and Jeong, M.-J.: MODIS Collection 6 aerosol products: Comparison between Aqua's e-Deep Blue, Dark Target, and “merged” data sets, and usage recommendations, J. Geophys. Res.-Atmos., 119, 13965–13989, https://doi.org/10.1002/2014JD022453, 2014. a
Schaap, M., Müller, K., and Ten Brink, H.: Constructing the European aerosol nitrate concentration field from quality analysed data, Atmos. Environ., 36, 1323–1335, https://doi.org/10.1016/S1352-2310(01)00556-8, 2002. a
Schaap, M., van Loon, M., ten Brink, H. M., Dentener, F. J., and Builtjes, P. J. H.: Secondary inorganic aerosol simulations for Europe with special attention to nitrate, Atmos. Chem. Phys., 4, 857–874, https://doi.org/10.5194/acp-4-857-2004, 2004. a, b, c, d
Seinfeld, J. H., Pandis, S. N., and Noone, K.: Atmospheric chemistry and physics: from air pollution to climate change, Phys. Today, 51, p. 88, https://doi.org/10.1063/1.882420, 1998. a
Shindell, D. T., Lamarque, J.-F., Schulz, M., Flanner, M., Jiao, C., Chin, M., Young, P. J., Lee, Y. H., Rotstayn, L., Mahowald, N., Milly, G., Faluvegi, G., Balkanski, Y., Collins, W. J., Conley, A. J., Dalsoren, S., Easter, R., Ghan, S., Horowitz, L., Liu, X., Myhre, G., Nagashima, T., Naik, V., Rumbold, S. T., Skeie, R., Sudo, K., Szopa, S., Takemura, T., Voulgarakis, A., Yoon, J.-H., and Lo, F.: Radiative forcing in the ACCMIP historical and future climate simulations, Atmos. Chem. Phys., 13, 2939–2974, https://doi.org/10.5194/acp-13-2939-2013, 2013. a, b, c
Tang, I. N.: Deliquescence properties and particle size change of hygroscopic aerosols, Tech. rep., Brookhaven National Lab., Upton, NY (USA), available at: https://www.osti.gov/servlets/purl/5527062 (last access: 19 March 2019), 1979. a
Tang, T., Shindell, D., Samset, B. H., Boucher, O., Forster, P. M., Hodnebrog, Ø., Myhre, G., Sillmann, J., Voulgarakis, A., Andrews, T., Faluvegi, G., Fläschner, D., Iversen, T., Kasoar, M., Kharin, V., Kirkevåg, A., Lamarque, J.-F., Olivié, D., Richardson, T., Stjern, C. W., and Takemura, T.: Dynamical response of Mediterranean precipitation to greenhouse gases and aerosols, Atmos. Chem. Phys., 18, 8439–8452, https://doi.org/10.5194/acp-18-8439-2018, 2018. a
Tanré, D., Kaufman, Y., Herman, M., and Mattoo, S.: Remote sensing of aerosol properties over oceans using the MODIS/EOS spectral radiances, J. Geophys. Res.-Atmos., 102, 16971–16988, https://doi.org/10.1029/96JD03437, 1997. a
Toon, O. B. and Ackerman, T.: Algorithms for the calculation of scattering by stratified spheres, Appl. Optics, 20, 3657–3660, https://doi.org/10.1364/AO.20.003657, 1981. a
Tørseth, K., Aas, W., Breivik, K., Fjæraa, A. M., Fiebig, M., Hjellbrekke, A. G., Lund Myhre, C., Solberg, S., and Yttri, K. E.: Introduction to the European Monitoring and Evaluation Programme (EMEP) and observed atmospheric composition change during 1972–2009, Atmos. Chem. Phys., 12, 5447–5481, https://doi.org/10.5194/acp-12-5447-2012, 2012. a
Trail, M., Tsimpidi, A., Liu, P., Tsigaridis, K., Rudokas, J., Miller, P., Nenes, A., Hu, Y., and Russell, A.: Sensitivity of air quality to potential future climate change and emissions in the United States and major cities, Atmos. Environ., 94, 552–563, https://doi.org/10.1016/j.atmosenv.2014.05.079, 2014. a
Twomey, S.: The influence of pollution on the shortwave albedo of clouds, J. Atmos. Sci., 34, 1149–1152, https://doi.org/10.1175/1520-0469(1977)034<1149:TIOPOT>2.0.CO;2, 1977. a
Zanis, P.: A study on the direct effect of anthropogenic aerosols on near surface air temperature over Southeastern Europe during summer 2000 based on regional climate modeling, Ann. Geophys., 27, 3977–3988, https://doi.org/10.5194/angeo-27-3977-2009, 2009. a
Zanis, P., Ntogras, C., Zakey, A., Pytharoulis, I., and Karacostas, T.: Regional climate feedback of anthropogenic aerosols over Europe using RegCM3, Clim. Res., 52, 267–278, https://doi.org/10.3354/cr01070, 2012. a
Zhuang, H., Chan, C. K., Fang, M., and Wexler, A. S.: Size distributions of particulate sulfate, nitrate, and ammonium at a coastal site in Hong Kong, Atmos. Environ., 33, 843–853, https://doi.org/10.1016/S1352-2310(98)00305-7, 1999. a
- Abstract
- Introduction
- Model description
- Methodology
- Evaluation of the new aerosol scheme and analysis of the spatio-temporal variability and trends of A&N aerosols
- Impact of ammonium and nitrate aerosols on the radiative budget and regional climate
- Conclusions
- Data availability
- Author contributions
- Competing interests
- Special issue statement
- Acknowledgements
- Review statement
- References