the Creative Commons Attribution 4.0 License.
the Creative Commons Attribution 4.0 License.
 | 22 Feb 2019
High Arctic aircraft measurements characterising black carbon vertical variability in spring and summer
Hannes Schulz
Marco Zanatta
Heiko Bozem
W. Richard Leaitch
Andreas B. Herber
Julia Burkart
Megan D. Willis
Daniel Kunkel
Peter M. Hoor
Jonathan P. D. Abbatt
Rüdiger Gerdes
The vertical distribution of black carbon (BC) particles in the Arctic atmosphere is one of the key parameters controlling their radiative forcing and thus role in Arctic climate change. This work investigates the presence and properties of these light-absorbing aerosols over the High Canadian Arctic (>70∘ N). Airborne campaigns were performed as part of the NETCARE project (Network on Climate and Aerosols: Addressing Key Uncertainties in Remote Canadian Environments) and provided insights into the variability of the vertical distributions of BC particles in summer 2014 and spring 2015. The observation periods covered evolutions of cyclonic disturbances at the polar front, which favoured the transport of air pollution into the High Canadian Arctic, as otherwise this boundary between the air masses largely impedes entrainment of pollution from lower latitudes. A total of 48 vertical profiles of refractory BC (rBC) mass concentration and particle size, extending from 0.1 to 5.5 km altitude were obtained with a Single-Particle Soot Photometer (SP2).
Generally, the rBC mass concentration decreased from spring to summer by a factor of 10. Such depletion was associated with a decrease in the mean rBC particle diameter, from approximately 200 to 130 nm at low altitude. Due to the very low number fraction, rBC particles did not substantially contribute to the total aerosol population in summer.
The analysis of profiles with potential temperature as vertical coordinate revealed characteristic variability patterns within specific levels of the cold and stably stratified, dome-like, atmosphere over the polar region. The associated history of transport trajectories into each of these levels showed that the variability was induced by changing rates and efficiencies of rBC import. Generally, the source areas affecting the polar dome extended southward with increasing potential temperature (i.e. altitude) level in the dome. While the lower dome was mostly only influenced by low-level transport from sources within the cold central and marginal Arctic, for the mid-dome and upper dome during spring it was found that a cold air outbreak over eastern Europe caused intensified northward transport of air from a corridor over western Russia to central Asia. This sector was affected by emissions from gas flaring, industrial activity and wildfires. The development of transport caused rBC concentrations in the second lowest level to gradually increase from 32 to 49 ng m−3. In the third level this caused the initially low rBC concentration to increase from <15 to 150 ng m−3. A shift in rBC mass-mean diameter, from above 200 nm in the lower polar dome dominated by low-level transport to <190 nm at higher levels, may indicate that rBC was affected by wet removal mechanisms preferential to larger particle diameters when lifting processes were involved during transport. The summer polar dome had limited exchange with the mid-latitudes. Air pollution was supplied from sources within the marginal Arctic as well as by long-range transport, but in both cases rBC was largely depleted in absolute and relative concentrations. Near the surface, rBC concentrations were <2 ng m−3, while concentrations increased to <10 ng m−3 towards the upper boundary of the polar dome. The mass mean particle diameter of 132 nm was smaller than in spring; nonetheless the summer mean mass size distribution resembled the spring distribution from higher levels, with depletion of particles >300 nm.
Our work provides vertical, spatial and seasonal information of rBC characteristics in the polar dome over the High Canadian Arctic, offering a more extensive dataset for evaluation of chemical transport models and for radiative forcing assessments than those obtained before by other Arctic aircraft campaigns.
- Article
(16037 KB) - Full-text XML
-
Supplement
(7716 KB) - BibTeX
- EndNote


Climate change in the Arctic is more rapid than on global scale and a significant loss of the summertime sea-ice extent has been observed over recent decades (e.g. Lindsay et al., 2009). The fast progression of change is largely a result of the ice-albedo and temperature feedback (Screen and Simmonds, 2010; Pithan and Mauritsen, 2014). The driving agents of Arctic warming, however, still remain unclear. Recent studies suggest that next to CO2, short-lived climate forcers contribute significantly to the observed warming, but their complex interactions with the Arctic climate system cause high uncertainties (Quinn et al., 2008; Shindell et al., 2012; Yang et al., 2014; AMAP, 2015; Sand et al., 2015). Black carbon (BC) particles, emitted during incomplete combustion of fossil fuels and biomass, are the major light-absorbing component of atmospheric aerosol. Bond et al. (2013) concluded that atmospheric BC's interaction with solar radiation induces a global radiative forcing of +0.71 W m−2, with an uncertainty range of +0.08 up to +1.27 W m−2. BC may also affect the distribution, lifetime, and microphysical properties of clouds when particles act as cloud condensation nuclei (e.g. Chen et al., 2010) or, in BC-loaded atmospheric layers, cloud properties can change as adjustment to increased temperature and stability (e.g. Lohmann and Feichter, 2001). The aerosol–cloud interaction is suspected to significantly impact climate (IPCC, 2013), but the overall level of scientific understanding is still low (Bond et al., 2013). The aerosol interactions with solar radiation and clouds not only depend on concentrations, but also on microphysical properties of BC particles, namely the size distribution and mixing state (Kodros et al., 2018).
Model studies of the Arctic climate system by Flanner (2013) and Samset et al. (2013) emphasise that Arctic surface temperatures have different sensitivities to BC's radiative forcing, depending on the altitude at which absorbing aerosols are distributed. When absorption and scattering through aerosols occur higher in the atmosphere, it has a dimming effect on the solar radiation reaching the surface. The energy absorbed at higher levels is inefficiently mixed downward and atmospheric stability is even increased; thus BC-containing aerosol can cause a net cooling effect at the surface (MacCracken et al., 1986). On the other hand, thermal radiation from absorbed solar light in the lower parts of the atmosphere can actually contribute efficiently to surface warming. Reflections from the bright, high-albedo ice and snow surfaces in the Arctic increase the amount of energy absorbed by aerosols like BC. Aerosol particles are removed from the atmosphere by sedimentation as well as nucleation, impaction and below-cloud scavenging (e.g. Kondo et al., 2016). The result within the Arctic is likely a deposition of BC in ice and snow that can darken the otherwise highly reflective surfaces (Flanner et al., 2009; Tuzet et al., 2017, and references therein). Studies (e.g. Hansen and Nazarenko, 2004; Flanner et al., 2007) suggest that an albedo decrease due to deposition can offset the cooling effect through dimming by higher atmospheric aerosol, but the balance of these effects in the Arctic can only be estimated in models as accurately as vertical distributions of BC are known. However, profiles of BC concentration show a spread of more than 1 order of magnitude amongst different state-of-the-art models as well as between models and observations (AMAP, 2015).
Consequently, in order to provide accurate radiative forcing estimation in the Arctic region, it is necessary to understand what controls the vertical distribution of BC particles in the Arctic atmosphere. Import of polluted air from lower latitudes is controlled by the cold air mass that lies over the Arctic like a dome with sloping isentropes, the isolines of potential temperature (Barrie, 1986; Klonecki et al., 2003). The polar dome's vertical temperature structure forces warmer air from lower latitudes to ascend along those isentropic surfaces when transported into the colder high-latitude polar region, reaching it in layers in the middle and upper troposphere (Stohl, 2006). The polar front between the cold polar and the warmer mid-latitude air masses, a strong horizontal temperature gradient, acts as transport barrier that is controlling the intrusion of polluted air from southern source regions into the Arctic (see Bozem et al., 2019). Emissions from sources within the cold polar air are transported through the Arctic at lower altitudes. BC emitted from continental areas in the Northern Hemisphere is mainly carried poleward by mid-latitude low-pressure systems and is eventually mixed across the polar front in the systems' warm and cold fronts. These frontal systems, with lifetimes of 1–2 weeks, are frequently generated and poleward mass transport is continuously induced (Stohl, 2006; Sato et al., 2016). The polar front retreats northward in the summer and leaves many pollution sources south of this transport barrier. Increased wet removal (scavenging) of aerosol particles is thought to help maintain much more pristine conditions throughout the Arctic in summer, compared to winter and spring (Barrie, 1986; Shaw, 1995; Garrett et al., 2011; Tunved et al., 2013; Raut et al., 2017). This pronounced seasonal variability of BC concentration was observed at ground-based High Arctic measurement sites (e.g. Eleftheriadis et al., 2009; Massling et al., 2015; Sharma et al., 2017); however, the near-surface air is decoupled from the middle and upper troposphere due to the high stability of the atmosphere (Brock et al., 2011) and these measurements cannot represent variability in the vertical (Stohl, 2006). The concentrations of BC particles in the lower atmosphere might be affected by increasing numbers of local emissions. In fact, as the sea-ice retreat makes the Arctic region more accessible, commercial activities in the marginal Arctic (the sea-ice boundary and boreal forest region), associated with flaring of gas in connection with oil extraction (Stohl et al., 2013; Evans et al., 2017) and shipping (e.g. Corbett et al., 2010; Aliabadi et al., 2015), are increasing. The possible consequences are an area of current research demand (Law et al., 2017). Models aiming to assess the radiative forcing impact of Arctic aerosol have shortcomings in the representation of concentrations and size distributions as well as their vertical variability, which was partly attributed to incorrect treatment of scavenging processes in parametrisations (Schwarz et al., 2010b; Liu et al., 2011). Therefore, vertically resolved observations of aerosol mass and size distributions are an important benchmark for chemical transport models.
Despite their important implications, measurements of the vertical distribution of BC and its variability in the Arctic atmosphere are very sparse (AMAP, 2015). Aircraft campaigns like ARCPAC, ARCTAS and POLARCAT (Spackman et al., 2010; Brock et al., 2011; Kondo et al., 2011a; Matsui et al., 2011; Wang et al., 2011); PAMARCMIP (Stone et al., 2010); HIPPO (Schwarz et al., 2010b, 2013) and ACCESS (Law et al., 2017; Raut et al., 2017) delivered limited numbers of BC vertical profiles from within the cold High Arctic air mass. To increase the validity and reduce biases of the vertical information on the presence of BC in the Arctic, which is the basis of our system understanding, high-latitude observations at better spatial and temporal resolution are required. Such observations may resolve the internal variability due to weather changes as well as regional characteristics due to the prevailing atmospheric transport pathways with respect to differences between the seasons.
This paper will discuss a set of measurements from the spring and summer aircraft campaigns in the NETCARE project (Network on Climate and Aerosols: Addressing Key Uncertainties in Remote Canadian Environments, http://www.netcare-project.ca, last access: 10 February 2019). Motivated by the high sensitivity of the mechanisms of BC's radiative forcing in the Arctic climate system on its vertical distribution, the main goal of this study is to characterise the vertical variability of BC concentrations and particle properties in the polar dome, contrasting spring and summer. The campaigns yielded a unique and detailed dataset from within the polar dome at high latitudes, and covered timescales that give insight into the variability of aerosol distributions due to changes in the meteorological conditions and transport pathways for air pollution in spring and summer.
2.1 Spatial and temporal coverage of research flights
Aerosol observations were carried out with the Alfred Wegener Institute's (AWI) research aircraft Polar 6, a DC-3 fuselage converted to a turboprop Basler BT-67 (see Herber et al., 2008). This aircraft was specifically modified for polar research and allows flights at relatively low speeds and within an altitude range of 60–8000 m above mean sea level. A constant survey speed of approximately 120 knots and ascent or descent rates of 150 m min−1 were maintained for vertical profiles.
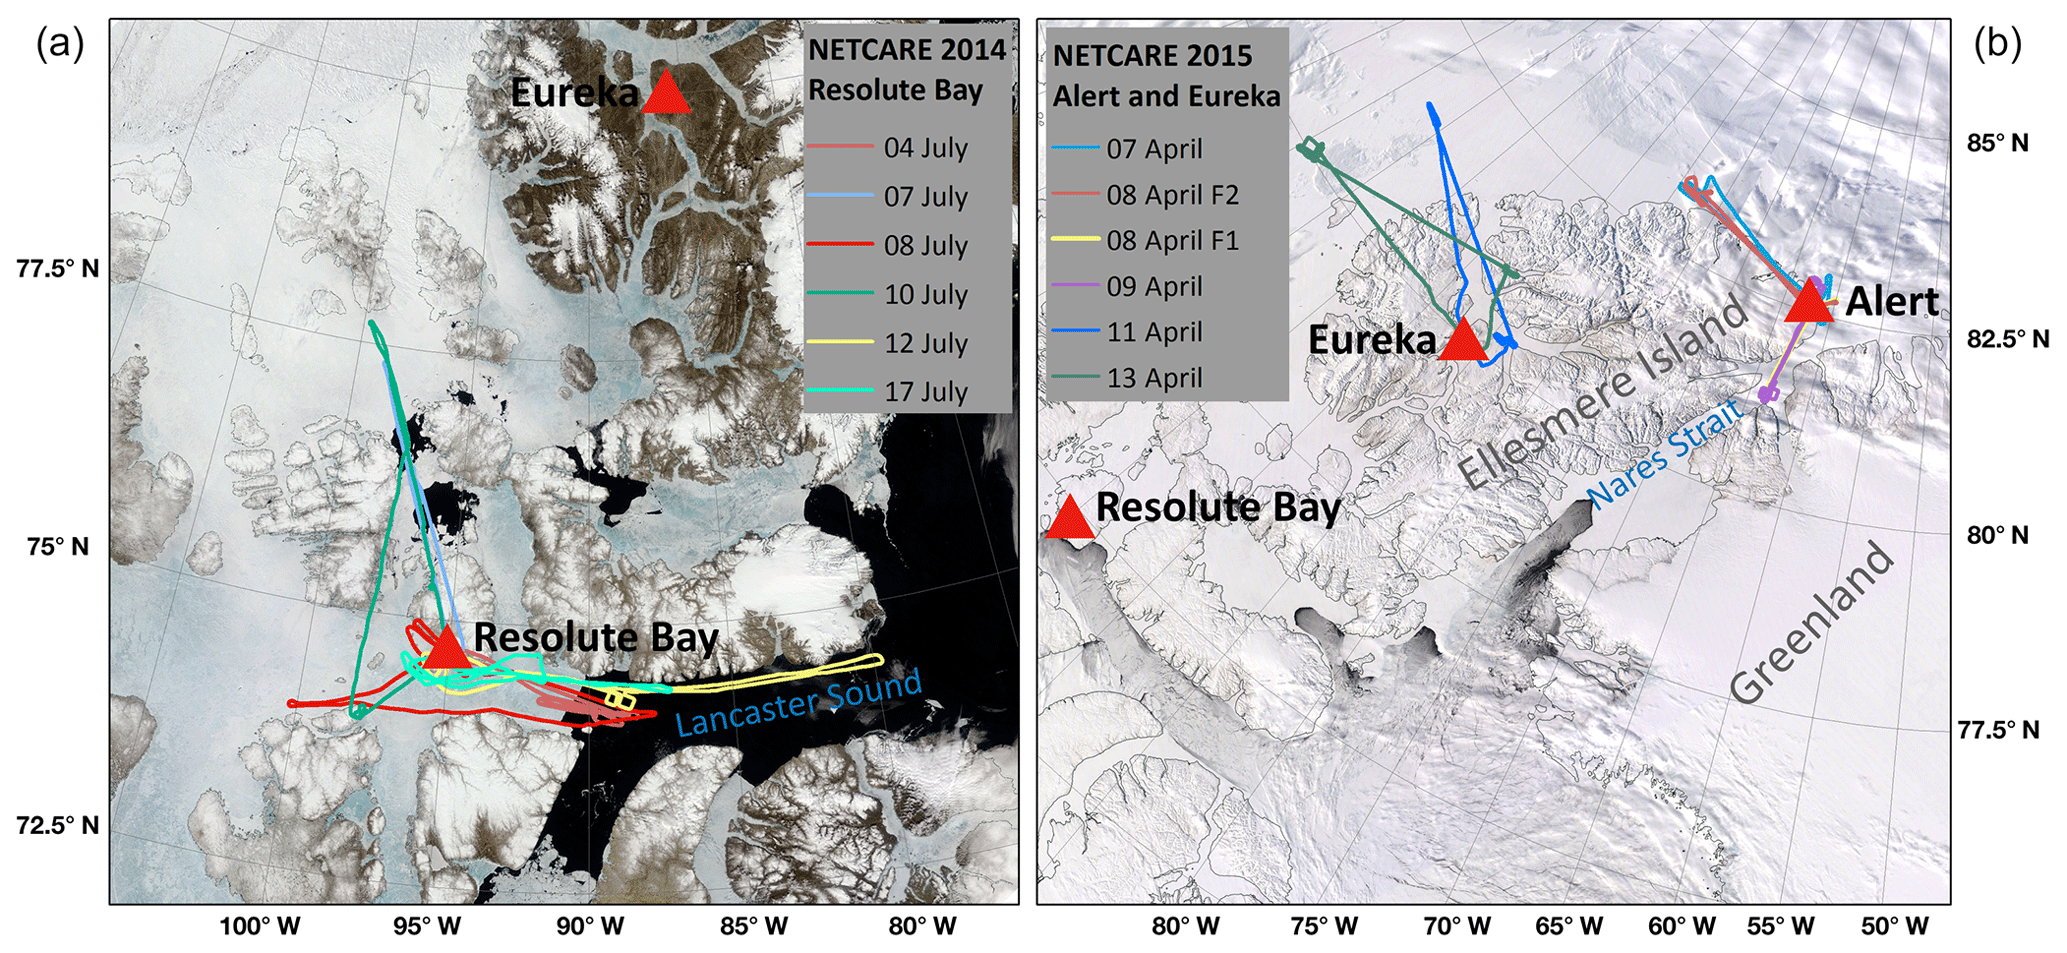
Figure 1Maps of all flight tracks evaluated in this study. The summer measurement flights were operated out of Resolute Bay on the northern shore of Lancaster Sound, southern Canadian Arctic Archipelago (a). The spring campaign operated from Alert and Eureka on Ellesmere Island (b). MODIS satellite true-colour images were obtained from https://worldview.earthdata.nasa.gov (last access: 10 February 2019).
The vertical atmospheric profile measurements were performed during the aircraft campaigns of the NETCARE project in summer 2014 and spring 2015 (Abbatt et al., 2018). The summer measurements took place from 4 to 21 July 2014 and the aircraft was based in Resolute Bay (74.7∘ N, 94.9∘ W), Nunavut, at the northern shores of Lancaster Sound in the Canadian Arctic Archipelago. During spring, measurements on a total of 10 flights took place from 5 to 21 April 2015 as a traverse through the western Arctic with four stations: Longyearbyen (78.2∘ N, 15.6∘ E), Svalbard; Alert (82.5∘ N, 62.3∘ W), Nunavut, Canada; Eureka (80.0∘ N, 85.9∘ W), Nunavut, Canada; and Inuvik (68.4∘ N, 133.7∘ W), Northwest Territories, Canada. The map in Fig. 1 details all flight tracks from both campaigns analysed in this study, which is a subset of research flights that took place north of the Arctic front and thus within or above the polar dome. This selection is based on the extent of the polar dome defined in Bozem et al. (2019). Table 1 gives a list of the flights selected for this study.
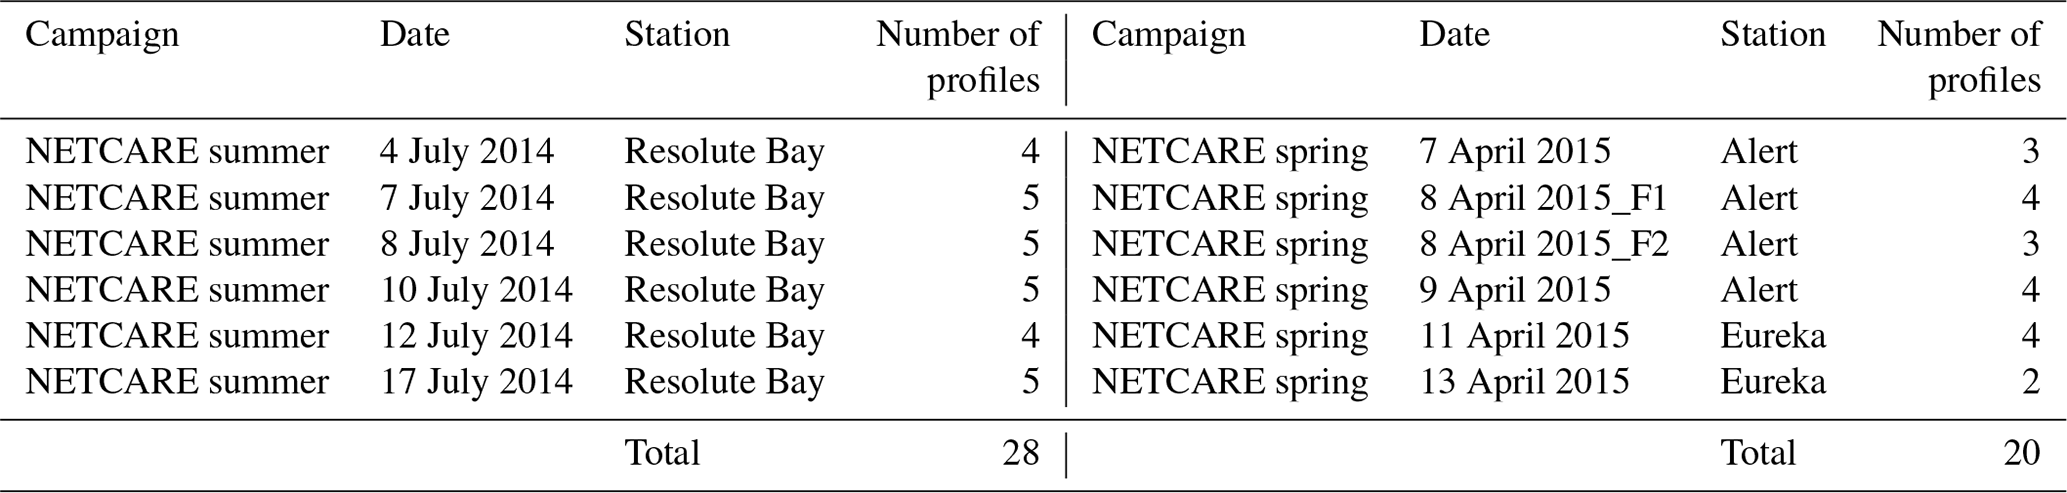
Table 1An overview of all measurement flights of the NETCARE summer campaign 2014 and the spring campaign 2015 that are evaluated in this study. The stations are the Arctic airfields the plane started from and returned to (see Fig. 1). Two flights took place on 8 April 2015, which are referred to with the shorthand notations F1 and F2.
2.2 Measurements
2.2.1 Single-particle aerosol measurements
A Single-Particle Soot Photometer (SP2; 8-channel) by Droplet Measurement Technologies Inc. (DMT, Longmont, CO, USA) was used to detect BC particles. The operation principle and evaluations of the method are given by Stephens et al. (2003), Schwarz et al. (2006) and Moteki and Kondo (2010). Briefly, the SP2 is based on the laser-induced-incandescence method: a concentric-nozzle jet system directs the aerosol sample flow through a high-intensity continuous-wave intra-cavity laser beam at a wavelength of 1064 nm, in which highly absorbing particles, such as BC, are heated to their vaporisation temperature and emit thermal radiation (incandescence). Particles containing a sufficient amount of BC (∼0.5 fg) can absorb enough energy to reach incandescence, which excludes sensitivity to other, less absorptive material, such as organic carbon, brown carbon or inorganic aerosol components. The peak intensity of the emitted thermal radiation, which occurs when the boiling-point temperature of BC is reached, is proportional to the BC mass contained in the particle. Following the terminology defined by Petzold et al. (2013), the refractory, essentially pure carbon, material detected with the SP2 is hereafter referred to as refractory black carbon (rBC). All other particulates that may be internally mixed with a BC core evaporate at temperatures below the boiling point of BC (∼4000 ∘C) such that no interference occurs in the quantification of the rBC mass (Moteki and Kondo, 2007).
The incandescence light detector, a photomultiplier tube with a 350–800 nm band-pass filter, used two gain stages. It was calibrated with a fullerene soot standard from Alfa Aesar (stock no. 40971, lot no. FS12S011) by selecting a narrow size distribution of particles with a differential mobility analyser upstream of the SP2 (following Schwarz et al., 2010a; Laborde et al., 2012). The mass of these mono-disperse particles was empirically calculated using the relationship between mobility diameter and the effective density of fullerene soot (Gysel et al., 2011). The fullerene soot calibrations used for the datasets of the two NETCARE campaigns agreed to within ±10 % with each other, ensuring a good degree of comparability between the two campaigns in agreement with the reproducibility of SP2 rBC mass measurements evaluated by Laborde et al. (2012). After calibration, the SP2 allowed 100 % detection efficiency of particles with mass in the range 0.6–328.8 fg, which is equal to 85–704 nm mass equivalent diameter (DrBC), assuming a void-free bulk material density of 1.8 g cm−3. The SP2 was prepared for the research flights following the recommendations given in Laborde et al. (2012). Stability of the optical system and laser power was confirmed during the campaign by measuring mono-disperse polystyrene latex (PSL) spheres. An estimated total uncertainty of rBC mass concentrations is 15 %, including reproducibility and calibration uncertainty (Laborde et al., 2012) and uncertainties of airborne in situ measurements (e.g. precision of the sample flow measurement). The SP2 was used to obtain rBC mass concentrations (MrBC), rBC number size distribution weighted by particle mass (mass size distributions, MSDs) and mass mean diameters (MMDs) of rBC particles.
The measured MrBC was not corrected for the mass of particles outside the detection range and are thus only valid for the range 85–704 nm. The contribution of small Aitken mode particles as well as particles larger than 704 nm to the total PM1 rBC mass (mass of particles smaller than 1000 nm) may be significant and the measurements presented here can underestimate the total PM1 mass by variable degrees. Approaches as used by Sharma et al. (2017), to estimate the total PM1 rBC mass by fitting a lognormal distribution to a measured particle MSD, cannot be applied to aircraft measurements since MSDs vary with location and altitude and statistics are insufficient to derive multivariate correction factors. The underestimation of the total PM1 mass due to the contribution of particles smaller than 85 nm were calculated for selected cases to be an additional 4.5 % (between 2 % and 7 %) rBC mass in the summer polar dome, 7.5 % (between 4.5 % and 8.5 %) in the lower spring polar dome and up to 10 % (7.8 %–12 %) within high-concentration pollution plumes. Assuming the SP2 was likely able to count (but not size) all particles between 700 and 1000 nm, an infrequent (<30 particles per flight) underestimation of the PM1 mass due to large particles occurred in spring in high-concentration plumes as well as in the lower atmosphere. No influence of particles larger than 700 nm was apparent for summer conditions.
The particle number size distributions and number concentration of the total aerosol (TA) were measured with a DMT Ultra-High Sensitivity Aerosol Spectrometer (UHSAS). As described in Cai et al. (2008), the UHSAS measures the scattered light intensity of individual particles crossing an intra-cavity solid-state laser (Nd3+ : Y LiF4), operating at a wavelength of 1054 nm, to evaluate the particle size (under the assumption of the refractive index of PSL particles and spherical shape). The UHSAS can detect scattering particles over the range 85–1000 nm with 95 % counting efficiency below concentrations of 3000 cm−3 compared to a condensation particle counter (CPC) (Cai et al., 2008). Thus, the instrument covers a size range comparable to the SP2's rBC particle detection range. Fast changes in the aircraft's vertical speed can cause a pressure difference between inlet and exhaust of the instrument and may affect the sample flow measurements, and thus concentrations reported by standard UHSAS (Brock et al., 2011). Instrument modifications were recommended by Kupc et al. (2018). Cross-comparisons of data from the non-modified UHSAS used in this study with other aerosol counters (SP2, CPC) have, however, shown no effects. This is likely due to the slow vertical speed maintained during the research flights and the non-pressurised cabin of Polar 6 compared to the NOAA WP-3D aircraft used for the measurements reported by Brock et al. (2011). In the present work, the number ratio of rBC over TA particles, RnumTA, was used to identify atmospheric layers influenced by combustion-generated aerosol. It must be noted that, due to the limited detection range of the UHSAS, the TA number is biased low and RnumTA must therefore be considered as an upper estimate of the number fraction of rBC particles.
The air inlet for aerosol sampling was a shrouded inlet diffuser (diameter 0.35 cm at intake point) on a stainless steel tube (outer diameter of 2.5 cm, inner diameter of 2.3 cm) mounted to the top of the cockpit and ahead of the engines to exclude contamination. In-flight air was pushed through the line with a regulated flow rate of approximately 55 L min−1, which was estimated to meet nearly isokinetic sampling criteria at survey speed. The transmission efficiency of particles with diameters between 20 and 1000 nm through the main inlet was approximately unity. The inlet is further discussed by Leaitch et al. (2016). The SP2 and UHSAS shared one bypass line off the main aerosol inlet and sampled with constant 120 cm3 min−1 (volumetric) and 50 cm3 min−1 (at standard temperature and pressure, STP), respectively. A higher flow was maintained in the bypass using a critical orifice and a vacuum pump at its end. The rBC mass and number concentrations presented in this study refer to standard temperature and pressure of 273.15 K and 1013.25 hPa, respectively, as the volumetric flow was converted using temperature and pressure readings from the instrument's measurement chamber.
2.2.2 Trace gases
Carbon monoxide (CO) was measured with an Aerolaser ultra fast CO monitor model AL 5002 based on vacuum ultraviolet fluorimetry, using the excitation of CO at a wavelength of 150 nm. The instrument was modified for applying in situ calibrations during in-flight operations. Calibrations were performed on a 15–30 min time interval during the measurement flights, using a NIST traceable calibration gas. The total uncertainty relative to the working standard of 4.7 ppbv (summer) or 2.3 ppbv (spring) can be regarded as an upper limit. Further details of calibrations and corrections are presented by Bozem et al. (2019). Trace gases were sampled through a separate inlet made of a 0.4 cm (outer diameter) Teflon tubing entering the aircraft at the main inlet and exiting through a rear-facing 0.95 cm exhaust line that provided a lower line pressure. An inlet flow of approximately 12 L min−1 was continuously monitored.
Atmospheric BC and CO are often co-emitted from the same combustion sources (Streets et al., 2003), but the relative ratio of the species depends on the combustion type, i.e. fuel types such as biomass or fossil fuel, and combustion conditions, such as flaming, smouldering or (engine) internal combustion. As opposed to aerosol, which is affected by dry and wet removal mechanisms, CO can be used as a nearly inert combustion tracer within timescales of a few weeks. This assumption is neglecting possible sources of CO due to biogenic production or by means of oxidation of other trace gases (Gaubert et al., 2016). The ratio of rBC to CO relative to their background levels (RCO) can be used as an indicator for when rBC particles were depleted by removal processes (Oshima et al., 2012; Stohl et al., 2013). Based on the measured rBC and CO concentrations, the ratio is calculated as (with units ng m−3 ppbv−1). A background completely depleted of rBC is assumed throughout the column as in previous studies (e.g. Moteki et al., 2012; Kondo et al., 2016) due to the short atmospheric lifetime of BC of the order of days to weeks (Bond et al., 2013). The CO background value is altitude dependent (Supplement Fig. S1) and hence defined as the fifth percentile value of all CO mixing ratios observed within defined altitude intervals, following Kondo et al. (2016). RCO is only calculated when ΔCO exceeded the measurement uncertainty.
2.2.3 Meteorological parameters
The meteorological state parameters pressure, humidity and temperature were recorded at 1 Hz resolution with the basic meteorological sensor suite and data acquisition of Polar 6. The ambient air temperature was measured with a PT100-type sensor mounted to the aircraft fuselage in a Goodrich/Rosemount 102 EK 1BB housing with de-icing facility. Corrections for the de-icing heat and adiabatic temperature increase due to pressurisation of the airflow inside the sensor housing (RAM raise and recovery factor) were applied to the temperature readings (following Stickney et al., 1994). The relative humidity (RH) was measured with a Vaisala humidity sensor HMT333 mounted inside a Rosemount housing Model 102 BX, which is also de-iced and similar in its flow characteristics to the housing of the temperature probe. The saturation vapour pressure and RH are corrected with the actual ambient temperature from corrected PT100 readings. The potential temperature was calculated from ambient temperature and the ambient pressure from a static pressure probe.
A Forward Scattering Spectrometer Probe (FSSP), model 100, by Particle Measuring Systems (PMS Inc., Boulder, CO) was used for the measurement of cloud particles. Data from the probe, which was mounted in a canister on a wing pylon, were analysed in more detail in Leaitch et al. (2016). It contributes to the following analysis as an indicator of visible and invisible clouds by an empirically chosen threshold above instrument noise level to the measured cloud particle concentrations (droplets and ice crystals). Aerosol data have been masked when the aircraft was in clouds.
2.3 Model weather data and transport pathway analysis
The ERA-Interim re-analysis data (Dee et al., 2011) from the European Centre of Medium-Range Weather Forecasts (ECMWF) are analysed at certain pressure levels in the form of classical weather maps in order to understand the meteorological situation in the Arctic during the period of our measurement flights. ECMWF operational data are further used to drive the Lagrangian analysis tool (LAGRANTO: Wernli and Davies, 1997; Sprenger and Wernli, 2015) and its kinematic back-trajectories are analysed to estimate the regions of origin for polluted air encountered during the research flights. The model's input data have a horizontal grid spacing of 0.5∘ with 137 hybrid sigma–pressure levels in the vertical from the surface up to 0.01 hPa. Trajectories were initialised every 10 s from coordinates along the research flight tracks and calculated 10 days back in time. The time series of trajectories along the track of the aircraft were correlated with in situ measurement values, in order to relate individual features in the vertical profiles to an ensemble of trajectories (see Sect. 3.4). Due to the potential influence of wildfires and gas flaring on BC presence in the Arctic region, the spatial distribution of gas flaring sites from the ECLIPSE (Evaluating the Climate and Air Quality Impacts of Short-Lived Pollutants) emission inventory (Stohl et al., 2015; Klimont et al., 2017) and active fires from the MODIS level 2 satellite product (Giglio et al., 2003) were also considered for the interpretation of trajectory pathways.
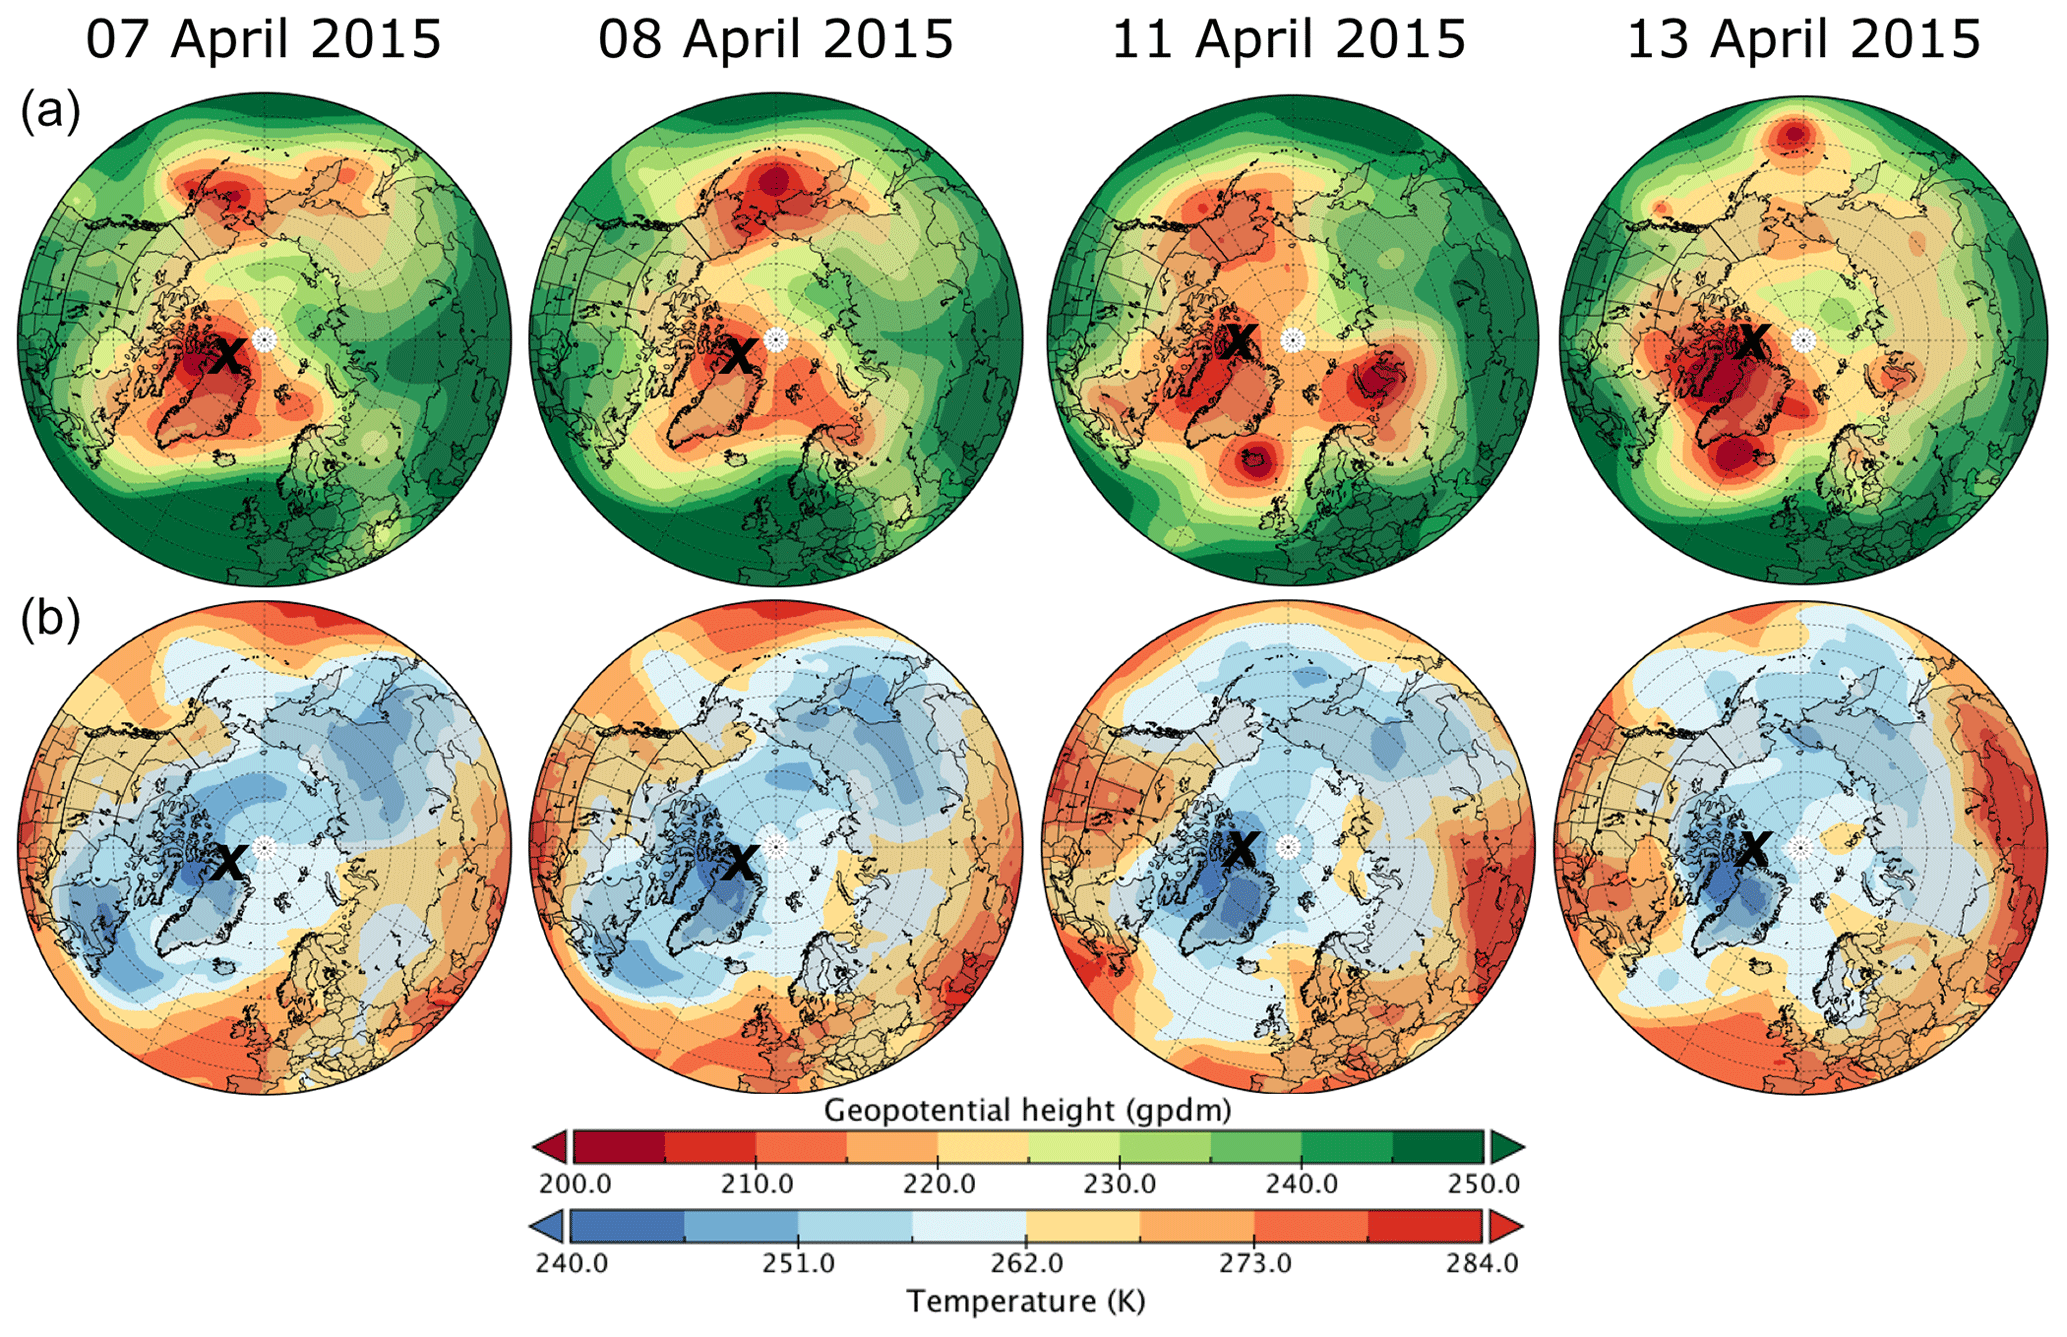
Figure 2Weather charts for the NETCARE spring campaign in April 2015 showing the 750 hPa geopotential height (a) and temperature (b) evolution over the duration of the campaign. The stations Alert or Eureka are marked with a black cross for the maps from 7 to 8 April and 11 to 13 April, respectively.
3.1 Meteorological overview
With the focus on the polar dome and the vertical distribution of rBC therein, subsets of the flights in spring 2015 and summer 2014 were selected for this analysis. The subset selections are based on the variability of the polar dome's position and southern border. The structure and extent of the polar dome in both seasons has been evaluated by Bozem et al. (2019), who defined the polar dome based on trace gas gradients measured during the NETCARE campaigns. They found that the polar dome boundary was, on average over the course of the campaigns, located between 66 and 68.5∘ N in April 2015 and further north, at 73.5∘ N, in July 2014. The upper boundary of the dome was found in a potential temperature range between 283.5 and 287.5 K in spring and between 299 and 303.5 K in summer. An operational estimation of the atmospheric circulation patterns confining the polar dome's horizontal extent in the mid-troposphere can also be made by locating the maximum latitudinal gradients in geopotential height and temperature, as they indicate the position of the jet stream in the upper troposphere and pressure-driven wind systems in the lower troposphere, which surround and stabilise centres of coldest air (Jiao and Flanner, 2016). Maps of these properties (Figs. 2 and 3 for spring and summer, respectively) are shown in this section in order to give an overview of the measurement locations relative to synoptic features of the atmosphere.
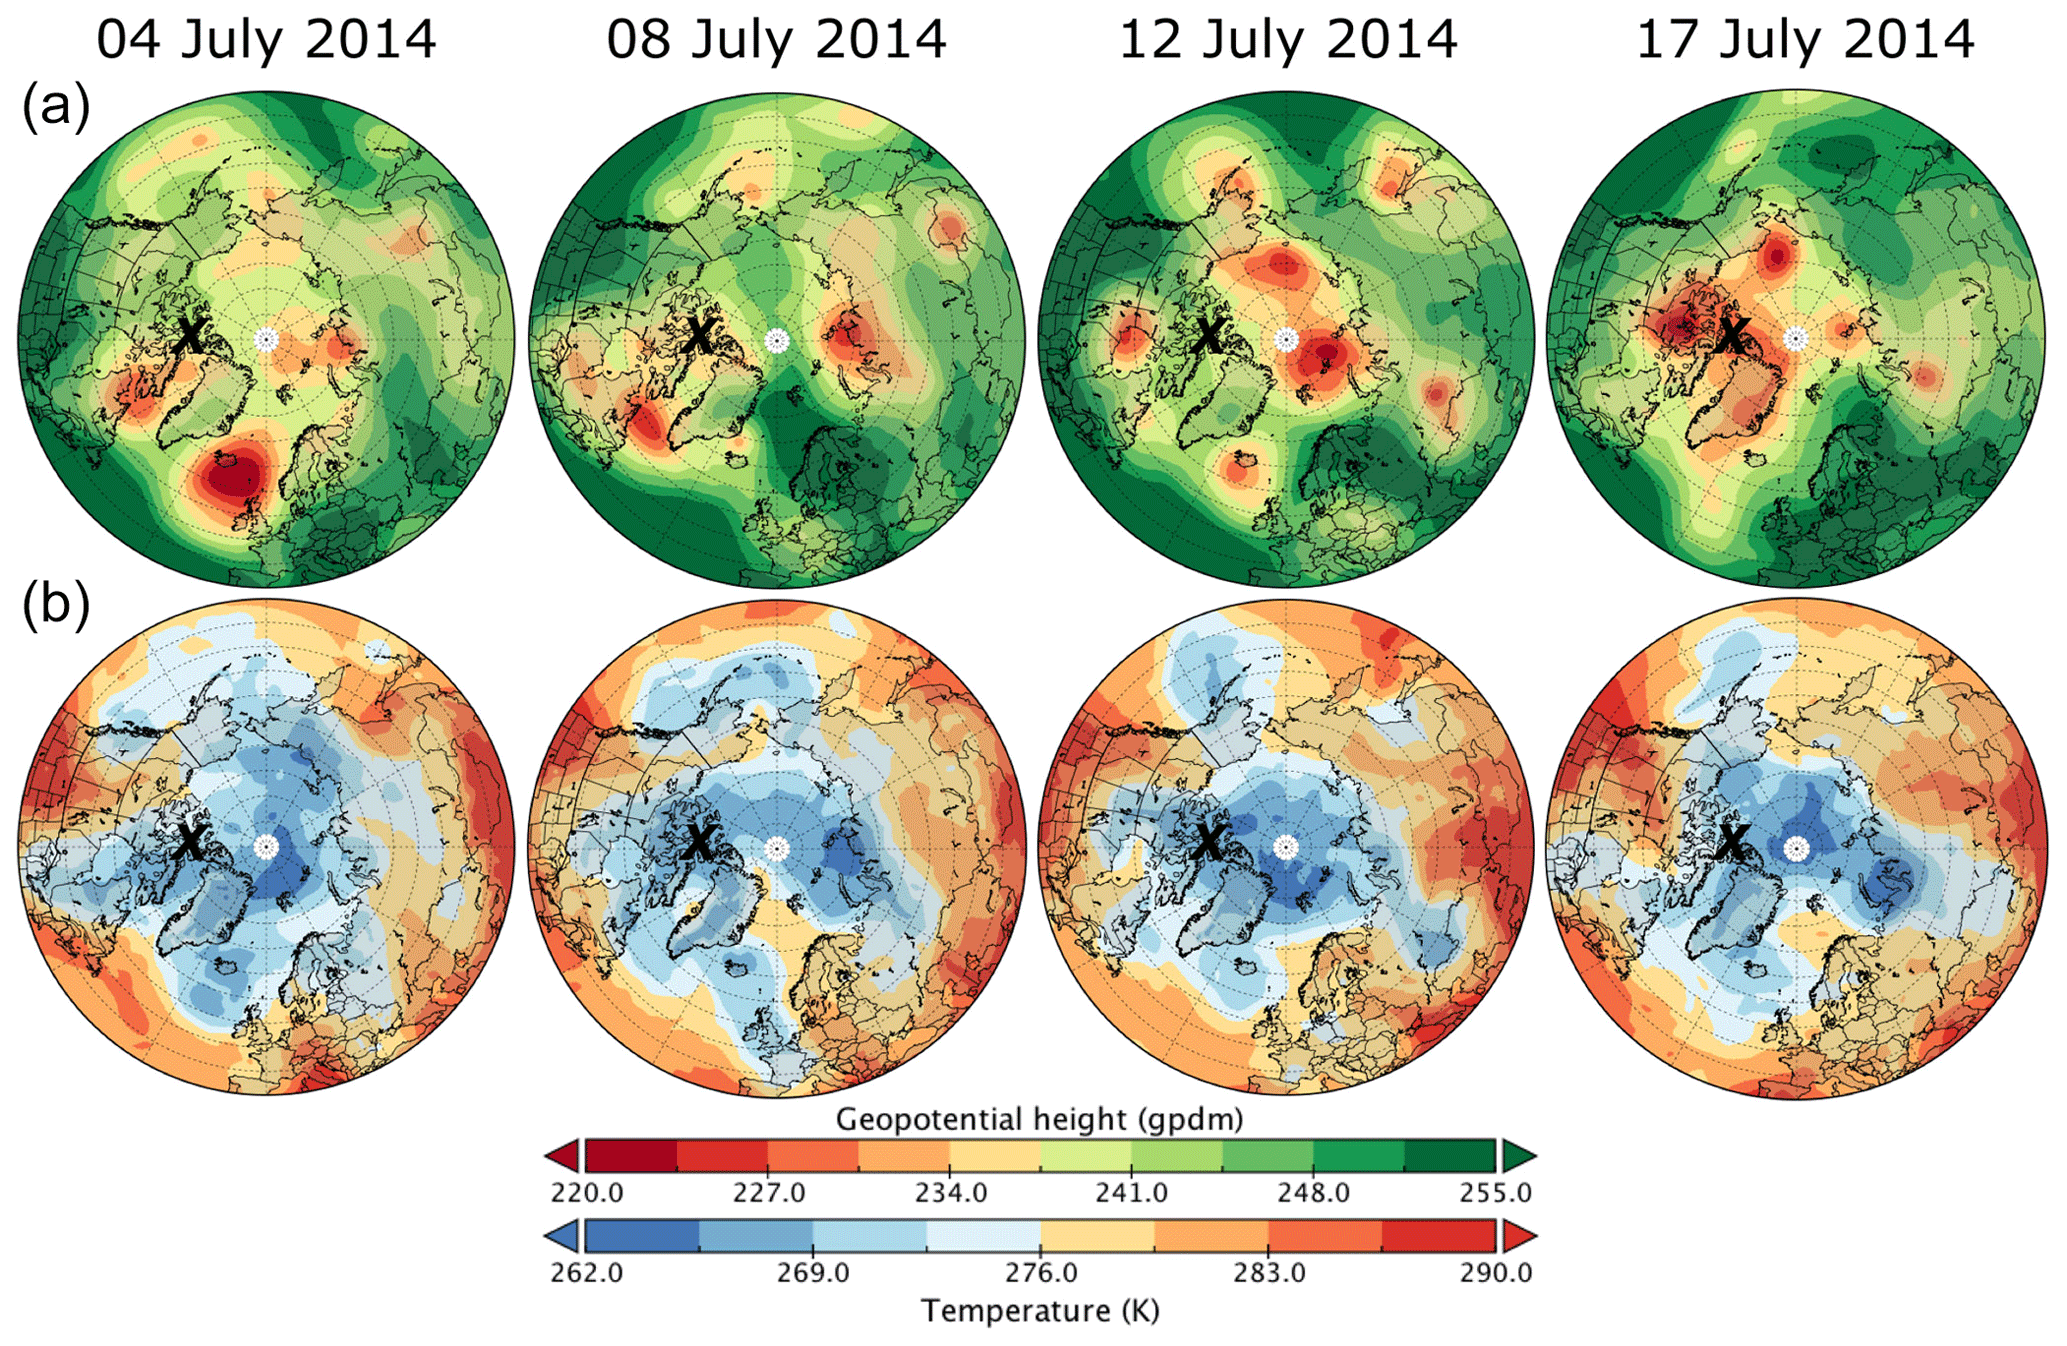
Figure 3Weather charts for the NETCARE summer campaign in July 2014 showing the 750 hPa geopotential height (a) and temperature (b) evolution over the duration of the campaign. Resolute Bay is marked with a black cross.
The meteorological situation in April 2015 was dominated by a pool of very cold air centred over the Canadian Arctic Archipelago that surrounded the stations Alert and Eureka on Ellesmere Island. The cyclonic flow surrounding the cold air stabilised this system by blocking perturbations of low-pressure systems (Fig. 2). The polar vortex was in a weak state and not well defined. Cold air masses in the Russian Arctic were cut off from the dome over the Canadian Arctic Archipelago. Near the beginning of the measurement period, a strong low-pressure system caused an outbreak of cold air over eastern Europe, while warm mid-latitude air moved poleward further west. This synoptic feature affected Alert strongest on 8 April, and its influence was diminishing during the measurements around Eureka 11–13 April (Fig. 2). Conditions during all flights were low wind speeds and clear sky with only a few, mostly thin clouds (Libois et al., 2016).
The NETCARE summer campaign 2014 operated in an area of the high Canadian Arctic that was situated within the summer polar dome. The first half of the campaign (4–12 July) was characterised by a northern influence (Fig. 3). The atmosphere featured a low boundary layer height capped by a distinctive temperature inversion leading to a very stable stratification of the lower troposphere. Prevailing conditions for the research flights were clear skies, only a few or scattered clouds, and low wind speeds (Burkart et al., 2017). These conditions gave the opportunity to characterise the summer polar dome in undisturbed conditions, when 6 flights with a total of 28 vertical profiles were conducted in the study area around Resolute Bay on Lancaster Sound (see map in Fig. 1). Starting from 13 July 2014, the weather pattern changed and Resolute Bay got into the transition zone between polar and mid-latitudinal air, as a consequence of a low-pressure system coming from the north-western Beaufort Sea and passing south of Lancaster Sound. Bad visibility due to fog, clouds and precipitation impeded flights until 17 July, on which day the study area shifted back into the cold air mass and a westerly air movement (Fig. 3).
3.2 Seasonal characteristics of rBC vertical distribution in the polar dome
In this section, the vertical distribution of rBC is examined with a focus on changes from spring to summer. For each ascent or descent of the flights listed in Table 1, data points within fixed pressure–altitude intervals were averaged. These profiles were then successively averaged to mean flight profiles and mean regional profiles, thus avoiding sampling biases due to varying sampling times in each altitude interval. Figure 4 shows that there are substantial differences between the average spring and summer profiles of rBC mass concentration (MrBC), mass mean diameter and rBC-to-TA-number ratio (RnumTA).
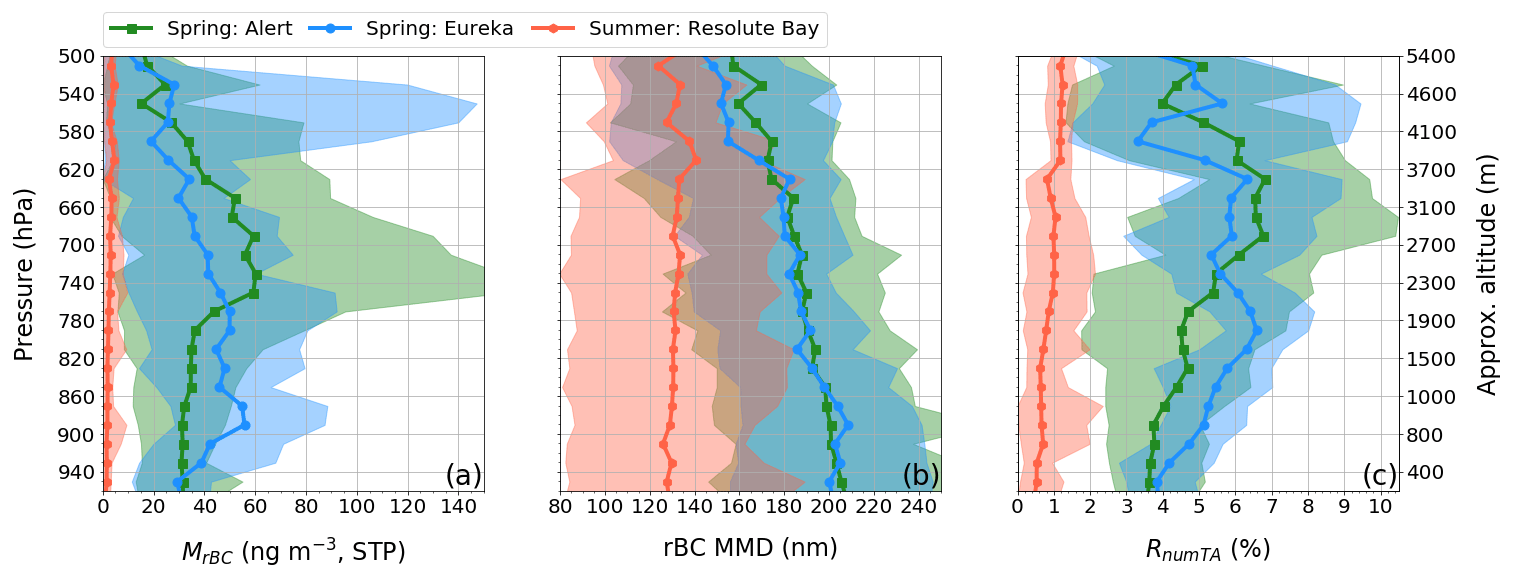
Figure 4Mean regional vertical profiles of (a) rBC mass concentration, (b) mass mean diameter of rBC particles and (c) ratio of rBC to TA particle number. Shaded areas indicate the minimum 25th and maximum 75th percentiles of all individual profiles included in the mean profile. The altitude scale may only be used as a guide as it indicates the mean altitude above sea level of each pressure interval for the spring atmosphere.
The absolute and relative presence of rBC was generally reduced during summer. Ground-based observations at High Arctic sites like Alert show a pronounced seasonal cycle in rBC concentrations (e.g. Leaitch et al., 2013; Stone et al., 2014; Sharma et al., 2017), which is well matched by the difference in mean MrBC of observations in the lower part of the atmosphere (>920 hPa) presented here. During spring, averaged MrBC of 31.5 and 30.1 ng m−3 were present in the Alert and Eureka region, respectively, while summertime observations showed a mean MrBC 1 order of magnitude lower at 1.4 ng m−3. Figure 4a shows that this seasonal difference was present throughout the vertical extent of the polar dome. A difference of 1 order of magnitude in MrBC between the seasons was also found during the ARCTAS spring and summer campaigns in 2008 reported by Matsui et al. (2011). However, their observed MrBC were a factor of 2 higher compared to the NETCARE observations. This might be due to the fact that their observations were from a subarctic region (northern Alaska), where pollution supply and removal not necessarily are in the same balance as within the polar dome. The balance between supply and removal (during transport or within the Arctic) of rBC at high latitudes appears to have a pronounced seasonality.
During spring, mean profiles from the Alert and Eureka regions showed a similar MrBC range; however, vertical trends in MrBC showed certain differences between the two regions. At Eureka, the maxima of the mean profiles occurred between 900 and 800 hPa with averaged MrBC of 55 ng m−3 and an interquartile range (IQR) of 11–120 ng m−3. At a notably higher pressure–altitude of 730 hPa, the mean profile from the Alert region reached up to 69 ng m−3 with an IQR between 4 and 157 ng m−3 (Fig. 4a). Furthermore, high variability in MrBC occurred above 4000 m in the Eureka region. The fact that maxima occur at different, i.e. shifted, pressure–altitudes may be due to the fact that profiles were flown at different positions relative to the three-dimensional structure of the dome, thus finding the same isentropic surfaces at different altitudes. Given that both stations were within the same synoptic system (Sect. 3.1), transport patterns affecting both regions are expected to be similar. These hypotheses are investigated in Sect. 3.3 and 3.4. The overall range of rBC concentrations is comparable with previous spring observations reported for the European Arctic (Liu et al., 2015) and to measurements from the mixed boundary layer over Europe (McMeeking et al., 2010).
The spring profiles of MMD show a nearly steady decrease with altitude from 206 to 162 nm for Alert and 202 to 140 nm for Eureka (Fig. 4b). In contrast, the relative contribution of rBC particles to the total aerosol particle number, RnumTA, increased with altitude from around 4 % near the surface to 6 %–7 % on average aloft. RnumTA is particularly variable within altitudes with increased MrBC (Fig. 4c). In general, the rBC mass appeared to be distributed among higher numbers of smaller-sized rBC particles with increasing altitude. Maxima in RnumTA were shifted upwards relative to the nearest maximum in MrBC. In contrast to the spring, summer-time MMD show a slight increase with altitude from the surface (129 nm) to about 600 hPa (140 nm; Fig. 4b). As pointed out in Bond and Bergstrom (2006), the mass absorption cross section of BC particles depends on, amongst other factors, the particles' diameter. As a consequence, a concentration of rBC mass in small particles could potentially contribute to an enhancement of the absorption coefficient of the total aerosol. However, the summer polar dome showed low values of MrBC (average of 2 ng m−3 with IQR 0–12 ng m−3 throughout the column) and low RnumTA (average of 0.75 %), which rendered rBC a minor contributor to the total aerosol light extinction. A more detailed description of seasonal and vertical variability of rBC particle diameters will be provided in Sect. 3.5.
3.3 Vertical distribution of rBC relative to potential temperature
In order to fully understand the vertical variability of the aerosol distribution, it is important to consider the vertical structure of the polar dome with its core of cold, dense air at ground level and successive dome-shaped layers of warmer air above. Stohl (2006) showed that the transport of air parcels along isentropic surfaces supplies pollutants from lower latitudes to certain levels of the polar dome. The altitude of these surfaces depends on the depth of colder air beneath and varies with the spatial extent of the polar dome induced by synoptic conditions and orographic features. Sampling in different positions relative to the structure of the polar dome has induced variability to the profiles averaged over pressure–altitude intervals. Levels affected by different transport patterns might be unveiled by adopting potential temperature as a vertical coordinate, which is monotonically increasing in the stable polar atmosphere.
The measurement periods in both seasons each covered an evolution cycle of a low-pressure system, causing a disturbance of the polar dome's structure (see Sect. 3.1). Those disturbances have altered existing transport pathways and facilitated new ones, thereby affecting the vertical distribution of rBC. This variability in the vertical profiles is evaluated in Sect. 3.3.1 for spring and in Sect. 3.3.2 for summer.
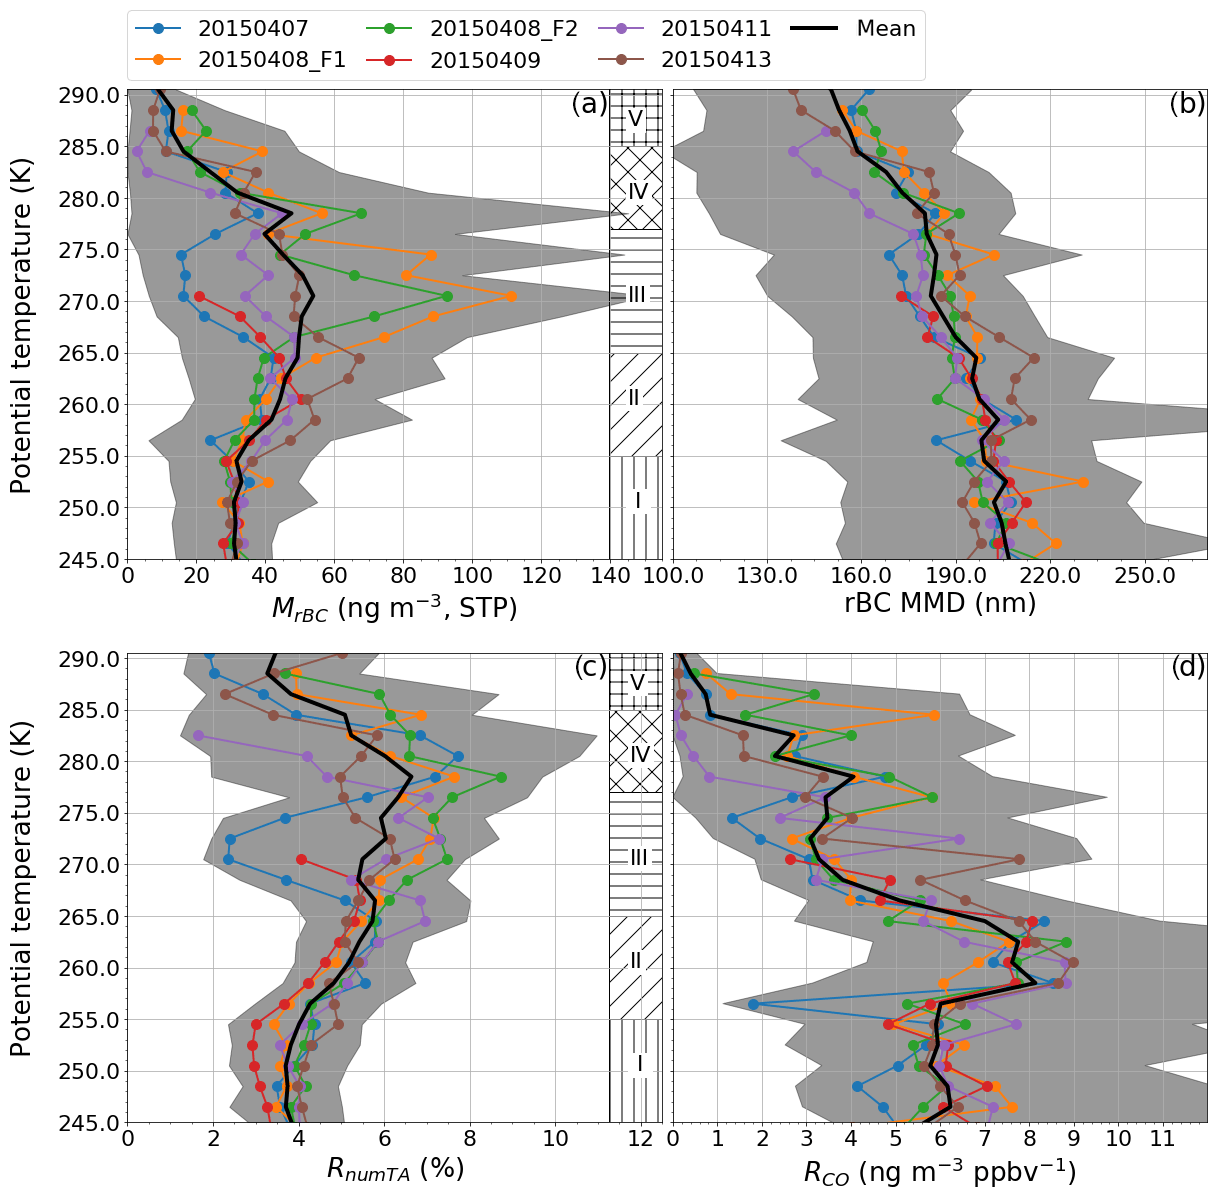
Figure 5Flight profiles averaged over intervals of potential temperature from the spring polar dome of (a) MrBC, (b) MMD, (c) RnumTA and (d) RCO. The grey shading around the mean over all profiles (black line) indicates the minimum 25th and maximum 75th percentiles of the flight profiles included in the mean. Five levels with different variability patterns as discussed in the text are marked with hatch patterns.
3.3.1 Vertical distribution of rBC in the spring polar dome
The spring mean flight profiles from Alert and Eureka averaged over intervals of potential temperature are shown in Fig. 5. Five different levels can be identified according to vertical trends and variability patterns in MrBC, MMD and RnumTA as well as RCO (the ratio of enhancement over background level of rBC mass relative to CO mixing ratio, as defined in Sect. 2.2). The following analysis describes and links patterns in the individual profiles of these properties, aiming to identify possible implications for mechanisms affecting the aerosol, before source regions and transport patterns for these levels are investigated by means of a kinematic back-trajectory analysis in Sect. 3.4. The vertical boundaries of the five levels are confined within strong temperature gradients, which can be found in all profiles, but with slight variation in strength and potential temperature range. However, the vertical location of the gradients varies in relation to pressure–altitude by up to 1000 m between individual profiles (Fig. S1a).
The profiles in Fig. 5 show a homogeneous distribution of rBC with a mean MrBC of 32 ng m−3 (IQR: 13–48 ng m−3) that was present in a temperature gradient capped surface layer (level I), which was the coldest air encountered with temperatures of 255 down to 245 K. The observed MrBC across the lowest flight sections matches well with the mean ground-based rBC observations performed in Alert for spring seasons of the years 2011–2013 with 30±26 ng m−3 (Sharma et al., 2017). Moreover, level I showed the highest average MMD of 204 nm (IQR: 153–250 nm). Such large mean rBC particle diameters were already observed at the surface in the European Arctic in spring (Raatikainen et al., 2015; Zanatta et al., 2018) and are distinctly different from freshly emitted rBC (MMD of ∼100 nm) in urban areas (Laborde et al., 2013).
Although rBC represented a minor component of the total aerosol in the respective size range by number, with an averaged RnumTA of 3.8 % that was low with respect to higher levels, rBC mass was comparably high relative to co-emitted CO with a mean RCO of 5.7 ng m−3 ppbv−1 (IQR: 2.7–10.5 ng m−3 ppbv−1). This ratio is difficult to compare to observations from the literature, because, although ranges of values have been attributed to specific combustion source types, all air masses sampled for these studies were subject to different ageing timescales. This led to significant variations in reported RCO (Liu et al., 2015). Besides particle removal altering RCO, air pollution from different sources may become mixed in the source region or within the polar dome, thus blending the ratio of rBC to CO. RCO around 4–9 ng m−3 ppbv−1 were observed by Stohl et al. (2013) at Mt. Zeppelin on Svalbard, in the European Arctic, in an air mass influenced by transport from northern Russian gas flaring sites. A similar range was observed by Liu et al. (2015), who profiled between northern Norway and Svalbard in spring during transport influence from Europe and Asia. Moreover, different combustion processes lead to a wide range of RCO values: While fossil fuel combustion induces RCO values of approximately 6±1.0 ng m−3 ppbv−1 (Spackman et al., 2008; Kondo et al., 2016), Mikhailov et al. (2017) observed RCO values of 1.2–5.0 and 10–20 ng m−3 ppbv−1 in conjunction with boreal forest and grassland fires, respectively. Due to this large spread of values, it is neither possible to identify rBC depletion by wet removal, nor to discriminate source types based on absolute values for remote regions like the Arctic. However, deviations of RCO from the mean of each atmospheric level might help in identifying the dominant factor controlling the rBC mass concentration and its particle size distribution.
Concentrations and mixing ratios of rBC increased from the surface to level II, which was in the potential temperature range of about 255–265 K. The mean MrBC was 44 ng m−3 (IQR: 15–79 ng m−3) and mean MMD was 198 nm (IQR: 143–251 nm). The Eureka profiles (11 and 13 April) show higher MrBC at this level than observed around Alert. The highest overall RCO occurred within this level with a mean of 7.4 ng m−3 ppbv−1 (IQR: 3.8–12.0 ng m−3 ppbv−1). Profiles from the Eureka region, especially those of 13 April, showed above-average MrBC together with maxima in RCO (8–9 ng m−3 ppbv−1) and MMD (215 nm), which suggests that either removal along the transport pathway was lower or pollution from a different mix of sources was entrained into the air mass, or a combination of both took place. rBC mass size distributions, and therefore also MMDs, are known to exhibit systematic differences between biomass burning and fossil fuel combustion (Kondo et al., 2011b; Sahu et al., 2012). While the measured RCO in this level were comparable to the above-mentioned literature values from fossil-fuel-combustion-influenced air masses, the range of observed MMD is more similar to biomass burning plumes. This suggests that a complex mixture of rBC from different sources as well as less efficient wet removal occurred during transport, since wet removal will decrease the MMD (e.g. Browse et al., 2012; Taylor et al., 2014; Kondo et al., 2016).
The highest variability in rBC abundance and its properties was present between 265 and 277 K (level III). At the beginning of the observation period (7 April), low mean MrBC of 17 ng m−3 (IQR: 4–22 ng m−3) was measured, while the two flights on 8 April encountered significantly higher concentrations up to 111 ng m−3 (IQR: 65–151 ng m−3). The overall average concentration of rBC in level III was 49 ng m−3. The enhancement of rBC mass concentration, together with a decrease in the mean RCO and MMD potentially suggests different transport or removal regimes compared to the lower atmospheric levels. The ratios RnumTA and RCO as well as MMD were significantly below average on 7 April, while supply of polluted air set in on 8 April and lasted over the course of the observation period with variable intensity. The Arctic-haze-like polluted layers with highest MrBC were not connected to high RCO. Compared to the lower polar dome, only half as much rBC as CO is transmitted with the pollution plumes in level III, leading to a mean RCO of 3.9 ng m−3 ppbv−1 (1.5–8.0 ng m−3 ppbv−1).
The potential temperature range 277–285 K (level IV) was in the transition zone to the air mass above the dome (Bozem et al., 2019). Within a temperature gradient zone marking the upper boundary of the dome, all profiles peak before sharply decreasing in the air mass above. This transition is also apparent in a gradient of trace gas concentrations (Bozem et al., 2019) and occurs at slightly varying temperature. The maximum MrBC on 8 April was comparable to that in the level below, but high RCO around 6 ng m−3 ppbv−1 suggest a different, more efficient transport to this level. MrBC on the higher end of the IQR in level IV (145 ng m−3) was encountered by one out of three profile flights on 11 April. The other two profiles included in the mean of that day encountered air depleted in rBC, where low MMD as well as RCO suggest substantial removal of rBC from the air mass by precipitation. However, rBC reached its maximum contribution to the TA by number with mean RnumTA of 6.2 % in level IV.
Bozem et al. (2019) defined the region of potential temperatures higher than about 287 K (level V) to be in the transition zone to the troposphere above the polar dome with a strong negative gradient in CO concentrations and stronger connection of transport trajectories to mid-latitudes. At the highest altitudes of the profiling flights, low MrBC (average of 13 ng m−3 with IQR: 0–34 ng m−3) and a decrease in MMD (average of 155 nm with IQR: 106–191 nm) combined with a low RCO (0.7 ng m−3 ppbv−1) suggest that polluted air was transported to this level, but lost much of the BC by wet scavenging induced during lifting of the air parcels.
Different transport pathways between the described levels as well as the temporal variability of transport to each layer are investigated in Sect. 3.4.1 by means of an air parcel back-trajectory analysis.
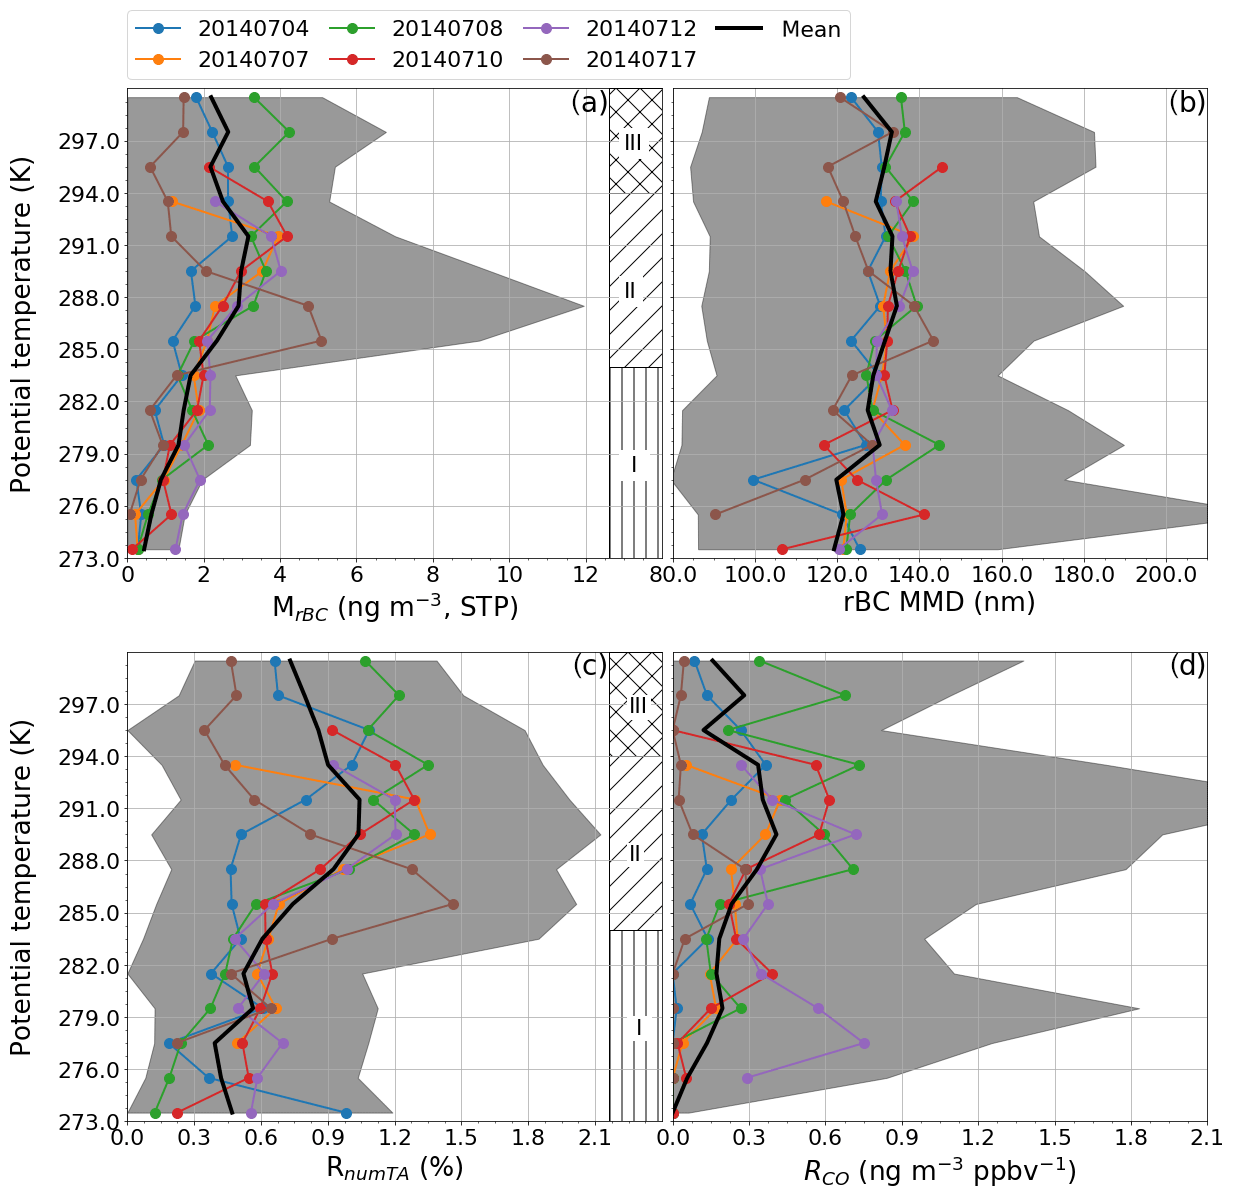
Figure 6Flight profiles averaged over intervals of potential temperature from the summer polar dome of (a) MrBC, (b) MMD, (c) RnumTA and (d) RCO. The grey shading around the mean over all profiles (black line) indicates the minimum 25th and maximum 75th percentiles of the flight profiles included in the mean. Three levels with different variability patterns, as discussed in the text, are marked with hatch patterns.
3.3.2 Vertical distribution of rBC in the summer polar dome
The variability of aerosol properties was also investigated for summer as a function of the potential temperature within the polar dome over the area of Resolute Bay (Fig. 6). As already introduced in Sect. 3.2, the general concentration of rBC particles was almost 1 order of magnitude lower and the variability in the distributions had a lower absolute magnitude than the spring observations. Two strong temperature gradients (Fig. S1b) structured the atmosphere below 5 km into three levels in which similar vertical tendencies of rBC concentration and mixing ratios were observed.
Close to the surface, within air at potential temperatures between 273 and 284 K (level I), the 75th percentile MrBC did not exceed 3.3 ng m−3. Concentrations in the same order of magnitude (1 ng m−3) were already observed over the Arctic ocean (Taketani et al., 2016). rBC represented a minor component of the TA throughout the vertical column; however, the lowest values were recorded at low altitude, where mean RnumTA was 0.5 %. The RCO well below 1 ng m−3 ppbv−1 suggested, combined with the low particle diameter (average MMD of 125 nm), that particles in the summer polar dome were subject to strong wet removal. The MMD values show a larger variance amongst the different profiles due to a scarcity of particles in the statistics.
A weakly stable to neutral atmospheric level was present above the stable near-surface level and up to a strong temperature gradient aloft (level II). MrBC was relatively constant within the lower part of level II, but increased within the temperature gradient zone in its upper part. This zone lay around 288–294 K (Fig. S1b) in the period before the weather change (4–12 July) and lower, around 284–290 K, on 17 July after the perturbation of the polar dome by a low pressure system (see Sect. 3). The altitude of the gradient zone was changing amongst individual profiles flown in different regions and was likely affected by orography and the variable sea-ice cover (see map in Fig. 1). High humidity was frequently observed in the neutral or weakly stable zone below the temperature gradient. The highest MrBC values up to 12 ng m−3 were encountered around 286 K on 17 July, while in the earlier measurement period, the mean profiles of MrBC peak at only around 4 ng m−3, which is, however, still a factor-of-2 increase over the concentrations within the less stable lower part of this level. Also the relative presence of rBC showed a significant difference between the two parts. RnumTA reached a mean of 1.3 % (1.7 %) within the concentration peaks in the first (second) period, while the background in the lower part was around 0.6 %. Similarly, RCO was 0.2 ng m−3 ppbv−1 in the background and mean profiles reached 0.6 ng m−3 ppbv−1 within concentration peaks in the first period. Although the highest rBC concentrations were encountered on 17 July, RCO of 0.0–0.3 ng m−3 ppbv−1 indicates that rBC aerosol was strongly depleted relative to co-emitted CO, which featured elevated concentrations throughout the column compared to the first weather period of stable northern influence (Fig. S1b).
The highest investigated level (III) of the atmosphere was characterised by potential temperatures above 294 K, and most probably represented a strong temperature gradient separating the polar dome from free tropospheric conditions. In fact, Bozem et al. (2019) identified the upper boundary of the summer polar dome in the potential temperature range of 299–303.5 K. Three flights reached this potential temperature level at higher altitudes and show relatively large variability of rBC absolute and relative concentrations, which are within the range of background and elevated concentrations found in the lower levels. Generally, MrBC was higher than at the surface with an IQR of 0.0–6.7 ng m−3.
Air parcel back-trajectories were analysed for Sect. 3.4.2 below to identify transport patterns and source areas of the summer polar dome for (1) the near-surface layer, (2) the mixed atmosphere and strong temperature gradient zone with increased MrBC, and (3) the outer polar dome up to its boundary.
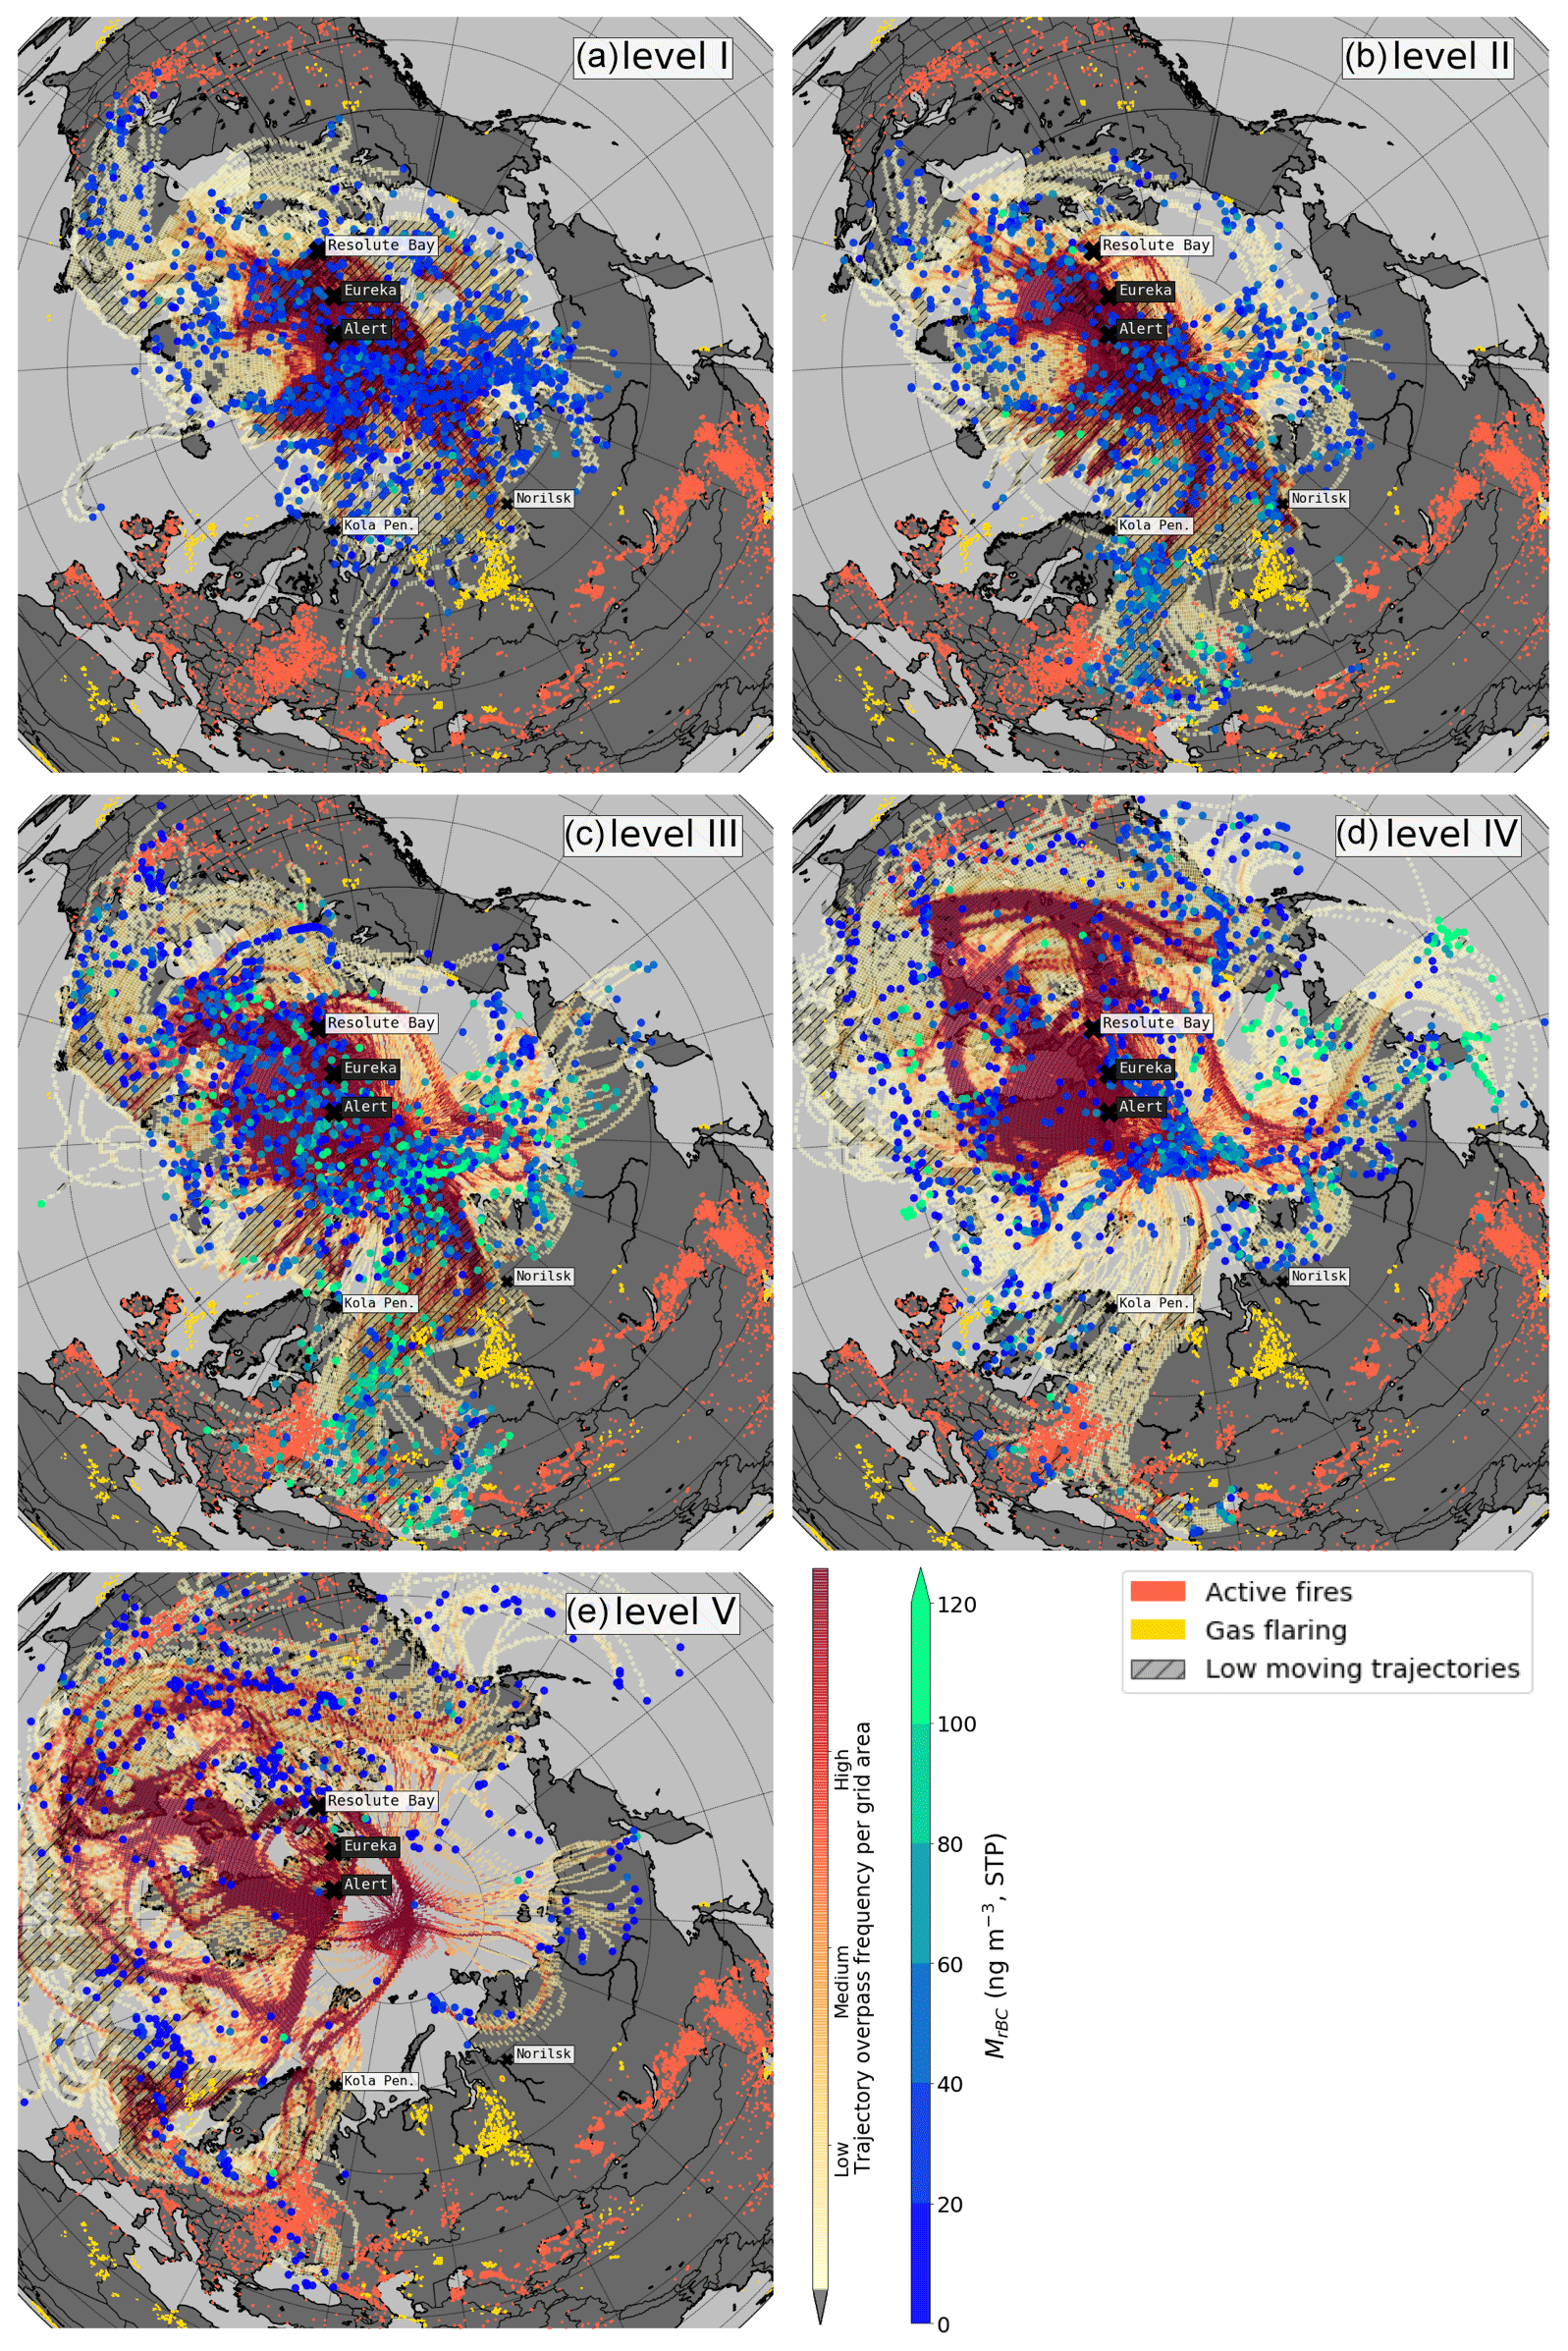
Figure 7Heat maps of normalised back-trajectory overpass frequencies in each grid cell for the flights of the spring campaign initialised from five potential temperature levels of the polar dome. Hatching shows areas in which trajectories were at atmospheric pressure >920 hPa. Dots at the end point of every trajectory, 10 days back in time, are colour coded with MrBC measured during the flights. The aircraft operated near the stations Alert and Eureka marked with black labels. The map further shows MODIS active fire detections for the period 10 days prior to the first flight until the day of the last flight (orange dots) and known gas flaring sites (yellow dots) from the ECLIPSE emission inventory.
3.4 Transport patterns and source areas
Kinematic back-trajectories were calculated in order to discern different contributions of potential source regions to the changing characteristics of aerosol properties observed within the potential temperature levels identified above in Sect. 3.3. For their analysis, gridded overpass frequencies were calculated based on the hourly positions of trajectories initiated every 10 s along the flight paths, weighted with the grid area and normalised by the total number of back-trajectories for each case. Figures 7 and 8 in the following subsections show the overpass frequencies displayed as heat map overlays. A hatching highlights grids where trajectories travelled at atmospheric pressures >920 hPa, which is equal to less than about 0.5 km. Climatological boundary layer heights over Europe are typically <1 km during daytime (Seidel et al., 2012); thus pollution uptake from surface sources may be possible in a well-mixed atmosphere in the hatched areas in contrast to trajectories moving in the upper atmosphere or being already lifted well above the boundary layer due to vertical motion in synoptic-scale systems. Trajectory end points with the location where the air parcels were 10 days prior to release are marked by dots colour coded with the rBC concentrations measured during the flights at the trajectory initialisation position.
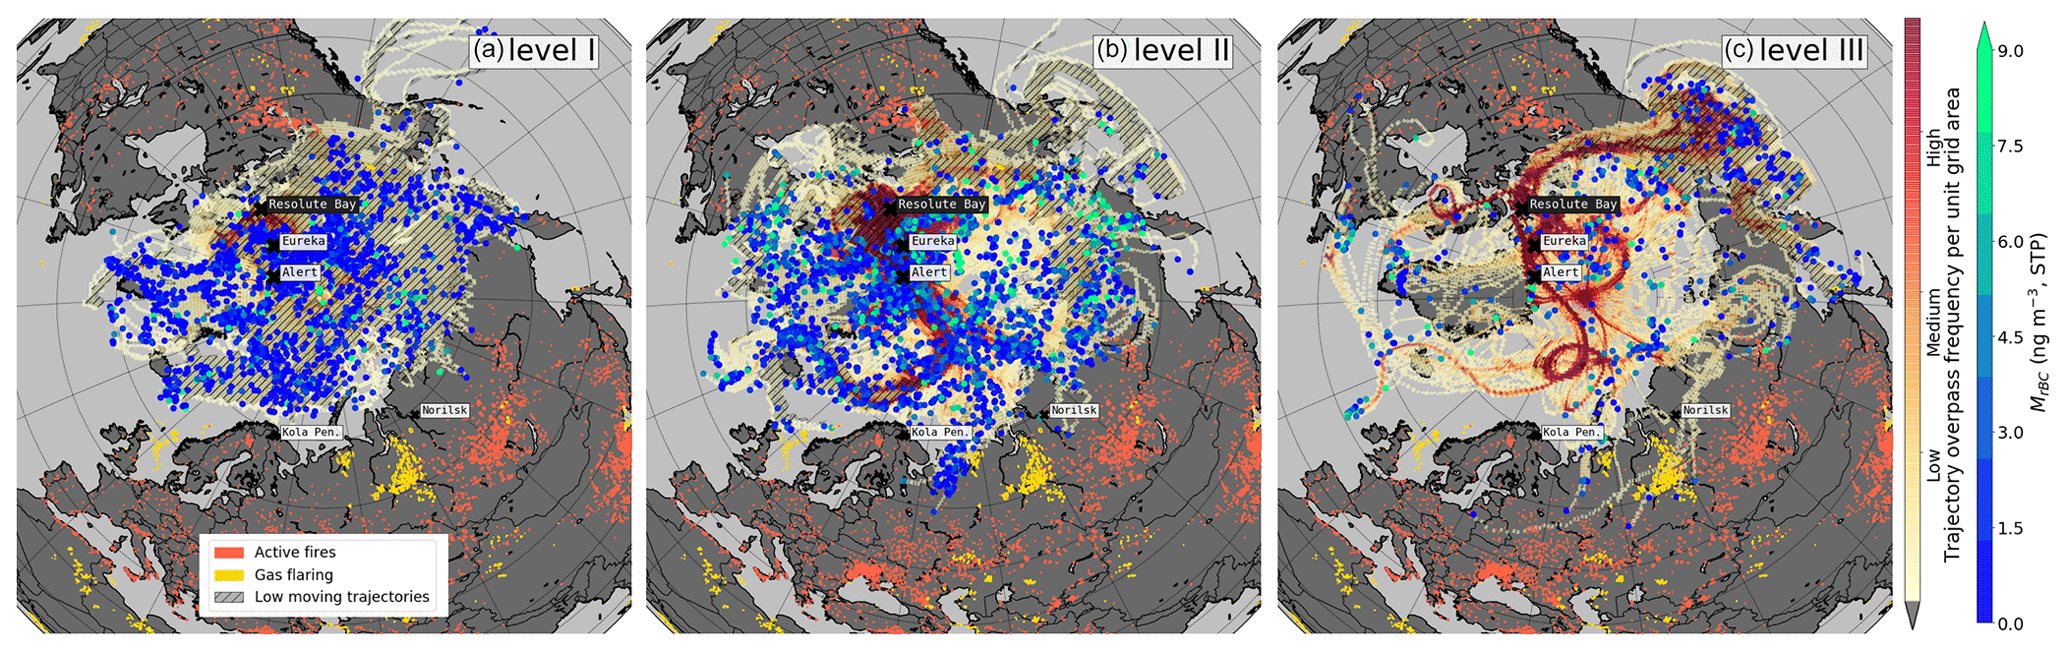
Figure 8Heat maps of normalised back-trajectory overpass frequencies in each grid cell for the flights of the summer campaign initialised from three potential temperature levels of the polar dome. Hatching shows areas in which trajectories were at atmospheric pressure >920 hPa. Dots at the end point of every trajectory, 10 days back in time, are colour coded with MrBC measured during the flights. The aircraft operated near Resolute Bay, which is marked with a black label. The map further shows MODIS active fire detections for the period 10 days prior to the first flight until the day of the last flight (orange dots) and known gas flaring sites (yellow dots) from the ECLIPSE emission inventory.
3.4.1 rBC source areas for the spring polar dome
The aerosol over Alert and Eureka in the period 7–13 April was influenced by air transport from eastern Europe, central Asia and Siberia as well as North America (Fig. 7). In those regions lobes of cold polar air reached south due to cyclonic perturbations of the polar front (Fig. 2).
Confined by the cyclonic winds around the polar dome and due to the lower wind speed within it (Sect. 3.1), the back-trajectories initiated in the lowest level (potential temperature 245–255 K) showed a long residence time within the Arctic region at low altitude (Fig. 7a). The majority of trajectories was not leaving the cold polar air mass at all (compare Fig. 2). Despite that, the limited horizontal extent of the polar dome (Bozem et al., 2019) largely prevented the intrusion of combustion-generated aerosol from lower latitudes, and background rBC mass concentrations of around 30 ng m−3 were maintained over the whole measurement period. Higher MrBC values (>60 ng m−3) were measured when trajectory paths suggest that pollution supply by low-level transport was possible from northern Siberia. This region is associated with intense natural resource exploitation activities. Potentially accessible for the trajectories to pick up pollutants were the regions of the nickel mines and smelters in Norilsk (Siberia) and on Kola Peninsula (Fig. 7), which are known to be high-emitting sources of gases and particulates together with their associated marine traffic (Arctic Council, 2009; Stohl et al., 2013; Law et al., 2017; Roiger et al., 2015, and references therein). Also potentially accessible for poleward transport was the oil-rich region of Khanty-Mansy south-west of Norilsk where gas flaring emits BC (Evans et al., 2017; Winiger et al., 2017), as indicated by the ECLIPSE BC emission inventory data in Fig. 7. On the other hand, air masses originating over North America were associated with low rBC mass concentration.
Compared to the surface, the mass concentration of rBC significantly increased in the two levels between 255–265 K (II) and 265–277 K (III). In fact, the highest MrBC values observed in these layers were associated with low-level transport pathways originating at mid-latitudes over western Russia and central Asia (Fig. 7b, c). Moving from level II to III, the cyclonic perturbations at the polar front favoured additional entrainment of rBC from over the Russian far east. Although transport from North America took place into the western Arctic, it did not cause any substantial increase in the observed MrBC. The frontal and orographic lifting, to which air parcels originating from North America are often subjected on the way into the Arctic (e.g. Stohl, 2006; Quinn et al., 2011), was likely accompanied by precipitation events and subsequent aerosol removal (Pozzoli et al., 2017), thus potentially decreasing the overall impact of North American emissions to Arctic rBC concentration, as observed here.
The transport patterns to level IV between 277 and 285 K showed a high degree of complexity and some patterns visible in Fig. 7d occurred only occasionally in association with different measurement flights in the regions of Alert and Eureka. For instance, transport possibly from Scandinavian cities, the corridor over eastern Europe to central Asia and gas flaring sites in the North Sea contributed to elevated MrBC and relatively high RCO only for observations around Alert (Figs. 7d and S2a, b). The pathway over the Russian far east that already contributed to elevated MrBC in level III became a more prominent transport pattern in level IV. It is evident, however, that the origin of the air parcels is not fully traceable with the 10-day back-trajectories, yet the air parcels supposedly overpassed wildfires east of Lake Baikal (southern Russia–northern China). Despite peak MrBC reaching over 100 ng m−3, RCO on this pathway was comparably low (Fig. S2d). The polar dome over Eureka in level IV was not directly affected by the outbreak of polluted air from the corridor over eastern Europe that also affected the lower levels, but the air was transported over and across the central polar dome and then subsided over northern Canada (Figs. 7d and S2c). From there it was again redirected northward in a cyclone to reach Eureka after being lifted over central Greenland. Air pollution from Alaska and western Canada may have also been entrained. On this long transport pathway, medium MrBC was associated with low RCO (Fig. 5).
The air sampled at potential temperatures >285 K in level V above the polar dome (Bozem et al., 2019) was characterised by the lowest rBC concentrations of the spring campaign and featured clearly different transport patterns compared to the lower atmospheric levels (Fig. 7e). Generally, the trajectories ending at Alert and Eureka experienced reduced or no contact with the surface north of 60∘ N, limiting the entrainment from many sources responsible for rBC enhancement in the lower levels. Although trajectories spread out over the north-eastern United States and Canada as well as the British Islands and gas flaring sites in the North Sea, only low MrBC was carried into level V. This might be due to uplift of the air parcels, and subsequent wet removal.
Interpreting the back-trajectories and vertical profiles together makes it apparent that the regions contributing most to the enhanced presence of combustion-generated particles were Russia and central Asia, while the contribution of North America was mostly negligible or significantly smaller than from the Eurasian side at all levels. This conclusion agrees with the findings presented by Stohl (2006) and Huang et al. (2010).
The MMD and RCO also showed interesting changes in the different levels. In level I, the highest MMD and RCO might suggest entrainment of pollution from the marginal Arctic which underwent no or inefficient wet scavenging. In fact, high RCO values have previously been associated with low precipitation during transport to the Arctic (Matsui et al., 2011). On the other hand, longer atmospheric processing undergone by rBC sampled in the higher levels of the polar dome might favour wet removal of larger rBC particles due to increased hygroscopicity (Moteki et al., 2012), and thus potentially explain the decrease in MMD from the surface to level V.
The vertical profiles in Fig. 5 showed a gradual decrease in RCO with altitude, excluding a sharp enhancement in level II. Assuming RCO as a useful indicator of wet removal, we could argue that transport patterns involving the lifting of air might have caused preferential removal of aerosol via wet scavenging. Such an approach was already used in the past, combined with accumulated precipitation along trajectories to investigate the impact of wet scavenging on BC concentration in the Arctic (Matsui et al., 2011). Nevertheless, RCO might also be affected by emission type. The enhancement of RCO in level II might be predominantly caused by entrainment of pollution emitted by different sources. In fact, the frontal-passage-induced low-level transport in the corridor from western Siberia down to central Asia struck areas affected by both biomass burning and gas flaring emissions. The variability of RCO in level IV was similar, with higher values resulting from more direct transport towards the region over Alert. Longer and more complex transport towards level IV over Eureka resulted in similar MrBC but lower RCO. However, RCO did not show any clear correlation with the occurrence of liquid and ice cloud water along the trajectories (Fig. S3). Due to the complexity of the transport pathways and potentially the entrainment of pollution from different source types, RCO alone proved to be insufficient in assessing the impact of atmospheric processing on rBC variability in the polar dome in spring. The parallel interpretation of RCO and accumulated precipitation along the trajectories might be a better tool to investigate the impact of wet removal on rBC presence in the Arctic, as already proposed by Matsui et al. (2011). However, a complete investigation on the efficiency of BC removal mechanisms is beyond the scope of the present work.
3.4.2 rBC source areas for the summer polar dome
The aerosol features observed in summer and described in Sect. 3.3.2 allowed the identification of three different atmospheric levels. Potential relationships between rBC mass concentrations, mixing ratios and particle properties in those levels with different transport pathways into the polar dome were investigated with back-trajectories as in the previous section. In summer, the polar dome retreats northward and confines air movement to the Arctic Ocean and the northern shores of the bordering continents (Fig. 8), leading to limited entrainment of pollution from lower latitudes (Bozem et al., 2019).
Most of the back-trajectories initiated in level I (capped by an inversion at 284 K) stayed for at least 10 days in the close vicinity of Lancaster Sound (map in Fig. 1) and a few were spread out over the Arctic Ocean (Fig. 8a). As a consequence, the reduced extent of transport did not allow substantial entrainment of pollution from any continent, and the trajectory origins that could suggest a contribution of local sources to MrBC are scattered. It is important to note that local Arctic sources of BC are not well quantified (Law and Stohl, 2007); however, present-day shipping and resource extraction activities already impact the air quality and radiative balance in the Arctic (Ødemark et al., 2012; Marelle et al., 2015). In the context of a warming Arctic and reduced sea-ice extent, shipping emissions will induce changes in atmospheric composition at the surface and on local scale in the Canadian Arctic. Nevertheless, the magnitude of such changes is variable and strongly dependent on future economic developments (Corbett et al., 2010; Aliabadi et al., 2016; Gong et al., 2018).
More Arctic-wide air exchange was possible in level II (potential temperature between 284 and 294 K; Fig. 8b). For example, the low-pressure system traversing eastward south of Resolute Bay after 13 July (Fig. 3) enabled direct transport from the Alaskan North Slope oil and gas fields around Prudhoe Bay and likely caused enhanced MrBC observed on 17 July. Additional high MrBC values were associated with transport from the Russian far east and north-western Canada, where the presumed source of rBC could be biomass burning events.
Level III (potential temperatures >294 and up to 303 K at maximum altitude) was located within a strong temperature gradient at the outer boundary of the dome (Bozem et al., 2019). It featured several long-range transport pathways that were different from the lower levels. Air was carried from latitudes as far south as 50∘ N towards Resolute Bay, while the marginal Arctic was less frequently accessed by trajectories (Fig. 8c). A large fraction of the air parcels made contact with near-surface air over Alaska and the Bering Sea.
It is established that the minimum BC mass concentration as observed in ground-based measurements appears in summer in both the European (Eleftheriadis et al., 2009) and Canadian Arctic (Sharma et al., 2004). Our data show that rBC was still brought to the polar dome over the High Canadian Arctic by transport from various regions within the cold polar air mass north of 65∘ N. The comparably low RCO ratios for the majority of maxima in MrBC observed in the upper polar dome (Fig. 6) may suggest that most combustion-generated aerosol was scavenged from the air masses during transport. Other studies showed that efficient wet removal in the summer reduces the presence of aerosol particles in the Aitken and accumulation modes (Croft et al., 2016) and so also BC (Shen et al., 2017). As already discussed in Sect. 3.4.1, changes in RCO alone are a limited indicator for the impact of wet removal on rBC imported into the Arctic in certain transport pathways. Due to the overall low RCO in the air of the summertime polar dome, back-trajectories did not show any clear spatial pattern in RCO of entrained air or a correlation with cloud encounters (Fig. S4). Nevertheless, wet removal might be the dominant factor leading to the generally low RCO<0.5 ng m−3 ppbv−1 that was observed.
3.5 Vertically changing rBC size distribution
As already discussed in Sect. 3.2, a consistent change in the mean diameter of rBC particles was observed between spring and summer. Moreover, the mean MMD showed a general trend towards smaller particles with increasing altitude in spring. Such variability might be related to several mechanisms, including different atmospheric processing or sources; the MMD provides only qualitative information on this, though. In order to investigate the variability of rBC particle size in detail, averaged mass size distributions of rBC were calculated for the different potential temperature levels presented in Sect. 3.3. Figure 9 shows MSD normalised by the total MrBC for levels I–V from the spring observations around Alert (A) and Eureka (E) as well as for level II from the summer measurements around Resolute Bay. Levels I and III from the summer case were excluded due to insufficient particle numbers. Results from Alert and Eureka show only a small variation of the normalised MSD from each level and will thus be described together and simply addressed as spring.
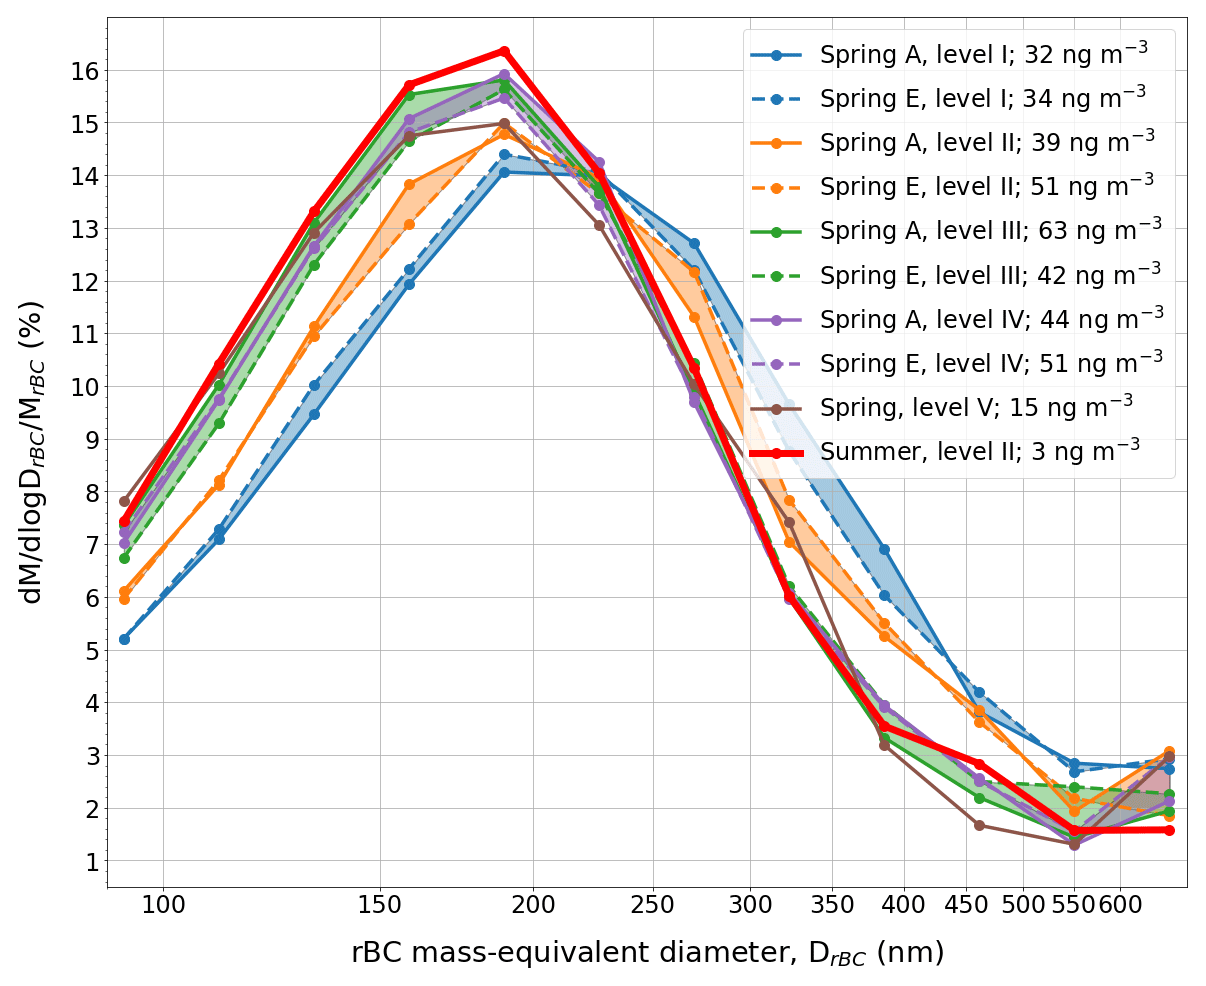
Figure 9Averaged rBC mass size distributions normalised with the total mass concentration under the curve for levels I–V from the spring polar dome observations around Alert (A) and Eureka (E), as well as for level II from the summer polar dome observations around Resolute Bay.
All size distributions were log-normally distributed with the main mode located between 160 and 220 nm. The MSDs from the upper polar dome in summer (level II) and spring (levels III-V) showed a surprising resemblance, with their mean mode peaking below 200 nm of DrBC. This range is quite comparable with ship-borne measurements performed over the Arctic Ocean, Bering Sea, and North Pacific Ocean in summer, where MMDs ranged between 168 and 192 nm (Taketani et al., 2016). On the contrary the lowest spring atmosphere (level I–II) appeared to be enriched with rBC cores larger than approximately 250 nm. The size distribution is similar to previous observations in summer in the European Arctic at the surface (Raatikainen et al., 2015; Zanatta et al., 2018), suggesting a non-dissimilar influence of sources and impact of atmospheric processing on rBC at low altitudes between the Canadian and European Arctic. rBC size distribution has been found to be extremely sensitive to both emission type and atmospheric processing. For example, while rBC particle diameters increase when switching from fresh urban emissions to biomass burning emissions (Sahu et al., 2012; Laborde et al., 2013), ship-emitted rBC can show a bimodal size distribution characterised by a second mode above 600 nm of DrBC (Corbin et al., 2018). Besides emission type, atmospheric processing plays an important role in the evolution of the rBC size distribution. While Laborde et al. (2013) observed an increase in the rBC particle diameter from local emissions to aged air with continental-scale influence, Moteki et al. (2012) found evidence of preferential removal of large particles by wet deposition. In the Arctic region especially, where import of BC with an air mass and cloud formation driven removal were found to be a synergistic process (Liu et al., 2011), it became clear that the rBC particle size distribution alone is not sufficient to determine the dominant removal process or source type. Even though the present dataset does not allow a complete decoupling of factors controlling the seasonal and altitudinal change in rBC mean diameter, the latter might influence the rBC optical properties and subsequent radiative forcing. The mass absorption cross section of pure rBC varies as a function of rBC diameter (Bond and Bergstrom, 2006), and a shift from about 200–250 nm of DrBC causes a decrease in the mass absorption cross section from 6.7 to 4.9 m2 g−1 (Zanatta et al., 2018). Although the direct rBC forcing in the Arctic is dominated by the absolute BC mass concentration and mainly affected by rBC mixing state (Kodros et al., 2018), the change in the rBC particle diameter is rarely considered in radiative forcing estimations.
Two aircraft campaigns within the NETCARE project allowed observation of the vertical distribution of black carbon aerosol over the High Canadian Arctic during spring and summer. A seasonal difference was first and foremost noticed in the concentration and properties of rBC from the vertical profile flights. rBC mass concentration at low altitude decreased by 1 order of magnitude from spring (mean of ∼32 ng m−3) to summer (∼1 ng m−3) and such seasonal difference also translated to higher altitudes. The concurrent decrease in rBC number fraction also suggested that, especially during summer, particles originating from combustion processes represent a minority of the aerosol population in the High Canadian Arctic. Besides the absolute and relative concentration of rBC, the different atmospheric conditions between the seasons also appeared to influence the size of rBC particles. The mass mean diameter in spring (mean range of 142–207 nm) was significantly larger than the one observed in summer (mean range of 119–134 nm). One additional difference between the two seasons was related to the vertical distribution of rBC and its properties, which was highly variable in spring and more homogeneous in summer.
The vertical variability of rBC in the polar dome was investigated as a function of potential temperature, which highlighted that the distribution of aerosols is constrained by the temperature structure of the cold and stable air mass over the Arctic. Prominent patterns of variability in rBC mass, particle size and particle presence relative to total aerosol number and CO mixing ratio were identified within five potential temperature levels in spring and three levels in summer. Back-trajectories initialised within each level generally showed that with increasing potential temperature in the polar dome, air pollution from warmer, more southern areas can affect the High Canadian Arctic. Low-pressure systems caused strong southward disruptions of the polar front and thus extended the area affecting the cold polar air mass for more emission sources.
The lowest levels in spring (with potential temperatures <265 K) were particularly influenced by low-level transport from sources within the marginal Arctic. Between 255 and 265 K, MrBC gradually increased (to a mean of 49 ng m−3) due to low-level transport from northern Russia and within a cold air outbreak in the corridor from eastern Europe to central Asia, where potential sources for combustion-generated air pollution were industrial activity, gas flaring and biomass burning. The temporal development of this outbreak enhanced the initially low MrBC (<15 ng m−3) within the next higher level of the polar dome (between 265 and 276 K) to peaks up to 150 ng m−3 at altitudes above 2000 m. While the lower polar dome was dominated by low-level transport, higher levels were supplied with air pollution mainly from lower-latitude eastern Europe and central Asia as well as north-eastern Asia by transport patterns that likely involved lifting processes.
In summer, by contrast, the motion of air masses was mostly confined to the region north of the Arctic Circle, largely preventing entrainment of pollution from lower latitudes during the measurement period. The averaged rBC mass concentration increased from the surface to the upper atmospheric levels by a factor of 2–3, but remained below 12 ng m−3. Considering the correlation between absolute and relative concentration of rBC, it appeared that mid-level transport favoured the entrainment of combustion-generated aerosol from low latitudes to the High Canadian Arctic. Enhancements in rBC and CO concentrations were associated with instances of northward transport triggered by low-pressure systems, which supplied combustion-generated air pollution from wildfires and gas flaring sites located north of 60∘ N.
Regarding rBC properties, a remarkable and monotonic decrease in rBC particle size with altitude was observed in spring, while no evident trend was observed in summer. The change in rBC particle size in spring might be associated either with changes in source type, facilitated by the southward extent of the polar dome, or with atmospheric processing such as wet removal, which is enabled during uplift of an air mass and consequent cloud formation. A similar discussion applies to the ratio of rBC over CO, which showed, at least in spring, distinct deviations from an otherwise general decreasing trend.
The vertical profiles presented here captured the variability of rBC concentrations and properties imposed by cyclonic disturbances to the polar dome over the course of 1 week in spring and 2 weeks in summer, which to our knowledge has not been achieved during an aircraft campaign in the High Arctic before. The back-trajectory analysis suggests that Eurasian emissions represent the most probable source of combustion-generated aerosol in the polar dome. The contribution of individual sources and the effects of removal ultimately resulting in the observed high variability in the vertical presence and properties of rBC could not be given a concluding explanation by the analysis presented here. Despite this, the discussion of this dataset along the meteorological context represents an extensive insight into the vertical distribution of rBC and its properties in the Arctic, providing new input for the validation of chemical transport models and radiative forcing assessments.
The NETCARE project (Network on Climate and Aerosols: Addressing Key Uncertainties in Remote Canadian Environments, http://www.netcare-project.ca, last access: 10 February 2019) made all data publicly available on the Government of Canada Open Data Portal in collaboration with Environment and Climate Change Canada. The data can be accessed at https://open.canada.ca/data/en/dataset?q=NETCARE (last access: 10 February 2019). Global MODIS active fire locations are available at https://earthdata.nasa.gov/earth-observation-data/near-real-time/firms/active-fire-data (last access: 10 February 2019). Gas flaring locations from the ECLIPSE inventory V5 are available at http://www.iiasa.ac.at/web/home/research/researchPrograms/air/ECLIPSEv5.html (last access: 10 February 2019).
The supplement related to this article is available online at: https://doi.org/10.5194/acp-19-2361-2019-supplement.
HS wrote the paper, with significant conceptual input from MZ, WRL and ABH and critical feedback from all co-authors. HS, HB, MDW, JB and WRL operated instruments in the field and analysed resulting data. HB, DK and PMH ran LAGRANTO simulations and HS analysed the resulting data with input from HB. WRL, JPDA and ABH designed the field experiment.
The authors declare that they have no conflict of interest.
This article is part of the special issue “NETCARE (Network on Aerosols and Climate: Addressing Key Uncertainties in Remote Canadian Environments) (ACP/AMT/BG inter-journal SI)”. It is not associated with a conference.
This research was funded jointly by NETCARE through the Climate Change and
Atmospheric Research (CCAR) program at the Natural Sciences and Engineering
Research Council of Canada (NSERC), by the Alfred Wegener Institute (AWI), and by Environment and Climate Change Canada (ECCC). We gratefully
acknowledge the funding by the Deutsche Forschungsgemeinschaft (DFG, German
Research Foundation) – project no. 268020496 – TRR 172, within the
Transregional Collaborative Research Center “ArctiC Amplification: Climate
Relevant Atmospheric and SurfaCe Processes, and Feedback Mechanisms
(AC)3”. We thank Kenn Borek Air Ltd (KBAL), in particular Gary Murtsell
and Neil Travers, as well as Kevin Elke and John Bayes for their skilful
piloting across the Arctic. We acknowledge Martin Gehrmann, Manuel Sellmann
and Lukas Kandora (AWI) as well as Doug MacKenzie and Kevin Riehl (KBAL) for
their technical help on the ground and during airborne operations. We thank
Jim Hodgson and Lake Central Air Services (LCAS) in Muskoka, Jim Watson
(Scale Modelbuilders, Inc.), and Julia Binder (AWI) for their support of the
instrument integration. We are grateful to Bob Christensen (University of
Toronto), Carrie Taylor, Dan Veber, Alina Chivulescu, Andrew Platt,
Ralf Staebler, Anne Marie Macdonald, Desiree Toom and Maurice Watt (ECCC) for
their support of the study. We are grateful to Kathy Law, Jennie Thomas
(LATMOS) and Jean-Pierre Blanchet (UQUAM) for their model support during the
campaign. Franziska Nehring and Johannes Käsbohrer (FIELAX GmbH) are
acknowledged for their support with the meteorological measurements. The
meteorological data were supplied by the European Centre for Medium-Range
Weather Forecasts (ECWMF). We thank the Nunavut Research Institute and the
Nunavut Impact Review Board for licensing the study. Logistical support in
Resolute Bay was provided by the Polar Continental Shelf Project (PCSP) of
Natural Resources Canada under PCSP field project no. 218-14, and we are
particularly grateful to Tim McCagherty and Jodi MacGregor of the
PCSP.
The article processing charges for this
open-access
publication were covered by a Research
Centre of the Helmholtz Association.
Edited by: Lynn M. Russell
Reviewed by: four
anonymous referees
Abbatt, J. P. D., Leaitch, W. R., Aliabadi, A. A., Bertram, A. K., Blanchet, J.-P., Boivin-Rioux, A., Bozem, H., Burkart, J., Chang, R. Y. W., Charette, J., Chaubey, J. P., Christensen, R. J., Cirisan, A., Collins, D. B., Croft, B., Dionne, J., Evans, G. J., Fletcher, C. G., Ghahremaninezhad, R., Girard, E., Gong, W., Gosselin, M., Gourdal, M., Hanna, S. J., Hayashida, H., Herber, A. B., Hesaraki, S., Hoor, P., Huang, L., Hussherr, R., Irish, V. E., Keita, S. A., Kodros, J. K., Köllner, F., Kolonjari, F., Kunkel, D., Ladino, L. A., Law, K., Levasseur, M., Libois, Q., Liggio, J., Lizotte, M., Macdonald, K. M., Mahmood, R., Martin, R. V., Mason, R. H., Miller, L. A., Moravek, A., Mortenson, E., Mungall, E. L., Murphy, J. G., Namazi, M., Norman, A.-L., O'Neill, N. T., Pierce, J. R., Russell, L. M., Schneider, J., Schulz, H., Sharma, S., Si, M., Staebler, R. M., Steiner, N. S., Galí, M., Thomas, J. L., von Salzen, K., Wentzell, J. J. B., Willis, M. D., Wentworth, G. R., Xu, J.-W., and Yakobi-Hancock, J. D.: New insights into aerosol and climate in the Arctic, Atmos. Chem. Phys. Discuss., https://doi.org/10.5194/acp-2018-995, in review, 2018. a
Aliabadi, A. A., Staebler, R. M., and Sharma, S.: Air quality monitoring in communities of the Canadian Arctic during the high shipping season with a focus on local and marine pollution, Atmos. Chem. Phys., 15, 2651–2673, https://doi.org/10.5194/acp-15-2651-2015, 2015. a
Aliabadi, A. A., Thomas, J. L., Herber, A. B., Staebler, R. M., Leaitch, W. R., Schulz, H., Law, K. S., Marelle, L., Burkart, J., Willis, M. D., Bozem, H., Hoor, P. M., Köllner, F., Schneider, J., Levasseur, M., and Abbatt, J. P. D.: Ship emissions measurement in the Arctic by plume intercepts of the Canadian Coast Guard icebreaker Amundsen from the Polar 6 aircraft platform, Atmos. Chem. Phys., 16, 7899–7916, https://doi.org/10.5194/acp-16-7899-2016, 2016. a
AMAP: AMAP Assessment 2015: Black carbon and ozone as Arctic climate forcers, Tech. rep., Arctic Monitoring and Assessment Programme (AMAP), Oslo, Norway, 2015. a, b, c
Arctic Council: Arctic Marine Shipping Assessment 2009 Report, Arctic Council, 190 pp., 2009. a
Barrie, L. A.: Arctic air pollution: An overview of current knowledge, Atmos. Environ., 20, 643–663, https://doi.org/10.1016/0004-6981(86)90180-0, 1986. a, b
Bond, T. C. and Bergstrom, R. W.: Light Absorption by Carbonaceous Particles: An Investigative Review, Aerosol Sci. Tech., 40, 27–67, https://doi.org/10.1080/02786820500421521, 2006. a, b
Bond, T. C., Doherty, S. J., Fahey, D. W., Forster, P. M., Berntsen, T., Deangelo, B. J., Flanner, M. G., Ghan, S., Kärcher, B., Koch, D., Kinne, S., Kondo, Y., Quinn, P. K., Sarofim, M. C., Schultz, M. G., Schulz, M., Venkataraman, C., Zhang, H., Zhang, S., Bellouin, N., Guttikunda, S. K., Hopke, P. K., Jacobson, M. Z., Kaiser, J. W., Klimont, Z., Lohmann, U., Schwarz, J. P., Shindell, D., Storelvmo, T., Warren, S. G., and Zender, C. S.: Bounding the role of black carbon in the climate system: A scientific assessment, J. Geophys. Res.-Atmos., 118, 5380–5552, https://doi.org/10.1002/jgrd.50171, 2013. a, b, c
IPCC: 7. Clouds and Aerosols, Clim. Chang. 2013 Phys. Sci. Basis. Contrib. Work. Gr. I to Fifth Assess. Rep. Intergov. Panel Clim. Chang., edited by: Boucher, O., Randall, D., Artaxo, P., Bretherton, C., Feingold, G., Forster, P., Kerminen, V.-M., Kondo, Y., Liao, H., Lohmann, U., Rasch, P., Satheesh, S. K., Sherwood, S., Stevens, B., and Zhang, X. Y., Cambridge University Press, Cambridge, United Kingdom and New York, NY, USA, 571–657, https://doi.org/10.1017/CBO9781107415324.016, 2013. a
Bozem, H., Hoor, P., Kunkel, D., Köllner, F., Schneider, J., Herber, A., Schulz, H., Leaitch, W. R., Aliabadi, A. A., Willis, M. D., Burkart, J., and Abbatt, J. P. D.: Characterization of Transport Regimes and the Polar Dome during Arctic Spring and Summer using in-situ Aircraft Measurements, Atmos. Chem. Phys. Discuss., https://doi.org/10.5194/acp-2019-70, in review, 2019. a, b, c, d, e, f, g, h, i, j, k, l
Brock, C. A., Cozic, J., Bahreini, R., Froyd, K. D., Middlebrook, A. M., McComiskey, A., Brioude, J., Cooper, O. R., Stohl, A., Aikin, K. C., de Gouw, J. A., Fahey, D. W., Ferrare, R. A., Gao, R.-S., Gore, W., Holloway, J. S., Hübler, G., Jefferson, A., Lack, D. A., Lance, S., Moore, R. H., Murphy, D. M., Nenes, A., Novelli, P. C., Nowak, J. B., Ogren, J. A., Peischl, J., Pierce, R. B., Pilewskie, P., Quinn, P. K., Ryerson, T. B., Schmidt, K. S., Schwarz, J. P., Sodemann, H., Spackman, J. R., Stark, H., Thomson, D. S., Thornberry, T., Veres, P., Watts, L. A., Warneke, C., and Wollny, A. G.: Characteristics, sources, and transport of aerosols measured in spring 2008 during the aerosol, radiation, and cloud processes affecting Arctic Climate (ARCPAC) Project, Atmos. Chem. Phys., 11, 2423–2453, https://doi.org/10.5194/acp-11-2423-2011, 2011. a, b, c, d
Browse, J., Carslaw, K. S., Arnold, S. R., Pringle, K., and Boucher, O.: The scavenging processes controlling the seasonal cycle in Arctic sulphate and black carbon aerosol, Atmos. Chem. Phys., 12, 6775–6798, https://doi.org/10.5194/acp-12-6775-2012, 2012. a
Burkart, J., Willis, M. D., Bozem, H., Thomas, J. L., Law, K., Hoor, P., Aliabadi, A. A., Köllner, F., Schneider, J., Herber, A., Abbatt, J. P. D., and Leaitch, W. R.: Summertime observations of elevated levels of ultrafine particles in the high Arctic marine boundary layer, Atmos. Chem. Phys., 17, 5515–5535, https://doi.org/10.5194/acp-17-5515-2017, 2017. a
Cai, Y., Montague, D. C., Mooiweer-Bryan, W., and Deshler, T.: Performance characteristics of the ultra high sensitivity aerosol spectrometer for particles between 55 and 800 nm: Laboratory and field studies, J. Aerosol Sci., 39, 759–769, https://doi.org/10.1016/j.jaerosci.2008.04.007, 2008. a, b
Chen, W. T., Lee, Y. H., Adams, P. J., Nenes, A., and Seinfeld, J. H.: Will black carbon mitigation dampen aerosol indirect forcing?, Geophys. Res. Lett., 37, L09801, https://doi.org/10.1029/2010GL042886, 2010. a
Corbett, J., Winebrake, J., and Green, E.: An assessment of technologies for reducing regional short-lived climate forcers emitted by ships with implications for Arctic shipping, Carbon Manag., 1, 207–225, https://doi.org/10.4155/cmt.10.27, 2010. a, b
Corbin, J. C., Pieber, S. M., Czech, H., Zanatta, M., Jakobi, G., Massabò, D., Orasche, J., El Haddad, I., Mensah, A. A., Stengel, B., Drinovec, L., Mocnik, G., Zimmermann, R., Prévôt, A. S., and Gysel, M.: Brown and Black Carbon Emitted by a Marine Engine Operated on Heavy Fuel Oil and Distillate Fuels: Optical Properties, Size Distributions, and Emission Factors, J. Geophys. Res.-Atmos., 123, 6175–6195, https://doi.org/10.1029/2017JD027818, 2018. a
Croft, B., Martin, R. V., Leaitch, W. R., Tunved, P., Breider, T. J., D'Andrea, S. D., and Pierce, J. R.: Processes controlling the annual cycle of Arctic aerosol number and size distributions, Atmos. Chem. Phys., 16, 3665–3682, https://doi.org/10.5194/acp-16-3665-2016, 2016. a
Dee, D. P., Uppala, S. M., Simmons, A. J., Berrisford, P., Poli, P., Kobayashi, S., Andrae, U., Balmaseda, M. A., Balsamo, G., Bauer, P., Bechtold, P., Beljaars, A. C. M., van de Berg, L., Bidlot, J., Bormann, N., Delsol, C., Dragani, R., Fuentes, M., Geer, A. J., Haimberger, L., Healy, S. B., Hersbach, H., Hólm, E. V., Isaksen, L., Kållberg, P., Köhler, M., Matricardi, M., Mcnally, A. P., Monge-Sanz, B. M., Morcrette, J. J., Park, B. K., Peubey, C., de Rosnay, P., Tavolato, C., Thépaut, J. N., and Vitart, F.: The ERA-Interim reanalysis: Configuration and performance of the data assimilation system, Q. J. Roy. Meteor. Soc., 137, 553–597, https://doi.org/10.1002/qj.828, 2011. a
Eleftheriadis, K., Vratolis, S., and Nyeki, S.: Aerosol black carbon in the European Arctic: Measurements at Zeppelin station, Ny-Ålesund, Svalbard from 1998-2007, Geophys. Res. Lett., 36, L02809, https://doi.org/10.1029/2008GL035741, 2009. a, b
Evans, M., Kholod, N., Kuklinski, T., Denysenko, A., Smith, S. J., Staniszewski, A., Hao, W. M., Liu, L., and Bond, T. C.: Black carbon emissions in Russia: A critical review, Atmos. Environ., 163, 9–21, https://doi.org/10.1016/j.atmosenv.2017.05.026, 2017. a, b
Flanner, M. G.: Arctic climate sensitivity to local black carbon, J. Geophys. Res.-Atmos., 118, 1840–1851, https://doi.org/10.1002/jgrd.50176, 2013. a
Flanner, M. G., Zender, C. S., Randerson, J. T., and Rasch, P. J.: Present-day climate forcing and response from black carbon in snow, J. Geophys. Res.-Atmos., 112, 1–17, https://doi.org/10.1029/2006JD008003, 2007. a
Flanner, M. G., Zender, C. S., Hess, P. G., Mahowald, N. M., Painter, T. H., Ramanathan, V., and Rasch, P. J.: Springtime warming and reduced snow cover from carbonaceous particles, Atmos. Chem. Phys., 9, 2481–2497, https://doi.org/10.5194/acp-9-2481-2009, 2009. a
Garrett, T. J., Brattström, S., Sharma, S., Worthy, D. E. J., and Novelli, P.: The role of scavenging in the seasonal transport of black carbon and sulfate to the Arctic, Geophys. Res. Lett., 38, 1–11, https://doi.org/10.1029/2011GL048221, 2011. a
Gaubert, B., Arellano, A. F., Barré, J., Worden, H. M., Emmons, L. K., Tilmes, S., Buchholz, R. R., Vitt, F., Raeder, K., Collins, N., Anderson, J. L., Wiedinmyer, C., Martinez Alonso, S., Edwards, D. P., Andreae, M. O., Hannigan, J. W., Petri, C., Strong, K., and Jones, N.: Toward a chemical reanalysis in a coupled chemistry-climate model: An evaluation of MOPITT CO assimilation and its impact on tropospheric composition, J. Geophys. Res., 121, 7310–7343, https://doi.org/10.1002/2016JD024863, 2016. a
Giglio, L., Descloitres, J., Justice, C. O., and Kaufman, Y. J.: An enhanced contextual fire detection algorithm for MODIS, Remote Sens. Environ., 87, 273–282, https://doi.org/10.1016/S0034-4257(03)00184-6, 2003. a
Gong, W., Beagley, S. R., Cousineau, S., Sassi, M., Munoz-Alpizar, R., Ménard, S., Racine, J., Zhang, J., Chen, J., Morrison, H., Sharma, S., Huang, L., Bellavance, P., Ly, J., Izdebski, P., Lyons, L., and Holt, R.: Assessing the impact of shipping emissions on air pollution in the Canadian Arctic and northern regions: current and future modelled scenarios, Atmos. Chem. Phys., 18, 16653–16687, https://doi.org/10.5194/acp-18-16653-2018, 2018. a
Gysel, M., Laborde, M., Olfert, J. S., Subramanian, R., and Gröhn, A. J.: Effective density of Aquadag and fullerene soot black carbon reference materials used for SP2 calibration, Atmos. Meas. Tech., 4, 2851–2858, https://doi.org/10.5194/amt-4-2851-2011, 2011. a
Hansen, J. and Nazarenko, L.: Soot climate forcing via snow and ice albedos, P. Natl. Acad. Sci. USA, 101, 423–428, https://doi.org/10.1073/pnas.2237157100, 2004. a
Herber, A., Dethloff, K., Haas, C., Steinhage, D., Strapp, J. W., Bottenheim, J., McElroy, T., and Yamanouchi, T.: POLAR 5 – a new research aircraft for improved access to the Arctic, ISAR-1, Drastic Chang. under Glob. Warm. Ext. Abstr., 54–57, 2008. a
Huang, L., Gong, S. L., Sharma, S., Lavoué, D., and Jia, C. Q.: A trajectory analysis of atmospheric transport of black carbon aerosols to Canadian high Arctic in winter and spring (1990–2005), Atmos. Chem. Phys., 10, 5065–5073, https://doi.org/10.5194/acp-10-5065-2010, 2010. a
Jiao, C. and Flanner, M. G.: Changing black carbon transport to the Arctic from present day to the end of 21st century, J. Geophys. Res.-Atmos., 121, 4734–4750, https://doi.org/10.1002/2015JD023964, 2016. a
Klimont, Z., Kupiainen, K., Heyes, C., Purohit, P., Cofala, J., Rafaj, P., Borken-Kleefeld, J., and Schöpp, W.: Global anthropogenic emissions of particulate matter including black carbon, Atmos. Chem. Phys., 17, 8681–8723, https://doi.org/10.5194/acp-17-8681-2017, 2017. a
Klonecki, A., Hess, P., Emmons, L., Smith, L., and Orlando, J.: Seasonal changes in the transport of pollutants into the Arctic troposphere-model study, J. Geophys. Res., 108, 8367, https://doi.org/10.1029/2002JD002199, 2003. a
Kodros, J. K., Hanna, S. J., Bertram, A. K., Leaitch, W. R., Schulz, H., Herber, A. B., Zanatta, M., Burkart, J., Willis, M. D., Abbatt, J. P. D., and Pierce, J. R.: Size-resolved mixing state of black carbon in the Canadian high Arctic and implications for simulated direct radiative effect, Atmos. Chem. Phys., 18, 11345–11361, https://doi.org/10.5194/acp-18-11345-2018, 2018. a, b
Kondo, Y., Matsui, H., Moteki, N., Sahu, L., Takegawa, N., Kajino, M., Zhao, Y., Cubison, M. J., Jimenez, J. L., Vay, S., Diskin, G. S., Anderson, B., Wisthaler, A., Mikoviny, T., Fuelberg, H. E., Blake, D. R., Huey, G., Weinheimer, A. J., Knapp, D. J., and Brune, W. H.: Emissions of black carbon, organic, and inorganic aerosols from biomass burning in North America and Asia in 2008, J. Geophys. Res.-Atmos., 116, D08204, https://doi.org/10.1029/2010JD015152, 2011a. a
Kondo, Y., Sahu, L., Moteki, N., Khan, F., Takegawa, N., Liu, X., Koike, M., and Miyakawa, T.: Consistency and Traceability of Black Carbon Measurements Made by Laser-Induced Incandescence, Thermal-Optical Transmittance, and Filter-Based Photo-Absorption Techniques, Aerosol Sci. Tech., 45, 295–312, https://doi.org/10.1080/02786826.2010.533215, 2011b. a
Kondo, Y., Moteki, N., Oshima, N., Ohata, S., Koike, M., Shibano, Y., Takegawa, N., and Kita, K.: Effects of wet deposition on the abundance and size distribution of black carbon in East Asia, J. Geophys. Res.-Atmos., 121, 4691–4712, https://doi.org/10.1002/2015JD024479, 2016. a, b, c, d, e
Kupc, A., Williamson, C., Wagner, N. L., Richardson, M., and Brock, C. A.: Modification, calibration, and performance of the Ultra-High Sensitivity Aerosol Spectrometer for particle size distribution and volatility measurements during the Atmospheric Tomography Mission (ATom) airborne campaign, Atmos. Meas. Tech., 11, 369–383, https://doi.org/10.5194/amt-11-369-2018, 2018. a
Laborde, M., Schnaiter, M., Linke, C., Saathoff, H., Naumann, K.-H., Möhler, O., Berlenz, S., Wagner, U., Taylor, J. W., Liu, D., Flynn, M., Allan, J. D., Coe, H., Heimerl, K., Dahlkötter, F., Weinzierl, B., Wollny, A. G., Zanatta, M., Cozic, J., Laj, P., Hitzenberger, R., Schwarz, J. P., and Gysel, M.: Single Particle Soot Photometer intercomparison at the AIDA chamber, Atmos. Meas. Tech., 5, 3077–3097, https://doi.org/10.5194/amt-5-3077-2012, 2012. a, b, c, d
Laborde, M., Crippa, M., Tritscher, T., Jurányi, Z., Decarlo, P. F., Temime-Roussel, B., Marchand, N., Eckhardt, S., Stohl, A., Baltensperger, U., Prévôt, A. S. H., Weingartner, E., and Gysel, M.: Black carbon physical properties and mixing state in the European megacity Paris, Atmos. Chem. Phys., 13, 5831–5856, https://doi.org/10.5194/acp-13-5831-2013, 2013. a, b, c
Law, K. S. and Stohl, A.: Arctic Air Pollution: Origins and Impacts, Science, 315, 1537–1540, https://doi.org/10.1126/science.1137695, 2007. a
Law, K. S., Roiger, A., Thomas, J. L., Marelle, L., Raut, J.-C., Dalsøren, S., Fuglestvedt, J., Tuccella, P., Weinzierl, B., and Schlager, H.: Local Arctic air pollution: Sources and impacts, Ambio, 46, 453–463, https://doi.org/10.1007/s13280-017-0962-2, 2017. a, b, c
Leaitch, W. R., Sharma, S., Huang, L., Toom-Sauntry, D., Chivulescu, A., Macdonald, A. M., von Salzen, K., Pierce, J. R., Bertram, A. K., Schroder, J. C., Shantz, N. C., Chang, R. Y. W., and Norman, A.-L.: Dimethyl sulfide control of the clean summertime Arctic aerosol and cloud, Elem. Sci. Anth., 1, 12 pp., https://doi.org/10.12952/journal.elementa.000017, 2013. a
Leaitch, W. R., Korolev, A., Aliabadi, A. A., Burkart, J., Willis, M. D., Abbatt, J. P. D., Bozem, H., Hoor, P., Köllner, F., Schneider, J., Herber, A., Konrad, C., and Brauner, R.: Effects of 20–100 nm particles on liquid clouds in the clean summertime Arctic, Atmos. Chem. Phys., 16, 11107–11124, https://doi.org/10.5194/acp-16-11107-2016, 2016. a, b
Libois, Q., Ivanescu, L., Blanchet, J.-P., Schulz, H., Bozem, H., Leaitch, W. R., Burkart, J., Abbatt, J. P. D., Herber, A. B., Aliabadi, A. A., and Girard, É.: Airborne observations of far-infrared upwelling radiance in the Arctic, Atmos. Chem. Phys., 16, 15689–15707, https://doi.org/10.5194/acp-16-15689-2016, 2016. a
Lindsay, R. W., Zhang, J., Schweiger, A., Steele, M., and Stern, H.: Arctic sea ice retreat in 2007 follows thinning trend, J. Climate, 22, 165–176, https://doi.org/10.1175/2008JCLI2521.1, 2009. a
Liu, D., Quennehen, B., Darbyshire, E., Allan, J. D., Williams, P. I., Taylor, J. W., Bauguitte, S. J.-B., Flynn, M. J., Lowe, D., Gallagher, M. W., Bower, K. N., Choularton, T. W., and Coe, H.: The importance of Asia as a source of black carbon to the European Arctic during springtime 2013, Atmos. Chem. Phys., 15, 11537–11555, https://doi.org/10.5194/acp-15-11537-2015, 2015. a, b, c
Liu, J., Fan, S., Horowitz, L. W., and Levy, H.: Evaluation of factors controlling long-range transport of black carbon to the Arctic, J. Geophys. Res., 116, D04307, https://doi.org/10.1029/2010JD015145, 2011. a, b
Lohmann, U. and Feichter, J.: Can the direct and semi-direct aerosol effect compete with the indirect effect on a global scale?, Geophys. Res. Lett., 28, 159–161, https://doi.org/10.1029/2000GL012051, 2001. a
MacCracken, M. C., Cess, R. D., and Potter, G. L.: Climatic effects of anthropogenic Arctic aerosols: an illustration of climate feedback mechanisms with one- and two-dimensional climate models, J. Geophys. Res., 91, 14445–14450, 1986. a
Marelle, L., Thomas, J. L., Raut, J.-C., Law, K. S., Jalkanen, J.-P., Johansson, L., Roiger, A., Schlager, H., Kim, J., Reiter, A., and Weinzierl, B.: Air quality and radiative impacts of Arctic shipping emissions in the summertime in northern Norway: from the local to the regional scale, Atmos. Chem. Phys., 16, 2359–2379, https://doi.org/10.5194/acp-16-2359-2016, 2016. a
Massling, A., Nielsen, I. E., Kristensen, D., Christensen, J. H., Sørensen, L. L., Jensen, B., Nguyen, Q. T., Nøjgaard, J. K., Glasius, M., and Skov, H.: Atmospheric black carbon and sulfate concentrations in Northeast Greenland, Atmos. Chem. Phys., 15, 9681–9692, https://doi.org/10.5194/acp-15-9681-2015, 2015. a
Matsui, H., Kondo, Y., Moteki, N., Takegawa, N., Sahu, L., Zhao, Y., Fuelberg, H. E., Sessions, W., Diskin, G. S., Blake, D. R., Wisthaler, A., and Koike, M.: Seasonal variation of the transport of black carbon aerosol from the Asian continent to the Arctic during the ARCTAS aircraft campaign, J. Geophys. Res., 116, D05202, https://doi.org/10.1029/2010JD015067, 2011. a, b, c, d, e
McMeeking, G. R., Hamburger, T., Liu, D., Flynn, M., Morgan, W. T., Northway, M., Highwood, E. J., Krejci, R., Allan, J. D., Minikin, A., and Coe, H.: Black carbon measurements in the boundary layer over western and northern Europe, Atmos. Chem. Phys., 10, 9393–9414, https://doi.org/10.5194/acp-10-9393-2010, 2010. a
Mikhailov, E. F., Mironova, S., Mironov, G., Vlasenko, S., Panov, A., Chi, X., Walter, D., Carbone, S., Artaxo, P., Heimann, M., Lavric, J., Pöschl, U., and Andreae, M. O.: Long-term measurements (2010–2014) of carbonaceous aerosol and carbon monoxide at the Zotino Tall Tower Observatory (ZOTTO) in central Siberia, Atmos. Chem. Phys., 17, 14365–14392, https://doi.org/10.5194/acp-17-14365-2017, 2017. a
Moteki, N. and Kondo, Y.: Effects of mixing state on black carbon measurements by laser-induced incandescence, Aerosol Sci. Tech., 41, 398–417, https://doi.org/10.1080/02786820701199728, 2007. a
Moteki, N. and Kondo, Y.: Dependence of Laser-Induced Incandescence on Physical Properties of Black Carbon Aerosols: Measurements and Theoretical Interpretation, Aerosol Sci. Tech., 44, 663–675, https://doi.org/10.1080/02786826.2010.484450, 2010. a
Moteki, N., Kondo, Y., Oshima, N., Takegawa, N., Koike, M., Kita, K., Matsui, H., and Kajino, M.: Size dependence of wet removal of black carbon aerosols during transport from the boundary layer to the free troposphere, Geophys. Res. Lett., 39, L13802, https://doi.org/10.1029/2012GL052034, 2012. a, b, c
Ødemark, K., Dalsøren, S. B., Samset, B. H., Berntsen, T. K., Fuglestvedt, J. S., and Myhre, G.: Short-lived climate forcers from current shipping and petroleum activities in the Arctic, Atmos. Chem. Phys., 12, 1979–1993, https://doi.org/10.5194/acp-12-1979-2012, 2012. a
Oshima, N., Kondo, Y., Moteki, N., Takegawa, N., Koike, M., Kita, K., Matsui, H., Kajino, M., Nakamura, H., Jung, J. S., and Kim, Y. J.: Wet removal of black carbon in Asian outflow: Aerosol Radiative Forcing in East Asia (A-FORCE) aircraft campaign, J. Geophys. Res.-Atmos., 117, D03204, https://doi.org/10.1029/2011JD016552, 2012. a
Petzold, A., Ogren, J. A., Fiebig, M., Laj, P., Li, S.-M., Baltensperger, U., Holzer-Popp, T., Kinne, S., Pappalardo, G., Sugimoto, N., Wehrli, C., Wiedensohler, A., and Zhang, X.-Y.: Recommendations for reporting “black carbon” measurements, Atmos. Chem. Phys., 13, 8365–8379, https://doi.org/10.5194/acp-13-8365-2013, 2013. a
Pithan, F. and Mauritsen, T.: Arctic amplification dominated by temperature feedbacks in contemporary climate models, Nat. Geosci., 7, 181–184, https://doi.org/10.1038/NGEO2071, 2014. a
Pozzoli, L., Dobricic, S., Russo, S., and Vignati, E.: Impacts of large-scale atmospheric circulation changes in winter on black carbon transport and deposition to the Arctic, Atmos. Chem. Phys., 17, 11803–11818, https://doi.org/10.5194/acp-17-11803-2017, 2017. a
Quinn, P. K., Bates, T. S., Baum, E., Doubleday, N., Fiore, A. M., Flanner, M., Fridlind, A., Garrett, T. J., Koch, D., Menon, S., Shindell, D., Stohl, A., and Warren, S. G.: Short-lived pollutants in the Arctic: their climate impact and possible mitigation strategies, Atmos. Chem. Phys., 8, 1723–1735, https://doi.org/10.5194/acp-8-1723-2008, 2008. a
Quinn, P. K., Stohl, A., Arneth, A., Berntsen, T., Burkhart, J. F., Christensen, J. H., Flanner, M. G., Kupiainen, K., Lihavainen, H., Shepherd, M., Shevchenko, V. P., Skov, H., and Vestreng, V.: The impact of black carbon on Arctic climate (2011), Tech. Rep. 4, Arctic Monitoring and Assessment Programme (AMAP), Oslo, Norway, 2011. a
Raatikainen, T., Brus, D., Hyvärinen, A.-P., Svensson, J., Asmi, E., and Lihavainen, H.: Black carbon concentrations and mixing state in the Finnish Arctic, Atmos. Chem. Phys., 15, 10057–10070, https://doi.org/10.5194/acp-15-10057-2015, 2015. a, b
Raut, J.-C., Marelle, L., Fast, J. D., Thomas, J. L., Weinzierl, B., Law, K. S., Berg, L. K., Roiger, A., Easter, R. C., Heimerl, K., Onishi, T., Delanoë, J., and Schlager, H.: Cross-polar transport and scavenging of Siberian aerosols containing black carbon during the 2012 ACCESS summer campaign, Atmos. Chem. Phys., 17, 10969–10995, https://doi.org/10.5194/acp-17-10969-2017, 2017. a, b
Roiger, A., Thomas, J. L., Schlager, H., Law, K. S., Kim, J., Schäfler, A., Weinzierl, B., Dahlkötter, F., Krisch, I., Marelle, L., Minikin, A., Raut, J. C., Reiter, A., Rose, M., Scheibe, M., Stock, P., Baumann, R., Bouarar, I., Lerbaux, C. C., George, M., Onishi, T., and Flemming, J.: Quantifying emerging local anthropogenic emissions in the arctic region: The access aircraft campaign experiment, B. Am. Meteorol. Soc., 96, 441–460, https://doi.org/10.1175/BAMS-D-13-00169.1, 2015. a
Sahu, L. K., Kondo, Y., Moteki, N., Takegawa, N., Zhao, Y., Cubison, M. J., Jimenez, J. L., Vay, S., Diskin, G. S., Wisthaler, A., Mikoviny, T., Huey, L. G., Weinheimer, A. J., and Knapp, D. J.: Emission characteristics of black carbon in anthropogenic and biomass burning plumes over California during ARCTAS-CARB 2008, J. Geophys. Res.-Atmos., 117, D16302, https://doi.org/10.1029/2011JD017401, 2012. a, b
Samset, B. H., Myhre, G., Schulz, M., Balkanski, Y., Bauer, S., Berntsen, T. K., Bian, H., Bellouin, N., Diehl, T., Easter, R. C., Ghan, S. J., Iversen, T., Kinne, S., Kirkevåg, A., Lamarque, J.-F., Lin, G., Liu, X., Penner, J. E., Seland, Ø., Skeie, R. B., Stier, P., Takemura, T., Tsigaridis, K., and Zhang, K.: Black carbon vertical profiles strongly affect its radiative forcing uncertainty, Atmos. Chem. Phys., 13, 2423–2434, https://doi.org/10.5194/acp-13-2423-2013, 2013. a
Sand, M., Berntsen, T. K., von Salzen, K., Flanner, M. G., Langner, J., and Victor, D. G.: Response of Arctic temperature to changes in emissions of short-lived climate forcers, Nat. Clim. Change, 6, 1–5, https://doi.org/10.1038/nclimate2880, 2015. a
Sato, Y., Miura, H., Yashiro, H., Goto, D., Takemura, T., Tomita, H., and Nakajima, T.: Unrealistically pristine air in the Arctic produced by current global scale models, Sci. Rep.-UK, 6, 26561, https://doi.org/10.1038/srep26561, 2016. a
Schwarz, J. P., Gao, R. S., Fahey, D. W., Thomson, D. S., Watts, L. A., Wilson, J. C., Reeves, J. M., Darbeheshti, M., Baumgardner, D. G., Kok, G. L., Chung, S. H., Schulz, M., Hendricks, J., Lauer, A., Kärcher, B., Slowik, J. G., Rosenlof, K. H., Thompson, T. L., Langford, A. O., Loewenstein, M., and Aikin, K. C.: Single-particle measurements of midlatitude black carbon and light-scattering aerosols from the boundary layer to the lower stratosphere, J. Geophys. Res.-Atmos., 111, D16207, https://doi.org/10.1029/2006JD007076, 2006. a
Schwarz, J. P., Spackman, J. R., Gao, R. S., Perring, A. E., Cross, E., Onasch, T. B., Ahern, A., Wrobel, W., Davidovits, P., Olfert, J., Dubey, M. K., Mazzoleni, C., and Fahey, D. W.: The Detection Efficiency of the Single Particle Soot Photometer, Aerosol Sci. Tech., 44, 612–628, https://doi.org/10.1080/02786826.2010.481298, 2010a. a
Schwarz, J. P., Spackman, J. R., Gao, R. S., Watts, L. A., Stier, P., Schulz, M., Davis, S. M., Wofsy, S. C., and Fahey, D. W.: Global-scale black carbon profiles observed in the remote atmosphere and compared to models, Geophys. Res. Lett., 37, L18812, https://doi.org/10.1029/2010GL044372, 2010b. a, b
Schwarz, J. P., Samset, B. H., Perring, A. E., Spackman, J. R., Gao, R. S., Stier, P., Schulz, M., Moore, F. L., Ray, E. A., and Fahey, D. W.: Global-scale seasonally resolved black carbon vertical profiles over the Pacific, Geophys. Res. Lett., 40, 5542–5547, https://doi.org/10.1002/2013GL057775, 2013. a
Screen, J. A. and Simmonds, I.: The central role of diminishing sea ice in recent Arctic temperature amplification, Nature, 464, 1334–1337, https://doi.org/10.1038/nature09051, 2010. a
Seidel, D. J., Zhang, Y., Beljaars, A., Golaz, J. C., Jacobson, A. R., and Medeiros, B.: Climatology of the planetary boundary layer over the continental United States and Europe, J. Geophys. Res.-Atmos., 117, D17106, https://doi.org/10.1029/2012JD018143, 2012. a
Sharma, S., Lavoué, D., Chachier, H., Barrie, L. A., and Gong, S. L.: Long-term trends of the black carbon concentrations in the Canadian Arctic, J. Geophys. Res., 109, D15203, https://doi.org/10.1029/2003JD004331, 2004. a
Sharma, S., Leaitch, W. R., Huang, L., Veber, D., Kolonjari, F., Zhang, W., Hanna, S. J., Bertram, A. K., and Ogren, J. A.: An evaluation of three methods for measuring black carbon in Alert, Canada, Atmos. Chem. Phys., 17, 15225–15243, https://doi.org/10.5194/acp-17-15225-2017, 2017. a, b, c, d
Shaw, G. E.: The Arctic Haze Phenomenon, B. Am. Meteorol. Soc., 76, 2403–2413, https://doi.org/10.1175/1520-0477(1995)076<2403:TAHP>2.0.CO;2, 1995. a
Shen, Z., Ming, Y., Horowitz, L. W., Ramaswamy, V., and Lin, M.: On the seasonality of arctic black carbon, J. Climate, 30, 4429–4441, https://doi.org/10.1175/JCLI-D-16-0580.1, 2017. a
Shindell, D., Kuylenstierna, J. C. I., Vignati, E., Dingenen, R. V., Amann, M., Klimont, Z., Anenberg, S. C., Muller, N., Janssens-maenhout, G., Raes, F., Schwartz, J., Faluvegi, G., Pozzoli, L., Kupiainen, K., Höglund-isaksson, L., Emberson, L., Streets, D., Ramanathan, V., Hicks, K., Oanh, N. T. K., Milly, G., Williams, M., Demkine, V., and Fowler, D.: Simultaneously Mitigating Near-Term Climate Change and Improving Human Health and Food Security, Science, 335, 183–189, 2012. a
Spackman, J. R., Schwarz, J. P., Gao, R. S., Watts, L. A., Thomson, D. S., Fahey, D. W., Holloway, J. S., de Gouw, J. A., Trainer, M., and Ryerson, T. B.: Empirical correlations between black carbon aerosol and carbon monoxide in the lower and middle troposphere, Geophys. Res. Lett., 35, L19816, https://doi.org/10.1029/2008GL035237, 2008. a
Spackman, J. R., Gao, R. S., Neff, W. D., Schwarz, J. P., Watts, L. A., Fahey, D. W., Holloway, J. S., Ryerson, T. B., Peischl, J., and Brock, C. A.: Aircraft observations of enhancement and depletion of black carbon mass in the springtime Arctic, Atmos. Chem. Phys., 10, 9667–9680, https://doi.org/10.5194/acp-10-9667-2010, 2010. a
Sprenger, M. and Wernli, H.: The LAGRANTO Lagrangian analysis tool – version 2.0, Geosci. Model Dev., 8, 2569–2586, https://doi.org/10.5194/gmd-8-2569-2015, 2015. a
Stephens, M., Turner, N., and Sandberg, J.: Particle identification by laser-induced incandescence in a solid-state laser cavity, Appl. Opt., 42, 3726–3736, https://doi.org/10.1364/AO.42.003726, 2003. a
Stickney, T. M., Shedlov, M. W., and Thompson, D. I.: Total Temperature Sensors Technical Report 5755, Tech. rep., Goodrich Sensor Systems, Burnsville, MN, 1994. a
Stohl, A.: Characteristics of atmospheric transport into the Arctic troposphere, J. Geophys. Res.-Atmos., 111, D11306, https://doi.org/10.1029/2005JD006888, 2006. a, b, c, d, e, f
Stohl, A., Klimont, Z., Eckhardt, S., Kupiainen, K., Shevchenko, V. P., Kopeikin, V. M., and Novigatsky, A. N.: Black carbon in the Arctic: the underestimated role of gas flaring and residential combustion emissions, Atmos. Chem. Phys., 13, 8833–8855, https://doi.org/10.5194/acp-13-8833-2013, 2013. a, b, c, d
Stohl, A., Aamaas, B., Amann, M., Baker, L. H., Bellouin, N., Berntsen, T. K., Boucher, O., Cherian, R., Collins, W., Daskalakis, N., Dusinska, M., Eckhardt, S., Fuglestvedt, J. S., Harju, M., Heyes, C., Hodnebrog, Ø., Hao, J., Im, U., Kanakidou, M., Klimont, Z., Kupiainen, K., Law, K. S., Lund, M. T., Maas, R., MacIntosh, C. R., Myhre, G., Myriokefalitakis, S., Olivié, D., Quaas, J., Quennehen, B., Raut, J.-C., Rumbold, S. T., Samset, B. H., Schulz, M., Seland, Ø., Shine, K. P., Skeie, R. B., Wang, S., Yttri, K. E., and Zhu, T.: Evaluating the climate and air quality impacts of short-lived pollutants, Atmos. Chem. Phys., 15, 10529–10566, https://doi.org/10.5194/acp-15-10529-2015, 2015. a
Stone, R. S., Herber, A., Vitale, V., Mazzola, M., Lupi, A., Schnell, R. C., Dutton, E. G., Liu, P. S. K., Li, S.-M. M., Dethloff, K., Lampert, A., Ritter, C., Stock, M., Neuber, R., and Maturilli, M.: A three-dimensional characterization of Arctic aerosols from airborne Sun photometer observations: PAM-ARCMIP, April 2009, J. Geophys. Res.-Atmos., 115, D13203, https://doi.org/10.1029/2009JD013605, 2010. a
Stone, R. S., Herber, S. S. A., Nelson, K. E. D. W., Sharma, S., Herber, A. B., Eleftheriadis, K., and Nelson, D. W.: A characterization of Arctic aerosols on the basis of aerosol optical depth and black carbon measurements, Elem. Sci. Anthr., 2, 1–22, https://doi.org/10.12952/journal.elementa.000027, 2014. a
Streets, D. G., Bond, T. C., Carmichael, G. R., Fernandes, S. D., Fu, Q., He, D., Klimont, Z., Nelson, S. M., Tsai, N. Y., Wang, M. Q., Woo, J.-H., and Yarber, K. F.: An inventory of gaseous and primary aerosol emissions in Asia in the year 2000, J. Geophys. Res.-Atmos., 108, 8809, https://doi.org/10.1029/2002JD003093, 2003. a
Taketani, F., Miyakawa, T., Takashima, H., Komazaki, Y., Pan, X., Kanaya, Y., and Inoue, J.: Shipborne observations of atmospheric black carbon aerosol particles over the Arctic Ocean, Bering Sea, and North Pacific Ocean during September 2014, J. Geophys. Res.-Atmos., 121, 1914–1921, https://doi.org/10.1002/2015JD023648, 2016. a, b
Taylor, J. W., Allan, J. D., Allen, G., Coe, H., Williams, P. I., Flynn, M. J., Le Breton, M., Muller, J. B. A., Percival, C. J., Oram, D., Forster, G., Lee, J. D., Rickard, A. R., Parrington, M., and Palmer, P. I.: Size-dependent wet removal of black carbon in Canadian biomass burning plumes, Atmos. Chem. Phys., 14, 13755–13771, https://doi.org/10.5194/acp-14-13755-2014, 2014. a
Tunved, P., Ström, J., and Krejci, R.: Arctic aerosol life cycle: linking aerosol size distributions observed between 2000 and 2010 with air mass transport and precipitation at Zeppelin station, Ny-Ålesund, Svalbard, Atmos. Chem. Phys., 13, 3643–3660, https://doi.org/10.5194/acp-13-3643-2013, 2013. a
Tuzet, F., Dumont, M., Lafaysse, M., Picard, G., Arnaud, L., Voisin, D., Lejeune, Y., Charrois, L., Nabat, P., and Morin, S.: A multilayer physically based snowpack model simulating direct and indirect radiative impacts of light-absorbing impurities in snow, The Cryosphere, 11, 2633–2653, https://doi.org/10.5194/tc-11-2633-2017, 2017. a
Wang, Q., Jacob, D. J., Fisher, J. A., Mao, J., Leibensperger, E. M., Carouge, C. C., Le Sager, P., Kondo, Y., Jimenez, J. L., Cubison, M. J., and Doherty, S. J.: Sources of carbonaceous aerosols and deposited black carbon in the Arctic in winter-spring: implications for radiative forcing, Atmos. Chem. Phys., 11, 12453–12473, https://doi.org/10.5194/acp-11-12453-2011, 2011. a
Wernli, H. and Davies, H. C.: A Lagrangian-based analysis of extratropical cyclones .1. The method and some applications, Q. J. Roy. Meteor. Soc., 123, 467–489, https://doi.org/10.1256/smsqj.53810, 1997. a
Winiger, P., Andersson, A., Eckhardt, S., Stohl, A., Semiletov, I. P., Dudarev, O. V., Charkin, A., Shakhova, N., Klimont, Z., Heyes, C., and Gustafsson, Ö.: Siberian Arctic black carbon sources constrained by model and observation, P. Natl. Acad. Sci. USA, 114, E1054–E1061, https://doi.org/10.1073/pnas.1613401114, 2017. a
Yang, Q., Bitz, C. M., and Doherty, S. J.: Offsetting effects of aerosols on Arctic and global climate in the late 20th century, Atmos. Chem. Phys., 14, 3969–3975, https://doi.org/10.5194/acp-14-3969-2014, 2014. a
Zanatta, M., Laj, P., Gysel, M., Baltensperger, U., Vratolis, S., Eleftheriadis, K., Kondo, Y., Dubuisson, P., Winiarek, V., Kazadzis, S., Tunved, P., and Jacobi, H.-W.: Effects of mixing state on optical and radiative properties of black carbon in the European Arctic, Atmos. Chem. Phys., 18, 14037–14057, https://doi.org/10.5194/acp-18-14037-2018, 2018. a, b, c