the Creative Commons Attribution 4.0 License.
the Creative Commons Attribution 4.0 License.
 | 21 Feb 2019
Primary emissions versus secondary formation of fine particulate matter in the most polluted city (Shijiazhuang) in North China
Ru-Jin Huang
Yichen Wang
Junji Cao
Chunshui Lin
Jing Duan
Yongjie Li
Yifang Gu
Jin Yan
Roman Fröhlich
Francesco Canonaco
Carlo Bozzetti
Jurgita Ovadnevaite
Darius Ceburnis
Manjula R. Canagaratna
John Jayne
Douglas R. Worsnop
Imad El-Haddad
André S. H. Prévôt
Colin D. O'Dowd
Particulate matter (PM) pollution is a severe environmental problem in the Beijing–Tianjin–Hebei (BTH) region in North China. PM studies have been conducted extensively in Beijing, but the chemical composition, sources, and atmospheric processes of PM are still relatively less known in nearby Tianjin and Hebei. In this study, fine PM in urban Shijiazhuang (the capital of Hebei Province) was characterized using an Aerodyne quadrupole aerosol chemical speciation monitor (Q-ACSM) from 11 January to 18 February in 2014. The average mass concentration of non-refractory submicron PM (diameter <1 µm, NR-PM1) was 178±101 µg m−3, and it was composed of 50 % organic aerosol (OA), 21 % sulfate, 12 % nitrate, 11 % ammonium, and 6 % chloride. Using the multilinear engine (ME-2) receptor model, five OA sources were identified and quantified, including hydrocarbon-like OA from vehicle emissions (HOA, 13 %), cooking OA (COA, 16 %), biomass burning OA (BBOA, 17 %), coal combustion OA (CCOA, 27 %), and oxygenated OA (OOA, 27 %). We found that secondary formation contributed substantially to PM in episodic events, whereas primary emissions were dominant (most significant) on average. The episodic events with the highest NR-PM1 mass range of 300–360 µg m−3 were comprised of 55 % of secondary species. On the contrary, a campaign-average low OOA fraction (27 %) in OA indicated the importance of primary emissions, and a low sulfur oxidation degree () of 0.18 even at RH >90 % hinted at insufficient oxidation. These results suggested that in Shijiazhuang in wintertime fine PM was mostly from primary emissions without sufficient atmospheric aging, indicating opportunities for air quality improvement by mitigating direct emissions. In addition, secondary inorganic and organic (OOA) species dominated in pollution events with high-RH conditions, most likely due to enhanced aqueous-phase chemistry, whereas primary organic aerosol (POA) dominated in pollution events with low-RH and stagnant conditions. These results also highlighted the importance of meteorological conditions for PM pollution in this highly polluted city in North China.
- Article
(1570 KB) - Full-text XML
-
Supplement
(419 KB) - BibTeX
- EndNote


Particulate pollution in China is a serious environmental problem, influencing air quality, regional and global climate, and human health. Especially during recent winters, large-scale and severe haze pollution has brought China's particulate pollution at the forefront of world-wide media and has evoked great scientific interest in air pollution studies. Measurements at a number of major cities showed that the wintertime daily average mass concentrations of PM2.5 (particulate matter with an aerodynamic diameter <2.5 µm) are approximately 1–2 orders of magnitude higher than those observed in urban areas in the US and Europe (Huang et al., 2014). Severe particulate pollution is often accompanied by extremely poor visibility and poor air quality leading to a sharp increase in respiratory diseases. Long-term exposure to high levels of particulate pollution was estimated to have resulted in 1.1 million deaths in China in 2015, ranking China first in the world with respect to air-pollution-related mortality (Cohen et al., 2017).
The Beijing–Tianjin–Hebei (BTH) region is one of the important city clusters in China, but also suffers from serious air pollution. Seven cities in this region ranked the top 10 most polluted cities in China in the year 2014–2015 (http://www.zhb.gov.cn, last acces: 7 February 2017). The urgent need for an air quality improvement in this region has been recognized by central and local governments as well as the public, which has led to mitigating actions being undertaken by the authorities. In particular, various emission control measures have been implemented in this region to clean Beijing's air, e.g., during the 2014 Asia-Pacific Economic Cooperation (APEC) summit. These temporal measures include the odd–even ban on vehicles and shutdowns of factories and construction sites, which have led to serious side effects on daily life and economic growth. Therefore, the identification of the major sources and atmospheric processes producing airborne particles is required for implementing targeted and optimized emission control strategies.
The first step for quantifying PM sources requires the measurement of inorganic and organic tracers and/or mass spectrometric fingerprints of ambient PM samples. This can be realized by online ambient measurements using aerosol mass spectrometric (AMS) techniques to determine aerosol composition (Jimenez et al., 2009; Ng et al., 2011b; Elser et al., 2016b). In particular, the quadrupole aerosol chemical speciation monitor (Q-ACSM) and, recently, the time-of-flight aerosol chemical speciation monitor (TOF-ACSM) have been developed for long-term continuous measurements of non-refractory submicron aerosols (Ng et al., 2011a; Fröhlich et al., 2013). Aerosol sources have been successfully identified from AMS measurements using positive matrix factorization (PMF) analysis (Ulbrich et al., 2009; Crippa et al., 2013; Elser et al., 2016a). In terms of Q-ACSM data sets, the use of PMF often fails to resolve sources with similar mass spectral profiles, e.g., the mixing of cooking organic aerosol with traffic organic aerosol in Nanjing (Zhang et al., 2015), or those present in low contributions, e.g., the lack of success in resolving a factor related to biomass burning in Beijing (Jiang et al., 2015). It has also been pointed out that PMF cannot separate the aerosol sources of temporal covariations driven by low temperature and periods of strong inversions (Canonaco et al., 2013; Reyes-Villegas et al., 2016). Several source apportionment studies (in which PMF did not find optimal results) have utilized the multilinear engine (ME-2) solver, which enables the constraint of the factor profiles/time series, providing a superior separation of the PM sources (e.g., Canonaco et al., 2013, 2015; Fröhlich et al., 2015a, b; Minguillón et al., 2015; Petit et al., 2015; Ripoll et al., 2015; Reyes-Villegas et al., 2016; Bressi et al., 2016; Schlag et al., 2016; Wang et al., 2017; Zhu et al., 2018). However, studies using ME-2 to resolve OA sources from the ACSM measurements are scarce in the BTH region.
Apart from the lack of applications of ME-2 for OA source apportionment, most field studies have mainly focused on the aerosol pollution in Beijing (Sun et al., 2013, 2014, 2016; Jiang et al., 2015; Xu et al., 2015; Elser et al., 2016a; Hu et al., 2016a). These and related studies have clearly shown that Beijing is sensitive to the regional transport of aerosols from its surrounding areas (Xu et al., 2008; Zhang et al., 2012; P. Li et al., 2015). For example, Guo et al. (2010) estimated that the regional pollutants accounted for 69 % of PM10 and 87 % of PM1.8 on average in Beijing during summer, with sulfate, ammonium, and oxalate mostly formed regionally (regional contributions >87 %). Sun et al. (2014) reported that 66 % of NR-PM1 was from regional transport in Beijing during the 2013 winter haze event. Among the surrounding areas of Beijing, the Hebei Province is the main source area leading to high aerosol loadings in Beijing (Chen et al., 2007; Xu et al., 2008; Lang et al., 2013; P. Li et al., 2015).
Shijiazhuang, the capital of Hebei Province, is located ∼270 km south of Beijing and has a population approximately half that of Beijing. P. Zhao et al. (2013) and P. S. Zhao et al. (2013) characterized the spatial and seasonal variations of the PM2.5 chemical composition in the BTH region, and Shijiazhuang was selected as the representative of the polluted cities in Hebei Province. The off-line analysis results showed that organic carbon (OC) and elemental carbon (EC) concentrations in Shijiazhuang were lower in the spring and summer than those in the autumn and winter. The sum of secondary inorganic species (, , and ) was highest in the autumn. However, the temporal profiles of PM composition cannot be captured by off-line analyses, hindering more detailed study of the sources and formation of PM. In this work, we present for the first time the 30 min time resolved NR-PM1 measurements in Shijiazhuang during the winter heating season. The characteristics of NR-PM1 are analyzed, which include the following: (1) time series, mass fraction, and diurnal variation of NR-PM1 species; (2) multilinear engine (ME-2)-resolved OA sources and their mass fraction as well as their diurnal variation; and (3) the characteristics and atmospheric evolution of aerosol composition and sources under different aerosol loadings and meteorological conditions.
2.1 Sampling site
Shijiazhuang, the capital of Hebei Province, is located ∼270 km south of Beijing. In 2014, ∼10 million residents and 2.1 million vehicles were reported in this city. It is often ranked first on the list of the top 10 most polluted cities in China, especially during wintertime heating periods (from 15 November to 15 March of the next year). For example, the average concentration of PM2.5 was 226.5 µg m−3 with a peak hourly concentration of 933 µg m−3 during the 2013–2014 wintertime heating period, largely exceeding the Chinese air pollution limit of 75 µg m−3. In this study, we performed an intensive field measurement campaign at an urban site in Shijiazhuang to investigate the chemical composition, sources, and atmospheric processes of fine particles. The campaign was carried out from 11 January to 18 February 2014 on the building roof (15 m) of the Institute of Genetics and Developmental Biology, Chinese Academy of Sciences ( N, E), a site located in a residential–business mixed zone.
2.2 Instrumentation
NR-PM1 was measured using an Aerodyne quadrupole aerosol chemical speciation monitor (Q-ACSM), which can provide quantitative mass concentration and mass spectra of non-refractory species including organics, sulfate, nitrate, ammonium, and chloride. The operation principles of Q-ACSM can be found elsewhere (Ng et al., 2011a). The ambient aerosol was drawn through a Nafion dryer (Perma Pure PD-50T-24SS) following a URG cyclone (model: URG-2000-30ED) with a cutoff size of 2.5 µm to remove coarse particles. The sampling flow was ∼3 L min−1, of which ∼85 mL min−1 was isokinetically sampled into the Q-ACSM. The residence time in the sampling tube was ∼5 s. The Q-ACSM was operated with a time resolution of 30 min and scanned from m∕z 10 to 150 at 200 ms amu−1. Dry monodispersed 300 nm ammonium nitrate and ammonium sulfate particles (selected by a differential mobility analyzer, DMA, TSI model 3080) were nebulized from a custom-built atomizer and sampled into the Q-ACSM and a condensation particle counter (CPC, TSI model 3772) calibrating ionization efficiency (IE). Therefore, IE can be determined by comparing the response factors of Q-ACSM to the mass calculated with the known particle size and the number concentration from the CPC.
Ozone (O3) was measured by a Thermo Scientific Model 49i ozone analyzer, CO by a Thermo Scientific Model 48i carbon monoxide analyzer, SO2 by an Ecotech EC 9850 sulfur dioxide analyzer, and NO2 by a Thermo Scientific Model 42i NO–NO2–NOx analyzer. The meteorological data, including temperature, relative humidity (RH), precipitation, wind speed, and wind direction, were measured by an automatic weather station (MAWS201, Vaisala, Vantaa, Finland) and a wind sensor (Vaisala Model QMW101-M2).
2.3 Data analysis
2.3.1 Q-ACSM data analysis
The mass concentrations and composition of NR-PM1 were analyzed with the standard Q-ACSM data analysis software written in Igor Pro (WaveMetrics, Inc., OR, USA). Standard relative ionization efficiencies (RIEs) were used for organics, nitrate, and chloride (i.e., 1.4 for organics, 1.1 for nitrate, and 1.3 for chloride) (Ng et al., 2011a), and RIEs for ammonium (6.0) and sulfate (1.2) were derived from the IE calibrations. The particle collection efficiency (CE) was applied to correct for the particle loss at the vaporizer due to particle bounce, which is influenced by aerosol acidity, composition, and the aerosol water content. Given that aerosol was dried before entering into Q-ACSM and that the ammonium nitrate mass fraction (ANMF) during the observation period was lower than 0.4, the composition dependent CE was estimated following the method described in Middlebrook et al. (2012).
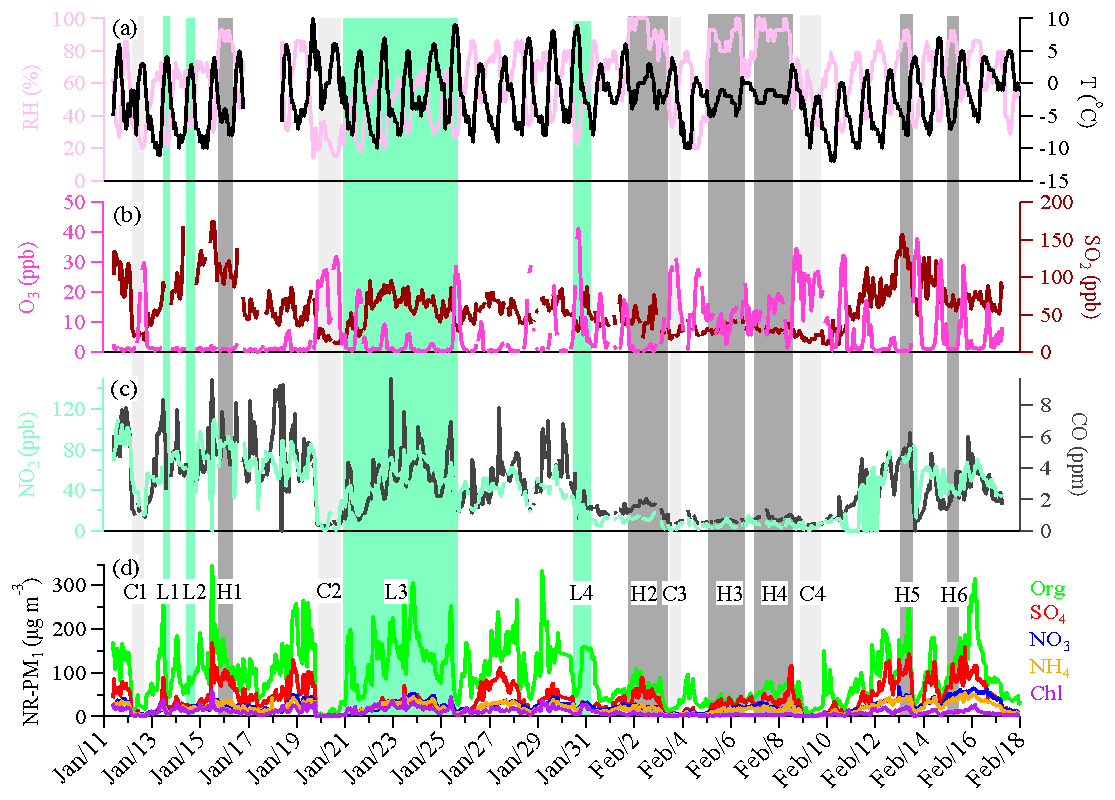
Figure 1Time series of relative humidity and temperature (a), O3 and SO2 (b), NO2 and CO (c), and the NR-PM1 species (d) during the observation period. Six high-RH (>80 %) polluted episodes (H1–H6), four low-RH (<60 %) polluted episodes (L1–L4), and four clean episodes (C1–C4) are marked for further discussion.
2.3.2 The multilinear engine (ME-2)
PMF is a bilinear receptor model that represents an input data matrix as a linear combination of a set of factor profiles and their time-dependent concentrations (Paatero and Tapper, 1994). Factors typically correspond to unique sources and/or processes. This allows for a quantitative apportionment of bulk mass spectral time series into several factors through the minimization of a quantity Q, which is the sum of the squares of the error-weighted residuals of the model. The PMF-AMS/ACSM analyses have been widely used for apportioning the sources of organic aerosol. However, in conventional PMF analyses, rotational ambiguity with limited rotational controls can lead to unclear factor resolution, especially in China where the emission sources are very complex and covariant during haze events. In contrast, the multilinear engine (ME-2), used in this study, enables efficient exploration of the entire solution space and can direct the apportionment towards an environmentally meaningful solution through the constraints of a subset of a priori factor profiles or time series using the a value approach (Canonaco et al., 2013). The a value can vary between 0 and 1. An a value of 0.1 accounts for maximum ±10 % variability of each m∕z signal of the final solution spectra that may differ from the anchor, implying that some m∕z signals might increase while some might decrease. The source finder (SoFi, Canonaco et al., 2013) tool version 4.9 for Igor Pro was used for ME-2 input preparation and result analysis. The number of factors resolved is determined by the user and the solutions of the model are not mathematically unique due to rotational ambiguity. Therefore, it is critical to study other parameters, e.g., the chemical fingerprint of the factor profiles, diurnal cycles, and time series of factors and external measurements, to support factor identification and interpretation (Canonaco et al., 2013; Crippa et al., 2014; Elser et al., 2016b).
3.1 Concentration and chemical composition of NR-PM1
Figure 1 shows the time series of NR-PM1 species, trace gases, and meteorological conditions during the entire measurement period. The measured mass concentrations of NR-PM1 for the entire campaign period ranged from a few to 508.4 µg m−3, with an average of 178±101 µg m−3. That was much higher than the wintertime/summertime concentrations measured in many other cities (see Table 1). The mass concentration of NR-PM1 correlated strongly with that of PM2.5 (R2=0.76) with a regression slope of 0.72, indicating that NR-PM1 represents a majority of PM2.5 mass. The NR-PM1 concentrations exceeded the Chinese PM2.5 limit of 75 µg m−3 for 90 % of days during the measurement period, showing the severity of particulate air pollution at Shijiazhuang.
Table 1The fine PM mass concentrations and fractional contribution of different compositions at different locations.

* NR-PM2.5
Similar to measurements at other urban sites, OA was the dominant fraction of NR-PM1, with an average of 50 % (31 %–80 %), followed by 21 % of sulfate (4 %–36 %), 12 % of nitrate (2 %–26 %), 11 % of ammonium (4 %–21 %), and 6 % of chloride (2 %–20 %). The dominant contribution of organics in NR-PM1 is also consistent with measurements from other urban sites in the BTH region during winter heating seasons (see Table 1). Sulfate was the second largest contributor to NR-PM1. The large fraction of sulfate was likely associated with the large consumption of coal in Hebei Province, i.e., 296 million tons was used in coal-fired power plants and steel industry (producing ∼11 % of global steel output) in 2014. The enhancement of chloride fraction from >1 % to 4 % in other Chinese cities in summer (see Table 1) to 6 % in Shijiazhuang in winter (within the range of >2 %–7 % in other Chinese cities in winter, see Table 1) can be attributed to the substantial emissions from coal and/or biomass burning activities.
Figure 2a shows the diurnal variations of NR-PM1 components, which were affected by the evolution of the planetary boundary layer (PBL) height that governed the vertical dispersion of pollutants and by the diurnal cycle of the emissions and atmospheric processes. The concentrations of pollutants increased at night as a result of enhanced emissions from residential heating (in particular, for organics and chloride) and a progressively shallower PBL. During daytime the PBL height was developed by solar radiation; thus, the pollutants became diluted resulting in the decrease of organics, sulfate, ammonium, and chloride in the afternoon. In contrast, the concentrations of nitrate increased after sunrise but then remained rather constant throughout the afternoon, suggesting a strong source or production of nitrate which offsets the dilution from PBL development. To minimize the effects of PBL heights, data were normalized by ΔCO. CO is often used as an emission tracer to account for dilution on timescales of hours to days because of its relatively long lifetime against oxidation by OH radicals (approximately 1 month) (DeCarlo et al., 2010). After offsetting the PBL dilution effect, sulfate, nitrate, and ammonium showed clear increases from 07:00 to 15:00 LT (local time; Fig. 2c), indicating the efficient daytime production of these secondary inorganic species. It should be noted that the increase of nitrate (about 2 times, from ∼6 to ∼12 ) is slightly larger than that of sulfate (about 1.6 times, from ∼11 to ∼17.5 ), indicating more efficient photochemical production of nitrate than sulfate, given that the loss rate of sulfate could not be higher than that of nitrate as nitric acid is semi-volatile and may be further lost by evaporation. Furthermore, the continuous increase of organics after sunrise suggested efficient photochemical production of secondary organic aerosol (SOA).
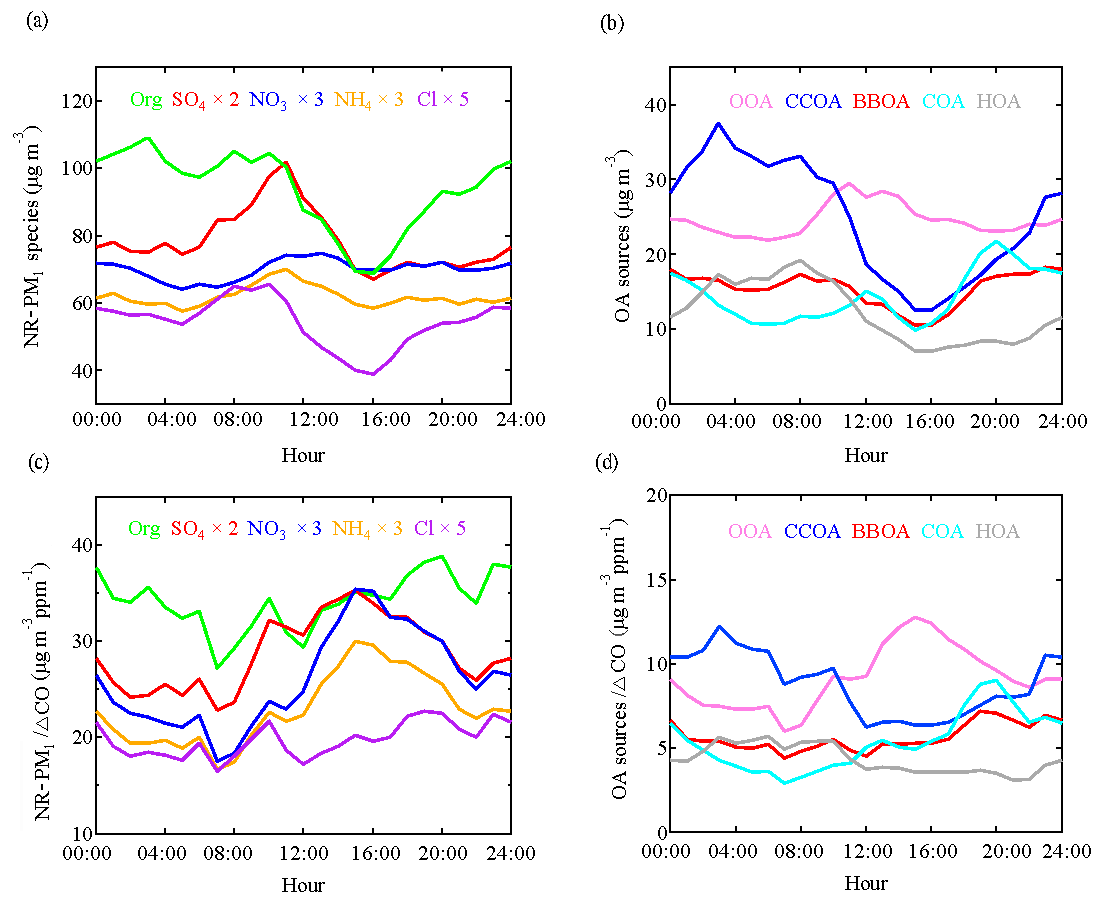
Figure 2Diurnal variations of NR-PM1 composition (a), OA sources (b), NR-PM1 species∕ΔCO (c), and OA sources∕ΔCO (d).
3.2 Sources of organic aerosol
From the PMF analysis, we first examined a range of solutions with three to eight factors. The solution that best represents the data is the five-factor solution (Fig. S1 in the Supplement). The solutions with factor numbers more than five provide no new meaningful factors (see Fig. S2 and more details in the Supplement).
Although the five-factor solution can reasonably represent the data, HOA is still mixed with BBOA because the HOA profile contains a higher than expected contribution from m∕z 60. In addition, COA contains no signal at m∕z 44, which might indicate a suboptimal splitting between the contributing sources. To better separate HOA from BBOA, we constrained the HOA profile from Ng et al. (2011b), which is an average profile over 15 cities from China, Japan, Europe, and the US. Although gasoline vehicles dominate in China while diesel vehicles dominate in Europe, HOA mass spectra do not show significant variability when compared to different sites in China and Europe (Ng et al., 2011b; Reyes-Villegas et al., 2016; Bozzetti et al., 2017), indicating that traffic emissions from different types of vehicles have similar profiles. To avoid the influences of other sources on COA, the COA profile from Paris (Crippa et al., 2013) was used as a constraint because high similarities were found between the COA profile from Paris and four COA profiles from different types of Chinese cooking activities (He et al., 2010; Crippa et al., 2013). However, the constraint on HOA and COA profiles still seems to sub-optimally resolve the apportionment of BBOA from CCOA, as one unconstrained factor contains high contributions from both m∕z 60 and PAH-related m∕z's (m∕z 77, 91, and 115, as shown in Fig. S3) which indicates the mixing between BBOA and CCOA. To separate BBOA and CCOA, we constrained BBOA using the average of BBOA profiles from the five-factor unconstrained PMF solutions.
To explore the solution space, an a value of 0–0.5 with an interval of 0.1 was used to constrain both the HOA and COA reference profiles from literature while BBOA was constrained with an a value of 0 because the BBOA profile was resolved from an unconstrained PMF solution which is not expected to vary significantly. Thirty-six possible results were obtained by limiting the range of a values. Three criteria for optimizing OA source appointment are as follows:
-
The diurnal pattern of COA. The diurnal cycle of COA should have higher concentrations during mealtimes.
-
Minimization of m/z 60 in HOA. The upper limit of m∕z 60 in the HOA profile is 0.006, which is the maximal fractional contribution derived from multiple ambient data sets in different regions (mean +2σ) (Ng et al., 2011b).
-
The rationality of unconstrained factors. OOA should have abundant signal at m∕z 44 and should contain much lower signals at PAH-related ion peaks compared with CCOA.
Nine solutions match the criteria above. Therefore, the final time series and mass spectra are the averages of these nine solutions. The diurnal variations of mass concentrations of the OA factors and their PBL-corrected results are shown in Fig. 2b and d, respectively. The mass spectra and time series of the OA factors and their correlation with external tracers are shown in Fig. 3. The relative contributions of each OA source to the m∕z's are shown in Fig. S4. Potential source contribution function (PSCF) analysis was also performed and the result is shown in Fig. S5.
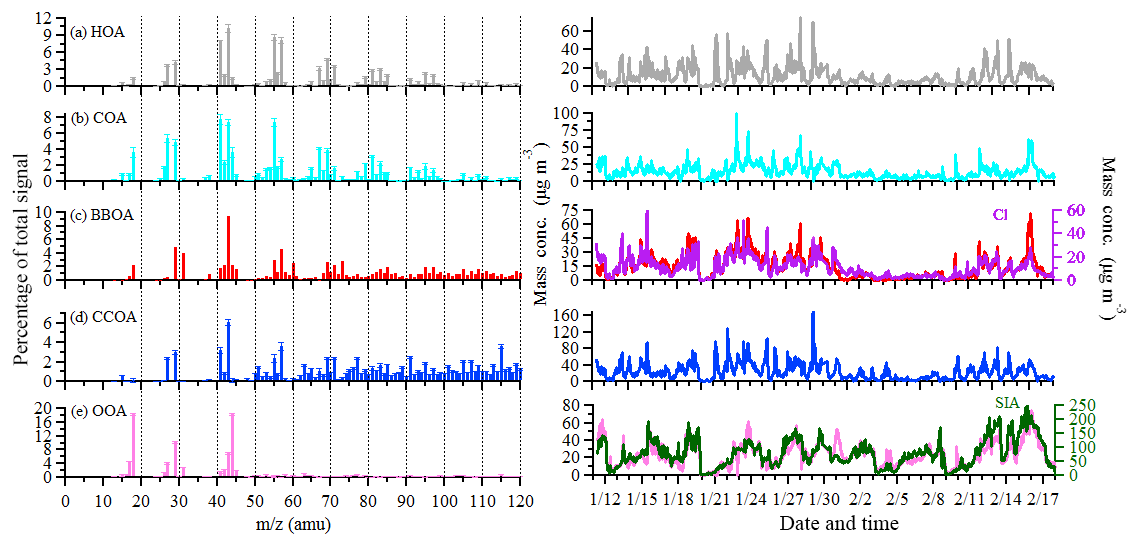
Figure 3Mass spectrums (left) and time series (right) of five OA sources. Error bars of the mass spectrums represent the standard deviation of each m∕z over all accepted solutions.
OOA is characterized by high signals at m∕z 44 () and m∕z 43 ( or C2H3O+) and accounts for 85 % of m∕z 44 signal, which is much higher than other OA sources. The time series of OOA is highly correlated with that of sulfate (R2=0.70), nitrate (R2=0.75), and ammonium (R2=0.76), confirming the secondary nature of this factor. The diurnal cycle of OOA shows an increase from 07:00 to 11:00 LT, followed by a decrease in the afternoon due to the PBL evolution effect. After normalizing the PBL effect, OOA increased continuously from 07:00 to 15:00 LT, indicating the importance of photochemical oxidation. This diurnal feature in combination with the PSCF results indicated that a large fraction of OOA was produced locally and/or produced from the highly populated and industrialized surrounding areas, consistent with the sulfate production discussed below.
The mass spectrum of CCOA is featured by prominent contributions of unsaturated hydrocarbons, particularly PAH-related ion peaks (e.g., 77, 91, and 115). The CCOA profile shows a weaker signal at m∕z 44 than that observed in Beijing (Hu et al., 2016a) and Lanzhou (Xu et al., 2016). This difference can be caused by the difference in coal types, burning conditions, and aging processes (Zhou et al., 2016). CCOA accounts for 42 %–66 % of PAH-related ion peaks, much higher than those in other OA sources. This result suggested that the major source of PAHs was coal combustion in Shijiazhuang in wintertime. The campaign-averaged mass concentration of CCOA was 23.2 µg m−3, which is higher than that in Xi'an (10.1 µg m−3) but is similar to that in Beijing (23.5 µg m−3) observed in the same winter (Elser et al., 2016a). Nevertheless, during haze extremes, the average CCOA concentration was 77.5 µg m−3 in Shijiazhuang, much higher than that in Beijing (48.2 µg m−3, Elser et al., 2016a). CCOA showed distinct diurnal variations with low concentrations (down to 12.6 µg m−3) during the day and high concentrations (up to 37.6 µg m−3) at night, corresponding to 19 % and 35 % of OA, respectively. The elevated CCOA concentrations at night suggested a large emission from residential heating activities using coal as the fuel compounded by the shallow PBL. The average contribution of CCOA to the total OA was 27 %, which is consistent with studies in Beijing and Handan (∼160 km south to Shijiazhuang) where CCOA was found to be the dominant primary OA (Elser et al., 2016a; Sun et al., 2016; Li et al., 2017). Given this large fraction of OA from coal combustion, mitigating residential coal combustion is of significant importance for improving air quality in the BTH regions.
The BBOA mass spectrum is featured by prominent m∕z 60 (mainly ) and 73 (mainly ) signals (He et al., 2010). These two ions ( and ) are fragments of anhydrous sugars produced from the incomplete combustion and pyrolysis of cellulose and hemicelluloses (Alfarra et al., 2007; Lanz et al., 2007; Mohr et al., 2009). Consistently, BBOA accounts for 50 % of m∕z 60 and 56 % of m∕z 73, which is much higher than those in other sources. In addition, BBOA accounts for 9 %–27 % of the PAH-related m∕z's (i.e., m∕z 77, 91, and 115), which is lower than those in CCOA but higher than those in other primary OA sources. This suggested that BBOA was also an important PAH source in Shijiazhuang in wintertime. A high correlation was found between the time series of BBOA and that of chloride (R2=0.75), the latter of which was suggested to be one of the tracers of biomass burning. BBOA accounted for 17 % of OA on average, which is higher than those (9 %–12 %) observed in Beijing during wintertime heating seasons (Elser et al., 2016a; Hu et al., 2016a; Sun et al., 2016). The higher BBOA contribution in Shijiazhuang in wintertime is likely associated with the widespread use of wood and crop residuals for heating and cooking in Shijiazhuang and surrounding areas, as supported by the PSCF results (Fig. S5).
The COA profile is characterized by a high m∕z 55∕57 ratio of 2.7, which is much higher than that in non-cooking POA (0.6–1.1) but within the range of 2.2–2.8 in COA profiles reported by Mohr et al. (2012). COA shows a clear diurnal cycle with distinct peaks at lunchtime (between 11:00 and 13:00 LT) and dinnertime (between 19:00 and 21:00 LT). A small peak was also observed in the morning between 06:00 and 07:00 LT, consistent with breakfast time. COA accounted for 16 % of total OA on average with the highest contribution of 24 % during dinnertime.
The HOA mass spectrum is dominated by hydrocarbon ion series of and (Canagaratna et al., 2004; Mohr et al., 2009). The diurnal variation of HOA is featured by a high concentration at night, likely due to enhanced truck emissions (only allowed to drive on the road between 23:00 and 06:00 LT) and a shallow PBL at night. Similar diurnal cycles were found in Beijing and Xi'an in wintertime (Sun et al., 2016; Elser et al., 2016a). HOA, on average, accounted for 13 % of total OA for the entire observation period, which was higher than that in Beijing (9 %–10 %) but lower than that in Xi'an (15 %) measured in the same winter (Elser et al., 2016a; Sun et al., 2016).
3.3 Chemical nature and sources at different PM levels
Figure 4 shows the mass fractions of NR-PM1 species and OA sources on reference days and extremely polluted days. Here, the days with a NR-PM1 daily average mass concentration higher than the 75th percentile (i.e., ≥238 µg m−3) are denoted as extremely polluted days and the rest of days are as designated as reference days. The average concentration of NR-PM1 was 310 µg m−3 during extremely polluted days, about 2 times higher than that during reference days (162 µg m−3). The average concentration of secondary inorganic aerosol was 65 µg m−3 (40 % of NR-PM1 mass) during reference days and increased to 143 µg m−3 (46 % of NR-PM1 mass) during extremely polluted days. Secondary organic aerosol also increased from 19 µg m−3 (22 % of OA) during reference days to 40 µg m−3 (26 % of OA) during extremely polluted days. The enhanced mass concentrations (∼2 times) of both secondary inorganic aerosol and secondary organic aerosol during extremely pollution days suggested strong secondary aerosol production during pollution events. Such enhancement was likely confounded by stagnant weather conditions (e.g., average wind speed of 0.9 m s−1) and a high RH of 69.4 % which facilitated the production and accumulation of secondary aerosol. Note that it was already very polluted during the reference days with an average NR-PM1 concentration of 162 µg m−3, which may explain the relatively small increase in the fractional contribution of secondary aerosol from reference days to extremely polluted days.
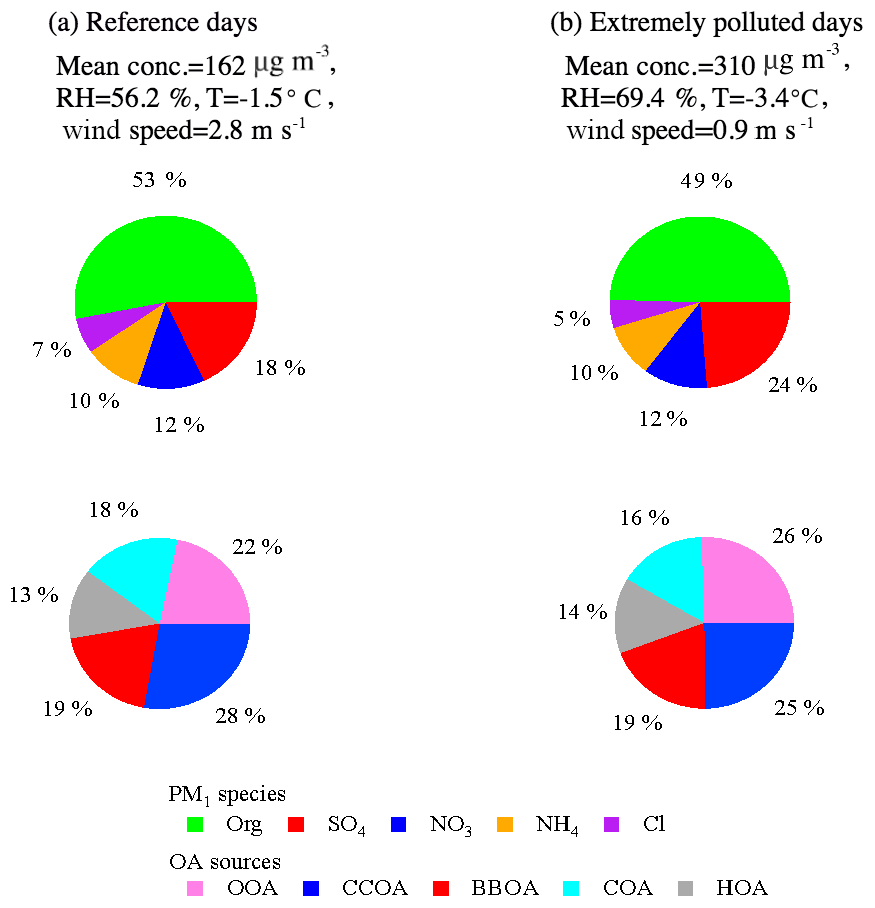
Figure 4Relative contributions of NR-PM1 species and OA sources (OOA, CCOA, BBOA, COA, and HOA) on reference days (a) and extremely polluted days (b). Extremely polluted days are defined as days with a NR-PM1 daily average mass concentration higher than the 75th percentile (237.3 µg m−3), and the remaining days are referred to the reference days. Data collected during the Chinese Spring Festival are excluded to eliminate the influence of the change in emission patterns during the holiday.
Figure 5a and b show the factors driving the pollution events by binning the fractional contribution of each chemical species and OA source to total NR-PM1 and OA mass, respectively. The data clearly show that high pollution events are characterized by an increasing secondary fraction, reaching ∼55 % at the highest NR-PM1 mass bin (300–360 µg m−3). In particular, from the lowest NR-PM1 bin to the highest NR-PM1 bin, the fractional contribution increases from 14 % to 25 % for sulfate in NR-PM1 and from 18 % to 25 % for OOA in OA, demonstrating the importance of secondary aerosol formation in driving particulate air pollution (Huang et al., 2014; Elser et al., 2016a; Wang et al., 2017). To investigate the oxidation degree of sulfur at different NR-PM1 mass, the sulfur oxidation ratio () was calculated according to Eq. (1):
where n is the molar concentration. As can be seen from Fig. 6, shows a clear increasing trend with NR-PM1 mass, climbing from 0.08 in the lowest mass bin to 0.21 in the highest mass bin. However, the highest value is still much lower than that reported in previous studies, e.g., 0.62 in Xi'an (Elser et al., 2016a), suggesting a low atmospheric oxidative capacity during the measurement period in Shijiazhuang. This may also explain the relatively low OOA fraction (see Fig. 5b). Certainly, it should be noted that the mass concentration of sulfate may also be affected by other parameters, including aerosol liquid water content, aerosol, or cloud water pH, besides atmospheric oxidative capacity.
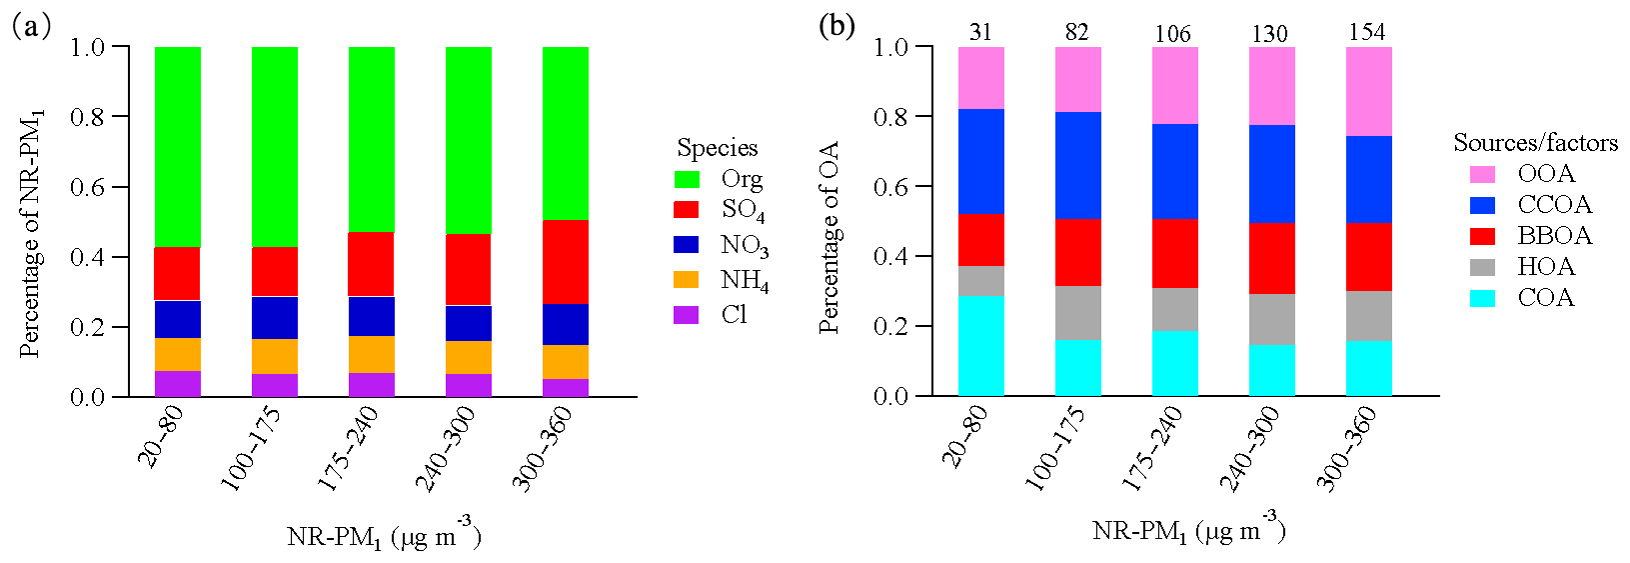
Figure 5Relative contributions of NR-PM1 species (a) and OA sources (b) as a function of the daily average NR-PM1 mass concentrations. The numbers above the bars refer to the OA mass concentration (µg m−3). Data collected during the Chinese Spring Festival are excluded to eliminate the influence of the change in emission patterns during the holiday.
3.4 Evolution of aerosol composition and sources at different RH levels
Figure 7a and b show the mass concentrations of the NR-PM1 species and of the OA sources as a function of RH, with RH bins of 10 % increments. The absolute mass concentrations of secondary inorganic species increased as RH increased from 60 %, whereas chloride showed a decreasing trend. Among the OA sources, OOA and HOA were enhanced with RH – increasing from <60 % to 90 % – whereas other OA sources did not show a clear trend. As RH increased gradually with the decrease in wind speed (Fig. 6a), the development of stagnant weather conditions (including a shallower PBL) promoted both the accumulation of pollutants and the formation of secondary aerosol (Tie et al., 2017). To minimize the effects of PBL variations, the NR-PM1 species and OA fractions were normalized by the sum of the POA, as a surrogate of secondary aerosol precursors. The resulting ratios were further normalized by the values at the first RH bin (<60 %) for better visualization. As shown in Fig. 7c, when RH increased from 60 % to 100 %, the normalized sulfate increased by a factor of ∼1.7, suggesting the importance of aqueous-phase SO2 oxidation in the formation of sulfate at high RH. The enhancements for nitrate and ammonium were slightly lower (∼1.2) compared to that of sulfate, because NH4NO3 is thermally labile and its gas–particle partitioning is affected by both temperature and RH. The importance of aqueous-phase chemistry is further supported by the increase of as a function of RH (Fig. 6b). At RH <60 %, was rather constant, with an average of 0.09, indicating a low sulfur oxidation degree. At RH >60 %, increased rapidly with the increase in RH, reaching a maximal average of 0.18 at the last RH bin (90 %–100 %). Note that the sulfur oxidation degree at high RH (>60 %) was much lower compared with those measured in Xi'an during the same winter (average 0.62 at a RH of 90 %–100 %, Elser et al., 2016a). The low sulfur oxidation degree observed in Shijiazhuang (i.e., >80 % of sulfur is still not oxidized) indicated insufficient atmospheric processing and also suggested a large fraction of pollutants in Shijiazhuang was likely emitted locally and/or transported from the heavily populated and industrialized surrounding areas. With a longer atmospheric processing time in the downwind region, e.g., Beijing, higher secondary aerosol fractions are expected, as observed in previous studies (e.g., Huang et al., 2014). Similar to sulfate, the normalized OOA increased by a factor of ∼1.2 when RH increased from 60 % to 100 % (Fig. 7d). The mass fraction of OOA increased from 29 % to 41 % when RH increased from 70 % to 100 %, whereas POA contribution decreased correspondingly from 71 % to 59 % (Fig. 6d). These results support the above discussion that aqueous-phase chemistry also plays an important role in the formation of OOA under high-RH conditions during haze pollution episodes.

Figure 6Variations of wind speed as a function of RH (a), as a function of RH (b) and of the NR-PM1 mass concentrations (c), and the mass fraction of OA as a function of RH (d).
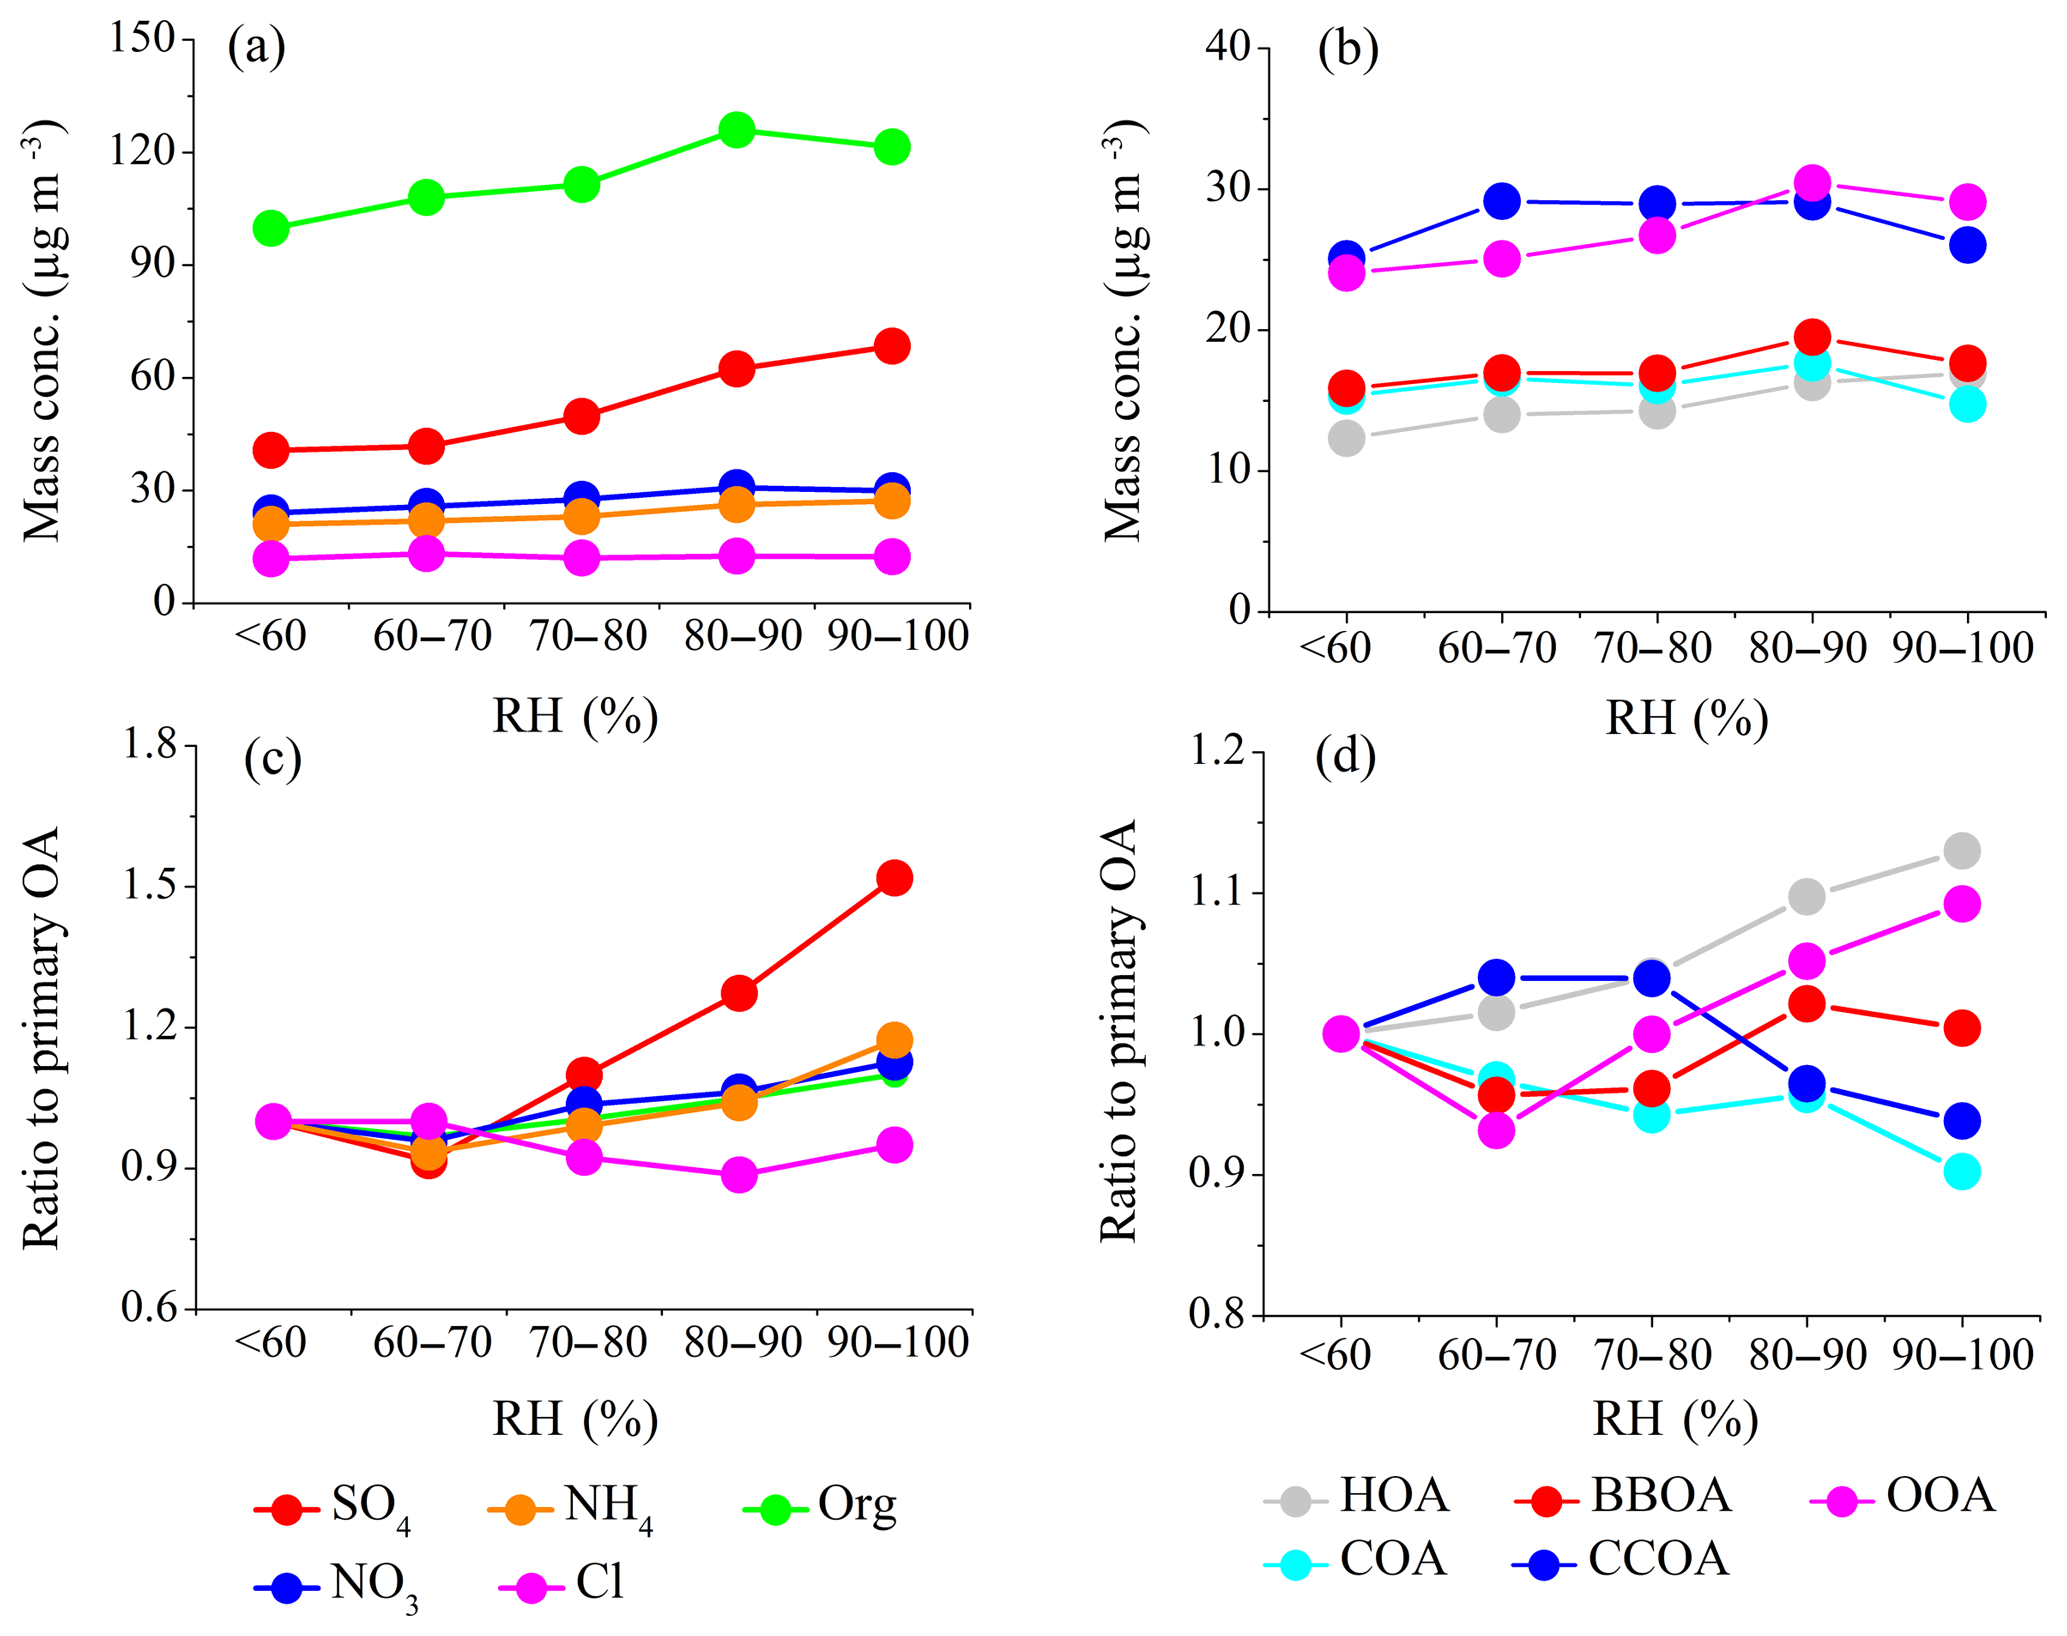
Figure 7The average mass concentration of NR-PM1 species (a) and OA sources (b) as a function of RH. The average mass concentration of NR-PM1 species (c) and OA sources (d) normalized to the sum of primary sources (HOA, COA, BBOA, and CCOA) as a function of RH. All ratios are further normalized to the values at the first RH bin (<60 %) for better illustration.
3.5 Primary emissions versus secondary formation
Frequent changes between clean and polluted episodes were observed in this study. To get a better insight into aerosol sources and atmospheric processes, four clean periods (C1–C4) with a daily average NR-PM1 mass concentration lower than the 25th percentile, six high-RH (>80 %) polluted episodes (H1–H6), and four low-RH (<60 %) polluted episodes (L1–L4) with daily average NR-PM1 mass concentration higher than the 75th percentile were selected for further analysis. As shown in Fig. 8, the chemical composition and sources differed during different episodes. The contributions of organics showed a decreasing trend, from 54 %–64 % during C1–C4 to 49 %–58 % during L1–L4, and to 35 %–44 % during H1–H6, while the corresponding contributions of secondary inorganic species increased. This indicated a notable production and accumulation of secondary inorganic aerosol during severe haze pollution events. For example, the mass fraction of sulfate in NR-PM1 was much higher during high-RH pollution events (H1–H6, 27 %–30 %) compared to those during low-RH pollution events (L1–L4, 11 %–18 %) and clean events (C1–C4, 11 %–17 %). OOA also showed a much higher contribution to OA during high-RH pollution events (H1–H6, 29 %–50 %) than during low-RH pollution events (L1–L3, 17 %–26 %) and clean events (C1–C4, 10 %–34 %). Interestingly, when comparing high-RH and low-RH pollution events of similar PM levels (Fig. 8), secondary inorganic species and OOA dominated the particulate pollution during high-RH pollution events, which was likely due to enhanced secondary formation, similar to previous studies (e.g., Wang et al., 2017), whereas POA dominated the particulate pollution at low RH and under stagnant conditions. The concentrations of POA are determined by both emissions and meteorological conditions. The different significance of primary aerosol and secondary aerosol in low- and high-RH pollution events highlights the importance of meteorological conditions in driving particulate pollution.
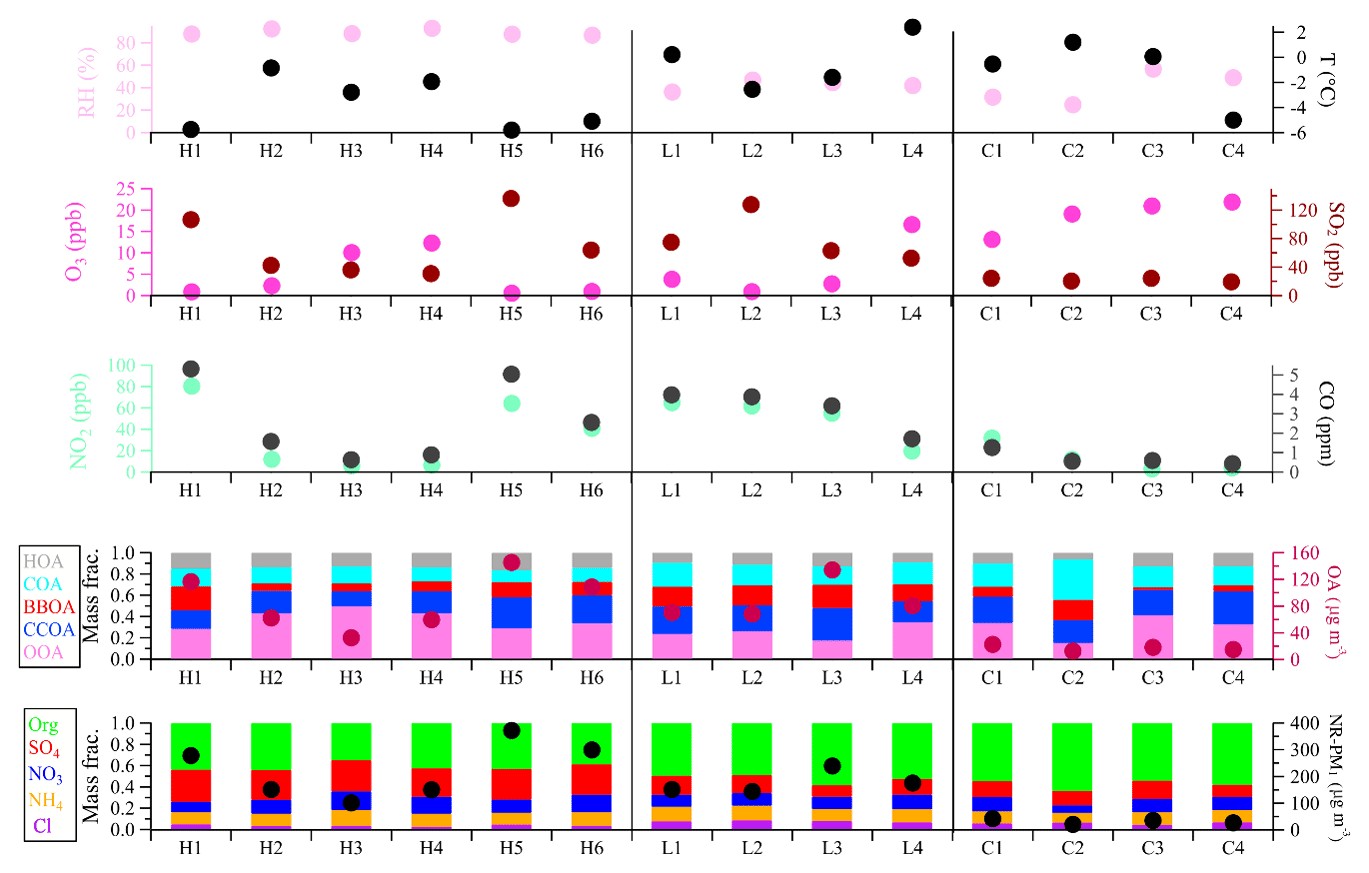
Figure 8Summary of relative humidity and temperature, gaseous species, organic sources, and NR-PM1 chemical composition for high-RH (H1–H6) polluted, low-RH (L1–L4) polluted, and clean (C1–C4) episodes.
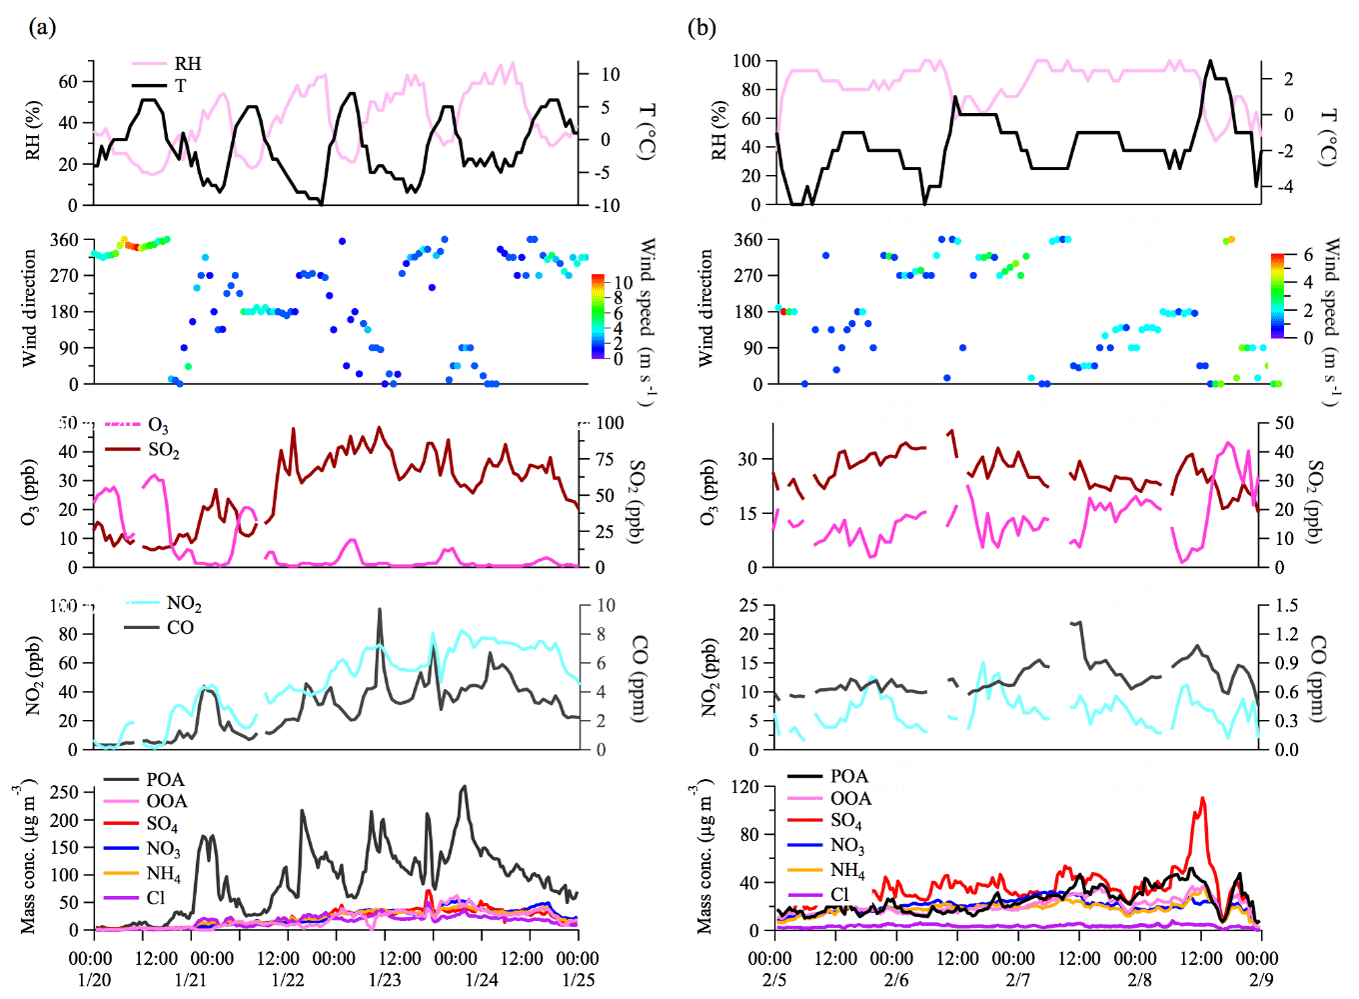
Figure 9Time series of meteorological factors (relative humidity, temperature, wind speed, and wind direction), gaseous species, OA factors, and NR-PM1 chemical composition for the first period (average RH <50 %) (a) and the second period (average RH >80 %) (b).
Figure 9 shows the evolution of aerosol species in two cases with different RH levels. The first case had an average RH <50 % from 20 to 24 January (C2 and L3 episodes). The high wind speed (>6 m s−1) from the northwest before the L3 episode led to a significant reduction of air pollutants (the C3 episode, a clean-up period). When the wind direction switched from northwest to the 90–270∘ sector and the wind speed decreased to <3 m s−1, the measured pollutants (except O3 which was reacted out by increasing NO emissions) started to build up. Specifically, NR-PM1 showed a dramatic increase by a factor of 19 over the first 11 h (from 20 January 16:00 to 21 January 03:00 LT) from 12 to 233 µg m−3. During this process POA contributed to an average 69 % of NR-PM1 mass. The other three processes were also characterized by a rapid increase of NR-PM1 mass (39–50 µg m−3 h−1) and a high contribution of POA, i.e., from 22 January 00:00–03:00, 22 January 16:00–20:00, and 23 January 12:00–19:00 LT. Such rapid increases in NR-PM1 mass under low RH were associated with stagnant weather conditions (e.g., low wind speed) which promoted the accumulation of pollutants. The second case had an average RH >80 % from 5 to 8 February (H3 and H4 episodes). In this case, the wind speed was low (<3 m s−1) throughout the 4-day period. Under these very stagnant weather conditions, POA accumulated continuously (Fig. 9). However, unlike from the low-RH case, the concentration of secondary species also showed continuous increases in this high-RH case. The enhancement of secondary aerosol formation was likely driven by aqueous-phase chemistry at high-RH levels (Elser et al., 2016a; Wang et al., 2017) and the accumulation of pollutants under stagnant weather conditions (Tie et al., 2017) which further promoted the formation of secondary species.
The chemical nature, sources, and atmospheric processes of wintertime fine particles in Shijiazhuang were investigated. The mass fractions of secondary inorganic species and SOA increased with the increase of NR-PM1 mass, suggesting the importance of secondary formation in driving PM pollution. However, the low sulfur oxidation degree and low OOA fraction indicated an insufficient atmospheric oxidation capacity. Together with the diurnal variations and PSCF results, these observations suggested that a large fraction of pollutants in Shijiazhuang was most likely produced locally and/or transported from the heavily populated and industrialized surrounding areas without sufficient atmospheric aging. Two different regimes were found to be responsible for the high PM pollution in Shijiazhuang. At low RH under stagnant weather conditions, the accumulation of primary emissions was the main culprit. In contrast, at high RH, the enhanced formation of secondary aerosol through aqueous-phase chemistry was the main issue. To conclude, we found that in this highly polluted city in North China, (1) secondary formation is important in high-PM episodes, (2) primary emissions are still important on an average basis, and (3) meteorological conditions play an key role in pollutant accumulation and transformation. Thus, the findings from this study suggest that (a) there are still opportunities for air pollution mitigation by controlling direct emissions such as coal combustion, and (b) control on precursors (e.g., NOx, SO2, and volatile organic compounds) for secondary formation, especially during high-PM episodes with unfavorable meteorological conditions, can ease the situation substantially.
All data needed to evaluate the conclusions presented in this study are present in the paper and the Supplement. Additional data related to this paper are available upon request from the corresponding author.
The supplement related to this article is available online at: https://doi.org/10.5194/acp-19-2283-2019-supplement.
RJH and JC designed the study. YW and RJH performed the measurements. RJH, YW, CL, JD, QC, and YL analyzed and interpreted the data. RJH, YW, and JD wrote the paper with contributions from all co-authors.
The authors declare that they have no conflict of interest.
This research is supported by the National Science Foundation of China (grant nos. 91644219,
41877408, and 41675120), the National Key Research and Development Program of
China (grant no. 2017YFC0212701), and EPA-Ireland (AEROSOURCE,
2016-CCRP-MS-31).
Edited by: Jianping Huang
Reviewed by: two anonymous referees
Alfarra, M. R., Prévôt, A. S. H., Szidat, S., Sandradewi, J.,Weimer, S., Schreiber, D., Mohr, M., and Baltensperger, U.: Identification of the mass spectral signature of organic aerosols from wood burning emissions, Environ. Sci. Technol., 41, 5770–5777, 2007.
Bozzetti, C., El Haddad, I., Salameh, D., Daellenbach, K. R., Fermo, P., Gonzalez, R., Minguillón, M. C., Iinuma, Y., Poulain, L., Elser, M., Müller, E., Slowik, J. G., Jaffrezo, J.-L., Baltensperger, U., Marchand, N., and Prévôt, A. S. H.: Organic aerosol source apportionment by offline-AMS over a full year in Marseille, Atmos. Chem. Phys., 17, 8247–8268, https://doi.org/10.5194/acp-17-8247-2017, 2017.
Bressi, M., Cavalli, F., Belis, C. A., Putaud, J.-P., Fröhlich, R., Martins dos Santos, S., Petralia, E., Prévôt, A. S. H., Berico, M., Malaguti, A., and Canonaco, F.: Variations in the chemical composition of the submicron aerosol and in the sources of the organic fraction at a regional background site of the Po Valley (Italy), Atmos. Chem. Phys., 16, 12875–12896, https://doi.org/10.5194/acp-16-12875-2016, 2016.
Canagaratna, M. R., Jayne, J. T., Ghertner, D. A., Herndon, S., Shi, Q., Jimenez, J. L., Silva, P. J., Williams, P., Lanni, T., Drewnick, F., Demerjian, K. L., Kolb, C. E., and Worsnop, D. R.: Chase studies of particulate emissions from in-use New York City vehicles, Aerosol Sci. Tech., 38, 555–573, 2004.
Canonaco, F., Crippa, M., Slowik, J. G., Baltensperger, U., and Prévôt, A. S. H.: SoFi, an IGOR-based interface for the efficient use of the generalized multilinear engine (ME-2) for the source apportionment: ME-2 application to aerosol mass spectrometer data, Atmos. Meas. Tech., 6, 3649–3661, https://doi.org/10.5194/amt-6-3649-2013, 2013.
Canonaco, F., Slowik, J. G., Baltensperger, U., and Prévôt, A. S. H.: Seasonal differences in oxygenated organic aerosol composition: implications for emissions sources and factor analysis, Atmos. Chem. Phys., 15, 6993–7002, https://doi.org/10.5194/acp-15-6993-2015, 2015.
Chen, D. S., Cheng, S. Y., Liu, L., Chen, T., and Guo, X. R.: An integrated MM5-CMAQ modeling approach for assessing trans-boundary PM10 contribution to the host city of 2008 Olympic summer games-Beijing, China, Atmos. Environ., 41, 1237–1250, 2007.
Cohen, A. J., Brauer, M., Burnett, R., Anderson, H. R., Frostad, J., Estep, K., Balakrishnan, K., Brunekreef, B., Dandona, L., Dandona, R., Feigin, V., Freedman, G., Hubbell, B., Jobling, A., Kan, H. D., Knibbs, L., Liu, Y., Martin, R., Morawska, L., Pope III, C. A., Shin, H., Straif, K., Shaddick, G., Thomas, M., van Dingenen, R., van Donkelaar, A., Vos, T., Murray, C. J. L., and Forouzanfar, M. H.: Estimates and 25-year trends of the global burden of disease attributable to ambient air pollution: an analysis of data from the Global Burden of Diseases Study 2015, Lancet, 389, 1907–1918, 2017.
Crippa, M., DeCarlo, P. F., Slowik, J. G., Mohr, C., Heringa, M. F., Chirico, R., Poulain, L., Freutel, F., Sciare, J., Cozic, J., Di Marco, C. F., Elsasser, M., Nicolas, J. B., Marchand, N., Abidi, E., Wiedensohler, A., Drewnick, F., Schneider, J., Borrmann, S., Nemitz, E., Zimmermann, R., Jaffrezo, J.-L., Prévôt, A. S. H., and Baltensperger, U.: Wintertime aerosol chemical composition and source apportionment of the organic fraction in the metropolitan area of Paris, Atmos. Chem. Phys., 13, 961–981, https://doi.org/10.5194/acp-13-961-2013, 2013.
Crippa, M., Canonaco, F., Lanz, V. A., Äijälä, M., Allan, J. D., Carbone, S., Capes, G., Ceburnis, D., Dall'Osto, M., Day, D. A., DeCarlo, P. F., Ehn, M., Eriksson, A., Freney, E., Hildebrandt Ruiz, L., Hillamo, R., Jimenez, J. L., Junninen, H., Kiendler-Scharr, A., Kortelainen, A.-M., Kulmala, M., Laaksonen, A., Mensah, A. A., Mohr, C., Nemitz, E., O'Dowd, C., Ovadnevaite, J., Pandis, S. N., Petäjä, T., Poulain, L., Saarikoski, S., Sellegri, K., Swietlicki, E., Tiitta, P., Worsnop, D. R., Baltensperger, U., and Prévôt, A. S. H.: Organic aerosol components derived from 25 AMS data sets across Europe using a consistent ME-2 based source apportionment approach, Atmos. Chem. Phys., 14, 6159–6176, https://doi.org/10.5194/acp-14-6159-2014, 2014.
DeCarlo, P. F., Ulbrich, I. M., Crounse, J., de Foy, B., Dunlea, E. J., Aiken, A. C., Knapp, D., Weinheimer, A. J., Campos, T., Wennberg, P. O., and Jimenez, J. L.: Investigation of the sources and processing of organic aerosol over the Central Mexican Plateau from aircraft measurements during MILAGRO, Atmos. Chem. Phys., 10, 5257–5280, https://doi.org/10.5194/acp-10-5257-2010, 2010.
Elser, M., Huang, R.-J., Wolf, R., Slowik, J. G., Wang, Q., Canonaco, F., Li, G., Bozzetti, C., Daellenbach, K. R., Huang, Y., Zhang, R., Li, Z., Cao, J., Baltensperger, U., El-Haddad, I., and Prévôt, A. S. H.: New insights into PM2.5 chemical composition and sources in two major cities in China during extreme haze events using aerosol mass spectrometry, Atmos. Chem. Phys., 16, 3207–3225, https://doi.org/10.5194/acp-16-3207-2016, 2016a.
Elser, M., Bozzetti, C., El-Haddad, I., Maasikmets, M., Teinemaa, E., Richter, R., Wolf, R., Slowik, J. G., Baltensperger, U., and Prévôt, A. S. H.: Urban increments of gaseous and aerosol pollutants and their sources using mobile aerosol mass spectrometry measurements, Atmos. Chem. Phys., 16, 7117–7134, https://doi.org/10.5194/acp-16-7117-2016, 2016b.
Fröhlich, R., Cubison, M. J., Slowik, J. G., Bukowiecki, N., Prévôt, A. S. H., Baltensperger, U., Schneider, J., Kimmel, J. R., Gonin, M., Rohner, U., Worsnop, D. R., and Jayne, J. T.: The ToF-ACSM: a portable aerosol chemical speciation monitor with TOFMS detection, Atmos. Meas. Tech., 6, 3225–3241, https://doi.org/10.5194/amt-6-3225-2013, 2013.
Fröhlich, R., Crenn, V., Setyan, A., Belis, C. A., Canonaco, F., Favez, O., Riffault, V., Slowik, J. G., Aas, W., Aijälä, M., Alastuey, A., Artiñano, B., Bonnaire, N., Bozzetti, C., Bressi, M., Carbone, C., Coz, E., Croteau, P. L., Cubison, M. J., Esser-Gietl, J. K., Green, D. C., Gros, V., Heikkinen, L., Herrmann, H., Jayne, J. T., Lunder, C. R., Minguillón, M. C., Mocnik, G., O'Dowd, C. D., Ovadnevaite, J., Petralia, E., Poulain, L., Priestman, M., Ripoll, A., Sarda-Estève, R., Wiedensohler, A., Baltensperger, U., Sciare, J., and Prévôt, A. S. H.: ACTRIS ACSM intercomparison – Part 2: Intercomparison of ME-2 organic source apportionment results from 15 individual, co-located aerosol mass spectrometers, Atmos. Meas. Tech., 8, 2555–2576, https://doi.org/10.5194/amt-8-2555-2015, 2015a.
Fröhlich, R., Cubison, M. J., Slowik, J. G., Bukowiecki, N., Canonaco, F., Croteau, P. L., Gysel, M., Henne, S., Herrmann, E., Jayne, J. T., Steinbacher, M., Worsnop, D. R., Baltensperger, U., and Prévôt, A. S. H.: Fourteen months of on-line measurements of the non-refractory submicron aerosol at the Jungfraujoch (3580 m a.s.l.) – chemical composition, origins and organic aerosol sources, Atmos. Chem. Phys., 15, 11373–11398, https://doi.org/10.5194/acp-15-11373-2015, 2015b.
Ge, X., Zhang, Q., Sun, Y. L., Ruehl, C. R., and Setyan, A.: Effect of aqueous-phase processing on aerosol chemistry and size distributions in Fresno, California, during wintertime, Environ. Chem., 9, 221–235, https://doi.org/10.1071/EN11168, 2012.
Guo, S., Hu, M., Wang, Z. B., Slanina, J., and Zhao, Y. L.: Size-resolved aerosol water-soluble ionic compositions in the summer of Beijing: implication of regional secondary formation, Atmos. Chem. Phys., 10, 947–959, https://doi.org/10.5194/acp-10-947-2010, 2010.
He, L.-Y., Lin, Y., Huang, X.-F., Guo, S., Xue, L., Su, Q., Hu, M., Luan, S.-J., and Zhang, Y.-H.: Characterization of high-resolution aerosol mass spectra of primary organic aerosol emissions from Chinese cooking and biomass burning, Atmos. Chem. Phys., 10, 11535–11543, https://doi.org/10.5194/acp-10-11535-2010, 2010.
He, L.-Y., Huang, X.-F., Xue, L., Hu, M., Lin, Y., Zheng, J., Zhang, R., and Zhang, Y.-H.: Submicron aerosol analysis and organic source apportionment in an urban atmosphere in Pearl River Delta of China using high-resolution aerosol mass spectrometry, J. Geophys. Res., 116, D12304, https://doi.org/10.1029/2010JD014566, 2011.
Hu, W., Hu, M., Hu, W., Jimenez, J. L., Yuan, B., Chen, W., Wang, M., Wu, Y., Chen, C., Wang, Z., Peng, J., Zeng, L., and Shao, M.: Chemical composition, sources and aging process of submicron aerosols in Beijing: contrast between summer and winter, J. Geophys. Res., 121, 1955–1977, https://doi.org/10.1002/2015JD024020, 2016a.
Hu, W., Hu, M., Hu, W.-W., Niu, H., Zheng, J., Wu, Y., Chen, W., Chen, C., Li, L., Shao, M., Xie, S., and Zhang, Y.: Characterization of submicron aerosols influenced by biomass burning at a site in the Sichuan Basin, southwestern China, Atmos. Chem. Phys., 16, 13213–13230, https://doi.org/10.5194/acp-16-13213-2016, 2016b.
Huang, R. J., Zhang, Y., Bozzetti, C., Ho, K. F., Cao, J. J., Han, U., Daellenbach, K. R., Slowik, J. G., Platt, S. M., Canonaco, F., Zotter, P., Wolf, R., Pieber, S. M., Bruns, E. A., Crippa, M., Ciarelli, G., Piazzalunga, A., Schwikowski, M., Abbaszade, G., Schnelle-Kreis, J., Zimmermann, R., An, Z., Szidat, S., Baltensperger, U., El Haddad, I., and Prévôt, A. S. H.: High secondary aerosol contribution to particulate pollution during haze events in China, Nature, 514, 218–222, 2014.
Huang, X.-F., He, L.-Y., Xue, L., Sun, T.-L., Zeng, L.-W., Gong, Z.-H., Hu, M., and Zhu, T.: Highly time-resolved chemical characterization of atmospheric fine particles during 2010 Shanghai World Expo, Atmos. Chem. Phys., 12, 4897–4907, https://doi.org/10.5194/acp-12-4897-2012, 2012.
Jiang, Q., Sun, Y. L., Wang, Z., and Yin, Y.: Aerosol composition and sources during the Chinese Spring Festival: fireworks, secondary aerosol, and holiday effects, Atmos. Chem. Phys., 15, 6023–6034, https://doi.org/10.5194/acp-15-6023-2015, 2015.
Jimenez, J. L., Canagaratna, M. R., Donahue, N. M., Prévôt, A. S. H., Zhang, Q., Kroll, J. H., DeCarlo, P. F., Allan, J. D., Coe, H., Ng, N. L., Aiken, A. C., Docherty, K. S., Ulbrich, I. M., Grieshop, A. P., Robinson, A. L., Duplissy, J., Smith, J. D., Wilson, K. R., Lanz, V. A., Hueglin, C., Sun, Y. L., Tian, J., Laaksonen, A., Raatikainen, T., Rautiainen, J., Vaattovaara, P., Ehn, M., Kulmala, M., Tomlinson, J. M., Collins, D. R., Cubison, M. J., E, Dunlea, J., Huffman, J. A., Onasch, T. B., Alfarra, M. R., Williams, P. I., Bower, K., Kondo, Y., Schneider, J., Drewnick, F., Borrmann, S., Weimer, S., Demerjian, K., Salcedo, D., Cottrell, L., Griffin, R., Takami, A., Miyoshi, T., Hatakeyama, S., Shimono, A., Sun, J. Y., Zhang, Y. M., Dzepina, K., Kimmel, J. R., Sueper, D., Jayne, J. T., Herndon, S. C., Trimborn, A. M., Williams, L. R., Wood, E. C., Middlebrook, A. M., Kolb, C. E., Baltensperger, U., and Worsnop, D. R.: Evolution of organic aerosols in the atmosphere, Science, 326, 1525–1529, 2009.
Lang, J. L., Cheng, S. Y., Li, J. B., Chen, D. S., Zhou, Y., Wei, X., Han, L. H., and Wang, H. Y.: A monitoring and modeling study to investigate regional transport and characteristics of PM2.5 pollution, Aerosol Air Qual. Res., 13, 943–956, 2013.
Lanz, V. A., Alfarra, M. R., Baltensperger, U., Buchmann, B., Hueglin, C., and Prévôt, A. S. H.: Source apportionment of submicron organic aerosols at an urban site by factor analytical modelling of aerosol mass spectra, Atmos. Chem. Phys., 7, 1503–1522, https://doi.org/10.5194/acp-7-1503-2007, 2007.
Li, H., Zhang, Q., Zhang, Q., Chen, C., Wang, L., Wei, Z., Zhou, S., Parworth, C., Zheng, B., Canonaco, F., Prévôt, A. S. H., Chen, P., Zhang, H., Wallington, T. J., and He, K.: Wintertime aerosol chemistry and haze evolution in an extremely polluted city of the North China Plain: significant contribution from coal and biomass combustion, Atmos. Chem. Phys., 17, 4751–4768, https://doi.org/10.5194/acp-17-4751-2017, 2017.
Li, P., Yan, R., Yu, S., Wang, S., Liu, W., and Bao, H.: Reinstate regional transport of PM2.5 as a major cause of severe haze in Beijing, P. Natl. Acad. Sci. USA, 112, E2739–E2740, https://doi.org/10.1073/pnas.1502596112, 2015.
Li, Y. J., Lee, B. P., Su, L., Fung, J. C. H., and Chan, C. K.: Seasonal characteristics of fine particulate matter (PM) based on high-resolution time-of-flight aerosol mass spectrometric (HR-ToF-AMS) measurements at the HKUST Supersite in Hong Kong, Atmos. Chem. Phys., 15, 37-53, https://doi.org/10.5194/acp-15-37-2015, 2015.
Middlebrook, A. M., Bahreini, R., Jimenez, J. L., and Canagaratna, M. R.: Evaluation of Composition-Dependent Collection Efficiencies for the Aerodyne Aerosol Mass Spectrometer using Field Data, Aerosol Sci. Tech., 46, 258–271, 2012.
Minguillón, M. C., Ripoll, A., Pérez, N., Prévôt, A. S. H., Canonaco, F., Querol, X., and Alastuey, A.: Chemical characterization of submicron regional background aerosols in the western Mediterranean using an Aerosol Chemical Speciation Monitor, Atmos. Chem. Phys., 15, 6379–6391, https://doi.org/10.5194/acp-15-6379-2015, 2015.
Mohr, C., Huffman, J. A., Cubison, M. J., Aiken, A. C., Docherty, K. S., Kimmel, J. R., Ulbrich, I. M., Hannigan, M., and Jimenez, J. L.: Characterization of primary organic aerosol emissions from meat cooking, trash burning, and motor vehicles with High-Resolution Aerosol Mass Spectrometry and comparison with ambient and chamber observations, Environ. Sci. Technol., 43, 2443–2449, https://doi.org/10.1021/es8011518, 2009.
Mohr, C., DeCarlo, P. F., Heringa, M. F., Chirico, R., Slowik, J. G., Richter, R., Reche, C., Alastuey, A., Querol, X., Seco, R., Peñuelas, J., Jiménez, J. L., Crippa, M., Zimmermann, R., Baltensperger, U., and Prévôt, A. S. H.: Identification and quantification of organic aerosol from cooking and other sources in Barcelona using aerosol mass spectrometer data, Atmos. Chem. Phys., 12, 1649–1665, https://doi.org/10.5194/acp-12-1649-2012, 2012.
Ng, N. L., Herndon, S. C., Trimborn, A., Canagaratna, M. R., Croteau, P. L., Onasch, T. B., Sueper, D., Worsnop, D. R., Zhang, Q., Sun, Y. L., and Jayne, J. T.: An Aerosol Chemical Speciation Monitor (ACSM) for Routine Monitoring of the Composition and Mass Concentrations of Ambient Aerosol, Aerosol Sci. Tech., 45, 770–784, 2011a.
Ng, N. L., Canagaratna, M. R., Jimenez, J. L., Zhang, Q., Ulbrich, I. M., and Worsnop, D. R.: Real-time methods for estimating organic component mass concentrations from aerosol mass spectrometer data, Environ. Sci. Technol., 45, 910–916, 2011b.
Paatero, P. and Tapper, U., Positive Matrix Factorization: A Non-Negative Factor Model with Optimal Utilization of Error Estimates of Data Values, Environmetrics, 5, 111–126, https://doi.org/10.1002/env.3170050203, 1994.
Petit, J.-E., Favez, O., Sciare, J., Crenn, V., Sarda-Estève, R., Bonnaire, N., Mocnik, G., Dupont, J.-C., Haeffelin, M., and Leoz-Garziandia, E.: Two years of near real-time chemical composition of submicron aerosols in the region of Paris using an Aerosol Chemical Speciation Monitor (ACSM) and a multi-wavelength Aethalometer, Atmos. Chem. Phys., 15, 2985–3005, https://doi.org/10.5194/acp-15-2985-2015, 2015.
Reyes-Villegas, E., Green, D. C., Priestman, M., Canonaco, F., Coe, H., Prévôt, A. S. H., and Allan, J. D.: Organic aerosol source apportionment in London 2013 with ME-2: exploring the solution space with annual and seasonal analysis, Atmos. Chem. Phys., 16, 15545–15559, https://doi.org/10.5194/acp-16-15545-2016, 2016.
Ripoll, A., Minguillón, M. C., Pey, J., Jimenez, J. L., Day, D. A., Sosedova, Y., Canonaco, F., Prévôt, A. S. H., Querol, X., and Alastuey, A.: Long-term real-time chemical characterization of submicron aerosols at Montsec (southern Pyrenees, 1570 m a.s.l.), Atmos. Chem. Phys., 15, 2935–2951, https://doi.org/10.5194/acp-15-2935-2015, 2015.
Schlag, P., Kiendler-Scharr, A., Blom, M. J., Canonaco, F., Henzing, J. S., Moerman, M., Prévôt, A. S. H., and Holzinger, R.: Aerosol source apportionment from 1-year measurements at the CESAR tower in Cabauw, the Netherlands, Atmos. Chem. Phys., 16, 8831–8847, https://doi.org/10.5194/acp-16-8831-2016, 2016.
Sun, Y. L., Wang, Z. F., Fu, P. Q., Yang, T., Jiang, Q., Dong, H. B., Li, J., and Jia, J. J.: Aerosol composition, sources and processes during wintertime in Beijing, China, Atmos. Chem. Phys., 13, 4577–4592, https://doi.org/10.5194/acp-13-4577-2013, 2013.
Sun, Y. L., Jiang, Q., Wang, Z., Fu, P., Li, J., Yang, T., and Yin, Y.: Investigation of the sources and evolution processes of severe haze pollution in Beijing in January 2013, J. Geophys. Res., 119, 4380–4398, https://doi.org/10.1002/2014JD021641, 2014.
Sun, Y. L., Wang, Z. F., Du, W., Zhang, Q., Wang, Q. Q., Fu, P. Q., Pan, X. L., Li, J., Jayne, J., and Worsnop, D. R.: Long-term real-time measurements of aerosol particle composition in Beijing, China: seasonal variations, meteorological effects, and source analysis, Atmos. Chem. Phys., 15, 10149–10165, https://doi.org/10.5194/acp-15-10149-2015, 2015.
Sun, Y., Du, W., Fu, P., Wang, Q., Li, J., Ge, X., Zhang, Q., Zhu, C., Ren, L., Xu, W., Zhao, J., Han, T., Worsnop, D. R., and Wang, Z.: Primary and secondary aerosols in Beijing in winter: sources, variations and processes, Atmos. Chem. Phys., 16, 8309–8329, https://doi.org/10.5194/acp-16-8309-2016, 2016.
Tie, X., Huang, R. J., Cao, J. J., Zhang, Q., Cheng, Y. F., Su, H., Chang, D., Pöschl, U., Hoffmann, T., Dusek, U., Li, G. H., Worsnop, D. R., and O'Dowd, C. D.: Severe pollution in China amplified by atmospheric moisture, Sci. Rep.-UK, 7, 15760, https://doi.org/10.1038/s41598-017-15909-1, 2017.
Ulbrich, I. M., Canagaratna, M. R., Zhang, Q., Worsnop, D. R., and Jimenez, J. L.: Interpretation of organic components from Positive Matrix Factorization of aerosol mass spectrometric data, Atmos. Chem. Phys., 9, 2891–2918, https://doi.org/10.5194/acp-9-2891-2009, 2009.
Wang, Q., Sun, Y., Jiang, Q., Du, W., Sun, C., Fu, P., and Wang, Z.: Chemical composition of aerosol particles and light extinction apportionment before and during the heating season in Beijing, China, J. Geophys. Res.-Atmos., 120, 12708–12722, 2015.
Wang, Y. C., Huang, R. J., Ni, H. Y., Chen, Y., Wang, Q. Y., Li, G. H., Tie, X. X., Shen, Z. X., Huang, Y., Liu, S. X., Dong, W. M., Xue, P., Frohlich, R., Canonaco, F., Elser, M., Daellenbach, K. R., Bozzetti, C., El Haddad, I., and Prevot, A. S. H.: Chemical composition, sources and secondary processes of aerosols in Baoji city of northwest China, Atmos. Environ., 158, 128–137, 2017.
Xu, J., Zhang, Q., Chen, M., Ge, X., Ren, J., and Qin, D.: Chemical composition, sources, and processes of urban aerosols during summertime in northwest China: insights from high-resolution aerosol mass spectrometry, Atmos. Chem. Phys., 14, 12593–12611, https://doi.org/10.5194/acp-14-12593-2014, 2014.
Xu, J., Shi, J., Zhang, Q., Ge, X., Canonaco, F., Prévôt, A. S. H., Vonwiller, M., Szidat, S., Ge, J., Ma, J., An, Y., Kang, S., and Qin, D.: Wintertime organic and inorganic aerosols in Lanzhou, China: sources, processes, and comparison with the results during summer, Atmos. Chem. Phys., 16, 14937–14957, https://doi.org/10.5194/acp-16-14937-2016, 2016.
Xu, W. Q., Sun, Y. L., Chen, C., Du, W., Han, T. T., Wang, Q. Q., Fu, P. Q., Wang, Z. F., Zhao, X. J., Zhou, L. B., Ji, D. S., Wang, P. C., and Worsnop, D. R.: Aerosol composition, oxidation properties, and sources in Beijing: results from the 2014 Asia-Pacific Economic Cooperation summit study, Atmos. Chem. Phys., 15, 13681–13698, https://doi.org/10.5194/acp-15-13681-2015, 2015.
Xu, X., Barsha, N. A. F., and Li, J.: Analyzing Regional Influence of Particulate Matter on the City of Beijing, China, Aerosol Air Qual. Res., 8, 78–93, 2008.
Zhang, J. P., Zhu, T., Zhang, Q. H., Li, C. C., Shu, H. L., Ying, Y., Dai, Z. P., Wang, X., Liu, X. Y., Liang, A. M., Shen, H. X., and Yi, B. Q.: The impact of circulation patterns on regional transport pathways and air quality over Beijing and its surroundings, Atmos. Chem. Phys., 12, 5031–5053, https://doi.org/10.5194/acp-12-5031-2012, 2012.
Zhang, Y. J., Tang, L. L., Wang, Z., Yu, H. X., Sun, Y. L., Liu, D., Qin, W., Canonaco, F., Prévôt, A. S. H., Zhang, H. L., and Zhou, H. C.: Insights into characteristics, sources, and evolution of submicron aerosols during harvest seasons in the Yangtze River delta region, China, Atmos. Chem. Phys., 15, 1331–1349, https://doi.org/10.5194/acp-15-1331-2015, 2015.
Zhao, P., Dong, F., Yang, Y., He, D., Zhao, X., Zhang, W., Yao, Q., and Liu, H.: Characteristics of carbonaceous aerosol in the region of Beijing, Tianjin, and Hebei, China, Atmos. Environ., 71, 389–398, 2013.
Zhao, P. S., Dong, F., He, D., Zhao, X. J., Zhang, X. L., Zhang, W. Z., Yao, Q., and Liu, H. Y.: Characteristics of concentrations and chemical compositions for PM2.5 in the region of Beijing, Tianjin, and Hebei, China, Atmos. Chem. Phys., 13, 4631–4644, https://doi.org/10.5194/acp-13-4631-2013, 2013.
Zhou, W., Jiang, J., Duan, L., and Hao, J.: Evolution of submicron organic aerosols during a complete residential coal combustion process, Environ. Sci. Technol., 50, 7861–7869, 2016.
Zhu, Q., Huang, X.-F., Cao, L.-M., Wei, L.-T., Zhang, B., He, L.-Y., Elser, M., Canonaco, F., Slowik, J. G., Bozzetti, C., El-Haddad, I., and Prévôt, A. S. H.: Improved source apportionment of organic aerosols in complex urban air pollution using the multilinear engine (ME-2), Atmos. Meas. Tech., 11, 1049–1060, https://doi.org/10.5194/amt-11-1049-2018, 2018.