the Creative Commons Attribution 4.0 License.
the Creative Commons Attribution 4.0 License.
 | 07 Jan 2019
Synergistic effect of water-soluble species and relative humidity on morphological changes in aerosol particles in the Beijing megacity during severe pollution episodes
Baozhu Ge
Yu Tian
Lianfang Wei
Siyao Yue
Itsushi Uno
Hiroshi Kobayashi
Tomoaki Nishizawa
Atsushi Shimizu
Pingqing Fu
Zifa Wang
Depolarization ratio (δ) of backscattered light is an applicable parameter for distinguishing the sphericity of particles in real time, which has been widely adopted by ground-based lidar observation systems. In this study, δ values of particles and chemical compositions in both PM2.5 (aerodynamic diameter less than 2.5 µm) and PM10 (aerodynamic diameter less than 10 µm) were concurrently measured on the basis of a bench-top optical particle counter with a polarization detection module (POPC) and a continuous dichotomous aerosol chemical speciation analyzer (ACSA-14) from November 2016 to February 2017 at an urban site in Beijing megacity. In general, measured δ values depended on both size and sphericity of the particles. During the observation period, mass concentrations of in PM2.5 (fNO3) were about an order of magnitude higher than that in PM2.5−10 (cNO3) with a mean fNO3∕cNO3 ratio of 14±10. A relatively low fNO3∕cNO3 ratio (∼5) was also observed under higher relative humidity conditions, mostly due to heterogeneous processes and particles in the coarse mode. We found that δ values of ambient particles in both PM2.5 and PM2.5−10 obviously decreased as mass concentration of water-soluble species increased at unfavorable meteorological conditions. This indicated that the morphology of particles was changed as a result of water-absorbing processes. The particles with optical size (Dp) of Dp = 5 µm were used to represent mineral dust particles, and its δ values (δDp=5) decreased by 50 % as the mass fraction of cNO3 increased from 2 % to 8 % and ambient relative humidity increased up to 80 %, suggesting that mineral dust particles were likely to be spherical during humid pollution episodes. During the observation, relative humidity inside the POPC measuring chamber was stable at 34±2 %, lower than the ambient condition. Its influence on the morphology was estimated to be limited and did not change our major conclusion. This study highlights the evident alteration of non-sphericity of mineral dust particles during their transport owing to a synergistic effect of both pollutant coatings and hygroscopic processes, which plays an important role in the evaluation of its environmental effect.
- Article
(4322 KB) - Full-text XML
-
Supplement
(177 KB) - BibTeX
- EndNote


Tropospheric aerosols, in particular the particles with aerodynamic diameter less than 2.5 µm (PM2.5), have a detrimental impact on human health (Zheng et al., 2015). It degrades the air quality by increasing atmospheric turbidity, and affects regional and global climate by disturbing the solar radiation transfer in the Earth system via directly scattering or absorbing light and altering the amount and lifespan of cloud (Ramanathan et al., 2001; Kaufman et al., 2002). In the past decades, intensive anthropogenic and industrial activities in East Asia emitted huge amounts of primary pollutants such as SO2, NOx, NH3, VOCs, etc., which resulted in severe air pollution. PM2.5 was mainly composed of light-scattering species (sulfate, nitrate, ammonium, organics, etc.) and light-absorbing matter (BC, BrC, etc.). Under high relative humidity (RH) conditions, most aerosol particles absorb water vapor and undergo apparently hygroscopic growth, which lead to dramatic changes in its mass concentration, size distribution and optical properties (single scattering albedo), as well as its corresponding morphologies (Li et al., 2017).
Mineral aerosol is also one of the key compounds in East Asia, it was frequently reported to be coated by anthropogenic pollutants during its transport owing to heterogeneous reactions with reactive acidic gas and coagulation of soluble particles. In polluted areas, photochemically formatted nitric acid (HNO3) could easily react with CaCO3 to form Ca(NO3)2 on the surface of dust particles. The consecutive water-absorbing process will also lead to apparent morphological changes in dust particles (Krueger et al., 2003; Laskin et al., 2005; Tang et al., 2016), which also impact on dust–cloud interactions (Sullivan et al., 2009; Tang et al., 2015) and new particle formation. Until now, online investigation on the morphological changes in aerosol particles in the ambient environment is still limit. The widely adopted method to study the morphology and mixing state of particles is filter-based single particle sampling with electron-microscopy inspection in laboratory. For example, scanning electron microscopy (SEM) coupled with energy dispersive X-ray spectrometry (EDX) could provide information about surface topography and composition of the sample surface by scanning it with a high-energy beam of electrons. Li and Shao (2009), using transmission electron microscopy (TEM), found that approximately 90 % of sampled mineral particles were covered by visible coatings during pollution episodes in central east China. As a matter of fact, such hygroscopic coating on some individual dust particles was observed not only in polluted area but also at clean marine area. The observation on R/V during ACE-Asia found that dust particles mixed with chloride was sometimes dominant over sulphate and nitrate due to disassociation of acidified sea salt particles (Sullivan et al., 2007). Tobo et al. (2010) found that Asian dust particles could also be deliquescent to aqueous droplet as a result of formation of CaCl2. Dust particles could also acquire sulfate coatings via either heterogeneous uptake of gaseous SO2 and subsequent oxidation or coagulation within cloud or fog droplets (Kojima et al., 2006), as well as volatile carbonaceous species due to condensation processes (Kim and Park, 2012). Although diversity in chemical composition and structure of single particles with different degrees of aging were investigated in the past studies, these analyses had to be inspected subjectively, one by one, and such a labor-intensive operation caused difficult in broadening the results due to poor statistics (Li and Shao, 2009; Li et al., 2017).
To obtain better understanding the real-time morphological variation in atmospheric processing particles, the polarization property of backscattering light from the illuminated particle has been used as an applicable surrogate. For spherical particles, the oscillation direction of the magnetic wave of scattering light was identical to the incident light. Therefore, depolarization ratio (DR, here defined as the ratio of S-polarized to P-polarized backward components) was theoretically zero. However, for uncoated dust particles, the direction significantly deviates with a large DR value. Such a characteristic is widely used to distinguish dust and spherical particles by both ground-based lidar observations (Asian Dust and Aerosol Lidar Observation Network, AD-Net; Shimizu et al., 2016) and satellite remote sensing (Cloud-Aerosol Lidar with Orthogonal Polarization, CALIOP; on board the CALIPSO satellite; Winker et al., 2009; Zhang et al., 2018) presuming that spherical particles and dust were externally mixed. On the basis of this technique, studies on spatially resolved distributions (Hara et al., 2009; Uno et al., 2008), transport patterns (Uno et al., 2009) of pollution and dust, and data processing algorithms (Nishizawa et al., 2007, 2011; Winker et al., 2009) have been widely performed. For instance, Shimizu et al. (2004) summarized the contributions of different aerosol types on the total backscattering coefficient at multiple sites in East Asia using three-channel Mie scatting lidar data. Huang et al. (2015) identified anthropogenic dust particles due to human activities and its contribution to global dust loading on the basis of CALIPSO observations. Recently, a multi-wavelength Mie–Raman lidar (MMRL) and a new algorithm were developed to estimate extinction coefficients for black carbon, dust, sea salt and air-pollution aerosols (a mixture of sulfate, nitrate and organic carbon substances; Hara et al., 2017; Nishizawa et al., 2017).
Once the dust particles were coated by other water-soluble pollutants, its polarization degree altered. Even until now, it is still a challenge to classify coated or uncoated dust particles in real time according to their morphological changes. In particular, lidar systems adopted a volume depolarization ratio to discriminate different aerosol types; it was easily biased due to the presence of small spherical particles in the volume of targeted air. To overcome this shortcoming, a bench-top optical particle counter equipped with a depolarization module (polarization optical particle counter, POPC) was recently developed to detect the size-resolved polarization of individual particles. POPC is capable of investigating the temporal variation in mixing state of single dust particles. The observation at an urban site in Japan showed that DR of super-micron particles evidently decreased due to an increase in mass fraction of nitrate concentration during a long stagnant dust event (Pan et al., 2015). Observations in Beijing showed that some dust particles changed to be spherical at high RH conditions during a typical dust event. (Wang et al., 2017; Pan et al., 2017). The comprehensive long-term observation of such an effect was still lacking.
From 15 November 2016 to 18 February 2017, Beijing suffered from several consecutive severe air pollution events with hourly-averaged mass concentrations of PM2.5 and PM2.5−10 larger than 300 and 100 µg m−3, respectively. It provided a good chance to investigate the interaction between dust particles with pollutants. During this period, chemical composition, size distribution and polarization properties of aerosol particles were concurrently measured, as well as the vertical profile of backscattering coefficient by lidar at a downtown tower site of the Beijing megacity. The objective of this study was to investigate depolarization properties of aerosol particles in the polluted urban site on the single-particle basis, and to study the impact of both water-soluble species and RH on the morphological changes in dust particles. This study will provide useful information for better understanding the physical and optical properties of particles in East Asia, and improving numerical simulations on the environment and climate effects.
2.1 Observation overview
The field measurements were performed at a tower on the campus of the Institute of Atmospheric Physics, Chinese Academy of Sciences, in the downtown area of Beijing. The observation site is located between 3rd North Ring Road and 4th North Ring Road, where anthropogenic emissions are intense in the daytime. Within the campus (150 m×50 m), there is a 325 m tower for meteorological measurements and scientific research; therefore, anthropogenic activity nearby is limited. During the observation period, a continuous dichotomous aerosol chemical speciation analyzer (ACSA-14) was placed on the roof of two-story building in the campus. The POPC was placed in an air-conditioned room on the roof to measure polarization properties of single particles less than 10 µm. To avoid loss of particles in coarse mode, the sampled air was drawn into the room by a supporting pump (flow rate: 10 L min−1) through a 2 m long 1/4-inch vertically assembled stainless steel tube. From 15 November to 15 December 2016, a UK-China joint field campaign, entitle as “In-depth study of air pollution sources and processes within Beijing and its surrounding region (APHH-Beijing)” was also performed in the tower campus. Detailed information about the objectives and instruments are shown on the web page (https://www.atmos-chem-phys.net/special_932.html, last access: 20 October 2018).
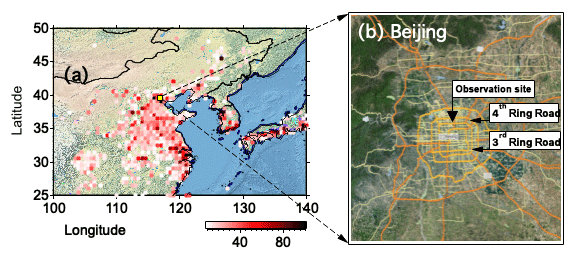
Figure 1Geographic location of the observation site and NOx emission in East Asia (a); the transportation map of Beijing and location of the tower on the campus of the Institute of Atmospheric Physics.
2.2 Instruments
In this study, mass concentrations of particulate matter and water-soluble chemical compounds in both PM2.5 and PM2.5−10 were measured by ACSA-14 (Kimoto Electric Co. Ltd., Osaka, Japan) with 1 h intervals at the observation site. The mass concentration of particulate matter was determined using the beta-ray absorption method. Mass concentration of was determined on the basis of the BaSO4-based turbidimetric method with addition of BaCl2 dissolved in polyvinylpyrrolidone solution. Mass concentrations of the and water-soluble organic carbon were determined using the ultraviolet photometric absorption method. Because mass concentration of was generally high in Beijing, the instrument generally collected aerosol samples in the first 5–10 min in each hour and analyzed the samples in the rest time to guarantee that it followed the Beer–Lambert law. The acidity of particles [H+], in units of nmol m−3, was semi-quantitatively determined using the pH indicator photometric absorption method. The basic equation is pH], presuming that all the WSM was dissolved in the extract liquid with a pH value of 4.6. A factor of 10−6 was used to convert the unit of [H+] from nmol m−3 to mol L−1. The comparison of [H+] in PM2.5 between ACSA and off-line filter-pack measurements showed a good linear correlation ([H+]) with r2=0.54 (personal communication with Kazuo Osada in Nagoya University, 2017). The details of the ACSA instrument are described in literature (Kimoto et al., 2013).
Depolarization ratio (δ) of a single particle was determined using a POPC. The POPC adopted a 780 nm linearly polarized laser beam to illuminate the aerosol particles that passed through the measuring chamber vertically. The direction of vibration of the electric field of the incident laser is parallel to the plane of the scattering angle. Detailed information about the POPC was described in the literature (Kobayashi et al., 2014; Pan et al., 2016, 2017). Forward scattering signal at 60∘ with respect to the direction of incident light was measured by a photodiode with acceptance angle of 45∘ to determine the size of the particle. The backward-scattering signal at 120∘ was split into P component (parallel with respect to the plane of the scattering angle) and S component (perpendicular with respect to the plane of the scattering angle). Herein, the depolarization ratio (parallel with respect to the plane of the scattering angle) of the particles was defined as the ratio of S component to P component (S∕P). To avoid the coincidence error in the measurements, the inlet flow rate of POPC was set to 80 cm3 min−1 and was diluted with zero air (920 cm3 min−1). During measurements, the temperature and RH inside the measuring chamber were stable at 29.2±0.1 ∘C and 34.3±1.6 %, respectively. Overall measurement uncertainty in size determination was less than 15 %.
During the observation period, the vertical structure of backscattering coefficient for aerosols was derived from a Mie-scattering lidar system that was installed at the same place as the ACSA-14. This lidar system, developed by the research group in the National Institute for Environmental Studies (NIES), employs a flash-lamp-pumped Q-switching Nd:YAG laser as the light source. It emits pulsed light with wavelengths of 1064 and 532 nm at a frequency of 10 Hz, and collects the backscattered light from the atmosphere by a 20 cm Schmidt–Cassegrain telescope. The light at 532 nm wavelength is also further separated into S and P component (Sugimoto et al., 2002). The algorithm for classifying sphere and dust particles was described in the literature (Shimizu et al., 2017; Nishizawa et al., 2011). It should be noted that a direct comparison of depolarization ratio between POPC and lidar systems was difficult. Firstly, the lidar system receives backscattering light at almost 180∘ with a field of view of 1 mrad, whereas POPC employs a 120∘ backscattering signal. Secondly, the lidar system measures the total volume depolarization from a volume of targeted air parcel, whereas depolarization properties from the POPC is on a single particle basis.
2.3 Footprint analysis
We simulated the footprint region of aerosol particles at the observation site using the NOAA Hybrid Single Particle Lagrangian Integrated Trajectory (HYSPLIT) model (v4.9; available at https://ready.arl.noaa.gov/HYSPLIT.php, last access: 20 October 2018). This model has been widely applied to calculating long-range or mesoscale transport and footprint regions of air pollution with fast computational speed and high spatial resolution. HYSPLIT model is capable of forward or backward runs in time to simulate the dispersion or potential source of tracers in a given location. Detailed description and validations of this model are shown on the web page https://www.arl.noaa.gov/hysplit/hysplit/ (last access: 20 October 2018). In this study, input meteorological data of the model are from the products (GDAS dataset) of the Global Forecast System (GFS) from the National Centers for Environmental Prediction (NCEP) with a spatial resolution of 0.5∘ by 0.5∘, and a time resolution of 3 h (00:00, 06:00, 12:00 and 18:00 UTC from data assimilation product; 03:00, 09:00, 15:00 and 21:00 UTC from forecast model). By offsetting the release point by a meteorological grid point in the horizontal and 0.01 sigma units in the vertical, ensemble simulation have 27 trajectories and were simultaneously calculated in each hour, providing great advantage for evaluating the uncertainty and potential footprint region. In the present study, the grids at which the height of the backward endpoint of the air parcel was less than the height of the mixing layer were labeled as potential footprint regions.
3.1 Overview in particulate matter and chemical species
3.1.1 Comparison of mass concentration of particulate matter
Figure 2a shows the temporal variations in mass concentrations of ambient PM2.5 that were measured by ACSA-14 at the observation site. For comparison, mass concentration of PM2.5 observed at a state-controlled monitoring station (Olympic center, about 3 km northeast of the observation site) was plotted in the figure. In general, two results were in good agreement with r2=0.8, indicating that the pollution events were generally on the regional scale with minor interference from emission sources nearby. During the observation period, number size distributions of ambient particles with optical diameters between 0.3 and 10 µm were measured with the POPC, and the mass concentration of PM2.5 was estimated assuming that all the particles were spherical with a density of 1.77 g cm−3. Mass concentration of PM2.5 estimated by POPC was compared well with ACSA-14 measurements before 7 January 2017, when ambient RH was almost above 40 %, whereas estimated mass concentration of PM2.5 was obviously underestimated. One possible explanation is that both air temperature and ambient RH after 7 January 2017 evidently decreased. The interaction between WSM in PM2.5 and moisture were unlikely to occur, and the hypothesis of spherical shape of particles due to hygroscopicity may have resulted in a relatively larger uncertainty in estimating the optical size of particles on the basis of scattered light. Another possibility is that the chemical composition of particles was different (Sect. 3.1.2). As shown in Fig. 2d, the northerly wind become stronger, which resulted in a larger proportion of mineral dust matter, the latter which have larger density (2.2–2.8 g cm−3). Deploying the same density for particle in both fine mode and coarse mode will lead to an underestimation of total mass. It was pronounced for the case on 29 January 2017 when the observation site was subject to a floating dust event with an hourly-averaged mass concentration of PM10 reached 734 µg m−3. Daily-averaged mass concentration of PM2.5 measured by ACSA-14 was 354.3 µg m−3, 4 times higher than the values (77.1 µg cm−3) estimated by POPC. Deployment of a larger particle density of 2.8 g cm−3 could only explain 35 % of the difference. The lowest detection limit of particle size of the POPC was 0.5 µm, and miscounting of particles less than 0.5 µm was estimated to contribute another 10 % of the difference. The most probable reason is that the irregularity of particles in fine mode resulted in significant underestimating in particle diameter on the basis of scattering signal. However, the estimation of spherical particles diameter by POPC bears smaller bias theoretically. For example, during a typical anthropogenic-pollutant-dominant case on 1 January 2017, mass concentrations of PM2.5 and PM10 were as high as 438.8 and 626.2 µg m−3, respectively. Hourly-averaged mass concentrations of PM2.5 estimated by POPC correlated well with ACSA-14 measurement with a ratio of 1.1±0.1. It was noticeable that PM2.5 accounted for 80 % of PM10, and ambient RH was 65 %. It implied that anthropogenic water-soluble compounds in PM2.5 underwent hygroscopic processes that may alter non-sphericity of the particles (Sect. 3.5).
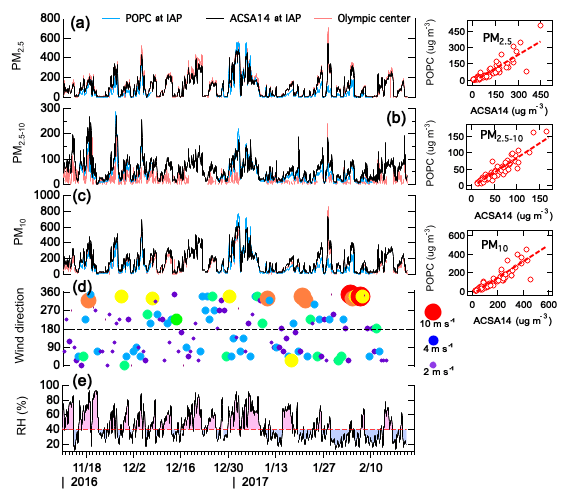
Figure 2Temporal variations in mass concentration of PM2.5 (a), PM2.5−10 (b) and PM10 (c) measured by ACSA-14 and derived from POPC measurements, wind speed and direction (d) and relative humidity (RH) (e) at the observation site. The three scatter plots on the right indicate the linear relationship between ACSA14 and POPC, the correlations are (r2=0.86), (r2=0.77) and (r2=0.81) for PM2.5, PM2.5−10 and PM10, respectively.
Regarding the particles in coarse mode, mass concentration estimated by POPC is much better than that in fine mode. It was because, firstly, the detection efficiency of POPC for the particles in coarse mode was better than that in fine mode, and miscounting of particles in coarse mode by POPC was less likely to occur; secondly, interference of non-sphericity of particles in coarse mode was insignificant in determining the size of particle according to the scattering signal. Besides, changes in the refractive index of particles due to mixing of mineral dust particles with anthropogenic pollutants (such as black carbon) also have limited impact on size determination. In general, the daily-averaged mass fraction of PM2.5−10 in PM10 (PM) was ranging between 0.25 and 0.7 (Figs. S1 and S2 in the Supplement). The minimum value occurred in severe pollution days when daily-averaged mass concentration of PM2.5 was larger than 250 µg cm−3 (Air Quality Level: VI), whereas PM ratio increased as mass concentration of PM2.5 decreases. It was because the formation of secondary particulate matter (such as sulfate and nitrate) during the pollution episode was so overwhelming that it makes the contribution of mineral dust decrease; although the mass concentration of PM2.5−10 increased. A number of studies have addressed the importance of mineral dust in promoting new particle formation (Nie et al., 2014) and conversion of SO2 to sulfate (He et al., 2014), both of which are related to formation of the OH radical. However, this study was performed in winter and the role of mineral dust in the formation of regional pollution is out of scope of this study.
3.1.2 Chemical compounds in fine and coarse modes
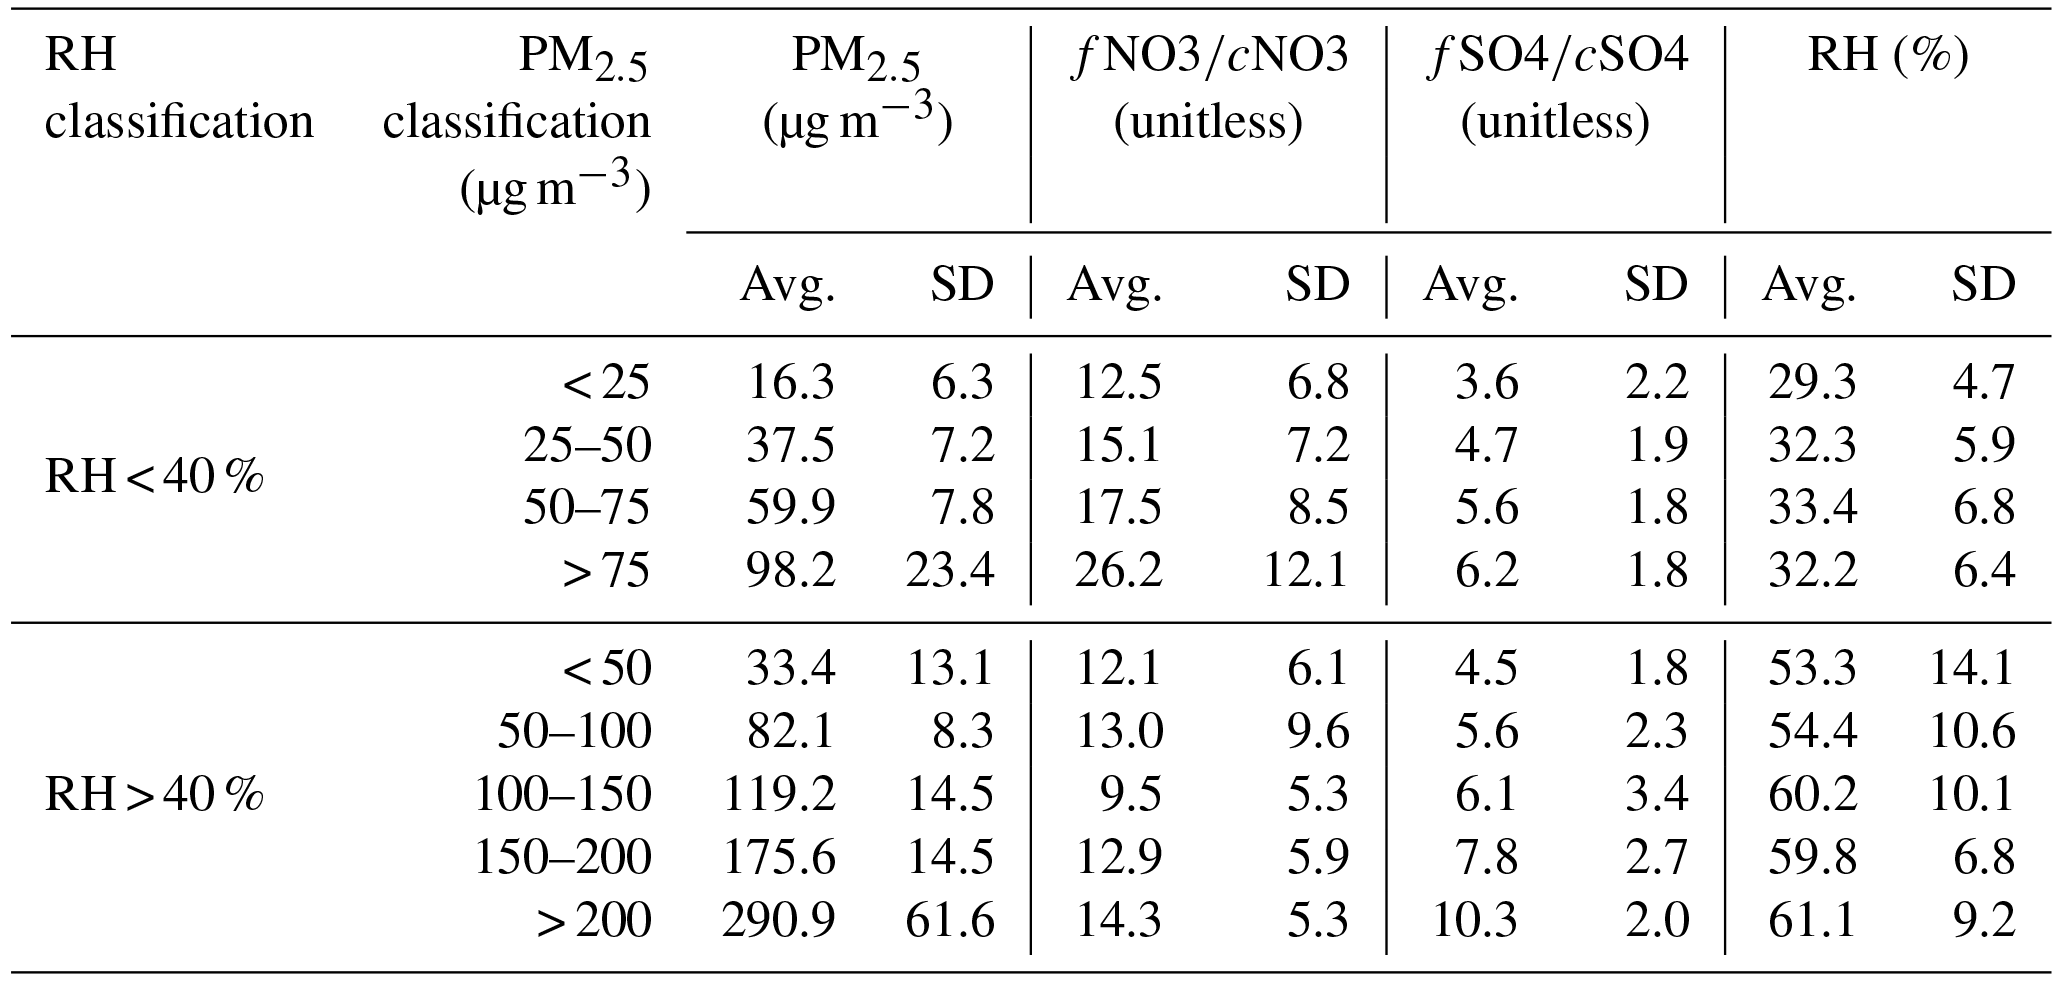
In winter, nitrate, sulfate and water-soluble organic carbon (WSOC) were found in both fine and coarse modes (Fig. 3). Mass concentration of nitrate in the fine (fNO3) was 28.3±33.7 µg m−3 on average with a maximum value of 190.9 µg m−3. Mass concentration of nitrate in the coarse mode (cNO3) was 2.9±4.8 µg m−3. The maximum value of cNO3 (43.1 µg m−3) occurred at a different time from that for fNO3, implying a complicated mass equilibrium of nitrate among different size ranges. Table 1 summarizes the fNO3∕cNO3 ratio as a function of mass concentration of PM2.5 at RH > 40 % and RH < 40 %. We found that when ambient RH was less than 40 %, fNO3∕cNO3 ratio has a positive correlation with mass concentration of PM2.5, which demonstrated that nitrate mass preferentially formed in fine mode and mass transfer of nitrate toward coarse mode was unlikely to happen due to hygroscopic processes of particles. However, when ambient RH was larger than 40 %, fNO3∕cNO3 ratio did not increase with PM2.5 concentration with a mean of 12.4±6.5. The possible explanations were, first, once the aerosol-phase nitrate formed in the fine mode, it simultaneously absorbed water vapor and grew larger; secondary, ambient nitric acid may directly stick on the surface of particles in coarse mode through heterogeneous processes. Although the high concentration of PM2.5 in Beijing was regarded as a synergistic contribution from both local formation and long-range transport, it apparently did not influence the fNO3∕cNO3 ratio, at least in the present study.
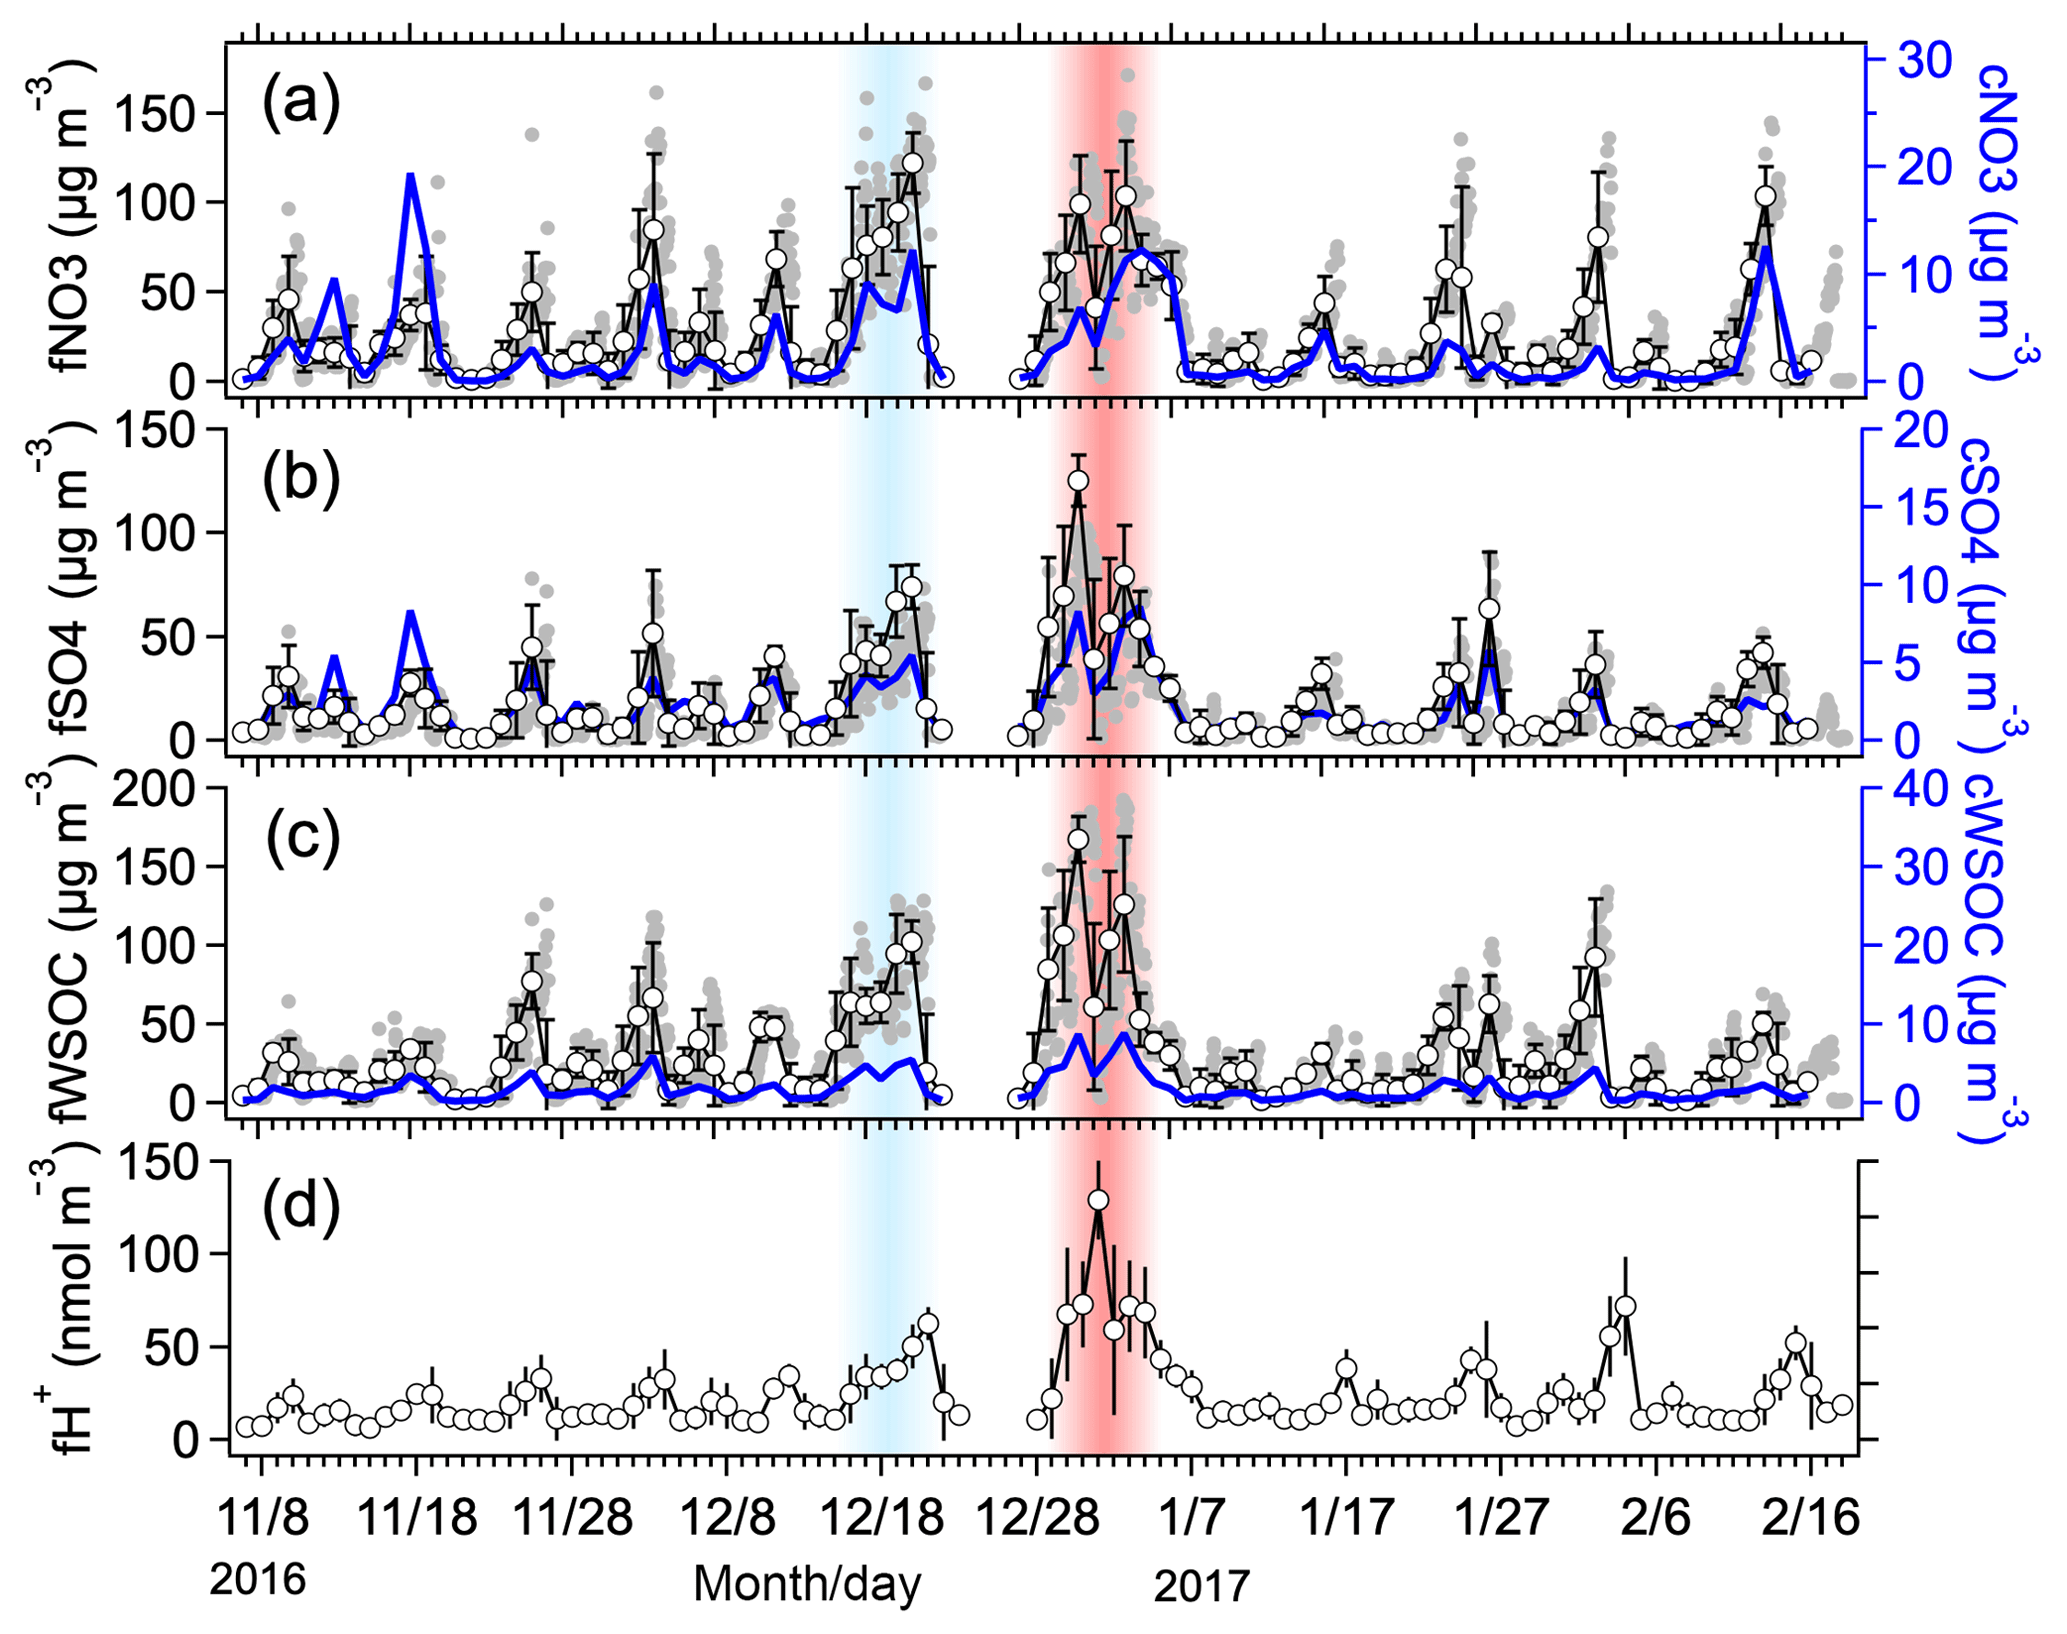
Figure 3Temporal variations in mass concentrations of nitrate (a), sulfate (b) and water-soluble organic carbon (WSOC) (c) in fine mode and coarse mode, and acidity of particle (fH+) in the fine mode (d). Gray dots and white circles represent hourly- and daily-averaged values, respectively.
Mass concentration of sulfate in the fine mode (fSO4) and in the coarse mode (cSO4) were 18.9±24.8 and 2.2±2.5 µg m−3 with maximum values of 143.1 and 25.2 µg m−3, respectively. As shown in Fig. 3b, the variabilities in fSO4 and cSO4 concentrations generally have the same trend. The fSO4∕cSO4 ratio increased with mass concentration of PM2.5, irrespective of ambient RH. The positive correlation between fSO4∕cSO4 ratio and RH indicated that water vapor also took effect in the formation of sulfate. It was worthy to note that the fNO3∕fSO4 ratio varied among cases due to different air mass origin and meteorology conditions. For instance, on 21 December 2016 (blue-shaded strip in Fig. 3), mass concentration of fNO3 and fSO4 were 122.4 and 74.1 µg m−3, respectively, with a fNO3∕fSO4 ratio of 1.6; however, on 1 January 2017 (red-shaded strip in Fig. 3), mass concentration of fSO4 increased to 125.2 µg m−3 and fNO3 decreased to 99.2 µg m−3 with a fNO3∕fSO4 ratio of 0.79. Backward trajectory analysis for the case on 1 January 2017 showed that the air mass was mainly transported from the North China Plain (NCP) along Taihang Mountain, fossil fuel usage in the NCP in winter mainly contributes to the sharp increase in fSO4; however, for the case on 21 December 2016, the air mass was mostly stagnant near the Beijing area, and the intensive emission of NOx resulted in a large difference between fNO3 and fSO4. The variability in WSOC in both fine mode (fWSOC) and coarse mode (cWSOC) were consistent with fSO4 with maximum values of 167.6 and 8.7 µg m−3 (Fig. 3c).
Mass fraction of total WSM in PM2.5 and acidity of the particle are shown in Fig. 3d. Here, WSM includes only , , WSOC, and , the latter of which was estimated on the basis of equation ()). In general, mass fraction of WSM in PM2.5 during pollution period was higher than that during clean period. On average, WSM∕PM2.5 was 0.5±0.16. We found that, WSM∕PM2.5 was more likely related to origin and residence time of air mass than the ambient loading of PM2.5 concentration. For example, daily-averaged mass concentration of PM2.5 reached the maximum (447.5 µg m−3) on 1 January 2017; whereas the maximum value of WSM∕PM2.5 (0.80) occurred on 7 January 2017 when the pollution period almost ended. On 1 January 2017 at the observation site, southwesterly wind was prevailing, which introduced pollutants from the NCP where industrial emission was intensive. However, air mass was mostly from the east region on 7 January 2017, and high concentrations of cNO3 (Fig. 3a) and high RH (Fig. 2d) indicated that heterogeneous processes played a key role. Mole concentration of [H+] in fine mode (fH+) correlated well with mass concentration of fSO4 (Fig. 3d), implying of possibility of presence of surplus of sulfuric acid that converted from SO2 that emitted from coal burning during heating period.
Table 1The relationship between fNO3∕cNO3, fSO4∕cSO4 and mass concentration of PM2.5 at different RH conditions.
3.2 Volume size distribution and depolarization ratio
Volume size distribution of aerosols and averaged depolarization ratio (δ) during the observation period are shown in Fig. 4. In general, evolution of all the pollution cases were well captured by POPC. Volume size distribution of aerosols showed a pronounced peak at 1 µm, at which secondary anthropogenic pollutants were dominant. Correspondingly, δ value of particles were normally less than 0.1, consistent with the previous study in East Asia (Pan et al., 2016). On 19 November 2016, two peaks were observed at the size range of 1 and 2–3 µm. δ value of particles at these two sizes were as low as 0.1. Such a pattern of volume size distribution has been described in previous studies (Pan et al., 2015, 2016), which classified such phenomena as a mixing pollution type that both anthropogenic pollutants and mineral dust particles interacted. The 5-day trajectory analysis indicated that air mass mainly originated from the Mongolian Plateau and they were stagnant over east China for days. Volume peak at sizes of 4–5 µm was not observed, probably due to fast gravity settling of large particles in coarse mode during their stagnancy. On 26 November 2016, the observation site was influenced by floating dust, and volume size distribution had a pronounced peak at 4–5 µm, as expected. The δ value of submicron particles also increased to 0.3, implying the substantial presence of irregular mineral particles in the fine mode. From 30 December 2016 to 8 January 2017 it had a long-lasting pollution period in Beijing. Volume size distribution of aerosols varied due to impacts from both change in planetary boundary layer (PBL) height and origin of aerosols. Multi-peak fitting analysis indicated that volume size distribution had two peaks with a dominant peak at size of 0.9 µm and another peak at size of 2 µm. Different from the case on 19 November 2016, the δ values of particles were 0.2–0.4, though ambient RH was the same (> 60 %). It implied that physicochemical properties of the particles were different, probably due to the impact by mineral dust. A Detailed discussion is given in Sect. 3.3.2.
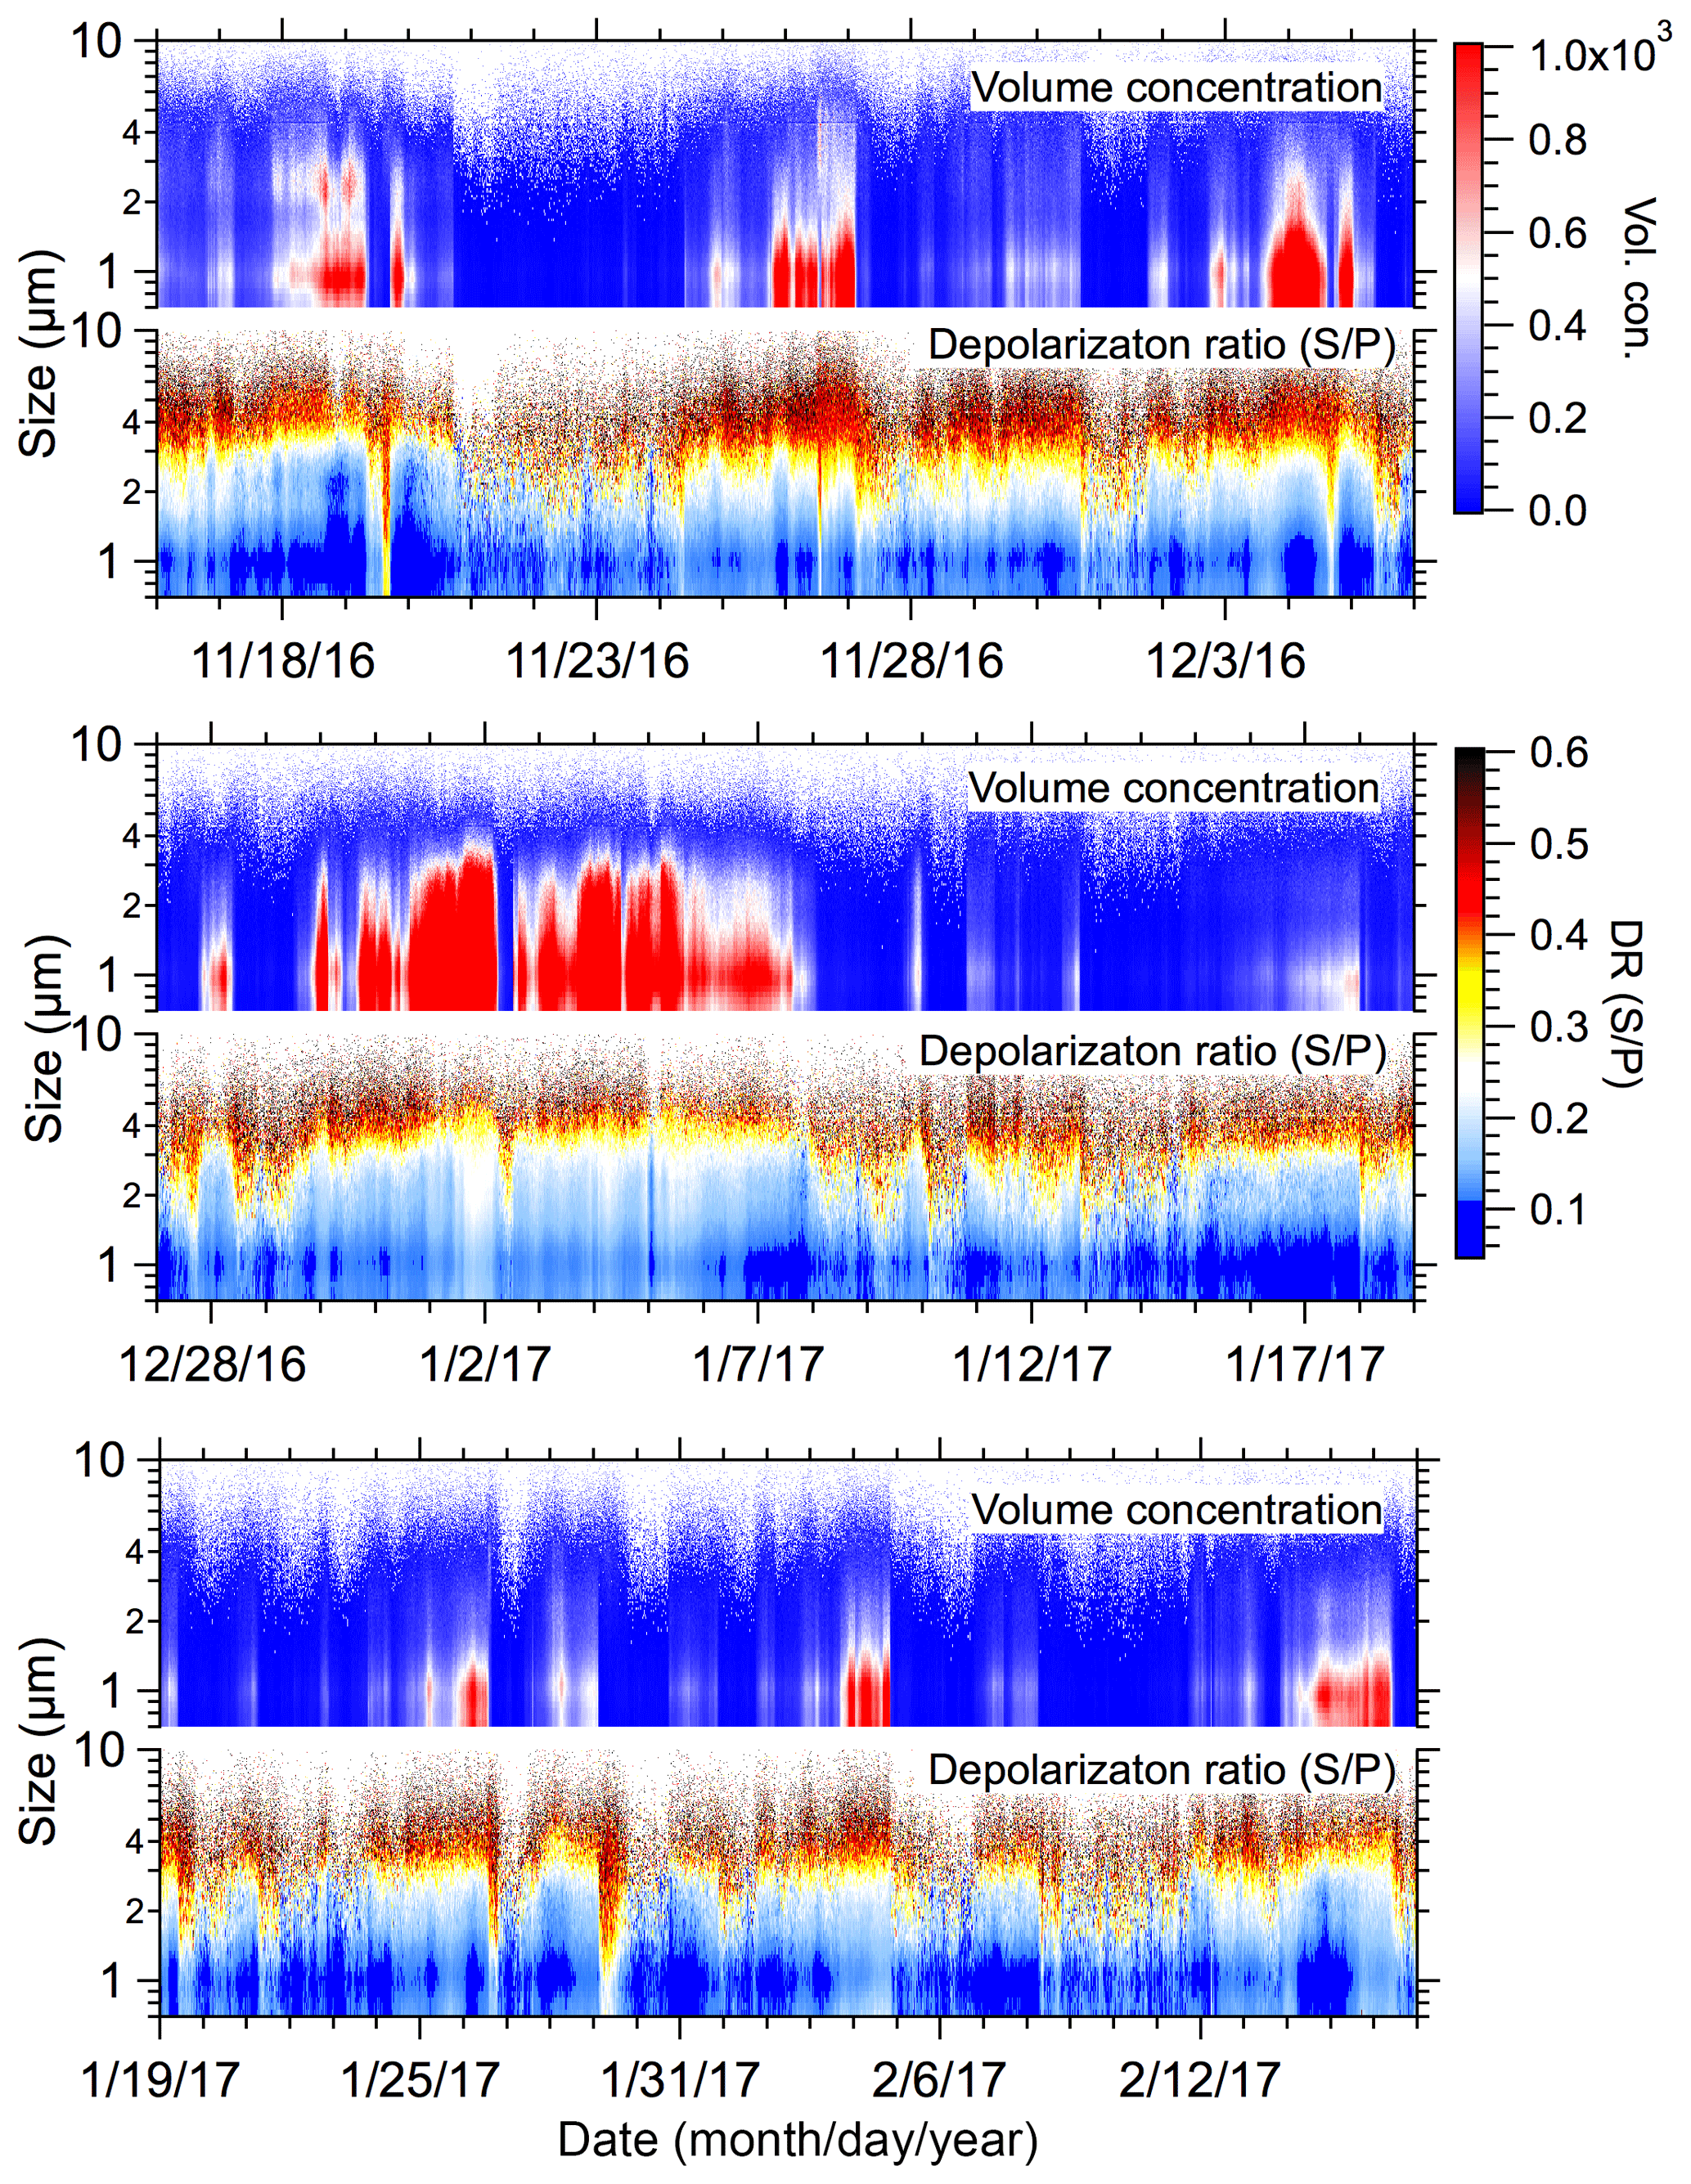
Figure 4Volume concentrations of particles and corresponding depolarization ratios as a function of time during observation period. For a better view of the performance of the instrument, the observation results are shown in three time slots.
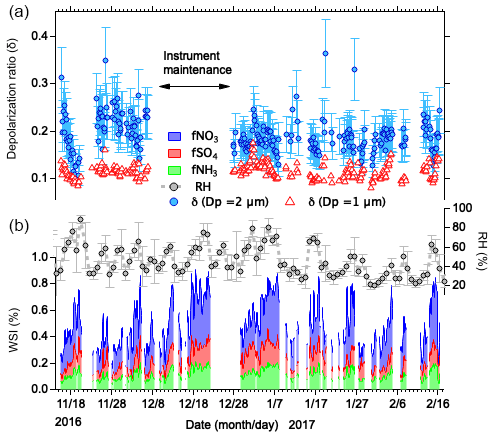
Figure 5Temporal variabilities in δ values for particles at sizes of 1 and 2 µm (a) and mass fraction of water-soluble inorganic matter (WSI, blue: nitrate; red: sulphate; green: ammonium) in PM2.5 and ambient RH (b).
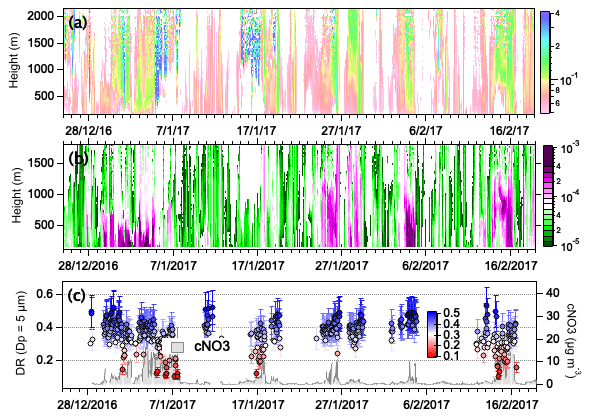
Figure 6Vertical distribution of volume depolarization ratio (@532 nm) (a), extinction coefficient of dust particles derived from lidar observation (b) and variability of δ value of mineral dust particles and in coarse mode aerosols (c) as a function of time. Here we choose the particles at a size of 5 µm to indicate the mineral dust particles, marked as δDp=5 correspondingly.
3.3 Variability of δ values for particles of different size
3.3.1 δ values for particles in fine mode
As pointed out in a previous study, δ values of particles generally depends on both their size and non-sphericity. Histogram analysis on the particles at size of 1 µm showed that there was one peak mode with δ value of 0.11. For the particles at a size of 2 µm, a multi-Gaussian fitting for frequency distribution of δ values showed there was one dominant peak at a value of 0.17 and a shoulder value of 0.23, the latter of which was mostly related to the impact of dust aerosols. We found that variability in δ values of particles in fine mode was a synergistic effect of both water-soluble inorganic matter (WSI) and RH. For example, in Fig. 5, δ values of particles at a size of 2 µm gradually decreased from 0.3 to 0.1 as mass fraction of WSI in PM2.5 increased from 0.2 to 0.65, and RH increased from 38 % to 85 %. It is noted that δ values of particles in fine mode decreased only when RH > 60 % and mass fraction of WSI > 0.6. Mass fractions of both fSO4 and fNO3 in PM2.5 showed a negative correlation with δ value of the particles at size of 2 µm with a slope of −0.3 and −0.1, respectively. We speculated that fNO3 might play a key role in decreasing of δ values of particles in the fine mode because fNO3 was accounting for ∼50 % of total WSI and deliquescent point of ammonium nitrate was ∼60 %; and the impact of ammonium sulfate was less important since it started to undergo hygroscopic growth only at higher RH (79 %). Quantitatively distinguishing the respective contribution of fNO3 and fSO4 on the decrease in δ value of particles was difficult in the present study.
3.3.2 δ values of mineral dust aerosols
Histogram analysis of δ value for the particles at size of 5 µm (δDp=5) had a wide range (0.3–0.55). Laboratory experiments on typical spherical particles at a size of 5.124 µm (SS-053-P) showed that their δDp=5 value was 0.07±0.01. The larger δDp=5 value (> 0.3) of mineral dust particle in the ambient air indicated that they were aspherical in shape. Figure 6 shows time variation in vertical profile of extinction coefficient of dust particles derived from ground-based lidar observation. We can see that there was a typical dust event on 26 December 2016 with a PM ratio of 68 %, and extinction coefficient of dust particles at the site was larger than 0.3 Km−1. The δDp=5 values of dust particle were varying around 0.5, and no decrease in δ value of dust particles was observed due to low cNO3 concentration and low RH (Fig. 6). Another dust event was from 1 to 7 January 2017, we found that δDp=5 value of dust particles was apparently low with a mean value of 0.35. In particular, during the period that mass concentration of cNO3 increased up to 10 µg m−3 and ambient RH was ranging above 60 %, hourly-averaged δDp=5 value of dust particles decreased to 0.2, implying that cNO3 on the surface of dust particle may form as Ca(NO3)2 owing to heterogeneous processes, and consecutive hygroscopic growth resulted in the decrease in its δDp=5 value. Compared with the case on 26 December 2016, the impact of this dust event was relatively weak with a PM ratio of 27 %. It was worth noting that all the mineral-dust-impacting cases were captured by both lidar and POPC observations; nevertheless, the mixing state of mineral dust particles could be illustrated better with POPC measurement according to their δDp=5 variations. Once the morphology of mineral dust particles was modified due to cNO3 coating at high RH condition, lidar observation may underestimate the impact of dust due to decrease in δDp=5 values of particles. Such phenomena may be more likely to happen at a downstream polluted area. For instance, dust particles were found to be spherical due to interaction with HCl and HNO3 at a marine area (Tobo et al., 2010). Observations using POPC at the Kyushu area of Japan also indicated that there was a large number of larger particles with a δDp=5 value between 0.05–0.15 when air mass came from the NCP of China, implying that the morphology of dust particles were altering with transport (Pan et al., 2016).
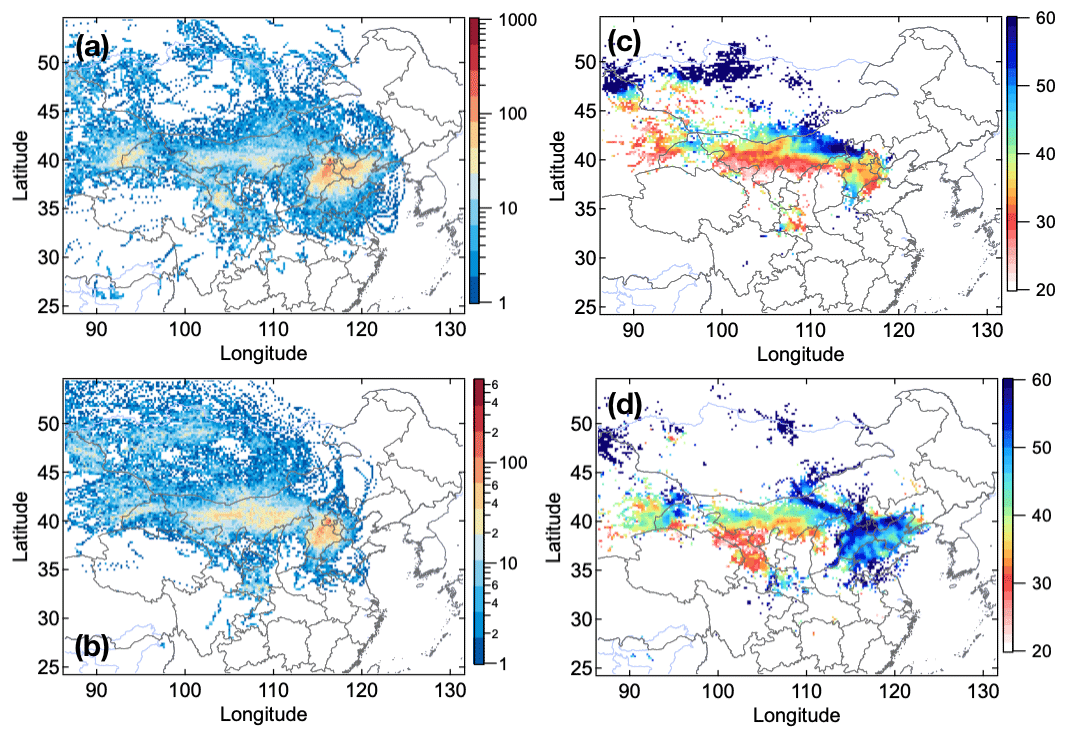
Figure 7Footprint regions of mineral dust particles for the periods when averaged mass concentration of cNO3 was higher than 5 µg m−3, while δDp=5 values were higher than 0.4 (a) and lower than 0.2 (b), and corresponding mean RH (c) and (d) in each grid within the footprint area on the basis of ensemble HYSPLIT analysis. Footprint height was defined as the height that the endpoint of the backward trajectory was lower than the height of the mixing layer in that grid.
3.4 Footprint analysis of mineral dust particles
As discussed above, the decrease in δDp=5 values of mineral dust particles was influenced by both mass concentration of cNO3 and ambient RH. We selected two mineral-dust-influencing episodes to demonstrate such an impact (Fig. 7). Here, the footprint region of the air mass was calculated for the period that hourly-averaged mass concentration of cNO3 was higher than 5 µg m−3. For the episode between 24 November and 7 December 2016, the footprint region of air mass covered west of Inner Mongolia province and south of Hebei province. The particles in coarse mode seemed to mostly be related with anthropogenic dust (defined as dust aerosols due to human activity, such as agriculture, industrial activity, transportation, etc.) in the NCP where NOx emission and atmospheric nitrate loading were also high. Averaged RH was relatively low with a mean value of 30 % (Fig. 7c). However, for the episode between 1 January and 8 January 2017, averaged RH within the footprint region around the NCP was as high as 60 % (Fig. 7d), although mineral dust particles had similar origins. Adsorption of water vapor and consecutive heterogeneous reaction lead to an obvious decrease in the δDp=5 value of mineral dust particles. It indicated that a synergetic effect of both nitrate in coarse mode and high RH condition lead to morphological changes in dust shape. The variability of morphological changes was simulated on the basis of the T-matrix methodology and randomly oriented elongated ellipsoid particles. We found that observed maximal δDp=5 value (0.5) of dust particle corresponded to an aspect ratio (defined as ratio of the longest dimension to its orthogonal width) of 1.7. When δ values of mineral dust particles decrease to 0.2, the aspect ratio was estimated to be 1.5, not being “spherical”. Therefore, we considered such dust particles as being “quasi-spherical”. Huang et al. (2015) pointed out that layer-integrated δ values of anthropogenic dust particles in the PBL of the NCP was lower than that of Taklimakan dust on the basis of CALIPSO lidar measurements, mostly being due to mixed with other more spherical aerosol within the PBL. Because lidar observation just provide an averaged δ value for all the particles in the detecting volume, external mixing of dust particles with a substantial amount of secondary anthropogenic particles of spherical shape could also result in a low δ value. From the view point of this study, irregularity of anthropogenic dust particles in the NCP were possibly the same as the natural dust in the source region; however, their interaction in particular at high RH condition will obviously lead to a decrease in δ value.
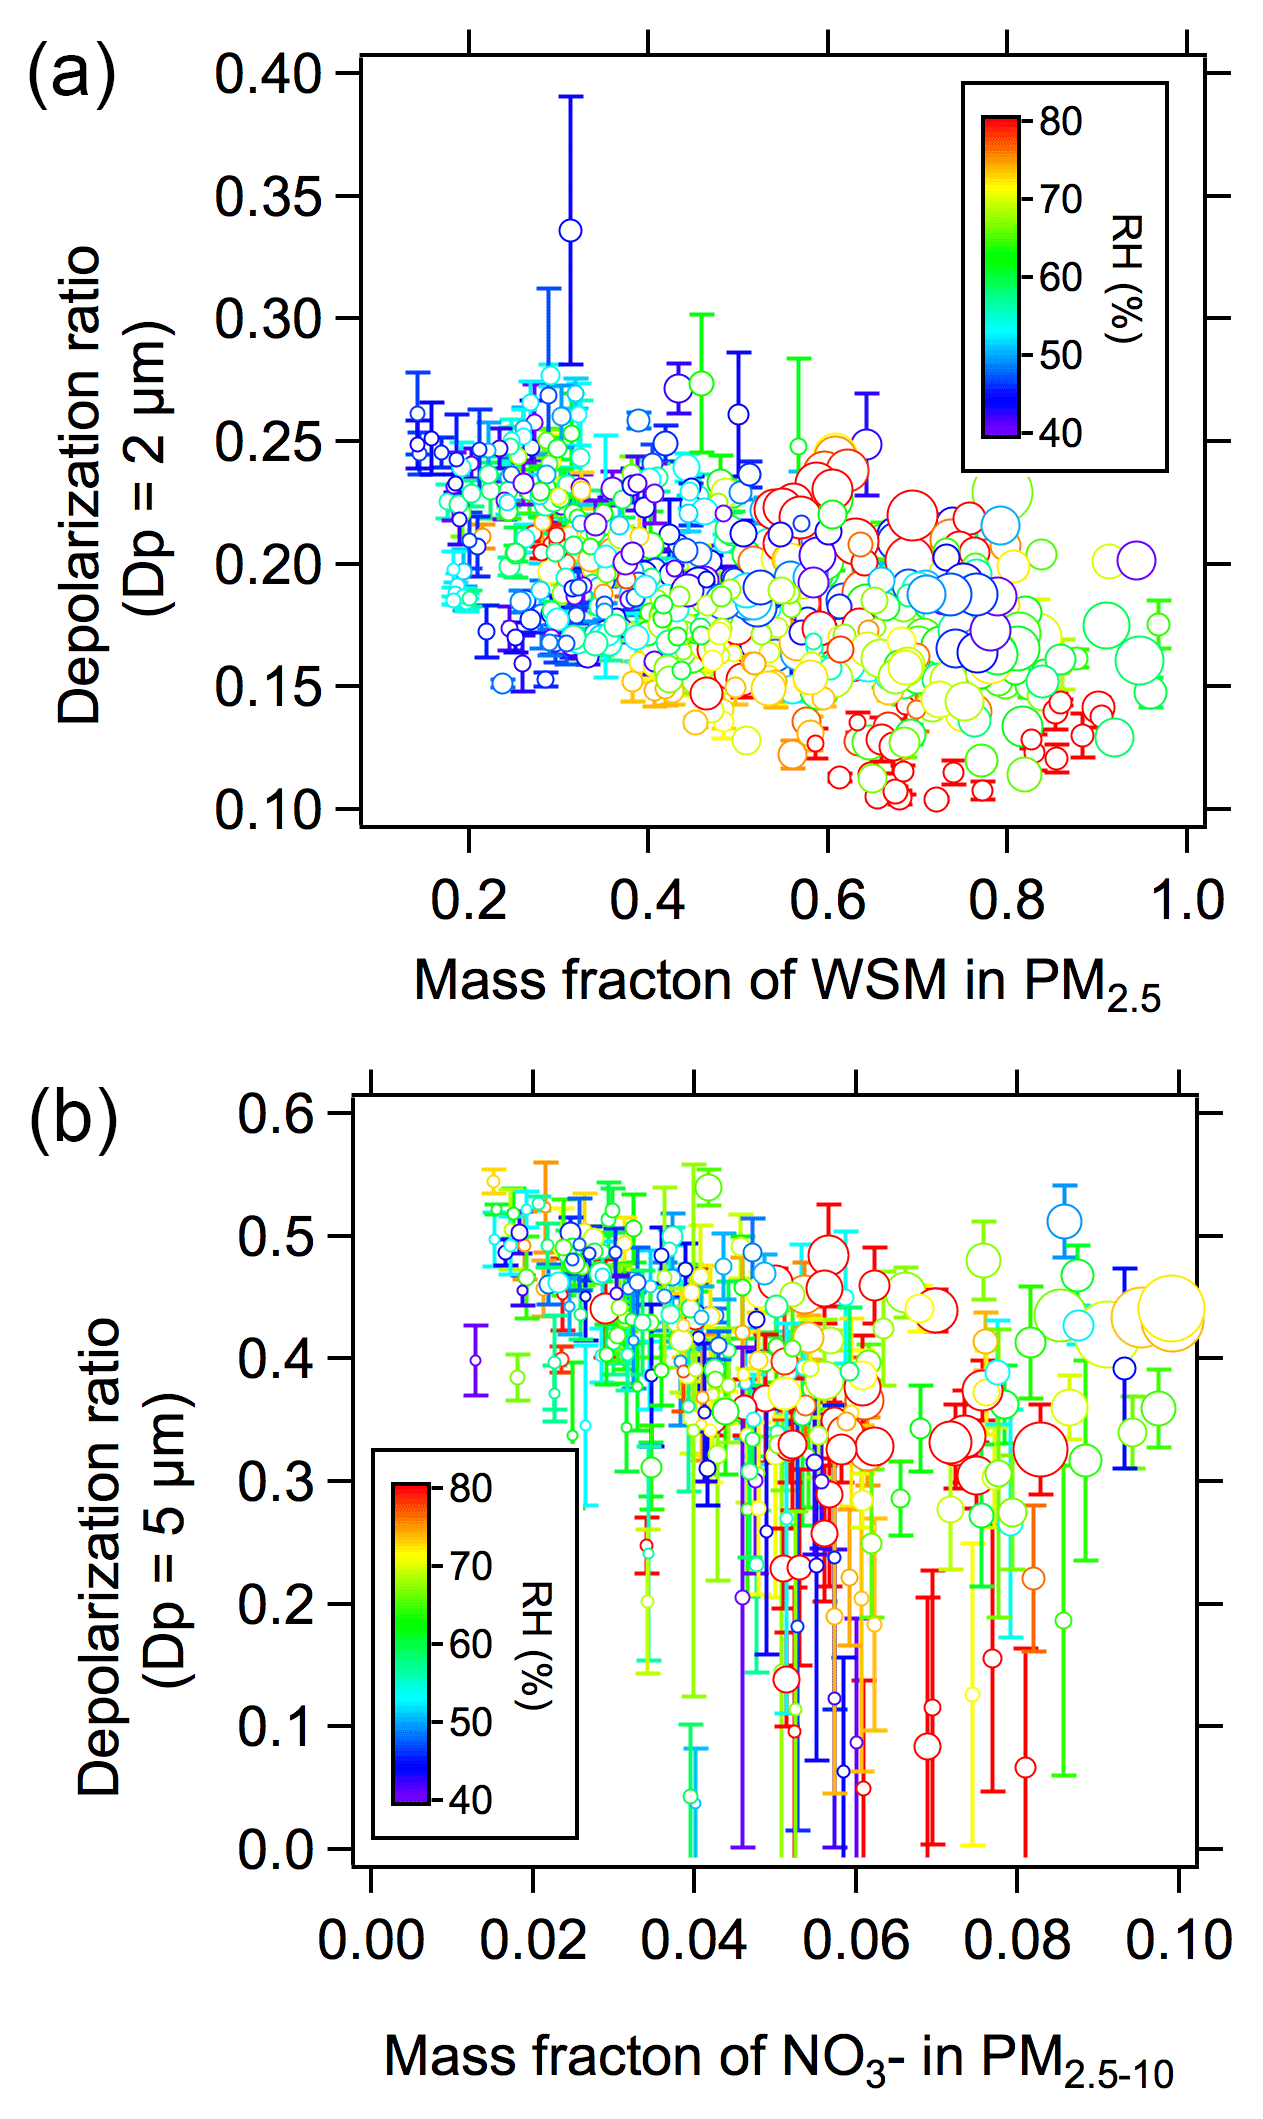
Figure 8The variation in δDp=2 as a function of mass fraction of WSM in PM2.5 (a), and δDp=5 as a function of mass fraction of cNO3 in PM2.5−10. The color represents the hourly-averaged relative humidity (RH) during measurement.
3.5 Impact of heterogeneous reactions on δ values of particles
As shown in Fig. 8, δ values of particles obviously decrease with an increase in mass fraction of WSM, in particular at high RH condition. For the particles at Dp = 2 µm, their δ value was normally 0.3 when mass fraction of WSM in PM2.5 was less than 0.2, whereas it decreased to 0.1 when the mass fraction of WSM increased to 0.6, and RH also increased to 80 % (Fig. 8a). The linear relation was because the growth of particles in fine mode was closely related to formation of secondary inorganic matter (sulfate, nitrate, etc.) and organic aerosols. Throughout the atmospheric chemistry processes, the positive feedback between aerosol and water vapor was ubiquitous. For example, hygroscopic processes of anthropogenic secondary inorganics resulted in abundance of aerosol liquid water content (Wu et al., 2018), and the latter of which could provide an efficient media of multiphase reactions that promote new particle formation and so on. Therefore, the particles in PM2.5 generally approach to spherical in shape, resulting in a low δ value, and the high RH and the high possibility that spherical particles formed. The morphological changes in particles in PM2.5 could be well simulated on the basis of the T-matrix method (Pan et al., 2017).
For mineral dust particles, as discussed, the δDp=5 value (0.3–0.5) was clearly higher than that of particles in fine mode (Fig. 8b). Since the mass concentration of cSO4 and cNH4 were insignificant in coarse mode, the δDp=5 value was plotted versus mass fraction of cNO3 in PM2.5−10. Decrease in δ values of dust particles as a function of mass fraction of cNO3 in PM2.5−10 was also obvious, especially when RH was higher than 60 %. A number of studies have reported that emissions of anthropogenic dust in the NCP was significant, and calcium was the most abundant crustal element in the NCP. We believed that Ca(NO3)2 present on the surface of mineral dust particles, and the decrease in δDp=5 value of particle in coarse mode was mostly due to heterogeneous reactions and consecutive water-absorbing processes. Such kinds of mineral dust particles coated with anthropogenic pollutants have been observed by a number of previous electro-microscopic-based studies. Previous studies (Reitz et al., 2011; Gu et al., 2017; Ma et al., 2013) also demonstrated the presence of cSO4 on the surface of dust particles; nevertheless, we think the effect of cSO4 on the decrease in δDp=5 value was negligible because the mass fraction of cSO4 was tiny (< 0.02) and the CaSO4 was hard to dissolve in limited amounts of aerosol liquid water content. Note that the chemical compounds (such as kaolinite, illite, humic matter, etc.) of particles in coarse mode was very complicated, δDp=5 values just indicate a synthetic effect of morphological changes as a result of all physical and chemical processes. To quantitatively characterize their optical and environmental effect, detailed studies on δDp=5 value variability in one compound in the laboratory was still essentially needed.
Depolarization properties of aerosol particles is an important parameter classifying the aerosol types and describing the variability in morphology of particles, which is affected by complicated mixing processes and heterogeneous reactions. It also has a great impact on its transport and regional or global climate due to the alteration of optical properties of particles. In 2017, a joint field campaign (“In-depth study of air pollution sources and processes within Beijing and its surrounding region”, APHH-Beijing) was performed at an urban site in Beijing. One of key aims of the project is to assess the processes by which pollutants are transformed through atmospheric chemical reactions. Taking this opportunity, we performed an online observation of the depolarization ratio of single particles using a POPC. The chemical compositions (, , WSOC) and acidity of particles in both fine mode (PM2.5) and coarse mode (PM2.5−10) were determined using a continuous dichotomous aerosol chemical speciation analyzer (ACSA-14). The main conclusions are as follows. (1) Depolarization ratio (δ) of ambient particles generally increase with its size due to an increase in irregularity of the particles, and the characteristic values of δ for the particles at Dp = 1 and 2 µm were 0.11, 017, respectively. Once the observation site was influenced by a dust event, both δ values increased to above 0.3 due to the presence of submicron mineral dust particle in irregular shape. The δ value of the particles at Dp = 2 µm was mainly determined by the mass fraction of water-soluble inorganic matter (WSI) in PM2.5, in which water vapor was fully involved in their atmospheric formation processes. (2) In the NCP, anthropogenic dust was an important contributor to the atmospheric loading of particles, their δ values (0.2–0.3) were found to be smaller than that (0.5) of natural dust because of adsorption of acidic substance (such as HNO3) and coagulation with water-soluble anthropogenic pollutants (nitrate, sulfate) and consecutive chemical reactions on the surface of dust. Ambient relative humidity (RH) plays a key role in altering the morphology of mineral dust as a result of hygroscopic processes of deliquescent substances such as Ca(NO3)2, in particular when RH > 80 %. In this study, we found that δ values of mineral dust particles in the NCP could be as small as 0.2, which could be termed as “quasi-spherical”. (3) We found that allocation of anthropogenic pollutants in fine and coarse modes was influenced by the RH along the trajectories of air masses, and increase in nitrate mass in coarse mode was highly associated with the dust event. It indicated that the mineral dust particles in the NCP was mostly coated with anthropogenic pollution, upon which classification and quantitative determination of anthropogenic dust emission was possible, though a pioneering study have been done on the basis of satellite remote sensing and land type (Huang et al., 2015).
In this study, we provided solid evidence of morphological changes in mineral dust particles in the NCP. Variability in δ values of particles is also a valuable parameter for distinguishing how mineral dust particles interacted with anthropogenic pollutants in the formation of regional-scale haze pollution. This result also spurs us to revisit decades of lidar observation data to better describe the transport and vertical distribution of Asian dust and pollution, and its regional environmental effects under the scenarios of China's 30 years of rapid urbanization. A reliable optical model capable of discriminating multiple aerosol types was necessary for detailed analysis of polarization-related remote-sensing observations. This study suggests that an integrated observation network with single-particle-based depolarization measurements is necessary for synthetically understanding physicochemical properties of Asian dust.
To request observation data for scientific research purposes, please contact the corresponding author at the Institute of Atmospheric Physics via email (panxiaole@mail.iap.ac.cn).
The supplement related to this article is available online at: https://doi.org/10.5194/acp-19-219-2019-supplement.
XP, BG and ZW designed the entire study and coordinated all of the analyses. IU, HK and TN performed the T-Matrix model calculation and its related discussion. YT and HL examined the POPC data analyses. PF supported the chromatography chemical analysis; ZW, SY and LW supported the field observation in Beijing. XP wrote the manuscript with valuable input from all of the co-authors.
The authors declare that they have no conflict of interest.
This article is part of the special issue “In-depth study of air pollution sources and processes within Beijing and its surrounding region (APHH-Beijing) (ACP/AMT inter-journal SI)”. It is not associated with a conference.
This work was supported by the Strategic Priority Research Program of the Chinese Academy
of Sciences (grant no. XDA19040201), the National Natural Science Foundation of China
(grant nos. 41675128 and 41571130034), and in part supported by CAS Information
Technology Program (grant no. XXH13506-302). The authors gratefully thank
Yele Sun from the State Key Laboratory of Atmospheric Boundary
Layer Physics and Atmospheric Chemistry/Institute of Atmospheric Physics for their
valuable comments on the original manuscript.
Edited by:
Yongjie Li
Reviewed by: two anonymous referees
Gu, W., Li, Y., Zhu, J., Jia, X., Lin, Q., Zhang, G., Ding, X., Song, W., Bi, X., Wang, X., and Tang, M.: Investigation of water adsorption and hygroscopicity of atmospherically relevant particles using a commercial vapor sorption analyzer, Atmos. Meas. Tech., 10, 3821–3832, https://doi.org/10.5194/amt-10-3821-2017, 2017.
Hara, Y., Yumimoto, K., Uno, I., Shimizu, A., Sugimoto, N., Liu, Z., and Winker, D. M.: Asian dust outflow in the PBL and free atmosphere retrieved by NASA CALIPSO and an assimilated dust transport model, Atmos. Chem. Phys., 9, 1227–1239, https://doi.org/10.5194/acp-9-1227-2009, 2009.
Hara, Y., Nishizawa, T., Sugimoto, N., Matsui, I., Pan, X., Kobayashi, H., Osada, K., and Uno, I.: Optical properties of mixed aerosol layers over Japan derived with multi-wavelength Mie–Raman lidar system, J. Quant. Spectros. and Ra., 188, 20–27, https://doi.org/10.1016/j.jqsrt.2016.06.038, 2017.
He, H., Wang, Y., Ma, Q., Ma, J., Chu, B., Ji, D., Tang, G., Liu, C., Zhang, H., and Hao, J.: Mineral dust and NOx promote the conversion of SO2 to sulfate in heavy pollution days, Sci. Rep., 4, 4172, https://doi.org/10.1038/srep04172, 2014.
Huang, J. P., Liu, J. J., Chen, B., and Nasiri, S. L.: Detection of anthropogenic dust using CALIPSO lidar measurements, Atmos. Chem. Phys., 15, 11653–11665, https://doi.org/10.5194/acp-15-11653-2015, 2015.
Kaufman, Y. J., Tanre, D., and Boucher, O.: A satellite view of aerosols in the climate system, Nature, 419, 215–223, https://doi.org/10.1038/nature01091, 2002.
Kim, J.-S. and Park, K.: Atmospheric aging of Asian dust particles during long range transport, Aerosol Sci. Technol., 46, 913–924, 2012.
Kimoto, H., Ueda, A., Tsujimoto, K., Mitani, Y., and Kimoto, T.: Development of a Continuous Dichotomous Aerosol Chemical Speciation Analyzer, Clean Technol., 23, 49–52, 2013.
Kobayashi, H., Hayashi, M., Shiraishi, K., Nakura, Y., Enomoto, T., Miura, K., Takahashi, H., Igarashi, Y., Naoe, H., and Kaneyasu, N.: Development of a polarization optical particle counter capable of aerosol type classification, Atmos. Environ., 97, 486–492, 2014.
Kojima, T., Buseck, P. R., Iwasaka, Y., Matsuki, A., and Trochkine, D.: Sulfate-coated dust particles in the free troposphere over Japan, Atmos. Res., 82, 698–708, https://doi.org/10.1016/j.atmosres.2006.02.024, 2006.
Krueger, B. J., Grassian, V. H., Laskin, A., and Cowin, J. P.: The transformation of solid atmospheric particles into liquid droplets through heterogeneous chemistry: Laboratory insights into the processing of calcium containing mineral dust aerosol in the troposphere, Geophys. Res. Lett., 30, 1148, https://doi.org/10.1029/2002GL016563, 2003.
Laskin, A., Iedema, M. J., Ichkovich, A., Graber, E. R., Taraniuk, I., and Rudich, Y.: Direct observation of completely processed calcium carbonate dust particles, Faraday Discuss., 130, 453–468, https://doi.org/10.1039/b417366j, 2005.
Li, R., Hu, Y., Li, L., Fu, H., and Chen, J.: Real-time aerosol optical properties, morphology and mixing states under clear, haze and fog episodes in the summer of urban Beijing, Atmos. Chem. Phys., 17, 5079–5093, https://doi.org/10.5194/acp-17-5079-2017, 2017.
Li, W. J. and Shao, L. Y.: Observation of nitrate coatings on atmospheric mineral dust particles, Atmos. Chem. Phys., 9, 1863–1871, https://doi.org/10.5194/acp-9-1863-2009, 2009.
Ma, Q., He, H., Liu, Y., Liu, C., and Grassian, V. H.: Heterogeneous and multiphase formation pathways of gypsum in the atmosphere, Phys. Chem. Chem. Phys., 15, 19196–19204, https://doi.org/10.1039/C3CP53424C, 2013.
Nie, W., Ding, A., Wang, T., Kerminen, V. M., George, C., Xue, L., Wang, W., Zhang, Q., Petaja, T., Qi, X., Gao, X., Wang, X., Yang, X., Fu, C., and Kulmala, M.: Polluted dust promotes new particle formation and growth, Sci. Rep., 4, 6634, https://doi.org/10.1038/srep06634, 2014.
Nishizawa, T., Okamoto, H., Sugimoto, N., Matsui, I., Shimizu, A., and Aoki, K.: An algorithm that retrieves aerosol properties from dual-wavelength polarized lidar measurements, J. Geophys. Res.-Atmos., 112, https://doi.org/10.1029/2002jd003253, 2007.
Nishizawa, T., Sugimoto, N., Matsui, I., Shimizu, A., and Okamoto, H.: Algorithms to retrieve optical properties of three component aerosols from two-wavelength backscatter and one-wavelength polarization lidar measurements considering nonsphericity of dust, J. Quant. Spectros. Ra., 112, 254–267, https://doi.org/10.1016/j.jqsrt.2010.06.002, 2011.
Nishizawa, T., Sugimoto, N., Matsui, I., Shimizu, A., Hara, Y., Itsushi, U., Yasunaga, K., Kudo, R., and Kim, S.-W.: Ground-based network observation using Mie–Raman lidars and multi-wavelength Raman lidars and algorithm to retrieve distributions of aerosol components, J. Quant. Spectros. Ra., 188, 79–93, https://doi.org/10.1016/j.jqsrt.2016.06.031, 2017.
Pan, X., Uno, I., Hara, Y., Kuribayashi, M., Kobayashi, H., Sugimoto, N., Yamamoto, S., Shimohara, T., and Wang, Z.: Observation of the simultaneous transport of Asian mineral dust aerosols with anthropogenic pollutants using a POPC during a long-lasting dust event in late spring 2014, Geophys. Res. Lett., 42, 1593–1598, https://doi.org/10.1002/2014gl062491, 2015.
Pan, X., Uno, I., Hara, Y., Osada, K., Yamamoto, S., Wang, Z., Sugimoto, N., Kobayashi, H., and Wang, Z.: Polarization properties of aerosol particles over western Japan: classification, seasonal variation, and implications for air quality, Atmos. Chem. Phys., 16, 9863–9873, https://doi.org/10.5194/acp-16-9863-2016, 2016.
Pan, X., Uno, I., Wang, Z., Nishizawa, T., Sugimoto, N., Yamamoto, S., Kobayashi, H., Sun, Y., Fu, P., Tang, X., and Wang, Z.: Real-time observational evidence of changing Asian dust morphology with the mixing of heavy anthropogenic pollution, Sci. Rep., 7, 335, https://doi.org/10.1038/s41598-017-00444-w, 2017.
Ramanathan, V., Crutzen, P. J., Kiehl, J. T., and Rosenfeld, D.: Aerosols, climate, and the hydrological cycle, Science, 294, 2119–2124, https://doi.org/10.1126/science.1064034, 2001.
Reitz, P., Spindler, C., Mentel, T. F., Poulain, L., Wex, H., Mildenberger, K., Niedermeier, D., Hartmann, S., Clauss, T., Stratmann, F., Sullivan, R. C., DeMott, P. J., Petters, M. D., Sierau, B., and Schneider, J.: Surface modification of mineral dust particles by sulphuric acid processing: implications for ice nucleation abilities, Atmos. Chem. Phys., 11, 7839–7858, https://doi.org/10.5194/acp-11-7839-2011, 2011.
Shimizu, A., Sugimoto, N., Matsui, I., Arao, K., Uno, I., Murayama, T., Kagawa, N., Aoki, K., Uchiyama, A., and Yamazaki, A.: Continuous observations of Asian dust and other aerosols by polarization lidars in China and Japan during ACE-Asia, J. Geophys. Res.-Atmos., 109, https://doi.org/10.1029/2002jd003253, 2004.
Shimizu, A., Nishizawa, T., Jin, Y., Kim, S.-W., Wang, Z., Batdorj, D., and Sugimoto, N.: Evolution of a lidar network for tropospheric aerosol detection in East Asia, Opt. Eng., 56, 031219, https://doi.org/10.1117/1.oe.56.3.031219, 2016.
Shimizu, A., Nishizawa, T., Jin, Y., Kim, S.-W., Wang, Z., Batdorj, D., and Sugimoto, N.: Evolution of a lidar network for tropospheric aerosol detection in East Asia, Opt. Eng., 56, 031219–031219, 2017.
Sugimoto, N., Matsui, I., Shimizu, A., Uno, I., Asai, K., Endoh, T., and Nakajima, T.: Observation of dust and anthropogenic aerosol plumes in the northwest Pacific with a two-wavelength polarization lidar on board the research vessel Mirai, Geophys. Res. Lett., 29, https://doi.org/10.1029/2002gl015112, 2002.
Sullivan, R. C., Guazzotti, S. A., Sodeman, D. A., and Prather, K. A.: Direct observations of the atmospheric processing of Asian mineral dust, Atmos. Chem. Phys., 7, 1213–1236, https://doi.org/10.5194/acp-7-1213-2007, 2007.
Sullivan, R. C., Moore, M. J. K., Petters, M. D., Kreidenweis, S. M., Roberts, G. C., and Prather, K. A.: Effect of chemical mixing state on the hygroscopicity and cloud nucleation properties of calcium mineral dust particles, Atmos. Chem. Phys., 9, 3303–3316, https://doi.org/10.5194/acp-9-3303-2009, 2009.
Tang, M., Cziczo, D. J., and Grassian, V. H.: Interactions of Water with Mineral Dust Aerosol: Water Adsorption, Hygroscopicity, Cloud Condensation, and Ice Nucleation, Chem. Rev., 116, 4205–4259, https://doi.org/10.1021/acs.chemrev.5b00529, 2016.
Tang, M. J., Whitehead, J., Davidson, N. M., Pope, F. D., Alfarra, M. R., McFiggans, G., and Kalberer, M.: Cloud condensation nucleation activities of calcium carbonate and its atmospheric ageing products, Phys. Chem. Chem. Phys., 17, 32194–32203, https://doi.org/10.1039/C5CP03795F, 2015.
Tobo, Y., Zhang, D., Matsuki, A., and Iwasaka, Y.: Asian dust particles converted into aqueous droplets under remote marine atmospheric conditions, P. Natl. Acad. Sci. USA, 107, 17905–17910, https://doi.org/10.1073/pnas.1008235107, 2010.
Uno, I., Yumimoto, K., Shimizu, A., Hara, Y., Sugimoto, N., Wang, Z., Liu, Z., and Winker, D. M.: 3D structure of Asian dust transport revealed by CALIPSO lidar and a 4DVAR dust model, Geophys. Res. Lett., 35, https://doi.org/10.1029/2007gl032329, 2008.
Uno, I., Eguchi, K., Yumimoto, K., Takemura, T., Shimizu, A., Uematsu, M., Liu, Z., Wang, Z., Hara, Y., and Sugimoto, N.: Asian dust transported one full circuit around the globe, Nat. Geosci., 2, 557–560, 2009.
Wang, Z., Pan, X., Uno, I., Li, J., Wang, Z., Chen, X., Fu, P., Yang, T., Kobayashi, H., and Shimizu, A.: Significant impacts of heterogeneous reactions on the chemical composition and mixing state of dust particles: A case study during dust events over northern China, Atmos. Environ., https://doi.org/10.1016/j.atmosenv.2017.03.044, 2017.
Winker, D. M., Vaughan, M. A., Omar, A., Hu, Y., Powell, K. A., Liu, Z., Hunt, W. H., and Young, S. A.: Overview of the CALIPSO Mission and CALIOP Data Processing Algorithms, J. Atmos. Ocean. Tech., 26, 2310–2323, https://doi.org/10.1175/2009jtecha1281.1, 2009.
Wu, Z., Wang, Y., Tan, T., Zhu, Y., Li, M., Shang, D., Wang, H., Lu, K., Guo, S., Zeng, L., and Zhang, Y.: Aerosol Liquid Water Driven by Anthropogenic Inorganic Salts: Implying Its Key Role in Haze Formation over the North China Plain, Environ. Sci. Tech. Let., 5, 160–166, https://doi.org/10.1021/acs.estlett.8b00021, 2018.
Zhang, X.-X., Sharratt, B., Liu, L.-Y., Wang, Z.-F., Pan, X.-L., Lei, J.-Q., Wu, S.-X., Huang, S.-Y., Guo, Y.-H., Li, J., Tang, X., Yang, T., Tian, Y., Chen, X.-S., Hao, J.-Q., Zheng, H.-T., Yang, Y.-Y., and Lyu, Y.-L.: East Asian dust storm in May 2017: observations, modelling, and its influence on the Asia-Pacific region, Atmos. Chem. Phys., 18, 8353–8371, https://doi.org/10.5194/acp-18-8353-2018, 2018.
Zheng, S., Pozzer, A., Cao, C. X., and Lelieveld, J.: Long-term (2001–2012) concentrations of fine particulate matter (PM2.5) and the impact on human health in Beijing, China, Atmos. Chem. Phys., 15, 5715–5725, https://doi.org/10.5194/acp-15-5715-2015, 2015.