the Creative Commons Attribution 4.0 License.
the Creative Commons Attribution 4.0 License.
The measurement of atmospheric CO2 at KMA GAW regional stations, its characteristics, and comparisons with other East Asian sites
Sang-Ok Han
Sang-Boom Ryoo
Jeong-Soon Lee
Gang-Woong Lee
To understand the carbon cycle at policy-relevant spatial scales, a high density of high-quality CO2 measurement sites is needed. In 2012, the Korea Meteorological Administration (KMA) installed CO2 monitoring systems at Anmyeondo (AMY) in the west, Jejudo Gosan Suwolbong (JGS) in the southwest, and Ulleungdo (ULD) in the east of South Korea. Three stations were instrumented with identical greenhouse gas measurement systems based on cavity ring-down spectroscopy (CRDS) and a new drying system developed by KMA and the Korea Research Institute of Standards and Science (KRISS). This drying system is suitable in humid areas; water vapor measured using CRDS in ambient air was 0.001 % to 0.004 % across the stations. Measurement uncertainties expressed by the quadrature sum of the uncertainties from the drying system, scale propagations, repeatability, and reproducibility were ∼0.11 ppm from all KMA stations in the 68 % confidence interval. Average monthly CO2 enhancements above the local background at each station were 4.3±3.3 ppm at AMY, 1.7±1.3 ppm at JGS, and 1±1.9 ppm (1σ) at ULD, respectively, during 2012 to 2016. At AMY station, located between China and South Korea, CO2 annual means and seasonal variations are also greater than the other KMA stations, indicating that it is affected not only by local vegetation, but also added anthropogenic sources. Selected baseline CO2 at AMY and at JGS in the west of South Korea is more sensitive to East Asia (e.g., China) according to wind direction and speed. Through the comparison of long-term trends and growth rates at AMY with other East Asian stations over 15 years, it was suggested that they could be affected not only by local vegetation but also by measurement quality.
Carbon dioxide, the most important anthropogenic greenhouse gas, is one of the main drivers of climate change on Earth. Measurements of atmospheric CO2 have assumed increased importance to track the increase in global CO2 due to fossil fuel combustion (Canadell et al., 2007; Knorr, 2009).
Roughly half of anthropogenic CO2 emitted by fossil fuel combustion is stored in the atmosphere, whereas the other half is absorbed by the oceans and terrestrial ecosystems. Recent studies showed the atmospheric CO2 network is not yet dense enough to confirm or invalidate the increased global carbon uptake, estimated from ocean measurement or ocean models (Wanninkhof et al., 2013), but emphasized that the combination of a highly dense observation network, coupled with atmospheric models, leads to better understanding of regional carbon fluxes (Dolman et al., 2009). Therefore, confidence in our understanding of carbon cycle processes may be improved by a higher density of continuous measurement sites.
There are now over 400 regional stations monitoring atmospheric CO2 under the Global Atmosphere Watch Programme (GAW) of the World Meteorological Organization (WMO) (https://gawsis.meteoswiss.ch, last access: 1 December 2014). These sites capture more regional-scale information on fluxes than global stations, which reflect only well-mixed air mass. However, if technical measurement skill and data quality control are not sufficient, the data may not be useful to help identify and understand changes to the carbon cycle caused by climate change. Also, both measurement uncertainty and imperfect knowledge of the composition of background air can limit the precision of observation-based estimates of local- or regional-scale greenhouse gas enhancements (Turnbull et al., 2009, 2015; Graven et al., 2012).
The Korean Peninsula is important due to its location, as it is affected by flow from the Asian continent, especially China. South Korea's atmospheric CO2 monitoring history started at Tae-Ahn Peninsula (TAP; 36∘44′ N, 126∘08′ E; 20 m a.s.l.), in the west of South Korea, in 1990 with weekly flask-air samples as a part of the NOAA/CMDL/GMD Cooperative Global Air Sampling Network (http://www.esrl.noaa.gov/gmd/ccgg/flask.php, last access: 1 August 2018). Studies demonstrated that its regional characteristically high CO2 was affected by China's industrial regions, while CH4 was affected by Russian wetlands and local rice cultivation near TAP (Dlugokencky et al., 1993; Kim et al., 2014).
Since 1999, the Korea Meteorological Administration (KMA) has been monitoring atmospheric CO2 at Anmyeondo (AMY; 36.53∘ N, 126.32∘ E; 46 m above sea level from a 40 m tower), about 28 km from TAP. Nevertheless, this was the first attempt to continuously monitor CO2 in South Korea. In 2012, KMA expanded its monitoring network to include data from the southwest (Jejudo Gosan Suwolbong, JGS; 33.30∘ N, 126.16∘ E) and the east (Ulleungdo, ULD; 37.48∘ N, 130.90∘ E) of South Korea to cover the whole peninsula for a better understanding of CO2 sources and sinks. At the same time, all three monitoring stations started to use analyzers based on cavity ring-down spectroscopy (CRDS; a different model at each station; Picarro, CA, USA) with the same measurement method. So far, even though measurements began in 1999 at AMY, there is no published description of methods used to measure and process the data from the three KMA sites.
In this paper, we present the CO2 measurement such as the sampling system, data quality, and processing methods at these three KMA monitoring stations. The measurement uncertainties are calculated separately from the hourly, daily, and monthly standard deviations, which include natural variability and measurement uncertainty. We analyze the characteristics of CO2 at KMA stations during 2012 to 2016 and compare the data to other stations in East Asia: the global background WMO GAW station in Waliguan (WLG; 36.28∘ N, 100.90∘ E; 3810 m), China, and Ryori (RYO; 30.03∘ N, 141.82∘ E; 260 m), which reflects global growth rates as a regional WMO GAW station in Japan (Watanabe et al., 2000). In addition, we present 15 years of long-term CO2 measurements in East Asia, including those from AMY. Furthermore, this paper will serve as a reference for KMA data archived at the World Data Centre for Greenhouse Gases.
2.1 Sampling sites
The locations of Anmyeondo (AMY), Jejudo Gosan Suwolbong (JGS), and Ulleungdo (ULD) stations are shown in Fig. 1, and their details are summarized in Table 1.
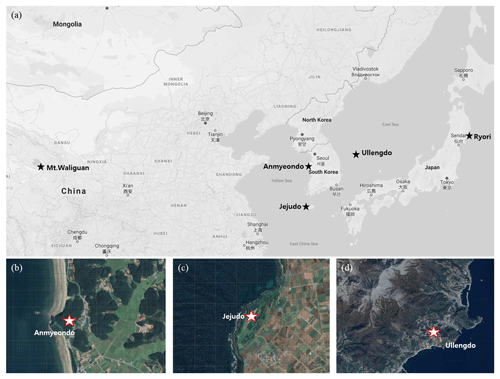
Figure 1Locations of (a) the three KMA monitoring stations in South Korea, and Mt. Waliguan WMO GAW global station and Ryori WMO GAW regional station in East Asia. Surrounding environment of the (b) Anmyeondo (AMY), (c) Jejudo Gosan Suwolbong (JGS), and (d) Ullengdo (ULD) stations. These figure panels are derived from Google Maps.
AMY is located in the west part of South Korea, about 130 km southwest of the megacity of Seoul. Within a 100 km radius, the semiconductor industry and relevant industries exist. Also, the largest thermal power plants fired by coal and heavy oil in South Korea are within 35 km of the northeast and southeast of the station. Local activity is related to agriculture, such as rice paddies, sweet potatoes, and onions, while the area is also known for its leisure opportunities during summer. The west and south side of AMY is open to the sea and along the coast, and there is a large tidal mudflat with many pine trees.
Table 1Information about the three KMA monitoring stations in South Korea and the two monitoring stations in East Asia.

* ULD is not a GAW station.
JGS is located in the west part of Jeju Island, which is the biggest volcanic island (1845.88 km2) in the southwest of South Korea and about 90 km from the mainland. Jeju is popular for tourists regardless of the season, while the region of Suwolbong is famous as a Global Geopark due to the outcrops of volcanic deposits exposed along the coastal cliff where JGS is located. In Jeju, there are two major power plants fired by heavy oil at approximately 47 km northeast and 16 km southeast of the stations. The side of the station from the southwest to the northwest is open to the sea, where there are volcanic basalt rocks. The sea to the south is connected to the East China Sea and the sea to the west is linked to the Yellow Sea. Next to JGS there is a wide plain where mainly potatoes, garlic, and onions are harvested.
ULD is located in the east part of Ulleung Island, which is in the east of South Korea and about 155 km from the mainland. In the southeast of the Korean Peninsula, there are cities very famous for steel, chemical, and petrochemical industries along the coastline, and these cities are located about 200–250 km southwest of the island. Ulleung Island is 72 km2 and of volcanic origin, and it is a rocky steep-sided island, with the top of a large stratovolcano reaching a maximum elevation of 984 m. This peak is located northwest of ULD. There are a few small mountains whose heights are about 500 to 960 m a.s.l., within 5 km to the north and southeast of the station. Due to those geological features, ULD is mainly affected by airflow up over the hill from the southwest and downslope winds from the northeast. There is also a small town in the valley northeast of the station with a small port, which is 810 m away from the station. In the southwest area, there is a small brickyard 200 m from the ULD. Farming and fishing industries are very active on the island, though there is no farm in the southern area. An automatic weather station (AWS) was installed at AMY near the inlet, and 10 m above the station at JGS and ULD, but separate from the air inlet tower.
2.2 Measurement system: inlet, drying system, and instruments
The measurement system consists of three main parts: the inlet, the drying system, and the instruments (Fig. 2). The intake is an inverted stainless steel box (15 cm (W) × 25 cm (D) × 30 cm (H)) with a stainless steel filter (D 4.7 cm, pore size 5 µm) mounted on a plastic mesh holder and connected to the Dekabon sampling tubing (Nitta Moore 1300-10, I.D. 6.8 mm, O.D. 10 mm). Over times longer than 1 month, a significant pressure drop occurs between the inlet and the pump, so the filter is replaced monthly.
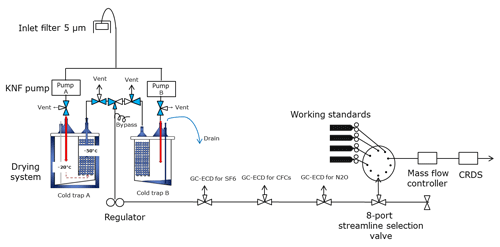
Figure 2Schematic of the in situ system when the drying system is at the state described in Step 3 in AMY, JGS, and ULD.
Sample air is dried with a system that has a cold trap (CT-90, Operon, South Korea), which is connected to the pump (KNF N145.1.2AN.18, Germany, 55 L min−1, 7 bar in AMY; KNF N035AN.18, Germany, 30 L min−1, 4 bar in JGS and ULD). The cold trap is set to −80 ∘C and maintains its temperature. When the sample air comes from outside into the drying system, the inner temperature increases. Therefore ambient air is cooled down to −20 ∘C in the first chamber, and then to −50 ∘C in the second chamber. To increase dehumidification efficiency, the second chamber is filled with stainless steel beads (Fig. 2).
One of the dual traps is used to dry ambient air for 24 h while the other is warmed and drained. The dehumidification and water drain sequence is as follows: Step 1: pump/cold trap A is employed to dry ambient air for 24 h. Step 2: pump/cold trap B is turned off to melt ice at ambient temperature for 20 h. Step 3: pump B turns on to pressurize and allow water to drain for 2 h. Step 4: cold trap B turns on and cools to operating temperature for 2 h. The difference between this system and a typical cryogenic one is that it was designed with a dual mode, with one trap drying while water is automatically drained from the other. Therefore it avoids the cold trap impinger clogging during long-term, unattended monitoring. This drying system was developed by KMA and the Korea Research Institute of Standards and Science (KRISS) in 2011 for the remote monitoring stations so that it can be easily accessed remotely.
Even though the H2O monitored using CRDS was not calibrated, hourly mean H2O through the drying system is 0.004±0.005 % at AMY, 0.001±0.002 % in JGS, and 0.001±0.004 % in ULD during 2012 to 2016. Laboratory standard gases prepared by the Central Calibration Laboratory (CCL), which is operated by the National Oceanic and Atmospheric Administration, Global Monitoring Division in Boulder, Colorado, USA, typically contain less than 0.0001 % H2O (http://www.esrl.noaa.gov/gmd/ccl/airstandard.html, last access: 1 August 2018). When we sampled them directly using CRDS without this drying system, mean H2O (10 min average) was 0.0009 % regardless of the CO2 level across the KMA monitoring stations.
For example, when there is a difference in H2O at AMY between laboratory standard gases and ambient samples of 0.003 %, this creates a small bias of 0.012 ppm on 400 ppm CO2 according to the equation suggested by Rella et al. (2013):
where C is the CO2 mole fraction and Hact is the actual water mole fraction (in %). Since working standards showed almost the same level of H2O to laboratory standards through using CRDS, we considered the CO2 mole fraction dilution offsets between calibration standards and sample air when the uncertainty was estimated (Sect. 3.1).
After the drying system, ambient air flows through the 1∕8 in. (O.D.) stainless steel tubing to an 8-port multi-position valve (VICI, EMTMA-CE), which selects among standard gases and ambient air. A leak test of all lines is performed every month. CRDS is well known for its highly linear and stable response (Crosson, 2008). The G2301 model (Picarro, USA) was installed in October 2011, and it became our official CO2 measurement at AMY starting on 1 January 2012. Picarro models G1301 and G2401 have been used to measure ambient CO2 and CH4 since 1 January and 12 February in 2012, at JGS and ULD, respectively. Those analyzers monitor CO2 every 5 s across the KMA greenhouse gas (GHG) network.
At AMY, a non-dispersive infrared analyzer (NDIR; Ultramat 6, Siemens, Germany) was used to monitor atmospheric CO2 every 30 s from 1 February 1999 to 31 December 2011. During the period, we used a three-step dehumidification system, (1) −4∘ cold trap, (2) nafion, and (3) Mg(ClO4)2, before installing the new system.
2.3 Calibration, quality control, and data processing
2.3.1 Calibration method
The metrological definition of calibration is followed, operation that, under specified conditions, in a first step, establishes a relation between the quantity values with measurement uncertainties provide by measurement standards and corresponding indications with associated measurement uncertainties and, in a second step, uses this information to establish a relation for obtaining a measurement result for an indication (JCGM, 2012).
After starting to operate the KMA GHG network in 2012, we calibrate our instruments against the WMO-X2007 scale with our working standards. Our standard hierarchy consists of the laboratory standards from CCL, which are the highest rank in our network (https://www.empa.ch/web/s503/gaw_glossary, last access: 1 December 2018), and working standards that are certified by the laboratory standards. Four laboratory standards are prepared from 360 to 480 ppm, with an uncertainty of ±0.070 ppm (Zhao and Tans, 2006). Since AMY is a central lab for the GHG network, working standards used at three stations are filled and certified by laboratory standards using CRDS for CO2 dry mole fraction at AMY. We have four working standards at each station from 360 to 460 ppm at intervals of 30–40 ppm, with an uncertainty of ±0.088 ppm after transferring the scale. This value is also used as the scale propagation factor of the measurement uncertainty in Sect. 3.1.
Our ability to maintain and propagate the WMO-X2007 scale was shown through the 6th Round Robin comparison of standards hosted by the CCL (https://www.esrl.noaa.gov/gmd/ccgg/wmorr/wmorr_results.php, last access: 1 December 2018; the difference of low-level CO2 was 0.03±0.04 ppm, while it was 0.04±0.06 ppm for high CO2), a comparison of continuous measurements with the traveling instrument of the World Calibration Centre (WCC-Empa, 2014 and 2017a, b), and a co-located comparison of discrete samples collected at AMY and analyzed by NOAA ESRL with our in situ analyzer results. This ongoing comparison between Level 1 (L1) hourly data from using CRDS and weekly flask-air samples collected at AMY has been implemented since December 2013. The mean difference between flask-ask samples minus in situ samples is ppm from 2014 to 2016, close to GAW's compatibility goal for CO2 in the Northern Hemisphere (±0.1 ppm) (Fig. 3).
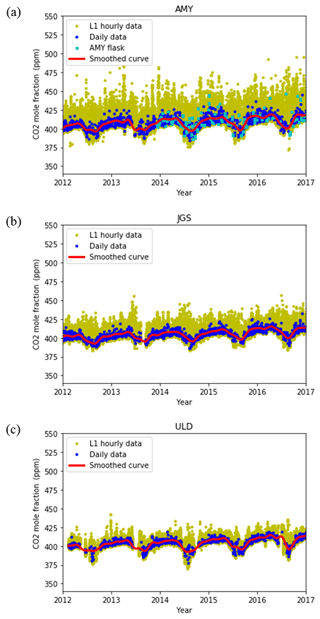
Figure 3L1 hourly data (yellow dots, CO2 OBS), L2 daily data (blue dots), and smoothed curves fitted to L2 daily averages (red line, CO2 BG) at (a) AMY, (b) JGS, and (c) ULD.
The analyzers are calibrated every 2 weeks; all four working standard gases are sampled using CRDS for 40 min. The first 30 min of each cylinder run is rejected and 10 min is used for the calibration of CO2 to ensure instrument stabilization. Four standards are adequate to determine CO2, as indicated by mean residuals of 0.0003±0.026 ppm from a linear function fitted to the measurements of standards. Calibration connects analyzer response to the WMO-X2007 scale and also tracks drift in the analyzer. The drift of CRDS over 2 weeks is negligible, indicating that the mean values were ∼0.006 ppm at AMY, ∼0.001 ppm at JGS, and ppm at ULD respectively. Therefore the calibrations are applied as a stepwise change fortnightly.
When we started monitoring atmospheric CO2 with a NDIR at AMY, it was calibrated every 2 h with 4-point calibration tanks against the KRISS scale from February 1999 to December 2011. During this period, we used the cylinders which were certified by KRISS directly without working standards. KRISS and WMO scales agreed well in CCQM-P41 organized by the International Bureau of Weights and Measures (BIPM) (https://www.bipm.org/utils/common/pdf/final_reports/QM/P41/CCQM-P41_part1.pdf, last access: 11 February 2019).
2.3.2 Data quality control process
All data are monitored, collected, and stored at the Environmental Meteorological Research Division (EMRD), National Institute of Meteorological Sciences (NIMS) in Jeju, South Korea. Raw data based on 5 s intervals are processed two ways: (1) auto-flagging and (2) manual flagging. Auto-flagging identifies instrument malfunction and the instrument detection limit of CO2. Auto-flags are assigned when our algorithm detects deviations from prescribed ranges for analyzer engineering data.
Acceptable values for the parameters related to instrument function are H2O (%) < 0.02; 139.95 < cavity pressure (Torr) < 140.05; and 44.99 < cavity temperature (∘) < 45.01. H2O > 0.02 % indicates periods when the drying system had problems or a leak in the gas line occurred, while the ranges of cavity pressure and temperature were suggested by the manufacturer. The instrument measurement range is based on the calibration range, from 360 to 460 ppm at 30–40 ppm intervals. Therefore flags are assigned when CO2 is outside this range.
Manual flags are assigned by technicians at each station according to the logbook based on inlet filter exchange, diaphragm pump error, low flow rate, dehumidification system error, calibration periods, experimental periods such as participation in comparison experiments, observatory environmental issues such as construction next to a station, extreme weather, or other issues related to the instrument. These codes refer to definitions by the World Data Centre for reactive gases and aerosols maintained by EBAS for the GAW Programme (http://www.nilu.no/projects/ccc/flags/flags.html, last access: 1 July 2017) and were modified for the South Korean network.
Data with flags are reviewed by scientists at the EMRD, and valid data are selected as Level 1 (L1).
2.3.3 Regional background selection method
L1 data include local and long-range-transported pollution by human and/or biotic activities. Therefore, only those data that represent non-polluted and well-mixed air should be selected for analysis on a regional scale. The data are selected for background when they meet the following conditions. (1) Hourly averages are calculated when there are at least 60 30 s measurements from the NDIR and at least 300 5 s measurements using CRDS, (2) the hourly average of Level 1 has a standard deviation less than A, (3) and the differences between consecutive hourly averages are less than B. A and B were determined empirically and are equal. We determined 1.8 ppm for AMY, 1 ppm for JGS, and 0.8 ppm for ULD. This process selects 55 % to 60 % of the data at each station, and they are defined as Level 2 (L2) hourly data. To calculate daily averages (L2 daily), at least 6 L2 hourly data are required. In this paper, the smoothed curves fitted to L2 daily data are calculated with methods by Thoning et al. (1989) to represent the regional baseline as reducing noise due to synoptic-scale atmospheric variability and measurement gaps. Figure 3 shows L1 hourly data, L2 daily data, and the smoothed curves fitted to L2 daily data.
3.1 Measurement uncertainty
Variability in CO2 observed at KMA's stations includes contributions from natural atmospheric variability and variability related to the air handling and measurement procedures. Natural atmospheric variability is represented, for example, by the standard deviation of all measurements contributing to a time average, after the contribution of experimental noise is accounted for. Here we develop methods to calculate practical realistic measurement uncertainties. Based on measurements of target cylinders and a co-located comparison of measurements at AMY, we assume systematic biases are negligible. According to the previous studies, the total measurement uncertainty consists of multiple uncertainty components (Andrews et al., 2014, Verhulst et al., 2017). However, in this paper, we assess the measurement uncertainty based on the following components:
where UT is the total measurement uncertainty in the reported dry-air mole fractions, is the uncertainty from the drying system, Up is repeatability, Ur is reproducibility, and Uscale the uncertainty of propagating the WMO-XCO2 scale to working standard gases.
is computed from the differences in H2O (%) between the ambient airstream through the drying system and standard gases injected directly, bypassing the drying system. According to the GAW recommendation, the standard gases should be treated through the same system to air sample (WMO, 2016). However, our drying efficiency is not constant, so we injected standard gases directly as a reference value. Here, we define H2O from the standard gases as 0.0009 %. This value was constant and stable during 2012 to 2016. On the other hand, the drying system efficiency is not constant, so this uncertainty component was time dependent. Equation (1) was applied to this factor, where Hact is the difference between H2O in samples and standard gases (0.0009 %). Hourly CO2 dilution offsets range from −0.05 to 0.09 ppm at AMY, −0.02 to 0.07 ppm at JGS, and −0.05 to 0.08 ppm at ULD during 2012 to 2016. Since positive and negative values are found, we use the following equation:
where Ux represents , x is the hourly CO2 dilution offsets from Eq. (1), and N is the total number of hourly mean values. is tabulated for each station in Table 2.
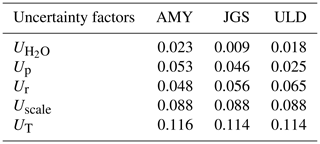
Table 2The uncertainty estimates for measurements of CO2 at each station from 2012 to 2016. Units are ppm. All terms are in the 68 % confidence interval.
Up is determined from the standard deviations of working standard measurements, as described in Sect. 2.3.1 and expressed by a pooled standard deviation:
where Si is the standard deviation of 10 min averages of working standard measurements, Ni the number of data during 10 min (based 5 s intervals), and Nt is the total number of calibrations during the period. Si varied from 0.02 to 0.09 ppm at AMY, 0.02 to 0.07 ppm at JGS, and 0.01 to 0.05 at ULD. The pooled standard deviations (Up) are shown in Table 2.
Ur is the drift occurring between 2-weekly calibration episodes, which was mentioned in Sect. 2.3.1. We determined it as the differences in CO2 measured from cylinders with subsequent calibrations over 2 weeks. It ranged from −0.08 to 0.1 ppm at AMY, −0.07 to 0.09 ppm at JGS, and −0.16 to 0.11 ppm at ULD. We expressed Ur as the standard deviation of all drift values during the experimental period using Eq. (3), where Ux represents Ur, xΔCO2 during 2 weeks, and N is the total number of data. They are tabulated with other uncertainty terms by site in Table 2.
According to the Zhao and Thans (2006) the uncertainty of working standards can be calculated by the propagation error arising from the uncertainty of primaries with maximum propagation coefficient (γ=1) and repeatability. Similarly Uscale for working standards is determined by
where Ulab is the uncertainty of laboratory standards, which CCL (NOAA∕ESRL) certified. Here, Ulab has the same value as the uncertainty of secondaries, 0.070 ppm, in the 1σ absolute scale. These values are the same for all stations since they are calibrated by a central lab in AMY. Therefore Up is the repeatability at AMY since we propagate the standard scale through the same analyzer and setup for the atmospheric monitoring.
In the future, quoted uncertainties could be greater due to the inclusion of more error sources. Repeatability and reproducibility may become more precise with improvements in technologies and methods.
3.2 CO2 data from 2012 to 2016 at KMA's three monitoring stations
The L1 hourly data, L2 daily data, and smoothed curves fitted to L2 daily data are shown in Fig. 3. Episodes of elevated CO2 were often observed at AMY, with a mean difference between maximum and minimum L1 hourly values in a year of ppm; for the other sites, maximum minus minimum values were ppm at JGS and ppm in ULD. The enhancement relative to the local background mole fraction helps evaluate local additions of CO2, with the excess signal defined as
where CO2OBS is L1 hourly data and CO2BG indicates regional background at the site, determined from the smoothed curve fitted to L2 daily data (Sect. 2.3.3). When we roughly analyzed the footprints for hourly CO2XS at three stations, the potential source region was considered not only to be the Korean Peninsula but also northeastern China (KMA, 2014). This happens due to the synoptic system in which the developing low pressure over the source regions causes the pollution to uplift into the free troposphere and makes it descend to the downwind area (Tohjima et al., 2010, 2014; Lee et al., 2016).
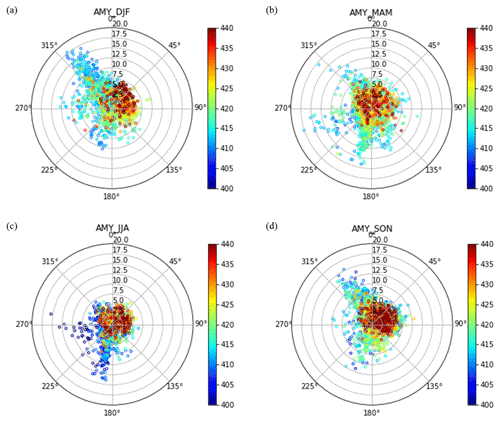
Figure 4Bivariate polar plots for observed CO2 (L1) in winter (a), spring (b), summer (c), and autumn (d) at AMY in 2016
Monthly mean CO2XS at AMY was 4.3±3.3 ppm, with 1.7±1.3 ppm at JGS and 1.0±1.9 ppm at ULD during 2012 to 2016. As described in Sect. 2.1, since there are a lot of local activities around AMY, the mean value is larger than at other stations. It was assumed that CO2XS is greater in winter compared to other seasons since photosynthesis is not active and respiration is diminished, while anthropogenic sources such as residential sectors would dominate. However, all three stations showed the highest CO2XS in summer (JJA); it was 6.3±4.9 ppm at AMY, 2.8±1.4 ppm at JGS, and 1.6±2.7 ppm at ULD. Meanwhile the smallest CO2XS was during spring (MAM) at AMY with 2.8±1.5 ppm and during winter (DJF) at JGS and ULD with 0.9±0.5 ppm and 0.4±0.4 ppm, respectively. Even though the selected data, which agree with the conditions given in Sect. 2.3.3, accounted for 55 % to 60 % of total data, the percentages are different according to the seasons. For example, during summer they decreased to 46 % at AMY, 43 % at JGS, and 34 % at ULD; meanwhile they account for 61 %–75 % at all stations during winter. This means that since the Korean Peninsula is affected by the Siberian high from winter to spring with a strong westerly wind, CO2OBS was measured in well-mixed air relative to summer. Also, the wind speed decreased and diurnal variation increased during summer, so CO2OBS might reflect local/regional sources and sink more than other seasons. We also discuss this issue in Sect. 3.3 and 3.4.
3.3 Local/regional effects on observed CO2
To understand the influence of local surface wind on observed CO2, bivariate polar plots were used. These plots are expressed by dependence of all hourly CO2 mole fractions (L1 data) on wind direction and speed in 2016 (Figs. 4–6). The wind data are derived from the AWS which was described in Sect. 2.1.
At AMY, lower CO2 from autumn to winter occurred when winds mainly come from 315 to 360∘. In spring, lower CO2 started to include winds from 180 to 225∘ and the dominant wind direction shifted to the south (180 to 225∘) in summer, indicating that lower CO2 is linked to air masses from the sea (Yellow Sea). However, when wind speed is less than 5 m s−1, CO2 is elevated in all seasons and even in the Yellow Sea. Especially in summer, this condition (wind speed < 5 m s−1) accounts for 80 % of total data, which might enhance CO2XS, as indicated in Sect. 3.2. This also suggests that the high CO2 can be observed in the air mass transported from not only from mainland South Korea but also from west regions from western parts of the Yellow Sea.
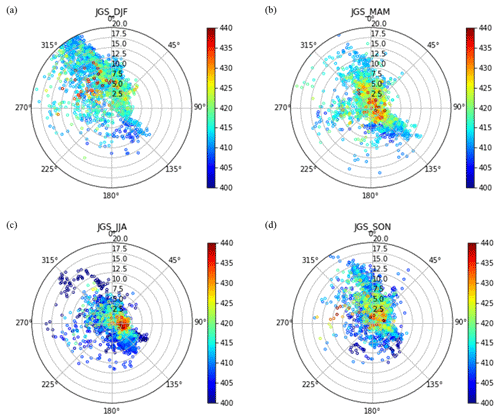
Figure 5Bivariate polar plots for observed CO2 (L1) in winter (a), spring (b), summer (c), and autumn (d) at JGS in 2016.
JGS observed the strongest winds among the three stations for all seasons, with wind speed > 7 m s−1 occurring almost 36 % of the time and a maximum speed of up to ∼40 m s−1. Lower CO2 was observed with winds from 315 to 340∘ (Yellow Sea) and 120 to 160∘ (East China Sea), with wind speed > 5 m s−1 regardless of seasons. In contrast, JGS is contaminated with local CO2 emissions when wind comes from 45 to 135∘ with wind speed ≤5 m s−1. Since the National Geopark is east of the station, JGS could be affected by tourist activities such as transportation. The station is surrounded by farmlands, so it also could be affected by farming activities such as burning trash and fields. High CO2 was also observed even with strong wind, especially on the side of the Yellow Sea.
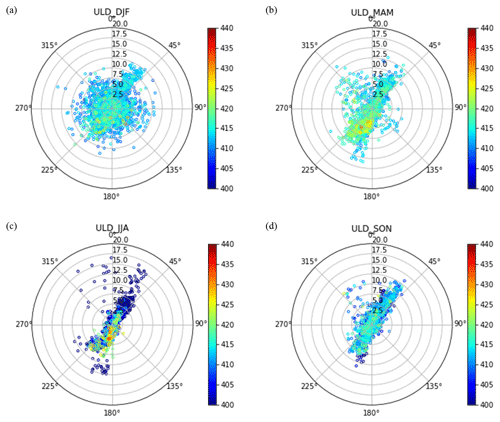
Figure 6Bivariate polar plots for observed CO2 (L1) in winter (a), spring (b), summer (c), and autumn (d) at ULD in 2016.
For ULD, the main wind directions are quite clearly from 0 to 90∘ (30 %) and from 180 to 270∘ (33 %), and wind speed less than 5 m s−1 occurs 72 % of the time. Normally lower CO2 is monitored regardless of wind direction and wind speed. High CO2 episodes were mainly observed when the wind sector was between 180 to 225∘, presumably affected by the industry complex located in the southeast of the Korean Peninsula and the brickyard 200 m from the station. This wind direction is very dominant in summer with lower wind speed than other seasons.
Overall, both stations on the west side of South Korea, AMY and JGS, might be more affected by continental air mass, so their observations contain information about its sources and sinks, while they are also affected by local activities. Our eastern station, ULD, reflects lower CO2 than other two stations with limited local activities. And it was also suggested that data from regional GAW stations have complex information, so it is necessary to develop a selection method for baseline conditions to better understand regional characteristics.
3.4 Average diurnal variation
Diurnal CO2 variations, calculated as the average departure from the daily mean, in April, August, November, and January, are used to represent the average diurnal variations in spring, summer, autumn, and winter over 5 years in Fig. 7. The standard deviations of the hourly means are ∼16, ∼7, and ∼5 ppm in AMY, JGS, and ULD in January, April, and November, but increased in August to ∼20, ∼10, and ∼8 ppm at AMY, JGS, and ULD, respectively.
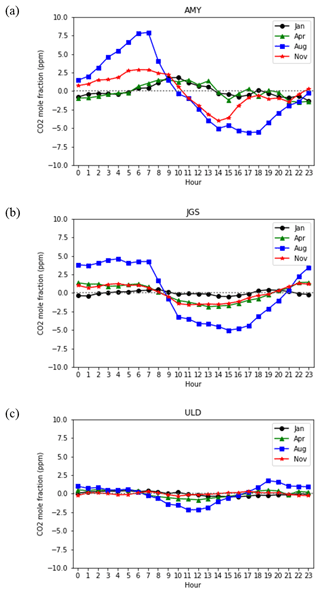
Figure 7Mean diurnal variations of CO2 mole fraction. Values show the average departure from the daily mean in January, April, August, and November at (a) AMY, (b) JGS, and (c) ULD from 2012 to 2016.
Prior studies described that diurnal variations can be influenced by the atmospheric rectifier effect that is derived from the covariance between terrestrial ecosystem metabolism, such as the intensity of photosynthesis and density of vegetation, and vertical atmospheric transport (Denning et al, 1999; Chan et al., 2008). Generally, rapid growth of turbulence at the surface after sunrise results in a high boundary layer and leads to decreased CO2 measured at the station during daytime, while CO2 accumulates in a stable nocturnal boundary layer created by a temperature inversion due to surface radiative cooling during the night (Higuchi et al., 2003). Also, the diurnal cycle in summer is the result of a combination of several factors, including active photosynthesis.
AMY and JGS showed those typical characteristics during all seasons, even though the differences between minimum and maximum CO2 values significantly varied by month. However, ULD only showed this trend in summer, while very steady values were shown for other seasons throughout the day.
At AMY, the differences between maximum and minimum values were 13.5 and 6.9 ppm in August and November, respectively, while these values were around 3 ppm in other seasons. This trend is very typical, as mentioned above. For JGS, these values were observed in the order of 9.6 > 3.3 >2.8 > 0.88 ppm in August, April, November, and January, respectively. During summer, both AMY and JGS show an afternoon plateau in CO2 from around mid-afternoon due to the combination of changes in the photosynthetic rate and increased boundary layer before sunset. In the evening CO2 increases again when respiration dominates and the boundary layer becomes neutral or stable. Those two stations also show the clear wind pattern such as land–sea breeze which might enhance the CO2 diurnal cycle in summer. In contrast, at ULD, an average diurnal cycle was only obvious in August (peak to peak value of 3.9 ppm), and CO2 increased monotonically during the afternoon. In other seasons, diurnal variations were 0.5–1 ppm.
Table 3Annual mean CO2 mole fractions with standard deviations from 2012 to 2016, mean seasonal amplitudes, and mean growth rates. Seasonal amplitudes are calculated from the detrended data. CO2 at ULD in 2012 was only calculated from February to December, without January. Units are dry-air mole fractions (ppm).

For ULD the wind has no diurnal pattern different from the other two stations; however, wind comes from certain sectors regardless of time, which we mentioned in Sects. 2.1 and 3.3. ULD, at 221 m, is higher than AMY and JGS, so it is less affected by local activities. Those geographical characteristics lead to steady values at ULD except for summer when the photosynthesis is most active.
3.5 Seasonal cycle and growth rates in East Asia
Seasonal variations from KMA's three stations and two other stations, WLG and RYO, in East Asia, are compared in Fig. 8. WLG flask-air data from NOAA∕ESRL∕GMD and quasi-continuous measurements at RYO by the Japan Meteorological Agency, which were downloaded from the World Data Centre for Greenhouse Gases (WDCGG), were fitted with smoothed curves and compared to KMA observations. It is known that the seasonal cycle of atmospheric CO2 at surface observation stations in the Northern Hemisphere is driven primarily by net ecosystem production fluxes from terrestrial ecosystems (Tucker et al., 1986; Fung et al., 1987; Keeling et al., 1989). The averaged seasonal amplitude from 2012 to 2016 was smallest at WLG with 12.2±0.9 ppm and largest at AMY with 15.4±3.3 ppm. For JGS and RYO, peak to peak amplitudes were similar at 13.2±1.7 ppm and 13.5±1.6 ppm, whereas the peak to peak amplitude was 14.2±3.1 ppm at ULD (Table 3).
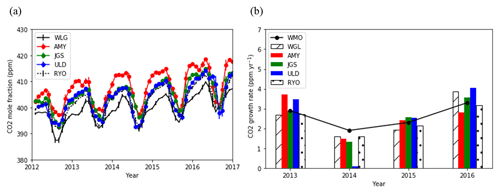
Figure 8The time series of (a) the monthly mean CO2 and (b) the annual growth rate at WLG, AMY, JGS, ULD, and RYO. Annual growth rate was defined as the increase in the annual mean of de-seasonal (long-term trend) values from the corresponding value in the previous year. The growth rate reported by WMO is overlaid on (b) and this value is annual increase (not de-seasonal), absolute differences from the previous year.
Normally, maximum CO2 appears from 4.8 ppm at JGS to 5.8 ppm at AMY in April, while the minimum appears in August between −6.8 ppm at WLG and −9.6 ppm at AMY according to the station. The highest maximum and lowest minimum mean value appeared at AMY, indicating that even though AMY is located at a similar latitude to these other stations, it seems to capture photosynthetic uptake and respiration release of CO2 by terrestrial ecosystems more than others. Also atmospheric CO2 at AMY includes added anthropogenic emissions transported through the Yellow Sea from the Asian continent as explained in Sects. 3.2 and 3.3. Meanwhile WLG is hardly affected by vegetation due to its altitude (Table 1).
The annual growth rate of CO2, which was computed by the increase in annual means of de-seasonal trends from one year to the next at KMA sites, was quite similar to other East Asian stations and to the global growth rate from WMO (Fig. 8b). From 2012 to 2016, the average annual increase observed at all stations in East Asia was between 2.4±0.7 and 2.6±0.9 ppm yr−1. This mean value is similar to the global increase of 2.21 ppm yr−1 from 2007 to 2016 reported by WMO. (This value is determined by the absolute differences from previous year.) The large increase in 2016 and 2015 was due to increased natural emissions of CO2 related to the most recent El Niño event (Betts et al., 2016). Averaged annual CO2 was highest at AMY and lowest at WLG among East Asian stations listed in Table 3, which shows that their differences are 8.5±0.7 ppm. The low growth rate in 2014 at ULD might be caused by unusually low CO2 in July–August 2014, resulting in no significant annual differences between 2013 and 2014, although the reasons are still unclear. Further studies are necessary to fully understand these results.
Since CO2 is a long-lived atmospheric species, the growth rate should be similar between the stations in the same region, even if they are subject to different combinations of anthropogenic and biogenic fluxes. However, our long-term trend comparison showed that measurement and environmental changes also affected its growth rate.
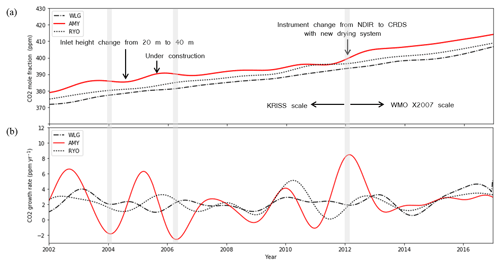
Figure 9(a) Long-term trend of atmospheric CO2 and its (b) instantaneous growth rate at WLG, AMY, and RYO. Overlaid grey line indicated the period of the negative (in 2004 and 2006) and positive (in 2012) growth rates at AMY compared to the other two East Asian stations (WLG and RYO).
The long-term trends of CO2 mole fractions at AMY, WLG, and RYO from 2002 to 2016, which were extracted using the method of Thoning et al. (1989), are shown in Fig. 9. The trends of CO2 at WLG and RYO increased in parallel, whereas AMY increased with a similar slope but with larger fluctuations than the other stations. Especially the negative growth rate, which was only observed at northern high latitudes in 1992 due to the Mount Pinatubo eruption, was recorded in 2004 and 2006 at AMY, while a high growth rate was recorded in 2012 without the El Niño–Southern Oscillation (Stenchikov et al., 2002; Heimann and Reichetein, 2008; WDCGG, 2017).
In July 2004, the inlet height at AMY was changed from 20 to 40 m above ground (Table 1); observed CO2 mole fractions before moving the inlet height reflected more influence from local activities that affected the long-term trend (Song et al., 2005). According to the logbook, in 2005 AMY was under construction to expand the space with a new building, and the instrument showed strong and highly localized signals during the period.
The measurement system, such as the instruments, the drying systems, and the standard scale, was changed in 2012, as described in Sects. 2.2 and 2.3.1. It was proved that CRDS provides higher precision measurements than the NDIR, and there were CO2 offsets in a comparison between the two instruments (Chen et al., 2010; Zellweger et al., 2016). Maintaining the traceability of standard gas to the primary standard with the same scale under the GAW Programme would be more of an incentive to assure the long-term consistency (WMO, 2017). This result suggests that factors not only related to local sources and sinks, but that environmental changes around stations and level of technical skill are also very important for the monitoring of regional background CO2 in the long term. On the other hand, ongoing comparisons of measurements at co-located sites and for the same species, such as between discrete samples and continuous measurement (Masarie et al., 2001), are valuable means to maintain data quality and identify sampling issues rapidly. After 2012, long-term trends increased in parallel, with AMY 5.5±0.3 ppm greater than RYO, and RYO 2.9±0.3 ppm greater than WLG.
Now many scientists are on the way to determining regional and national emissions through top-down methods using in situ data, so the importance of high-density monitoring stations such as WMO GAW regional stations is increasing since their data include a lot of information about CO2 fluxes. In this regard, it remains a challenge for WMO GAW stations to provide high-quality data to better constrain emissions and sinks. In this paper we introduced the three KMA stations and measurement systems for high-quality data, and we analyzed observed CO2 characteristics with comparisons to other East Asian stations.
KMA instrumented three monitoring stations covering the Korean Peninsula in 2012 using CRDS and a new drying system at each station. The drying system showed 0.001 % to 0.004 % water vapor in CRDS when sampling ambient air, while it was 0.0009 % in laboratory cylinders; these values satisfy the GAW recommendation of 0.0039 % (WMO, 2016). It also suggests the possibility of the monitoring of atmospheric species in humid areas with easy maintenance and remote control of the system.
From 2012 to 2016, our measurement uncertainties, which include components of the drying system, measurement repeatability, reproducibility, and scale propagation, are quite similar, with 0.116, 0.114, and 0.114 ppm at AMY, JGS, and ULD, respectively. In the future these uncertainties may increase as other components of uncertainty, and their variations over time, are added.
We assessed the CO2 enhancement relative to local background level at each station; this was 4.3±3.3 ppm at AMY, while it was 1.7±1.3 ppm at JGS and 1.0±1.9 ppm at ULD during 2012 to 2016. This indicates that AMY has higher CO2 episodes compared to the other stations. The CO2 mole fractions observed at AMY and at JGS in the west part of South Korea are more sensitive to East Asia (e.g., China) according to wind direction and speed. Meanwhile they also reflect locally contaminated CO2 under stagnant conditions. At JGS, however, local anthropogenic emissions were very limited due to high wind speed, and observed CO2 levels are lower compared to AMY. The diurnal variations at these two stations indicate they reflect the impacts of local vegetation and the degree and speed of atmospheric mixing. At ULD, east of the South Korean mainland, well-mixed air masses with small diurnal variations in CO2 were observed, as well as similar CO2 levels regardless of wind direction and speed due to its location.
The seasonal variation at AMY is large compared to the other stations in East Asia, indicating that it could be affected not only by vegetation but also by anthropogenic emissions transported from the Asian continent, such as from China. CO2 observed at three KMA stations is higher than at WLG and similar to RYO as expected by their locations, while growth rate is shown to be very similar to RYO and WLG during 2012 to 2016.
When AMY was compared to WLG and RYO in East Asia over 15 years, the long-term trend increased with a similar slope but with larger fluctuations compared to the other two stations. This seems to reflect not only carbon sources and sinks but also environment changes at the stations and the level of sophisticated measurement expertise.
Since CO2 observed in KMA includes much information about carbon fluxes in East Asia, these data are helpful in improving understanding of the carbon cycle in this region. In addition, to enhance the understanding of CO2 observations at South Korean monitoring stations, isotopes measurements such as 14C in CO2 would be very useful (Turnbull et al., 2011).
Our L2 hourly and daily data of AMY since 1999 and JGS since 2012, which are used for this paper, can be downloaded from the World Data Centre for Greenhouse Gases (WDCGG, 2019; http://gaw.kishou.go.jp; last access: 1 February 2019) under the WMO GAW Programme. ULD data can be accessed through the same website in the near future.
HL, SBR, and GWL designed the study. HL is responsible for the measurement including data management and quality assurances. Data analysis in this paper was carried out by HL, SBR, and GWL. SOH operated the measurement system at each station. HL and JSL installed these measurement systems at each station and developed the new drying system.
The authors declare that they have no conflict of interest.
This article is part of the special issue “The 10th International Carbon Dioxide Conference (ICDC10) and the 19th WMO/IAEA Meeting on Carbon Dioxide, other Greenhouse Gases and Related Measurement Techniques (GGMT-2017) (AMT/ACP/BG/CP/ESD inter-journal SI)”. It is a result of the 19th WMO/IAEA Meeting on Carbon Dioxide, Other Greenhouse Gases, and Related Measurement Techniques (GGMT-2017), Empa Dübendorf, Switzerland, 27–31 August 2017.
We would like to thank Edward Dlugokencky (NOAA/ESRL) for his helpful
comments on this paper. We also acknowledge Ryori station in Japan and Waliguan
station in China for their data contributions. Finally we appreciate all
staff and technicians at AMY, JGS, and ULD in the South Korean network. This work was
funded by the Korea Meteorological Administration Research and Development
Program “Research and Development for KMA Weather, Climate, and Earth system
Services – Development of Monitoring and Analysis Techniques for Atmospheric
Composition in Korea” under grant KMA2018-00522.
Edited by: Rachel Law
Reviewed by: two anonymous referees
Andrews, A. E., Kofler, J. D., Trudeau, M. E., Williams, J. C., Neff, D. H., Masarie, K. A., Chao, D. Y., Kitzis, D. R., Novelli, P. C., Zhao, C. L., Dlugokencky, E. J., Lang, P. M., Crotwell, M. J., Fischer, M. L., Parker, M. J., Lee, J. T., Baumann, D. D., Desai, A. R., Stanier, C. O., De Wekker, S. F. J., Wolfe, D. E., Munger, J. W., and Tans, P. P.: CO2, CO, and CH4 measurements from tall towers in the NOAA Earth System Research Laboratory's Global Greenhouse Gas Reference Network: instrumentation, uncertainty analysis, and recommendations for future high-accuracy greenhouse gas monitoring efforts, Atmos. Meas. Tech., 7, 647–687, https://doi.org/10.5194/amt-7-647-2014, 2014.
Betts, R. A., Jones, C. D., Knight, J. R., Keeling, R. F., and Kennedy, J. J.: El Nino and a record CO2 rise, Nat. Clim. Change, 6, 806–810, 2016.
Canadell, J. G., Le Quéré, C., Raupach, M. R., Field, C. B., Buitenhuis, E., Ciais, P., Conway, T. J., Gilett, N. P., Houghton, J. T., and Marland, G.: Contributions to accelerating atmospheric CO2 growth from economic activity, carbon intensity, and efficiency of natural sinks, P. Natl. Acad. Sci. USA, 104, 18866–18870, https://doi.org/10.1073/pnas.0702737104, 2007.
Chan, D., Ishizawa, M., Higuchi, K., Maksyutov, S., and Chen, J.: Seasonal CO2 rectifier effect and large-scale extratropical atmospheric transport, J. Geophys. Res., 113, D17309, https://doi.org/10.1029/2007JD009443, 2008.
Chen, H., Winderlich, J., Gerbig, C., Hoefer, A., Rella, C. W., Crosson, E. R., Van Pelt, A. D., Steinbach, J., Kolle, O., Beck, V., Daube, B. C., Gottlieb, E. W., Chow, V. Y., Santoni, G. W., and Wofsy, S. C.: High-accuracy continuous airborne measurements of greenhouse gases (CO2 and CH4) using the cavity ring-down spectroscopy (CRDS) technique, Atmos. Meas. Tech., 3, 375–386, https://doi.org/10.5194/amt-3-375-2010, 2010.
Crosson, E. R.: A cavity ring-down analyzer for measuring atmospheric levels of methane, carbon dioxide, and water vapor, Appl. Phys. B, 92, 403–408, 2008.
Denning S., Takahashi, T., and Friedlingstein, P.: Can a strong atmospheric CO2 rectifier effect be reconciled with a “reasonable” carbon budget?, Tellus, 51B, 249–253, 1999.
Dlugokencky, E. J., Harris, J. M., Chung, Y. S., Tans, P. P., and Fung, I.: The relationship between the methane seasonal cycle and regional sources and sinks at Tae-ahn Peninsula, Korea, Atmos. Environ., 27, 2115–2120, 1993.
Dolman, A. J., Gerbig, C., Noilhan, J., Sarrat, C., and Miglietta, F.: Detecting regional variability in sources and sinks of carbon dioxide: a synthesis, Biogeosciences, 6, 1015–1026, https://doi.org/10.5194/bg-6-1015-2009, 2009.
Fung, I. Y., Tucker, C. J., and Prentice, K. C.: Application of advanced very high resolution radiometer vegetation index to study atmosphere biosphere exchange of CO2, J. Geophys. Res., 92, 2999–3015, 1987.
Graven, H. D., Guilderson, T. P., and Keeling, R. F.: Observations of radiocarbon in CO2 at La Jolla, California, USA 1992–2007: Analysis of the long-term trend, J. Geophys. Res., 117, D02302, https://doi.org/10.1029/2011JD016533, 2012.
Heimann, M. and Reichstein, M.: Terrestrial ecosystem carbon dynamics and climate feddbacks, Nature, 451, 289–292, 2008.
Higuchi, K., Worthy, D., Chan, D., and Shashkov, A.: Regional source/sink impact on the diurnal, seasonal and inter-annual variations in atmospheric CO2 at a boreal forest site in Canada, Tellus B, 55, 115–125, 2003.
JCGM: International vocabulary of metrology-Basic and general concepts and associated terms (VIM, 3rd edition, 2008 version with minor corrections), available at: https://www.bipm.org/utils/common/documents/jcgm/JCGM_200_2012.pdf (last access: 1 December 2018), 2012.
Keeling, C. D., Bacastow, R. B., Carter, A. F., Piper, S. C., Whorf, T. P., Heimann, M., Mook, W. G., and Roeloffzen, H.: A three-dimensional model of atmospheric CO2 transport based on observed winds: 1. Analysis of observational data in Aspects of Climate Variability in the pacific and the Western Americas, Geophys. Monogr. Ser., vol. 55, edited by: Peterson, D. H., 165–236, AGU, Washington, DC, USA, 1989.
Kim, H.-S., Chung, Y.-S., and Tans, P. P.: A study on carbon dioxide concentrations and carbon isotopes measured in East Asia during 1991–2001, Air Qual. Atmos. Hlth., 7, 173–179, 2014.
KMA: Report of Global Atmosphere Watch 2013, Korea Meteorological Administration, 11-1360000-000991-10, 2014.
Knorr, W.: Is the airborne fraction of anthropogenic CO2 emissions increasing?, J. Geophys. Res., 36, L21710, https://doi.org/10.1029/2009GL040613, 2009.
Lee, G., Oh, H.-R., Ho, C.-H., Kim, J., Song, C.-K., Chang, L.-S., Lee, J.-B., and Lee, S.: Airborne Measurements of High Pollutant Concentration Events in the Free Troposphere over the West Coast of South Korea between 1997 and 2011, Aerosol Air Qual. Res, 16, 1118–1130, 2016.
Masarie, K. A., Langenfelds, R. L., Allison, C. E., Conway, T. J., Dlugokencky, E. J., Francey, R. J., Novelli, P. C., Steele, L. P., Tans, P. P., Vaughn, B., and White, J. W. C.: NOAA/CSIRO, Flask Air Intercomparison Experiment: A Strategy for Directly Assessing Consistency among Atmospheric Measurements Made by Independent Laboratories, J. Geophys. Res., 106, 20445–20464, 2001.
Rella, C. W., Chen, H., Andrews, A. E., Filges, A., Gerbig, C., Hatakka, J., Karion, A., Miles, N. L., Richardson, S. J., Steinbacher, M., Sweeney, C., Wastine, B., and Zellweger, C.: High accuracy measurements of dry mole fractions of carbon dioxide and methane in humid air, Atmos. Meas. Tech., 6, 837–860, https://doi.org/10.5194/amt-6-837-2013, 2013.
Song, B., Park, K. J., Yoo, H. J., and Choi, B. C.: A comparative study on two consecutive years' CO2 and CH4 measurement from the different height of air sample inlet at KGAWO, Asia-Pac. J. Atmos. Sci., 41, 851–895, 2005.
Stenchikov, G., Robock, A., Ramaswamy, V., Schwarzkopf, M. D., Hamilton, K., and Ramachandran, S.: Arctic Oscillation response to the 1991 Mount Pinatubo eruption: Effects of volcanic aerosols and ozone depletion, J. Geophys. Res., 107, 4803, https://doi.org/10.1029/2002JD002090, 2002.
Thoning, K. W., Tans, P. P., and Komhyr, W. D.: Atmospheric Carbon dioxide at Mauna Loa Observatory 2. Analysis of the NOAA GMCC Data, 1984–1985, J. Geophys. Res., 94, 8549–8565, 1989.
Tohjima, Y., Mukai, H., Hashimoto, S., and Patra, P. K.: Increasing synoptic scale variability in atmospheric CO2 at Hateruma Island associated with increasing East-Asian emissions, Atmos. Chem. Phys., 10, 453–462, https://doi.org/10.5194/acp-10-453-2010, 2010.
Tohjima, Y., Kubo, M., Minejima, C., Mukai, H., Tanimoto, H., Ganshin, A., Maksyutov, S., Katsumata, K., Machida, T., and Kita, K.: Temporal changes in the emissions of CH4 and CO from China estimated from CH4∕CO2 and CO∕CO2 correlations observed at Hateruma Island, Atmos. Chem. Phys., 14, 1663–1677, https://doi.org/10.5194/acp-14-1663-2014, 2014.
Tucker, C. J., Fung, I. Y., Keeling, C. D., and Gammon, R. H.: Relationship between atmospheric CO2 variations and a satellite-derived vegetation index, Nature, 319, 195–199, 1986.
Turnbull, J. C., Rayner, P., Miller, J., Newberger, T., Ciais, P., and Cozic, A.: On the use of 14CO2 as a tracer for fossil fuel CO2: Quantifying uncertainties using an atmospheric transport model, J. Geophys. Res., 114, D22302, https://doi.org/10.1029/2009JD012308, 2009.
Turnbull, J. C., Pieter, P. T., Lehman, S. J., Baker, D., Conway, T. J., Chung, Y. S., Gregg, J., Miller, J. B., Southon, J. R., and Zhou, L.-X.: Atmospheric observations of carbon monoxide and fossil fuel CO2 emissions from East Asia, J. Geophys. Res., 116, D24306, https://doi.org/10.1029/2011JD016691, 2011.
Turnbull, J. C., Sweeney, C., Karion, A., Newberger, T., Lehman, S. J., Tans, P. P., Davis, K. J., Lauvaux, T., Miles, N. L., Richardson, S. J., Cambaliza, M. O., Shepson, P. B., Gurney, K., Patarasuk, R., and Razlivanoc, I.: Toward quantification and sources sector identification of fossil fuel CO2 emissions from an urban area: Results from the INFLUX experiment, J. Geophys. Res.-Atmos., 120, 292–312, https://doi.org/10.1002/2014JD022555, 2015.
Verhulst, K. R., Karion, A., Kim, J., Salameh, P. K., Keeling, R. F., Newman, S., Miller, J., Sloop, C., Pongetti, T., Rao, P., Wong, C., Hopkins, F. M., Yadav, V., Weiss, R. F., Duren, R. M., and Miller, C. E.: Carbon dioxide and methane measurements from the Los Angeles Megacity Carbon Project – Part 1: calibration, urban enhancements, and uncertainty estimates, Atmos. Chem. Phys., 17, 8313–8341, https://doi.org/10.5194/acp-17-8313-2017, 2017.
Wanninkhof, R., Park, G.-H., Takahashi, T., Sweeney, C., Feely, R., Nojiri, Y., Gruber, N., Doney, S. C., McKinley, G. A., Lenton, A., Le Quéré, C., Heinze, C., Schwinger, J., Graven, H., and Khatiwala, S.: Global ocean carbon uptake: magnitude, variability and trends, Biogeosciences, 10, 1983–2000, https://doi.org/10.5194/bg-10-1983-2013, 2013.
Watanabe, F., Uchino, O., Joo, Y., Aono, M., Higashijima, K., Hitano, Y., Tsuboi, K., and Suda, K.: Interannual variation of growth rate of atmospheric carbon dioxide concentration observed at the JMA's three monitoring stations: Large increase in concentration of atmospheric carbon dioxide in 1998, J. Meteorol. Soc. Jpn., 78, 673–683, 2000.
WCC-Empa: System and performance audit of methane and carbon dioxide at the regional GAW station Anmyeon-do Republic of Korea Jun, 14/2, 18 pp., 2014.
WCC-Empa: System and performance audit of surface ozone, carbon monoxide, methane, carbon dioxide and nitrous oxide at the regional GAW station Anmyeon-do Republic of Korea Jun, 17/1, 48 pp., 2017a.
WCC-Empa: System and performance audit of surface ozone, carbon monoxide, methane, carbon dioxide and nitrous oxide at the regional GAW station Jeju-Gosan Republic of Korea Jun, 17/2, 42 pp., 2017b.
WDCGG: WDCGG DATA SUMMARY, Greenhouse gases and other atmospheric gases, No. 41, 2017.
WDCGG: L2 hourly and daily data of AMY since 1999 and JGS since 2012, available at: http://gaw.kishou.go.jp, last access: 1 February 2019.
WMO: 18th WMO∕IAEA Meeting on carbon dioxide, other greenhouse gases and related tracers measurement techniques (GGMT-2015), La Jolla, CA, USA, 13–17 September 2015, No. 229, 2016.
WMO: WMO Global Atmosphere Watch (GAW) Implementation Plan: 2016–2023, No. 228, 2017.
Zellweger, C., Emmenegger, L., Firdaus, M., Hatakka, J., Heimann, M., Kozlova, E., Spain, T. G., Steinbacher, M., van der Schoot, M. V., and Buchmann, B.: Assessment of recent advances in measurement techniques for atmospheric carbon dioxide and methane observations, Atmos. Meas. Tech., 9, 4737–4757, https://doi.org/10.5194/amt-9-4737-2016, 2016.
Zhao, C. L. and Tans, P. P.: Estimating uncertainty of the WMO mole fraction scale for carbon dioxide in air, J. Geophys. Res., 111, D08S09, https://doi.org/10.1029/2005JD006003, 2006.


