the Creative Commons Attribution 4.0 License.
the Creative Commons Attribution 4.0 License.
 | 14 Feb 2019
Seasonal and diurnal variability in O3, black carbon, and CO measured at the Rwanda Climate Observatory
H. Langley DeWitt
Jimmy Gasore
Maheswar Rupakheti
Katherine E. Potter
Ronald G. Prinn
Jean de Dieu Ndikubwimana
Julius Nkusi
Bonfils Safari
Air pollution is understudied in sub-Saharan Africa, resulting in a gap in the scientific understanding of emissions, atmospheric processes, and impacts of air pollutants in this region. The Rwanda Climate Observatory, a joint partnership between MIT and the government of Rwanda, has been measuring ambient concentrations of key long-lived greenhouse gases and the short-lived climate-forcing pollutants CO2, CO, CH4, black carbon (BC), and O3 with state-of-the-art instruments on the summit of Mt. Mugogo (1.586∘ S, 29.566∘ E; 2590 m above sea level) since May 2015. Rwanda is a small, mountainous, and densely populated country in equatorial East Africa, currently undergoing rapid development but still at less than 20 % urbanization. Black carbon concentrations during Rwanda's two dry seasons (December–January–February, DJF, and June–July–August, JJA), which coincide with the two regional biomass burning seasons, are higher at Mt. Mugogo than in major European cities with daily values (24 h) during the dry season of around 5 µg m−3 (daily average concentrations ranging from less than 0.1 to over 17 µg m−3 for the entire measurement period). BC baseline concentrations during biomass burning seasons are loosely correlated with fire radiative power data for the region acquired with a MODIS satellite instrument. The position and meteorology of Rwanda is such that the emissions transported from both the northern and southern African biomass burning seasons affect BC, CO, and O3 concentrations in Rwanda. Spectral aerosol absorption measured with a dual-spot Aethalometer varies seasonally due to changes in types of fuel burned and the direction of pollution transport to the site. Ozone concentrations peaked during Rwanda's dry seasons (daily measured maximum of 70 ppbv). The understanding and quantification of the percent contributions of regional and local (beyond large-scale biomass) emissions is essential to guide policy in the region. During the rainy seasons, local emitting activities (e.g., cooking, transportation, trash burning) remain steady, regional biomass burning is low, and transport distances are shorter as rainout of pollution occurs regularly. Thus, local pollution at Mugogo can be estimated during this time period and was found to account for up to 35 % of annual average BC measured. Our measurements indicate that air pollution is a current and growing problem in equatorial East Africa.
- Article
(6604 KB) - Full-text XML
- BibTeX
- EndNote


According to recent data collected and published by the World Bank, particulate air pollution in most African countries is above the annual average guideline values recommended by the World Health Organization (WHO). Despite this, little scientific research has been published on air quality in Africa, which can be approximated by the number of paper results from the search terms “air pollution + country name”. World Bank collected data and model approximations estimate higher PM2.5 exposure in African versus European countries (Fig. 1). The WHO reported in 2013 that one in eight premature deaths globally can currently be linked to poor air quality (WHO, 2013), while another, more recent report showed that these deaths are concentrated in developing countries (World Health Organization, 2016). Black carbon (BC) is one of the major air pollutants emitted from Africa, mainly from biomass burning as it is widespread on the continent during certain seasons. In addition to affecting health, BC contributes to atmospheric heating and thus to climate change (Ramanathan and Carmichael, 2008). Widespread crop fires in northern and southern Africa, prevalent in boreal winter (December–January–February, DJF) and austral winter and part of austral spring (June–July–August, JJA, and September–October), respectively, are known to increase aerosol and ozone concentrations in this region and transported molecular and aerosol fire tracers associated with elevated ozone have been measured as far as the Pacific and Indian oceans (Field et al., 2016; Real et al., 2010).

Figure 1Africa (red) and Europe (blue), PM2.5 mean annual exposure (https://data.worldbank.org/indicator/en.atm.pm25.mc.m3, last access: 17 January 2018) and paper count of country + air pollution (from Web of Science).
Rwanda is located in the middle of the two major seasonal biomass burning regions of sub-Saharan Africa. Wide-scale biomass burning occurs to the north of Rwanda during DJF and to the south during JJA. Rwanda's climate may exacerbate fire haze pollution effects, as Rwanda experiences two dry seasons that occur at the same time as these two continental burning seasons, making long-range transport with low rainout efficiency likely. Rwanda's prevalent wind direction also changes from northerly (DJF) to southerly (JJA) at the same time as the large-scale biomass burning area shifts from north central Africa to southern Africa. Increase in the incidence and amount of biomass burning is thought to be one consequence of climate change in this region (Niang et al., 2014). Southern Africa's biomass burning is also influenced significantly by human activity, not just the climate (Archibald et al., 2010). Rwanda is positioned to experience both large-scale (transported) haze due to fires and human activities and local, diffuse emissions.
In addition to air quality issues, climate change (related to air pollution) may also adversely affect Rwanda. The major pollutants from or ultimately increased by biomass burning (particles, carbon monoxide, ozone) are also known short-lived climate forcers. The main products exported (coffee and tea), the livelihood of the majority of Rwandans (agriculture), and power (currently almost half of Rwanda's power is hydroelectric) are all potentially affected by climate change. These issues are similar across the region. Central Africa is expected to receive increased severe rainstorms, which may lead to erosion and an uptick in vector-borne diseases (Niang et al., 2014). Rwanda's mountainous topography and ubiquitous hillside agriculture makes Rwanda vulnerable to floods and landslides. However, there are limited on-ground data on air quality and climate change in Africa.
In order to advance our scientific understanding of air pollution, climate change, and their impacts in Africa through generation of on-the-ground data, MIT and the government of Rwanda have established the Rwanda Climate Observatory (RCO). The RCO has a goal to measure long-lived greenhouse gases and short-lived climate forcers/pollutants in East Africa. Since May 2015, CH4, CO, CO2, O3, and BC concentrations have been continuously measured, and N2O measurements were added in February 2017. The RCO is a part of the Advanced Global Atmospheric Gases Experiment (AGAGE) network, a global network of high-frequency trace greenhouse gas measurements (Prinn et al., 2000), and is the first station of its kind in Africa. Rwanda was chosen as a location due to several factors. These factors include government interest from Rwanda and willingness to take on station maintenance, Rwanda's interest in growing its technical sector, readily available infrastructure in Rwanda to support the project, and a gap in climate data in this area of the world.
Here we present the first results on diurnal and seasonal variations in short-lived climate forcers/pollutants related to air quality, focusing on O3, CO, and BC observed at the RCO. This data set is unique and unprecedented to the region. Information on the concentrations, sources, and time-dependent concentration variations in these air pollutants is essential in this rapidly changing area of the world. Data will not only advance our understanding of air pollution and climate change in the region but also potentially inform future policies on air pollution with sound science.
2.1 Rwanda Climate Observatory environment
The RCO is located in the Northern Province of Rwanda, near Byangabo on the summit of Mt. Mugogo (1.586∘ S, 29.566∘ E; 2590 m a.s.l.). Mt. Mugogo is about 70 km (aerial distance) to the northwest of Kigali, the capital of Rwanda (population of approximately 1 million), 20 km (southwest) from the next major city, Musanze (population of around 100 000), and 60 km northeast of the Lake Kivu region (Gisenyi, Rwanda, and Goma, DRC; combined population of approximately 1 million). A dirt road reaches the base of the mountain, about 500 m below the summit where the RCO is located, and a diesel generator is installed on the road at the base. Inlets were installed on both the roof of the observatory (10 m above ground level) for O3 and BC and on a Rwanda Broadcasting Authority Tower (35 m above ground level) for CO, CO2, and CH4. There is a small Rwandan army camp adjacent to the measurement site, and a eucalyptus forest and a mix of agricultural fields and scattered rural houses surround the immediate vicinity of the RCO (Fig. 2).
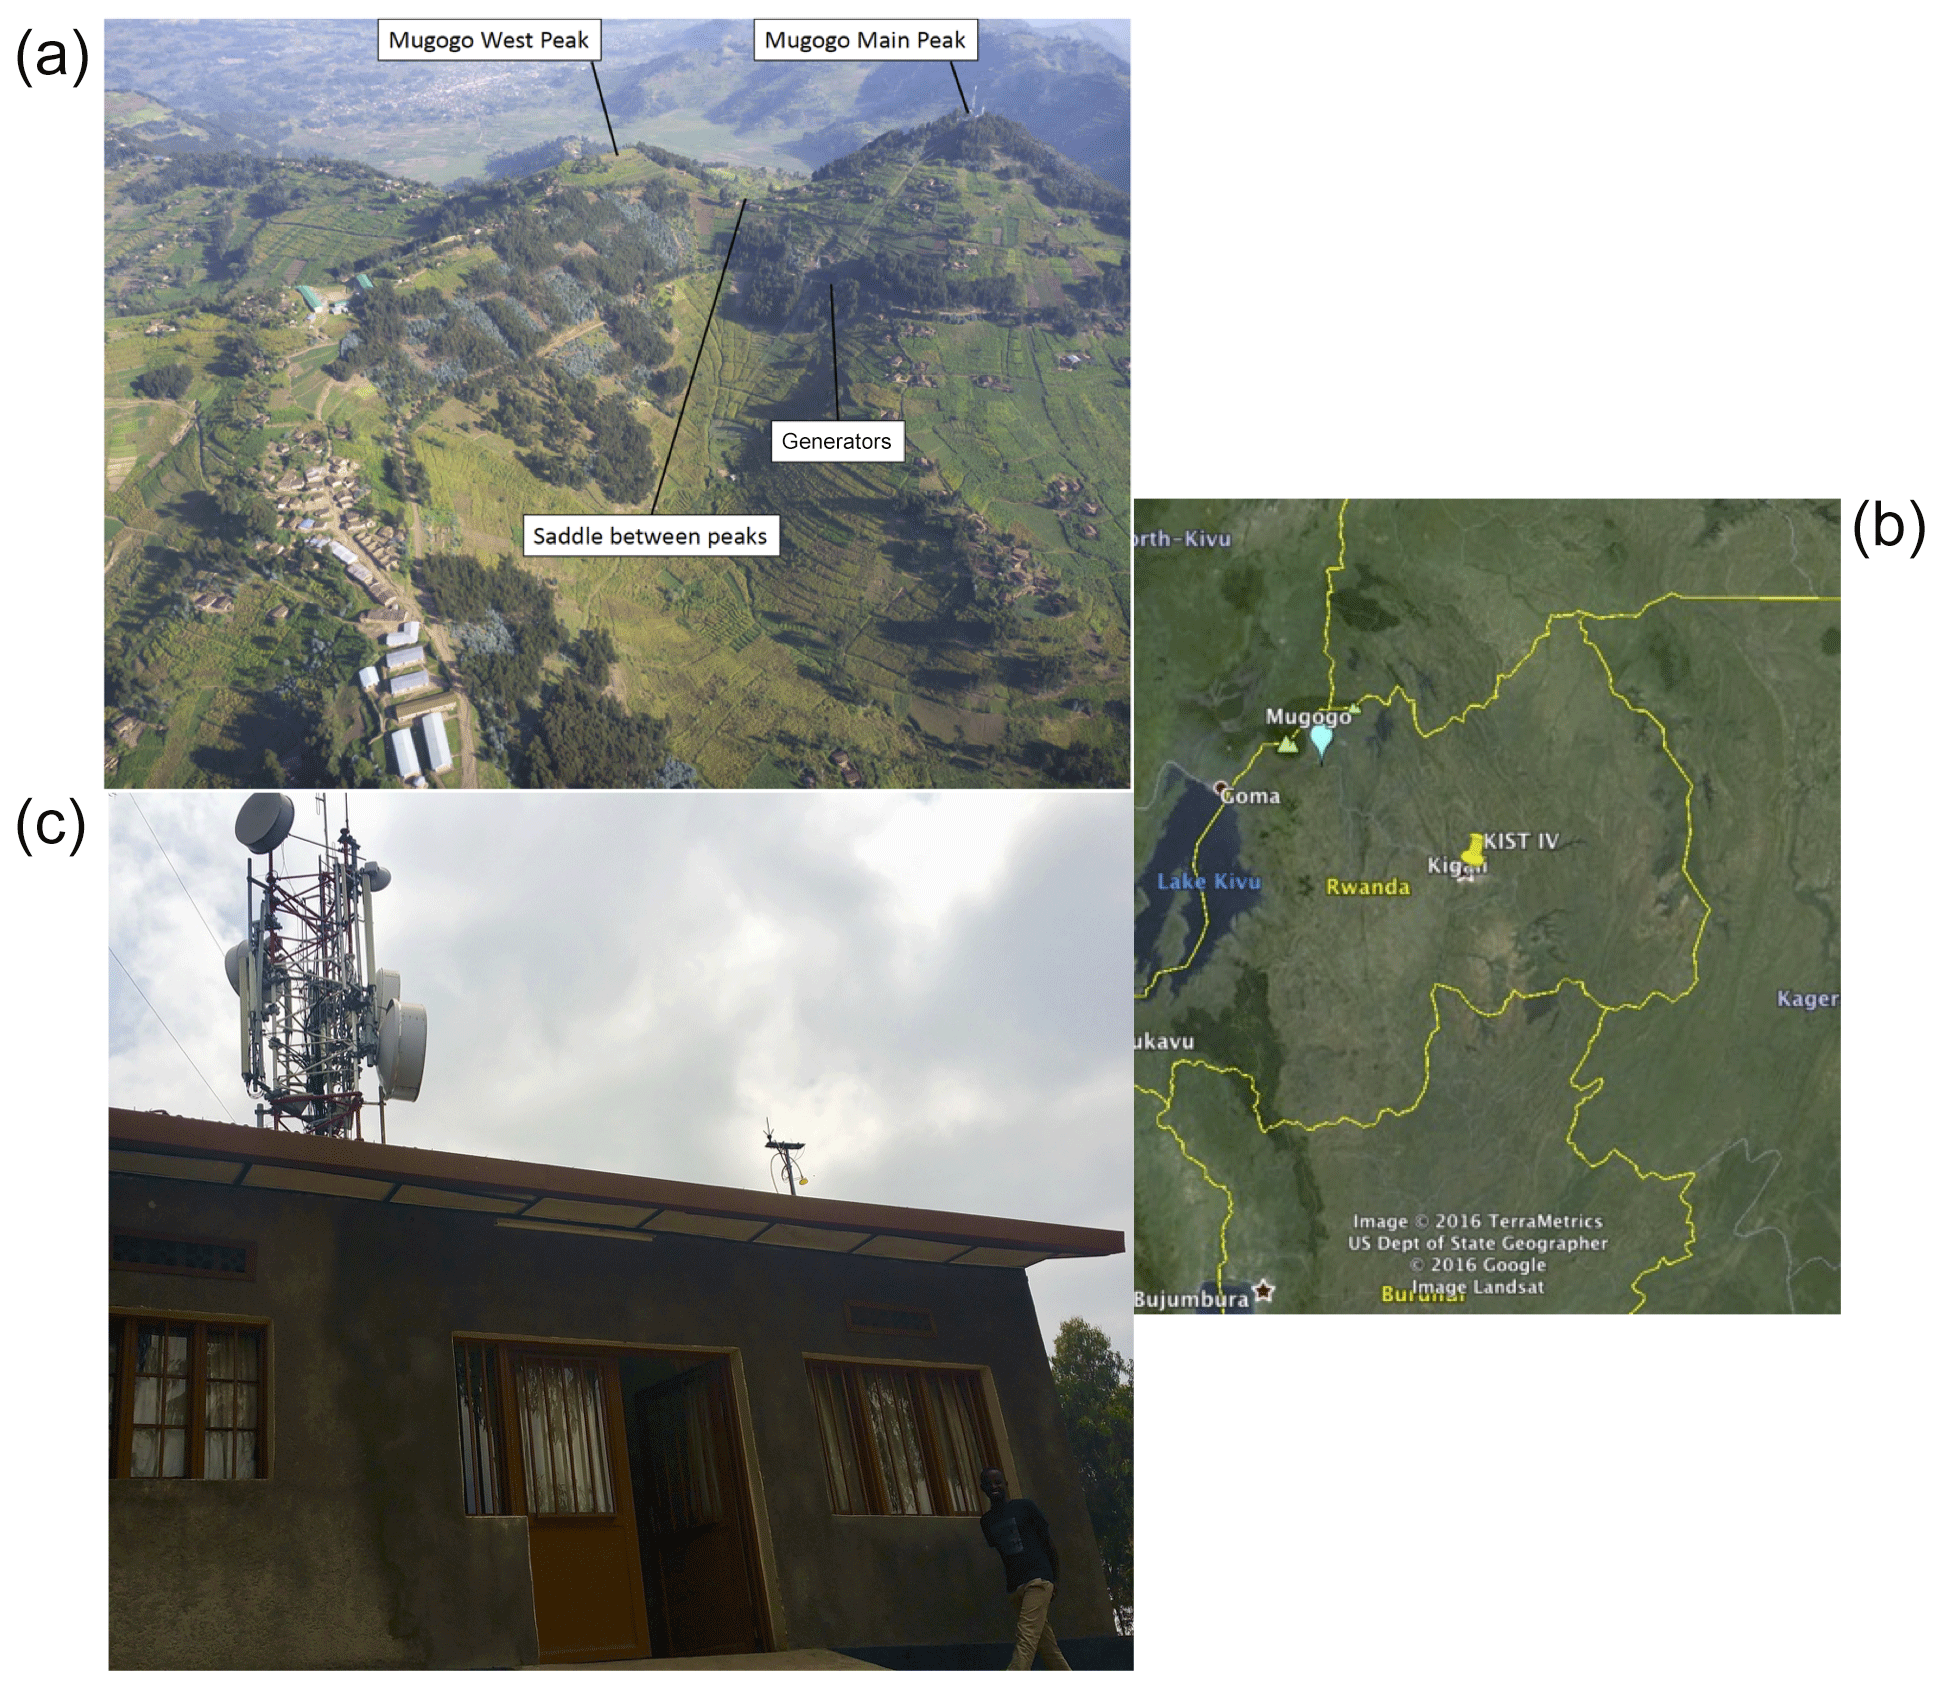
Figure 2From top left moving counterclockwise: an aerial view of RCO at Mt. Mugogo Main Peak, the station with towers in the background, and the location of Mt. Mugogo in Rwanda (blue pin) in relation to Kigali (yellow pin).
The high altitude and remote positioning of Mt. Mugogo allow sampling of regional air masses from throughout East Africa depending on prevailing meteorological conditions, as well as local pollution (as the dense population but low urbanization of Rwanda means that direct human influence is ubiquitous except within the national parks). Kigali and the Lake Kivu region are approximately 1000 m in altitude below the station height, and their altitude (∼1500 m) can be used as the base of local pollution. The majority of air masses transported to Mugogo originate below 5 km above ground level. Approximately 20 % of yearly air masses measured at Mugogo's summit originate from 0 to 1 km above ground level (certainly within the polluted boundary layer), and approximately 36 % below 2 km (potentially within the polluted boundary layer) (from HYSPLIT analysis). At midday, Mugogo's summit is likely within the regional polluted boundary layer, but during the later evening it is likely above. Complicating this issue is the network of farms and houses along the mountainside near Mt. Mugogo.
2.2 Instrumentation and calibration
Details on the instruments sampling at the RCO are compiled in Table 1. PM2.5 BC (particulate matter 2.5 µm in diameter or less) was measured using a Magee Scientific seven-wavelength Aethalometer with dual-spot technology that is able to correct for filter loading artifacts (Drinovec et al., 2015). A cyclone PM2.5 impactor was installed on the inlet to remove larger particles and covered with an insect net. Air was passed through a filter once per day to collect blank data and examined to ensure the instrument baseline was correct. If high, the filter was changed and the blank rerun. Flow was calibrated once per year and after major instrument movement and changes, while the optical performance was calibrated with a neutral density filter kit once per year. Data were recorded every minute at a 5 L per minute (L min−1) flow rate, and particles were captured on a quartz fiber filter tape. The air stream was not dried and the relatively humidity (RH) was not controlled, which could lead to increased uncertainty during periods of high relative humidity. RH recorded at the station varied by approximately 5 % over the day and from 60 % to 85 % monthly, depending on the season. The 880 nm channel was used to calculate the concentration of BC, but all channels were examined to determine reasonable data (comparing them to literature values). Five-minute data (not pictured) were used to detect very local pollution and remove the influence of short-lived local fires and BC from the generator 500 m below the station. Spikes in BC concentrations that lasted for less than 15 min with values higher than 25 000 ng m−3 were removed, along with corresponding CO.
Table 1Instruments used in this study and measurement period used for analysis.
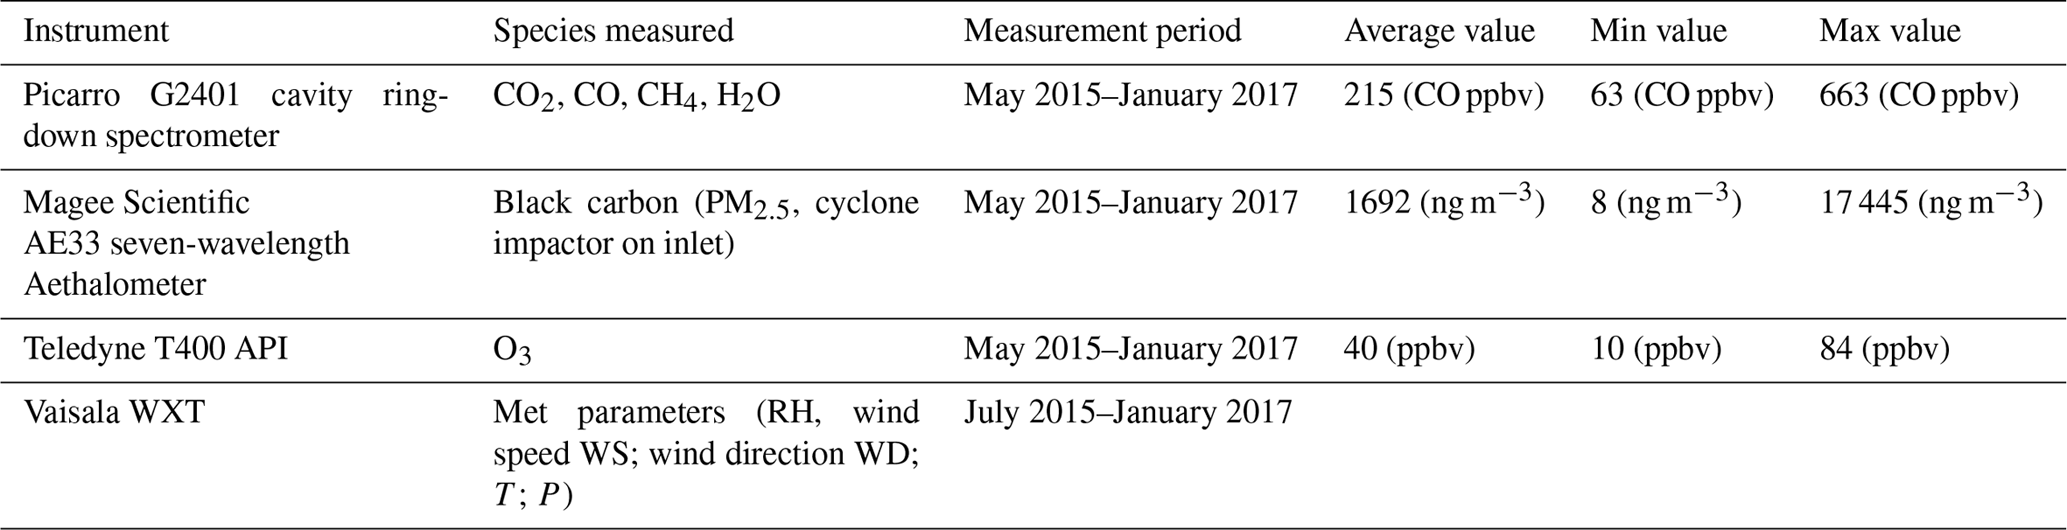
CO mixing ratios were measured in real time using a cavity ring-down spectrometer (G2401, Picarro, USA). Sampled, laboratory, and calibration air were dried with a Nafion drier inside an Earth Networks calibration box to increase the accuracy of the Picarro water vapor correction (Welp et al., 2013). Three NOAA-standard calibration tanks were used for calibration spanning normal ambient concentrations and calibrations were performed once per day initially to check for linearity of instrument's response (Gasore, 2018). An O3 monitor (T400, Teledyne Advanced Pollution Instrument, USA) was used to measure O3. Regular checks were performed using internal span and zero O3 calibrations, and non-passing data were removed. Flow was calibrated two to three times per year.
Meteorological data (ambient temperature, relative humidity, pressure, wind speed, wind direction, and rainfall) were collected with an automatic weather station (WXT520, Vaisala, Finland). The weather station was attached to a fixed, hinged arm 35 m above ground level and connected to the communications tower, level with the inlet, with a 2 m clearance from the tower. The weather station was calibrated when delivered and recalibrated during repairs (once during the 2-year measurement period).
In addition to the described instrument checks and data quality control procedures, station technicians visited the station once daily (except on Sundays) and performed visual checks of all instruments except for the meteorological station, which was examined once per quarter manually by climbing the tower. They also notified the station chief scientist immediately of any issues (instrument warnings, generator issues, data coverage outages) and worked to address these issues.
3.1 Seasonal variation in BC, CO, and O3
Figure 3 shows a summary of the data, including daily and 15 min averaged BC, O3, and CO data and meteorological data. Daily averages were examined to probe overall increases in regional pollutants, while 15 min averages were used to detect local pollution.
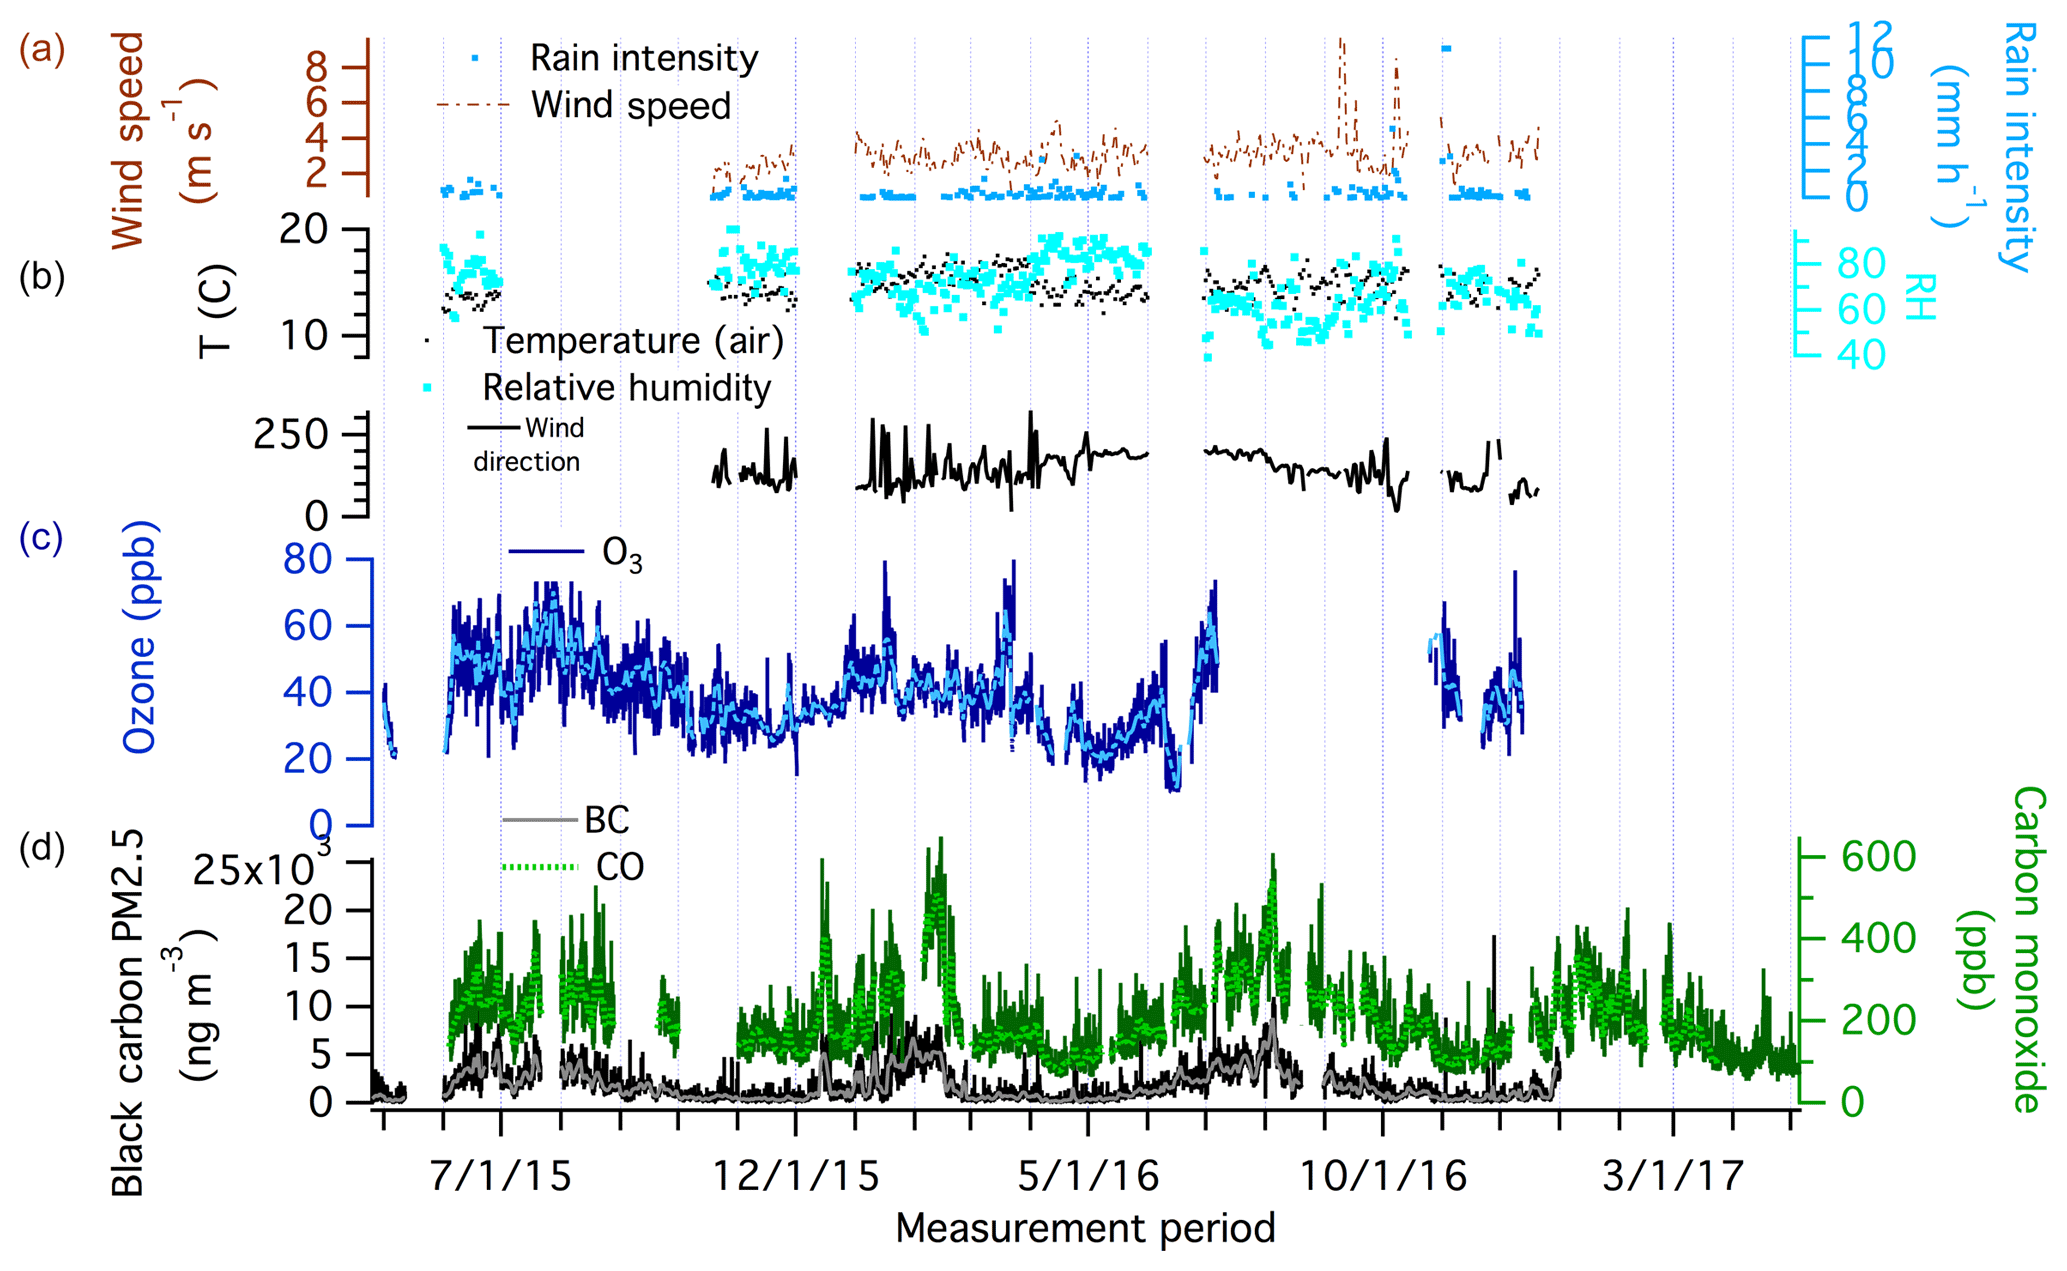
Figure 3From top to bottom: (a) wind speed (red dotted) and rain intensity (blue dash) daily average values; (b) temperature (black) and relative humidity (light blue) values; (c) ozone (dark blue, light blue) (15 min, daily); (d) black carbon (black, grey) and carbon monoxide (dark green, light green) (15 min, daily) average concentrations.
Rwanda has two rainy seasons roughly occurring in March–April–May (MAM) and September–October–November (SON) and two dry seasons during DJF and JJA. This generalized definition and the durations of the seasons are used for the purpose of comparing data for multiple years and are used throughout this paper. High variations in BC concentrations can be seen in the BC time series (Fig. 3) ranging from below 100 to above 20 000 ng m−3, with an average value of 1700 ng m−3 (standard deviation: 1600 ng m−3). Peak concentrations corresponded to dry seasons. CO and O3 mixing ratios also increased during the dry seasons compared to the rainy seasons, though these increases are not as pronounced as the BC increases. This decrease is partially due to the efficient rainout of black carbon particles during the rainy season. The diurnal, weekly, and monthly variations in concentrations of each species, normalized to their average, are shown in Fig. 4.
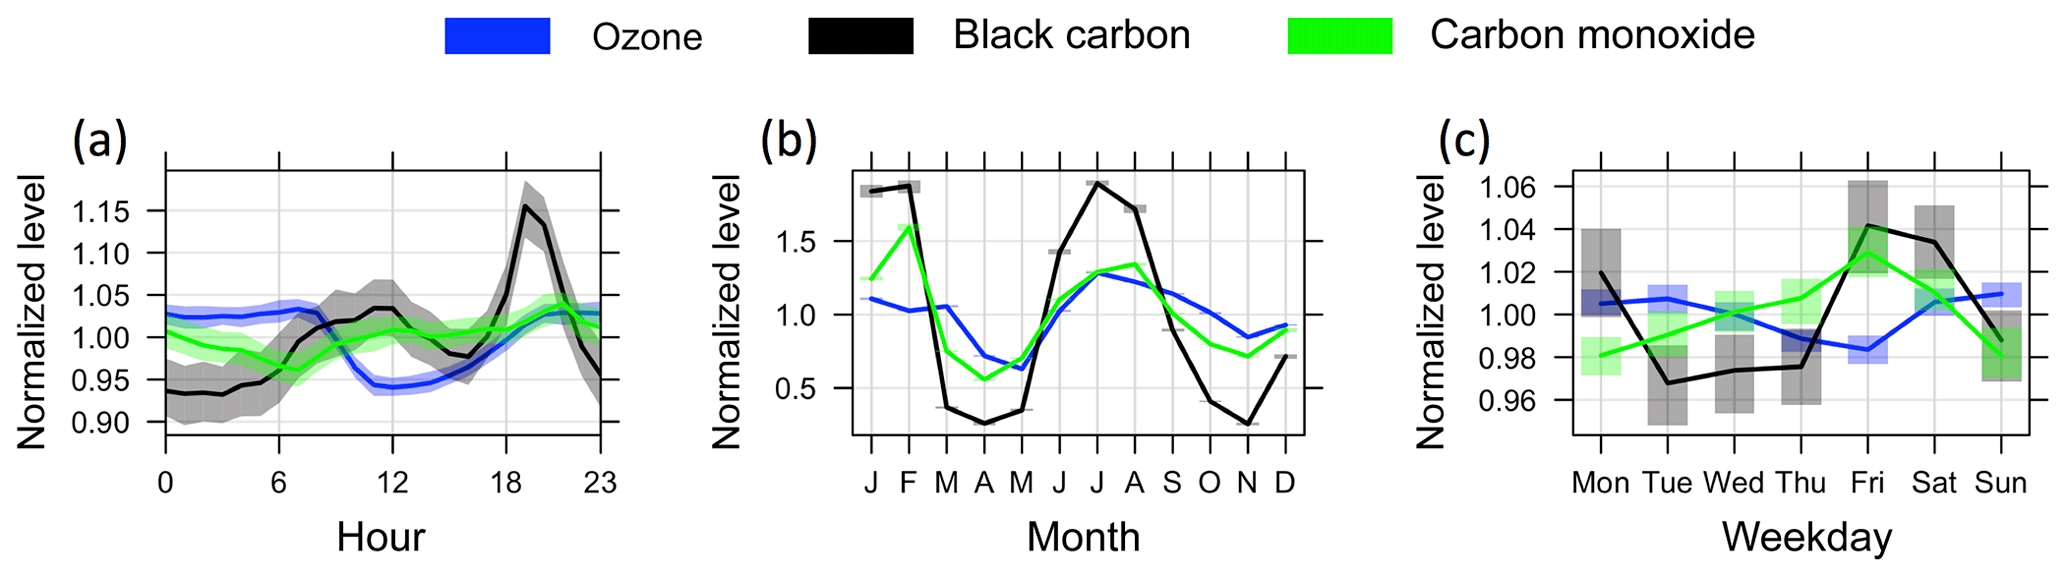
Figure 4Normalized temporal variations in O3 mixing ratios, CO mixing ratios, and BC concentrations by (a) hour (diurnal), (b) month, and (c) day of the week. Shaded areas are 95 % confidence intervals.
It has been known for some time that wide-scale biomass burning in sub-Saharan Africa has a large seasonal effect on the atmosphere (e.g., Archibald et al., 2010; Crutzen and Andreae, 1990). Understanding and separating these seasonal effects from anthropogenic emissions can be difficult without continuous data sets both during and outside of this period, especially as both biomass burning and anthropogenic emissions in this region of the world emit BC, CO, and PM. Biomass burning emissions have also been shown to affect O3 formation under the right meteorological conditions.
To explore the sources of BC and CO at the RCO, 7-day HYSPLIT back trajectories were run every 6 h using NCEP/NCAR reanalysis meteorological data (2.5×2.5∘ resolution) (Kalnay et al., 1996). This analysis provided insights into the approximate origin and trajectories of air masses before arriving at RCO. These HYSPLIT back trajectories were separated into DJF, MAM, JJA, and SON and are shown with MODIS satellite fire count data colored by fire radiative power (FRP; W m−2) (Fig. 5). The MODIS fire count data and radiative power are used strictly for qualitative, not quantitative, purposes in this work. Here we observe that, as major biomass burning sites moved to the north and west in DJF, transport direction was also primarily northerly, and as biomass burning moved to southern Africa in JJA, the prevailing wind directions were also southerly. Although Rwanda itself had few large-scale fires, its geographical position and meteorology meant that it experienced transported fire haze from both major burn seasons. Black carbon measured at the station tracked fairly well with summed daily FRP for sub-Saharan Africa (Fig. 5). This suggests that transport from regional biomass burning has a twice-yearly effect on BC concentrations in Rwanda, despite the different locations of the biomass burning in sub-Saharan Africa.

Figure 5(a) Seasonal fire radiative power data acquired with the MODIS instrument and back trajectories of air masses (generated with the HYSPLIT model) reaching the Rwanda Climate Observatory for the period May 2015 to January 2017. Seasons in Rwanda are split into a short dry season (December–January–February, DJF), a long rainy season (March–April–May, MAM), a long dry season (June–July–August, JJA), and a short rainy season (September–October–November, SON). (b) The time series of daily average BC concentration and the daily sum of Fire Radiative Power (W m−2) from the pictured data bound by the furthest HYSPLIT back trajectory reaches each season (box defined by the most north, south, east, and west point the HYSPLIT back trajectories' reach).
To further examine pollution transport to the RCO, the HYSPLIT back trajectory geographical areas were gridded (using the R Openair package; Carslaw and Ropkins, 2012) and merged, using date and time, with measured BC concentrations and mixing ratios of CO. This was done to generate concentration-weighted back trajectories (cwt) for each season (more details on cwt available in Hsu et al., 2003; Seibert et al., 1994) (Fig. 6). Trajectory time in each grid and arrival time of each air mass were taken into account in this model to predict the likely source regions and emission concentrations of pollutants measured at the RCO. This was done to determine likely source regions of air pollution at the RCO by comparing arrival times of air masses to the RCO and the time series of pollutants. This method has proven fairly effective at identifying emission sources when comparing predicted emission regions to emissions inventories (Lupu and Maenhaut, 2002) and is good as a rough estimate of emission regions with no a priori information (Kabashnikov et al., 2011).
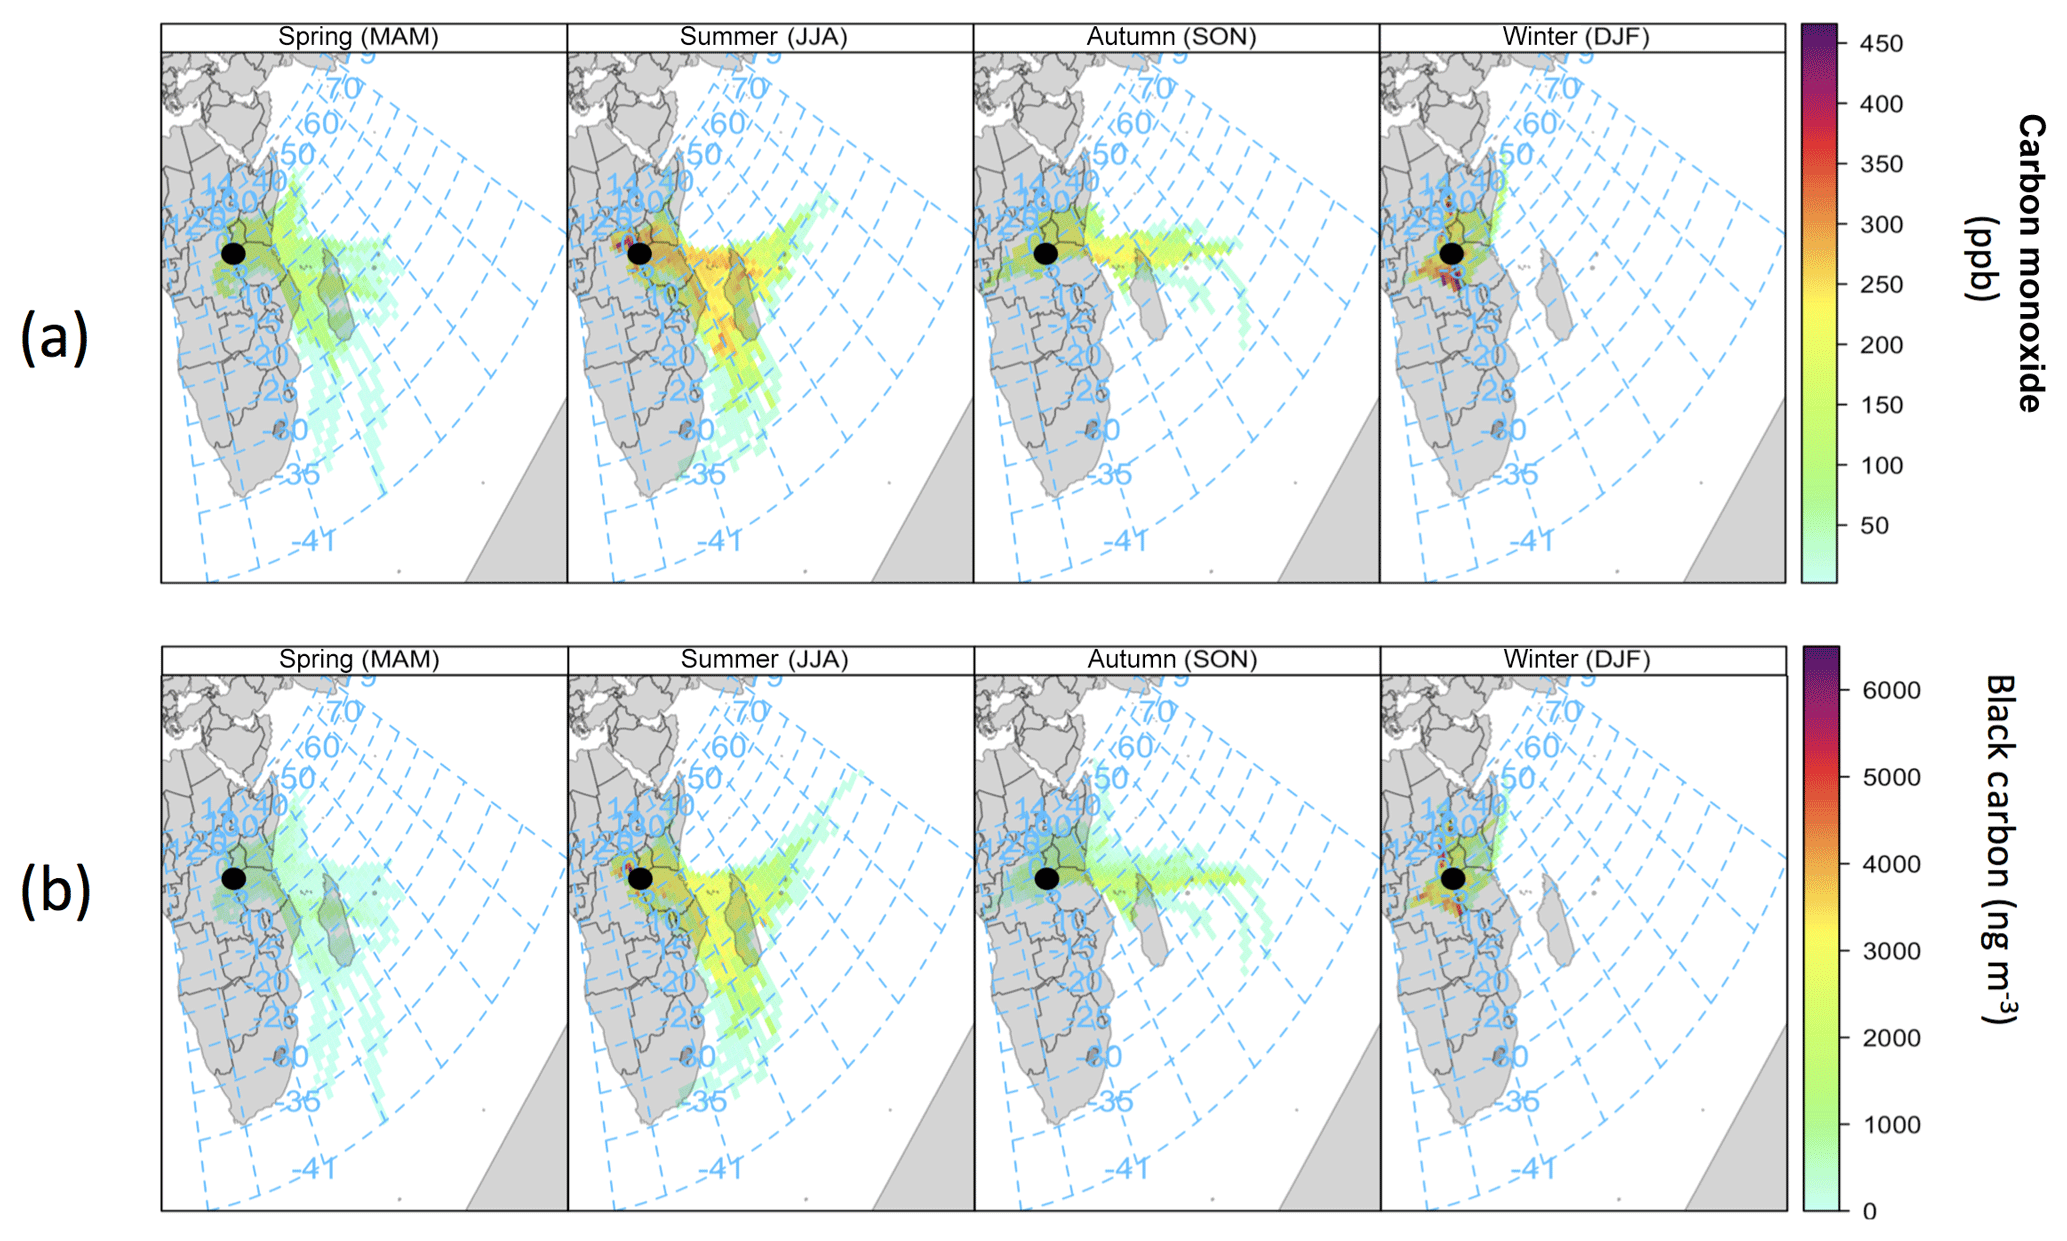
Figure 6Concentration-weighted back trajectories of (a) CO and (b) BC, separated by season, for measurements at the Rwanda Climate Observatory (black dot) for the period of July 2015–January 2017.
BC and CO appeared to originate from similar areas, as expected due to their overlapping sources of inefficient combustion and biomass burning. During JJA, significant BC and CO appeared to originate from southern Africa and Madagascar, as well as from local sources near the RCO. During DJF, the source of these pollutants appeared to be much closer to the RCO, as major fires in the DRC and Uganda were also closer to the station. Throughout the measurement period, but particularly DJF, the Lake Kivu region also appeared to be a source of BC and CO. The Lake Kivu region is densely populated and the use of both cookstoves and diesel generators is common.
In addition to direct emissions of BC and CO, other emissions such as volatile organic compounds and oxides of nitrogen from biomass burning are known to affect tropospheric O3 concentrations (Jaffe and Wigder, 2012; Sauvage et al., 2005). It appears that such emissions could have played a role in the observed seasonal increase in O3 mixing ratios of approximately 20 ppb in DJF and 25 ppb in JJA above rainy season levels at the RCO. This increase of about 5 ppb O3 during JJA versus DJF was potentially due to the mixing of biomass burning emissions with anthropogenic emissions from east African cities such as Nairobi, Dar es Salaam, and Kampala during the JJA dry season. It also could have been the result of generally higher solar radiation during the JJA season in Rwanda (Safari and Gasore, 2009). A mix of biomass burning and anthropogenic emissions from southern Africa could have been transported to Rwanda after photochemical aging and processing. Direct source apportionment of O3 is difficult as O3 is formed from the right combination of volatile organic compounds (VOCs), NOx, and favorable meteorological conditions (Baier et al., 2015; Geddes et al., 2009; Gong et al., 2017; Monks et al., 2015). During the DJF dry season, fires are closer to Rwanda and away from major urban areas. During June and July, a loose correlation (R=0.47 and 0.45, respectively) between O3 mixing ratios and BC concentrations was observed, while no correlations (, −0.15, and 0.07) were observed in December, January, and February.
3.2 Absorption Ångström exponent and BC source apportionment
It is important to understand the pollution emission sources in East Africa, beyond large-scale biomass burning, in order to enact policies and actions to reduce these emissions. One way scientists have estimated fuel combustion versus biomass burning BC particulate is by measuring the color of the particles (woodsmoke particles have enhanced absorption in the UV, while fossil fuel combustion particles have flat absorption over all wavelengths) (Kirchstetter and Thatcher, 2012; Sandradewi et al., 2008). The Aethalometer's seven wavelengths allow the measurement of the wavelength-dependent aerosol absorption and the calculation of absorption coefficients that can be used to infer the potential sources of BC aerosol (Drinovec et al., 2015; Sandradewi et al., 2008) measured. Theoretically, from the wavelength dependence of aerosol absorption, BC from fossil fuel and woodsmoke can be differentiated (Sandradewi et al., 2008). Though this two-component model can provide valuable knowledge on source attribution of BC, it has some limitations. This model is more accurate if calibrated to local conditions as burning and aging during transport affects the aerosol's wavelength-dependent absorption (Dumka et al., 2013; Harrison et al., 2012), as different fuels and wood biomass burning create aerosol with different radiative properties, and the standard model, based on European studies, has been shown to be less applicable in developing countries (Garg et al., 2016).
From the Aethalometer data, the wavelength dependence of absorption coefficients and the absorption Ångström exponent (AAE) were calculated and compared to literature values of biomass burning and fossil fuel combustion (Fig. 7). The AAE is a dimensionless property commonly used to characterize the wavelength-dependent absorption of BC and gives clues on the source and/or aging of BC when compared to laboratory and other ambient studies (Chung et al., 2012; Lack and Langridge, 2013; Russell et al., 2010; Yuan et al., 2016). The AAE values assigned for the standard Aethalometer model separating the BC from biomass burning and fossil fuel combustion are 2 and 1, respectively (where 2 represents an average AAE for woodsmoke of different types and ages) (Kirchstetter et al., 2004; Sandradewi et al., 2012; Drinovec et al., 2015). In this work, standard mass absorption cross sections (MACs) for each wavelength provided by the manufacturer of the Aethalometer were used to calculate the absorption coefficient (babs) at each wavelength. For pure BC from fossil fuel, and the AAE between two wavelengths (470 and 950 nm) is 1 using the equation .

Figure 7(a) Time series of contributions of fossil fuel combustion and biomass burning to BC concentrations observed at RCO. (b) Daily average absorption Ångström exponent (AAE) measured at RCO (black line) with rain intensity and published AAE for Eucalyptus burning (Yuan et al., 2016); laboratory studies (green line) and savanna burning (Russell et al., 2010; ambient, brown line) are also shown as reference.
The average AAE (averaged for entire measurement period between July 2015 and January 2017) was calculated to be 1.65 (±0.14) at the RCO using the 470 and 950 wavelength absorption and MACs (Fig. 10) (Sandradewi et al., 2008; Drinovec et al., 2015). These wavelengths were chosen as the AAE calculated from 470 and 950 is generally comparable with other literature values (Saarikoski et al., 2012). The calculated AAE values were on par with the AAE calculated from measurements taken in areas heavily influenced by biomass burning (Chung et al., 2012; Lack and Langridge, 2013; Russell et al., 2010; Saleh et al., 2013; Sandradewi et al., 2008; Yuan et al., 2016). Past studies have reported an AAE of 1.2–2.5 for biomass burning aerosol (Andreae and Gelencsér, 2006; Chung et al., 2012; Russell et al., 2010; Saleh et al., 2013, 2014). While daily only small variations (±0.05) for AAE were observed, significant seasonal differences in this value were found, with monthly averaged values ranging from 1.5 (dry season) to 1.9 (at the end of the long rainy season). This seasonal difference is shown with the 30-day running mean of the AAE (Fig. 7). Studies in southern Africa measuring savanna and crop burning found an AAE of around 1.45 for ambient black carbon aerosol, and in the dry season savanna and crop burning are the prevalent type of large-scale biomass burning in sub-Saharan Africa (Russell et al., 2010). The AAE calculated from the Aethalometer data at the RCO was higher during the rainy season when local emissions dominated our measurements (Fig. 7). Eucalyptus burning, the most prevalent burning near the station (for charcoal making, cooking fires, brick kiln fuel) was measured in laboratory experiments to have a higher AAE than savanna burning (AAE of 1.71±0.50 calculated between 405 and 781 nm wavelengths) (Chung et al., 2012). Eucalyptus trees and savanna burning were certainly not the only two types of solid biofuel influencing measurements at the station, but the difference in AAE of aerosols produced from different fuels means that the AAE will have large variations based on fuelwood or other biomass used, and this was reflected in our data.
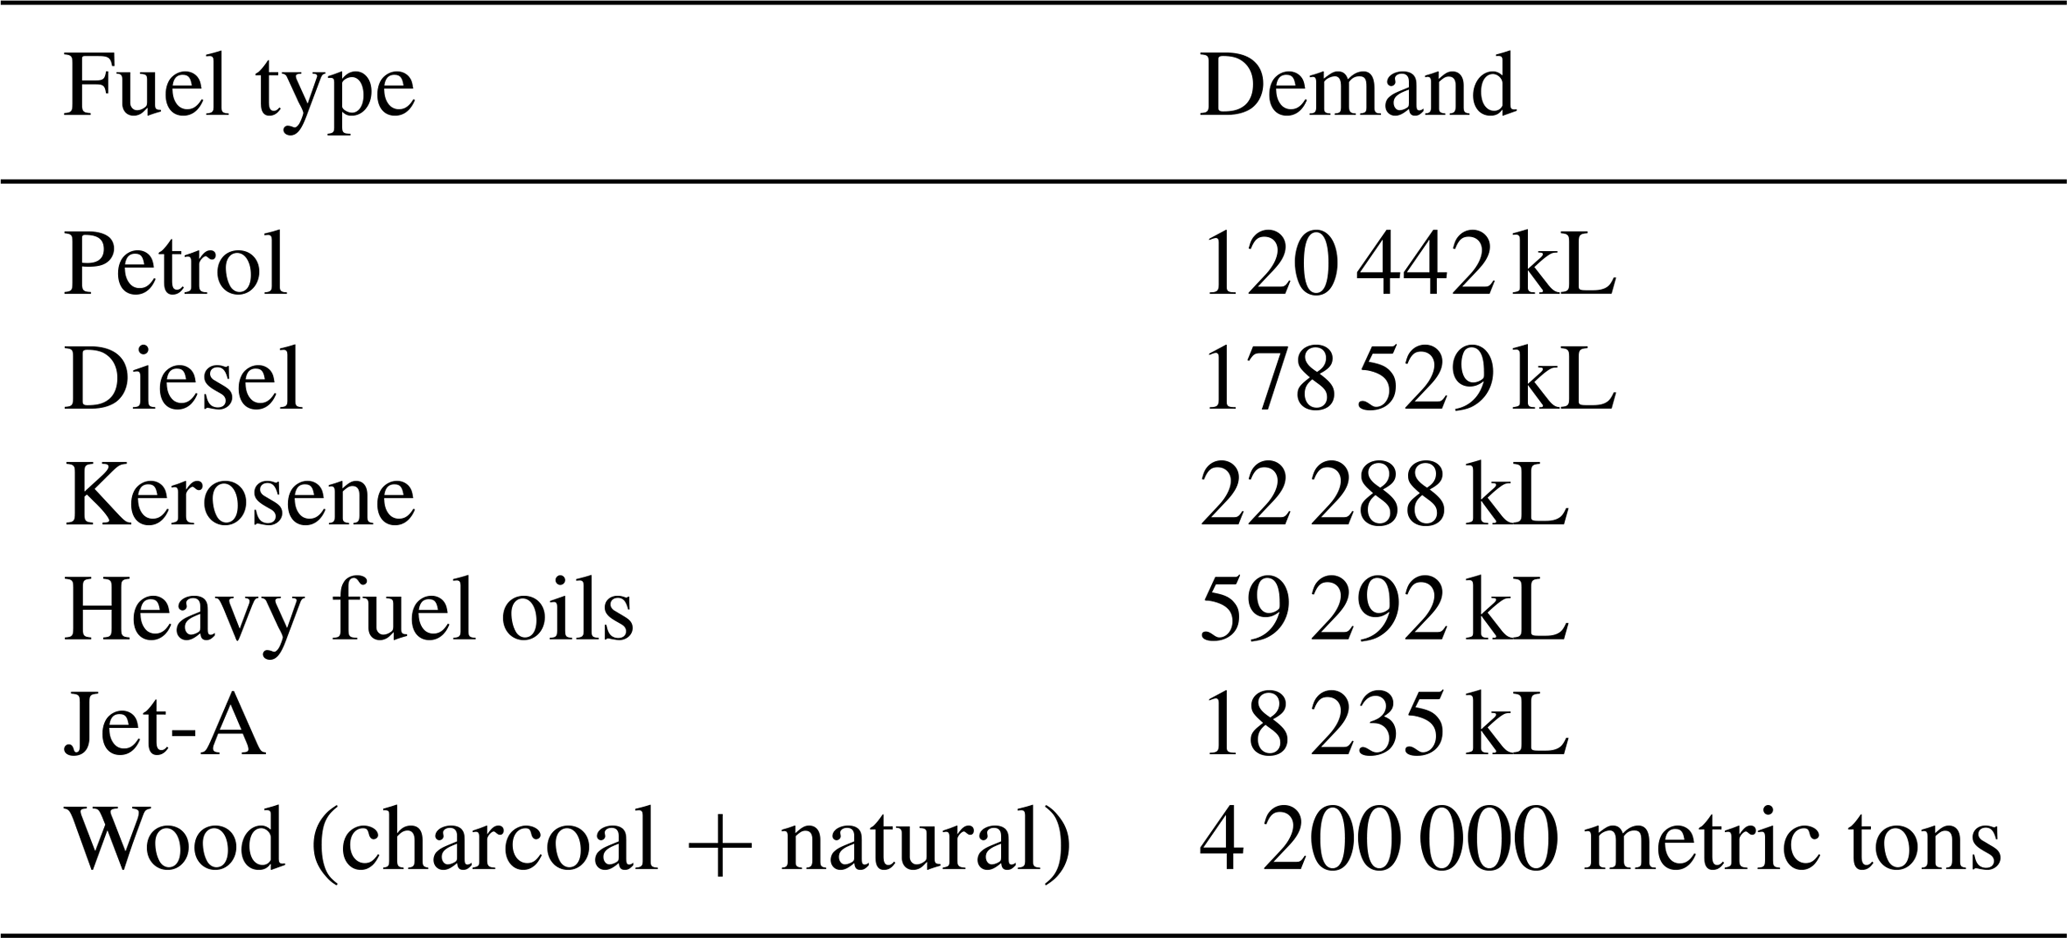
Using the Aethalometer model with standard inputs not accounting for the different types of fuel used in East Africa versus Europe, a high influence of fossil fuel black carbon emissions was calculated: in the dry season, over 50 % of black carbon was assigned to be fossil fuel in origin (Fig. 7). Fossil fuel emissions certainly influenced the pollution at the RCO, as air masses from Kigali, Kampala, Nairobi, and Dar es Salaam were transported to the station. These cities have high black carbon emissions from generators, fossil fuel power stations, and older diesel vehicles but would also have significant biomass cookstove emissions (Gatari and Boman, 2003; Koch et al., 2009; Mkoma et al., 2009; van Vliet and Kinney, 2007). However, at <10 % fossil fuel demand (all types, see Table 2) versus >90 % wood and charcoal fuel demand, even if the gram per black carbon per kilogram fuel from diesel was 4 times higher and all fossil fuel use was unregulated diesel (unlikely), well under half of the measured BC should be from fossil fuel combustion emissions. Aging with transport would increase the AAE of the aerosol, not decrease, so aging should not cause this seasonal difference as transport distances of BC are longer during the dry seasons.
Table 2Fuel demand in Rwanda (2016, Rwanda Ministry of Infrastructure).
In order to gain more insights into the sources of BC we also examined the BC:CO. CO is also released by inefficient combustion and the ΔBC:ΔCO ratio can be different for different emission sources. In order to calculate this ratio, we first converted the CO mixing ratios to concentrations (in µg m−3) and then subtracted the 95th percentile values for CO and BC from their respective concentrations. For the entire data set, the ΔBC:ΔCO (both in µg m−3) ratio was 0.014 (R20.79, n=40 523). The ΔBC:ΔCO ratio varied seasonally, with monthly average peaks reaching 0.016 in December, February, and July and lows below 0.01 in April. The average ratio of 0.014 for the measurement period was almost twice as high as in biomass burning plumes sampled over West Africa in an aircraft campaign (0.0072) (Moosmüller and Chakrabarty, 2011) but on par with or lower than measurements taken during the INDOEX campaign in the Indian Ocean (Dickerson et al., 2002). A study in Germany and Mexico found a correlation between diesel vehicle use and higher BC:CO (Baumgardner et al., 2002), while other studies have also found an increased ΔBC:ΔCO during periods more influenced by biomass burning (Pan et al., 2011). A study in India found no correlation in biomass burning and fossil-fuel-influenced ΔBC:ΔCO air masses (Sahu et al., 2012), as there are a wide range of ratios measured from the same source (Dickerson et al., 2002; Sahu et al., 2012). The high ΔBC:ΔCO ratio at the RCO could be due to the prevalence of older diesel engines in the country, which emit more BC to CO than newer engines (Cai et al., 2013), but, as the highest value occurs during the Rwanda dry seasons and the continental biomass burning seasons, likely the ratio is governed in part by rainout as BC is more easily removed by wet deposition than CO. In this study, we were not able to use this ratio to further separate biomass burning BC from fossil fuel combustion BC. However, this inconclusiveness highlights the need for further study, as ascribing a source to local pollution is important. Further work on emissions profiles relevant to sub-Saharan Africa could clarify these issues. Cookstoves, cook fires, agricultural, and trash burning and older diesel combustion emissions are all likely sources of BC and could be targeted by government policy. Understanding the most important source of local pollution is important for developing efficient government policies for air quality.
3.3 Examination of local and regional pollution
The continuous collection of BC, CO and O3 data during the dry and rainy seasons allowed the examination of both transported and local pollution. Here we define local pollution as pollution originating within 12 h transport time under typical wind speed conditions (<150 km, including both Rwanda and the border areas with DRC and Uganda). During Rwanda's rainy seasons, the continental fire count is also at a minimum, reducing large-scale biomass burning influence. The region's emissions are from small-scale agricultural burning, charcoal making, cooking fires, brick production (located in the valley below the station and throughout the region), vehicles, diesel and heavy fuel oil power plants, and diesel generators. These activities continued throughout the rainy season and dry season at similar rates.
The baseline daily average BC concentration in the rainy season remained at 0.5–1 µg m−3 after 12 h periods without rain, which could be considered as contributions of small but numerous diffuse emission sources to daily BC concentration in this region. These values, while significantly below those during the biomass-burning-affected seasons, are not negligible. If all BC during the rainy seasons is assumed to be local in origin (within 1 day of transport, as typically rain occurs each day during the rainy season), and this level remained the same throughout the year, the yearly average contribution of local emissions to BC would vary between 18 % and 100 % of the total measured BC concentration at the RCO. The shoulder months of September and February have been removed from this calculation as they have both rain and biomass burning influence, but on a yearly scale, around 35 % of BC concentration measured at the station could originate from local emissions. This estimate is a high estimate as transport of BC is still possible above the boundary layer, but it is on par with previous estimates of the contribution of savanna and forest burning BC emissions versus other emission sources in sub-Saharan Africa (Bond et al., 2013).
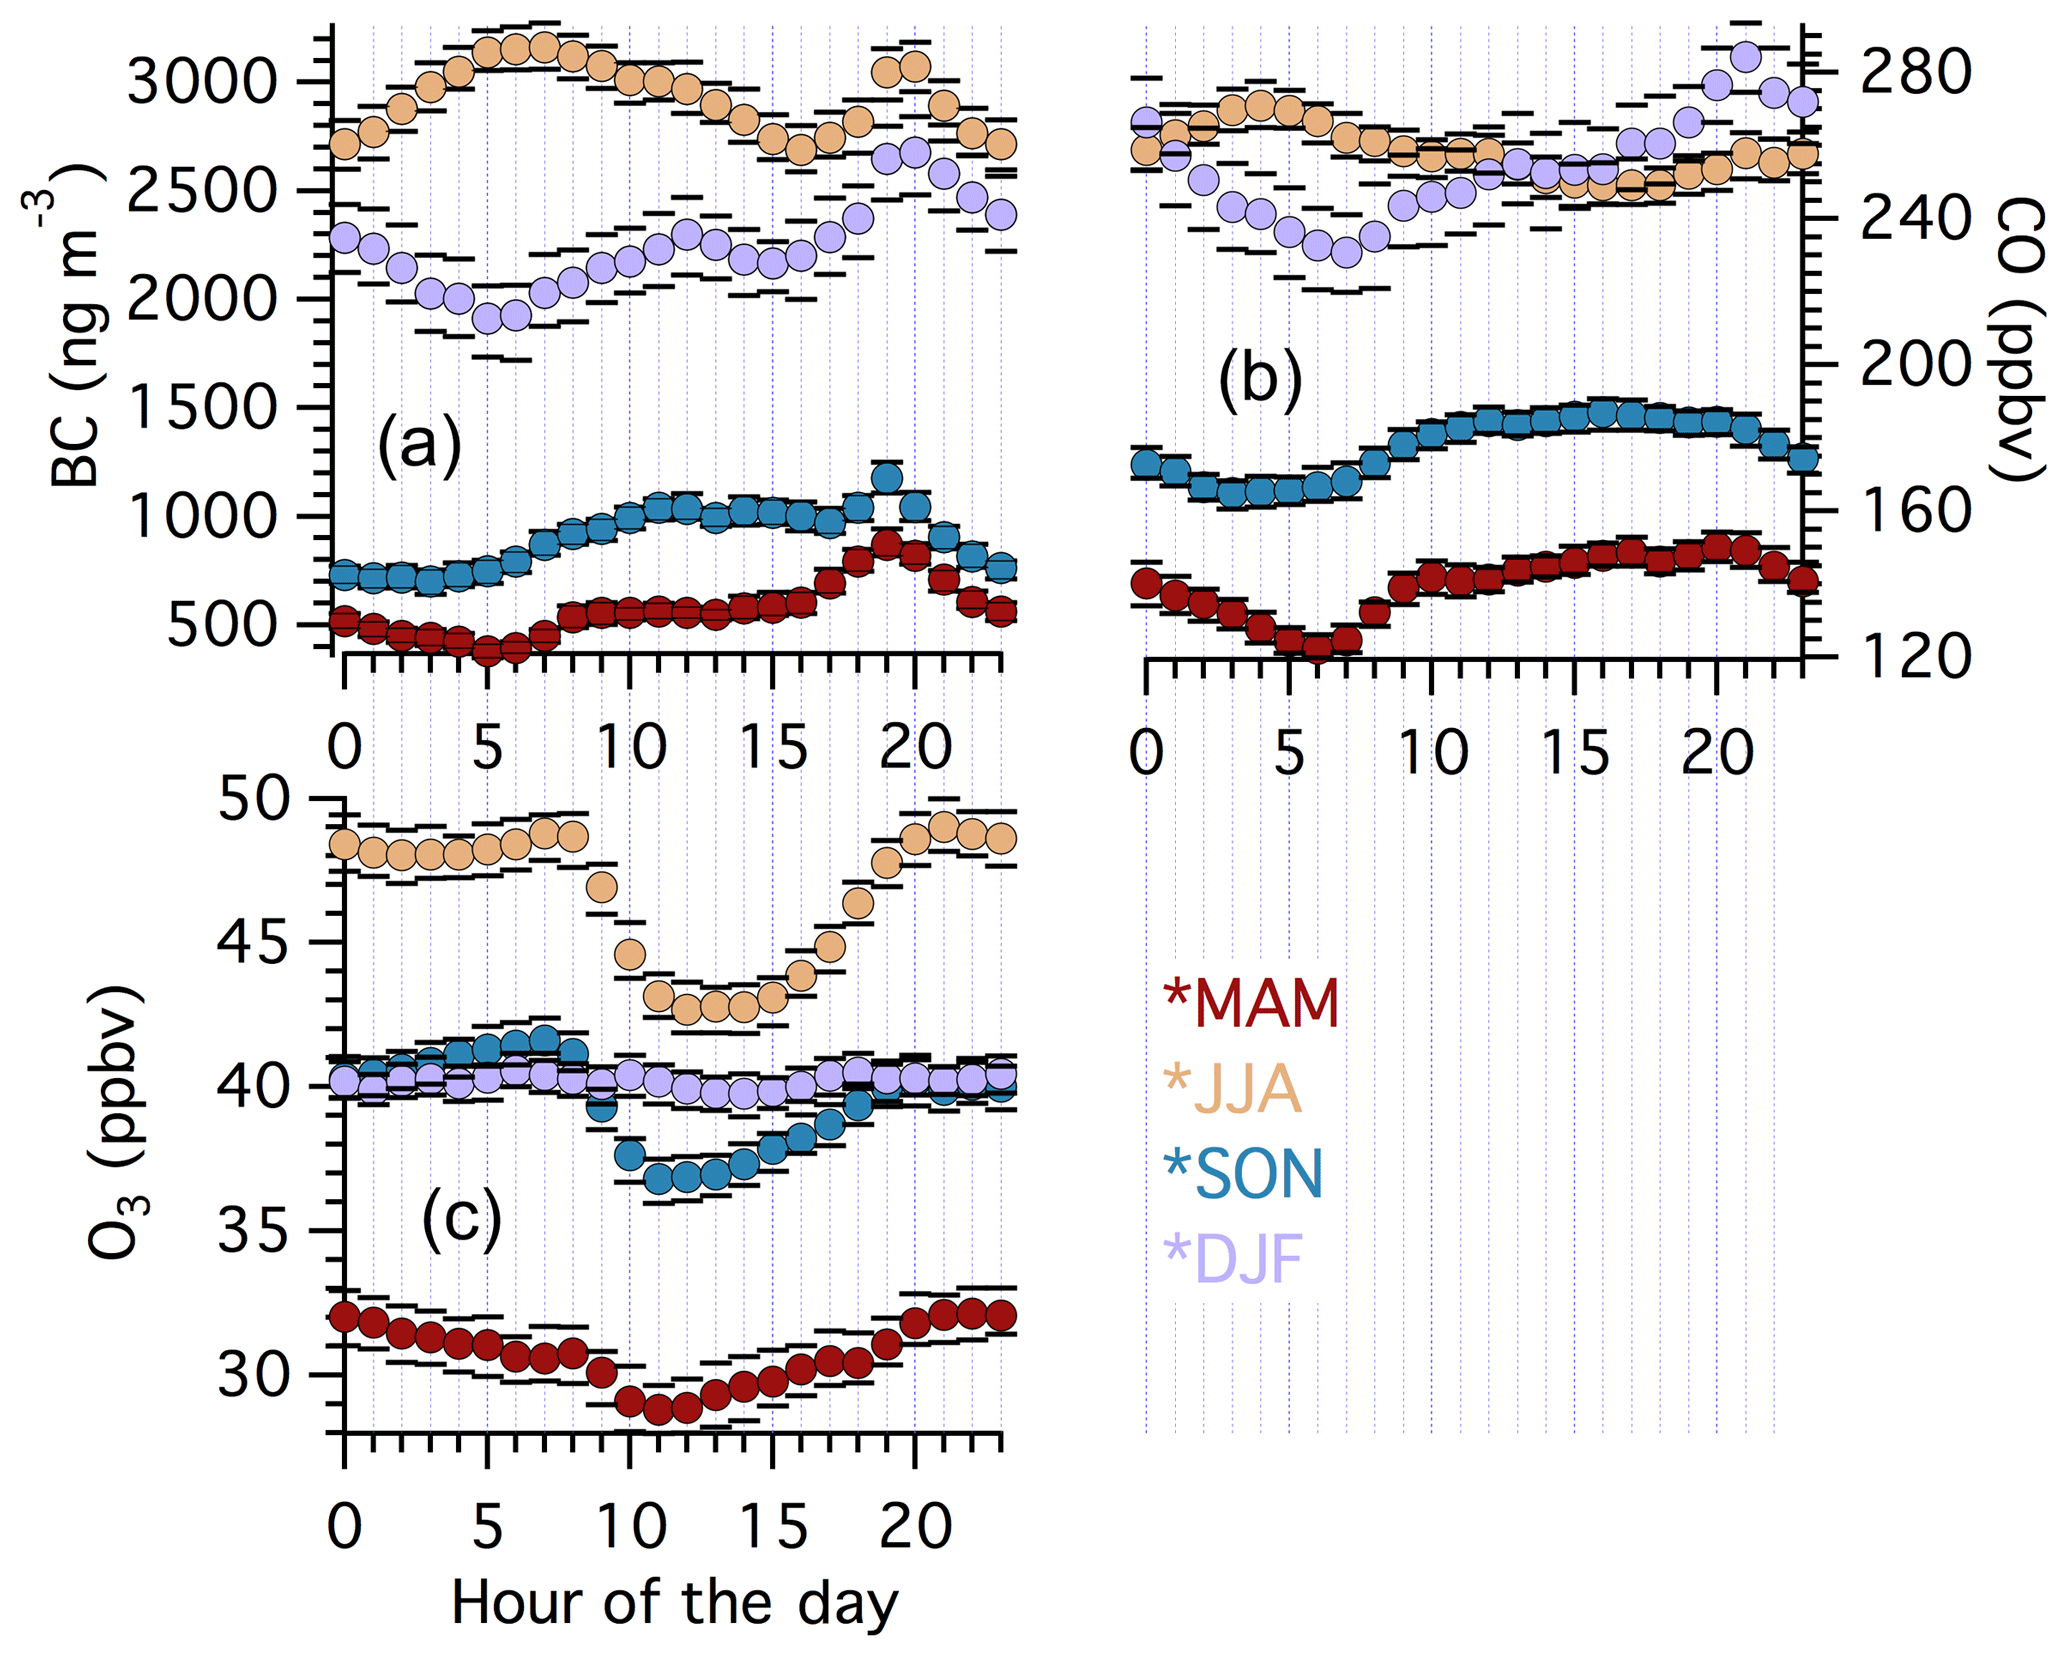
Figure 8Seasonally separated diurnal profiles of (a) BC concentrations, (b) CO mixing ratios, and (c) O3 mixing ratios, colored for each season. The circles represent mean concentrations, and the lines represent 95 % confidence intervals.
3.3.1 Diurnal variations in BC, CO, and O3
Diurnal variations in the concentration of pollutants can provide important insights into information on local as well as regional pollution emission sources. Boundary layer height and whether or not the station is measuring the free troposphere or the polluted boundary layer is also important for understanding diurnal changes in pollutant concentrations (Nyeki et al., 1998). Diurnal variations in BC concentrations, CO mixing ratios, and O3 mixing ratios observed at RCO in different seasons are shown in Fig. 8. At the RCO, the O3 mixing ratio exhibited a diurnal cycle with a peak in concentration in the evenings (after ∼20:00), with steady levels through the night and a minimum at midday. The increase in O3 in the later evening is likely mainly regional O3 transported above the boundary layer measured at night (as the boundary layer height is lowered), but some regionally formed O3 could also be transported to the station by the evening. Similar diurnal O3 profiles were found at other mountain locations remote from urban centers (Zhang et al., 2015). This diurnal pattern persists in all seasons (Fig. 8) and occurred on daily timescales. The differences in diurnal minima and maxima were highest in the June–August period, and lowest in the December–February period. This difference may be due to the differences in biomass burning proximity (far in JJA, closer in DJF), primary wind direction (southerly versus northerly), and also solar intensity (highest in JJA; Safari and Gasore, 2009).
BC had midmorning and early evening (∼18:00) peaks that coincided with both cooking times and kerosene/generator use times (sunset at 18:00 each night), indicating a local influence on BC, before the station was outside of the boundary layer in the evening. These peaks occurred approximately 2 h before the O3 peak each evening, further indicating some regional or local influence. Regional transport of BC higher in the atmosphere should be greater in JJA/DJF (more BC), and solely boundary-layer-driven BC concentration changes would be greater during these times, but the normalized diurnal changes from daily baseline to daily peak remain similar throughout the seasons. Additionally, no persistently higher nighttime (after 20:00) BC baseline levels were observed in these data. CO mixing ratios had a similar but less pronounced diurnal variation.
3.3.2 Case study: high and low periods of black carbon
Seasonal variations are too long to fully capture local pollution events. To further examine local pollution in 2016, high BC time periods during the DJF (12–15 February) and JJA periods (3–6 August) and one period of low black carbon in the MAM period (3–5 March) were examined for their BC:CO ratio and correlation, the relationship of O3 to CO, and AAE (Fig. 9). From this figure, no clear trends are observed. The BC:CO is 10 with an R2 of 0.48 for the polluted DJF period, 8 with an R2 of 0.47 for the non-polluted period in May, and 16.6 with an R2 of 0.72 for the polluted JJA period. The average AAE for the May period was 1.79, 1.53 for February, and 1.53 for August as well. Unfortunately, no O3 data were available for the August period. O3 in February was loosely correlated with CO (R2 0.17) and averaged 39 ppbv, with a peak value of 43. O3 in May had averaged 26 ppbv with a peak of 34 ppbv, and no correlation with CO.
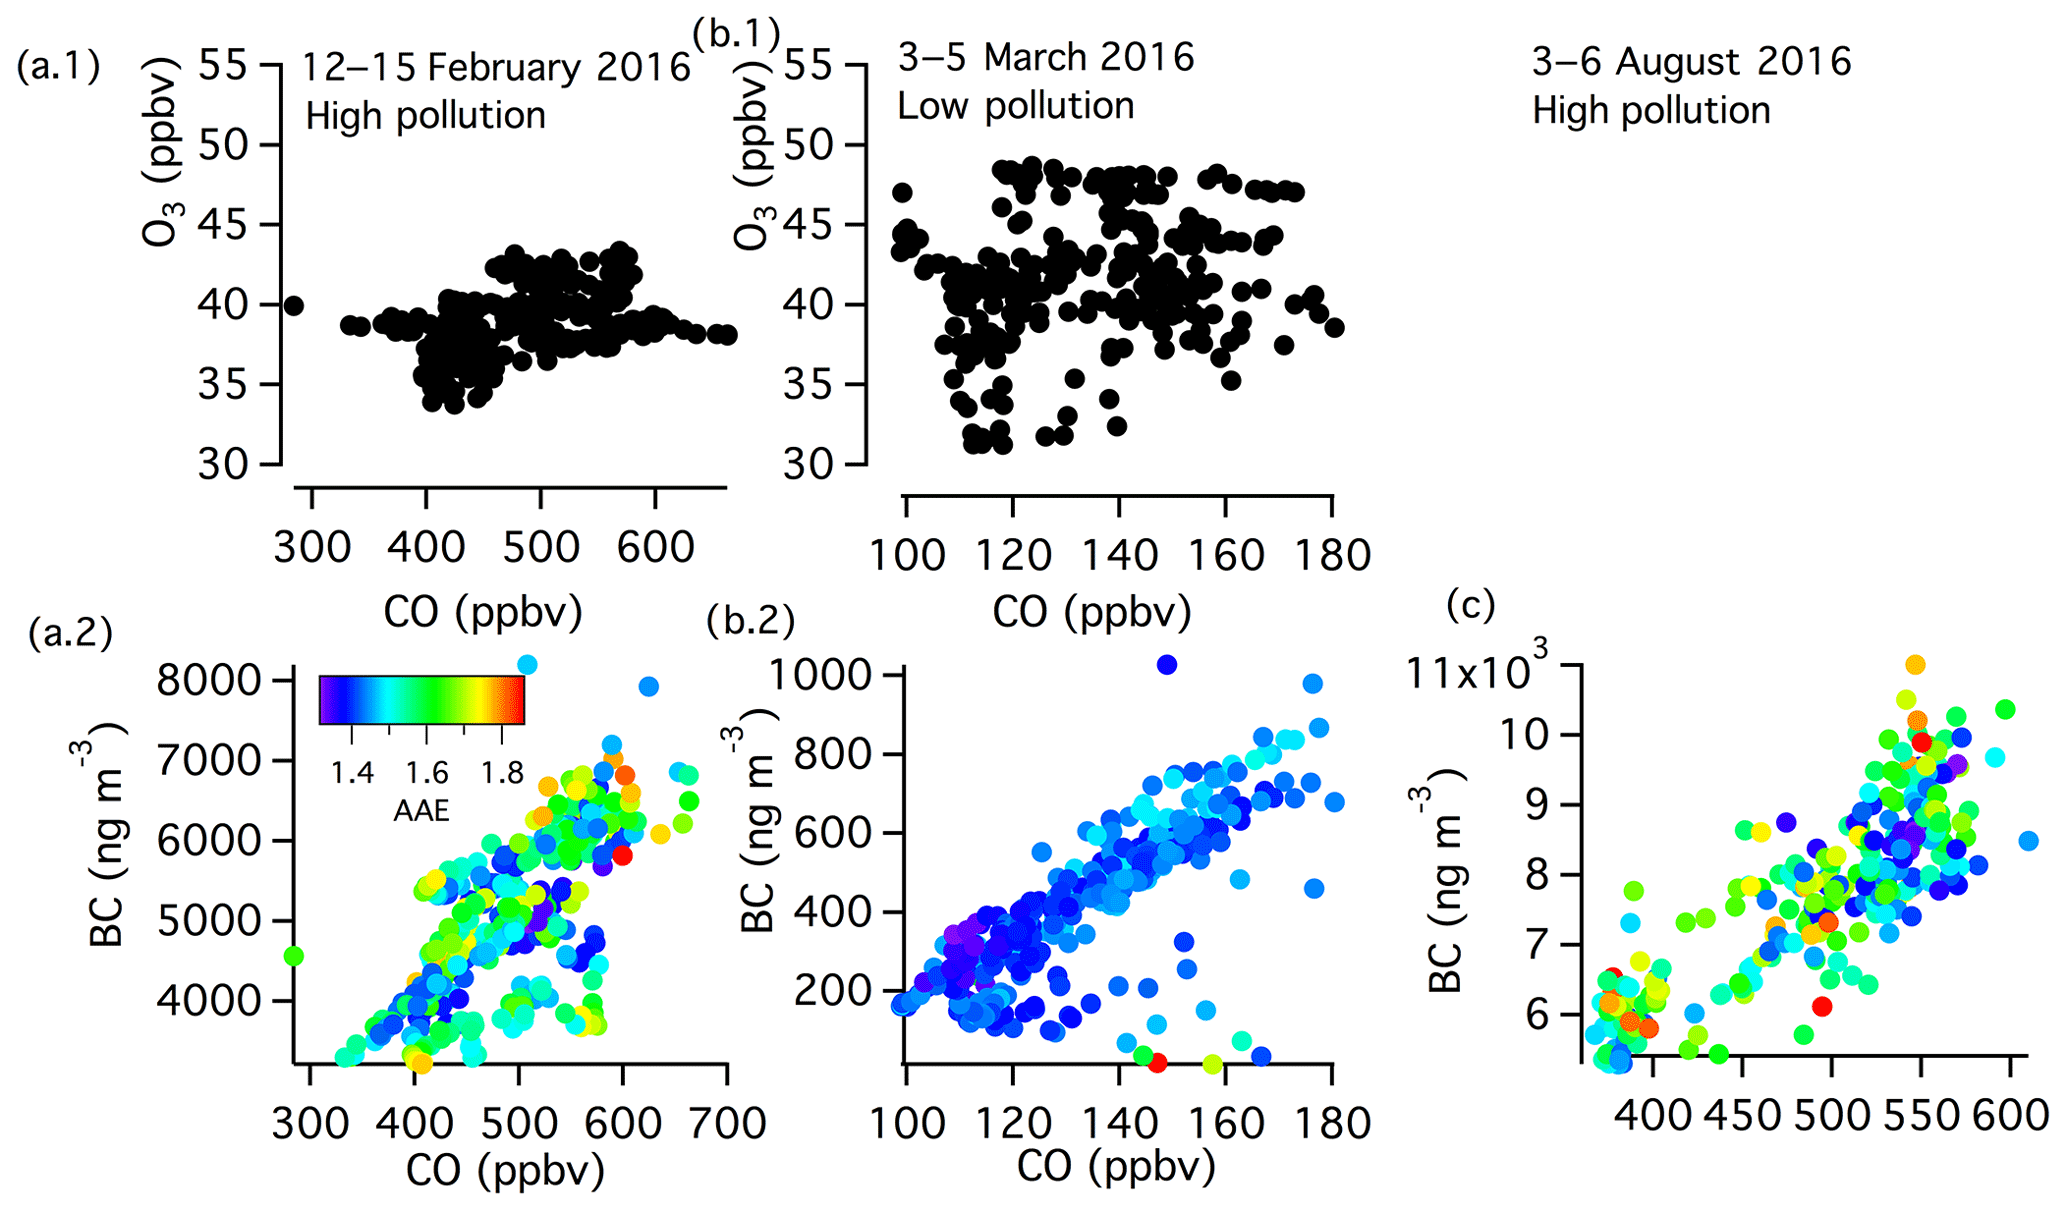
Figure 9Polluted period in DJF (a), non-polluted period in MAM (b), and polluted period in JJA (c). Comparison of O3 and CO in (a.1) and (b.1) and comparison of BC and CO, color-coded by AAE, in (a.2), (b.2), and (c) for each respective period.
During the May period, spikes in very local pollution can be seen (Fig. 10). These hour-plus increases in BC happen at regular cooking times in the valley, and, due to their shorter (hourly) timescales of rise and fall, cannot be explained by changes in boundary layer conditions. The diurnal patterns of increased BC during cooking times persist during the polluted period but on a baseline of regional pollution. Some of the diurnal variability in black carbon background can be attributed to boundary layer conditions, seen with the slow and steady changes over the course of the day not confined to the timescales of activity in the valley.
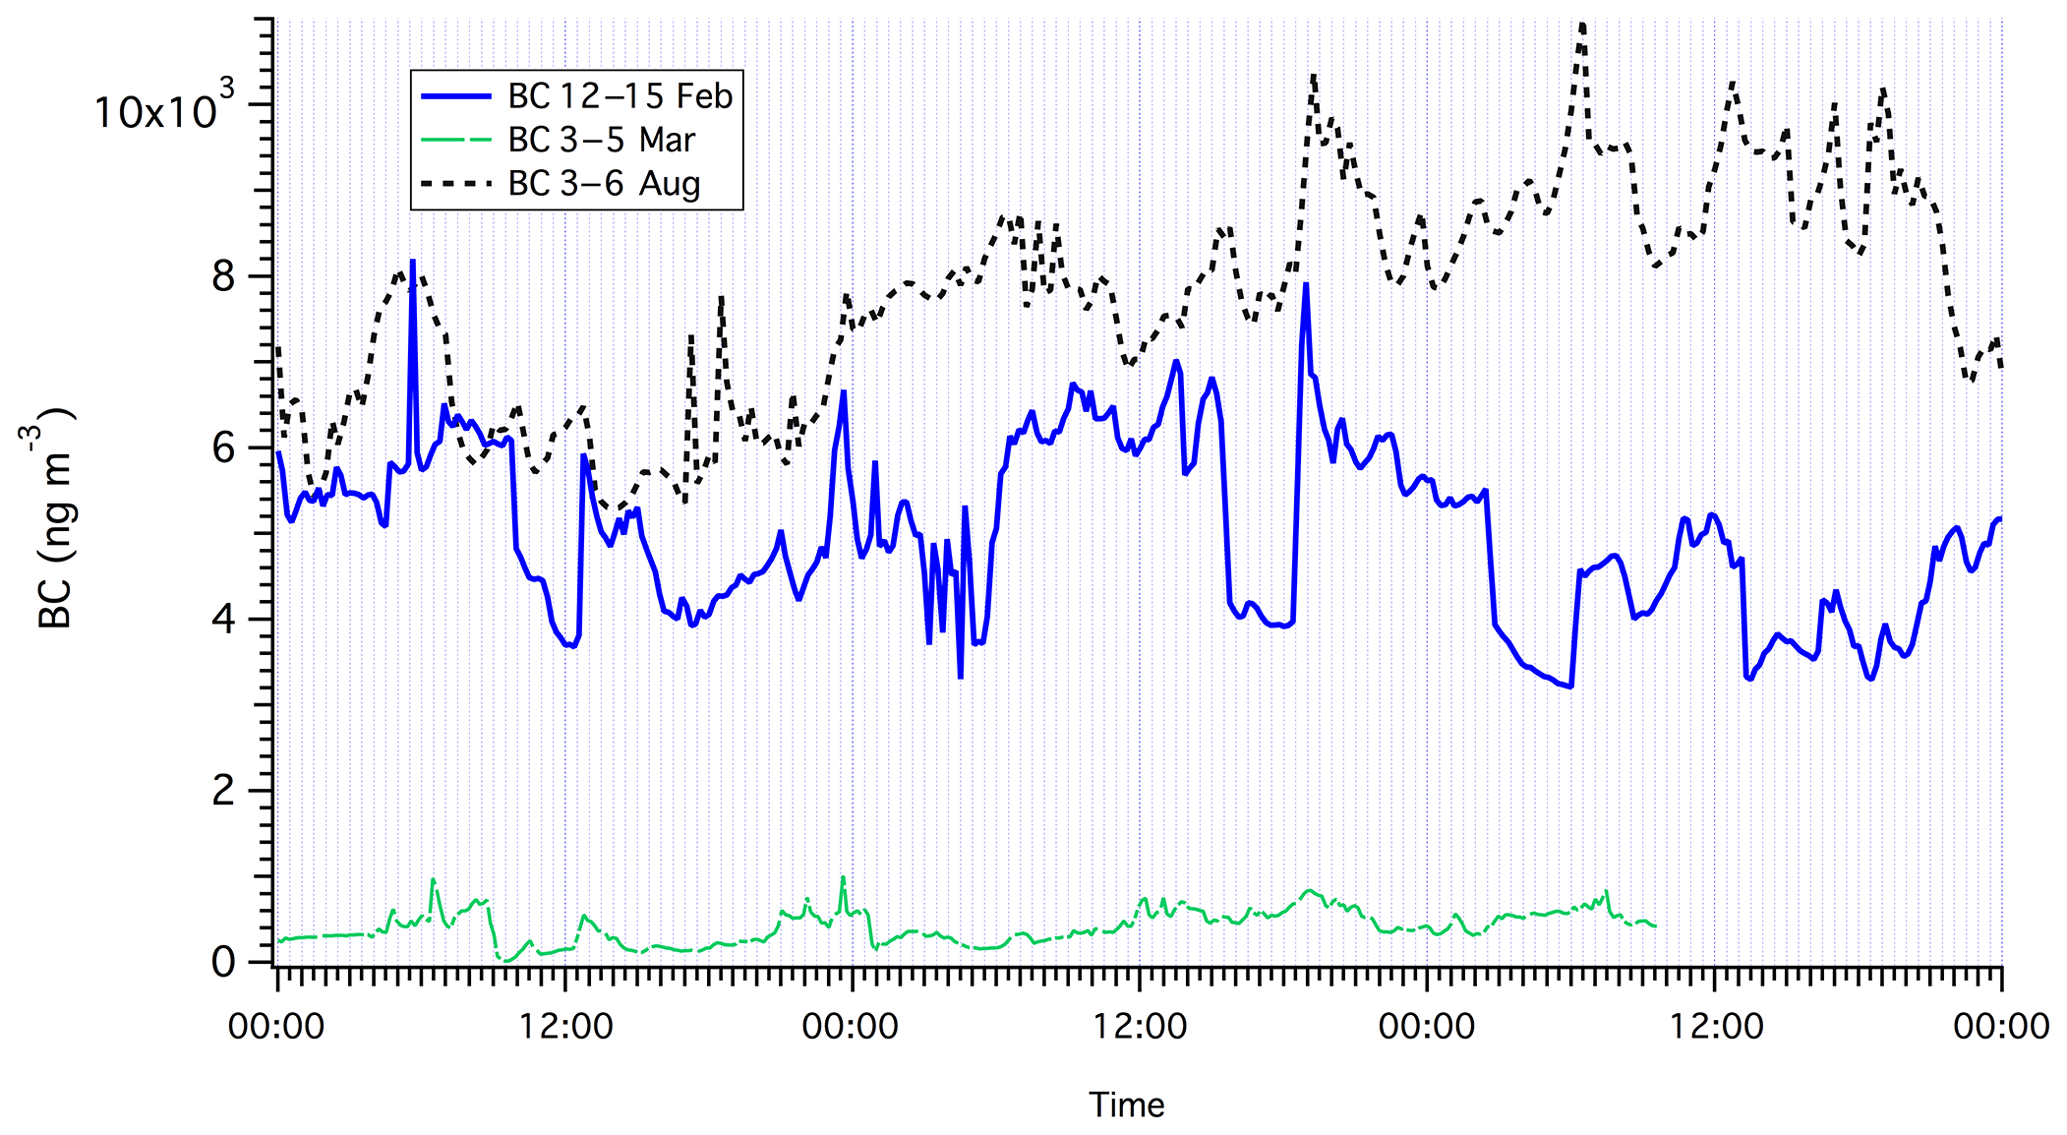
Figure 10Case study of BC in a polluted period in February (blue line), a non-polluted period in March (green line), and a polluted period in August (dotted black line).
3.3.3 Potential twice-yearly influence biomass burning in equatorial Africa
The BC in Rwanda has peaks in both dry seasons, and these peaks correlate well in time with the FRP in sub-Saharan Africa, as shown in Fig. 5. However, the site in Rwanda is one site, and drawing a conclusion on regional seasonal pollution trends is difficult without other data. BC is only one component of PM2.5. Other components of PM2.5 include dust, organic carbon, nitrates, sulfates, and ammonium. BC is indicative of combustion and when BC rises due to combustion processes, often PM2.5 will rise (though combustion aerosol contains a significant organic fraction).
Although no continuous measurements of BC are widely reported in sub-Saharan Africa, recently the US embassies in Addis Ababa, Ethiopia, and Kampala, Uganda have begun continuously measuring PM2.5 concentrations. The raw data are collected and reported online on the OpenAQ platform (http://OpenAQ.org, last access: 1 June 2018). This data set on PM2.5 concentrations in major cities over different seasons in this region has been valuable in gaining basic insights into the seasonal characteristics of PM2.5 concentrations in the region (Fig. 11). While PM2.5 is not the same as BC, biomass burning is thought to be a major contributor to PM2.5 in sub-Saharan Africa. By examining the PM2.5 concentration in a city in the same region as Rwanda (equatorial east Africa) and a different region (further north), the impact of the dual biomass burning seasons for different regions in sub-Saharan Africa's air quality can be better understood.
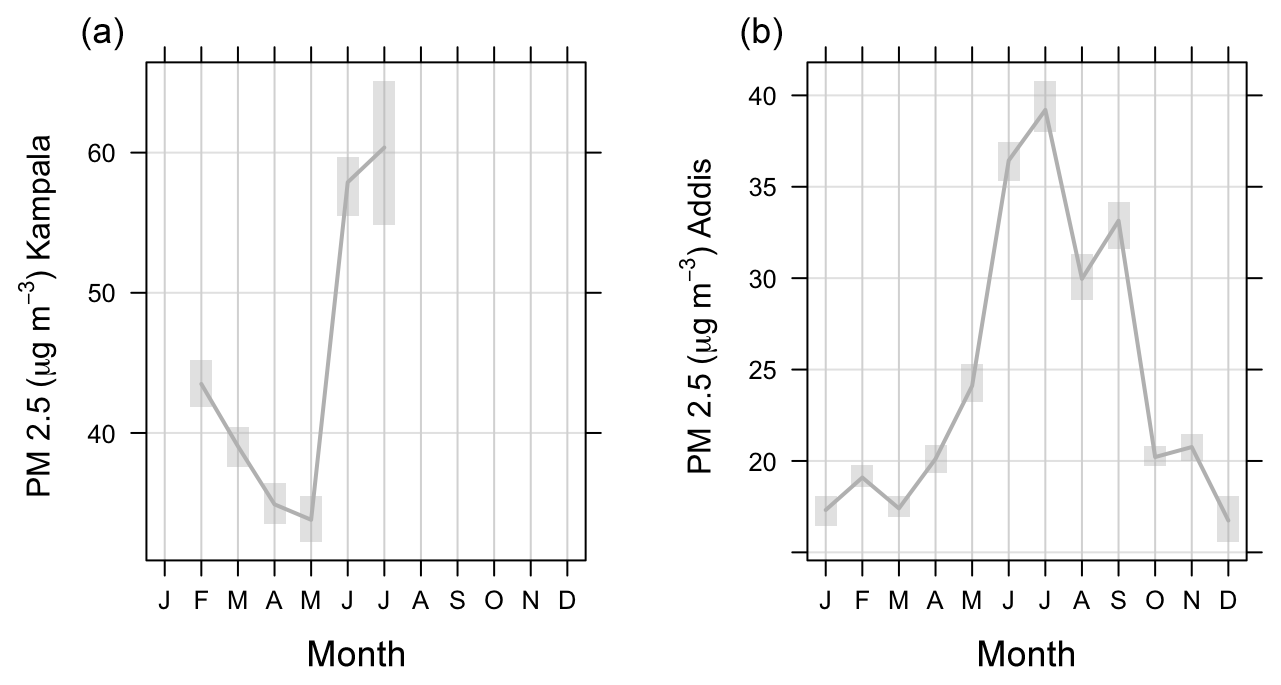
Figure 11Monthly means of PM2.5 concentrations measured at the US embassies in (a) Kampala, Uganda, (as available) and (b) Addis Ababa, Ethiopia, (b) from January–December 2016/2017 (as available). Shaded areas are 95 % confidence intervals. Lines indicate daily average WHO recommendation for healthy PM2.5 limits.
The PM2.5 concentrations in both Addis Ababa and Kampala showed clear seasonal patterns, though the seasonal patterns differed at the two sites. Addis Ababa (Ethiopia) is much further north than Rwanda, and Ethiopia is in general higher in elevation than Rwanda (though at 2355 m, not higher than the RCO) and closer to the Indian Ocean. In Addis Ababa, the dry season is also in DJF, but measured PM2.5 concentrations were low during this season. HYSPLIT back trajectory calculations confirmed that air masses during this time of the year originated over the ocean, not from the continent. Kampala, Uganda, is close to Rwanda, near the Equator, and has similar seasonality. Rainy and dry season extrema are shown in the available Kampala PM2.5 data, with an enhancement during February and JJA of around 15 to 25–30 µg m−3, respectively, above PM2.5 concentrations during other months.
While not pictured here, South Africa has the most air quality monitoring stations of any sub-Saharan African country. Results from these stations show a PM2.5 peak in the southern burning season (June–October), though June–July was mostly due to local heating (Hersey et al., 2015) and August–October was related to biomass burning (Horowitz et al., 2017; Tesfaye et al., 2011).
From these data, it appears that African countries near the Equator may be positioned to experience 6 months per year of transported regional fire haze, from both the northern and southern biomass burning seasons. This is potentially unique to the region and this effect may be seen in other pollutants and short lived climate forcers. In fact, beyond BC and PM2.5, the MOZAIC campaign in the late 1990s and early 2000s measured ambient O3 mixing ratios at the Nairobi, Kampala, and Kigali airports. This campaign found Kigali, despite its smaller size and lower vehicle count, to have the highest O3 mixing ratios among them (Sauvage et al., 2005). They measured an increase, similar in magnitude, in surface O3 mixing ratios during the JJA season in Rwanda as our measurements at the RCO, although DJF was not measured in their work.
O3 measurements were made in Brazzaville, Republic of the Congo, during January and February O3. While much further west than Rwanda, in Brazzaville O3 mixing ratios also increased during January and February, parallel to Rwanda, with monthly averages during January and February 25 ppb greater than the minimum of <30 ppb in April (Sauvage et al., 2005). This suggests influence from Northern Hemisphere biomass burning to O3 mixing ratios at Brazzaville. O3 in JJA at Brazzaville was almost 30 ppb higher than in January and February, however, so transport of air mass from the south and southern Africa biomass burning had a greater influence on O3 in the region than transport from the north and biomass burning in central Africa. The 1992 SAFARI campaign also measured O3 in sub-Saharan Africa throughout all seasons and measured a seasonal ozone concentration peak during the JJA period for central and southern Africa (Thompson et al., 1996). A separate, large peak for DJF was not as observable in the SAFARI data (Thompson et al., 1996). SAFARI measurements took place prior to 1993, meaning that significant development in sub-Saharan Africa could have taken place between the SAFARI campaign and the MOZAIC campaign (1997–2003) that could drive the increasing O3 in DJF as well as JJA over a period of almost a decade. More recent measurements were made in a 2000 SAFARI campaign but not as far north as the previous SAFARI campaign (Otter et al., 2002), and the positioning of the measurements could have also had an effect on O3 seasonality, as southern Africa is more influenced by biomass burning from August–October. The SAFARI campaign measured the total column O3, not the ground-level O3 mixing ratios, so data are not directly comparable.
In this work, we present the first long-term and continuous measurements of short-lived climate forcers for a nearly 2-year period from July 2015 to January 2017 at the Rwanda Climate Observatory located at Mt. Mugogo in Rwanda. From these observations, we find that
-
during Rwanda's two dry seasons, transported pollution led to high black carbon and carbon monoxide levels at the RCO, surpassing concentrations measured in many major cities elsewhere. Emissions from large-scale crop and savanna fires could have a wide-reaching effect on this region and likely drive the increased BC and O3 measured during DJF and JJA by our study and the O3 measured by past studies in equatorial Africa. The dense population of equatorial East Africa and the double impact of the two fire seasons could lead to significant public health problems for the population in Rwanda and equatorial East Africa as exposure to elevated levels of PM2.5 and BC concentrations occurs 6 months of the year.
-
local emissions beyond large-scale biomass burning influence were constant and estimated to contribute up to 35 % of the annual average measured black carbon concentration if black carbon during the rainy season was assumed to be completely local (Rwanda and neighboring countries) in origin (ranging from 0.5 to 1 µg m−3 daily average measured BC). These local emissions, from different combustion sources (e.g., cooking fires, inefficient diesel generators and engines with substandard fuel use, solid biomass fuel burning, small agricultural fires) are likely concentrated in the densely populated Rwanda and Lake Kivu economic area. Rwanda's population is growing quickly. As these local emissions are related to population density, air pollution will likely increase unless there is government intervention.
-
different combustion fuel and burning practices in Europe and East Africa call into question for use in East Africa the accuracy and applicability of a two-component model for estimating BC from fossil fuel combustion and biomass burning using AAE approximations for biomass burning and fossil fuel combustion aerosol measured in Europe. There may also be different mass absorption cross sections for aerosols measured at the RCO than in Europe or North America. This shows the need for multiple on-ground measurements to fully understand pollution sources in different regions of the world, notably in Africa. However, seasonal variations in the wavelength dependence of ambient BC particles did point to different sources of BC particles, and this should be further explored in future studies.
-
the measurements we have provided in this study will be useful in advancing atmospheric science in Rwanda, which has limited long-term and in situ atmospheric data.
These data and analyses, while acknowledging the high influence of regional biomass burning, also show that measurable decreases in air pollution could be achieved within eastern and central Africa with targeted local policies, emphasizing cleaner diesel vehicles and generators, reduced wood-fuel reliance for cookstoves, and improved cookstoves to burn biomass fuel more efficiently. Currently, over 2 million households in Rwanda rely on wood burning (including charcoal) for cooking. While reducing this number will have significant economic costs, putting in place infrastructure for alternative cooking fuels (pellet stoves, LPG stoves, electrical stoves) could help the country avoid even higher local air pollution emissions and associated adverse impacts as the population grows. Diesel-fueled minibuses, common transport between towns in Rwanda and within Kigali, and older diesel vehicles are also high emitters of black carbon but newer vehicles with emission control technology may be economically beyond the reach of local bus companies and citizens. Continuing to grow electrical capacity and connection will reduce the use of kerosene lanterns and diesel generators and will reduce air pollution if additional energy capacity is achieved through renewable sources (solar, hydropower). The huge influence of regional biomass burning, exacerbated by equatorial East Africa's meteorology, and the potential influence of anthropogenic emissions from major cities on O3 formation in these regions must also be examined as this area develops. Halting slash-and-burn agriculture, reducing trash incineration, and developing ways to warn the population during periods of high pollution from naturally occurring savanna and forest fires should be important points on the agenda for regional discussions on environmental, public health, and other development issues.
The government of Rwanda is working to establish an air quality and climate change monitoring network throughout the country to measure ambient criteria air pollutants and other key climate-change-related components of atmospheric pollution. Building knowledge of air quality and climate-change-related emissions in this data-poor area of the world is essential to fill the large data and knowledge gap in this region. Adding ground-based measurements, comparing measurements to satellite data, using data to evaluate and improve existing emission inventories, improving the accuracy of global/regional air quality and climate change models, and using data for the quantification of the impacts of air pollution and climate change will help local governments design appropriate mitigation strategies rooted in data and local context.
These data will be made available at the AGAGE website (https://agage.mit.edu/data/agage-data, Prinn et al., 2016, 2000). All data used in this article will be made available as of publication, and other data from this project will be available on a rolling basis after quality control.
HLDW wrote the manuscript, worked with the instruments, and analyzed the data. JG worked with the instruments, including helping or leading installation, and provided feedback on data analysis. KEP was instrumental in setting up the RCO and did most of the initial instrument installation. JN and JdDN worked as technical coordinators of the project at different times and facilitated the operations of the station as well as providing feedback on analysis. BS assisted with data analysis and was our University of Rwanda liaison as the head of the Climate Change Science Masters program. RGP is the head of the AGAGE network and is the MIT liaison to the RCO, and was essential in the setup of the observatory and scientific analysis.
The authors declare that they have no conflict of interest.
We thank the generous MIT alumni donors to the MIT-Rwanda Climate Observatory
Project that provided the funds to purchase, develop, and install most of the
instruments at the Rwanda Climate Observatory. Additional funds for this
purpose were provided by the MIT Center for Global Change Science. COMESA
provided the funds to purchase and install the Aethalometer at the RCO. We
also thank the Government of Rwanda and the Rwanda Ministry of Education,
specifically Mike Hughes, Vianney Rugamba, and Marie Christine Gasingirwa,
for supporting this project, including funding the staffing and
infrastructure costs of the Rwanda Climate Observatory, and the University of
Rwanda for providing laboratory space and infrastructure for instrument
testing. We thank Arnico Panday, who provided guidance during the initial
stages of this project. We also wish to acknowledge the essential
contributions of the Mugogo station technical experts Theobard Habineza,
Modeste Mugabo, Olivier Shyaka, and Gaston Munyampundu and RBA technician
Yves Fidele, without which running this station would be
impossible.
Edited by: Rupert Holzinger
Reviewed by: two anonymous referees
Andreae, M. O. and Gelencsér, A.: Black carbon or brown carbon? The nature of light-absorbing carbonaceous aerosols, Atmos. Chem. Phys., 6, 3131–3148, https://doi.org/10.5194/acp-6-3131-2006, 2006.
Archibald, S., Nickless, A., Govender, N., Scholes, R. J., and Lehsten, V.: Climate and the inter-annual variability of fire in southern Africa: a meta-analysis using long-term field data and satellite-derived burnt area data, Global Ecol. Biogeogr., 19, 794–809, 2010.
Baier, B. C., Brune, W. H., Lefer, B. L., Miller, D. O., and Martins, D. K.: Direct ozone production rate measurements and their use in assessing ozone source and receptor regions for Houston in 2013, Atmos. Environ., 114, 83–91, https://doi.org/10.1016/J.ATMOSENV.2015.05.033, 2015.
Baumgardner, D., Raga, G., Peralta, O., Rosas, I., Castro, T., Kuhlbusch, T., John, A., and Petzold, A.: Diagnosing black carbon trends in large urban areas using carbon monoxide measurements, J. Geophys. Res.-Atmos., 107, 8342, https://doi.org/10.1029/2001JD000626, 2002.
Bond, T. C., Doherty, S. J., Fahey, D. W., Forster, P. M., Berntsen, T., DeAngelo, B. J., Flanner, M. G., Ghan, S., Kärcher, B., Koch, D., Kinne, S., Kondo, Y., Quinn, P. K., Sarofim, M. C., Schultz, M. G., Schulz, M., Venkataraman, C., Zhang, H., Zhang, S., Bellouin, N., Guttikunda, S. K., Hopke, P. K., Jacobson, M. Z., Kaiser, J. W., Klimont, Z., Lohmann, U., Schwarz, J. P., Shindell, D., Storelvmo, T., Warren, S. G., and Zender, C. S.: Bounding the role of black carbon in the climate system: A scientific assessment, J. Geophys. Res.-Atmos., 118, 5380–5552, https://doi.org/10.1002/jgrd.50171, 2013.
Cai, H., Burnham, A., and Wang, M.: Updated Emission Factors of Air Pollutants from Vehicle Operations in GREET TM Using MOVES, September, 2013.
Carslaw, D. C. and Ropkins, K.: The openair manual open-source tools for analysing air pollution data, King's Coll. London, 27–28 January, 287 pp., 2012.
Chung, C. E., Kim, S.-W., Lee, M., Yoon, S.-C., and Lee, S.: Carbonaceous aerosol AAE inferred from in-situ aerosol measurements at the Gosan ABC super site, and the implications for brown carbon aerosol, Atmos. Chem. Phys., 12, 6173–6184, https://doi.org/10.5194/acp-12-6173-2012, 2012.
Crutzen, P. J. and Andreae, M.: Biomass Burning in the Tropics: Impact on Atmospheric Chemistry and Biogeochemical Cycles Estimates of Worldwide Biomass Burning, Science, 250, 1669–1678, https://doi.org/10.1126/science.250.4988.1669, 1990.
Dickerson, R. R., Andreae, M. O., Campos, T., Mayol-Bracero, O. L., Neusuess, C., and Streets, D. G.: Analysis of black carbon and carbon monoxide observed over the Indian Ocean: Implications for emissions and photochemistry, J. Geophys. Res., 107, 8017, https://doi.org/10.1029/2001jd000501, 2002.
Drinovec, L., Mocnik, G., Zotter, P., Prévôt, A. S. H., Ruckstuhl, C., Coz, E., Rupakheti, M., Sciare, J., Müller, T., Wiedensohler, A., and Hansen, A. D. A.: The “dual-spot” Aethalometer: an improved measurement of aerosol black carbon with real-time loading compensation, Atmos. Meas. Tech., 8, 1965–1979, https://doi.org/10.5194/amt-8-1965-2015, 2015.
Dumka, U. C., Manchanda, R. K., Sinha, P. R., Sreenivasan, S., Moorthy, K. K., and Suresh Babu, S.: Temporal variability and radiative impact of black carbon aerosol over tropical urban station Hyderabad, J. Atmos. Sol.-Terr. Phy., 105–106, 81–90, https://doi.org/10.1016/j.jastp.2013.08.003, 2013.
Field, R. D., van der Werf, G. R., Fanin, T., Fetzer, E. J., Fuller, R., Jethva, H., Levy, R., Livesey, N. J., Luo, M., Torres, O., and Worden, H. M.: Indonesian fire activity and smoke pollution in 2015 show persistent nonlinear sensitivity to El Niño-induced drought, P. Natl. Acad. Sci. USA, 113, 9204–9209, https://doi.org/10.1073/pnas.1524888113, 2016.
Garg, S., Chandra, B. P., Sinha, V., Sarda-Esteve, R., Gros, V., and Sinha, B.: Limitation of the Use of the Absorption Angstrom Exponent for Source Apportionment of Equivalent Black Carbon: a Case Study from the North West Indo-Gangetic Plain, Environ. Sci. Technol., 50, 814–824, https://doi.org/10.1021/acs.est.5b03868, 2016.
Gasore, J.: Quantifying Emissions of Carbon Dioxide and Methane in Central and Eastern Africa Through High Frequency Measurements and Inverse Modeling, MIT, http://hdl.handle.net/1721.1/115771 (last access: 2 December 2018), 2018.
Gatari, M. J. and Boman, J.: Black carbon and total carbon measurements at urban and rural sites in Kenya, East Africa, Atmos. Environ., 37, 1149–1154, https://doi.org/10.1016/S1352-2310(02)01001-4, 2003.
Geddes, J. A., Murphy, J. G., and Wang, D. K.: Long term changes in nitrogen oxides and volatile organic compounds in Toronto and the challenges facing local ozone control, Atmos. Environ., 43, 3407–3415, https://doi.org/10.1016/J.ATMOSENV.2009.03.053, 2009.
Gong, X., Kaulfus, A., Nair, U., and Jaffe, D. A.: Quantifying O3 Impacts in Urban Areas Due to Wildfires Using a Generalized Additive Model, Environ. Sci. Technol., 51, 13216–13223, https://doi.org/10.1021/acs.est.7b03130, 2017.
Harrison, R. M., Beddows, D. C. S., Hu, L., and Yin, J.: Comparison of methods for evaluation of wood smoke and estimation of UK ambient concentrations, Atmos. Chem. Phys., 12, 8271–8283, https://doi.org/10.5194/acp-12-8271-2012, 2012.
Hersey, S. P., Garland, R. M., Crosbie, E., Shingler, T., Sorooshian, A., Piketh, S., and Burger, R.: An overview of regional and local characteristics of aerosols in South Africa using satellite, ground, and modeling data, Atmos. Chem. Phys., 15, 4259–4278, https://doi.org/10.5194/acp-15-4259-2015, 2015.
Horowitz, H. M., Garland, R. M., Thatcher, M., Landman, W. A., Dedekind, Z., van der Merwe, J., and Engelbrecht, F. A.: Evaluation of climate model aerosol seasonal and spatial variability over Africa using AERONET, Atmos. Chem. Phys., 17, 13999–14023, https://doi.org/10.5194/acp-17-13999-2017, 2017.
Hsu, Y. K., Holsen, T. M., and Hopke, P. K.: Comparison of hybrid receptor models to locate PCB sources in Chicago, Atmos. Environ., 37, 545–562, https://doi.org/10.1016/S1352-2310(02)00886-5, 2003.
Kabashnikov, V. P., Chaikovsky, A. P., Kucsera, T. L., and Metelskaya, N. S.: Estimated accuracy of three common trajectory statistical methods, Atmos. Environ., 45, 5425–5430, https://doi.org/10.1016/j.atmosenv.2011.07.006, 2011.
Jaffe, D. A. and Wigder, N. L.: Ozone production from wildfires: A critical review, Atmos. Environ., 51, 1–10, https://doi.org/10.1016/j.atmosenv.2011.11.063, 2012.
Kalnay, E., Kanamitsu, M., Kistler, R., Collins, W., Deaven, D., Gandin, L., Iredell, M., Saha, S., White, G., Woollen, J., Zhu, Y., Chelliah, M., Ebisuzaki, W., Higgins, W., Janowiak, J., Mo, K. C., Ropelewski, C., Wang, J., Leetmaa, A., Reynolds, R., Jenne, R., and Joseph, D.: The NCEP/NCAR 40-year reanalysis project, B. Am. Meteorol. Soc., 77, 437–471, https://doi.org/10.1175/1520-0477(1996)077<0437:TNYRP>2.0.CO;2, 1996.
Kirchstetter, T. W. and Thatcher, T. L.: Contribution of organic carbon to wood smoke particulate matter absorption of solar radiation, Atmos. Chem. Phys., 12, 6067–6072, https://doi.org/10.5194/acp-12-6067-2012, 2012.
Kirchstetter, T. W., Novakov, T., and Hobbs, P. V.: Evidence that the spectral dependence of light absorption by aerosols is affected by organic carbon, J. Geophys. Res., 109, D21208, https://doi.org/10.1029/2004JD004999, 2004.
Koch, D., Schulz, M., Kinne, S., McNaughton, C., Spackman, J. R., Balkanski, Y., Bauer, S., Berntsen, T., Bond, T. C., Boucher, O., Chin, M., Clarke, A., De Luca, N., Dentener, F., Diehl, T., Dubovik, O., Easter, R., Fahey, D. W., Feichter, J., Fillmore, D., Freitag, S., Ghan, S., Ginoux, P., Gong, S., Horowitz, L., Iversen, T., Kirkevåg, A., Klimont, Z., Kondo, Y., Krol, M., Liu, X., Miller, R., Montanaro, V., Moteki, N., Myhre, G., Penner, J. E., Perlwitz, J., Pitari, G., Reddy, S., Sahu, L., Sakamoto, H., Schuster, G., Schwarz, J. P., Seland, Ø., Stier, P., Takegawa, N., Takemura, T., Textor, C., van Aardenne, J. A., and Zhao, Y.: Evaluation of black carbon estimations in global aerosol models, Atmos. Chem. Phys., 9, 9001–9026, https://doi.org/10.5194/acp-9-9001-2009, 2009.
Lack, D. A. and Langridge, J. M.: On the attribution of black and brown carbon light absorption using the Ångström exponent, Atmos. Chem. Phys., 13, 10535–10543, https://doi.org/10.5194/acp-13-10535-2013, 2013.
Lupu, A. and Maenhaut, W.: Application and comparison of two statistical trajectory techniques for identification of source regions of atmospheric aerosol species, Atmos. Environ., 36, 5607–5618, https://doi.org/10.1016/S1352-2310(02)00697-0, 2002.
Mkoma, S. L., Maenhaut, W., Chi, X., Wang, W., and Raes, N.: Characterisation of PM10 atmospheric aerosols for the wet season 2005 at two sites in East Africa, Atmos. Environ., 43, 631–639, https://doi.org/10.1016/j.atmosenv.2008.10.008, 2009.
Monks, P. S., Archibald, A. T., Colette, A., Cooper, O., Coyle, M., Derwent, R., Fowler, D., Granier, C., Law, K. S., Mills, G. E., Stevenson, D. S., Tarasova, O., Thouret, V., von Schneidemesser, E., Sommariva, R., Wild, O., and Williams, M. L.: Tropospheric ozone and its precursors from the urban to the global scale from air quality to short-lived climate forcer, Atmos. Chem. Phys., 15, 8889–8973, https://doi.org/10.5194/acp-15-8889-2015, 2015.
Moosmüller, H. and Chakrabarty, R. K.: Technical Note: Simple analytical relationships between Ångström coefficients of aerosol extinction, scattering, absorption, and single scattering albedo, Atmos. Chem. Phys., 11, 10677–10680, https://doi.org/10.5194/acp-11-10677-2011, 2011.
Niang, I., Ruppel, O. C., Abdrabo, M. A., Essel, A., Lennard, C., Padgham, J., and Urquhart, P.: Africa, Clim. Chang. 2014 Impacts, Adapt. Vulnerability – Contrib. Work. Gr. II to Fifth Assess. Rep. Intergov. Panel Clim. Chang., 1199–1265, https://doi.org/10.1017/CBO9781107415386.002, 2014.
Nyeki, S., Li, F., Weingartner, E., Streit, N., Colbeck, I., Gäggeler, H. W., and Baltensperger, U.: The background aerosol size distribution in the free troposphere: An analysis of the annual cycle at a high-alpine site, J. Geophys. Res.-Atmos., 103, 31749–31761, https://doi.org/10.1029/1998JD200029, 1998.
Otter, L. B., Scholes, R. J., Dowty, P., Privette, J., Caylor, K., Ringrose, S., Mukelabai, M., Frost, P., Hanan, N., Totolo, O., and Veenendaal, E. M.: The Southern African Regional Science Initiative SAFARI 2000: wet season campaigns, Situ, April, 131–137, 2002.
Pan, X. L., Kanaya, Y., Wang, Z. F., Liu, Y., Pochanart, P., Akimoto, H., Sun, Y. L., Dong, H. B., Li, J., Irie, H., and Takigawa, M.: Correlation of black carbon aerosol and carbon monoxide in the high-altitude environment of Mt. Huang in Eastern China, Atmos. Chem. Phys., 11, 9735–9747, https://doi.org/10.5194/acp-11-9735-2011, 2011.
Prinn, R. G., Weiss, R. F., Fraser, P. J., Simmonds, P. G., Cunnold, D. M., Alyea, F. N., O'Doherty, S., Salameh, P., Miller, B. R., Huang, J., Wang, R. H. J., Hartley, D. E., Harth, C., Steele, L. P., Sturrock, G., Midgley, P. M., and McCulloch, A.: A history of chemically and radiatively important gases in air deduced from ALE/GAGE/AGAGE, J. Geophys. Res.-Atmos., 105, 17751–17792, https://doi.org/10.1029/2000JD900141, 2000.
Prinn, R. G., Weiss, R. F., Krummel, P. B., O'Doherty, S., Fraser, P. J., Muhle, J., Reimann, S., Vollmer, M. K., Simmonds, P. G., Maione, M., Arduini, J., Lunder, C. R., Schmidbauer, N., Young, D., Wang, H. J., Huang, J., Rigby, M., Harth, C. M., Salameh, P. K., Spain, T. G., Steele, L. P., Arnold, T., Kim, J., Hermansen, O., Derek, N., Mitrevski, B., and Langenfelds, R.: The ALE/GAGE AGAGE Network, Carbon Dioxide Information Analysis Center (CDIAC), Oak Ridge National Laboratory (ORNL), U.S. Department of Energy (DOE), https://doi.org/10.3334/CDIAC/atg.db1001, 2016.
Ramanathan, V. and Carmichael, G.: Global and regional climate changes due to black carbon, Nat. Geosci., 1, 221–227, https://doi.org/10.1038/ngeo156, 2008.
Real, E., Orlandi, E., Law, K. S., Fierli, F., Josset, D., Cairo, F., Schlager, H., Borrmann, S., Kunkel, D., Volk, C. M., McQuaid, J. B., Stewart, D. J., Lee, J., Lewis, A. C., Hopkins, J. R., Ravegnani, F., Ulanovski, A., and Liousse, C.: Cross-hemispheric transport of central African biomass burning pollutants: implications for downwind ozone production, Atmos. Chem. Phys., 10, 3027–3046, https://doi.org/10.5194/acp-10-3027-2010, 2010.
Russell, P. B., Bergstrom, R. W., Shinozuka, Y., Clarke, A. D., DeCarlo, P. F., Jimenez, J. L., Livingston, J. M., Redemann, J., Dubovik, O., and Strawa, A.: Absorption Angstrom Exponent in AERONET and related data as an indicator of aerosol composition, Atmos. Chem. Phys., 10, 1155–1169, https://doi.org/10.5194/acp-10-1155-2010, 2010.
Saarikoski, S., Carbone, S., Decesari, S., Giulianelli, L., Angelini, F., Canagaratna, M., Ng, N. L., Trimborn, A., Facchini, M. C., Fuzzi, S., Hillamo, R., and Worsnop, D.: Chemical characterization of springtime submicrometer aerosol in Po Valley, Italy, Atmos. Chem. Phys., 12, 8401–8421, https://doi.org/10.5194/acp-12-8401-2012, 2012.
Safari, B. K. and Gasore, J.: Estimation of Global Solar Radiation in Rwanda Using Empirical Models, Asian J. Sci. Res., 2, 68–75, https://doi.org/10.3923/ajsr.2009.68.75, 2009.
Sahu, L. K., Kondo, Y., Moteki, N., Takegawa, N., Zhao, Y., Cubison, M. J., Jimenez, J. L., Vay, S., Diskin, G. S., Wisthaler, A., Mikoviny, T., Huey, L. G., Weinheimer, A. J., and Knapp, D. J.: Emission characteristics of black carbon in anthropogenic and biomass burning plumes over California during ARCTAS-CARB 2008, J. Geophys. Res.-Atmos., 117, 1–20, https://doi.org/10.1029/2011JD017401, 2012.
Saleh, R., Hennigan, C. J., McMeeking, G. R., Chuang, W. K., Robinson, E. S., Coe, H., Donahue, N. M., and Robinson, A. L.: Absorptivity of brown carbon in fresh and photo-chemically aged biomass-burning emissions, Atmos. Chem. Phys., 13, 7683–7693, https://doi.org/10.5194/acp-13-7683-2013, 2013.
Saleh, R., Robinson, E. S., Tkacik, D. S., Ahern, A. T., Liu, S., Aiken, A. C., Sullivan, R. C., Presto, A. A., Dubey, M. K., Yokelson, R. J., Donahue, N. M., and Robinson, A. L.: Brownness of organics in aerosols from biomass burning linked to their black carbon content, Nat. Geosci., 7, 1–4, https://doi.org/10.1038/ngeo2220, 2014.
Sandradewi, J., Prévôt, A. S. H., Szidat, S., Perron, N., Alfarra, M. R., Lanz, V. A., Weingartner, E., and Baltensperger, U.: Using Aerosol Light Absorption Measurements for the Quantitative Determination of Wood Burning and Traffic Emission Contributions to Particulate Matter, Environ. Sci. Technol., 42, 3316–3323, https://doi.org/10.1021/es702253m, 2008.
Sauvage, B., Thouret, V., Cammas, J.-P., Gheusi, F., Athier, G., and Nédélec, P.: Tropospheric ozone over Equatorial Africa: regional aspects from the MOZAIC data, Atmos. Chem. Phys., 5, 311–335, https://doi.org/10.5194/acp-5-311-2005, 2005.
Seibert, P., Kromp-Kolb, H., Baltensperger, U., Jost, D. T., and Schwikowski, M.: Trajectory Analysis of High-Alpine Air Pollution Data, in: Air Pollution Modeling and Its Application: NATO: Challenges of Modern Society, edited by: Gryning, R. N. L. and Millan, M., 595–596, Springer USA, 1994.
Tesfaye, M., Sivakumar, V., Botai, J., and Mengistu Tsidu, G.: Aerosol climatology over South Africa based on 10 years of Multiangle Imaging Spectroradiometer (MISR) data, J. Geophys. Res., 116, D20216, https://doi.org/10.1029/2011JD016023, 2011.
Thompson, A. M., Diab, R. D., Bodeker, G. E., Zunckel, M., Coetzee, G. J. R., Archer, C. B., Mcnamara, D. P., Pickering, K. E., Combrink, J., Fishman, J., and Nganga, D.: Ozone over southern Africa during SAFARI-92/TRACE A, J. Geophys. Res.-Atmos, 1012, 23793–23808, https://doi.org/10.1029/95JD02459, 1996.
van Vliet, E. D. S. and Kinney, P. L.: Impacts of roadway emissions on urban particulate matter concentrations in sub-Saharan Africa: new evidence from Nairobi, Kenya, Environ. Res. Lett., 2, 045028, https://doi.org/10.1088/1748-9326/2/4/045028, 2007.
Welp, L. R., Keeling, R. F., Weiss, R. F., Paplawsky, W., and Heckman, S.: Design and performance of a Nafion dryer for continuous operation at CO2 and CH4 air monitoring sites, Atmos. Meas. Tech., 6, 1217–1226, https://doi.org/10.5194/amt-6-1217-2013, 2013.
WHO: Health Effects of Particulate Matter: Policy implications for countries in eastern Europe, Caucasus and central Asia, World Heal. Organ., 15, available at: http://www.euro.who.int (last access: 30 October 2018), 2013.
World Health Organization: Ambient air pollution: A global assessment of exposure and burden of diseas, World Heal. Organ., ISBN 9789241511353, 2016.
Yuan, J.-F., Huang, X.-F., Cao, L.-M., Cui, J., Zhu, Q., Huang, C.-N., Lan, Z.-J., and He, L.-Y.: Light absorption of brown carbon aerosol in the PRD region of China, Atmos. Chem. Phys., 16, 1433–1443, https://doi.org/10.5194/acp-16-1433-2016, 2016.
Zhang, L., Jin, L., Zhao, T., Yin, Y., Zhu, B., Shan, Y., Guo, X., Tan, C., Gao, J., and Wang, H.: Diurnal variation of surface ozone in mountainous areas: Case study of Mt. Huang, East China, Sci. Total Environ., 538, 583–590, https://doi.org/10.1016/j.scitotenv.2015.08.096, 2015.