the Creative Commons Attribution 4.0 License.
the Creative Commons Attribution 4.0 License.
 | 20 Dec 2019
Sources and formation of carbonaceous aerosols in Xi'an, China: primary emissions and secondary formation constrained by radiocarbon
Haiyan Ni
Ru-Jin Huang
Junji Cao
Jie Guo
Haoyue Deng
Ulrike Dusek
To investigate the sources and formation mechanisms of carbonaceous aerosols, a major contributor to severe particulate air pollution, radiocarbon (14C) measurements were conducted on aerosols sampled from November 2015 to November 2016 in Xi'an, China. Based on the 14C content in elemental carbon (EC), organic carbon (OC) and water-insoluble OC (WIOC), contributions of major sources to carbonaceous aerosols are estimated over a whole seasonal cycle: primary and secondary fossil sources, primary biomass burning, and other non-fossil carbon formed mainly from secondary processes. Primary fossil sources of EC were further sub-divided into coal and liquid fossil fuel combustion by complementing 14C data with stable carbon isotopic signatures.
The dominant EC source was liquid fossil fuel combustion (i.e., vehicle emissions), accounting for 64 % (median; 45 %–74 %, interquartile range) of EC in autumn, 60 % (41 %–72 %) in summer, 53 % (33 %–69 %) in spring and 46 % (29 %–59 %) in winter. An increased contribution from biomass burning to EC was observed in winter (∼28 %) compared to other seasons (warm period; ∼15 %). In winter, coal combustion (∼25 %) and biomass burning equally contributed to EC, whereas in the warm period, coal combustion accounted for a larger fraction of EC than biomass burning. The relative contribution of fossil sources to OC was consistently lower than that to EC, with an annual average of 47±4 %. Non-fossil OC of secondary origin was an important contributor to total OC (35±4 %) and accounted for more than half of non-fossil OC (67±6 %) throughout the year. Secondary fossil OC (SOCfossil) concentrations were higher than primary fossil OC (POCfossil) concentrations in winter but lower than POCfossil in the warm period.
Fossil WIOC and water-soluble OC (WSOC) have been widely used as proxies for POCfossil and SOCfossil, respectively. This assumption was evaluated by (1) comparing their mass concentrations with POCfossil and SOCfossil and (2) comparing ratios of fossil WIOC to fossil EC to typical primary OC-to-EC ratios from fossil sources including both coal combustion and vehicle emissions. The results suggest that fossil WIOC and fossil WSOC are probably a better approximation for primary and secondary fossil OC, respectively, than POCfossil and SOCfossil estimated using the EC tracer method.
- Article
(2837 KB) - Full-text XML
-
Supplement
(690 KB) - BibTeX
- EndNote


Carbonaceous aerosols are an important component of PM2.5 (particles with aerodynamic diameter < 2.5 µm), constituting typically 20 %–50 % of PM2.5 mass in many urban areas in China (Cao et al., 2012; R. J. Huang et al., 2014; Tao et al., 2017). The total carbon content of carbonaceous aerosols (TC) is operationally classified into elemental carbon (EC) and organic carbon (OC; Pöschl, 2005). EC is emitted as primary aerosols from incomplete combustion of biomass (e.g., wood, crop residues and grass) and fossil fuels (e.g., coal, gasoline and diesel). In addition to these combustion sources, OC has other non-combustion sources, for example, biogenic emissions, cooking, etc. Unlike EC that is exclusively emitted as primary aerosols, OC includes both primary and secondary OC (POC and SOC, respectively), where SOC is formed in the atmosphere by chemical reaction and gas-to-particle conversion of volatile organic compounds (VOCs) from non-fossil (e.g., biomass burning, biogenic emissions and cooking) and fossil sources (Jacobson et al., 2000; Kanakidou et al., 2005; Hallquist et al., 2009). Moreover, OC can be separated into water-soluble OC (WSOC) and water-insoluble OC (WIOC), according to water solubility of OC.
High concentrations of carbonaceous aerosols have been observed during severe air pollution events in China (R. J. Huang et al., 2014; Elser et al., 2016; Liu et al., 2016a, b). Knowledge and understanding of the sources and formation processes of carbonaceous aerosols, which remain unclear due to the complicated chemical composition, are highly needed to improve air quality. Clear-cut separation between fossil and non-fossil sources of carbonaceous aerosols can be successfully achieved by radiocarbon measurement (Gustafsson et al., 2009; Szidat et al., 2009; Dusek et al., 2013). Radiocarbon (14C) source apportionment exploits the fact that carbonaceous aerosol emitted from fossil sources (e.g., coal combustion and vehicle emissions) does not contain 14C, whereas carbonaceous aerosol released from non-fossil (or “contemporary”) sources has a typical contemporary 14C signature. Radiocarbon studies show that a sizeable fraction of carbonaceous aerosols are from non-fossil origins, even for aerosols collected in urban areas (Heal, 2014; Cao et al., 2017). For example, Zhang et al. (2015a) found that 48±9 % total carbonaceous aerosols were contributed by non-fossil sources in urban areas of four large Chinese cities in the winter of 2013. 14C measurements conducted in early winter in 10 Chinese cities show that, on average, 65±7 % total carbonaceous aerosols were derived from non-fossil sources (Liu et al., 2017). When 14C analysis is conducted for OC and EC separately, contributions from biomass burning and other non-fossil sources to carbonaceous aerosols can be separated for a more comprehensive source apportionment.
14C measurements on either WIOC or WSOC can help to separate primary from secondary OC from fossil sources. Fossil sources tend to mainly produce WIOC in primary emissions (Weber et al., 2007; Dai et al., 2015; Yan et al., 2017). Therefore, fossil WIOC (WIOCfossil) can be used as a proxy of fossil POC (POCfossil). WSOC can be directly emitted as primary aerosols mainly from biomass burning or produced as SOC. There is evidence that SOC produced through the oxidation of VOCs followed by gas-to-particle conversion contains more polar compounds and thus may be an important source of WSOC (Miyazaki et al., 2006; Sannigrahi et al., 2006; Kondo et al., 2007; Weber et al., 2007). Fossil WSOC (WSOCfossil) therefore is thought to be a good proxy of fossil SOC (SOCfossil). 14C analysis of WIOC and WSOC can thus provide new insights into sources and formation processes of primary and secondary OC, respectively, and has been applied in several source apportionment studies (e.g., Liu et al., 2016a, b; Dusek et al., 2017; Liu et al., 2017). For example, using this approach, Y. L. Zhang et al. (2014) found that secondary fossil OC dominates total fossil OC in a background site in southern China. Measurements in four Chinese megacities highlight the importance of secondary formation to both fossil and non-fossil WSOC in severe winter haze episodes by combining 14C measurements of WSOC with positive matrix factorization of aerosol mass spectrometer data (Zhang et al., 2018).
14C measurements of EC allow direct separation of fossil and biomass-burning source contributions. In addition, analysis of the stable carbon isotopic composition (namely the 13C∕12C ratio, expressed as δ13C in Eq. 1) of EC can be used to separate fossil sources into coal and liquid fossil fuel combustion (i.e., vehicle emissions) because EC from coal combustion is, on average, more enriched in the stable carbon isotope 13C compared to liquid fossil fuel combustion (Andersson et al., 2015; Winiger et al., 2015, 2016; Fang et al., 2018). The interpretation of the stable carbon isotope signature for OC source apportionment is more difficult because OC is chemically reactive and δ13C signatures of OC are not only determined by the source signatures but also influenced by chemical reactions of the organic compounds in the atmosphere (Irei et al., 2011; Pavuluri and Kawamura, 2016).
In this study, PM2.5 samples collected from Xi'an, China, are investigated. Xi'an is the largest city in northwestern China and is also one of the most polluted cities in the world. We present, to our best knowledge, the first 14C measurements covering all four seasons that distinguish fossil and non-fossil contributions to various carbon fractions, including EC, OC, WIOC and WSOC in Xi'an. Fossil sources of EC are further divided into coal and liquid fossil fuel combustion by complementing radiocarbon with the stable carbon isotopic signature. Concentrations of POCfossil and SOCfossil are modeled based on the 14C-apportioned OC and EC and compared with their widely used proxies, i.e., 14C-apportioned WIOCfossil and WSOCfossil, respectively.
2.1 Sampling
Sampling was conducted in Xi'an, China, from 30 November 2015 to 17 November 2016. PM2.5 samples were collected on the rooftop (∼10 m) of a two-floor building located at the Institute of Earth Environment, Chinese Academy of Sciences (34.2∘ N, 108.9∘ E). This site is a typical urban background site surrounded by residential and education areas. The 24 h integrated PM2.5 samples were collected from 10:00 to 10:00 LST (local standard time) the next day. PM2.5 samples were collected on a pre-baked (780 ∘C for 3 h) quartz fiber filter (QM-A, Whatman Inc., Clifton, NJ, USA; 20.3 cm × 25.4 cm) using a high-volume sampler (TE-6070 MFC, Tisch Inc., Cleveland, OH, USA) at a flow rate of 1.0 m3 min−1. Field blank filters were treated exactly like the sample filters except that no air was drawn through the filter. After collection, the filters were immediately removed from the sampler, packed in pre-baked aluminum foils (450 ∘C for 3 h), sealed in polyethylene bags and stored in a freezer at −18 ∘C until analysis.
2.2 Thermal–optical organic carbon (OC) and elemental carbon (EC) analysis
Filter pieces of 1.5 cm2 were taken for OC and EC analysis using a carbon analyzer (Model 5L, Sunset Laboratory, Inc., Portland, OR, USA) following the thermal–optical transmittance protocol EUSAAR_2 (Cavalli et al., 2010). In the EUSAAR_2 protocol the filter sample is heated stepwise in an inert helium (He) atmosphere up to 650 ∘C to thermally desorb organic compounds. After a rapid cooling to 500 ∘C the sample is heated again stepwise up to 850 ∘C in an oxidizing 98 % He to 2 % O2 atmosphere to oxidize EC. All carbon gases are converted to CO2 and detected with a non-dispersive infrared (NDIR) detector. During heating in the inert He atmosphere, a fraction of OC pyrolyzes (chars) to light-absorbing EC, as demonstrated by a decreasing transmission signal. When the charred OC and original EC are released in the He∕O2 atmosphere, the transmission signal increases again. The split between OC and EC is set when the transmission signal reaches their pre-pyrolysis value. The sum of OC and EC is total carbon (TC).
At the beginning of each work day, the instrument is calibrated using a sucrose standard solution. The instrument blank, representing the background contamination of the instrument during the analysis, is measured every day and negligible (TC < 0.2 µg cm−2) compared to the TC loading of the samples (13–246 µg cm−2; range). The reproducibility determined by duplicate analysis of the filter samples was within 6 % for OC and 5 % for EC. The average field blank of OC was 0.9±0.2 µg cm−2 (N=6, equivalent to µg m−3), which was subtracted from the sample OC concentrations. EC on field blanks was in most cases below the detection level. Details of the OC∕EC measurement can also be found in Zenker et al. (2017).
2.3 Stable carbon isotopic composition of EC
The stable carbon isotopic composition of EC was measured at the Stable Isotope Laboratory at the Institute of Earth Environment, Chinese Academy of Sciences. To remove OC, filter pieces were heated at 375 ∘C for 3 h in a vacuum-sealed quartz tube in the presence of CuO catalyst grains. Extraction of EC was done by heating the carbon that remained on the filters at 850 ∘C for 5 h in another vacuum-sealed quartz tube. The resulting CO2 from EC was isolated by a series of cold traps and quantified manometrically. The stable carbon isotopic composition of the purified CO2 was determined as δ13C (δ13CEC for EC) by offline analysis with a Finnigan MAT-251 mass spectrometer (Bremen, Germany). δ13C values are expressed in the delta notation as per mil (‰) deviation from the international standard Vienna Pee Dee Belemnite (V-PDB):
A routine laboratory working standard with a known δ13C value was measured every day. The analytical precision of δ13C was better than ±0.3 ‰ based on duplicate analyses. Details of stable carbon isotope measurements are described in our previous studies (Cao et al., 2011, 2013; Ni et al., 2018).
Pyrolyzed OC can be formed through charring during the OC removal procedure and is released at the high temperature of the EC step. To assess the potential effect of pyrolyzed OC on the measured δ13CEC, we conducted a sensitivity analysis based on isotope mass balance (see details in Supplement S1). This analysis shows that even for high contribution from pyrolyzed OC to the isolated EC of 20 %, the expected difference in δ13C between measured EC and true EC is <1 ‰.
2.4 Radiocarbon (14C) measurements of OC, WIOC and EC
2.4.1 Sample selection for 14C analysis
For 14C analysis of OC, WIOC and EC, three composite samples per season were selected to represent high (H), medium (M) and low (L) concentrations of TC to cover various pollution conditions in each season. Each composite sample consists of two to four 24 h filter pieces with similar TC loadings and air mass backward trajectories (Fig. S1 and Table S1 in the Supplement). In total, 36 radiocarbon data were measured, including 12 OC, 12 WIOC and 12 EC data. 14C values of WSOC are calculated from 14C values of OC and WIOC according to the isotope mass balance (Eq. 4).
2.4.2 Extraction of OC, WIOC and EC
OC, WIOC and EC extractions were conducted on our custom-built aerosol combustion system (ACS). The ACS has been described in detail by Dusek et al. (2014) and evaluated in two intercomparison studies (Szidat et al., 2013; Zenker et al., 2017). In brief, the ACS consists of a reaction tube and a CO2 purification line. In the reaction tube, aerosol filter samples are inserted into a filter holder and heated at different temperatures in pure O2. Combustion products are fully oxidized using a platinum catalyst. The resulting CO2 is separated from other gases (e.g., NOx and water vapor) in the purification line. Here, NOx and liberated halogens are first removed by a heated oven (650 ∘C) filled with copper grains and silver; water is then removed by a U-type tube cooled with a dry ice–ethanol mixture (around −70 ∘C) and a flask containing phosphorus pentoxide (P2O5). The amount of purified CO2 is determined manometrically in a calibrated volume, and CO2 is subsequently stored in flame-sealed glass ampoules.
OC is combusted by heating filter pieces at 375 ∘C for 10 min. WIOC and EC are combusted from water-extracted filter pieces. By water extraction, water-soluble OC (WSOC) is removed from filter pieces (Zhang et al., 2012; Bernardoni et al., 2013; Dusek et al., 2014). For WIOC, a water-extracted filter piece is heated at 375 ∘C for 10 min. Subsequently, the oven temperature is increased to 450 ∘C for 3 min to remove the most refractory OC that is left on the filter. However, during this step some less refractory EC might be lost. After this step, OC has been completely removed from the filter pieces. Finally, the remaining EC is combusted by heating the filter at 650 ∘C in O2 for 5 min (Dusek et al., 2017; Zenker et al., 2017). EC recovery after the intermediate 450 ∘C step was approximately 70 %, estimated by comparing to the EC quantified by the EUSAAR_2 protocol.
Contamination during the extraction procedure is determined by following the same extraction procedures with either empty filter boat or pre-heated filters (at 650 ∘C in O2 for 10 min). The contamination yields, on average, 0.85 µg OC 0.73 µg WIOC and 0.72 µg EC per extraction, respectively. Compared with our sample size of 45–210 µg OC, 45–328 µg WIOC and 15–184 µg EC, the contamination is relatively small (<5 % of the sample amount).
2.4.3 14C measurements by accelerator mass spectrometer (AMS)
14C measurements were conducted using the Mini Carbon Dating System (MICADAS) AMS at the Centre for Isotope Research at the University of Groningen. The extracted CO2 is released from the glass ampules and captured by a zeolite trap within a gas inlet system (Ruff et al., 2007), where the sample is diluted using He to 5 % CO2 (Salazar et al., 2015). The CO2∕He mixture is directly introduced into the Cs sputter ion sources of the MICADAS at a constant rate (Synal et al., 2007).
The 14C∕12C ratio of an aerosol sample is usually normalized to the 14C∕12C ratio of an oxalic acid standard (OXII) and expressed as fraction modern (F14C). Following the definition of fraction modern (Mook and van der Plicht, 1999; Reimer et al., 2004), the 14C∕12C ratio of OXII is related to the unperturbed atmosphere in the reference year of 1950 by multiplying it by a factor of 0.7459:
where the 14C∕12C ratio of the sample and OXII are both corrected for machine background and normalized to ‰ with respect to V-PDB to correct for isotope fractionation. ‰ is the postulated mean value of terrestrial wood (Stuiver and Polach, 1977).
The F14C values are corrected for the memory effect (Wacker et al., 2010) using alternate measurements of OXII and 14C-free material as gaseous standards. Correction for instrument background (Salazar et al., 2015) is done by subtracting the memory-corrected F14C values of the 14C-free standard. Finally, the values are normalized to the average value of the (memory- and background-corrected) OXII standards. A set of secondary standards is used to assess the robustness and reliability of the data. This includes IAEA-C7, with a consensus value of , and sample masses of 76 and 80 µg and IAEA-C8, with a consensus value of and sample masses of 63 and 100 µg. All standards including OXII and 14C-free material used for data correction and IAEA-C7 and IAEA-C8 for quality control of AMS measurements are measured on the same day as the samples. F14C values of secondary standards undergo the same data correction as the samples. Results of IAEA-C7 and C8 agree within uncertainties (Table S2).
F14C of carbon from fossil sources is 0, and carbon from non-fossil sources (or “contemporary” sources) should have a F14C of 1. But the extensive release of 14C from nuclear-bomb tests in the late 1950s and early 1960s and 14C-free CO2 from fossil fuel combustion have perturbed the atmospheric F14C values significantly. The former increased the F14C in the atmosphere by up to a factor of 2 in the northern hemisphere in the 1960s. The nuclear tests have been banned in the atmosphere, outer space and under water since 1963. Since then, the atmospheric F14C has been slowly decreasing, as 14C is mainly taken up by the oceans and terrestrial biosphere and diluted by 14C-free CO2 (Hua and Barbetti, 2004; Levin et al., 2010). In 2010, the F14C of the atmospheric CO2 is approximately 1.04 (Levin et al., 2008, 2010), whereas in 2014 it decreased to 1.02 (Vlachou et al., 2018).
2.5 Estimation of source contributions to different carbon fractions
The F14C of EC, OC and WIOC (i.e., F14C(EC), F14C(OC) and F14C(WIOC), respectively) are directly measured. Mass concentrations (MWSOC) and F14C of WSOC (F14C(WSOC)) can be calculated as
where MOC and MWIOC are mass concentrations of OC and WIOC, respectively. MOC is measured by the thermal–optical method as described in Sect. 2.2.
To estimate MWIOC, we assume two extreme cases following the method of Dusek et al. (2017). (1) WIOC is completely recovered. That is, the recovery of WIOC is 100 %, where the recovery is estimated by dividing the WIOC mass extracted using ACS (MWIOC,e) by the WIOC mass in the aerosol samples. But the WIOC combustion temperature of 375 ∘C in the ACS is highly likely not high enough to recover 100 % of WIOC. Thus, this estimation is an underestimate of MWIOC (M1WIOC). (2) We assume that WIOC has the same recovery as OC. MWIOC can be calculated by dividing MWIOC,e by the OC recovery. Due to the fact that usually less WIOC than OC is lost to charring, this probably is an overestimate of MWIOC (M2WIOC). MWIOC is assumed to vary from M1WIOC to M2WIOC. The most likely value of MWIOC is chosen at because it is more likely that WIOC has a similar recovery as OC rather than 100 % recovery. Once MWIOC is estimated, F14C(WSOC) can be calculated following the Eq. (4). The best estimate and ranges of F14C(WSOC) are presented in Fig. S2 and Table S1. F14C(WSOC) is only slightly sensitive to MWIOC. If we shift the MWIOC from M1WIOC to M2WIOC, the average values of F14C(WSOC) only change by less than 0.03 (absolute differences).
F14C(EC) can be converted to the relative contribution of biomass burning to EC (fbb (EC)) by dividing by the F14C of biomass burning (; Lewis et al., 2004; Mohn et al., 2008; Palstra and Meijer, 2014) to eliminate the effect from nuclear-bomb tests in the 1960s. F14Cbb represents F14C of biomass burning, including wood burning and crop residue burning. This is because biomass burning in Xi'an mainly includes household usage of wood and crop residues as well as open burning of crop residues. F14C for burning of annual crop has a similar value of current atmospheric CO2. F14C of wood burning is higher than that and varies with the age of the tree. Estimates of F14C for wood burning are based on tree-growth models (e.g., Lewis et al., 2004; Mohn et al., 2008) and found to range from 1.08 to 1.30 relative to the wood age and felling date (Heal, 2014, and references therein). The lower limit of F14Cbb corresponds to burning of young wood (tree that is 5–10 years old harvested between 2010 and 2015) and crop residues as main sources of EC, and the upper end of F14Cbb corresponds to older wood (30–60 years old tree) combustion as the main source of EC.
Analogously, the relative contribution of non-fossil sources to OC, WIOC and WSOC (i.e., fnf (OC), fnf (WIOC) and fnf (WSOC), respectively) can be estimated from their corresponding F14C values and F14Cnf. F14Cnf is F14C of non-fossil sources including both biomass burning and biogenic emissions. F14C of biogenic sources can be estimated from long-term 14CO2 measurements at the Schauinsland background station (Levin et al., 2010, 2013). In Xi'an, biogenic OC is probably not very important, as could be expected from high concentrations of carbonaceous aerosols and strong anthropogenic sources. F14Cnf is thus estimated as 1.09±0.05 (Lewis et al., 2004; Levin et al., 2010; Y. L. Zhang et al., 2014). The central value of 1.09 corresponds to a 15 % contribution of biogenic OC to OC.
EC is primarily produced from biomass burning (ECbb) and fossil fuel combustion (ECfossil), and absolute EC concentrations from each source can be estimated as
where ffossil (EC) is the relative contribution of fossil sources to EC, and MEC values are mass concentrations of EC. Analogously, mass concentrations of OC, WIOC and WSOC from non-fossil sources (OCnf, WIOCnf and WSOCnf, respectively) and fossil sources (OCfossil, WIOCfossil and WSOCfossil, respectively) can be determined.
More detailed source apportionment of OC can be achieved by combining 14C-apportioned OC and EC with characteristic primary OC∕EC ratios for each source (i.e., using EC as a tracer of primary emissions; EC tracer method; Turpin and Huntzicker, 1995). Biomass burning usually has higher primary OC∕EC ratios (rbb=3–10) than those for coal combustion (rcoal=1.6–3) and vehicle exhausts (rvehicle=0.5–1.3; Ni et al., 2017, and references therein). The best estimate of rbb (4±1; average ± SD), rcoal (2.38±0.44), and rvehicle (0.85±0.16) is found through a literature search as described in Ni et al. (2018) and comparable to values used in earlier 14C source apportionment in China (Y. L. Zhang et al., 2014, 2015a).
Primary biomass burning OC (POCbb) can be estimated by multiplying ECbb by rbb:
Other non-fossil OC excluding POCbb (OCo,nf) can be estimated as
where OCo,nf includes OC from all non-fossil sources other than primary biomass burning; thus it mainly consists of secondary OC from biomass burning (SOCbb), primary and secondary biogenic OC, and cooking emissions. In most cases, contributions of primary biogenic OC to PM2.5 are likely small (Gelencsér et al., 2007; Guo et al., 2012).
Table 1Relative contributions of non-fossil sources to EC, OC, WIOC and WSOC – fbb (EC), fnf (OC), fnf (WIOC) and fnf (WSOC) – and relative fossil source contribution to EC, OC, WIOC and WSOC – ffossil (EC), ffossil (OC), ffossil (WIOC) and ffossil (WSOC) – for each sample.

OCfossil includes both primary and secondary OC from fossil sources (POCfossil and SOCfossil, respectively):
where POCfossil can be estimated from ECfossil and the primary OC∕EC ratio of fossil fuel combustion (rfossil),
Fossil sources in China are almost exclusively from coal combustion and vehicle emissions; thus rfossil can be estimated as
where p is the relative contribution of coal combustion to fossil EC. That is, p = ECcoal∕ECfossil, where estimation of ECcoal is achieved by combining F14C(EC) and δ13CEC with the Bayesian calculations, as described in detail in Sect. 2.6 and Supplement S2.
To propagate uncertainties, a Monte Carlo simulation with 10 000 individual calculations was conducted. For each individual calculation, F14C(EC), F14C(OC) and F14C(WIOC) and concentrations of EC, OC and WIOC are randomly chosen from a normal distribution symmetric around the measured values with the experimental uncertainties as the standard deviation (SD). For F14Cbb, F14Cnf, rbb, rcoal and rvehicle, random values of each parameter are chosen from a triangular frequency distribution, which has its maximum frequency at the central value and 0 frequency at the lower limit and upper limit of each parameter. For p values, random values from the respective probability density function (PDF) of p were used (Supplement S2). In this way 10 000 random sets of variables can be generated. For fbb (EC), fnf (OC), fnf (WIOC), fnf (WSOC), ECbb, ECfossil, OCnf, OCfossil, WIOCnf, WIOCfossil, WSOCnf, WSOCfossil, POCbb and OCo,nf, the derived average represents the best estimate, and the SD represents the combined uncertainties (Tables 1 and S3). For POCfossil and SOCfossil, the median value is considered to be the best estimate, and the interquartile ranges (25th–75th percentile) are used as uncertainties because the PDFs of POCfossil and SOCfossil are asymmetric (Fig. S3 and Table S4).
2.6 Source apportionment of EC using Bayesian statistics
Using F14C and δ13C signatures of EC (F14C(EC) and δ13CEC) and assuming isotope mass balance in combination with a Bayesian Markov chain Monte Carlo (MCMC) scheme, it is possible to differentiate the three main sources of EC: biomass burning, liquid fossil fuel combustion (i.e., vehicle emissions) and coal combustion (Andersson et al., 2015; Li et al., 2016; Winiger et al., 2016; Fang et al., 2018). EC from fossil sources can be first separated from biomass burning by F14C(EC). Furthermore, δ13CEC allows separation of fossil sources into coal and liquid fossil fuel burning:
where the last row ensures the mass balance; fbb, fliq.fossil and fcoal are the relative contribution from biomass burning, liquid fossil fuel combustion and coal combustion to EC, respectively; and F14Cbb is the F14C of biomass burning (1.10±0.05), as mentioned in Sect. 2.5. F14Cliq.fossil and F14Ccoal are zero due to the long-term decay. δ13Cbb, δ13Cliq.fossil and δ13Ccoal are the δ13C signature of EC emitted from biomass burning, liquid fossil fuel combustion and coal combustion, respectively. The means and the standard deviations for δ13Cbb ( ‰ for C3 plants and ‰ for cornstalk), δ13Cliq.fossil ( ‰), and δ13Ccoal ( ‰) are compiled and established by literature studies in previous publications (Andersson et al., 2015, and references therein; Ni et al., 2018). The source endmembers for δ13C are less well constrained than for F14C, as δ13C varies with fuel types and burning conditions. For example, the range of possible δ13Cliq.fossil overlaps to a small extent with the range of δ13Ccoal, although liquid fossil fuels are usually more depleted than coal. The MCMC technique takes into account the variability in the source signatures of F14C and δ13C (Parnell et al., 2010, 2013), where δ13C introduces a larger uncertainty than F14C. Uncertainties of δ13Cbb, δ13Cliq.fossil, δ13Ccoal and F14Cbb as well as the measured ambient δ13CEC and F14C(EC) are propagated. The results of the MCMC calculations are the posterior PDFs for fbb, fliq.fossil and fcoal. The PDFs of fliq.fossil and fcoal are skewed. By contrast, the PDF of fbb is symmetric, as it is well constrained by F14C (Fig. 6). In this study, the median is used to represent the best estimate of the fbb, fliq.fossil and fcoal. Uncertainties of this best estimate are expressed as an interquartile range (25th–75th percentile) of the corresponding PDFs. The MCMC-derived fbb (calculated by Eq. 12) is very similar to that obtained directly from radiocarbon data (fbb (EC); Eq. 5), as both of them are well constrained by F14C. In this study, fbb and fbb (EC) are therefore used interchangeably. Details on the MCMC-driven Bayesian approach have been described in our earlier study (Ni et al., 2018).
3.1 14C-based source apportionment of EC and OC
EC is derived mainly from fossil sources regardless of differences in EC concentrations and seasonal variations. The relative contribution of fossil fuel combustion to EC (ffossil (EC)) ranges from 69 % to 89 %, with an annual average of 82±6 % (Fig. 1a). The relative contribution of fossil sources to OC (ffossil (OC)) is consistently smaller than ffossil (EC) (Fig. 1b). The values of ffossil (OC) range from 41 % to 51 %, with an annual average of 47±4 %. The absolute difference in the fossil fractions between OC and EC is, on average, 35 % (28 %–42 %; range). The main reason for this difference is that biomass burning emits more OC relative to EC compared to the fossil sources (Streets et al., 2003; Akagi et al., 2011; Zhou et al., 2017). Thus, even if biomass burning contributes a small fraction to EC, it will have a much higher contribution to primary OC. Additionally other non-fossil sources, such as secondary biomass-burning emissions, primary and secondary biogenic emissions, and cooking contribute to OC but not to EC.
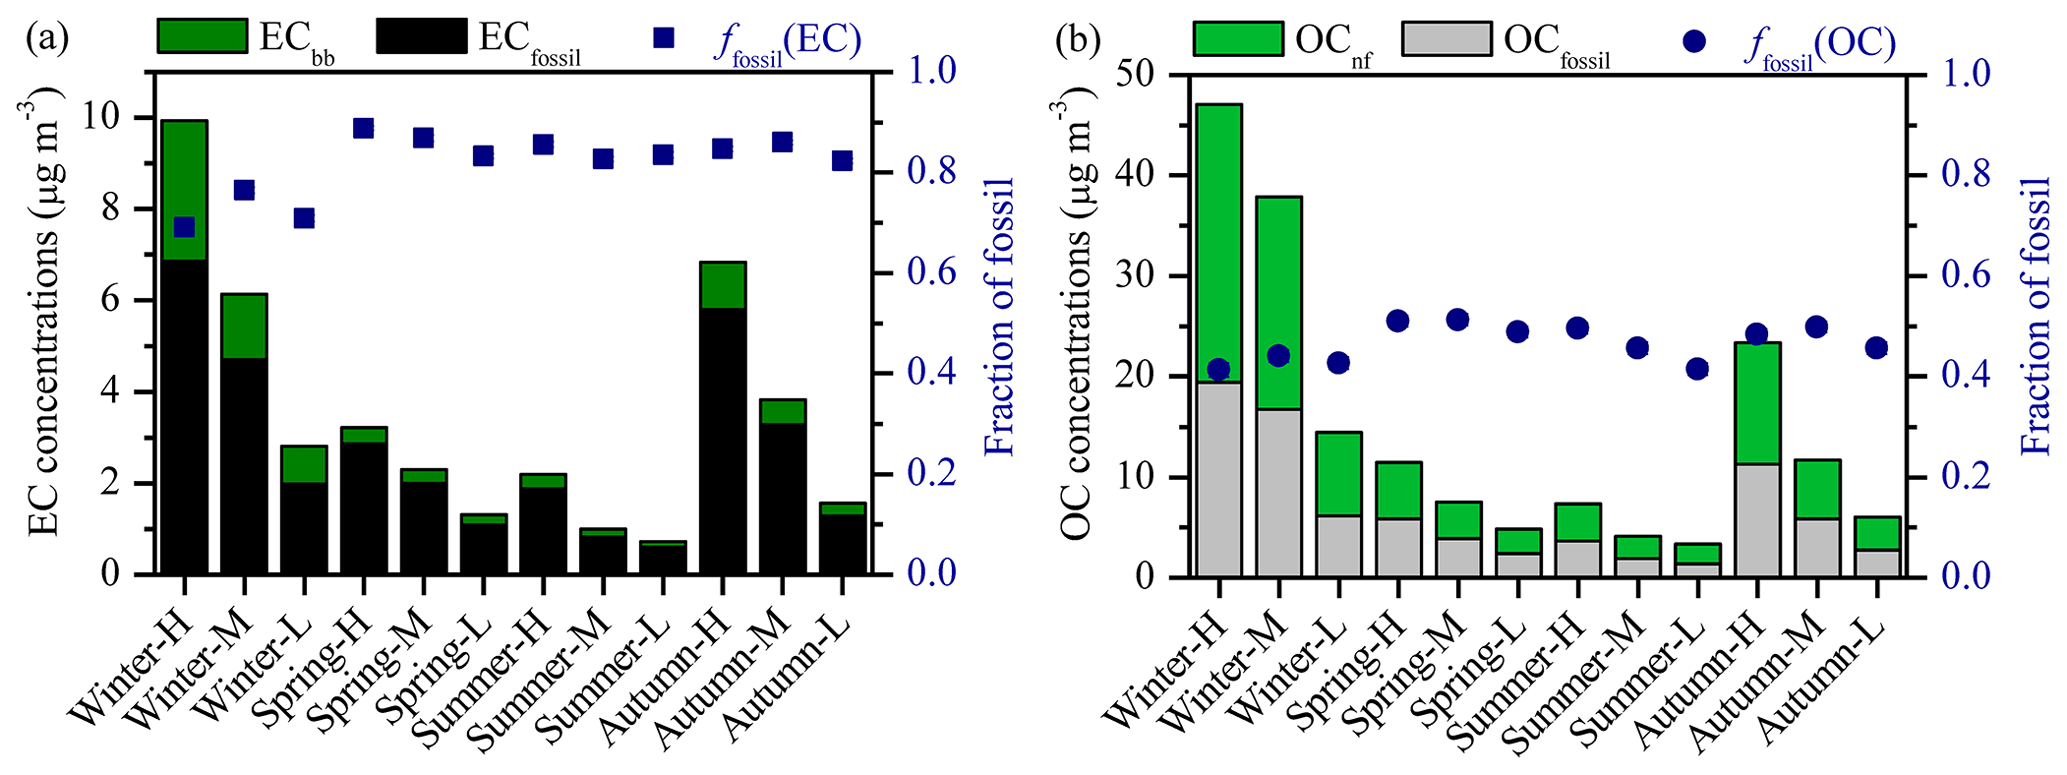
Figure 1(a) Mass concentrations of EC from fossil and non-fossil sources (ECfossil and ECbb, respectively), and fraction of fossil in EC (ffossil (EC)). (b) Mass concentrations of OC from fossil and non-fossil sources (OCfossil and OCnf, respectively), and fraction of fossil in OC (ffossil (OC)).
The annual average ffossil (EC) and ffossil (OC) reported here is consistent with the results reported at an urban site of the same Chinese city in 2008–2009 ( %, %; Ni et al., 2018), an urban site of Beijing, China, in 2013–2014 ( %, %; Zhang et al., 2017) and 2010–2011 ( %; Zhang et al., 2015b), and a background receptor site of Ningbo, China ( %; Liu et al., 2013). Much lower ffossil (EC) and ffossil (OC) were found at a regional background site in southern China in 2005–2006 ( % and % for Hainan; Y. L. Zhang et al., 2014), regional receptor sites in southern Asia in 2008–2009 ( % and % for Hanimaadhoo, Maldives, and % and % for Sinhagad, India; Sheesley et al., 2012), where regional and local biomass burning contributes much more to carbonaceous aerosols than fossil fuel combustion and the 14C levels can change significantly with the origin of air masses.
The ffossil (EC) and ffossil (OC) follow the same seasonal trends: the values are lower in winter and higher in the rest of the seasons (i.e., warm period). Within the warm period, both are slightly higher in spring ( % and %) than in summer and autumn ( % and %) in general and also slightly lower under the cleanest periods (i.e., in spring, summer and autumn, ffossil (EC) and ffossil (OC) on polluted days – “H” and “M” samples – were higher than on clean days – “L” samples; Fig. 1; Tables 1 and S5). The low ffossil (EC) in winter is due to the substantially increased contribution from biomass burning (mainly wood burning) for heating in winter, which gradually stops in spring, but in summer and early autumn, open biomass burning (mainly crop residues) occurs in Xi'an and its surrounding areas. Some biomass burning for cooking is probably present all year-round (Huang et al., 2012; T. Zhang et al., 2014). The seasonality in biomass-burning activity is consistent with the variations in fbb (EC). fbb (EC) is higher in winter (28±4 %) than in other seasons (i.e., warm period, with an average of 15±2 %). This is in line with our previous study in Xi'an, China in 2008–2009 (Ni et al., 2018). By comparison with literature data for Beijing, Beijing shows a very different seasonal trend, where fbb (EC) was lowest in summer (∼7 %) and increased to ∼20 % during the rest of the year (Zhang et al., 2017). The distinct different values and seasonality of fbb (EC) in Xi'an and Beijing indicate that biomass-burning emissions are seasonally dependent, and their influences vary spatially in different Chinese cities. The seasonal trends of ffossil (OC) were different in Beijing as well, with higher ffossil (OC) in winter than in other seasons (Yan et al., 2017; Zhang et al., 2017). This is in line with previous source apportionment results in which, during wintertime, biomass burning is a major source of OC in Xi'an and coal combustion is a dominant source for OC in Beijing (R. J. Huang et al., 2014; Elser et al., 2016).
EC concentrations from fossil fuel combustion (ECfossil) span a range from about 0.6 to 7 µg m−3 and increase by roughly a factor of 3 from summer to winter when separately comparing clean and polluted periods. The remaining EC is contributed by biomass burning (ECbb), which varies in a wider range than ECfossil, from about 0.1 to 3 µg m−3 (Fig. 1a and Table S3). ECfossil values are, on average, 2–3 times higher than ECbb in winter and 5–8 times higher in other seasons. This implies that the winter–summer differences in biomass-burning emissions are larger than fossil fuel combustion emissions regardless of the fact that both biomass burning and coal combustion are expected to increase during wintertime for heating (T. Zhang et al., 2014; Shen et al., 2017; Zhu et al., 2017). OC concentrations from fossil fuel combustion (OCfossil) range from about 1 to 20 µg m−3, with an average of 6.8 µg m−3, which is comparable to non-fossil OC concentrations (range: 2–28 µg m−3; mean: 8.2 µg m−3). Clear seasonal variations were observed in both EC and OC from fossil and non-fossil sources, with maxima in winter and minima in summer (Table S6). This is mainly because of an increase in coal burning and biomass burning for heating as well as unfavorable meteorological conditions in winter.
3.2 14C-based source apportionment of water-soluble and water-insoluble OC
The fossil contribution to total WIOC (ffossil (WIOC)) varied from 49±1 % in winter to 60±5 % in summer, with an annual average of 55±5 %. In winter the enhanced biomass burning is a source of non-fossil WIOC (Dusek et al., 2017). The relative contributions of fossil sources to WSOC ( %) were smaller than those to WIOC for nearly all the samples throughout the year. In winter both primary emission and secondary formation from biomass burning contribute to WSOC, and in the warm period additionally to biogenic SOC, though the latter concentrations are probably relatively low. In addition, primary fossil emissions are expected to contribute very little to WSOC, so the lower fossil fractions in WSOC are in line with expectations. In this study, the largest differences between fossil fractions in WIOC and WSOC were found to be 36 % for sample Summer-L (e.g., low TC concentrations in summer). Summer-L had the lowest ffossil (WSOC) of 28±2 % (Fig. 2a), which was contrary to the stable ffossil (EC) in the warm period (Fig. 1a) and therefore cannot be explained by an increase in primary (or probably secondary) biomass-burning OC. This indicates that the lowest ffossil (WSOC) for Summer-L was probably due to the impact of biogenic OC in the clean period.
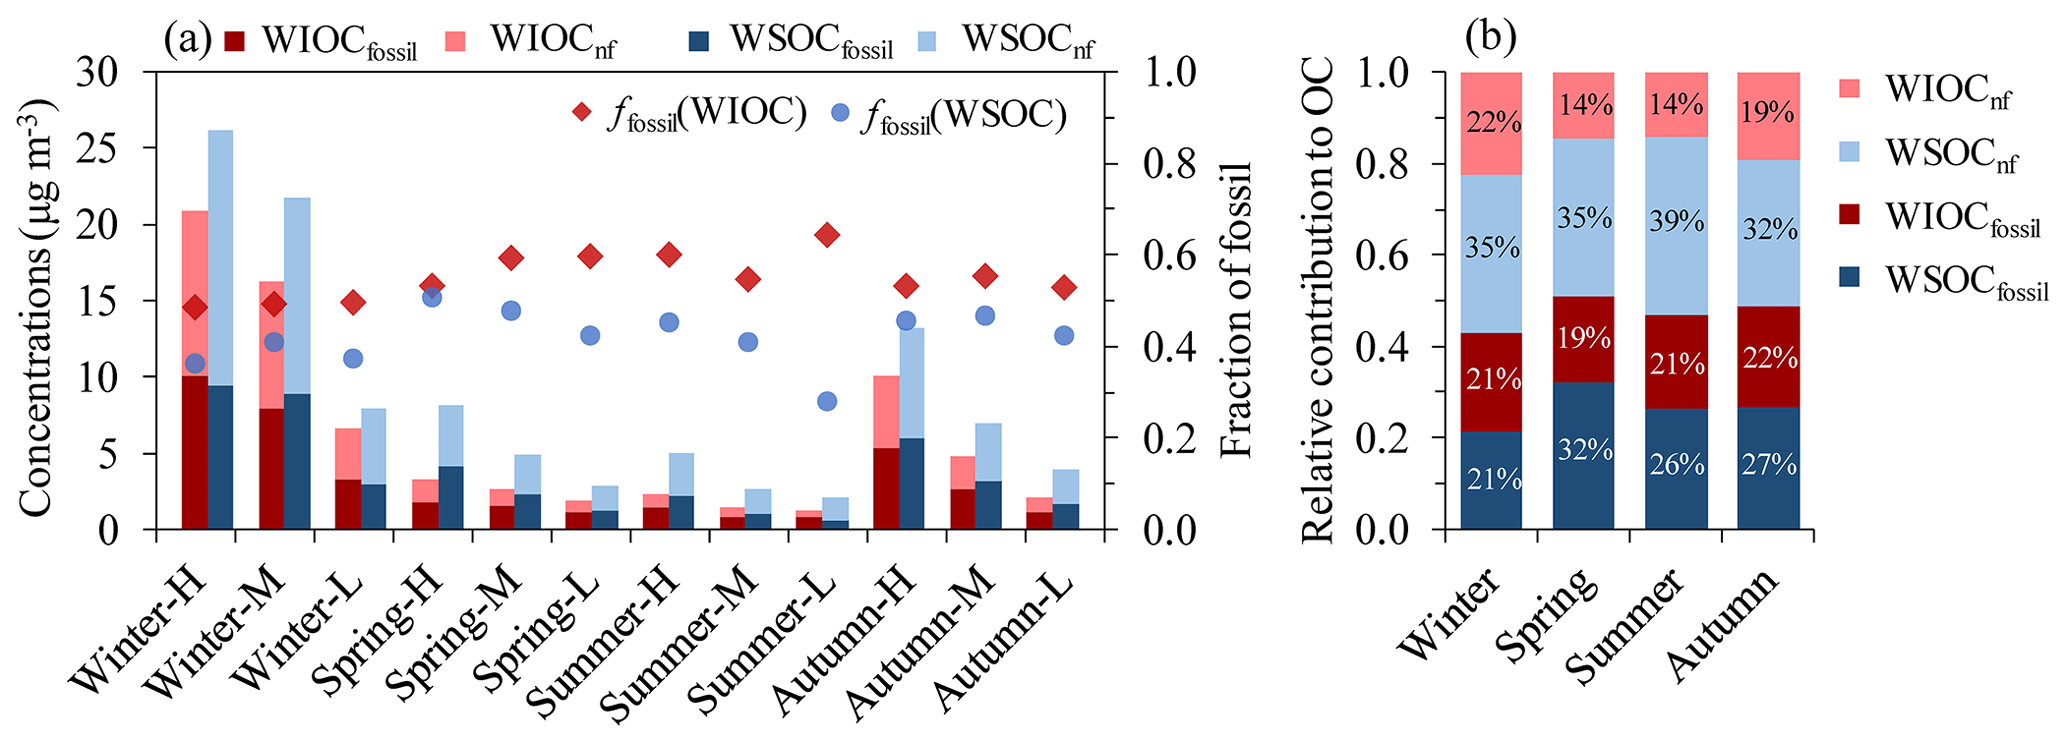
Figure 2(a) Mass concentrations of WIOC and WSOC from fossil and non-fossil sources (WIOCfossil, WIOCnf, WSOCfossil and WSOCnf) as well as fraction of fossil in WIOC and WSOC (ffossil (WIOC) and ffossil (WSOC), respectively). (b) Averaged relative contribution to OC (%) from WIOCnf, WSOCnf, WIOCfossil and WSOCfossil in each season.
WSOC concentrations from non-fossil sources (WSOCnf) are larger than WSOC from fossil sources (WSOCfossil) at the 95 % confidence level (paired t test; P value = 0.016), with an average of 5.1 µg m−3 (range of 1.5–16.7 µg m−3) for WSOCnf versus an average of 3.6 µg m−3 (range of 0.6–9.4 µg m−3) for WSOCfossil (Fig. 2). WIOC concentrations from non-fossil sources (WIOCnf) do not differ significantly from fossil sources (WIOCfossil; paired t test; P value = 0.113). WSOCnf, WSOCfossil, WIOCnf and WIOCfossil show the same seasonal trends, with higher mass concentrations in winter and lower concentrations in the warm period. WSOCnf is responsible for ∼35 % of the increased OC mass in winter, followed by WIOCnf (∼24 %), WIOCfossil (∼22 %) and WSOCff (∼19 %).
Figure 2b shows the fraction of WIOCnf, WSOCnf, WIOCfossil and WSOCfossil in the total OC in different seasons. WSOC (the sum of the blue areas), on a yearly average, accounted for 60±5 % of OC (ranging from 53 % to 70 %), consistent with previous measurements in Xi'an (Cheng et al., 2013; Zhang et al., 2018; Zhao et al., 2018). The remaining 40±5 % of OC is WIOC (the sum of red areas). Throughout the year, WSOCnf was the largest contributor to OC, which accounts for about one-third of the total OC, probably resulting from the mostly water-soluble biomass-burning POC and SOC as well as biogenic SOC (e.g., Mayol-Bracero et al., 2002; Nozière et al., 2015; Dusek et al., 2017). The respective proportions of WSOCfossil, WIOCfossil and WIOCnf in OC were 26 %, 21 % and 17 % on a yearly average in descending order, very likely related to secondary fossil OC, primary fossil OC and primary biomass burning, respectively (Weber et al., 2007; Dai et al., 2015; Dusek et al., 2017; Yan et al., 2017).
The majority (60 %–76 %) of the non-fossil OC was water-soluble. This result is qualitatively consistent with findings reported for an urban site of Xi'an (Zhang et al., 2018) and other places such as an urban site of Beijing, China (Zhang et al., 2018), an urban or rural site in Switzerland (Zhang et al., 2013), a remote site on the island of Hainan, southern China (Y. L. Zhang et al., 2014), and two rural sites in the eastern US (Wozniak et al., 2012) and a regional background site in the Netherlands (Dusek et al., 2017). Seasonal variations in (WSOC∕OC)nf ratios were also observed, with lower ratios in winter (around 0.6) and higher ratios in summer and spring (around 0.7). This reflects the higher fraction of WIOCnf in OCnf during wintertime, resulting from primary biomass-burning emissions (Dusek et al., 2017). In summer and spring, concentrations of WSOCnf and OCnf are both small, and the contribution of biogenic SOC to WSOCnf can be noticeable (Dusek et al., 2017).
The fossil OC is less water-soluble in winter, with somewhat lower (WSOC∕OC)fossil ratios than in the rest of seasons (i.e., warm period). (WSOC∕OC)fossil ratios in winter (0.50±0.03, with a range of 0.48–0.53) fall into the lower end of the range of (WSOC∕OC)fossil ratios in warm period (0.57±0.08, with a range of 0.42–0.70; Fig. 3). WSOCfossil can come mainly from secondary formation and/or photochemical aging of primary organic aerosols; thus the higher (WSOC∕OC)fossil ratios in the warm period suggest an enhanced SOC formation from fossil VOCs from vehicle emissions and/or coal burning. In spring and summer there is a clear increasing tend of (WSOC∕OC)fossil in more polluted periods. Elevated (WSOC∕OC)fossil ratios in polluted periods are very likely related to the formation of high pollutant concentrations in spring and summer. More stagnant conditions in the polluted periods (indicated by lower wind speed; see Fig. 3) that allow for accumulation of pollutants also provide more time for photochemical processes and SOC formation. As a consequence, formation of fossil WSOC will increase in stagnant conditions. At the same time, (WIOC∕EC)fossil ratios decline when pollution gets worse, suggesting removal of WIOC, likely through photochemical reactions. This can shift the water-soluble versus water-insoluble distribution for fossil OC to WSOC (Szidat et al., 2009). As a consequence, the (WSOC∕OC)fossil ratio is higher for Summer-H (0.62) than for Summer-L (0.42).
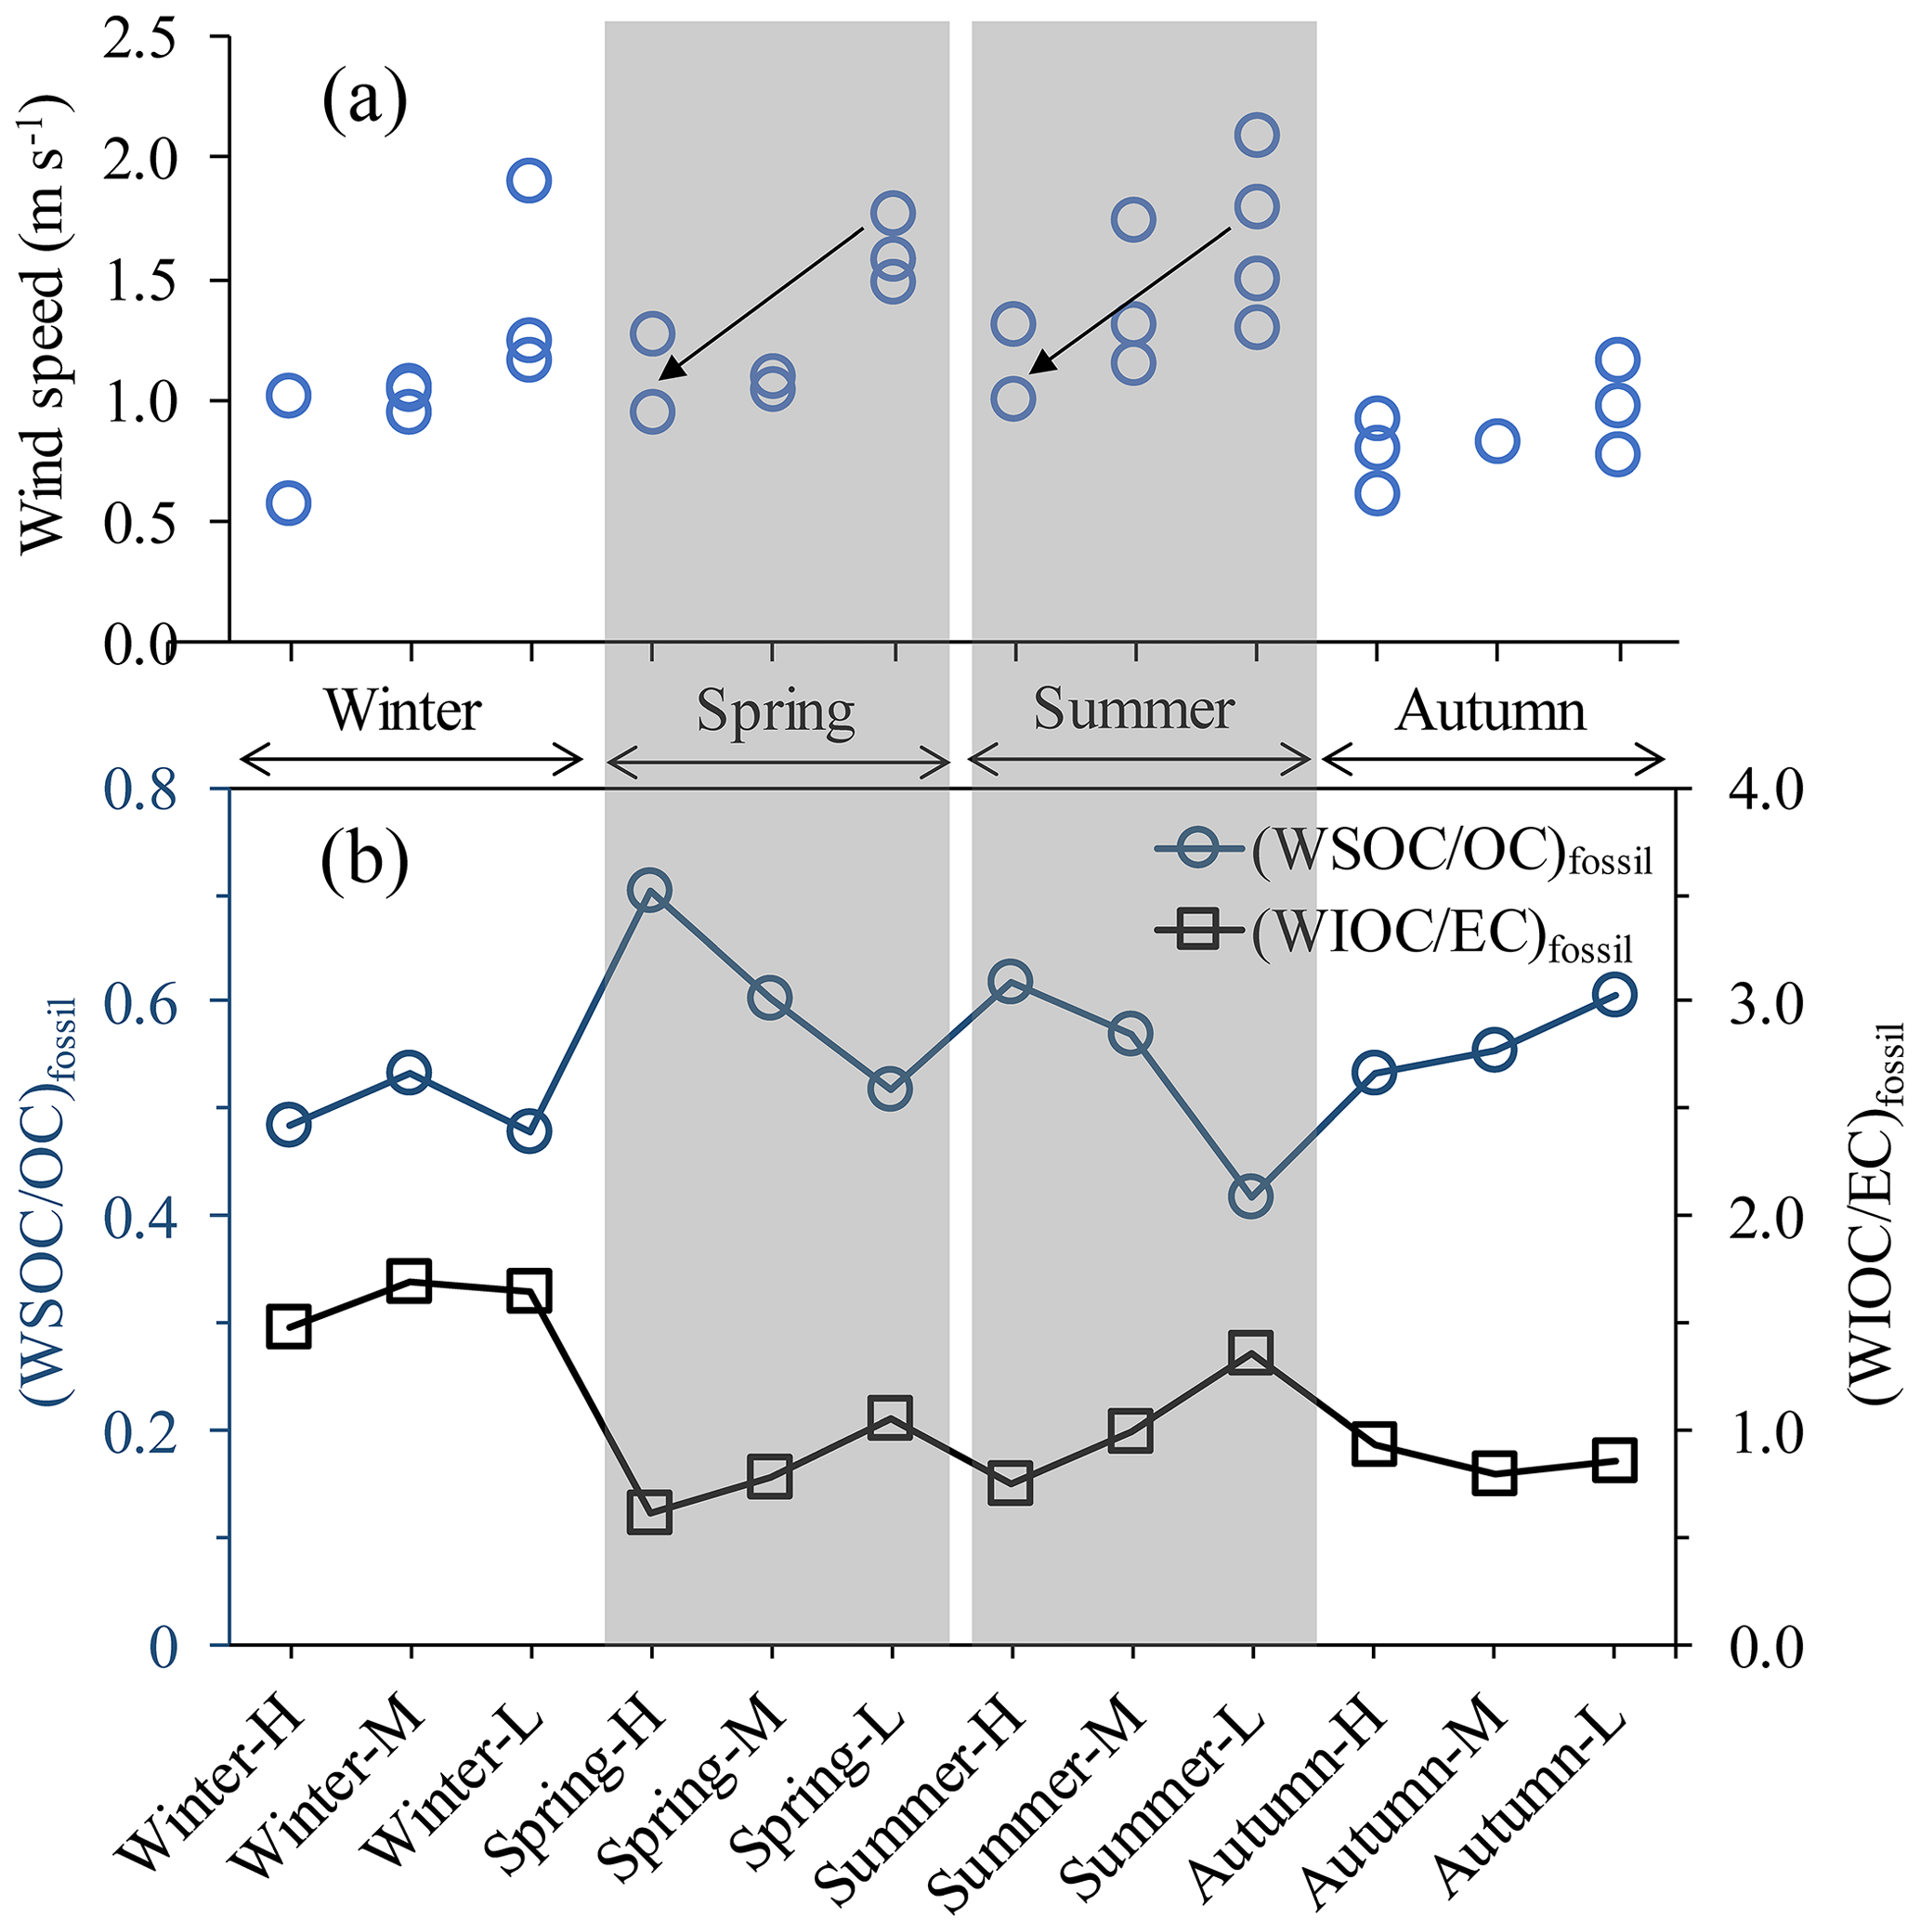
Figure 3(a) Wind speed for each composite sample. Each composite sample consists of two to four 24 h filter samples, and each filter sample is shown as individual data point. The wind speed is recorded by the Meteorological Institute of Shaanxi Province, Xi'an, China. (b) The fraction of fossil WSOC in fossil OC ((WSOC/OC)fossil; dark blue circles); the ratio of fossil WIOC to fossil EC ((WIOC/EC)fossil; black squares) over all the selected samples throughout the year.
3.3 Combustion sources apportioned by stable carbon isotopes
Along with radiocarbon data, the stable carbon isotopic ratio of EC (denoted by δ13CEC) provides additional insight into source apportionment of EC, especially between different types of fossil sources (i.e., coal versus liquid fossil fuel combustion). Figure 4 shows 14C-based ffossil (EC) against δ13CEC in Xi'an in different seasons for 2015–2016 from this study and in winter for 2008–2009 from Ni et al. (2018), together with the ranges of endmembers (i.e., isotopic signature) for the different EC sources of coal combustion, liquid fossil fuel combustion and biomass burning (C3 and C4 plants). ffossil (EC) is well constrained by F14C(EC), clearly separating fossil sources from biomass burning. In contrast to 14C, the source endmembers (i.e., isotopic signature) for δ13C are less well constrained, and δ13C values for liquid fossil fuel combustion overlap with δ13C values for both coal and C3 plant combustion. Regardless of the changes of δ13CEC in different seasons, all the δ13CEC data points fall within the range of C3 plant burning, coal and liquid fossil fuel, indicating that the C3 plant is the dominating biomass type in Xi'an, with little influence from C4 plant burning. In Xi'an, the dominant C4 plant is the cornstalk, which is burned for cooking and heating in the areas surrounding Xi'an (Sun et al., 2017; Zhu et al., 2017).
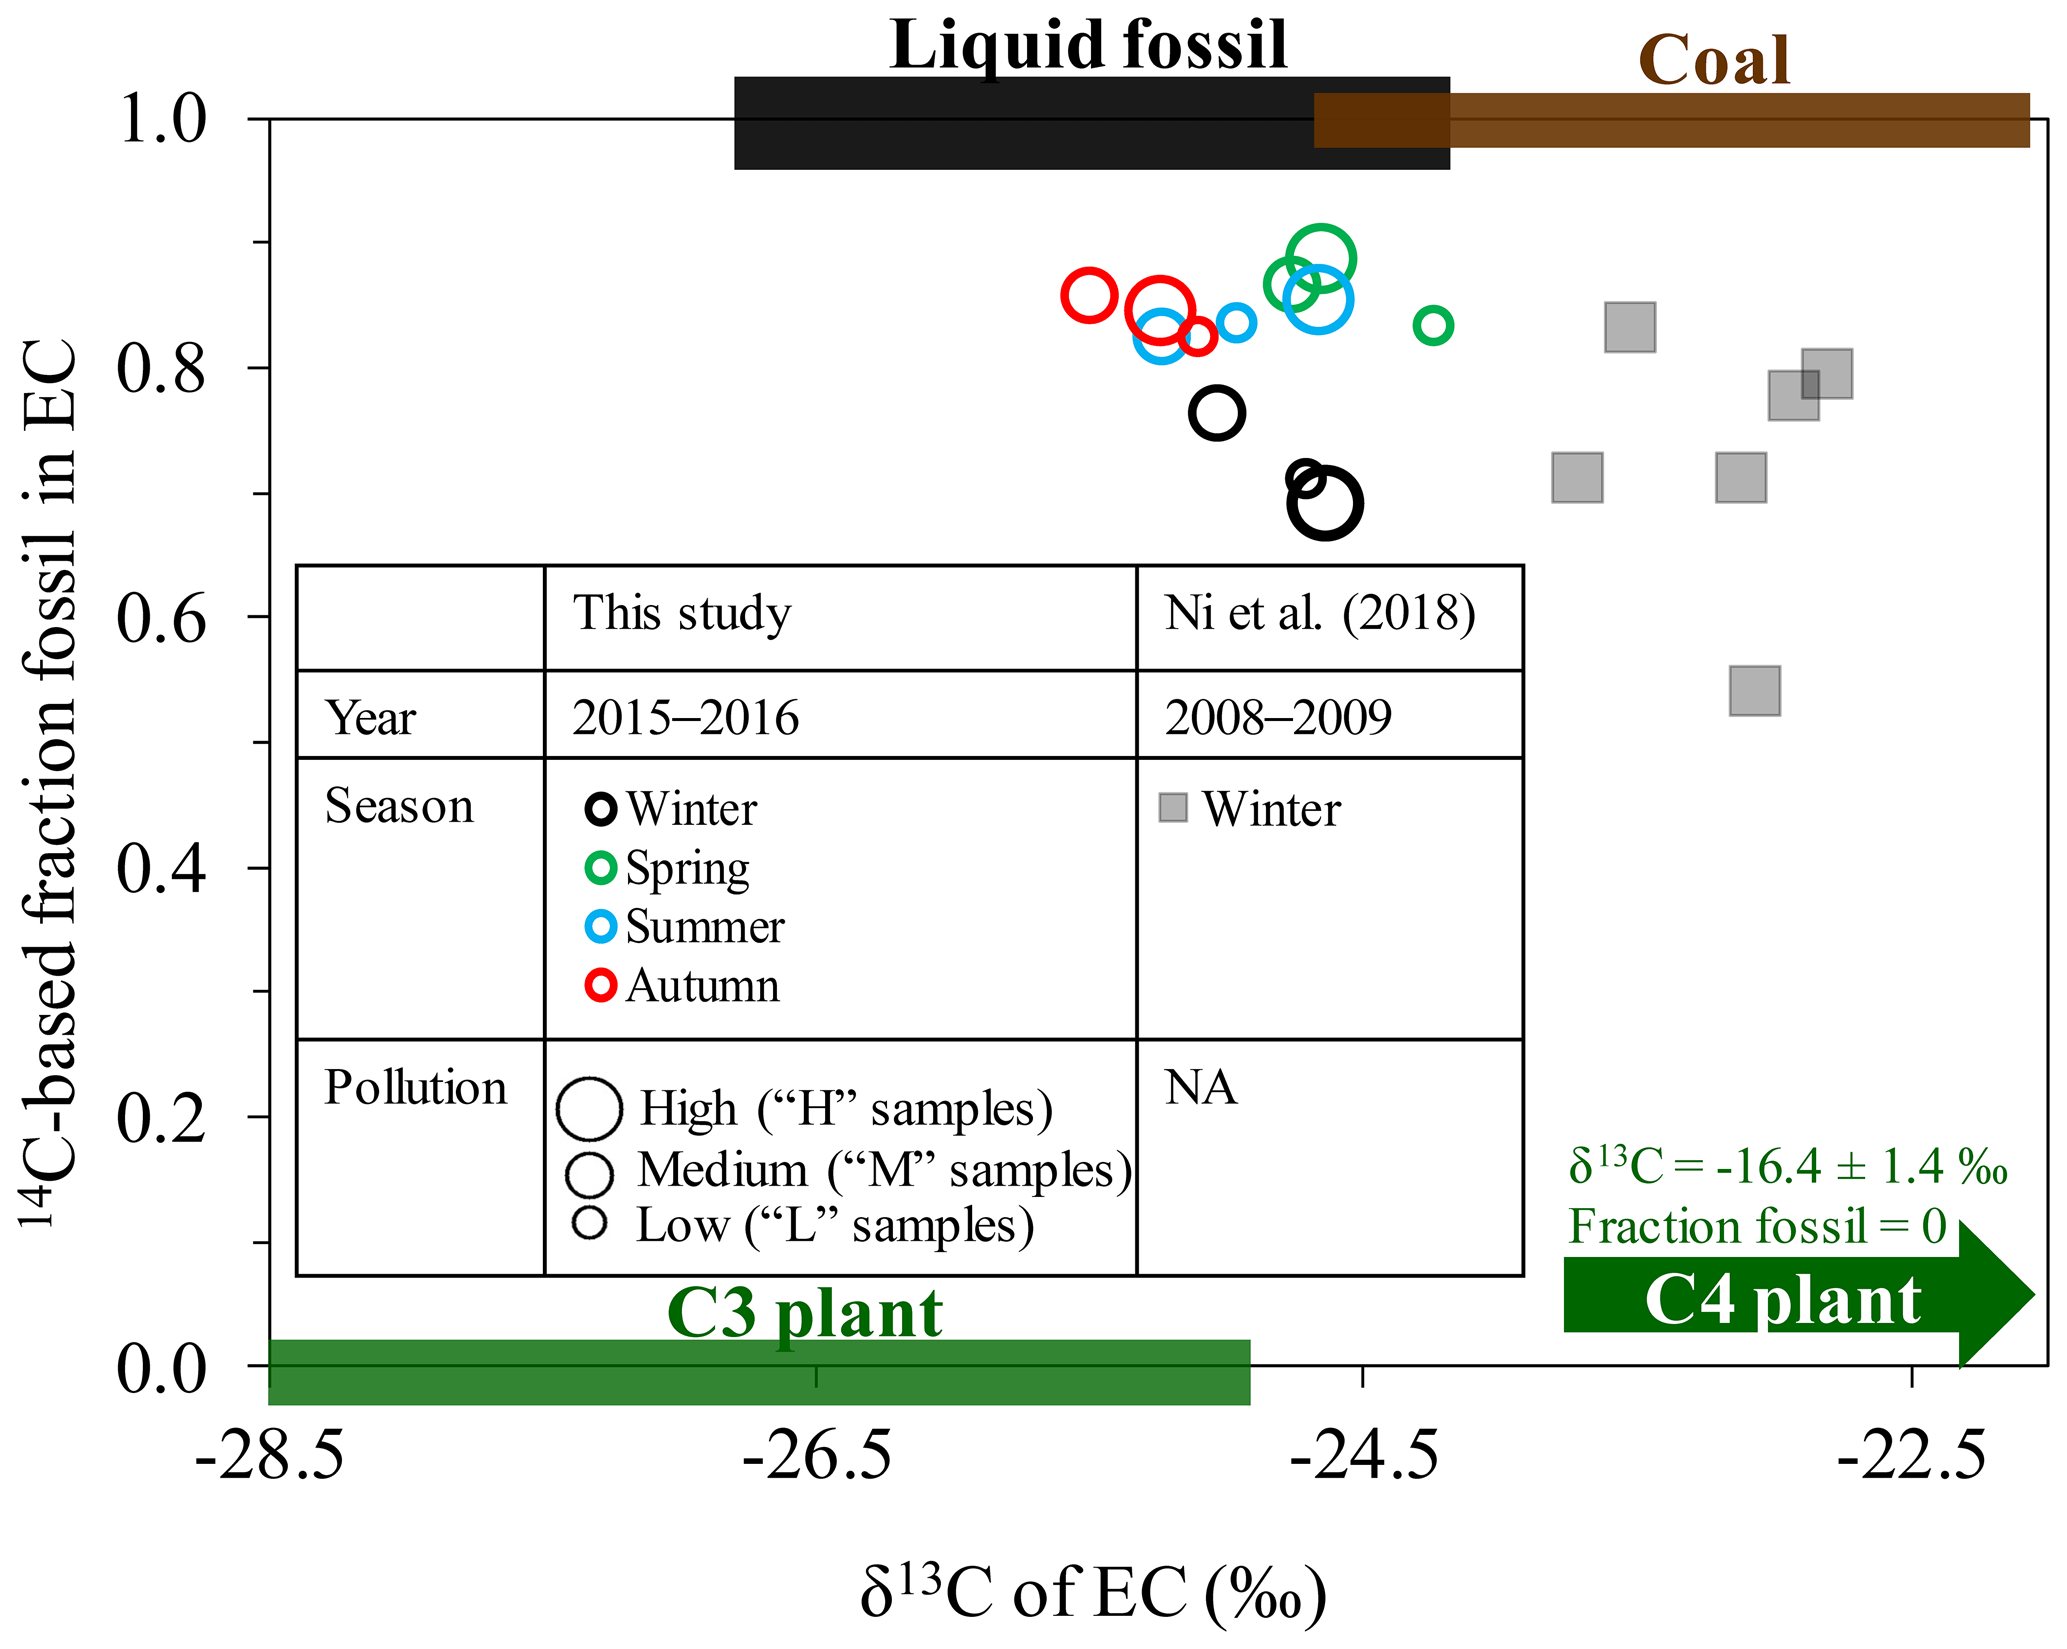
Figure 414C-based fraction fossil versus δ13C for EC in Xi'an, China, in different seasons in 2015–2016 (this study; circle symbols) compared with those in winter 2008–2009 from Ni et al. (2018; square symbols). The size of the symbols for the year 2015–2016 (this study) represents the pollution conditions (high, medium and low) for each sample. The symbol size for the years 2008–2009 does not correspond to pollution conditions and is indicated by “NA”. The expected 14C and δ13C endmember ranges for emissions from C3 plant burning, liquid fossil fuel burning and coal burning are shown as green, black and brown bars, respectively. The δ13C signatures are indicated as mean ± SD (Sect. 2.6). The δ13C signatures of cornstalk (i.e., C4 plant) burning ( ‰) are also indicated.
The annually averaged δ13CEC is ‰ (± SD). Moderate seasonal variation in δ13CEC was observed, reflecting a moderate shift in the relative contributions from combustion sources throughout the year. The δ13CEC values in autumn ( ‰) and summer ( ‰) are most depleted and fall into the overlapped δ13C range for liquid fossil fuel combustion and C3 plant burning. Because the 14C values in autumn and summer indicate that biomass-burning contribution to EC is relatively low (∼16 %), we can expect that liquid fossil fuel combustion dominates EC in autumn and summer. δ13CEC signatures in winter ( ‰) scatter into the range for C3 plant, liquid fossil fuel and coal combustion, implying that EC is influenced by mixed sources. The δ13CEC signatures in spring ( ‰) overlap with both liquid fossil fuel combustion and coal combustion. Only the sample Spring-L is characterized by the most enriched δ13CEC value among all the samples, even more enriched than wintertime δ13CEC, when coal combustion for heating is expected to influence EC strongly. At the same time, higher contributions from biomass burning (i.e., lower ffossil (EC)) were observed for Spring-L. This suggests contributions from a 13C-enriched biomass burning, that is, cornstalk burning (C4 plant). The contribution of this regional source can become noticeable in the relatively clean air that characterizes Spring-L.
To estimate seasonal source contributions to EC, we combined all the data points from each season for the Bayesian MCMC calculations. The MCMC results (Figs. 5 and 6) show that the dominant EC source is liquid fossil fuel combustion (i.e., vehicle emissions). Liquid fossil fuel combustion accounts for 64 % (median; 45 %–74 %, interquartile range) of EC in autumn, 60 % (41 %–72 %) in summer, 53 % (33 %–69 %) in spring, and 46 % (29 %–59 %) in winter, respectively, in descending order. Biomass-burning EC is a small fraction of total EC throughout the year. However, the relative contribution of biomass burning to EC increased in winter (28 %; 26 %–31 %) and is comparable to the relative contribution of coal combustion (25 %; 13 %–41 %). In the warm period, coal combustion for cooking accounts for a larger fraction of EC than biomass burning. The interquartile ranges for fliq.fossil overlap with those for fcoal in winter and spring (Table S7). However, comparing the PDFs distribution for both cases gives a more complete picture. As shown in Fig. 6, there is fair amount of overlap between the PDF distributions of fliq.fossil and focal. Though with some overlaps, in all seasons, the distribution of fliq.fossil variables are skewed to the left, while fcoal is skewed to the right, with considerably higher median fliq.fossil than median fcoal.
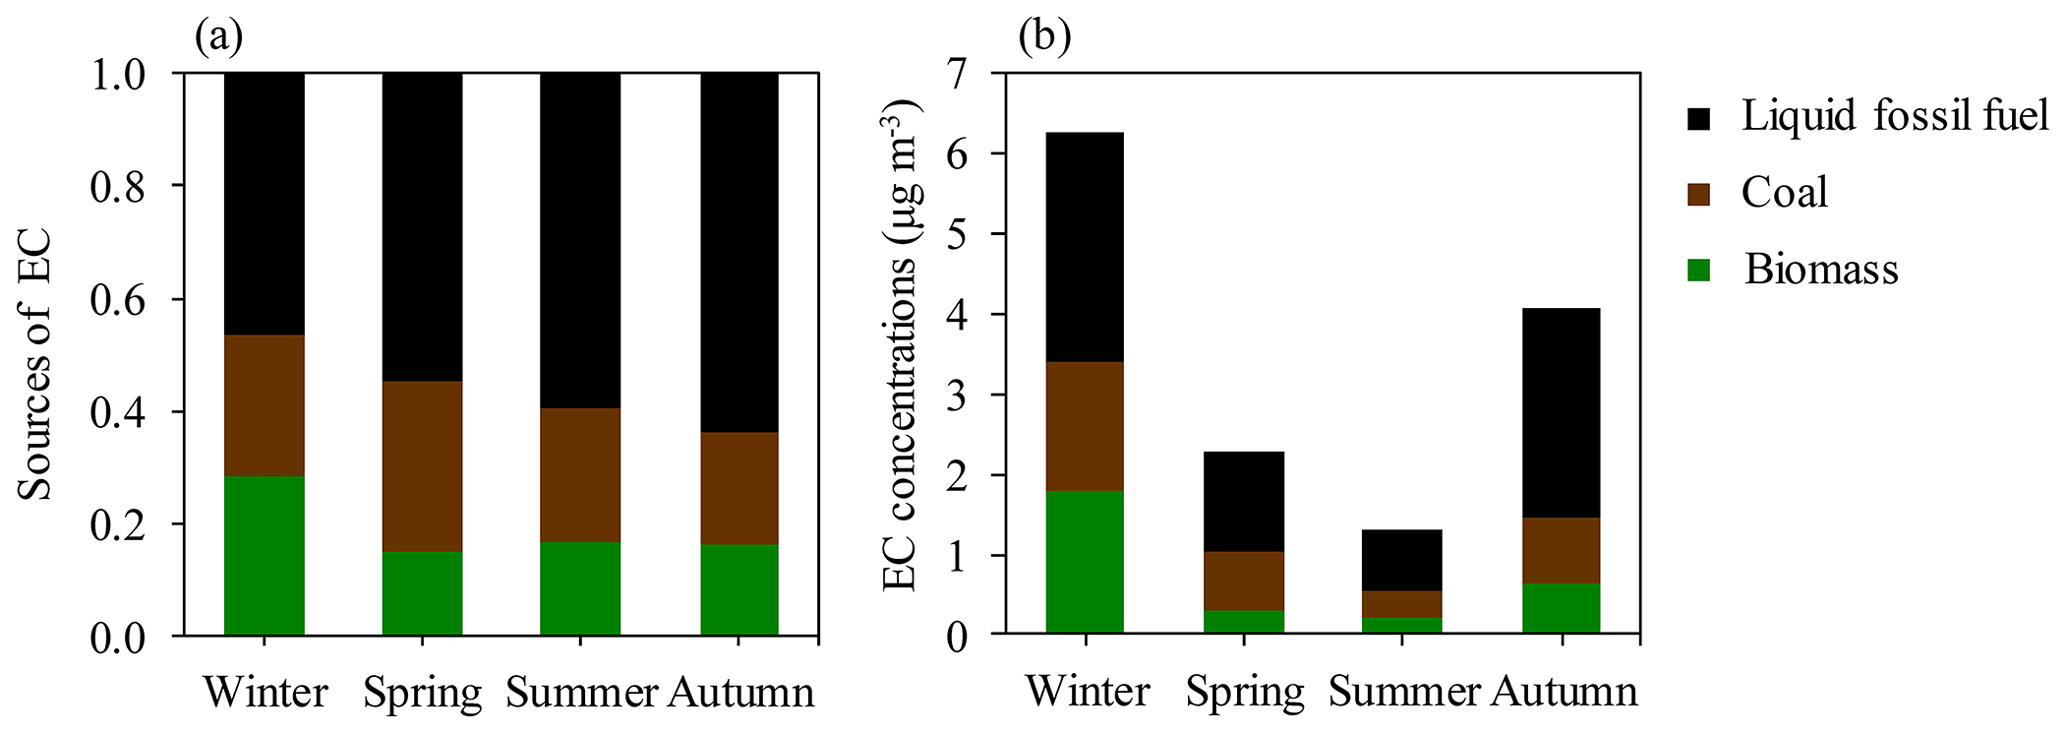
Figure 5(a) Fractional contributions of three incomplete combustion sources to EC in different seasons. (b) Mass concentration of EC (µg m−3) from each combustion source. The data are presented in Tables S7 and S8.
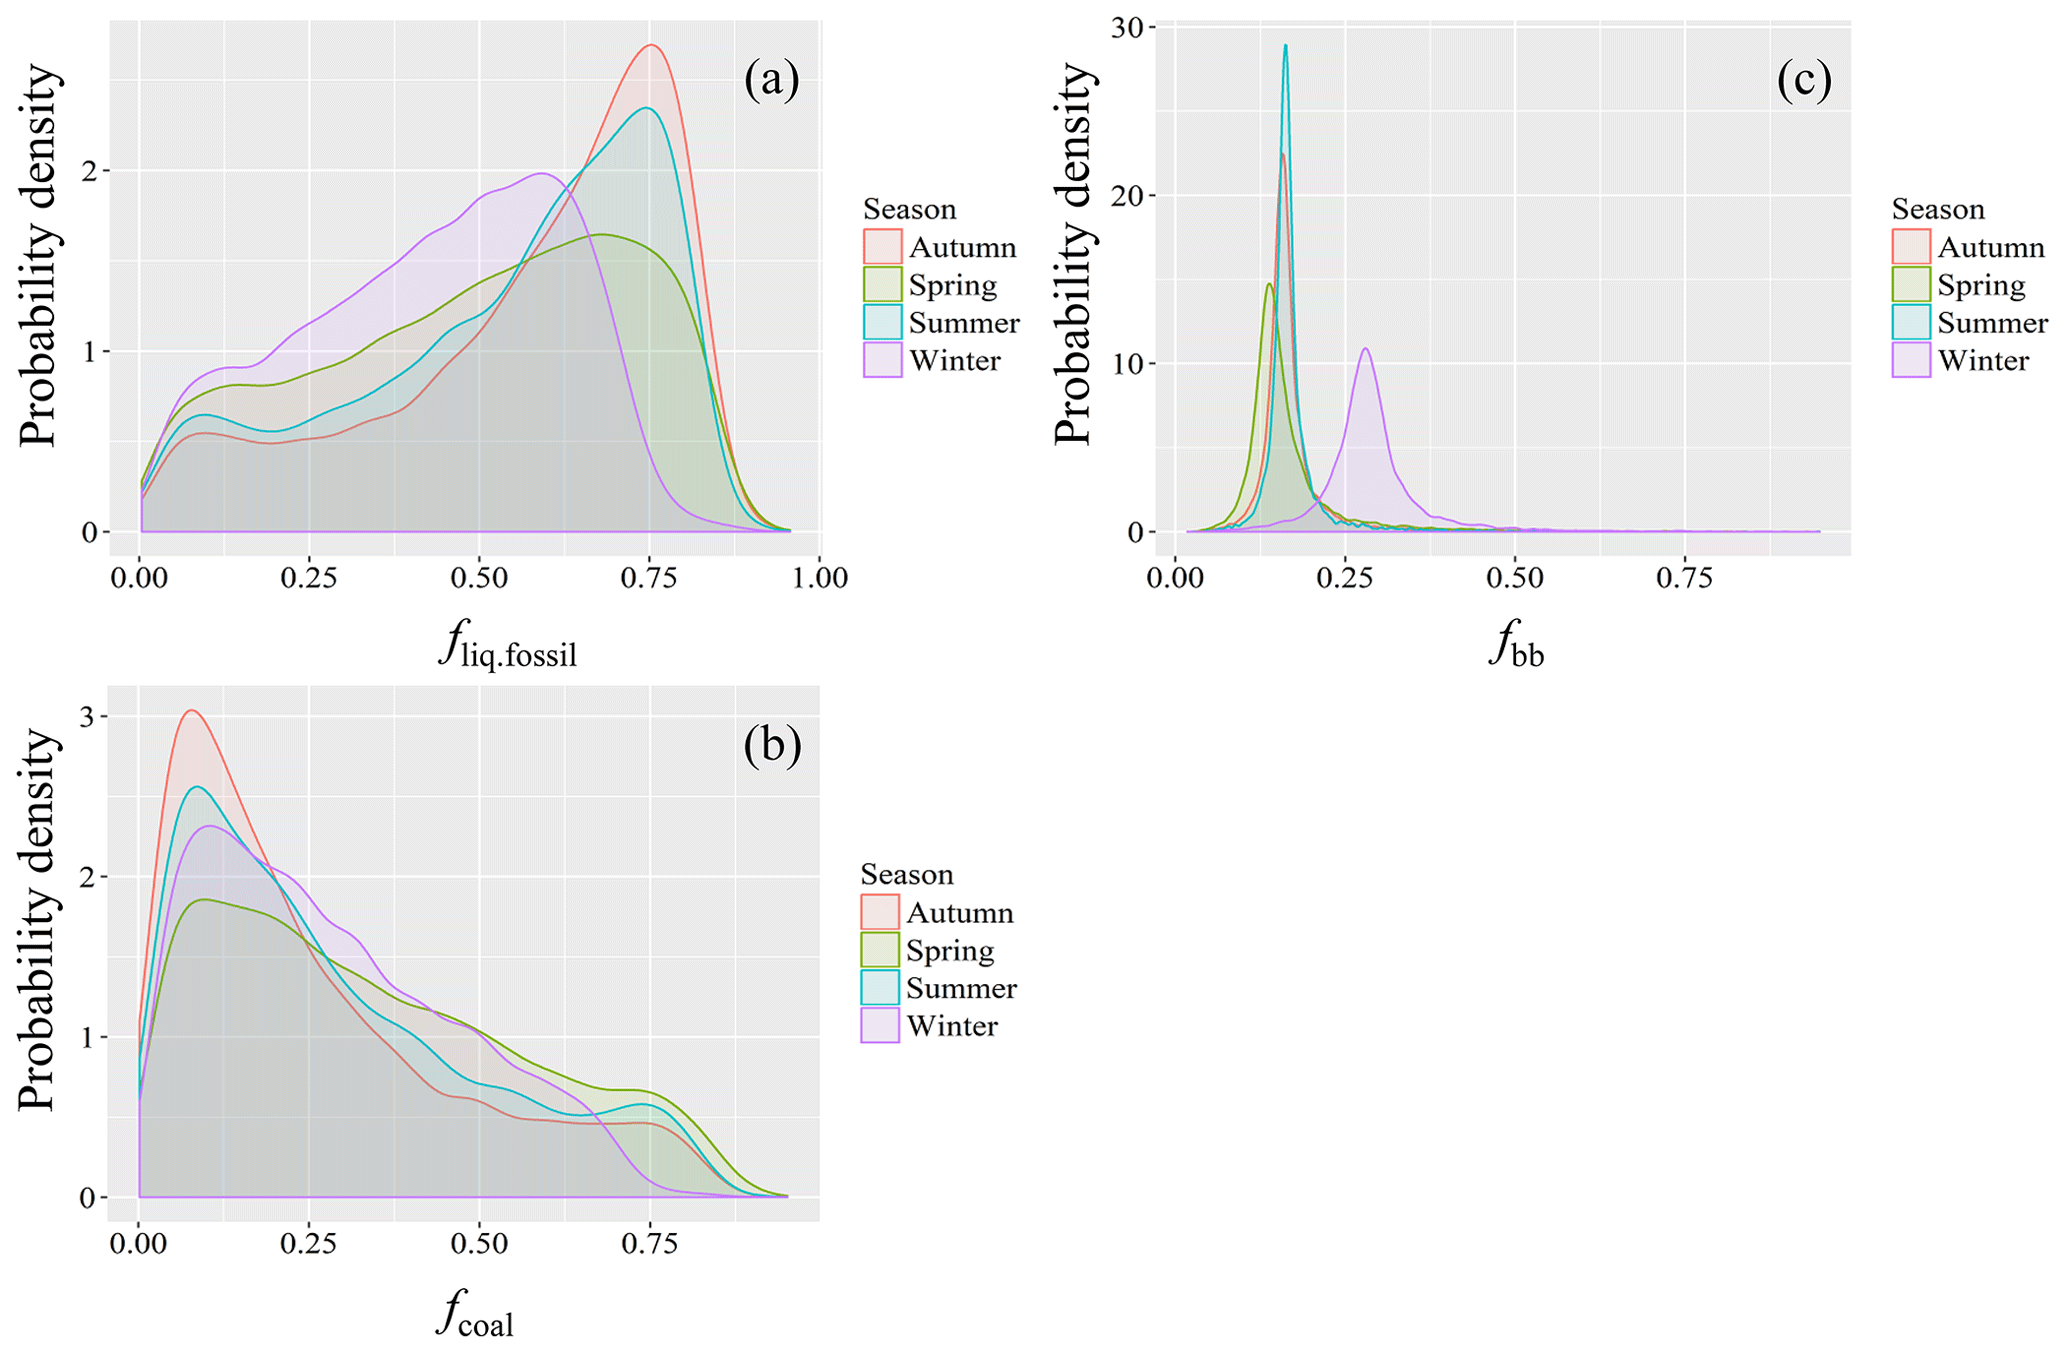
Figure 6Probability density functions (PDFs) of the relative source contributions of (a) liquid fossil fuel combustion (fliq.fossil), (b) coal combustion (fcoal) and (c) biomass burning (fbb) to EC constrained by combining radiocarbon and δ13C measurements, calculated using the Bayesian Markov chain Monte Carlo approach. For details, see Sect. 2.6.
EC concentrations from biomass burning (ECbb) increased by 9 times from summer (seasonal average of 0.2 µg m−3) to winter (1.8 µg m−3; Fig. 5b and Table S8). EC from coal combustion (ECcoal) has a 5-fold increase, from about 0.3 µg m−3 in summer and autumn to 1.6 µg m−3 in winter. EC from liquid fossil fuel (ECliq.fossil) varies less strongly than ECbb and ECcoal, by 4 times, from 0.7 µg m−3 in summer to 2.9 µg m−3 in winter. Liquid fossil fuel combustion (i.e., vehicle emissions) should be roughly constant throughout the year. The increased concentrations of ECliq.fossil in winter are most likely due to unfavorable meteorological conditions. An increase larger than a factor of 4 therefore suggests increasing emissions in winter. Compared to the 4-fold increase in ECliq.fossil from summer to winter, ECcoal only increases by 5 times in winter, reflecting the moderate seasonal variation in δ13CEC (Fig. 4). Coal use for heating during wintertime has been decreasing since the year 2008–2009 (Ni et al., 2018), suggested by the more depleted wintertime δ13CEC in 2015–2016 than in 2008–2009 (Fig. 4). The decreasing contribution from coal combustion to EC is consistent with the changes in energy consumption and the decreasing concentrations of coal combustion indicators (e.g., As and Pb) in Xi'an, as found in previous studies (Xu et al., 2016; Ni et al., 2018). The poor separation of fossil sources of EC into coal combustion and liquid fossil fuel combustion could be another reason, but it is difficult to quantify this effect due to our poor knowledge of δ13C source endmembers.
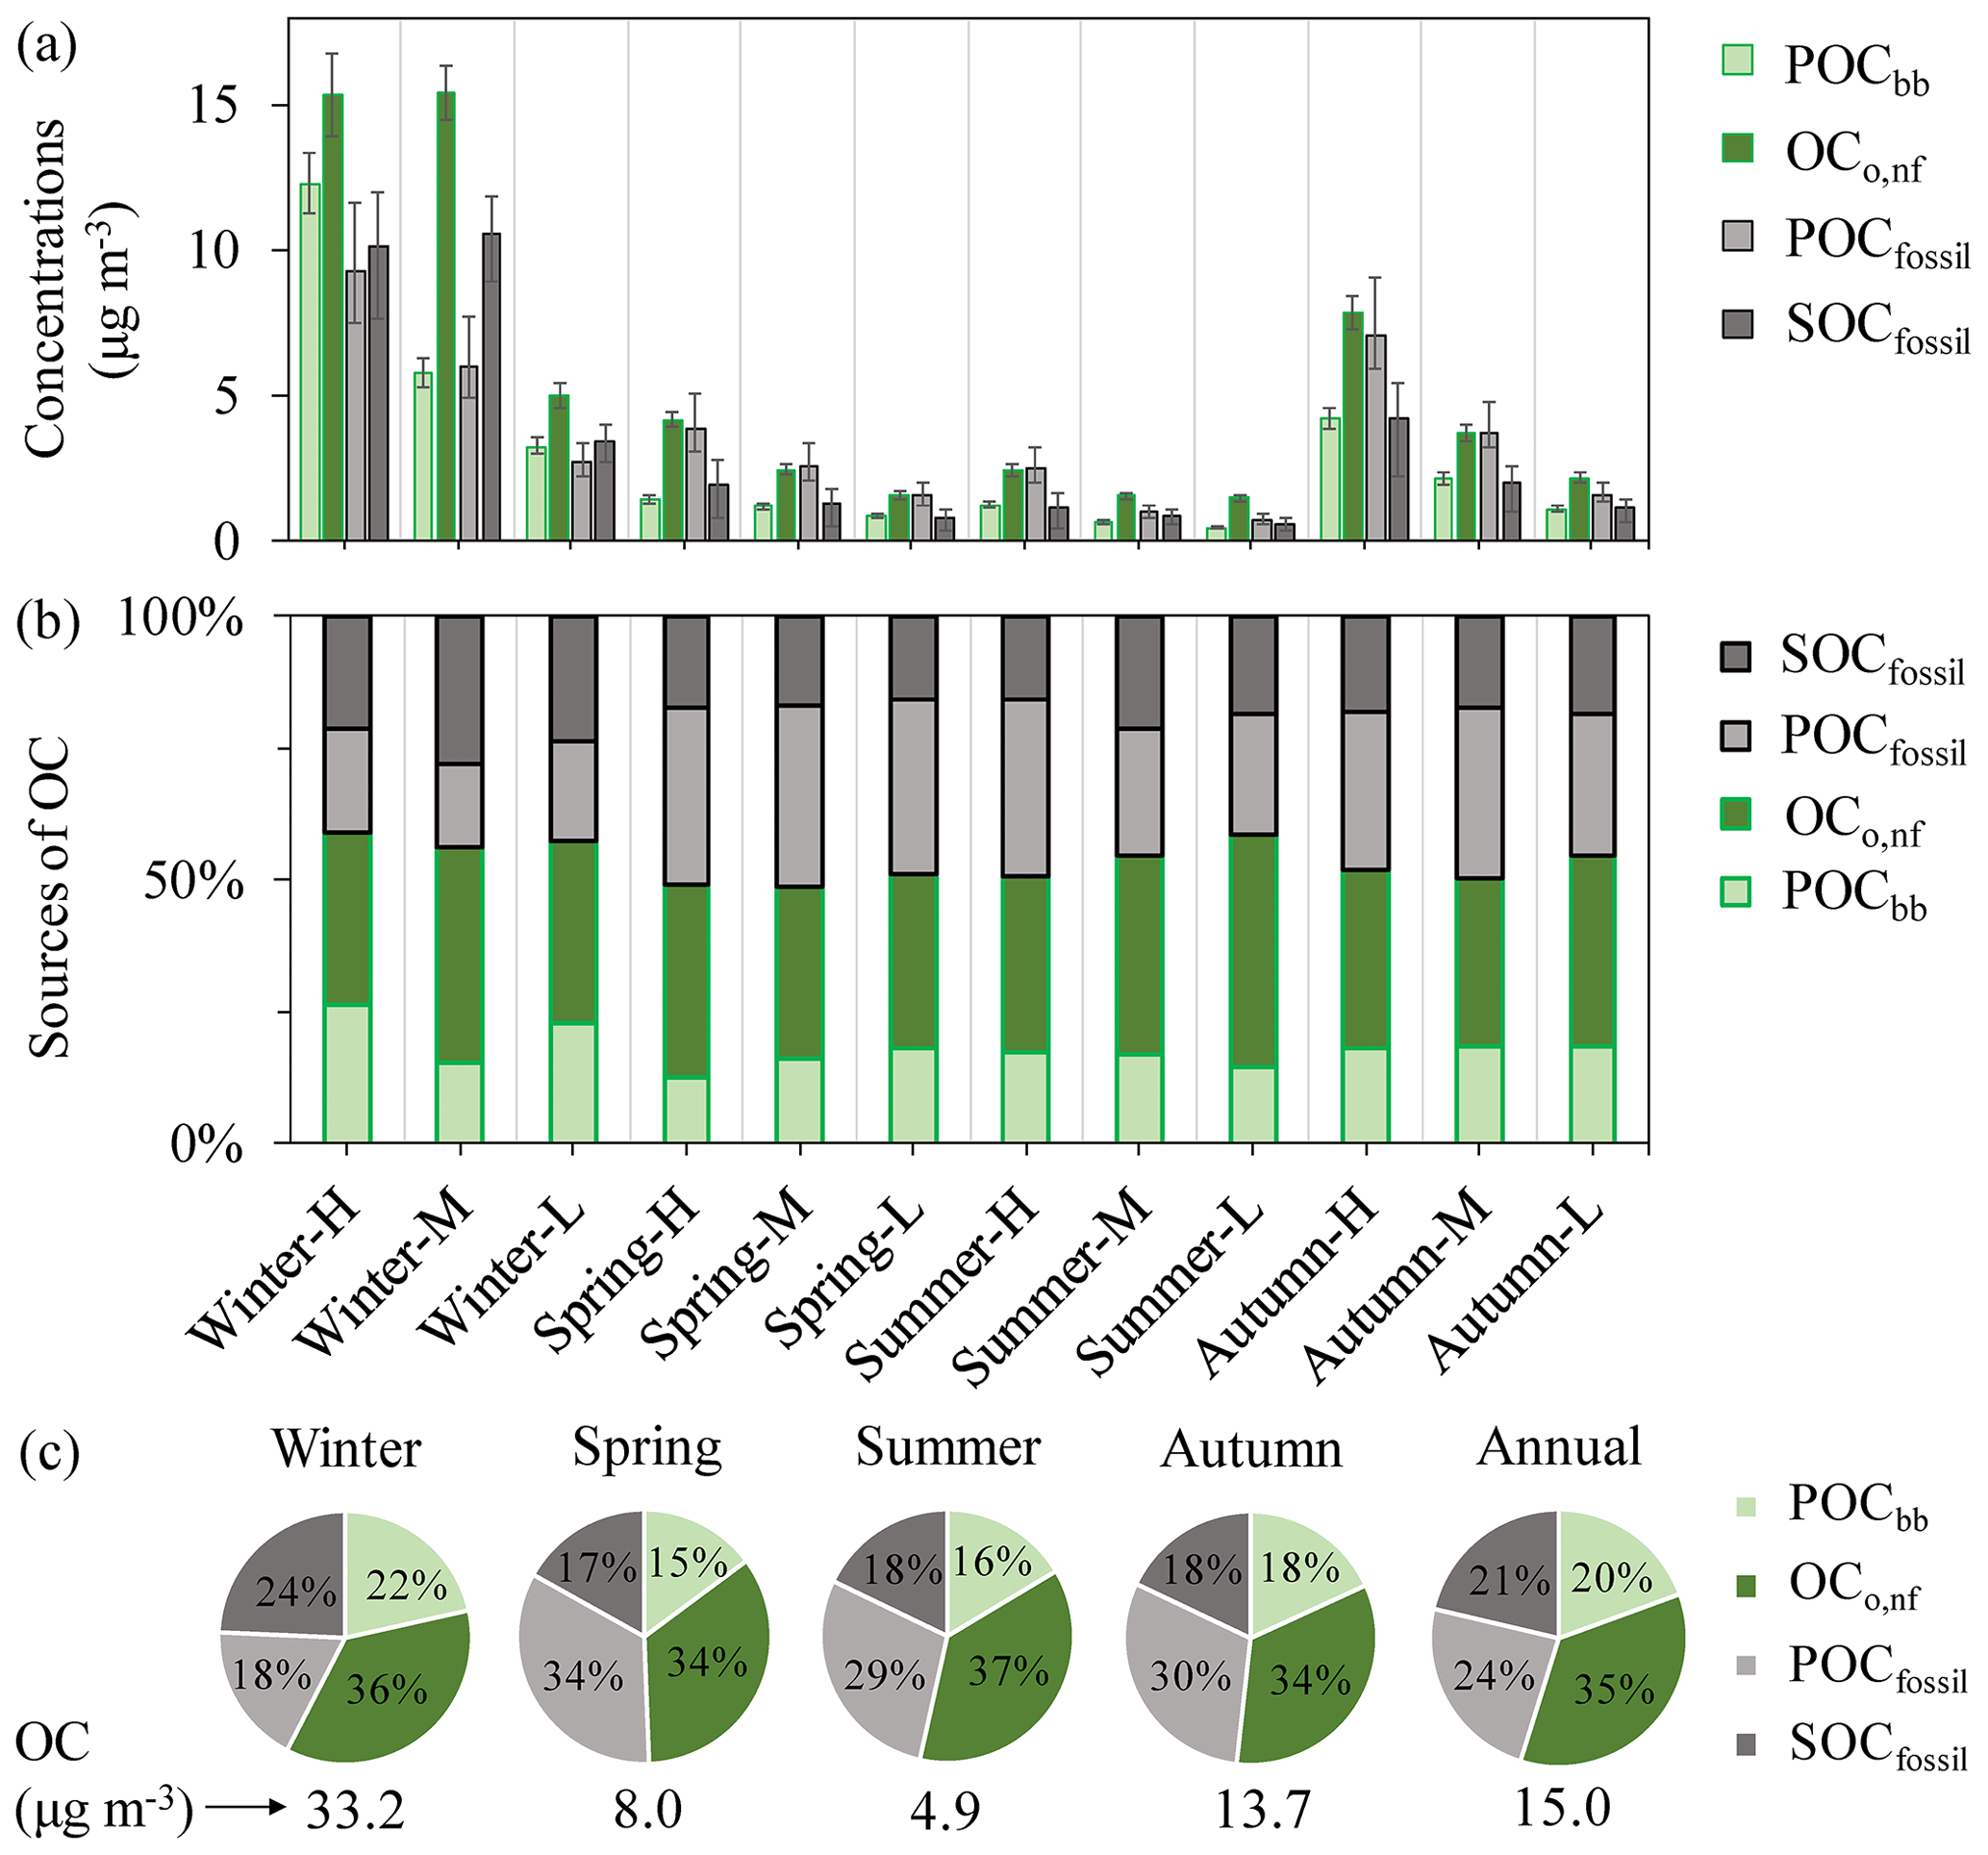
Figure 7(a) Estimated mass concentrations of POCbb, OCo,nf, POCfossil and SOCfossil (µg m−3) in total OC of PM2.5 samples. The error bars indicate the interquartile range (25th–75th percentile) of the median values. (b) The percentage of POCbb, OCo,nf, POCfossil and SOCfossil in total OC. (c) Average source apportionment results of OC in each season and over the year. The numbers below the pie charts represent the seasonally and annually averaged OC concentrations.
3.4 Primary and secondary OC
Based on the EC tracer method, OCo,nf is representative of SOCnf or can be considered an upper limit of SOCnf if cooking sources are significant. The fractions of primary OC (POCbb and POCfossil) and secondary OC (OCo,nf and SOCfossil) in total OC are shown in Fig. 7 and Table S4. On a yearly basis, the most important contributor to OC was OCo,nf (around 35 %). For all samples, OCo,nf concentrations were higher than POCbb despite the wide range of total OC concentrations in different seasons. POCbb contributed a relatively small fraction of OC (15 %–18 %) in the warm period, which increased to 22% during winter, when Xi'an was impacted significantly by biomass burning for heating and cooking. Enhanced biomass-burning activities during wintertime in Xi'an have also been reported by measurements of markers for biomass burning such as levoglucosan and K+ (T. Zhang et al., 2014; Shen et al., 2017). In winter, SOCfossil was generally more abundant than POCfossil, suggesting that secondary formation rather than primary emissions was a more important contributor to total OCfossil. However, in the warm period, for OC derived from fossil fuel (POCfossil and SOCfossil), primary emissions dominated over secondary formation (Fig. 7b and c). The SOCfossil∕OCfossil ratios indicate that SOCfossil contributes roughly 57 % to OCfossil in winter versus 37 % in the warm period. However, the lower SOCfossil∕OCfossil ratios in the warm period (especially in summer) than in winter in this study are unexpected due to the favorable atmospheric conditions (e.g., higher temperature and stronger solar radiation). A much higher contribution of SOCfossil to OCfossil (an annual average of around 70 %) was found in southern China (Y. L. Zhang et al., 2014). The importance of fossil-derived SOC formation to fossil OC during wintertime was also found in other Chinese cities, including Beijing, Shanghai and Guangzhou (Zhang et al., 2015a).
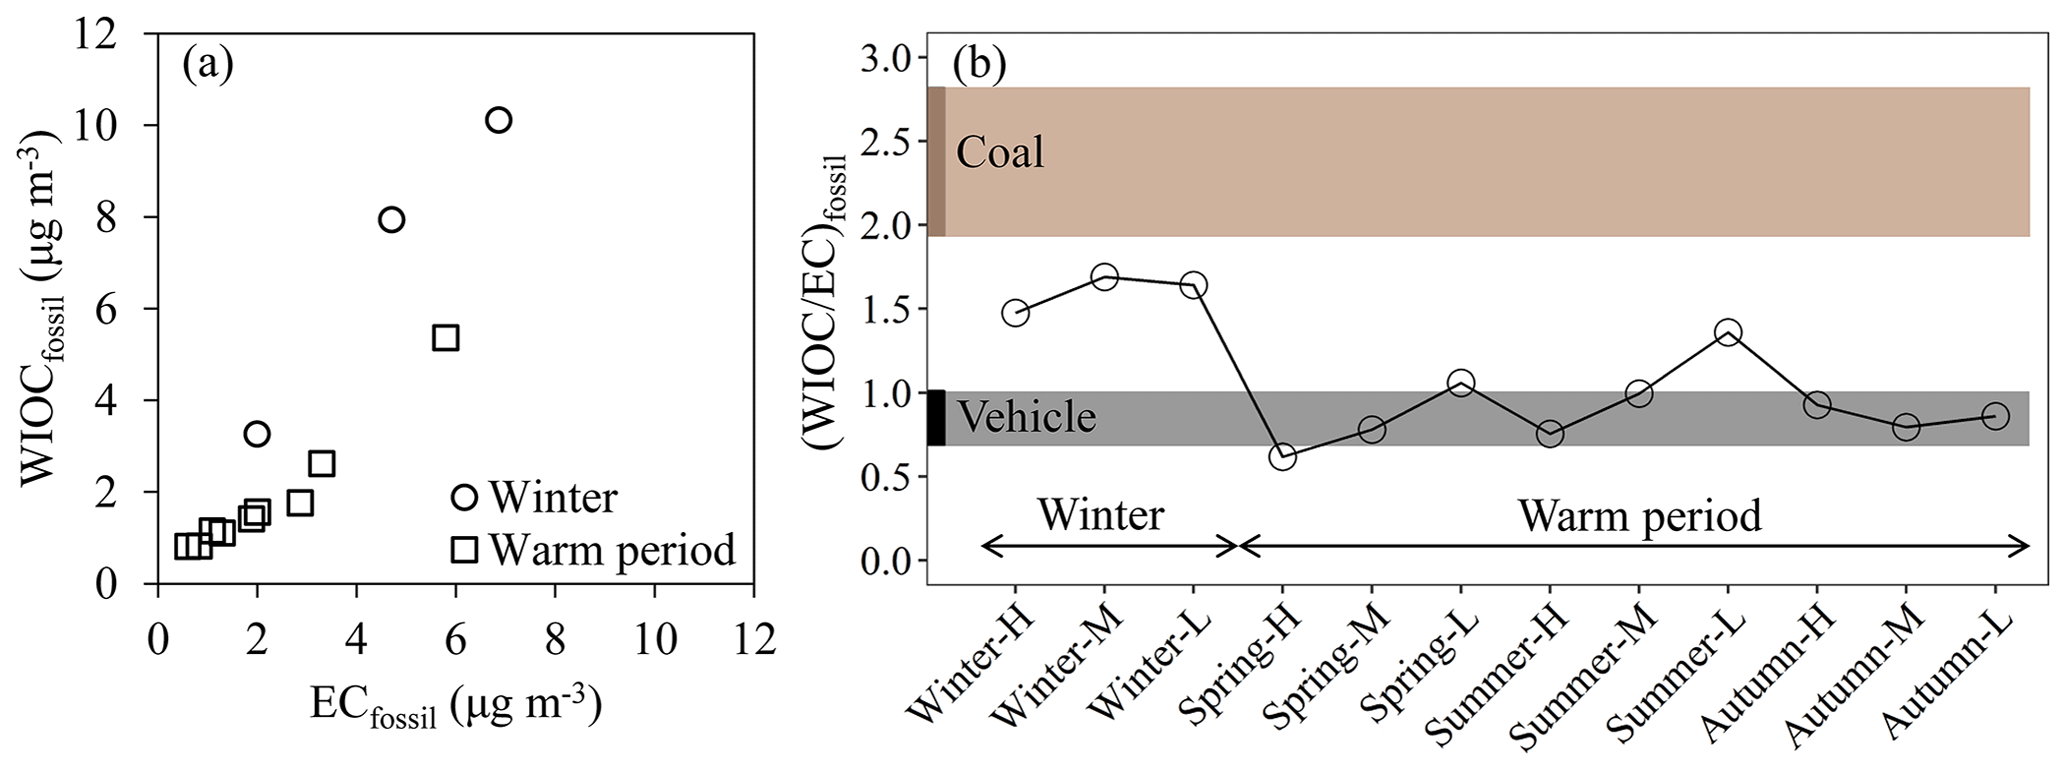
Figure 8(a) Scatter plot of EC concentrations from fossil sources (ECfossil) versus WIOC concentrations from fossil sources (WIOCfossil) in winter (circle) and the warm period (square). (b) WIOC-to-EC ratio from fossil sources ((WIOC ∕ EC)fossil) over all the selected samples throughout the year. The dashed areas indicate typical primary OC ∕ EC ratios for coal combustion (brown) and vehicle emissions (black).
As for OC from secondary origin (i.e., SOCfossil and OCo,nf), 65±4 % is derived from non-fossil sources throughout of the year, with decreased contribution during wintertime (∼60 %). Using multiple state-of-the-art analytical techniques (e.g., 14C measurements and aerosol mass spectrometry), R. J. Huang et al. (2014) found higher non-fossil contribution to SOC (65 %–85 %) in Xi'an and Guangzhou and lower non-fossil contribution to SOC (35 %–55 %) in Beijing and Shanghai in winter 2013. These findings underline the importance of the non-fossil contribution to SOC formation in Chinese megacities. The considerable differences in SOC composition in different cities might be due to the significant difference in SOC precursors from different emission sources and atmospheric processes.
3.5 Fossil WIOC versus fossil EC
Figure 8a shows a scatter plot of WIOCfossil and ECfossil concentrations. ECfossil is emitted by the combustion of fossil fuels, mainly coal combustion and vehicle emissions in Xi'an. WIOCfossil increasing concurrently with ECfossil suggests that primary emissions by fossil fuel combustion are an important source for WIOCfossil as well. However, a much higher slope of WIOCfossil against ECfossil was found in winter when compared with warm periods, implying that WIOCfossil and ECfossil originated from different fossil sources in winter and warm periods. In northern China, coal is used widely in winter for heating, which has higher primary OC∕EC ratios than vehicle emissions.
The ratio of WIOCfossil to ECfossil ((WIOC∕EC)fossil) can give real-world constraints on primary OC∕EC ratios of an integrated fossil source. In the warm period, individual (WIOC∕EC)fossil measured in this study ranged from 0.62 to 1.1 (averaged 0.85±0.14), falling into the range of typical primary OC∕EC ratios for vehicle emissions in tunnel studies (Cheng et al., 2010; Dai et al., 2015; Cui et al., 2016), excluding sample Summer-L, with the highest (WIOC∕EC)fossil ratio of 1.4 (Fig. 8b). The higher (WIOC∕EC)fossil for Summer-L is likely due to the less efficient removal of WIOC in cleaner periods in contrast to more polluted periods during summertime. The more stagnant conditions in more polluted periods (Fig. 3) provide longer time for photochemical processes and SOC formation, contributing to the formation of WSOC and resulting in decreased (WIOC∕EC)fossil ratios, as discussed in Sect. 3.2. The (WIOC∕EC)fossil during wintertime averaged 1.6±0.1, which is closer to the primary OC∕EC ratios for coal combustion than those for vehicle emissions (Fig. 8b), suggesting that coal combustion is one important fossil source in winter other than vehicle emissions. Higher (WIOC∕EC)fossil ratios in winter than in the warm period are also found in Beijing in northern China, with a (WIOC∕EC)fossil ratio of 1.6–2.4 in winter versus 0.7–1.2 in the warm period (Liu et al., 2018). However, no strong seasonal trends of (WIOC∕EC)fossil ratios were found in southern Chinese cities, such as Shanghai (range: 1.2–1.6; Liu et al., 2018), Guangzhou (range: 0.7–1.4; Liu et al., 2018) and Hainan (around 1; Y. L. Zhang et al., 2014). Lower (WIOC∕EC)fossil ratios were found in the Netherlands (0.6±0.3; Dusek et al., 2017), Switzerland or Sweden (ranging roughly from 0.5 to 1; Szidat et al., 2004, 2009). Those higher values in China than in Europe could be attributed to the combined effects of less efficient combustion of fuel in older vehicles in China and higher primary OC∕EC ratios from coal combustion that are more common in China (especially in winter in northern China) than in Europe.
In the warm period, most of individual (WIOC∕EC)fossil falls in the range of primary OC∕EC ratio for vehicle emissions, indicating that vehicle emission is the overwhelming fossil source, with negligible contribution from coal combustion. However, EC source apportionment by combining F14C and δ13C of EC in this study (Fig. 5) and previous studies in Xi'an (Wang et al., 2015; Ni et al., 2018) indicates that even in the warm period, coal combustion is also an important source of fine particles. Another inconsistency is that the considerable difference in (WIOC∕EC)fossil between the winter and warm period suggests strong seasonal variation in coal combustion, whereas only moderate seasonal changes of δ13CEC were observed. Possible causes of those contradictions will be explained in the following section.
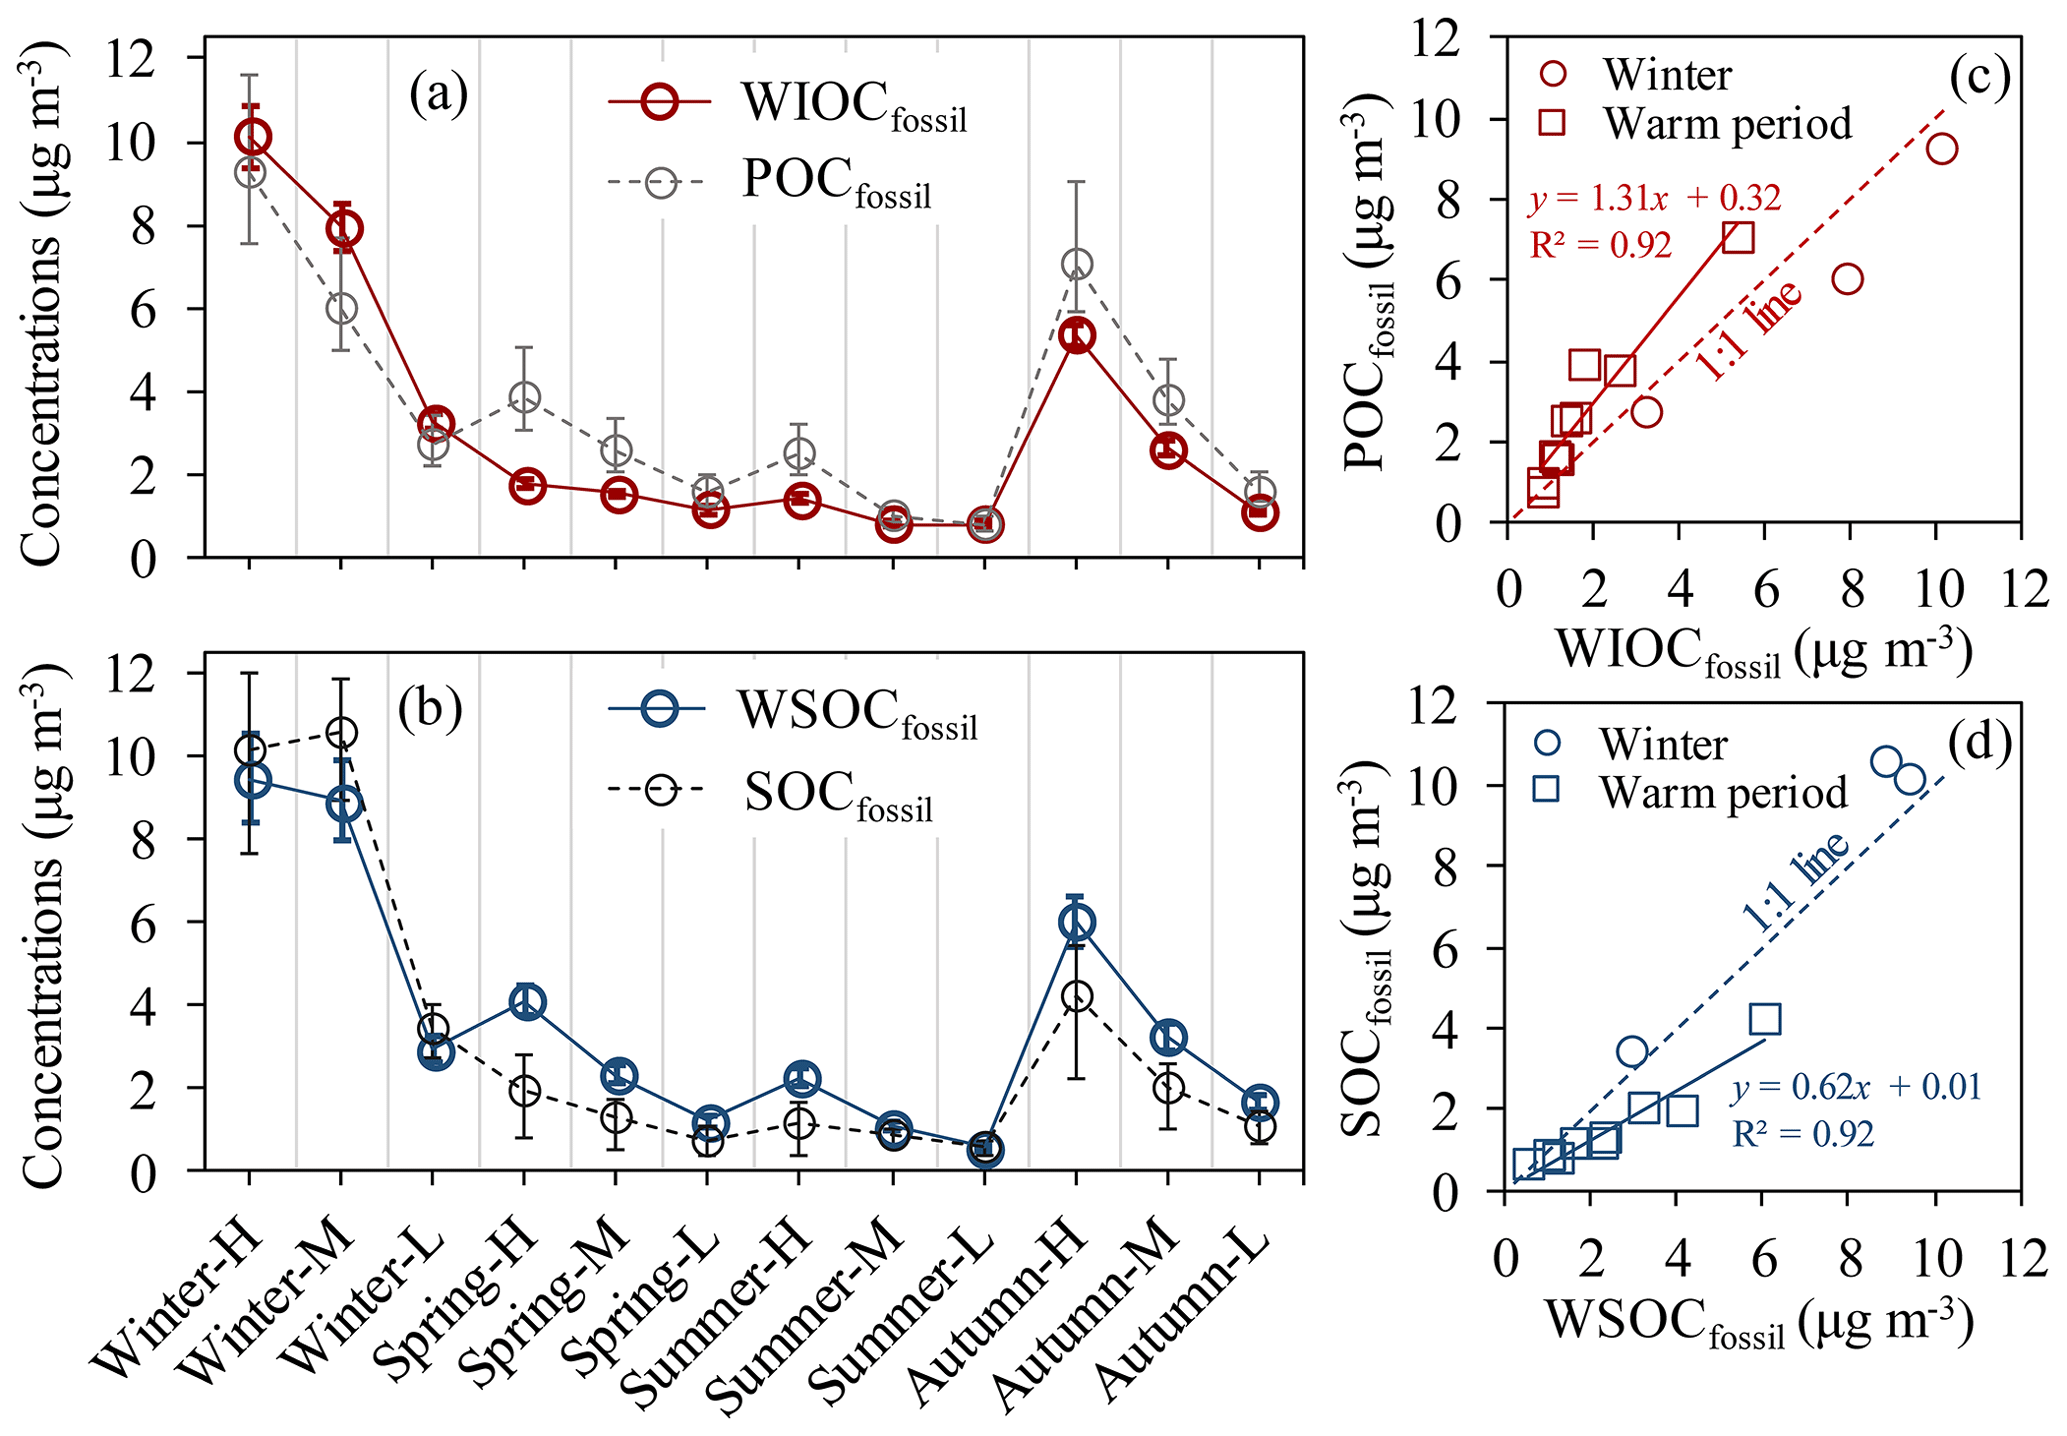
Figure 9(a) Concentrations of WIOC and POC from fossil sources (WIOCfossil and POCfossil, respectively). (a) has the same x axis as (b). (b) Concentrations of WSOC and SOC from fossil sources (WSOCfossil and SOCfossil, respectively). (c) Scatter plot of WIOCfossil concentrations versus POCfossil concentrations. (d) Scatter plot of WSOCfossil concentrations versus SOCfossil concentrations. The interquartile range (25th–75th percentile) of the median POCfossil and SOCfossil is shown by grey vertical bars in (a) and black vertical bars in (b).
3.6 Fossil OC: water-insoluble OC versus primary OC and water-soluble OC versus secondary OC
Fossil WIOC (WIOCfossil) and WSOC (WSOCfossil) have been used widely as proxies of the fossil POC (POCfossil) and SOC (SOCfossil), respectively (e.g., Liu et al., 2014; Y. L. Zhang et al., 2014), because primary OC from fossil sources is mainly WIOC. Figure 9 compares the mass concentrations of WIOCfossil with POCfossil as well as WSOCfossil with SOCfossil. The wider uncertainty ranges of POCfossil and SOCfossil than 14C-apportioned WIOCfossil and WSOCfossil are mainly propagated from the wide range of primary OC∕EC ratios for fossil emissions (Sect. 2.5).
The same trend is observed for WIOCfossil and POCfossil throughout the year (Fig. 9a). In winter, the averaged WIOCfossil concentrations of 7.1 µg m−3 (range of 3.3–10.1 µg m−3) matched the averaged POCfossil concentrations of 6.0 µg m−3 (range of 2.7–9.2 µg m−3). However, in the warm period, the WIOCfossil concentrations (1.8 µg m−3, with a range of 0.8–5.4 µg m−3) do not match the estimated POCfossil (2.7 µg m−3, with a range of 0.8–7.1 µg m−3) equally well. WIOCfossil is still highly correlated with POCfossil but deviates strongly from the 1:1 line of WIOCfossil against POCfossil, with a linear regression having a slope of 1.31, an intercept of 0.32 and an R2 of 0.92. The higher POCfossil than WIOCfossil is well outside the measurement uncertainties, at least for most samples representing high (H) and medium (M) TC concentrations (i.e., Spring-H, Spring-M, Summer-H, Autumn-H and Autumn-M). Previous studies have found that a part of the WIOC can also be secondary origin from fossil sources in Egypt (Favez et al., 2008), France (Sciare et al., 2011) and Beijing, China (Zhang et al., 2018), but this would cause the opposite trend (higher WIOCfossil than POCfossil). On the other hand, measurements of fresh emissions from fossil sources show that only a small fraction (∼10 %) of primary fossil OC is water-soluble (Dai et al., 2015; Yan et al., 2017). The differences between POCfossil and WIOCfossil (25 %–55 %) are much larger than that, and therefore the small fraction of primary fossil WSOC cannot explain the differences between POCfossil and WIOCfossil. The best explanation for the differences in summer and spring during polluted periods is the loss of fossil WIOC, indicated by decreased (WIOC∕EC)fossil when pollution gets worse. This is probably due to more stagnant conditions in polluted periods, which allows for accumulation of pollutants and also more time for photochemical processing of WIOC and SOC formation, as discussed in Sect. 3.2. Evaporation of WIOC is not a likely explanation for this trend, as temperatures do not differ strongly between clean and polluted periods and partitioning to the gas phase should be stronger in clean conditions. However, this decreasing trend of (WIOC∕EC)fossil with increasing TC is not found in autumn, where WIOCfossil is lower than estimated POCfossil by a roughly constant factor. In autumn, wind speed is generally low and not very variable, and photochemical processing would be weaker than in the summer and spring.
Overall, the most likely explanation for the difference between WIOCfossil and POCfossil is the overestimate of POCfossil by the EC tracer method. POCfossil is calculated by multiplying ECfossil by primary OC∕EC ratios for fossil sources (rfossil in Eq. 11). Thus, an overestimate of the POCfossil result has two causes. First, rfossil might be overestimated (as ECfossil is well constrained by 14C), which could result either from too high an estimated fraction of coal burning in the warm period or through rapid evaporation of POC at warmer temperatures. In the warm period, semi-volatile OC from fossil emission sources partitions more readily to the gas phase, leading to lower primary OC∕EC ratios compared to winter. This is supported by laboratory studies and ambient observations, which find that the primary OC∕EC ratio for vehicle emissions is lower in the warm period than in winter (Xie et al., 2017; X. H. H. Huang et al., 2014). Second, during longer residence time in the atmosphere, POC might not be chemically stable, and rfossil decreases with aging time in the atmosphere. This is the only mechanism that can explain the decreasing WIOC∕ECfossil ratios with higher pollutant concentrations, and it is in line with findings from our earlier study that OC loss due to active photochemistry is more intense under high temperature and humidity in a warm period than in a cold winter (Ni et al., 2018).
As a consequence, a good match between WSOCfossil and SOCfossil was observed in winter. As shown in Fig. 9d, the three data points fall close to the 1:1 line of WSOCfossil against SOCfossil. However, in the warm period, the data points fall below the 1:1 line of WSOCfossil against SOCfossil, with a linear regression having a slope of 0.62, an intercept of 0.01 and an R2 of 0.92. Higher WSOCfossil than SOCfossil can be explained by underestimated SOCfossil, overestimated WSOCfossil or both. SOCfossil is calculated by subtracting POCfossil from OCfossil. Thus, underestimated SOCfossil in the warm period can result directly from overestimated POCfossil due to active OC loss.
The comparisons between WIOCfossil and POCfossil, and WSOCfossil and SOCfossil, suggest that it is feasible to use WIOCfossil and WSOCfossil as an indicator of POCfossil and SOCfossil, respectively, with respect to trends and variations in POCfossil and SOCfossil. However, the absolute concentrations of WIOCfossil and WSOCfossil are not equal to those of respective estimated POCfossil and SOCfossil, especially in the warm period. If we consider photochemical loss to be the primary reason of the differences between WIOCfossil and POCfossil, and WSOCfossil and SOCfossil, then 14C-based WIOCfossil and WSOCfossil are probably a better approximation for primary and secondary fossil OC, respectively, than POCfossil and SOCfossil estimated using the EC tracer method (Sect. 2.5, Eqs. 7–10).
This study presents the first source apportionment of various carbonaceous aerosol fractions, including EC, OC, WIOC and WSOC in Xi'an, China, based on radiocarbon (14C) measurement in four seasons for the year 2015–2016. 14C analysis shows that non-fossil sources are an important contributor to OC fractions throughout the year, accounting for 58±6 % WSOC, 53±4 % OC and 45±5 % WIOC, whereas fossil sources dominated EC, with non-fossil sources contributing 18±6 % EC on the yearly average. An increased contribution of non-fossil sources to all carbon fractions was observed in winter because of enhanced non-fossil activities in winter, mainly biomass burning. Fossil sources of EC were further divided into liquid fossil fuel combustion (i.e., vehicle emissions) and coal combustion by combining radiocarbon and stable carbon signatures in a Bayesian MCMC approach. The MCMC results indicate that liquid fossil fuel combustion dominated EC over the whole year, contributing more than half of EC in the warm period and ∼46 % of EC in winter despite the source changes in different seasons. The remaining fossil EC was contributed by coal combustion: in winter, coal combustion (∼25 %) and biomass burning (∼28 %) equally affected EC, whereas in the warm period, coal combustion contributed a larger fraction of EC than biomass burning.
Concentrations of all carbon fractions were higher in winter than in the warm period. Non-fossil WSOC was responsible for ∼35 % of the increased OC mass in winter, followed by non-fossil WIOC (∼24 %), fossil WIOC (∼22 %; WIOCfossil) and fossil WSOC (∼19 %; WSOCfossil). Fossil EC and biomass-burning EC, on average, accounted for 62 % and 38 % increased EC mass in winter. Fossil WIOC∕EC ratios ((WIOC∕EC)fossil) in the warm period averaged 0.85±0.14, well within the range of typical primary OC∕EC ratios for vehicle emissions in tunnel studies (Cheng et al., 2010; Dai et al., 2015; Cui et al., 2016). Much higher (WIOC∕EC)fossil values were found in winter, with an average of 1.6±0.11, which is closer to the primary OC∕EC ratios for coal combustion (2.38±0.44; Sect. 2.5) than for vehicle emissions, indicating additional contribution from coal burning in winter. Higher (WIOC∕EC)fossil in winter than in the warm period is also found in Beijing in northern China (Liu et al., 2018). However, no strong seasonal trends of (WIOC∕EC)fossil were found in southern China, such as Shanghai (Liu et al., 2018), Guangzhou (Liu et al., 2018) and Hainan (Y. L. Zhang et al., 2014), where there is no official heating season using coal.
The majority (60 %–76 %) of the non-fossil OC was water-soluble in all seasons, probably resulting from the mostly water-soluble biomass-burning POC and SOC and biogenic SOC. The fossil OC in winter is less water-soluble than in the warm period, suggesting an enhanced SOC formation from fossil VOCs from vehicle emissions and/or coal burning in the warm period. In spring and summer, there is a clear increasing trend of (WSOC∕OC)fossil and decreasing trend of (WIOC∕EC)fossil in more polluted conditions. This suggests that the fossil WSOC formation as well as fossil WIOC removal increase under the stagnant conditions that characterize polluted periods and allow for accumulation of pollutants and also photochemical processing and secondary OC formation. WIOCfossil and WSOCfossil have been used widely as proxies of the primary and secondary fossil OC, respectively, since primary fossil sources tend to produce mainly WIOC. In winter, mass concentrations of WIOCfossil were comparable to POCfossil, and concentrations of WSOCfossil were comparable to SOCfossil, where POCfossil and SOCfossil are estimated using the EC tracer method. However, the agreement was worse in the warm period even though the respective concentrations were highly correlated. In other words, variations in WIOCfossil and WSOCfossil follow similar trends as POCfossil and SOCfossil, respectively. However, the absolute concentrations of WIOCfossil and WSOCfossil are not equal to those of estimated POCfossil and SOCfossil, especially in the warm period. The higher mass of POCfossil than WIOCfossil in the warm period was probably due to overestimated POCfossil (thus underestimated SOCfossil) resulting from overestimated primary fossil OC∕EC ratios. In the warm period, at relatively high temperatures, semi-volatile OC from emission sources becomes volatilized more quickly, owing to higher temperatures; this leads to lower primary OC∕EC ratios than in winter and is in line with the laboratory and ambient observations that the primary OC∕EC ratio for vehicle emissions is lower in the warm period than in winter (Xie et al., 2017; X. H. H. Huang et al., 2014) and the findings from our earlier study that in the warm period, photochemical OC loss is active and affects final OC concentrations (Ni et al., 2018). We suggest that WIOCfossil and WSOCfossil are probably a better approximation for primary and secondary fossil OC, respectively, than POCfossil and SOCfossil estimated using the EC tracer method.
All data needed to evaluate the conclusions in this study are present in the paper and the Supplement. Additional data related to this paper are available upon request to the corresponding author.
The supplement related to this article is available online at: https://doi.org/10.5194/acp-19-15609-2019-supplement.
UD, RJH, HN and JC designed the study. HN and HD conducted the 14C measurements. HN, HD and UD interpreted the 14C data. JG performed the measurements of stable isotope 13C. HN and UD interpreted the 13C data. HN and UD prepared the figures, and HN wrote the paper. All authors commented on and discussed the paper.
The authors declare that they have no conflict of interest.
The authors acknowledge the financial support from the Gratama Foundation. Special thanks are given to Dipayan Paul, Marc Bleeker and Henk Been for their help with the AMS measurements at CIO and to Anita Aerts-Bijma and Dicky van Zonneveld for their help with 14C data correction at CIO.
This research has been supported by the National Key Research and Development Program of China (grant no. 2017YFC0212701), the National Natural Science Foundation of China (grant nos. 91644219, 41877408 and 41925015), and the KNAW project (grant no. 530-5CDP30).
This paper was edited by Willy Maenhaut and reviewed by three anonymous referees.
Akagi, S. K., Yokelson, R. J., Wiedinmyer, C., Alvarado, M. J., Reid, J. S., Karl, T., Crounse, J. D., and Wennberg, P. O.: Emission factors for open and domestic biomass burning for use in atmospheric models, Atmos. Chem. Phys., 11, 4039–4072, https://doi.org/10.5194/acp-11-4039-2011, 2011.
Andersson, A., Deng, J., Du, K., Zheng, M., Yan, C., Sköld, M., and Gustafsson, Ö.: Regionally-varying combustion sources of the January 2013 severe haze events over eastern China, Environ. Sci. Technol., 49, 2038–2043, 2015.
Bernardoni, V., Calzolai, G., Chiari, M., Fedi, M., Lucarelli, F., Nava, S., Piazzalunga, A., Riccobono, F., Taccetti, F., Valli, G., and Vecchi, R.: Radiocarbon analysis on organic and elemental carbon in aerosol samples and source apportionment at an urban site in Northern Italy, J. Aerosol Sci., 56, 88–99, https://doi.org/10.1016/j.jaerosci.2012.06.001, 2013.
Cao, F., Zhang, Y., Ren, L., Liu, J., Li, J., Zhang, G., Liu, D., Sun, Y., Wang, Z., Shi, Z., and Fu, P.: New insights into the sources and formation of carbonaceous aerosols in China: potential applications of dual-carbon isotopes, Natl. Sci. Rev., 4, 804–806, 2017.
Cao, J.-J., Chow, J. C., Tao, J., Lee, S. C., Watson, J. G., Ho, K. F., Wang, G. H., Zhu, C. S., and Han, Y. M.: Stable carbon isotopes in aerosols from Chinese cities: influence of fossil fuels, Atmos. Environ., 45, 1359–1363, 2011.
Cao, J.-J., Shen, Z.-X., Chow, J. C., Watson, J. G., Lee, S.-C., Tie, X.-X., Ho, K.-F., Wang, G.-H., and Han, Y.-M.: Winter and summer PM2.5 chemical compositions in fourteen Chinese cities, J. Air Waste Manage., 62, 1214–1226, https://doi.org/10.1080/10962247.2012.701193, 2012.
Cao, J.-J., Zhu, C.-S., Tie, X.-X., Geng, F.-H., Xu, H.-M., Ho, S. S. H., Wang, G.-H., Han, Y.-M., and Ho, K.-F.: Characteristics and sources of carbonaceous aerosols from Shanghai, China, Atmos. Chem. Phys., 13, 803–817, https://doi.org/10.5194/acp-13-803-2013, 2013.
Cavalli, F., Viana, M., Yttri, K. E., Genberg, J., and Putaud, J.-P.: Toward a standardised thermal-optical protocol for measuring atmospheric organic and elemental carbon: the EUSAAR protocol, Atmos. Meas. Tech., 3, 79–89, https://doi.org/10.5194/amt-3-79-2010, 2010.
Cheng, C., Wang, G., Zhou, B., Meng, J., Li, J., Cao, J., and Xiao, S.: Comparison of dicarboxylic acids and related compounds in aerosol samples collected in Xi'an, China during haze and clean periods, Atmos. Environ., 81, 443–449, 2013.
Cheng, Y., Lee, S. C., Ho, K. F., Chow, J. C., Watson, J. G., Louie, P. K. K., Cao, J. J., and Hai, X.: Chemically-speciated on-road PM2.5 motor vehicle emission factors in Hong Kong, Sci. Total Environ., 408, 1621–1627, https://doi.org/10.1016/j.scitotenv.2009.11.061, 2010.
Cui, M., Chen, Y., Tian, C., Zhang, F., Yan, C., and Zheng, M.: Chemical composition of PM2.5 from two tunnels with different vehicular fleet characteristics, Sci. Total Environ., 550, 123–132, https://doi.org/10.1016/j.scitotenv.2016.01.077, 2016.
Dai, S., Bi, X., Chan, L. Y., He, J., Wang, B., Wang, X., Peng, P., Sheng, G., and Fu, J.: Chemical and stable carbon isotopic composition of PM2.5 from on-road vehicle emissions in the PRD region and implications for vehicle emission control policy, Atmos. Chem. Phys., 15, 3097–3108, https://doi.org/10.5194/acp-15-3097-2015, 2015.
Dusek, U., Ten Brink, H., Meijer, H., Kos, G., Mrozek, D., Röckmann, T., Holzinger, R., and Weijers, E.: The contribution of fossil sources to the organic aerosol in the Netherlands, Atmos. Environ., 74, 169–176, 2013.
Dusek, U., Monaco, M., Prokopiou, M., Gongriep, F., Hitzenberger, R., Meijer, H. A. J., and Röckmann, T.: Evaluation of a two-step thermal method for separating organic and elemental carbon for radiocarbon analysis, Atmos. Meas. Tech., 7, 1943–1955, https://doi.org/10.5194/amt-7-1943-2014, 2014.
Dusek, U., Hitzenberger, R., Kasper-Giebl, A., Kistler, M., Meijer, H. A. J., Szidat, S., Wacker, L., Holzinger, R., and Röckmann, T.: Sources and formation mechanisms of carbonaceous aerosol at a regional background site in the Netherlands: insights from a year-long radiocarbon study, Atmos. Chem. Phys., 17, 3233–3251, https://doi.org/10.5194/acp-17-3233-2017, 2017.
Elser, M., Huang, R.-J., Wolf, R., Slowik, J. G., Wang, Q., Canonaco, F., Li, G., Bozzetti, C., Daellenbach, K. R., Huang, Y., Zhang, R., Li, Z., Cao, J., Baltensperger, U., El-Haddad, I., and Prévôt, A. S. H.: New insights into PM2.5 chemical composition and sources in two major cities in China during extreme haze events using aerosol mass spectrometry, Atmos. Chem. Phys., 16, 3207–3225, https://doi.org/10.5194/acp-16-3207-2016, 2016.
Fang, W., Du, K., Andersson, A., Xing, Z., Cho, C., Kim, S. W., Deng, J., and Gustafsson, Ö.: Dual-isotope constraints on seasonally-resolved source fingerprinting of Black Carbon aerosols in sites of the four emission hotspot regions of China, J. Geophys. Res.-Atmos., 123, 11735–11747, https://doi.org/10.1029/2018JD028607, 2018.
Favez, O., Sciare, J., Cachier, H., Alfaro, S. C., and Abdelwahab, M. M.: Significant formation of water-insoluble secondary organic aerosols in semi-arid urban environment, Geophys. Res. Lett., 35, L15801, https://doi.org/10.1029/2008GL034446, 2008.
Gelencsér, A., May, B., Simpson, D., Sánchez-Ochoa, A., Kasper-Giebl, A., Puxbaum, H., Caseiro, A., Pio, C., and Legrand, M.: Source apportionment of PM2.5 organic aerosol over Europe: Primary/secondary, natural/anthropogenic, and fossil/biogenic origin, J. Geophys. Res., 112, D23S04, https://doi.org/10.1029/2006JD008094, 2007.
Guo, S., Hu, M., Guo, Q., Zhang, X., Zheng, M., Zheng, J., Chang, C. C., Schauer, J. J., and Zhang, R.: Primary sources and secondary formation of organic aerosols in Beijing, China, Environ. Sci. Technol., 46, 9846–9853, 2012.
Gustafsson, Ö., Kruså, M., Zencak, Z., Sheesley, R. J., Granat, L., Engström, E., Praveen, P., Rao, P., Leck, C., and Rodhe, H.: Brown clouds over South Asia: biomass or fossil fuel combustion?, Science, 323, 495–498, 2009.
Hallquist, M., Wenger, J. C., Baltensperger, U., Rudich, Y., Simpson, D., Claeys, M., Dommen, J., Donahue, N. M., George, C., Goldstein, A. H., Hamilton, J. F., Herrmann, H., Hoffmann, T., Iinuma, Y., Jang, M., Jenkin, M. E., Jimenez, J. L., Kiendler-Scharr, A., Maenhaut, W., McFiggans, G., Mentel, Th. F., Monod, A., Prévôt, A. S. H., Seinfeld, J. H., Surratt, J. D., Szmigielski, R., and Wildt, J.: The formation, properties and impact of secondary organic aerosol: current and emerging issues, Atmos. Chem. Phys., 9, 5155–5236, https://doi.org/10.5194/acp-9-5155-2009, 2009.
Heal, M. R.: The application of carbon-14 analyses to the source apportionment of atmospheric carbonaceous particulate matter: a review, Anal. Bioanal. Chem., 406, 81–98, 2014.
Hua, Q. and Barbetti, M.: Review of tropospheric bomb 14C data for carbon cycle modeling and age calibration purposes, Radiocarbon, 46, 1273–1298, 2004.
Huang, R. J., Zhang, Y., Bozzeti, C., Ho, K. F., Cao, J. J., Han, Y., Daellenbach, K. R., Slowik, J.G., Platt, S. M., Canonaco, F., Zotter, P., Wolf, R., Pieber, S. M., Bruns, E. A., Crippa, M., Ciarelli, G., Piazzalunga, A., Schwikowski, M., Abbaszade, G., SchnelleKreis, J., Zimmermann, R., An, Z., Szidat, S., Baltensperger, U., El Haddad, I., and Prévôt, A. S. H.: High secondary aerosol contribution to particulate pollution during haze events in China, Nature, 514, 218–222, https://doi.org/10.1038/nature13774, 2014.
Huang, X., Li, M., Li, J., and Song, Y.: A high-resolution emission inventory of crop burning in fields in China based on MODIS Thermal Anomalies/Fire products, Atmos. Environ., 50, 9–15, 2012.
Huang, X. H. H., Bian, Q. J., Louie, P. K. K., and Yu, J. Z.: Contributions of vehicular carbonaceous aerosols to PM2.5 in a roadside environment in Hong Kong, Atmos. Chem. Phys., 14, 9279–9293, https://doi.org/10.5194/acp-14-9279-2014, 2014.
Irei, S., Rudolph, J., Huang, L., Auld, J., and Hastie, D.: Stable carbon isotope ratio of secondary particulate organic matter formed by photooxidation of toluene in indoor smog chamber, Atmos. Environ., 45, 856–862, 2011.
Jacobson, M. C., Hansson, H. C., Noone, K. J., and Charlson, R. J.: Organic atmospheric aerosols: review and state of the science, Rev. Geophys., 38, 267–294, 2000.
Kanakidou, M., Seinfeld, J. H., Pandis, S. N., Barnes, I., Dentener, F. J., Facchini, M. C., Van Dingenen, R., Ervens, B., Nenes, A., Nielsen, C. J., Swietlicki, E., Putaud, J. P., Balkanski, Y., Fuzzi, S., Horth, J., Moortgat, G. K., Winterhalter, R., Myhre, C. E. L., Tsigaridis, K., Vignati, E., Stephanou, E. G., and Wilson, J.: Organic aerosol and global climate modelling: a review, Atmos. Chem. Phys., 5, 1053–1123, https://doi.org/10.5194/acp-5-1053-2005, 2005.
Kondo, Y., Miyazaki, Y., Takegawa, N., Miyakawa, T., Weber, R. J., Jimenez, J. L., Zhang, Q., and Worsnop, D. R.: Oxygenated and water-soluble organic aerosols in Tokyo, J. Geophys. Res.-Atmos., 112, D01203, https://doi.org/10.1029/2006JD007056, 2007.
Levin, I., Hammer, S., Kromer, B., and Meinhardt, F.: Radiocarbon observations in atmospheric CO2: determining fossil fuel CO2 over Europe using Jungfraujoch observations as background, Sci. Total Environ., 391, 211–216, 2008.
Levin, I., Naegler, T., Kromer, B., Diehl, M., Francey, R. J., Gomez-Pelaez, A., Steele, P., Wagenbach, D., Weller, R., and Worthy, D.: Observations and modelling of the global distribution and long-term trend of atmospheric 14CO2, Tellus B, 62, 26–46, 2010.
Levin, I., Kromer, B., and Hammer, S.: Atmospheric Δ14CO2 trend in Western European background air from 2000 to 2012, Tellus B, 65, 20092, https://doi.org/10.3402/tellusb.v65i0.20092, 2013.
Lewis, C. W., Klouda, G. A., and Ellenson, W. D.: Radiocarbon measurement of the biogenic contribution to summertime PM2.5 ambient aerosol in Nashville, TN, Atmos. Environ., 38, 6053–6061, 2004.
Li, C., Bosch, C., Kang, S., Andersson, A., Chen, P., Zhang, Q., Cong, Z., Chen, B., Qin, D., and Gustafsson, Ö.: Sources of black carbon to the Himalayan–Tibetan Plateau glaciers, Nat. Commun., 7, 12574, https://doi.org/10.1038/ncomms12574, 2016.
Liu, D., Li, J., Zhang, Y., Xu, Y., Liu, X., Ding, P., Shen, C., Chen, Y., Tian, C., and Zhang, G.: The use of levoglucosan and radiocarbon for source apportionment of PM2.5 carbonaceous aerosols at a background site in East China, Environ. Sci. Technol., 47, 10454–10461, 2013.
Liu, D., Li, J., Cheng, Z., Zhong, G., Zhu, S., Ding, P., Shen, C., Tian, C., Chen, Y., Zhi, G., and Zhang, G.: Sources of non-fossil-fuel emissions in carbonaceous aerosols during early winter in Chinese cities, Atmos. Chem. Phys., 17, 11491–11502, https://doi.org/10.5194/acp-17-11491-2017, 2017.
Liu, D., Vonwiller, M., Li, J., Liu, J., Szidat, S., Zhang, Y., Tian, C., Chen, Y., Cheng, Z., Zhong, G., Fu, P., and Zhang, G.: Fossil and Non-fossil Sources of Organic and Elemental Carbon Aerosols in Beijing, Shanghai and Guangzhou: Seasonal Variation of Carbon Source, Atmos. Chem. Phys. Discuss., https://doi.org/10.5194/acp-2018-295, 2018.
Liu, J., Li, J., Zhang, Y., Liu, D., Ding, P., Shen, C., Shen, K., He, Q., Ding, X., Wang, X., Chen, D., and Zhang, G.: Source apportionment using radiocarbon and organic tracers for PM2.5 carbonaceous aerosols in Guangzhou, South China: contrasting local-and regional-scale aaze events, Environ. Sci. Technol., 48, 12002–12011, 2014.
Liu, J., Li, J., Liu, D., Ding, P., Shen, C., Mo, Y., Wang, X., Luo, C., Cheng, Z., Szidat, S., Zhang, Y., Chen, Y., and Zhang, G.: Source apportionment and dynamic changes of carbonaceous aerosols during the haze bloom-decay process in China based on radiocarbon and organic molecular tracers, Atmos. Chem. Phys., 16, 2985–2996, https://doi.org/10.5194/acp-16-2985-2016, 2016a.
Liu, J., Li, J., Vonwiller, M., Liu, D., Cheng, H., Shen, K., Salazar, G., Agrios, K., Zhang, Y., He, Q., Ding, X., Zhong, G., Wang, X., Szidat, S., and Zhang, G.: The importance of non-fossil sources in carbonaceous aerosols in a megacity of central China during the 2013 winter haze episode: a source apportionment constrained by radiocarbon and organic tracers, Atmos. Environ., 144, 60–68, 2016b.
Mayol-Bracero, O. L., Guyon, P., Graham, B., Roberts, G., Andreae, M. O., Decesari, S., Facchini, M. C., Fuzzi, S., and Artaxo, P.: Water-soluble organic compounds in biomass burning aerosols over Amazonia, 2, apportionment of the chemical composition and importance of the polyacidic fraction, J. Geophys. Res.-Atmos., 107, 8091, https://doi.org/10.1029/2001JD000522, 2002.
Miyazaki, Y., Kondo, Y., Takegawa, N., Komazaki, Y., Fukuda, M., Kawamura, K., Mochida, M., Okuzawa, K., and Weber, R. J.: Time-resolved measurements of water-soluble organic carbon in Tokyo, J. Geophys. Res.-Atmos., 111, D23206, https://doi.org/10.1029/2006JD007125, 2006.
Mohn, J., Szidat, S., Fellner, J., Rechberger, H., Quartier, R., Buchmann, B., and Emmenegger, L.: Determination of biogenic and fossil CO2 emitted by waste incineration based on 14CO2 and mass balances, Bioresource Technol., 99, 6471–6479, 2008.
Mook, W. G. and van der Plicht, J.: Reporting 14C activities and concentrations, Radiocarbon, 41, 227–239, 1999.
Ni, H., Tian, J., Wang, X., Wang, Q., Han, Y., Cao, J., Long, X., Chen, L. W. A., Chow, J. C., Watson, J. G., Huang, R.-J., and Dusek, U.: PM2.5 emissions and source profiles from open burning of crop residues, Atmos. Environ., 169, 229–237, https://doi.org/10.1016/j.atmosenv.2017.08.063, 2017.
Ni, H., Huang, R.-J., Cao, J., Liu, W., Zhang, T., Wang, M., Meijer, H. A. J., and Dusek, U.: Source apportionment of carbonaceous aerosols in Xi'an, China: insights from a full year of measurements of radiocarbon and the stable isotope 13C, Atmos. Chem. Phys., 18, 16363–16383, https://doi.org/10.5194/acp-18-16363-2018, 2018.
Nozière, B., Kalberer, M., Claeys, M., Allan, J., D'Anna, B., Decesari, S., Finessi, E., Glasius, M., Grgić, I., Hamilton, J. F., Hoffmann, T., Iinuma, Y., Jaoui, M., Kahnt, A., Kampf, C. J., Kourtchev, I., Maenhaut, W., Marsden, N., Saarikoski, S., Schnelle-Kreis, J., Surratt, J. D., Szidat, S., Szmigielski, R., and Wisthaler, A.: The molecular identification of organic compounds in the atmosphere: state of the art and challenges, Chem. Rev., 115, 3919–3983, https://doi.org/10.1021/cr5003485, 2015.
Palstra, S. W. and Meijer, H. A.: Biogenic carbon fraction of biogas and natural gas fuel mixtures determined with 14C, Radiocarbon, 56, 7–28, 2014.
Parnell, A. C., Inger, R., Bearhop, S., and Jackson, A. L.: Source partitioning using stable isotopes: coping with too much variation, PloS ONE, 5, e9672, https://doi.org/10.1371/journal.pone.0009672, 2010.
Parnell, A. C., Phillips, D. L., Bearhop, S., Semmens, B. X., Ward, E. J., Moore, J. W., Jackson, A. L., Grey, J., Kelly, D. J., and Inger, R.: Bayesian stable isotope mixing models, Environmetrics, 24, 387–399, 2013.
Pavuluri, C. M. and Kawamura, K.: Enrichment of 13C in diacids and related compounds during photochemical processing of aqueous aerosols: new proxy for organic aerosols aging, Sci. Rep.-UK, 6, 36467, https://doi.org/10.1038/srep36467, 2016.
Pöschl, U.: Atmospheric aerosols: composition, transformation, climate and health effects, Angew. Chem. Int. Ed. Engl., 44, 7520–7540, 2005.
Reimer, P. J., Brown, T. A., and Reimer, R. W.: Discussion: reporting and calibration of post-bomb 14C data, Radiocarbon, 46, 1299–1304, 2004.
Ruff, M., Wacker, L., Gäggeler, H., Suter, M., Synal, H.-A., and Szidat, S.: A gas ion source for radiocarbon measurements at 200 kV, Radiocarbon, 49, 307–314, 2007.
Salazar, G., Zhang, Y. L., Agrios, K., and Szidat, S.: Development of a method for fast and automatic radiocarbon measurement of aerosol samples by online coupling of an elemental analyzer with a MICADAS AMS, Nucl. Instrum. Meth. B, 361, 163–167, https://doi.org/10.1016/j.nimb.2015.03.051, 2015.
Sannigrahi, P., Sullivan, A. P., Weber, R. J., and Ingall, E. D.: Characterization of water-soluble organic carbon in urban atmospheric aerosols using solid-state 13C NMR spectroscopy, Environ. Sci. Technol., 40, 666–672, 2006.
Sciare, J., d'Argouges, O., Sarda-Estève, R., Gaimoz, C., Dolgorouky, C., Bonnaire, N., Favez, O., Bonsang, B., and Gros, V.: Large contribution of water-insoluble secondary organic aerosols in the region of Paris (France) during wintertime, J. Geophys. Res.-Atmos., 116, D22203, https://doi.org/10.1029/2011JD015756, 2011.
Sheesley, R. J., Kirillova, E., Andersson, A., Kruså, M., Praveen, P., Budhavant, K., Safai, P. D., Rao, P., and Gustafsson, Ö.: Year-round radiocarbon-based source apportionment of carbonaceous aerosols at two background sites in South Asia, J. Geophys. Res.-Atmos., 117, D10202, https://doi.org/10.1029/2011JD017161, 2012.
Shen, Z., Lei, Y., Zhang, L., Zhang, Q., Zeng, Y., Tao, J., Zhu, C., Cao, J., Xu, H., and Liu, S.: Methanol extracted brown carbon in PM2.5 over Xi'an, China: seasonal variation of optical properties and sources identification, Aerosol Sci. Eng., 1, 57–65, https://doi.org/10.1007/s41810-017-0007-z, 2017.
Streets, D., Yarber, K., Woo, J. H., and Carmichael, G.: Biomass burning in Asia: annual and seasonal estimates and atmospheric emissions, Global Biogeochem. Cy., 17, 1099, https://doi.org/10.1029/2003GB002040, 2003.
Stuiver, M. and Polach, H. A.: Discussion: Reporting of 14C data, Radiocarbon, 19, 355–363, 1977.
Sun, J., Shen, Z., Cao, J., Zhang, L., Wu, T., Zhang, Q., Yin, X., Lei, Y., Huang, Y., Huang, R., Liu, S., Han, Y., Xu, H., Zheng, C., and Liu, P.: Particulate matters emitted from maize straw burning for winter heating in rural areas in Guanzhong Plain, China: current emission and future reduction, Atmos. Res., 184, 66–76, 2017.
Synal, H.-A., Stocker, M., and Suter, M.: MICADAS: A new compact radiocarbon AMS system, Nucl. Instrum. Meth. B, 259, 7–13, https://doi.org/10.1016/j.nimb.2007.01.138, 2007.
Szidat, S., Jenk, T. M., Gäggeler, H. W., Synal, H. A., Fisseha, R., Baltensperger, U., Kalberer, M., Samburova, V., Reimann, S., Kasper-Giebl, A., and Hajdas, I.: Radiocarbon (14C)-deduced biogenic and anthropogenic contributions to organic carbon (OC) of urban aerosols from Zürich, Switzerland, Atmos. Environ., 38, 4035–4044, https://doi.org/10.1016/j.atmosenv.2004.03.066, 2004.
Szidat, S., Ruff, M., Perron, N., Wacker, L., Synal, H.-A., Hallquist, M., Shannigrahi, A. S., Yttri, K. E., Dye, C., and Simpson, D.: Fossil and non-fossil sources of organic carbon (OC) and elemental carbon (EC) in Göteborg, Sweden, Atmos. Chem. Phys., 9, 1521–1535, https://doi.org/10.5194/acp-9-1521-2009, 2009.
Szidat, S., Bench, G., Bernardoni, V., Calzolai, G., Czimczik, C. I., Derendorp, L., Dusek, U., Elder, K., Fedi, M. E., Genberg, J., Gustafsson, Ö., Kirillova, E., Kondo, M., McNichol, A. P., Perron, N., Santos, G. M., Stenström. K., Swietlicki, E., Uchida, M., Vecchi, R., Wacher, L., Zhang, Y., and Prévôt, A. S. H.: Intercomparison of 14C analysis of carbonaceous aerosols: exercise 2009, Radiocarbon, 55, 1496–1509, 2013.
Tao, J., Zhang, L., Cao, J., and Zhang, R.: A review of current knowledge concerning PM2.5 chemical composition, aerosol optical properties and their relationships across China, Atmos. Chem. Phys., 17, 9485–9518, https://doi.org/10.5194/acp-17-9485-2017, 2017.
Turpin, B. J. and Huntzicker, J. J.: Identification of secondary organic aerosol episodes and quantitation of primary and secondary organic aerosol concentrations during SCAQS, Atmos. Environ., 29, 3527–3544, 1995.
Vlachou, A., Daellenbach, K. R., Bozzetti, C., Chazeau, B., Salazar, G. A., Szidat, S., Jaffrezo, J.-L., Hueglin, C., Baltensperger, U., Haddad, I. E., and Prévôt, A. S. H.: Advanced source apportionment of carbonaceous aerosols by coupling offline AMS and radiocarbon size-segregated measurements over a nearly 2-year period, Atmos. Chem. Phys., 18, 6187–6206, https://doi.org/10.5194/acp-18-6187-2018, 2018.
Wacker, L., Christl, M., and Synal, H. A.: Bats: A new tool for AMS data reduction, Nucl. Instrum. Meth. B, 268, 976–979, https://doi.org/10.1016/j.nimb.2009.10.078, 2010.
Wang, P., Cao, J.J., Shen, Z. X., Han, Y. M., Lee, S. C., Huang, Y., Zhu, C. S., Wang, Q. Y., Xu, H. M., and Huang, R. J.: Spatial and seasonal variations of PM2.5 mass and species during 2010 in Xi'an, China, Sci. Total Environ., 508, 477–487, 2015.
Weber, R. J., Sullivan, A. P., Peltier, R. E., Russell, A., Yan, B., Zheng, M., de Gouw, J., Warneke, C., Brock, C., Holloway, J. S., Atlas, E. L., and Edgerton, E.: A study of secondary organic aerosol formation in the anthropogenic-influenced southeastern United States, J. Geophys. Res.-Atmos., 112, D13302, https://doi.org/10.1029/2007JD008408, 2007.
Winiger, P., Andersson, A., Yttri, K. E., Tunved, P., and Gustafsson, Ö.: Isotope-based source apportionment of EC aerosol particles during winter high-pollution events at the Zeppelin Observatory, Svalbard, Environ. Sci. Technol., 49, 11959–11966, https://doi.org/10.1021/acs.est.5b02644, 2015.
Winiger, P., Andersson, A., Eckhardt, S., Stohl, A., and Gustafsson, Ö.: The sources of atmospheric black carbon at a European gateway to the Arctic, Nat. Commun., 7, 12776, https://doi.org/10.1038/ncomms12776, 2016.
Wozniak, A. S., Bauer, J. E., and Dickhut, R. M.: Characteristics of water-soluble organic carbon associated with aerosol particles in the eastern United States, Atmos. Environ., 46, 181–188, 2012.
Xie, M., Hays, M., and Holder, A.: Light-absorbing organic carbon from prescribed and laboratory biomass burning and gasoline vehicle emissions, Sci. Rep.-UK, 7, 7318, https://doi.org/10.1038/s41598-017-06981-8, 2017.
Xu, H., Cao, J., Chow, J. C., Huang, R.-J., Shen, Z., Chen, L. A., Ho, K. F., and Watson, J. G.: Inter-annual variability of wintertime PM2.5 chemical composition in Xi'an, China: evidences of changing source emissions, Sci. Total Environ., 545, 546–555, 2016.
Yan, C., Zheng, M., Bosch, C., Andersson, A., Desyaterik, Y., Sullivan, A. P., Collett, J. L., Zhao, B., Wang, S., He, K., and Gustafsson, Ö.: Important fossil source contribution to brown carbon in Beijing during winter, Sci. Rep.-UK, 7, 43182, https://doi.org/10.1038/srep43182, 2017.
Zenker, K., Vonwiller, M., Szidat, S., Calzolai, G., Giannoni, M., Bernardoni, V., Jedynska, A. D., Henzing, B., Meijer, H. A., and Dusek, U.: Evaluation and inter-comparison of oxygen-based OC-EC separation methods for radiocarbon analysis of ambient aerosol particle samples, Atmosphere, 8, 226, https://doi.org/10.3390/atmos8110226, 2017.
Zhang, T., Cao, J.-J., Chow, J. C., Shen, Z.-X., Ho, K.-F., Ho, S. S. H., Liu, S.-X., Han, Y.-M., Watson, J. G., Wang, G.-H., and Huang, R.-J.: Characterization and seasonal variations of levoglucosan in fine particulate matter in Xi'an, China, J. Air Waste Manage., 64, 1317–1327, https://doi.org/10.1080/10962247.2014.944959, 2014.
Zhang, Y. L., Perron, N., Ciobanu, V. G., Zotter, P., Minguillón, M. C., Wacker, L., Prévôt, A. S. H., Baltensperger, U., and Szidat, S.: On the isolation of OC and EC and the optimal strategy of radiocarbon-based source apportionment of carbonaceous aerosols, Atmos. Chem. Phys., 12, 10841–10856, https://doi.org/10.5194/acp-12-10841-2012, 2012.
Zhang, Y. L., Zotter, P., Perron, N., Prévôt, A. S. H., Wacker, L., and Szidat, S.: Fossil and non-fossil sources of different carbonaceous fractions in fine and coarse particles by radiocarbon measurement, Radiocarbon, 55, 1510–1520, 2013.
Zhang, Y. L., Li, J., Zhang, G., Zotter, P., Huang, R.-J., Tang, J.-H., Wacker, L., Prévôt, A. S. H., and Szidat, S.: Radiocarbon-based source apportionment of carbonaceous aerosols at a regional background site on Hainan Island, South China, Environ. Sci. Technol., 48, 2651–2659, https://doi.org/10.1021/es4050852, 2014.
Zhang, Y. L., Huang, R. J., El Haddad, I., Ho, K. F., Cao, J. J., Han, Y., Zotter, P., Bozzetti, C., Daellenbach, K. R., Canonaco, F., Slowik, J. G., Salazar, G., Schwikowski, M., Schnelle-Kreis, J., Abbaszade, G., Zimmermann, R., Baltensperger, U., Prévôt, A. S. H., and Szidat, S.: Fossil vs. non-fossil sources of fine carbonaceous aerosols in four Chinese cities during the extreme winter haze episode of 2013, Atmos. Chem. Phys., 15, 1299–1312, https://doi.org/10.5194/acp-15-1299-2015, 2015a.
Zhang, Y. L., Schnelle-Kreis, J., Abbaszade, G., Zimmermann, R., Zotter, P., Shen, R. R., Schäefer, K., Shao, L., Prévôt, A , and Szidat, S.: Source apportionment of elemental carbon in Beijing, China: insights from radiocarbon and organic marker measurements, Environ. Sci. Technol., 49, 8408–8415, 2015b.
Zhang, Y. L., Ren, H., Sun, Y., Cao, F., Chang, Y., Liu, S., Lee, X., Agrios, K., Kawamura, K., Liu, D., Ren, L., Du, W., Wang, Z., Prévôt, A. S. H., Szidat, S., and Fu, P.: High contribution of nonfossil sources to submicrometer organic aerosols in Beijing, China, Environ. Sci. Technol., 51, 7842–7852, 2017.
Zhang, Y.-L., El-Haddad, I., Huang, R.-J., Ho, K.-F., Cao, J.-J., Han, Y., Zotter, P., Bozzetti, C., Daellenbach, K. R., Slowik, J. G., Salazar, G., Prévôt, A. S. H., and Szidat, S.: Large contribution of fossil fuel derived secondary organic carbon to water soluble organic aerosols in winter haze in China, Atmos. Chem. Phys., 18, 4005–4017, https://doi.org/10.5194/acp-18-4005-2018, 2018.
Zhao, Z., Cao, J., Zhang, T., Shen, Z., Ni, H., Tian, J., Wang, Q., Liu, S., Zhou, J., Gu, J., and Shen, G.: Stable carbon isotopes and levoglucosan for PM2.5 elemental carbon source apportionments in the largest city of Northwest China, Atmos. Environ., 185, 253–261, https://doi.org/10.1016/j.atmosenv.2018.05.008, 2018.
Zhou, Y., Xing, X., Lang, J., Chen, D., Cheng, S., Wei, L., Wei, X., and Liu, C.: A comprehensive biomass burning emission inventory with high spatial and temporal resolution in China, Atmos. Chem. Phys., 17, 2839–2864, https://doi.org/10.5194/acp-17-2839-2017, 2017.
Zhu, C. S., Cao, J. J., Tsai, C. J., Zhang, Z. S., and Tao, J.: Biomass burning tracers in rural and urban ultrafine particles in Xi'an, China, Atmos. Pollut. Res., 8, 614–618, https://doi.org/10.1016/j.apr.2016.12.011, 2017.