the Creative Commons Attribution 4.0 License.
the Creative Commons Attribution 4.0 License.
 | 16 Dec 2019
Sources of organic aerosols in Europe: a modeling study using CAMx with modified volatility basis set scheme
Imad El-Haddad
Giancarlo Ciarelli
Hugo A. C. Denier van der Gon
Francesco Canonaco
Stefania Gilardoni
Marco Paglione
María Cruz Minguillón
Olivier Favez
Yunjiang Zhang
Nicolas Marchand
Liqing Hao
Annele Virtanen
Kalliopi Florou
Colin O'Dowd
Jurgita Ovadnevaite
Urs Baltensperger
André S. H. Prévôt
Source apportionment of organic aerosols (OAs) is of great importance to better understand the health impact and climate effects of particulate matter air pollution. Air quality models are used as potential tools to identify OA components and sources at high spatial and temporal resolution; however, they generally underestimate OA concentrations, and comparisons of their outputs with an extended set of measurements are still rare due to the lack of long-term experimental data. In this study, we addressed such challenges at the European level. Using the regional Comprehensive Air Quality Model with Extensions (CAMx) and a volatility basis set (VBS) scheme which was optimized based on recent chamber experiments with wood burning and diesel vehicle emissions, and which contains more source-specific sets compared to previous studies, we calculated the contribution of OA components and defined their sources over a whole-year period (2011). We modeled separately the primary and secondary OA contributions from old and new diesel and gasoline vehicles, biomass burning (mostly residential wood burning and agricultural waste burning excluding wildfires), other anthropogenic sources (mainly shipping, industry and energy production) and biogenic sources. An important feature of this study is that we evaluated the model results with measurements over a longer period than in previous studies, which strengthens our confidence in our modeled source apportionment results. Comparison against positive matrix factorization (PMF) analyses of aerosol mass spectrometric measurements at nine European sites suggested that the modified VBS scheme improved the model performance for total OA as well as the OA components, including hydrocarbon-like (HOA), biomass burning (BBOA) and oxygenated components (OOA). By using the modified VBS scheme, the mean bias of OOA was reduced from −1.3 to −0.4 µg m−3 corresponding to a reduction of mean fractional bias from −45 % to −20 %. The winter OOA simulation, which was largely underestimated in previous studies, was improved by 29 % to 42 % among the evaluated sites compared to the default parameterization. Wood burning was the dominant OA source in winter (61 %), while biogenic emissions contributed ∼ 55 % to OA during summer in Europe on average. In both seasons, other anthropogenic sources comprised the second largest component (9 % in winter and 19 % in summer as domain average), while the average contributions of diesel and gasoline vehicles were rather small (∼ 5 %) except for the metropolitan areas where the highest contribution reached 31 %. The results indicate the need to improve the emission inventory to include currently missing and highly uncertain local emissions, as well as further improvement of VBS parameterization for winter biomass burning. Although this study focused on Europe, it can be applied in any other part of the globe. This study highlights the ability of long-term measurements and source apportionment modeling to validate and improve emission inventories, and identify sources not yet properly included in existing inventories.
- Article
(9200 KB) - Full-text XML
-
Supplement
(1793 KB) - BibTeX
- EndNote


Pollution by atmospheric fine particulate matter (PM) exerts significant impacts on human health (Ciarelli et al., 2019; Cohen et al., 2017; Lelieveld et al., 2015; Tuet et al., 2017) and climate (Kanakidou et al., 2005), where organic aerosols (OAs) contribute 20 %–90 % (Jimenez et al., 2009; Kanakidou et al., 2005). Unlike the single-component pollutants such as ozone and sulfur dioxide, organic aerosols are composed of numerous compounds from different sources with distinct physical, chemical and toxicological properties (Hallquist et al., 2009; Shrivastava et al., 2017). The situation is even more complicated for secondary organic aerosol (SOA), which is generated from the oxidation of organic gases emitted from a wide range of biogenic and anthropogenic sources and accounts for a dominant fraction of OA (Hodzic et al., 2016; Srivastava et al., 2018). Understanding and identifying the OA sources is therefore important for understanding the implication of aerosols for health and climate and establishing effective mitigation policies.
Large efforts have been devoted to determine OA sources at different scales, mostly based on receptor modeling. Positive matrix factorization (PMF) analysis is often applied to aerosol mass spectrometer data to classify the measured organic mass spectra into different factors. Commonly retrieved factors include hydrocarbon-like OA (HOA) from traffic emissions, biomass burning (BBOA), cooking (COA) and oxygenated components (OOA) (Crippa et al., 2014). Recent studies with long-term offline aerosol mass spectrometer (AMS) measurements were able to further split the OOA component into biogenic SOA and anthropogenic SOA according to their seasonal variability (Daellenbach et al., 2016, 2017; Vlachou et al., 2018).
Air quality models (AQMs) provide another approach to quantify OA sources, with great advantages at high temporal and spatial resolution. Various tools have been developed and implemented in AQMs for regional-scale source apportionment of particulate matter, such as the Particulate Source Apportionment Technology (PSAT) for CAMx (Comprehensive Air quality Model with Extensions) (Koo et al., 2009), tagged species source apportionment (TSSA) (Wang et al., 2009) and the integrated source apportionment method (ISAM) (Kwok et al., 2013) for CMAQ (Community Multiscale Air Quality). However, the performance of these tools for OA source apportionment are always limited by substantial underestimation of SOA by the traditional AQMs (Hodzic et al., 2010; Tsigaridis et al., 2014). One of the most important reasons for the underestimation is the potentially high but unaccounted for contribution of non-traditional vapors. To take these vapors into consideration, the volatility basis set (VBS) scheme has been developed and implemented in several air quality models such as CAMx (Ciarelli et al., 2016, 2017a; Koo et al., 2014), CMAQ (Jathar et al., 2017; Koo et al., 2014; Woody et al., 2016), PMCAMx (Lane et al., 2008; Tsimpidi et al., 2010), CHIMERE (Cholakian et al., 2018; Zhang et al., 2013, 2015), EMEP (Bergström et al., 2012) and WRF-Chem (Ahmadov et al., 2012; Shrivastava et al., 2011, 2013, 2019). The VBS scheme classifies the first-generation oxidation products of vapors according to their volatility. The evolution of these products with aging through functionalization and fragmentation can also be presented by shifting the volatility of compounds (Donahue et al., 2006). It is widely reported that implementing VBS schemes improves the model performance for SOA (Ciarelli et al., 2016; Fountoukis et al., 2014; Koo et al., 2014; Robinson et al., 2007; Tsimpidi et al., 2010). It is however still a challenge to use the VBS scheme together with the source apportionment tools in AQMs. To our knowledge, the VBS scheme in CAMx is currently not enabled to be used with the source apportionment tool PSAT (Ramboll, 2018).
A number of studies have used air quality models with VBS to model OA components or sources on regional scales. Bergström et al. (2012) tested the EMEP model with different VBS setups to calculate the contributions of biogenic and anthropogenic SOA, residential wood combustion and wild fire emissions to OA during 2002–2007 over Europe, and evaluated the source apportionment results with observations at four sites with weekly or daily filter measurements of elemental and organic carbon (EC/OC) and one site with hourly AMS measurements. Yttri et al. (2019) used similar EMEP-VBS including reactions of semi-volatile organic compounds (SVOCs) and intermediate volatility organic compounds (IVOCs) to model OA sources at nine rural sites in Europe, and compared the model output with source apportionment of measured EC/OC by chemical and 14C tracers. Both studies found that residential wood burning was largely underestimated, and required further improvement.
Based on recent chamber experimental studies on wood burning (Bruns et al., 2016), Ciarelli et al. (2017a, b) parameterized a hybrid volatility basis set which included a new set for the oxidation from SVOCs and implemented it in the air quality model CAMx to simulate winter OA sources in Europe. The new parameterization significantly improved the model performance for SOA (Ciarelli et al., 2017a). However, as the biomass burning and biogenic precursors are merged into the same set in the original VBS scheme of CAMx, the biogenic SOA is implicitly taken into account to react with OH in the gas phase, which could lead to overestimated SOA in summer when biogenic emissions are high (Ramboll Environ, 2016).
Skyllakou et al. (2017) extended the PSAT tool in the regional model PMCAMx with VBS to quantify the OA sources in Europe, with a major focus on the source–receptor relationship but less attention on the evaluation of OA predictions against observations. More modeling studies using AQMs with VBS to simulate OA sources are available at the city scale. Woody et al. (2016) used CMAQ-VBS to model the primary organic aerosol (POA) from meat cooking, gasoline and diesel vehicles, biomass burning and other sources in California in May–June in 2010, while the SOA was characterized by formation pathways (including first products of anthropogenic and biogenic VOCs, first products of IVOCs, aging reactions of secondary SVOCs, and anthropogenic and biogenic VOCs) instead of sources. Jathar et al. (2017) simulated the sources of POA and SOA in southern California with an updated CMAQ-VBS with special focus on gasoline and diesel vehicles, and predicted that gasoline vehicles contribute ∼ 35 % of the inland OA which is ∼ 13 times more than diesel sources. However, the contribution of gasoline and diesel vehicle emissions to the total OA in Europe, where the vehicle types have high spatial variations, remains unclear. Results from recent aging studies of diesel and gasoline exhaust (Gentner et al., 2016; Platt et al., 2017; Zhao et al., 2017) have not yet been implemented into models either. Despite all the progress, the parameterization of volatility basis sets in AQMs requires further improvement based on the advance of chamber experimental data, especially for wood burning which was highly underestimated; most modeling studies focus more on the SOA components differentiated by the formation pathways (i.e., from IVOCs, SVOCs), while the sources of SOA are equally important for emission reduction strategies; modeled source apportionment results need further evaluation using measurement data with higher time resolution and longer periods.
In this study, we (i) modified the regional air quality model CAMx with the VBS scheme to differentiate primary and secondary organic aerosols from various sources including gasoline vehicles, old and new diesel vehicles, biomass burning (excluding wild fires), other anthropogenic sources and biogenic sources, (ii) updated the parameterization of the VBS based on recent smog chamber experimental data for residential wood burning and diesel vehicles, with separate sets and parameterization for aging of secondary condensable gases from biomass burning and biogenic sources, (iii) conducted a whole-year simulation in 2011 to calculate the OA concentrations from different primary and secondary sources in Europe and (iv) evaluated the model performance on OA source apportionment by comparing the model results with the PMF analyses of hourly observational data covering nine Aerodyne aerosol chemical speciation monitor (ACSM)/aerosol mass spectrometer (AMS) stations in Europe with measuring periods ranging from 1 month to 1 year.
2.1 Air quality model CAMx
The air quality model CAMx version 6.3 (Ramboll Environ, 2016) was used to simulate OA for the full year 2011. The model domain covers Europe (15∘ W–35∘ E, 35–70∘ N), with a spatial resolution of and 14 terrain-following vertical layers ranging from ∼ 20 m above ground level (first layer) going up to 460 hPa. The Carbon Bond 6 Revision 2 (CB6r2) gas-phase mechanism (Hildebrandt Ruiz and Yarwood, 2013) was selected in this study. The ISORROPIA thermodynamic model (Nenes et al., 1998) was used to simulate gas–aerosol partitioning of inorganic aerosols. For organic aerosols, a modified VBS module by the Paul Scherrer Institute (PSI-VBS) based on the 1.5-dimensional (1.5-D) VBS scheme (Koo et al., 2014) was used to model the formation and evolution of OA. The meteorological parameters were produced with the Weather Research and Forecasting model (WRF, version 3.7.1; Skamarock et al., 2008), based on the 6 h European Centre for Medium-range Weather Forecasts (ECMWF) reanalysis global data with a resolution of (Dee et al., 2011). The initial and boundary conditions for the concentrations of chemical species were obtained from the global model MOZART-4/GEOS-5 (Horowitz et al., 2003). The Total Ozone Mapping Spectrometer (TOMS) data by the National 25 Aeronautics and Space Administration (NASA: https://acd-ext.gsfc.nasa.gov/anonftp/toms/omi/data/Level3e/ozone/, last access: 6 December 2019) was adopted for the input of ozone column densities, and the photolysis rates were calculated by the Tropospheric Ultraviolet and Visible (TUV) Radiation Model version 4.8 (NCAR, 2011). A more detailed description of the inputs of meteorology, photolysis and initial and boundary conditions is found in Jiang et al. (2019). The simulation period was between 1 January and 31 December 2011 with the first 2 weeks being used as spin-up. We performed the simulations using both the standard (BASE) and modified (NEW) parameterization in the VBS module.
2.2 VBS parameterization
2.2.1 Extended volatility basis sets
The 1.5-D VBS framework in CAMx is based the one-dimensional (1-D) VBS, in which the organic species are grouped only by their volatility (Donahue et al., 2006). The 1-D VBS was later extended to a second dimension (2-D) to include the oxidation state – specifically O : C ratio (Donahue et al., 2011). In order to reduce the high computational burden of the 2-D VBS when implemented in chemical transport models, the 1.5-D VBS was developed, which combines the 1-D VBS and the multiple reaction trajectories defined in the 2-D VBS space; it can therefore account for changes in both volatility and oxidation state (Koo et al., 2014). The default VBS scheme of CAMx version 6.3 includes five basis sets to describe the oxidation process of OA: three sets for freshly emitted OA from biomass burning (PFP, Particle Fire Primary), cooking (PCP, Particle Cooking Primary) and other anthropogenic (PAP, Particle Anthropogenic Primary), and two basis sets for chemically aged oxygenated OA from anthropogenic (PAS, Particle Anthropogenic Secondary) and biogenic (PBS, Particle Biogenic Secondary) emissions. For the PAS set, the OA generated from gasoline vehicles (GVs), diesel vehicles (DVs) and other anthropogenic activities (OP) are parameterized according to volatility distributions, yields and vaporization enthalpies reported in the literature, and then merged to PAS. A similar treatment is adopted for secondary OA from biomass burning, cooking and biogenic sources, which are merged together as PBS.
The VBS scheme has been modified in previous studies to improve the performance of air quality models. For example, Shrivastava et al. (2013, 2015) treated SOA as a non-absorbing semisolid with low “effective volatility” and added the fragmentation reactions. Using this method in the regional model CHIMERE, it was found that fragmentation could effectively reduce the SOA formation when further aging of biogenic SOA was allowed, leading to a better agreement with observations (Cholakian et al., 2018). Instead of a major modification of the chemical mechanism, our study aims at modifying the 1.5-D VBS framework of CAMx to enable source apportionment of OA in Europe. As the first step to separate the modeled OA components, the standard 5 basis sets were split into 11 basis sets including primary and secondary OA from five sources, i.e., new diesel vehicles (DNs, with and after Euro 4) equipped with diesel particle filter (DPF), old diesel vehicles (DOs, before Euro 4) without DPF, GV, biomass burning (BB) and other anthropogenic sources (OthA), as well as SOA from biogenic sources (BIO). The schematic diagram of the VBS with the modified basis sets (it will be referred to as PSI-VBS thereafter) is shown in Fig. 1. Due to lack of emission data, OA from cooking emissions was excluded in this study. Instead of merging OA from different sources as done in the default CAMx-VBS, we added the species in the 11 basis sets to the species list of model output to distinguish the OA sources. The new PSI-VBS scheme was then tested with the standard parameterization of CAMx version 6.3 (BASE) and a modified parameterization (NEW) based on recent experimental findings.

Figure 1Schematic diagram of the default (left, with 4 sets) and the modified VBS module in this study (PSI-VBS) with extended basis sets (right, with 11 sets). The numbers 0–4 in the species names present the five volatility bins ranging from 10−1 to 103 µg m−3 in saturation vapor concentration (C*) at 298 K. The numbers in the grey boxes indicate the number of basis sets (4 sets for default CAMx-VBS, and 11 sets for CAMx-NEW). The primary organic aerosol (POA) components are oxidized to POA and SOA in the next lower volatility bins (shown as dashed arrows). The same reaction scheme but different volatility distribution and yields parameters are adopted for the anthropogenic sources DO, DN, GV and OthA. The parameterization of DO, GV and OthA follows the default values in CAMx-VBS. The modified parameterization CAMx-NEW enables the aging of secondary biomass burning vapor (brown dashed arrows in the BB box). The set of cooking (PCP) is not presented in CAMx-VBS due to missing cooking emission input in this study.
2.2.2 Standard parameterization: BASE
The BASE parameterization contains the default parameters of the CAMx (version 6.3) VBS module. The same parameterization (volatility distribution, yields, reaction rates of VOC/IVOC precursors and primary/secondary condensable gases) of the standard set PAS was used for the secondary OA from DO, DN, GV, OthA, as well as the PAP for the primary OA from DO, DN, GV, OthA. The primary and secondary BB and BIO followed the same parameterization as PFP and PBS, respectively. The aging of biogenic SOA was disabled in the standard parameterization as it led to significant overestimation of OA in rural areas in previous modeling studies (Ramboll Environ, 2016). As the biomass burning and biogenic SOA belong to the same PBS set and use the same parameterization in the default version, the aging of biomass burning SOA was also disabled in BASE.
2.2.3 Modified parameterization: NEW
In the NEW case, we used a modified parameterization based on smog chamber experimental studies. The major changes were made for diesel vehicles and biomass burning. Diesel vehicles constitute nearly half of the total passenger car registrations in Europe (ACEA, 2017). Diesel vehicle emissions were traditionally considered more efficient in generating SOA than gasoline exhaust (Gentner et al., 2012). However, the vehicles equipped with a diesel particle filter (DPF) were found to effectively reduce SOA production (Gentner et al., 2016; Gordon et al., 2013; Platt et al., 2017). In Europe, DPFs have been implemented in some diesel vehicles since Euro 4 in 2005 and have been required for all diesel vehicles since Euro 5 in 2009. Due to a large share of diesel vehicles equipped with DPF, we set the SOA yield for the basis set DN (diesel vehicle – new) to zero. Residential biomass burning is among the largest winter OA sources in Europe (Crippa et al., 2014; Lanz et al., 2010). Models generally underestimate OA from biomass burning (Ciarelli et al., 2017a; Hodzic et al., 2010; Jathar et al., 2014; Shrivastava et al., 2015). While the standard VBS of CAMx disables the aging of SOA for the basis set PBS (biomass burning and biogenic sources) to avoid overestimation of biogenic SOA, the separated sets for biomass burning (BB) and biogenic (BIO) allow us to implement individual parameterization schemes. Therefore, we kept the default parameterization (without aging of SOA) for BIO sources as a compromise for the lack of gas-phase fragmentation, and enabled the oxidation of secondary gases from biomass burning (see BB in Fig. 1) with a reaction rate of cm3 molec.−1 s−1 according to previous studies (Ciarelli et al., 2017a, b; Denier van der Gon et al., 2015; Fountoukis et al., 2014; Murphy and Pandis, 2009; Theodoritsi and Pandis, 2019). For other basis sets, the default parameters of CAMx v6.3 were used.
2.3 Emissions
The anthropogenic emissions were based on the high-resolution European emission inventory TNO-MACC (Monitoring Atmospheric Composition and Climate)-III, which is an extension of the TNO-MACC-II (Kuenen et al., 2014). The annual emissions of non-methane volatile organic compounds (NMVOCs), SO2, NOx, CO, NH3, PM10 and PM2.5 were hourly distributed using the TNO temporal variation profiles. The particulate matter emissions were split into POA, elemental carbon (EC), sodium (Na+), particle sulfate (), and other primary particles in the fine (FPRM) and coarse (CPRM) size fractions according to the TNO PM-splitting profile. The NMVOC speciation was performed using the approach of Passant (2002) to generate emissions of 20 NMVOC species including toluene, xylene and benzene. The TNO-MACC-III emission inventory includes anthropogenic emissions from 10 SNAP (Selected Nomenclature for Air Pollution) source categories: energy industries (SNAP 1), residential and other non-industrial combustion (SNAP 2), industry combustion and processes (sum of SNAP 3 and SNAP 4), extraction and distribution of fossil fuels (SNAP 5), product use (SNAP 6), road transport (SNAP 7), non-road transport and other mobile sources (SNAP 8), waste treatment (SNAP 9) and agriculture (SNAP 10). Additional SNAP 7 emissions were provided by TNO, which include more detailed classification of gasoline and diesel vehicles (before Euro 4 and for Euro 4 and higher emission standards), liquefied petroleum gas vehicles, vehicles evaporation and brake wear. To match the requirement of the modified VBS module, we reclassified the diesel vehicles before and after (including) Euro 4 as OLD and NEW diesel vehicles (DO and DN), respectively. All the other emissions from road traffic such as vehicular evaporation and brake wear were attributed to the “other anthropogenic (OthA)” due to the lack of information to conduct a specific parameterization. The POA from residential combustion (SNAP 2) and agriculture (SNAP 10, mainly from on-field burning of stubble and straw) were summed up to represent POA from biomass burning as justified in Ciarelli et al. (2017a). The wildfires are not included in the biomass burning.
The intermediate-volatility and semi-volatile organic compounds (IVOCs and SVOCs) are considered as important precursors of SOA (Jathar et al., 2011, 2014), but they are generally absent in current emission inventories. Here we estimated the IVOC emissions from different sources based on literature (Table S1). The IVOCs from gasoline and diesel vehicles were calculated as 25 % and 20 % of NMVOC emissions from gasoline and diesel vehicles, respectively, according to the gas-phase carbon-balance analysis of Jathar et al. (2014). IVOC emissions from biomass burning were estimated as 4.5 times POA emissions based on Ciarelli et al. (2017a). For other anthropogenic sources, the IVOC emissions were calculated as 1.5 times POA as proposed by Robinson et al. (2007), which has been widely adopted by modeling studies (Jathar et al., 2017; Woody et al., 2016). The VBS scheme assumes that a certain fraction of POA can evaporate and be distributed in the semi-volatile range (saturation concentration between 0.1 and 1000 µg m−3), while most of the emission inventories only include POA in the particle phase. According to the partitioning theory (Donahue et al., 2006), the ratio between gas and particle phase in the semi-volatile range is roughly 3, and therefore many modeling studies increase the POA emissions by a factor of 3 to compensate for the missing SVOCs (Ciarelli et al., 2017a; Shrivastava et al., 2011; Tsimpidi et al., 2010). This approach agrees well with the emission study in Europe which shows that the revised residential wood combustion emissions accounting for the semi-volatile components are higher than those in the previous inventory by a factor of 2–3 on average (Denier van der Gon et al., 2015). However, Denier van der Gon et al. (2015) also pointed out that this factor presents substantial inter-country variability due to different combustion types, fuel parameters and operation conditions, indicating a potential over- or underestimation for a specific area by using the factor of 3 in the whole domain. To investigate the role of SVOC, we adopted the approach to increase POA emissions by a factor of 3 in NEW, while keeping the POA unchanged in BASE.
Biogenic emissions (isoprene, monoterpenes, sesquiterpenes, soil NO) were estimated by the PSI model developed at the Laboratory of Atmospheric Chemistry at the Paul Scherrer Institute (Andreani-Aksoyoglu and Keller, 1995) and further improved by Oderbolz et al. (2013) and Jiang et al. (2019). A comparison study with the widely used biogenic Model of Emissions of Gases and Aerosols from Nature (MEGAN) version 2.1 indicated that the PSI model produces higher monoterpene emissions in Europe than MEGAN, and leads to a better performance of CAMx for OA (Jiang et al., 2019).
2.4 Model evaluation
As the performance of CAMx strongly depends on the quality of the meteorological inputs, we first evaluated the meteorological parameters (surface temperature, wind direction, wind speed, precipitation) modeled by WRF as described in Jiang et al. (2019) using observations obtained from the UK Met Office Integrated Data Archive System (MIDAS) Land Surface Stations database (Meteorological Office, 2013). It covers ∼ 1000 stations in Europe and provides observations at 3 h time resolution. The model performance criteria used for meteorological parameters (Emery, 2001) are shown in Table S2. The general model performance for the main gas-phase species (i.e., O3, SO2, NOx, CO) and fine particulate matter PM2.5 was also evaluated using the hourly measurements extracted from the European Environment Agency database, AirBase v7 (Mol and Leeuw, 2005). The statistical analysis was conducted by means of mean bias (MB), mean gross error (MGE), root-mean-square error (RMSE), mean fractional bias (MFB), mean fractional error (MFE), index of agreement (IOA) and correlation coefficient (r) between measured and modeled results. For ozone, only measurements at the background-rural stations were used in the model evaluation to reduce the possible uncertainties caused by the model resolution.
Table 1Coordinates, observation periods and PMF related information of stations.
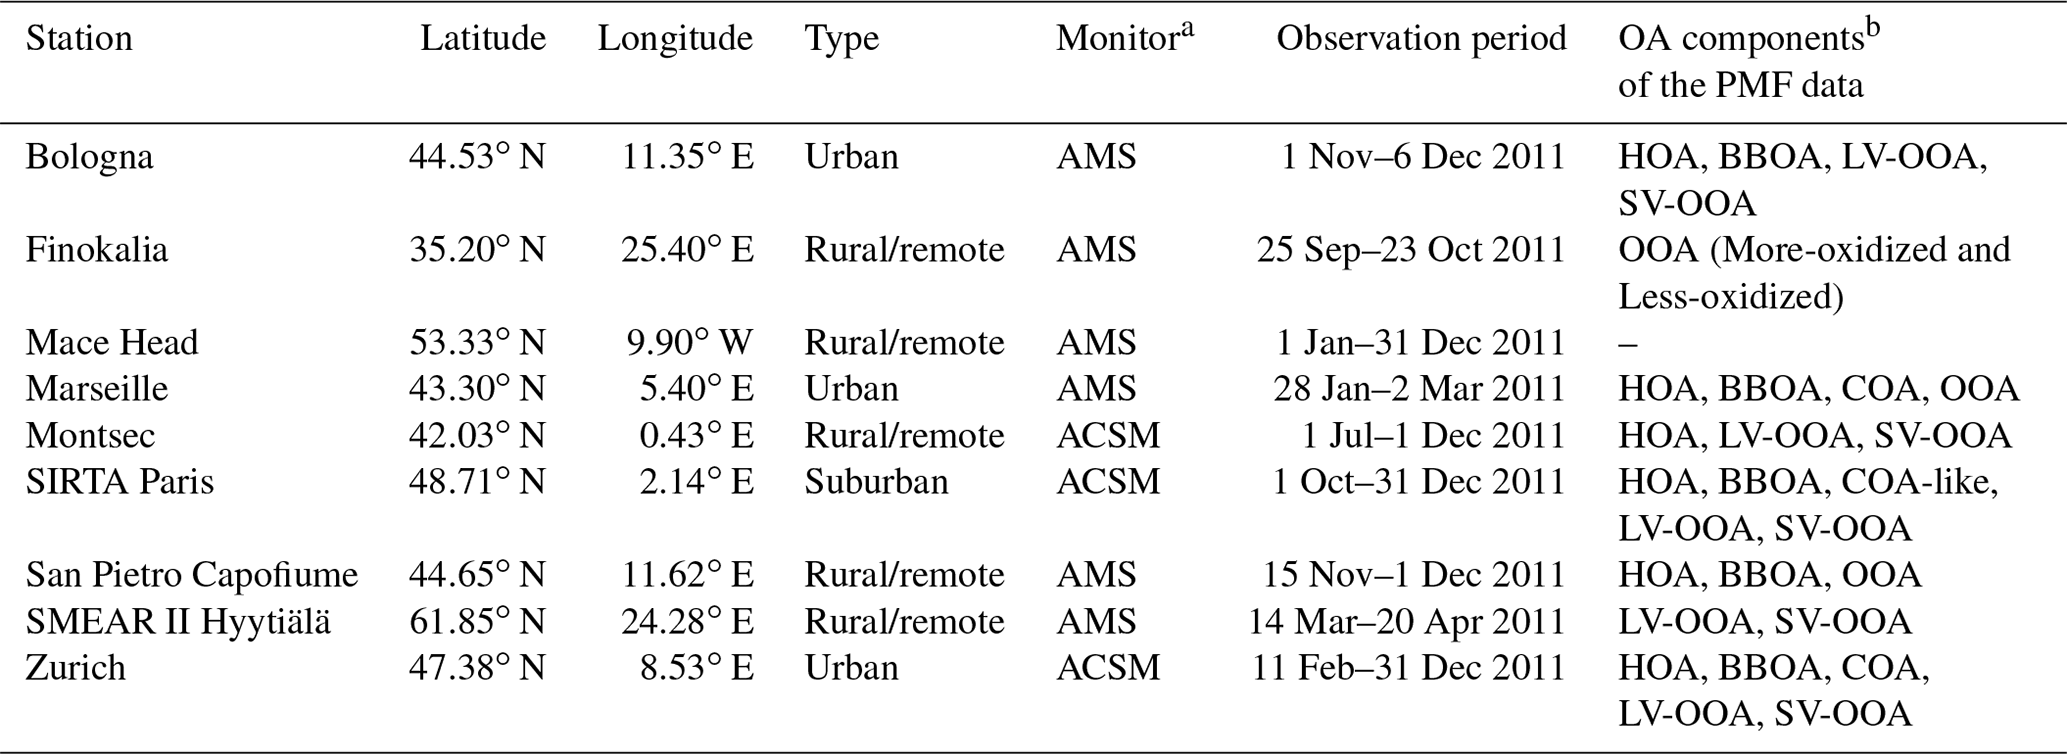
a AMS: Aerodyne aerosol mass spectrometer; ACSM: Aerodyne aerosol chemical speciation monitor. b LV-OOA: low-volatility oxygenated organic aerosol; SV-OOA: semi-volatile oxygenated organic aerosol.
The model performance for OA from different sources in Europe was evaluated using the OA measurements and source apportionment studies using positive matrix factorization (PMF) analysis, covering nine ACSM/AMS stations over Europe: Zurich (Canonaco et al., 2013), Mace Head (Ovadnevaite et al., 2014; Schmale et al., 2017), Montsec (Ripoll et al., 2015), Bologna (Paglione et al., 2019) and San Pietro Capofiume (SPC) (Gilardoni et al., 2014), Paris SIRTA (Site Instrumental de Recherche par Télédétection Atmosphérique) (Petit et al., 2015), Marseille (Bozzetti et al., 2017), Finokalia (as continuation of Hildebrandt et al., 2010), and SMEAR (Station for Measuring Forest Ecosystem–Aerosol Relations) II Hyytiälä (Kortelainen et al., 2017). The types and locations as well as the measurement periods of stations are displayed in Table 1 and Fig. S1. The meteorological measurements for Paris, Marseille and Finokalia were obtained from the UK Met Office Integrated Data Archive System (MIDAS) Land Surface Stations database (Meteorological Office, 2013), for Zurich from the automatic monitoring network of MeteoSwiss (ANETZ) and for the other stations the meteorological data measured at or near the stations were provided by the measurement groups.
3.1 Model evaluation
3.1.1 Meteorological parameters and major air pollutants
Modeled and measured meteorological parameters showed good agreement (Table S2). Most of the parameters fulfill the criteria for meteorological model performance (Emery, 2001) except surface temperature in winter (underestimated by about 1 ∘C) and the wind direction in summer. Most of the stations where surface temperature underestimation occurs are located in the Alpine regions and the Baltic coast, and the high bias of wind direction mostly occurs in the Mediterranean region, with a limited influence on the whole domain.
The model performance for the major air pollutants such as O3, NO2, SO2 and PM2.5 is presented in Table S3. As the modified parameterization for OA has a negligible impact on the gas species, the statistical results of the gaseous pollutants are displayed only for the NEW case while the results for PM2.5 are shown for both the BASE and NEW cases. For both winter and summer, the recommended model performance criteria and goals (Table S4, based on Boylan and Russell, 2006, and EPA, 2007) were met for PM2.5 (both BASE and NEW) and ozone. The NO2 concentrations were underestimated (MFB −35 % for the annual average), as reported by other European modeling studies as well (Bessagnet et al., 2016; Ciarelli et al., 2016; Knote et al., 2011; Oikonomakis et al., 2018), and might be related to underestimated emissions. The SO2 concentrations were overestimated with a mean bias of 5.9 ppb (4.4 ppb in summer – 7.4 ppb in fall). The highest overestimation occurred at sites with high SO2 emissions, e.g., harbors and Eastern Europe. One reason could be the accumulation in the first layer, since the SO2 emissions were all injected to the first layer of the model, which might be too low for point source emissions from high stacks. The high uncertainties in ship emissions could be another reason for the overestimated SO2 concentrations (Aksoyoglu et al., 2016). Overall, the model performance for the major air pollutants was comparable to the results of other modeling studies in Europe performed in the framework of the EURODELTA III exercise (Bessagnet et al., 2016).
Table 2Statistical analysis of daily average organic aerosols calculated by the standard (BASE) and modified (NEW) parameterization at nine ACSM/AMS stations. MB: mean bias; MGE: mean gross error; RMSE: root-mean-square error; MFB: mean fractional bias; MFE: mean fractional error.
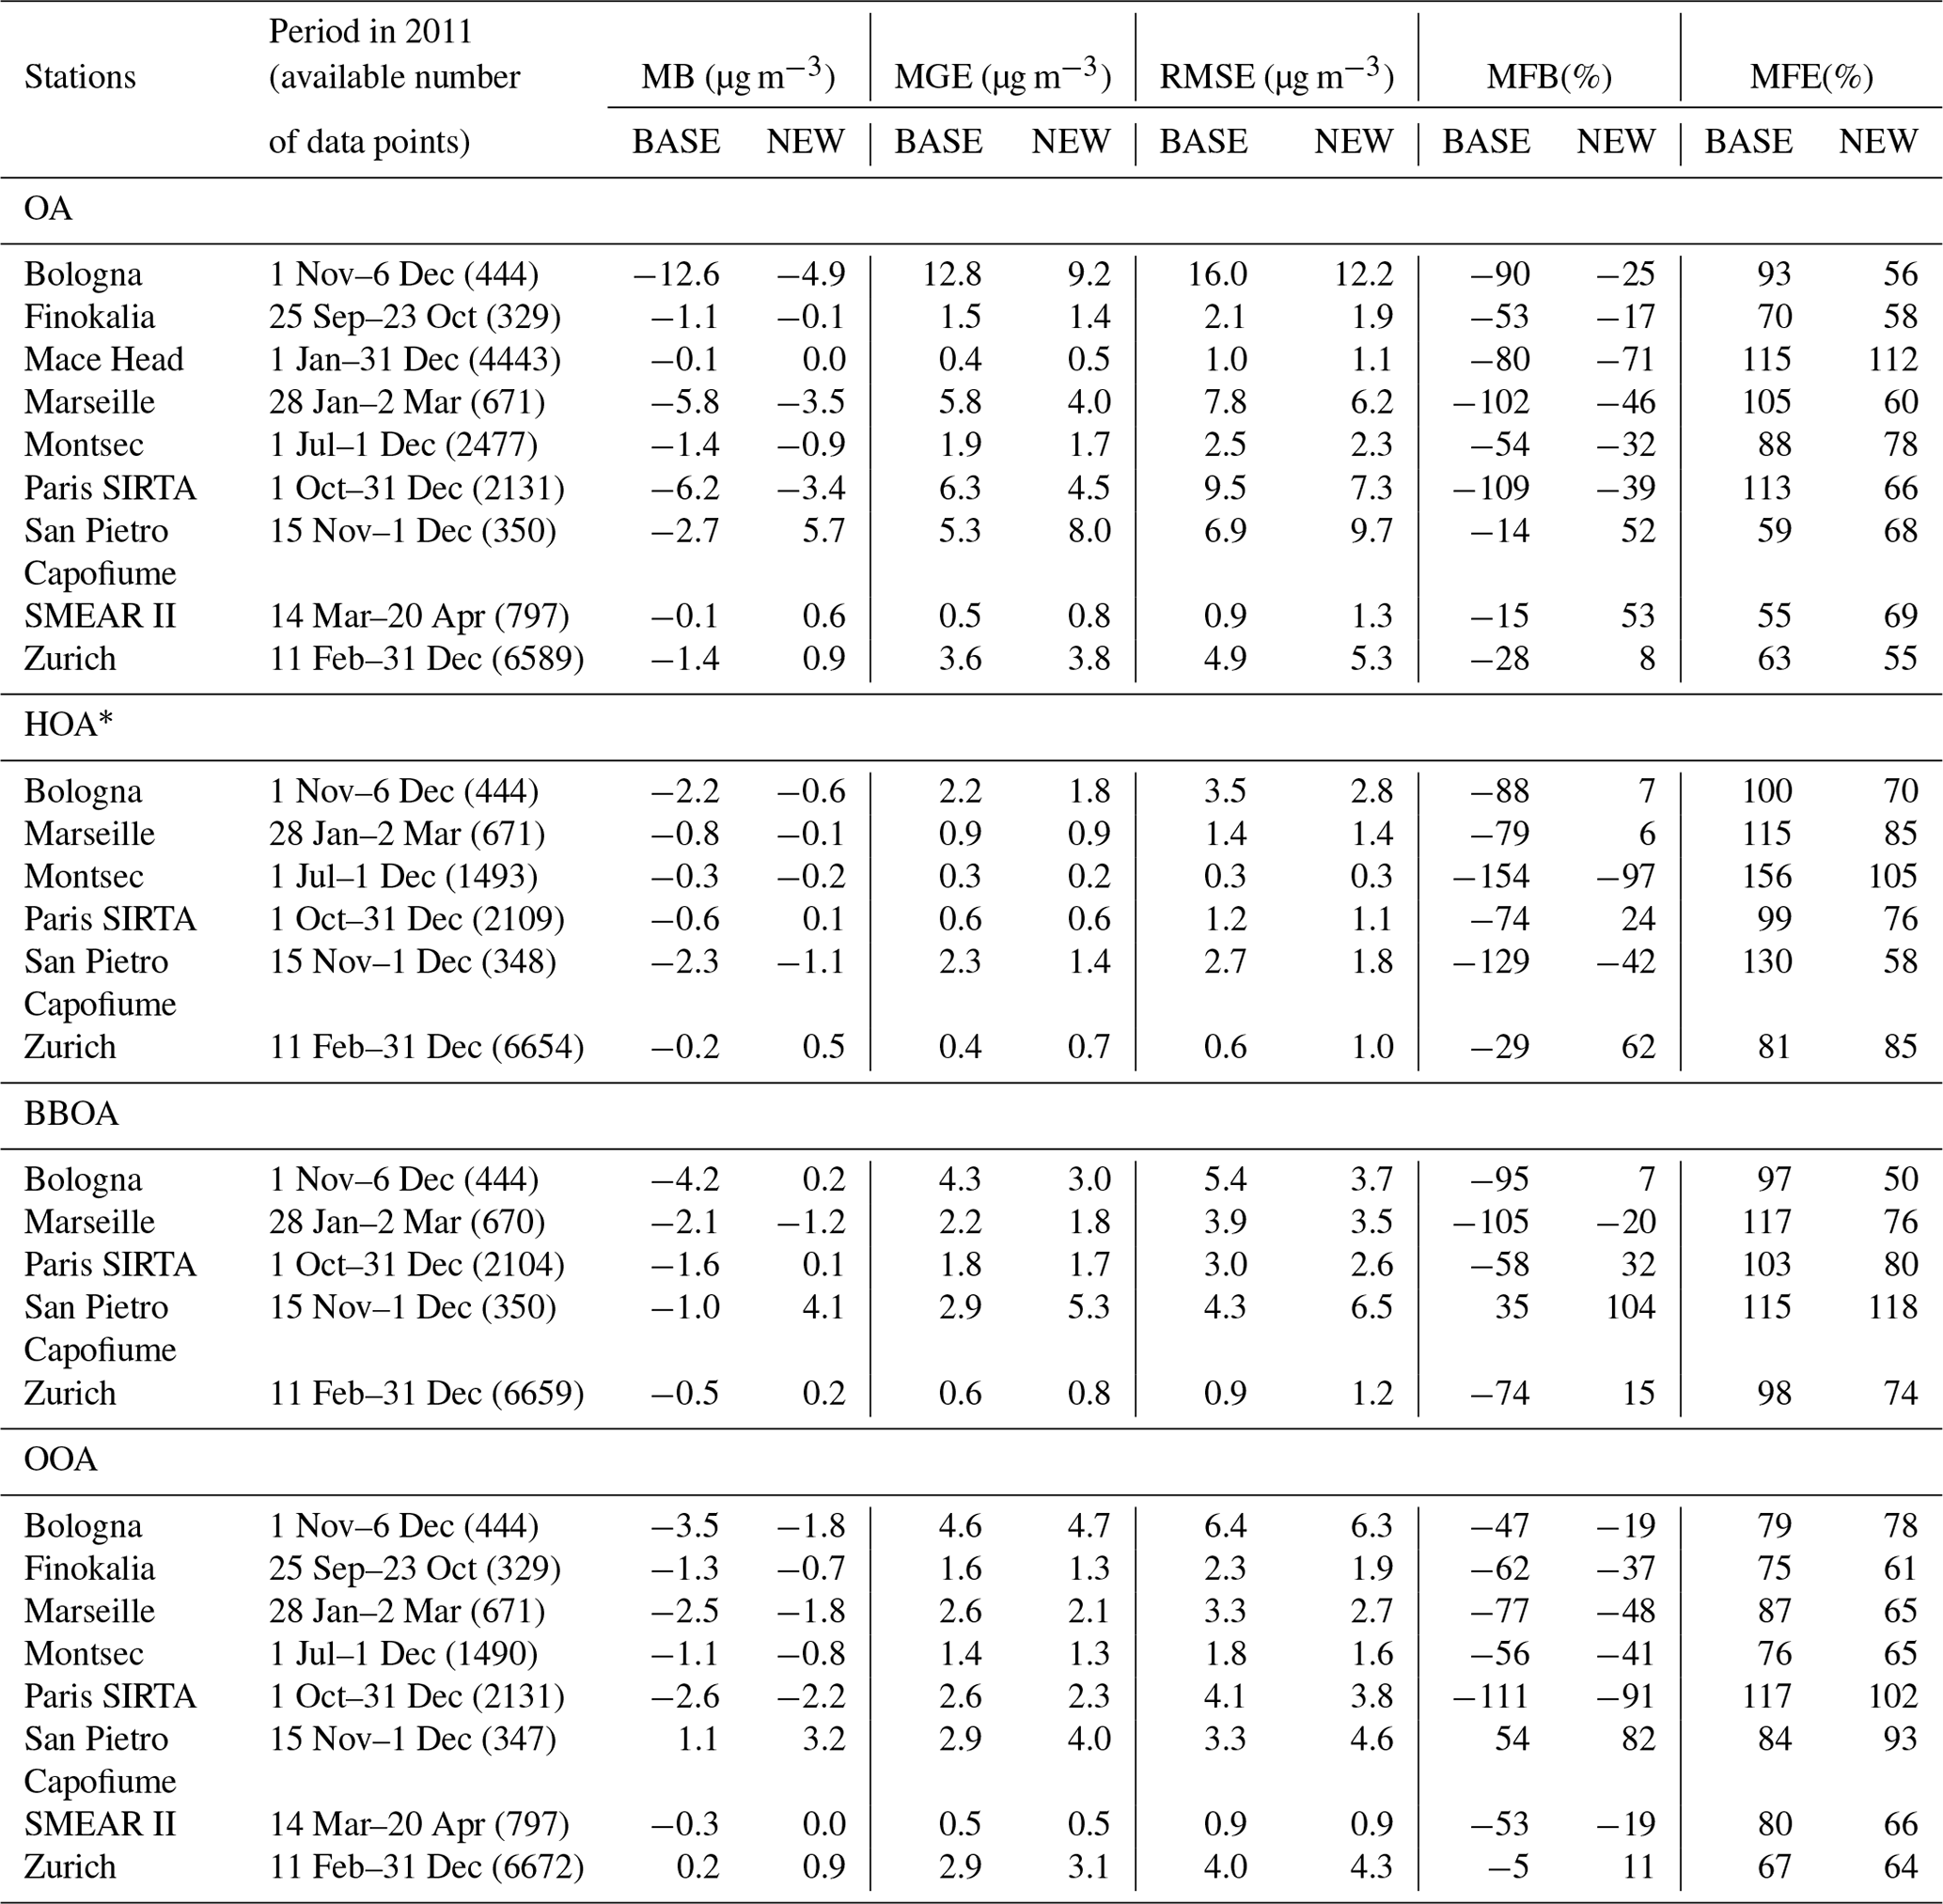
* HOA and BBOA were too low in Finokalia and SMEAR II to be resolved in the PMF analysis.
3.1.2 Total organic aerosol
We evaluated the model results for OA and its components calculated both with the standard parameterization (BASE) and with the modified VBS module (NEW) using the measurements available at nine ACSM/AMS stations (Table 2). There were two main differences between the two cases: (i) the BASE case used the standard POA emissions, while in the NEW case, POA emissions were 3 times higher, and (ii) the further aging of secondary biomass burning gases was enabled in the NEW case. In the NEW case, OA concentrations are higher, leading to a decreased mean bias (by 0.5 to 7.7 µg m−3) between modeled and measured OA at most sites except for San Pietro Capofiume and SMEAR II. As a consequence of major changes in the parameterization related to biomass burning and road traffic, the improvement in model performance is more significant at sites close to urban areas where the contribution of anthropogenic sources is relatively higher, e.g., Marseille (urban background site, located in a park near the city center), Paris SIRTA (suburban background site, located 25 km southwest of central Paris) and Bologna (urban background site, located at the northwestern edge of the city, surrounded by distributed industrial and agricultural activities and major highways), with a reduction in MFE from 37 % in Bologna to 47 % in Paris SIRTA. For another urban background site, Zurich, the NEW parameterization led to a decrease in the MB (by 0.5 µg m−3), MFB (by 20 %) and MFE (by 8 %), while RMSE and MGE slightly increased by 0.4 and 0.2 µg m−3, respectively. For the rural/remote sites, the CAMx-NEW reduced the MFE by 3 % to 12 % for Mace Head, Montsec and Finokalia, but it led to an overestimation at SPC and SMEAR II.
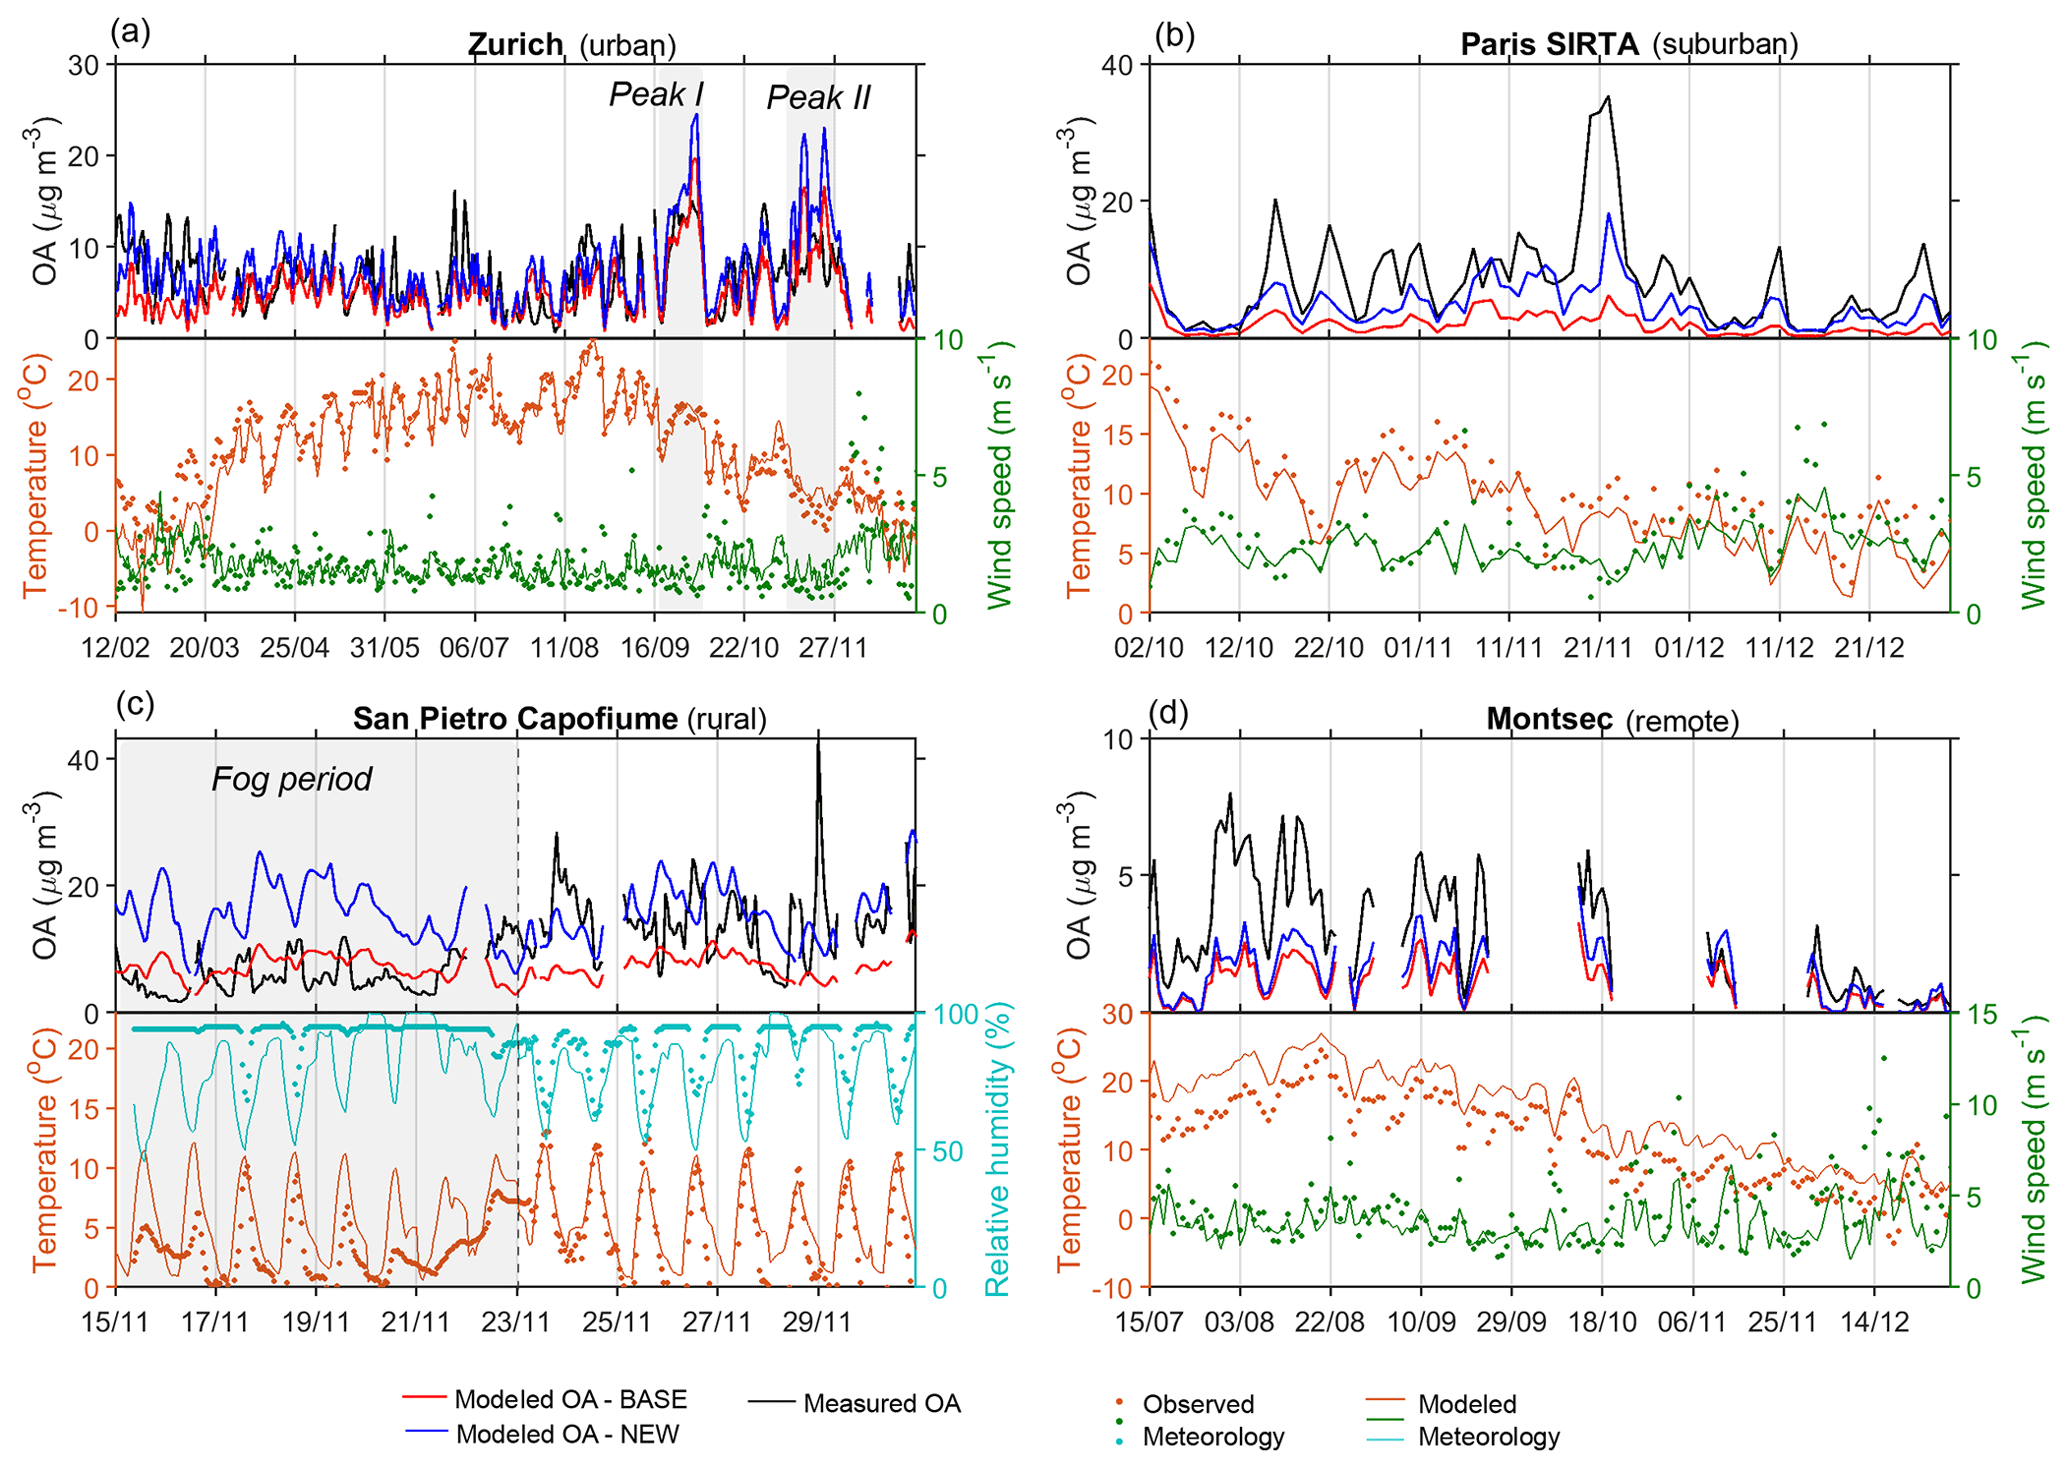
Figure 2Temporal variations of modeled (with both BASE and NEW parameterizations) and measured organic aerosol concentration together with some meteorological parameters available at each station (dotted line: measurements, solid line: model). Hourly OA concentrations were used for San Pietro Capofiume, while daily average OA concentrations were used for the other stations.
In order to further investigate the reasons for different model performance at different sites, the temporal variations of modeled OA for CAMx-BASE and CAMx-NEW were compared with the measurements (Figs. 2, S2). We selected four stations to represent different site types, i.e., Zurich as an urban (background) station, Paris SIRTA as a suburban station, SPC as a rural station and Montsec as a remote station. Among the four sites, measurements in Zurich cover almost the whole year of 2011, while measurements at other stations took place mostly in autumn and winter periods. The modeled OA concentrations in Zurich matched the measurements quite well except in winter, when the model underestimated OA with the BASE parameterization (Fig. 2a). In addition, there was a significant underestimation of temperature, which was expected to increase the modeled OA via enhanced condensation, indicating that the predicted OA concentrations would have been even lower if the modeled temperature had been higher. Including the reactions of SVOCs and further aging of secondary condensable gases for biomass burning sources in CAMx-NEW, the model performance in winter was effectively improved by increasing the OA concentrations by ∼ 100 % compared to CAMx-BASE during February and March. Nevertheless, CAMx-NEW led to an overestimation of OA in September and November, which influenced the overall performance of NEW. The two peaks in fall were largely due to the SOA from biogenic emissions, according to our previous work comparing the effects of two different biogenic emission models on OA (Jiang et al., 2019). Paris SIRTA is among the sites with best improvement of the predicted OA. In spite of the underestimation, the modeled OA reproduced the temporal evolution of the major peaks during the measurement period, and the OA by CAMx-NEW is about ∼ 1.4 times higher than CAMx-BASE (Fig. 2b) The highest peak during 19–24 November was related to an air mass from the south–southeast (SSE) with a recirculation over northern France, which is dominated by a wood burning source (Petit et al., 2015).

Figure 3Seasonal variation of PMF analysis results and modeled OA components (with both BASE and NEW parameterizations). The average of modeled OA components was calculated based on the data during the same periods with measurements at each stations as shown in Table 1. ZRH: Zurich, SMEARII: SMEAR II Hyytiälä, MSA: Montsec, BLQ: Bologna, SPC: San Pietro Capofiume, SIRTA: Paris SIRTA, FKL: Finokalia, MRS: Marseille. Spring: March–April–May, summer: June–July–August, autumn: September–October–November, winter: December–January (2011)–February (2011). See Table S5 for seasonal-based statistical results.
At the rural site, SPC, a distinction can be seen before and after 23 November (Fig. 2c). Both CAMx-BASE and CAMx-NEW overestimated the OA before 23 November. Located in the Po Valley, OA at SPC is significantly influenced by fog scavenging processes during autumn when the high relative humidity and low temperature lead to frequent fog events (Gilardoni et al., 2014). Due to the coarse resolution and special geographical location of SPC, the meteorological model failed to reproduce the extremely high relative humidity during the fog events, leading to an overestimation of OA as particle activation into fog droplets, and eventually wet scavenging, are not adequately captured by the model. A better agreement with the observed OA was found for CAMx-NEW than CAMx-BASE after 23 November, when fog events were shorter.
For comparison with the observations at the high-altitude (∼ 1570 m above sea level) station Montsec, we used the model results from the fifth vertical layer. Generally, air quality model results are poorly reproduced at high-altitude sites due to domain resolution. Although the NEW parameterization increased the OA by 35 %, the OA concentrations were still largely underestimated during July to September (Fig. 2d). The temporal variation of OA in Montsec is mainly influenced by the special meteorological conditions and the local planetary boundary layer (PBL) height. Especially in summer, the higher temperature and solar radiation enhances the growth of PBL and transport of OA to high elevation (Ripoll et al., 2015).
3.2 Comparison against PMF results
The modeled OA components were evaluated using AMS/ACSM measurements analyzed with PMF at different stations (Table 1). The statistical results are presented in Table 2. The CAMx-NEW led to a better agreement between the modeled and measured primary OA at most sites, except in Zurich (where HOA and BBOA tended to be overestimated by CAMx-NEW and underestimated by CAMx-BASE). In general, the NEW parameterization improved the underestimation of OOA by reducing the mean bias by 0.3 µg m−3 (SMEAR II) to 1.7 µg m−3 (Bologna), while increasing the mean bias at Zurich and SPC where OOA concentrations were overestimated by both CAMx-BASE and CAMx-NEW. To better understand the different model performance, the modeled and measured OA components were compared separately for the four different seasons (Fig. 3). The overestimation of OOA in autumn at SPC was largely due to the absence of fog droplet activation in the model as discussed in Sect. 3.1.2. In spite of the overestimation for the whole period, the winter OOA at Zurich was still underestimated by 73 % (BASE) and 64 % (NEW). The underestimation of winter OOA was also found at all the other studied sites (Marseille, Bologna and Paris SIRTA), while the summer OOA showed good agreement with the PMF results (Fig. 4a and d), indicating a possible underestimation of SOA from biomass burning (Gilardoni et al., 2014, 2016; Paglione et al., 2019; Qi et al., 2019). The NEW parameterization improved the OA modeling by increasing winter OOA by 29.3 % (SIRTA) to 41.7 % (Bologna). Compared to the modeled BBOA (Fig. 4b and e) and HOA (Fig. 4c and f) which were improved considerably by using the NEW parameterization, the SOA modeling still needs to be improved.
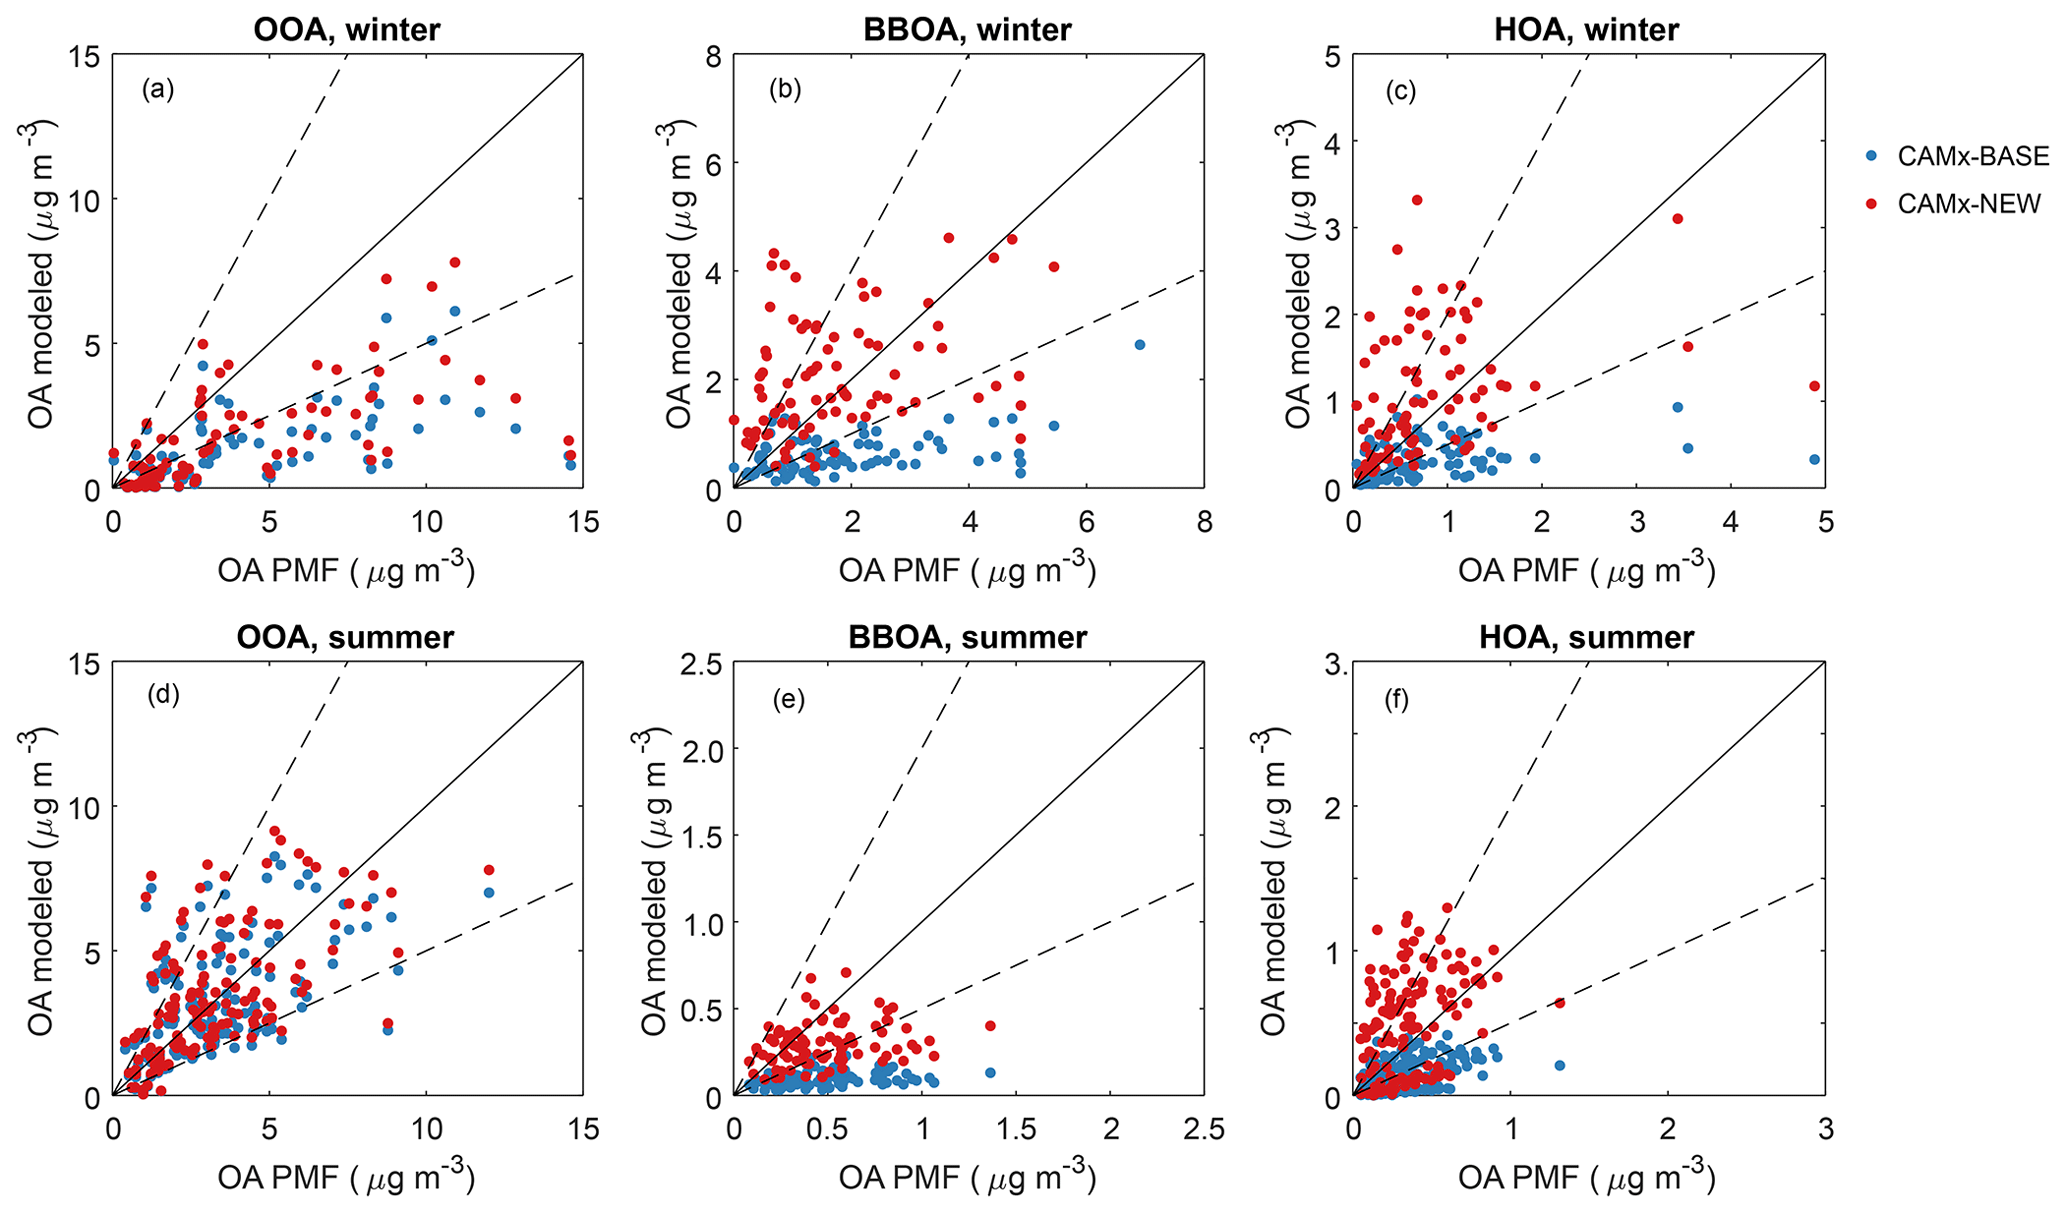
Figure 4Comparison between modeled daily average and PMF analysis results in winter and summer. The summer data include measurements at Zurich and Montsec, and the winter data include measurements at Zurich, Marseille, Bologna and SIRTA.
A more detailed comparison between the temporal variations of the OA components obtained by CAMx-NEW and PMF is presented in Figs. 5 and S3. As an example of an urban background site, at Zurich, the contributions of POA and SOA from different sources generally agree well with the PMF results. The OOA from biogenic sources (OOA-BIO) begins to increase from April, when the biogenic emissions increased with increasing temperature and biomass density (Fig. 5a), similar to the semi-volatile oxygenated organic aerosol (SV-OOA) by PMF (Fig. 5b), which is mainly produced from biogenic precursor gases in summer (Canonaco et al., 2015). However, for the winter period, the modeled contribution of BBOA is much higher than the PMF results, whereas the contribution of the total OOA is underestimated. This may be partly linked to uncertainties in PMF analysis for discriminating BBOA and OOA (Crippa et al., 2013; Petit et al., 2014). At some sites (e.g., Paris SIRTA), biomass burning emissions could also have substantial contributions to the HOA and/or COA-like PMF factors (Petit et al., 2014; Olivier Favez, personal communication, 2019; Zhang et al., 2019). It might also indicate the need for further improvement to the model parameterization of the biomass burning sector. For the remote site Montsec, despite the underestimated total OA (Fig. 2d, largely due to meteorological conditions), the contributions of the OA components are close to the PMF results (Fig. 5c, d). BBOA was not identified in the PMF study during the investigated period, while the modeled results show an average mass fraction of 13 %. SOA dominated the OA fraction for both modeled and PMF results, with a ratio of 87 % and 78 %, respectively. OOA from biogenic sources constitutes the largest OA fraction (∼ 53 %) according to the modeled results, which is in agreement with the previous findings in the Mediterranean forested area of Montseny (Ripoll et al., 2015).
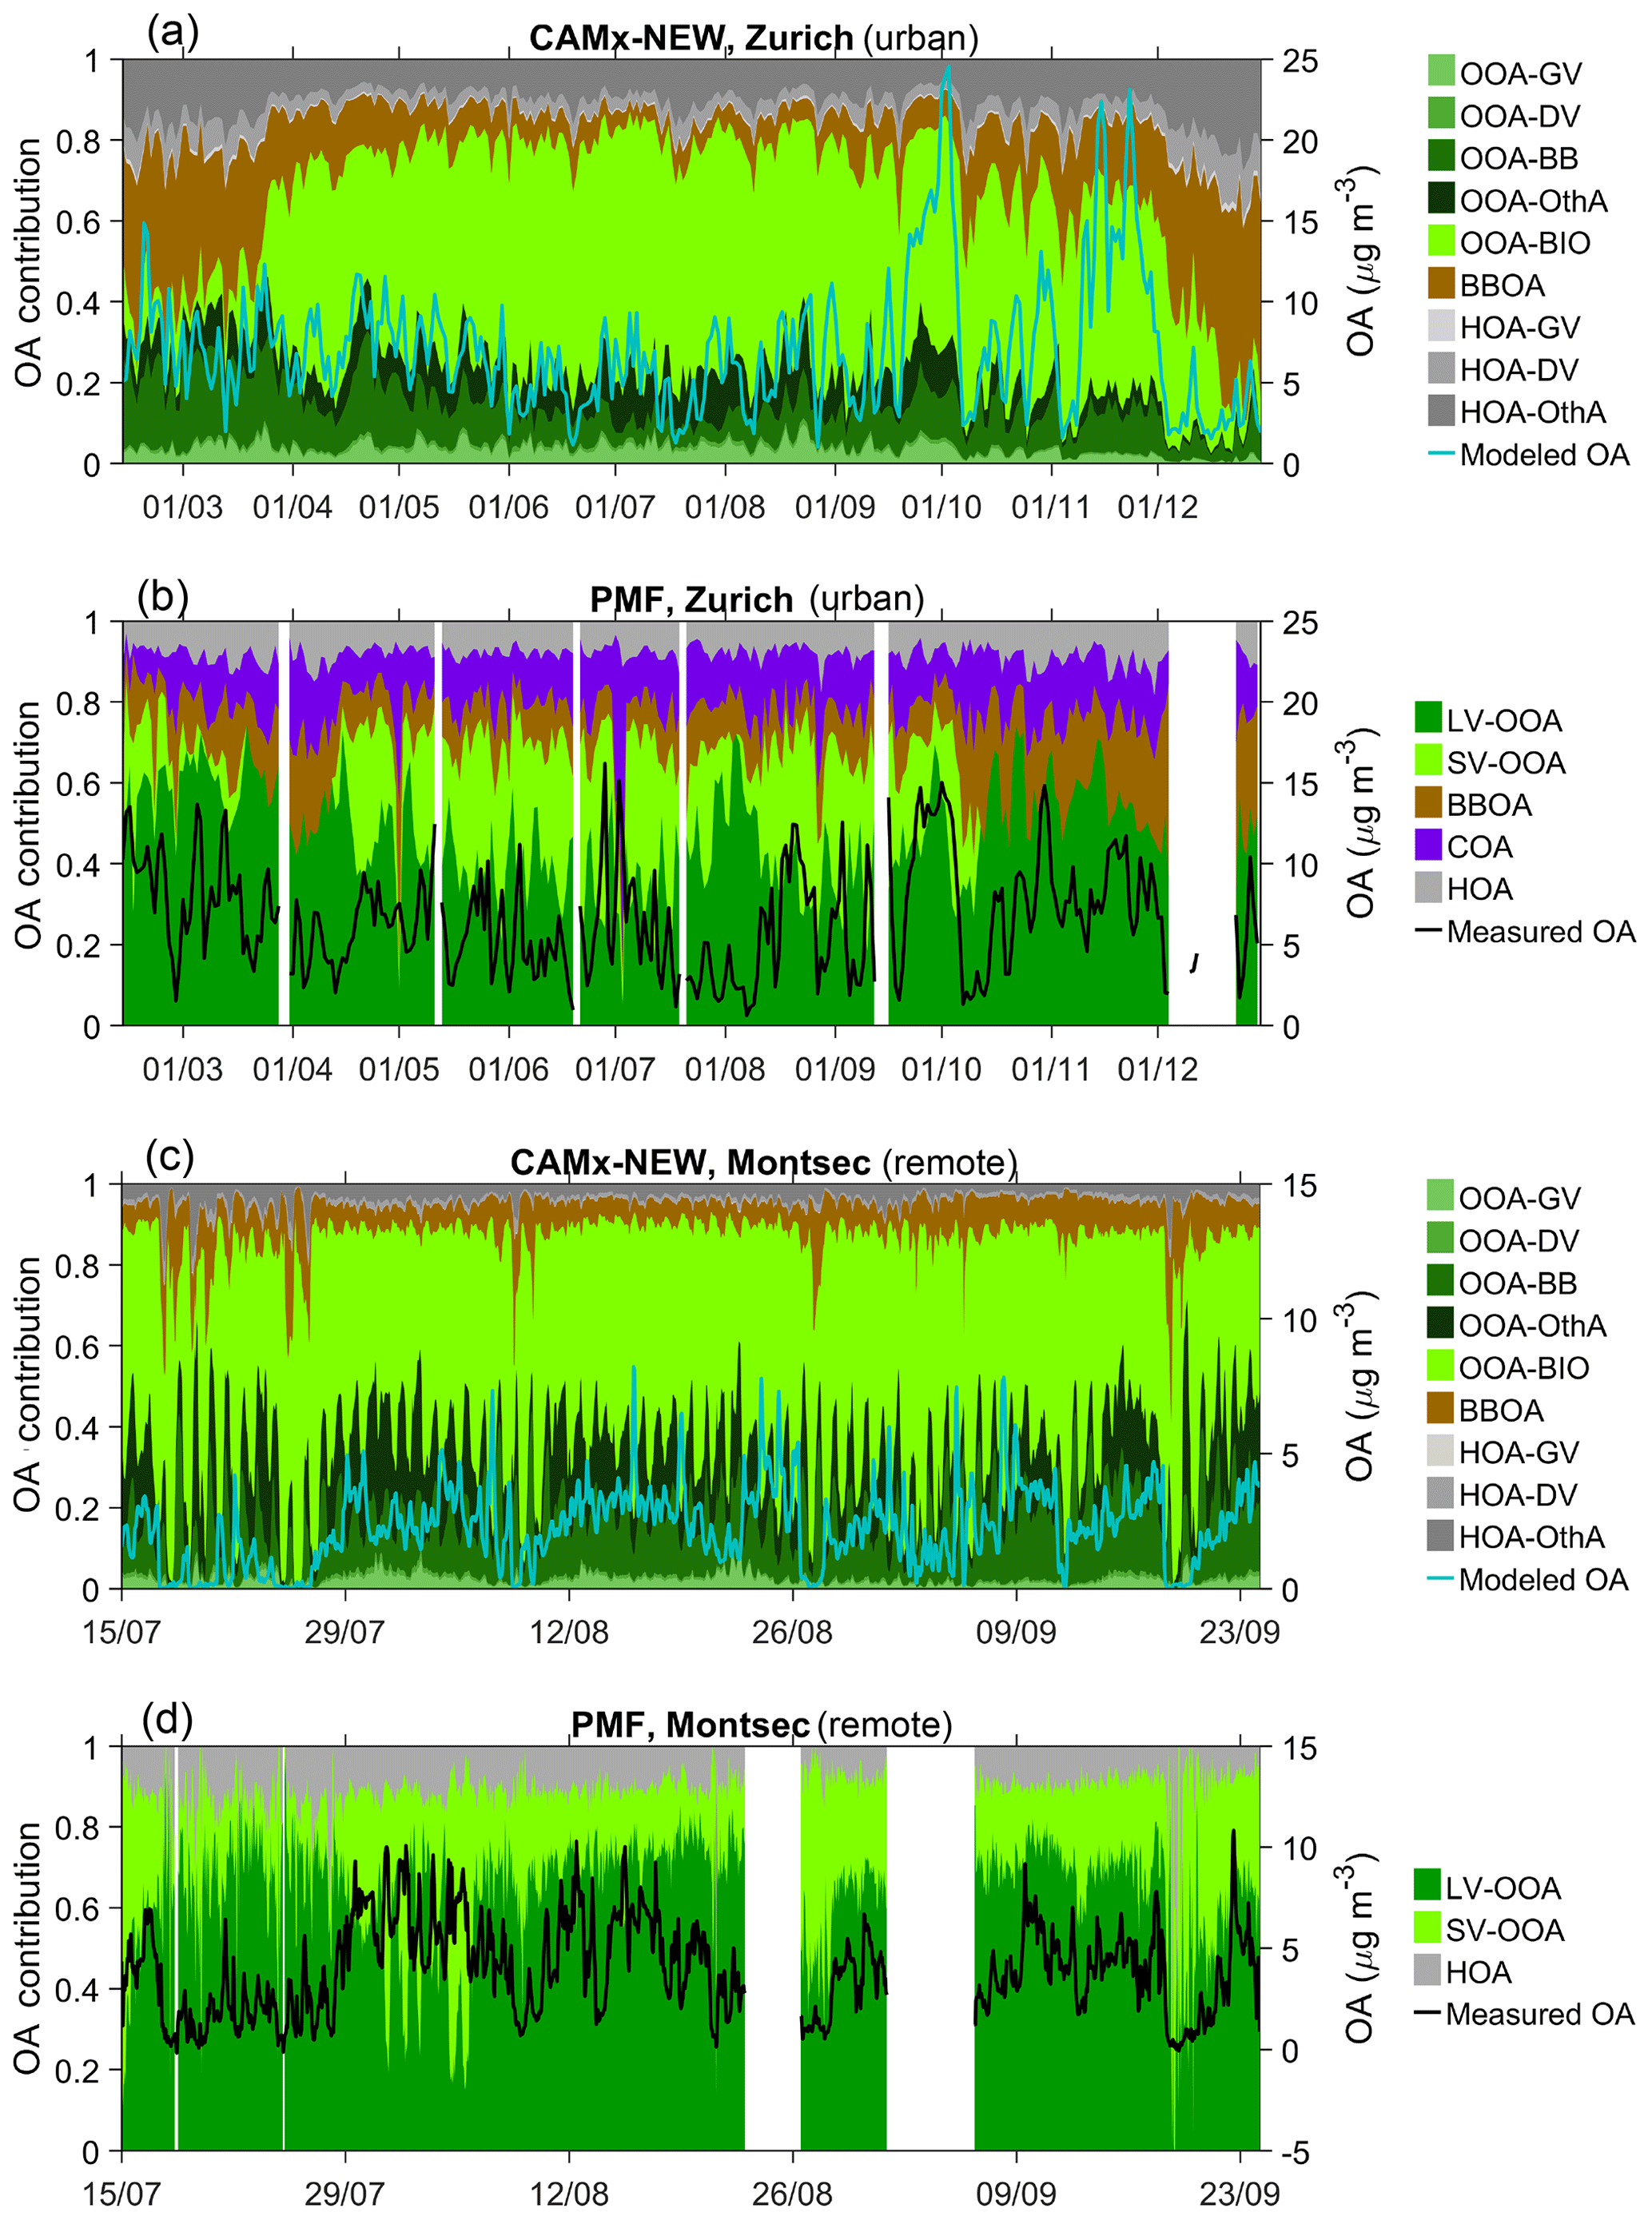
Figure 5Comparison between modeled relative contributions of OA components and positive matrix factorization (PMF) analysis results at Zurich (urban site) and Montsec (remote site). GV: gasoline vehicles; DV: diesel vehicles; BB: biomass burning; OthA: other anthropogenic sources; BIO: biogenic sources.
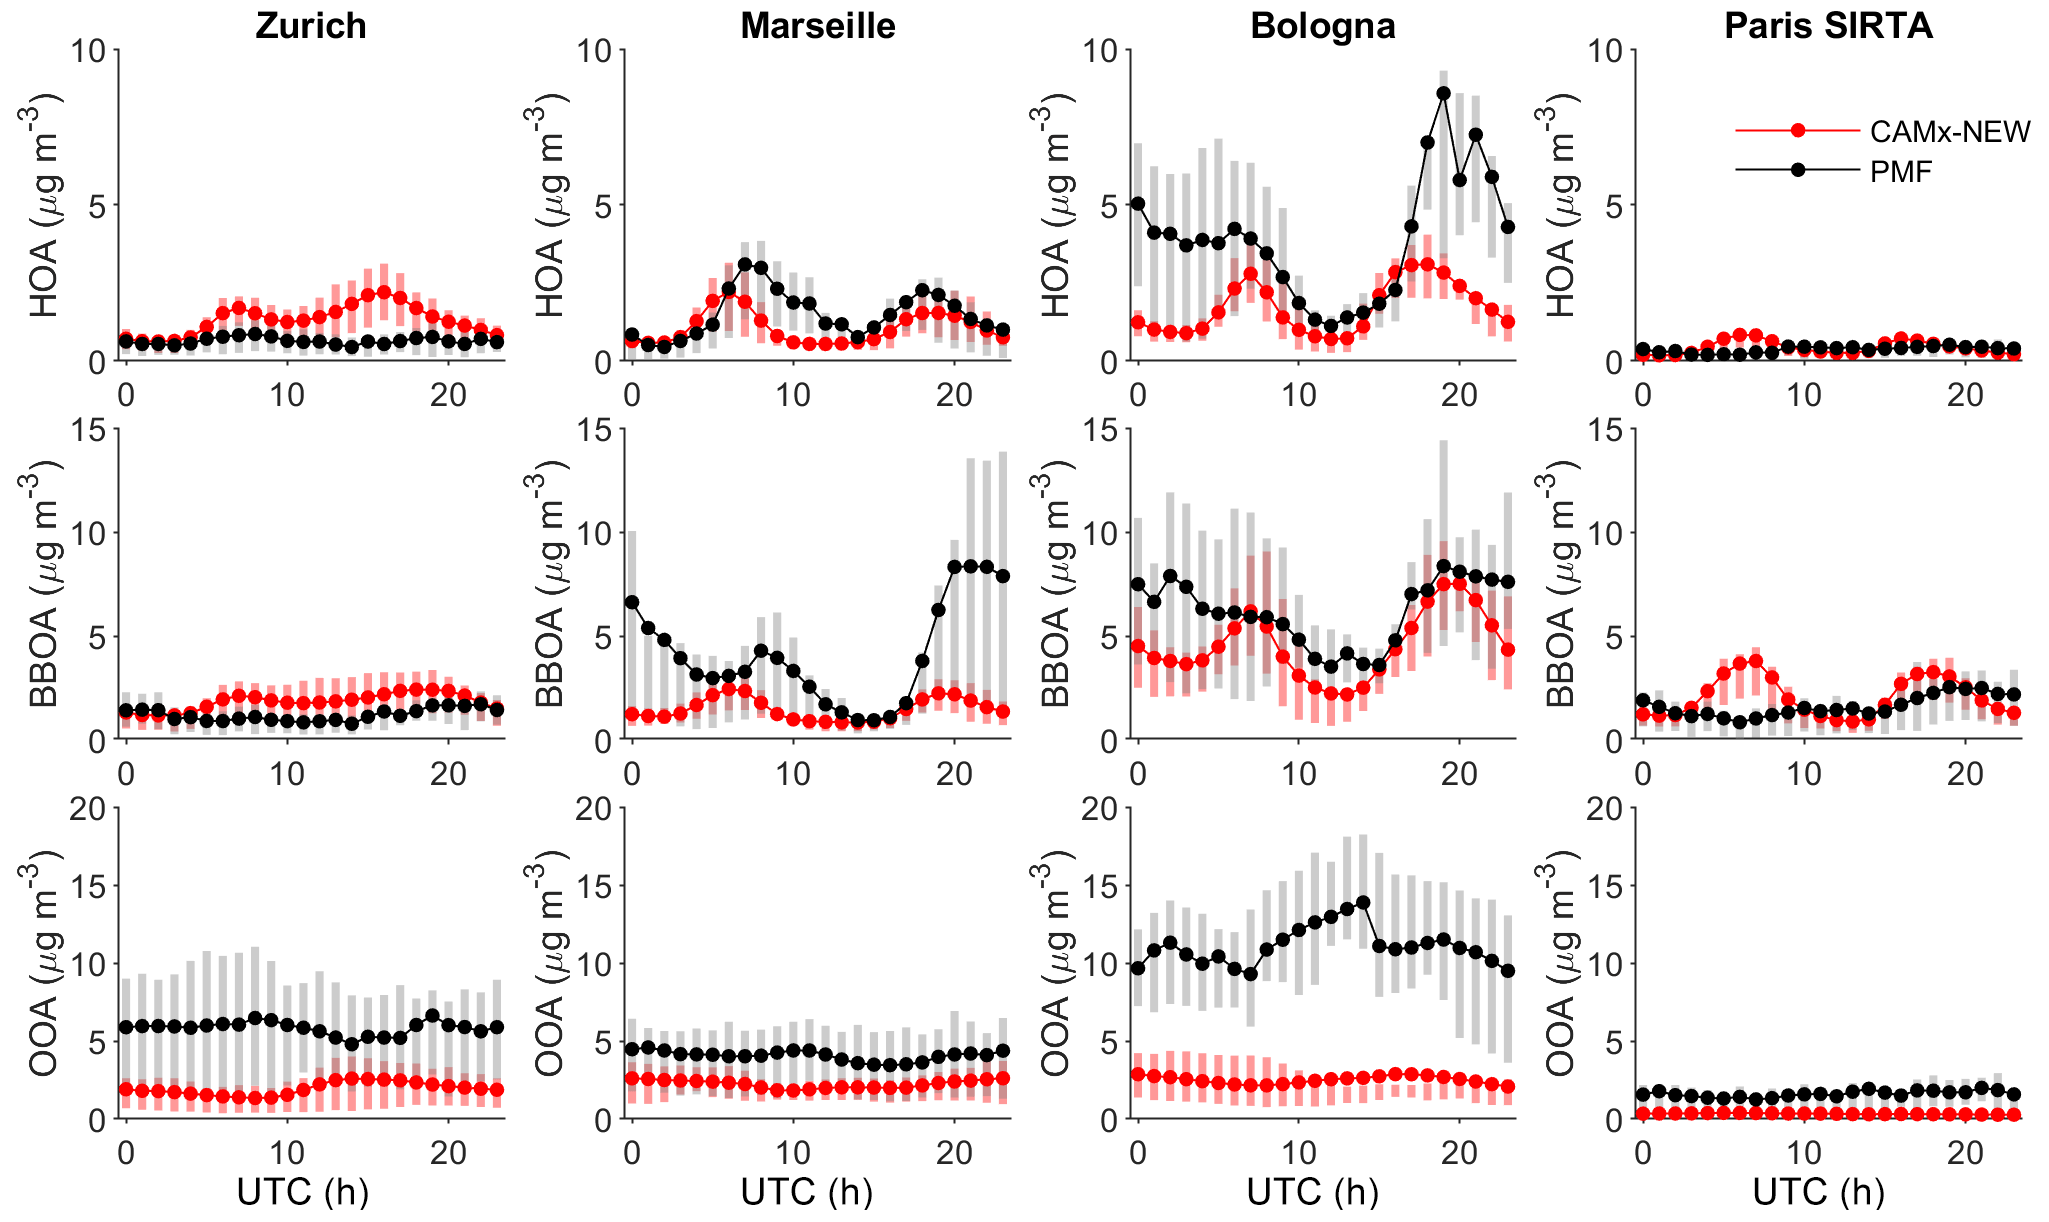
Figure 6Diurnal variations of modeled OA components by CAMx-NEW and PMF studies at urban sites in winter. The lines represent the average value of modeled and measured OA components during the same periods for each stations (as displayed in Fig. 2b), and the bars represent 25th and 75th percentiles of hourly data.
The model performance in reproducing the diurnal variations of the OA components varies with sites. Figure 6 shows the diurnal variations of HOA, BBOA and OOA by CAMx-NEW and PMF in winter. The simulation of primary organic aerosols (both HOA and BBOA) at site scale largely depends on the anthropogenic emission inputs. The modeled HOA shows dual peaks in the morning and evening rush hours for all sites as a consequence of the same diurnal variation factors in the emission model, while similar dual peaks only occur in Marseille and Bologna for the PMF HOA. The PMF HOA peaks are less pronounced in the urban background site Zurich and the suburban site SIRTA, where the magnitude of HOA is also lower compared to the other two urban stations. Similar to HOA, the modeled BBOA generally showed dual peaks in the morning and evening cooking and heating times. However, the diurnal pattern of PMF BBOA showed more variability over the sites. The largest difference between modeled and PMF BBOA occurred in Marseille, where the peaks of PMF BBOA were generally later than the modeled results and much higher at night. The high PMF BBOA during night mainly comes from the BBOA transported from the valleys near Marseille by the night land breeze (Bozzetti et al., 2017), whereas the local meteorology was poorly reproduced at Marseille, a common problem at coastal sites for meteorology modeling (Fig. S2b). Another important reason for the underestimated BBOA is that green waste combustion and agricultural fires comprise a large fraction of the BBOA in Marseille in February (Bozzetti et al., 2017); however, this part of BBOA was not modeled due to lack of emission data. In spite of a general underestimation for the modeled OOA in winter, both the CAMx-NEW and PMF OOA have rather flat diurnal patterns (Fig. 6). Better agreement between modeled and PMF results is found at rural/remote sites during spring to autumn (Fig. 7), especially at SMEAR II, Finokalia and Montsec, where OOA from biogenic sources contribute more than 90 % of the total OA according to the PMF results. The PMF OOA at San Pietro Capofiume shows a peak during the day when the liquid water content was low (Gilardoni et al., 2014), and the peak is higher during the less foggy period after 23 November (Fig. 7e) than during the highly foggy period (Fig. 7d). However, the modeled OOA is flat as the fog scavenging effect is poorly reproduced.
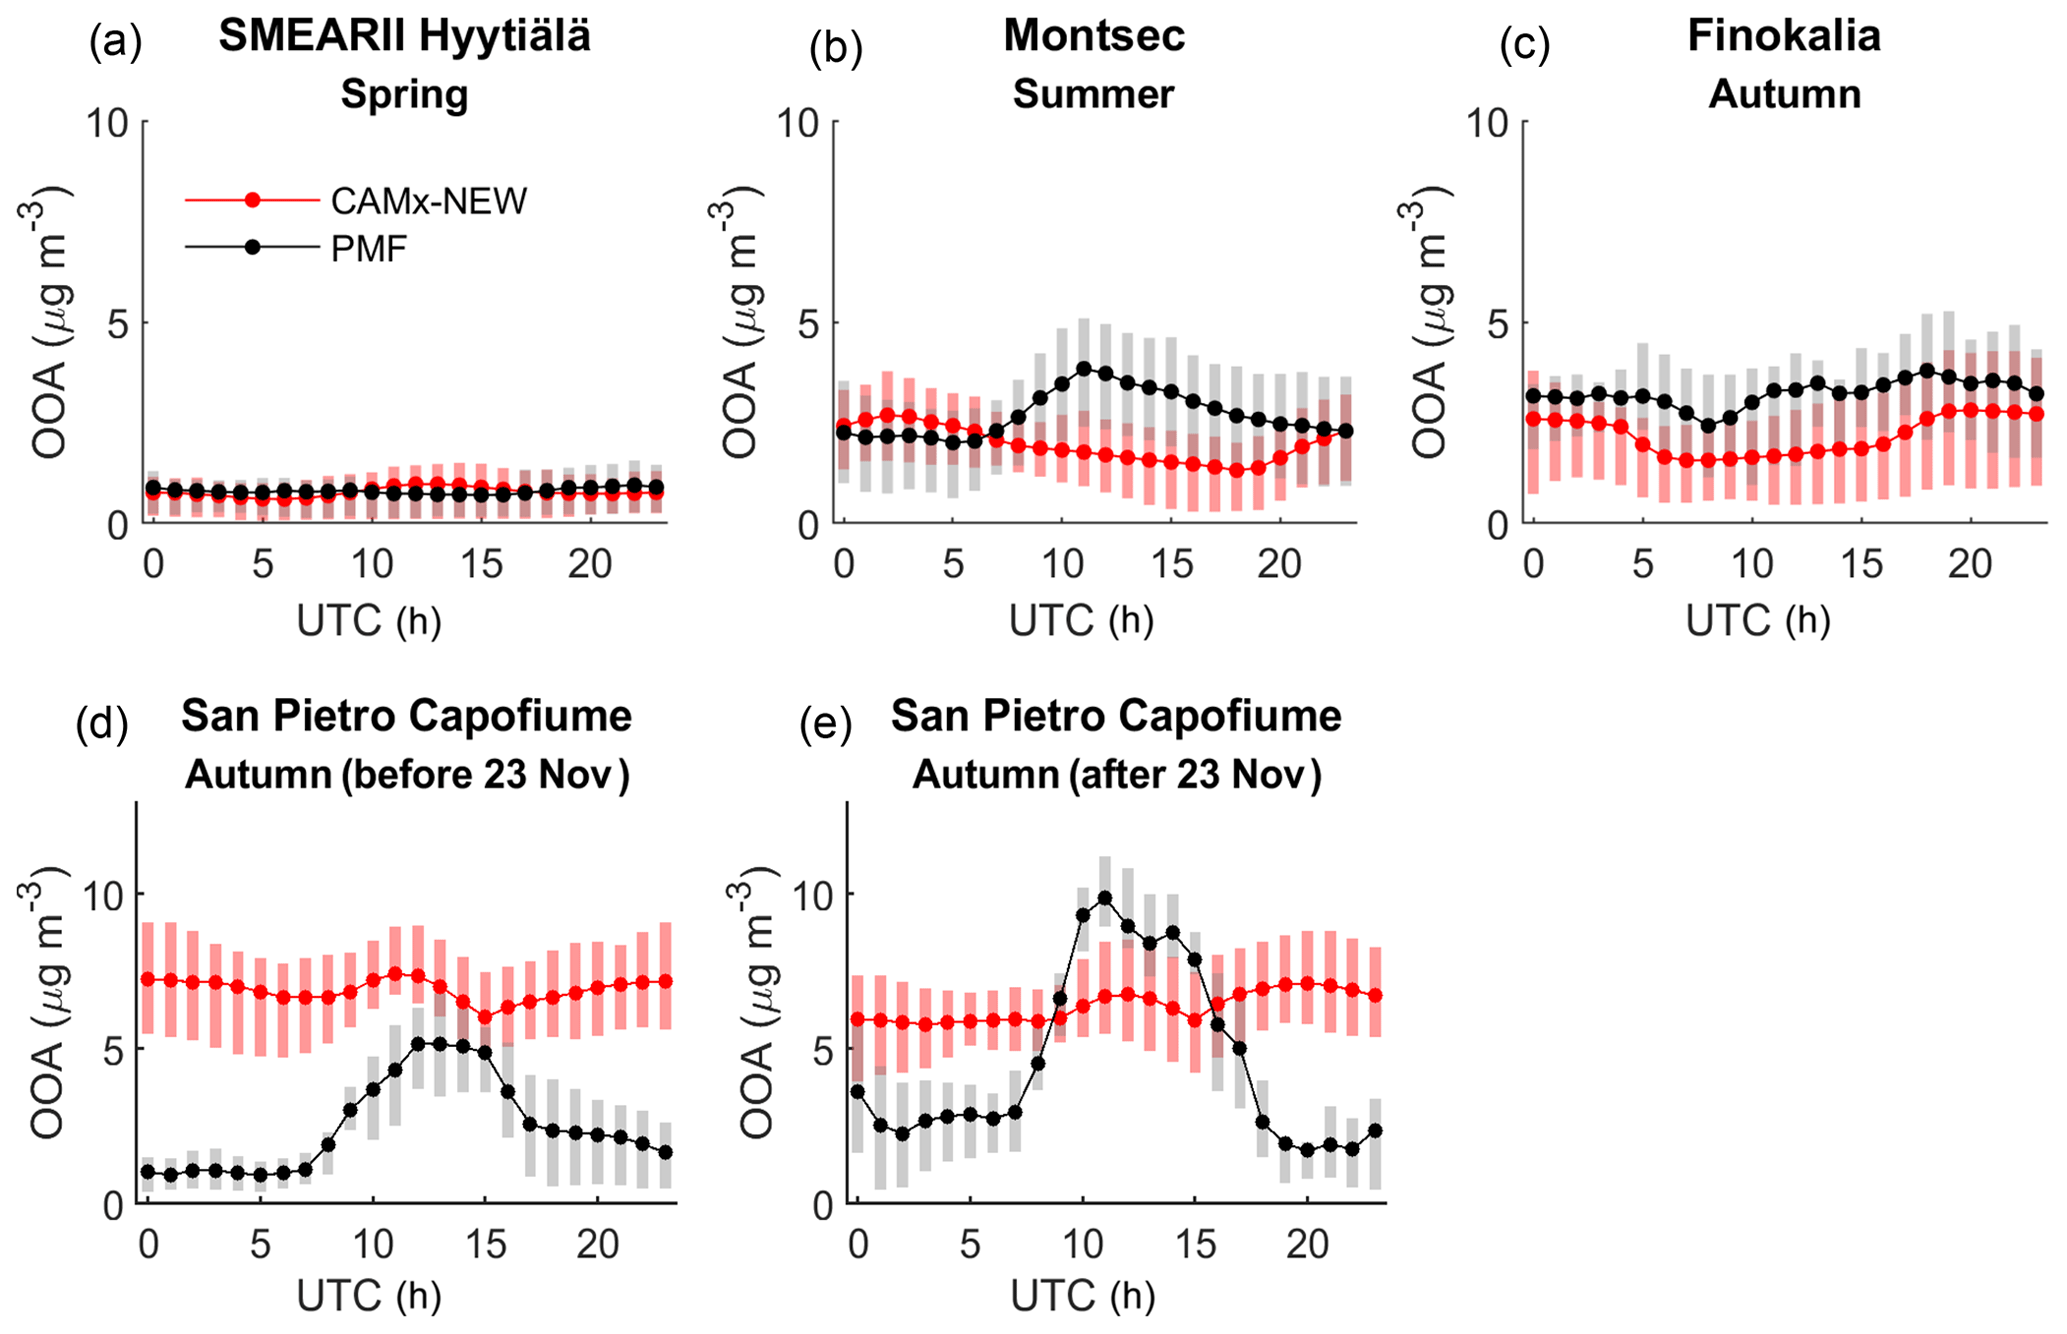
Figure 7Diurnal variations of modeled OOA components by CAMx-NEW and PMF studies in rural or remote sites. The lines represent the average value of modeled and measured OOA. Bars represent 25th and 75th percentiles of hourly data.
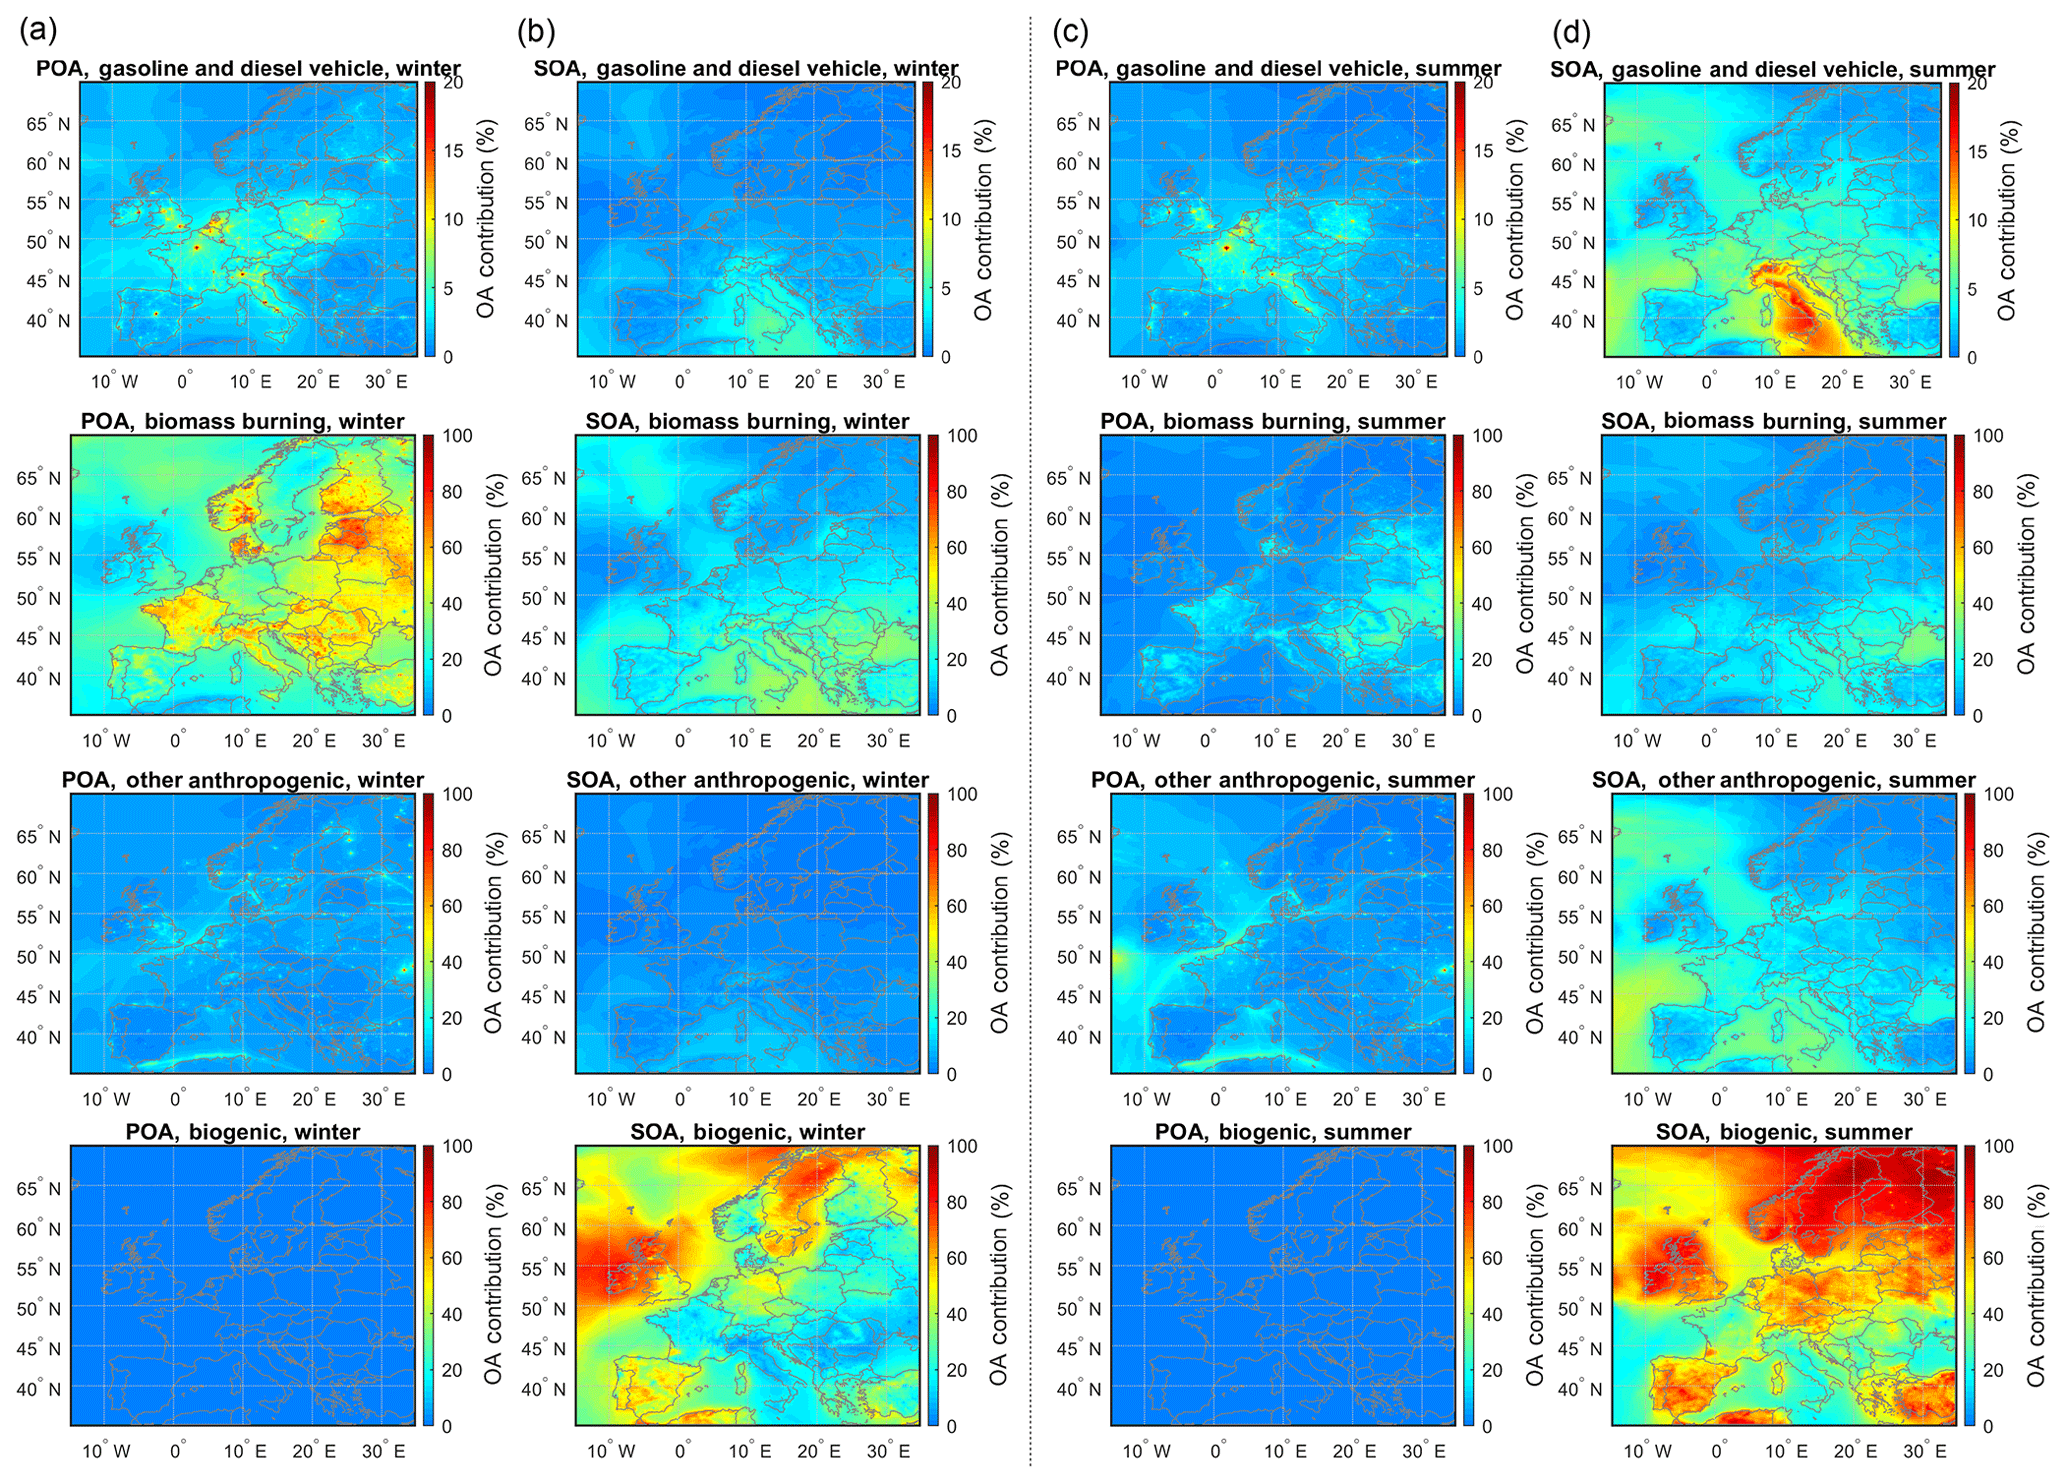
Figure 8Relative contributions of different sources (POA and SOA) to total OA in winter (a, b) and summer (c, d). The winter and summer results are the averages of December–January–February and June–July–August, respectively. OA from biogenic sources is all secondary so the POA panels for biogenic sources are empty.
Although the model performance was substantially improved by the NEW parameterization, some limitations still remain to be further improved. The winter OOA is still underestimated at most sites. It could come from the missing pathways of SOA formation such as the aqueous processing of water-soluble organics (Ervens et al., 2011), which was found to contribute up to ∼ 20 % of winter OA measured in Bologna (Gilardoni et al., 2016; Meroni et al., 2017). The uncertainties in the model parameters (reaction rate, yield, etc.) could also account for the underestimation. A recent study reported that the reaction rate of SVOC with hydroxyl radicals is highly uncertain without strong constraint of the whole set of parameters for various processes such as the vapor wall loss in chamber experiments (Bertrand et al., 2018). Another potential limitation is related to the uncertainties in SVOC/IVOC emissions. We adopted a factor of 3 for the SVOC and POA ratio for the whole domain; however, the substantial spatial and temporal variability of the factor could lead to over- or underestimation of SVOC emissions at site scale (Denier van der Gon et al., 2015) and therefore over- or underestimation of the SOA, as well as of POA. It could also partially explain the differences in model performance for the temporal variation of HOA and BBOA for each site. To further improve the model performance, it is necessary to continuously update the chemical mechanism in models by introducing missing processes and improving the parameterization based on advanced knowledge, as well as to improve the emissions by including more site-specific sources, IVOC and SVOC estimates and updated diurnal variation profiles.
3.3 Spatial and seasonal variation of OA components and sources
Due to the better performance of CAMx-NEW in predicting the OA components, the spatial and temporal variations of OA components and sources were investigated using the CAMx-NEW parameterization. The contributions of gasoline and diesel vehicles, biomass burning, other anthropogenic sources (including shipping, energy sector and industry) and biogenic sources in winter and summer are displayed in Fig. 8. Country-scale relative contributions of each source to the total OA can be found in Table S6. In winter, the largest contribution over the whole domain comes from biomass burning from residential and agriculture activities (Fig. 8a), and the biomass burning POA is the dominant component, with an average fraction of 43 % and the highest value reached in Slovenia (19.9 µg m−3, Fig. S4). The second largest OA component is the biogenic SOA (25 %), followed by the biomass burning SOA (19 %). A high contribution of biogenic SOA in winter is mainly found in Sweden, Ireland, and Spain (Table S6). Ireland and Spain have high emissions of the biogenic SOA precursor monoterpenes due to a high coverage of Norway spruce trees, the major emitters of monoterpenes, as well as comparatively high temperature. Our biogenic emission model assumes that grids with snow coverage of more than 50 % have zero monoterpene emissions in winter (Jiang et al., 2019). Therefore, there are still considerable monoterpene emissions in winter in areas with low snow coverage such as Ireland and Spain. The high biogenic SOA fraction in Sweden is mostly due to low SOA from anthropogenic activities.
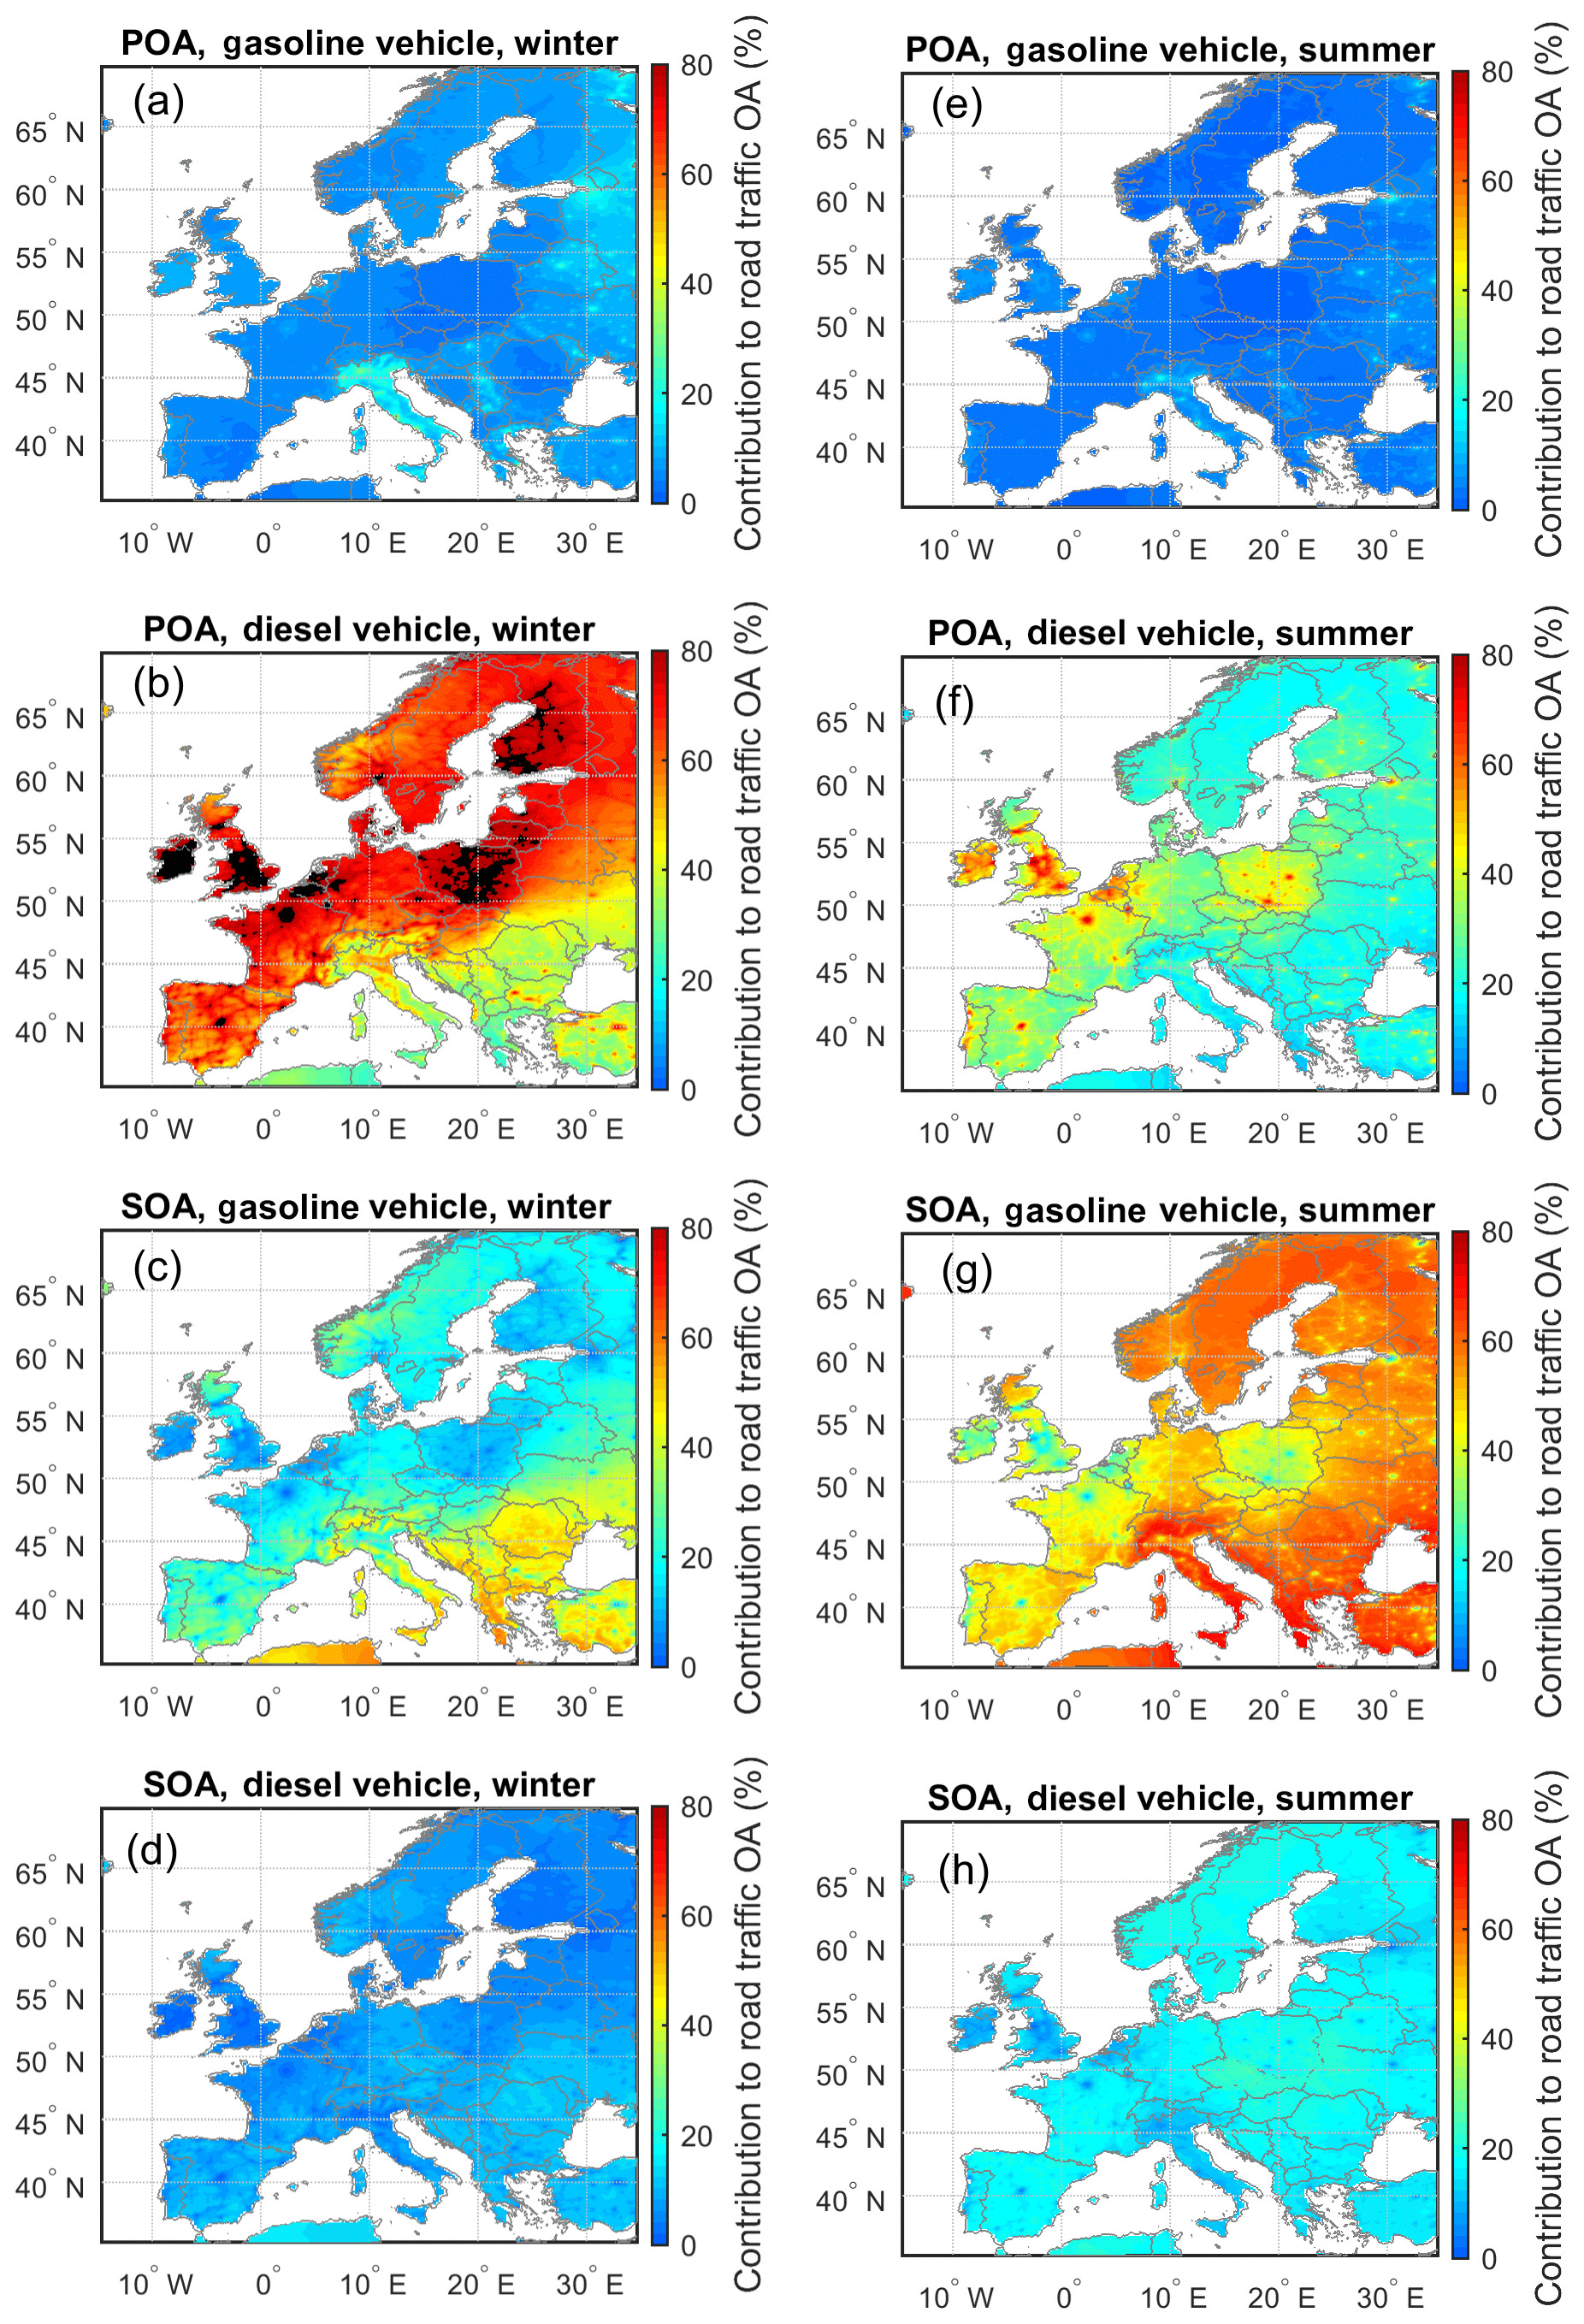
Figure 9Contributions of gasoline and diesel vehicles to the road traffic (gasoline and diesel vehicles) OA concentration in Europe during winter (December–January–February) and summer (June–July–August).
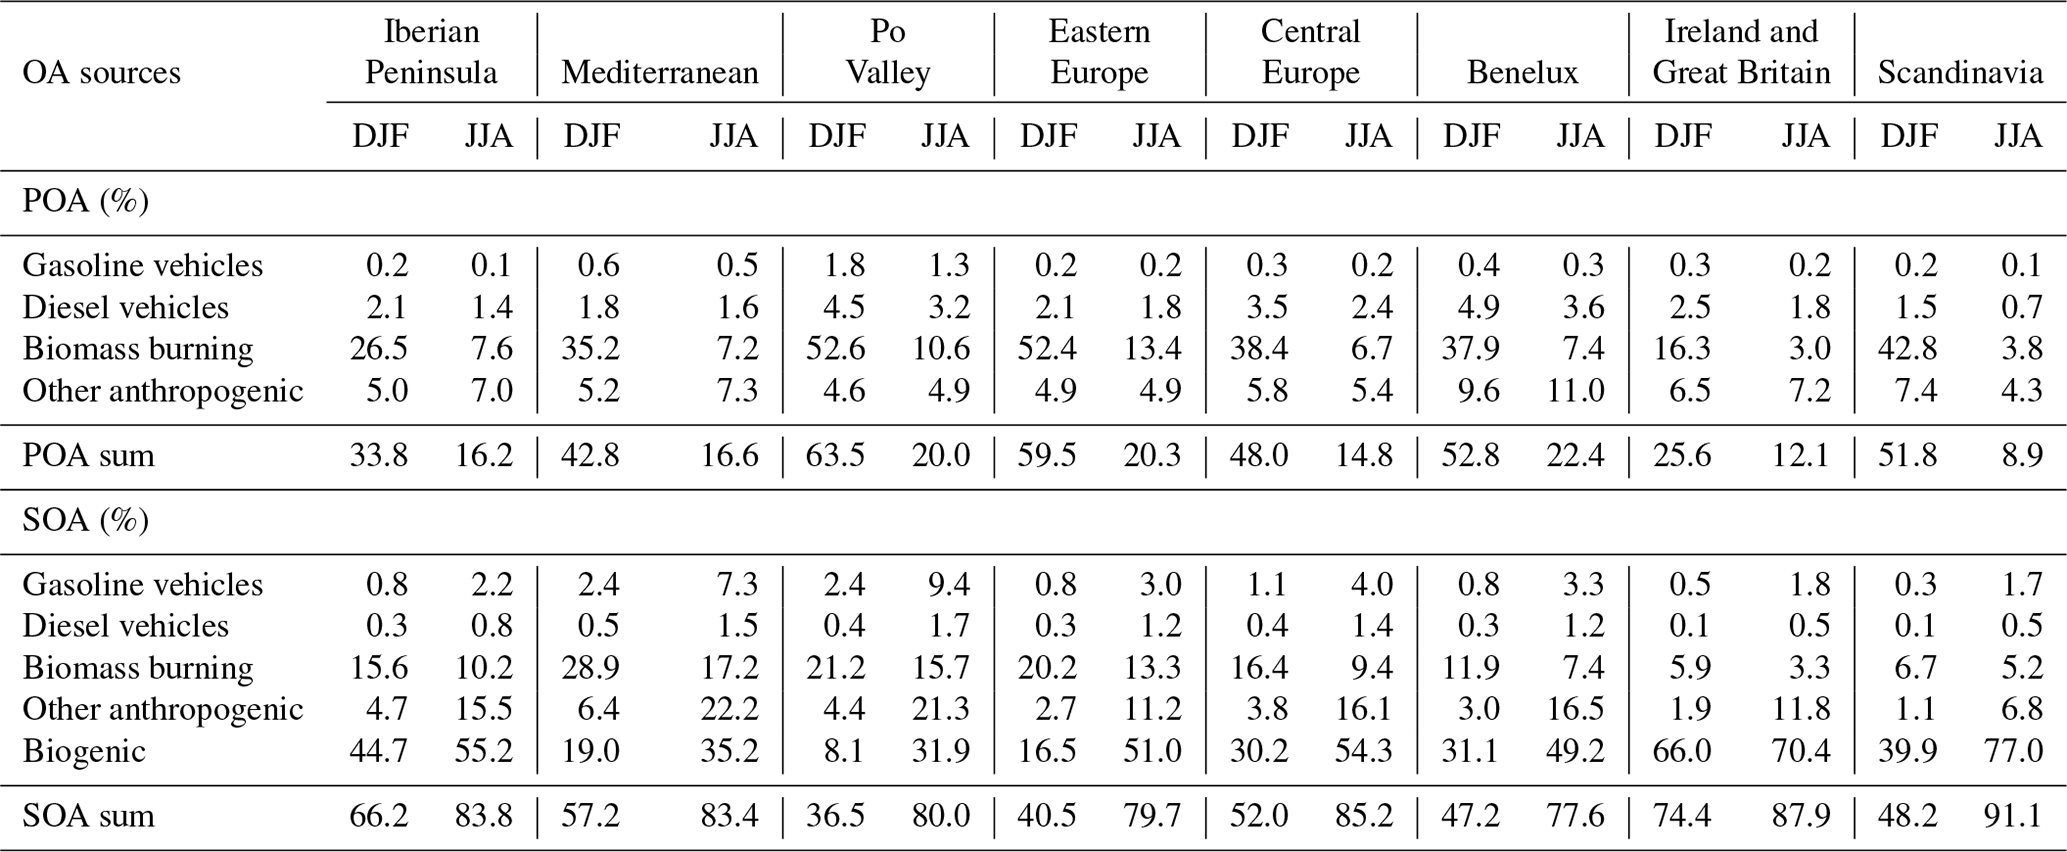
Table 3Modeled relative contribution of different sources to total OA in eight sub-regions in Europe. DJF: December–January–February; JJA: June–July–August.
Significantly higher contributions of SOA components were found in summer, when the biogenic SOA contributed up to 55 % of total OA in Europe. Other anthropogenic sources (OthA) are the second largest contributor except for a small region in the Balkans where biomass burning shows higher contribution. SOA from OthA was higher than POA with an average contribution to total OA of 13 %. Unlike the dominant role of biomass burning POA in winter, the SOA from biomass burning is higher than POA in summer. The model results generally agree with previous studies for Europe, i.e., biogenic emissions are the dominant OA source in summer, and residential wood burning is the most important winter OA source (Bergström et al., 2012; Skyllakou et al., 2017). However, the relative contribution of biogenic sources in this study are higher than in other studies, especially in winter with an average relative contribution of 25 %, while the value is less than 5 % in Skyllakou et al. (2017). Jiang et al. (2019) showed that the biogenic emission model we used produces higher monoterpenes than the widely used MEGAN model, which partly explains the higher contribution of the biogenic sources to the total OA. As the biogenic emissions are associated with high uncertainty while the measurements of biogenic volatile organic compound emissions are sparse, further studies are still needed to validate biogenic emissions. Meanwhile, the lack of cooking and wildfire emissions might also lead to an increased fraction of biogenic OA in this study.
The contributions of gasoline and diesel vehicles to total OA were rather small compared to the other sources (Fig. 8), with an average fraction of ∼ 5 % (3.9 % in winter and 6.3 % in summer for the sum of POA and SOA). However, the contribution is still high in metropolitan areas like Paris and Milan with a maximum value up to 31 % in summer. Although the magnitude of the road-traffic contribution to OA was similar for these “hotspots”, major components were found to be different. For Paris, POA from diesel vehicles was identified as the major contributor (Fig. 9b and f) as a result of the high share of diesel vehicles in France (ACEA, 2017), while SOA from gasoline vehicles contributed most in the Italian cities including Milan, Rome and Naples (Fig. 9c and g). The contribution of diesel vehicles to SOA (Fig. 9d and f) was much lower than the gasoline vehicles (Fig. 9c and g). Compared with recent studies in southern California where the gasoline and diesel vehicles contributed ∼ 35 % and ∼ 2.6 % to the total OA (Jathar et al., 2017), the highest contribution of gasoline vehicles to the total OA in Europe (20 % in Naples, summer) was lower while the contribution of diesel vehicles (24 % in Paris, summer) was much higher, due to the distinct vehicle mixes in the US and Europe.
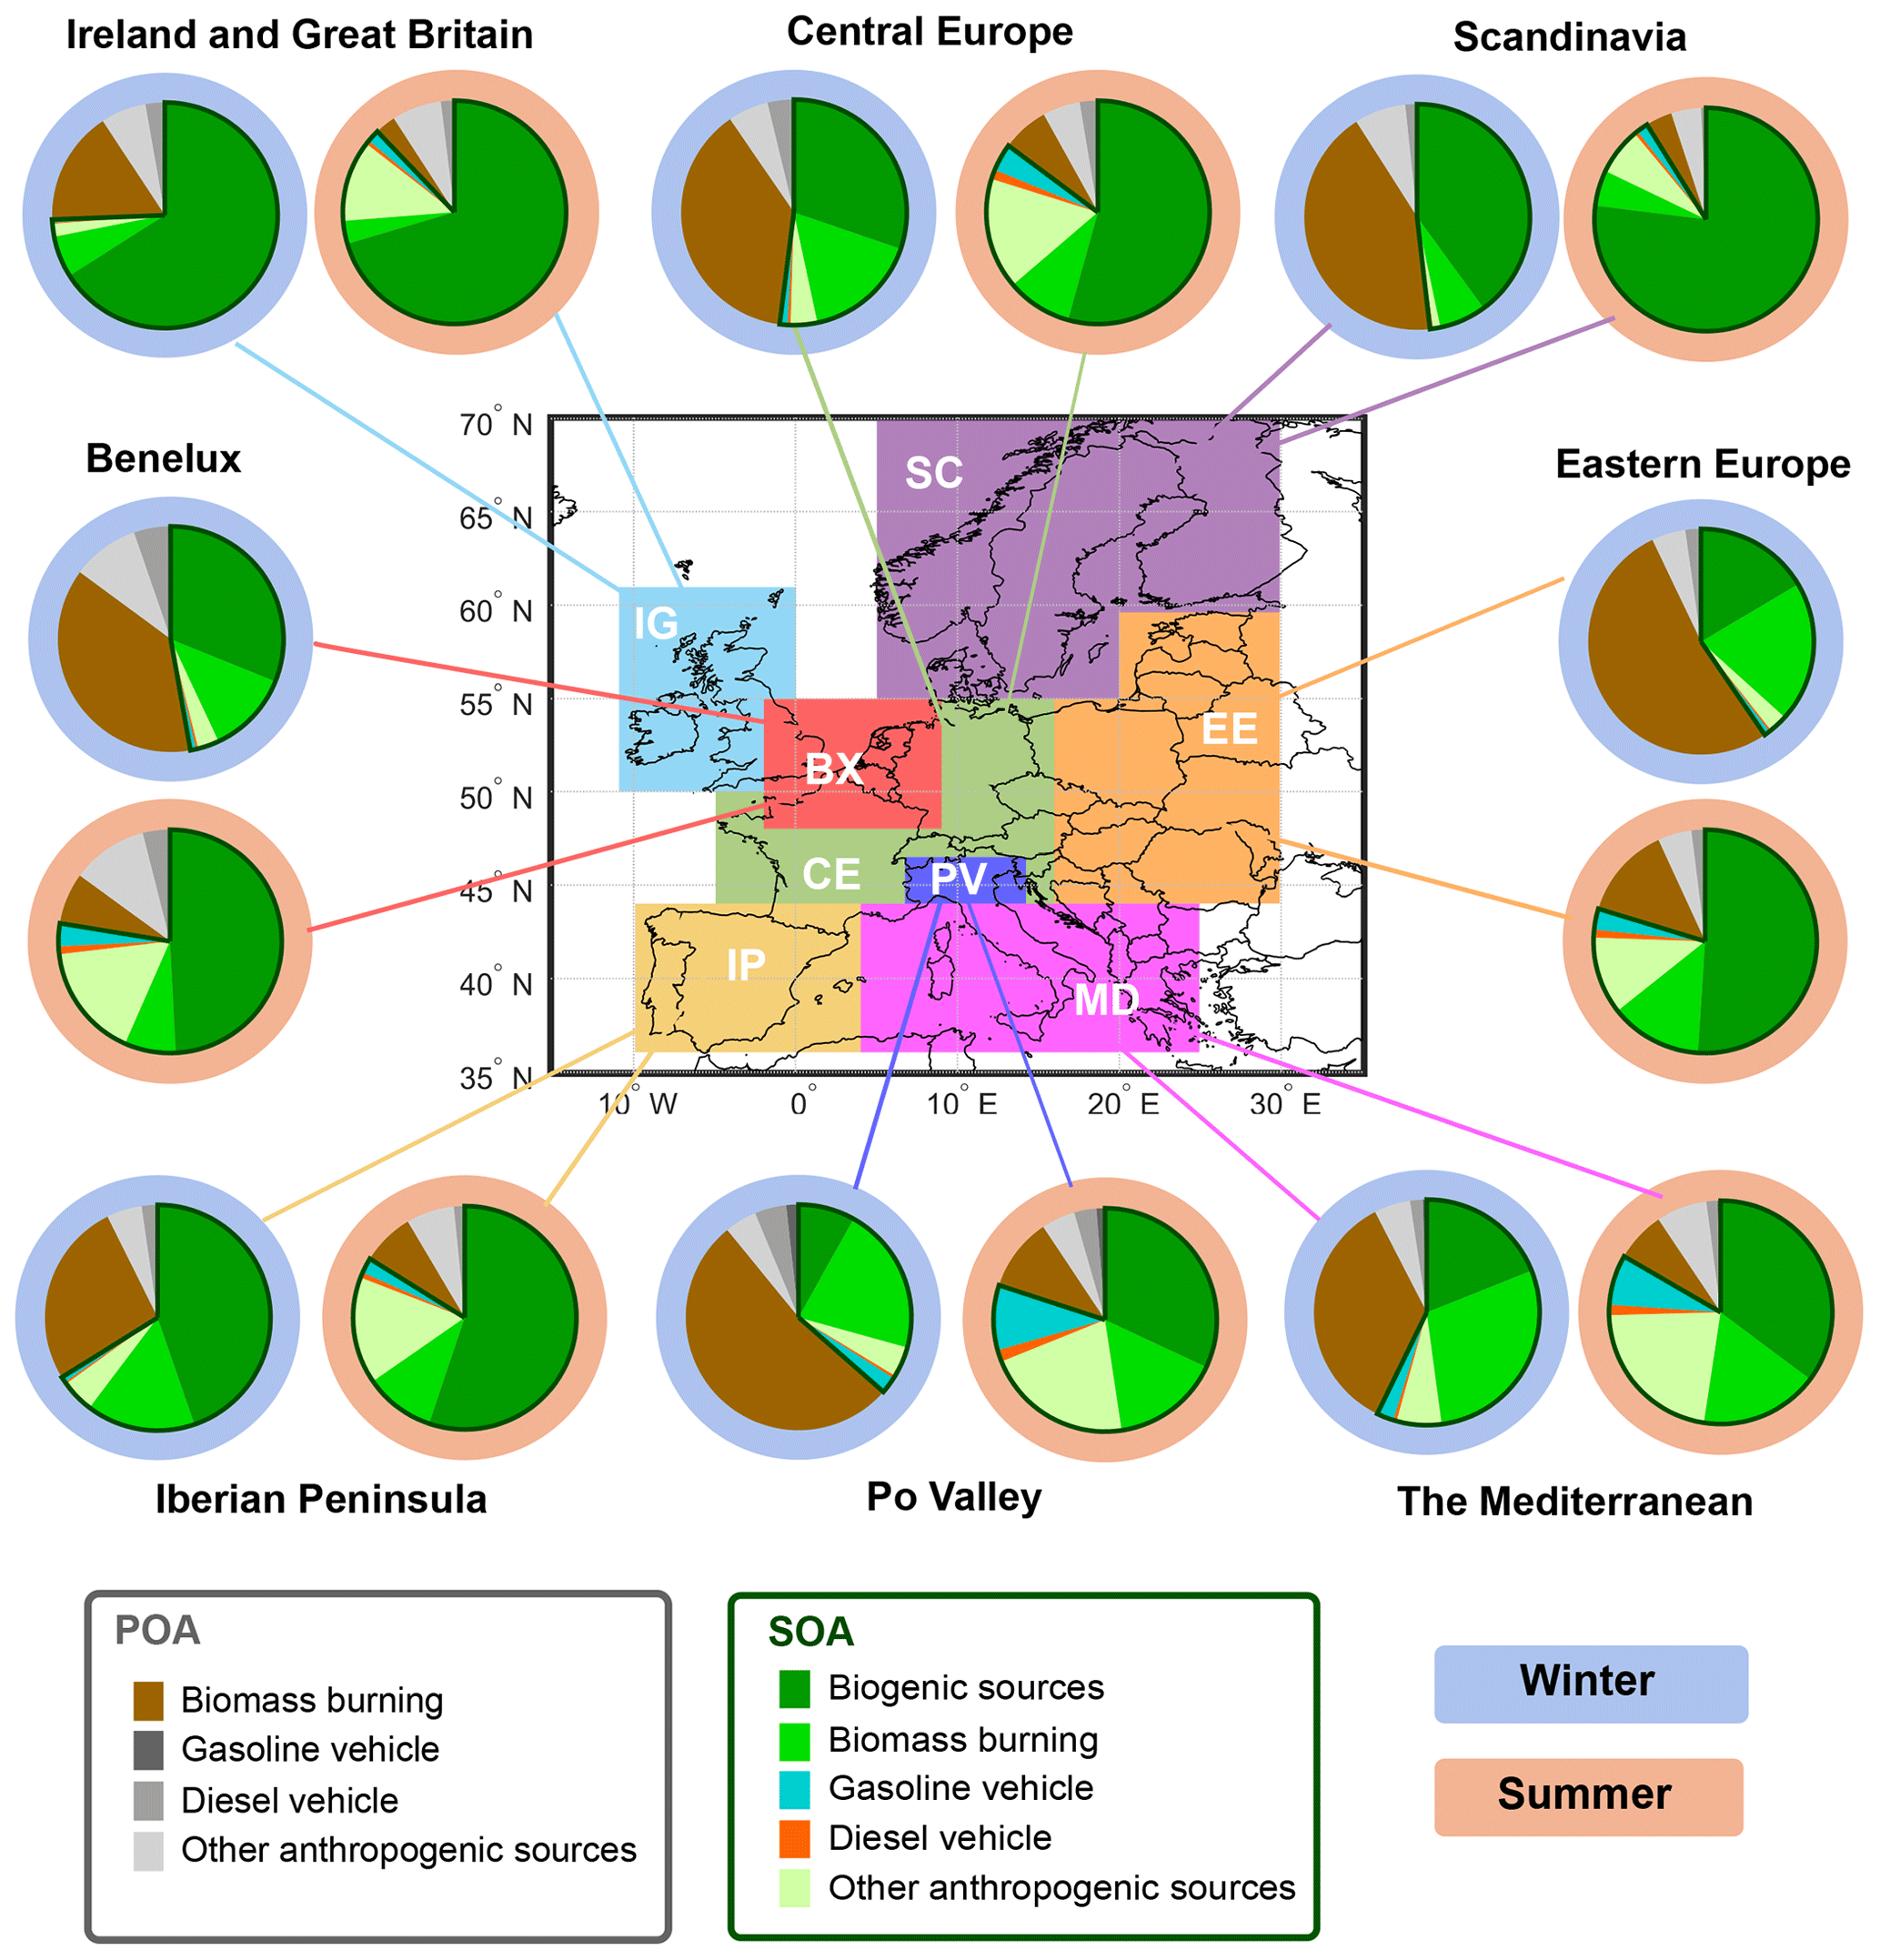
Figure 10Modeled regional variations of primary and secondary organic aerosols sources in Europe in winter (December–January–February) and summer (June–July–August). The eight sub-regions are the Iberian Peninsula (IP), the Mediterranean (MD), Po Valley (PV), eastern Europe (EE), central Europe (CE), Benelux (BX), Ireland and Great Britain (IG) and Scandinavia (SC).
3.4 Regional OA sources
In order to understand the regional variations of OA components and sources, we divided the model domain into eight sub-regions: the Iberian Peninsula (IP), the Mediterranean (MD), Po Valley (PV), eastern Europe (EE), central Europe (CE), Benelux (BX), Ireland and Great Britain (IG) and Scandinavia (SC). The regional division and average fractions of the POA and SOA components for each region are shown in Table 3 and Fig. 10. In winter, OA in most regions is dominated by biomass burning POA except for Ireland and Great Britain and the Iberian Peninsula, where the biogenic SOA contributes most with a fraction of 66 % and 45 %, respectively. Both of these regions have relatively high monoterpene emissions as explained in Sect. 3.3. Meanwhile, the high biogenic SOA fraction in Ireland and Great Britain could also come from underestimated contribution of biomass burning, in which the peat combustion covers a considerable portion (Lin et al., 2018) but is not considered in the emission inventory. The second largest POA source in all regions is other anthropogenic sources, with a similar contribution to total OA (4.9 %–9.6 %). The Po Valley and Benelux regions feature a comparatively higher contribution of POA from diesel vehicles (4.5 % for PV, 4.9 % for BX). For the winter SOA, the Mediterranean, Eastern Europe and Po Valley are dominated by biomass burning (20 %–29 %), while the other regions are dominated by biogenic SOA (30 % in CE – 66 % in BX). The summer OA is dominated by SOA for all the regions due to a considerable contribution of biogenic SOA. Scandinavia shows the highest fraction of biogenic SOA reaching up to 77 %, followed by Ireland and Great Britain (70 %) and the Iberian Peninsula (55 %). In summer, a significant increase is seen in the contribution of gasoline SOA compared to winter, especially in central and southern Europe. The Po Valley has the highest fraction of gasoline SOA (9.4 %), followed by the Mediterranean (7.3 %) and central Europe (4.0 %). The contributions of the POA components show more regional variation. In the coastal regions, e.g., the Mediterranean, Ireland and Great Britain, Benelux and Scandinavia, POA-OthA has the highest contribution, while in the other regions POA-BB contributes most (although with much lower values than in winter).
Among all the anthropogenic sources, OthA contributes from 9 % (EE) to 25 % (IG) in winter and from 33 % (EE) to 64 % (IG) to the anthropogenic OA (excluding the biogenic OA) in summer. This component mostly comes from the non-road transport, energy sector, industrial production and processes, solvent use, waste treatment, extraction of fossil fuels and brake wear. The CAMx-VBS is not able to further separate the OA sources from OthA. To give a general view about the contribution of specific sources in OthA, the contributions of PM2.5 (as a proxy of POA) and NMVOC (as a proxy of gaseous OA precursor) emissions from specific sources are shown in Fig. S5. The highest ratio of PM2.5 emissions from OthA reaches 82 % in the Iberian Peninsula due to high contribution of non-road transport (shipping), and the highest fraction of NMVOC emissions from OthA (major proxy of the gaseous precursors from OthA) reaches 86 % due to the solvent use. However, compared to the widely studied OA sources such as biomass burning and road traffic, knowledge about these sources is still quite limited.
This modeling study was conducted to identify the sources of organic aerosol (OA) components in Europe using the air quality model CAMx for the whole year of 2011. In order to improve the model performance for the organic aerosol which is generally underestimated by air quality models, we updated the VBS parameterization based on recent findings in chamber experiments with biomass burning and diesel vehicles (CAMx-NEW). A more source-specific PSI-VBS scheme compared with previous studies was used to calculate separately the OA contributions from old and new diesel and gasoline vehicles, biomass burning (residential wood burning and agricultural combustion), other anthropogenic sources (mainly shipping, industry and energy production) and biogenic sources in Europe. We modified the basis sets and emissions in order to be able to identify OA sources such as gasoline vehicles (GV), old diesel vehicles before Euro 4 emission standards (DO), new diesel vehicles with Euro 4 and higher (DN), biomass burning (BB), biogenic sources (BIO) and other anthropogenic sources (OthA). CAMx-NEW enhances the role of semi-volatile organic compounds (SVOC) and enables the further aging of secondary condensable gases from biomass burning, which significantly improved the model performance for the total OA.
Another important outcome of this study is the evaluation of the model results with measurements over a longer period than in other studies which strengthened our confidence on our modeled source apportionment. The model evaluation using measurements at nine ACSM/AMS stations in Europe showed that the CAMx-NEW reduced the mean fractional error (MFE) between the modeled and measured OA by 3 %–47 % compared to the standard VBS parameterization (CAMx-BASE). The model performance at reproducing the OA components (HOA, BBOA and OOA) was also improved by using CAMx-NEW. The MFE between modeled and PMF HOA was 24 %–72 % lower with CAMx-NEW than with CAMx-BASE, and the MFE of BBOA was reduced by 23 %–47 % with CAMx-NEW. The general underestimation of OOA by models was also improved with reduced mean bias of 0.3–1.7 µg m−3 by the modified VBS scheme.
The model results of CAMx-NEW suggested that biomass burning and biogenic sources are the major sources of OA in Europe in winter and summer, respectively. The highest contribution from biomass burning to OA was predicted in the Po Valley and Eastern European regions with > 70 % in winter. The SOA from biogenic sources was calculated to cover more than 50 % of summer OA on average (highest with 77 % in Scandinavia). Over Ireland and Great Britain, the contribution of SOA from biogenic sources was more than 50 % even in winter, possibly due to underestimated biomass burning emissions in that area. The other anthropogenic component excluding biomass burning and road traffic (shipping, energy sector, industry, etc.) was identified as another group of important OA sources with an average contribution of 9 % and 19 % in winter and summer, respectively, and the highest contribution to total OA was predicted to be 29 % in the Mediterranean in summer. The contribution of road traffic (gasoline and diesel vehicles) was rather small on average (∼ 5 %) but was higher in metropolitan areas. The highest contribution of gasoline and diesel vehicles to total OA was found in the Po Valley region with a value of 16 % in summer.
The results of this study provide information on the OA source apportionment with a regional perspective, which complements the current measurements and PMF analysis to understand regional differences of OA sources in Europe, and to identify needs for future studies. The modeling of OA source apportionment needs further evaluation based on measurements with wide spatial coverage, especially using advanced measuring techniques with improved capability of SOA identification. The considerable contribution of OA from shipping, industry and energy sectors highlights the importance of more experimental and model studies on such sources to provide explicit parameters (yields, volatility distributions, SVOC emissions, etc.) which are currently estimated by default parameters in most of the air quality models. The emission inventory remains to be improved for the highly uncertain cooking and wildfire emissions, as well as to include more site-specific emission sources, in order to further enhance the model performance at predicting the OA sources.
Model data of this study are available online at https://doi.org/10.5281/zenodo.3540796 (Jiang and Aksoyoglu, 2019a). Source codes of the PSI-VBS module are available at https://doi.org/10.5281/zenodo.3540826 (Jiang and Aksoyoglu, 2019b).
The supplement related to this article is available online at: https://doi.org/10.5194/acp-19-15247-2019-supplement.
JJ and SA conceived the study. JJ carried out the model modification, simulation and data analysis. GC contributed to model setup and development of the source apportionment code. HACDG provided the anthropogenic emissions. IEH, FC, SG, MP, MCM, OF, YZ, NM, LH, AV, KF, COD and JO provided the measurement data and contributed to data interpretation. SA, ASHP and UB supervised the entire work development. The manuscript was prepared by JJ. All authors discussed and contributed to the final paper.
The authors declare that they have no conflict of interest.
We would like to thank the European Centre for Medium-range Weather Forecasts (ECMWF) for access to the meteorological data, the European Environmental Agency (EEA) for the air quality data, the National Aeronautics and Space Administration (NASA) and its data-contributing agencies (NCAR, UCAR) for the TOMS and MODIS data, the global air quality model data and the TUV model. We acknowledge the continuous support of CAMx by RAMBOLL. Simulation of WRF and CAMx models were performed at the Swiss National Supercomputing Centre (CSCS). Anna Alastuey and Andrés Ripoll from IDAEA-CSIC are acknowledged.
This study was financially supported by the Swiss Federal Office for the Environment (FOEN). The measurements were supported by EPA-Ireland (2016-CCRP-MS-31), Emilia-Romagna region's Supersito project (DRG 428/10; DGR 1971/2013), Generalitat de Catalunya (AGAUR 2017 SGR41), the Spanish Ministry of Economy, Industry and Competitiveness (Ramón y Cajal fellowship awarded to María Cruz Minguillón), EU-FP7 ACTRIS project (grant agreement no. 262254), and the COST Action CA16109 Chemical On-Line cOmpoSition and Source Apportionment of fine aerosoL (COLOSSAL).
This paper was edited by Andrea Pozzer and reviewed by Manish Shrivastava and two anonymous referees.
ACEA: Report: Vehicles in use – Europe 2017, European Automobile Manufacturers Association, available at: https://www.acea.be/statistics/article/vehicles-in-use-europe-2017 (last access: 6 December 2019), 2017.
Ahmadov, R., McKeen, S. A., Robinson, A. L., Bahreini, R., Middlebrook, A. M., de Gouw, J. A., Meagher, J., Hsie, E. Y., Edgerton, E., Shaw, S., and Trainer, M.: A volatility basis set model for summertime secondary organic aerosols over the eastern United States in 2006, J. Geophys. Res.-Atmos, 117, D06301, https://doi.org/10.1029/2011JD016831, 2012.
Aksoyoglu, S., Baltensperger, U., and Prévôt, A. S. H.: Contribution of ship emissions to the concentration and deposition of air pollutants in Europe, Atmos. Chem. Phys., 16, 1895-1906, https://doi.org/10.5194/acp-16-1895-2016, 2016.
Andreani-Aksoyoglu, S. and Keller, J.: Estimates of monoterpene and isoprene emissions from the forests in switzerland, J. Atmos. Chem., 20, 71–87, https://doi.org/10.1007/bf01099919, 1995.
Bergström, R., Denier van der Gon, H. A. C., Prévôt, A. S. H., Yttri, K. E., and Simpson, D.: Modelling of organic aerosols over Europe (2002–2007) using a volatility basis set (VBS) framework: application of different assumptions regarding the formation of secondary organic aerosol, Atmos. Chem. Phys., 12, 8499–8527, https://doi.org/10.5194/acp-12-8499-2012, 2012.
Bertrand, A., Stefenelli, G., Pieber, S. M., Bruns, E. A., Temime-Roussel, B., Slowik, J. G., Wortham, H., Prévôt, A. S. H., El Haddad, I., and Marchand, N.: Influence of the vapor wall loss on the degradation rate constants in chamber experiments of levoglucosan and other biomass burning markers, Atmos. Chem. Phys., 18, 10915–10930, https://doi.org/10.5194/acp-18-10915-2018, 2018.
Bessagnet, B., Pirovano, G., Mircea, M., Cuvelier, C., Aulinger, A., Calori, G., Ciarelli, G., Manders, A., Stern, R., Tsyro, S., García Vivanco, M., Thunis, P., Pay, M.-T., Colette, A., Couvidat, F., Meleux, F., Rouïl, L., Ung, A., Aksoyoglu, S., Baldasano, J. M., Bieser, J., Briganti, G., Cappelletti, A., D'Isidoro, M., Finardi, S., Kranenburg, R., Silibello, C., Carnevale, C., Aas, W., Dupont, J.-C., Fagerli, H., Gonzalez, L., Menut, L., Prévôt, A. S. H., Roberts, P., and White, L.: Presentation of the EURODELTA III intercomparison exercise – evaluation of the chemistry transport models' performance on criteria pollutants and joint analysis with meteorology, Atmos. Chem. Phys., 16, 12667–12701, https://doi.org/10.5194/acp-16-12667-2016, 2016.
Boylan, J. W. and Russell, A. G.: PM and light extinction model performance metrics, goals, and criteria for three-dimensional air quality models, Atmos. Environ., 40, 4946–4959, https://doi.org/10.1016/j.atmonsenv.2005.09.087, 2006.
Bozzetti, C., El Haddad, I., Salameh, D., Daellenbach, K. R., Fermo, P., Gonzalez, R., Minguillón, M. C., Iinuma, Y., Poulain, L., Elser, M., Müller, E., Slowik, J. G., Jaffrezo, J.-L., Baltensperger, U., Marchand, N., and Prévôt, A. S. H.: Organic aerosol source apportionment by offline-AMS over a full year in Marseille, Atmos. Chem. Phys., 17, 8247–8268, https://doi.org/10.5194/acp-17-8247-2017, 2017.
Bruns, E. A., El Haddad, I., Slowik, J. G., Kilic, D., Klein, F., Baltensperger, U., and Prévôt, A. S. H.: Identification of significant precursor gases of secondary organic aerosols from residential wood combustion, Sci. Rep., 6, 27881, https://doi.org/10.1038/srep27881, 2016.
Canonaco, F., Crippa, M., Slowik, J. G., Baltensperger, U., and Prévôt, A. S. H.: SoFi, an IGOR-based interface for the efficient use of the generalized multilinear engine (ME-2) for the source apportionment: ME-2 application to aerosol mass spectrometer data, Atmos. Meas. Tech., 6, 3649–3661, https://doi.org/10.5194/amt-6-3649-2013, 2013.
Canonaco, F., Slowik, J. G., Baltensperger, U., and Prévôt, A. S. H.: Seasonal differences in oxygenated organic aerosol composition: implications for emissions sources and factor analysis, Atmos. Chem. Phys., 15, 6993–7002, https://doi.org/10.5194/acp-15-6993-2015, 2015.
Cholakian, A., Beekmann, M., Colette, A., Coll, I., Siour, G., Sciare, J., Marchand, N., Couvidat, F., Pey, J., Gros, V., Sauvage, S., Michoud, V., Sellegri, K., Colomb, A., Sartelet, K., Langley DeWitt, H., Elser, M., Prévot, A. S. H., Szidat, S., and Dulac, F.: Simulation of fine organic aerosols in the western Mediterranean area during the ChArMEx 2013 summer campaign, Atmos. Chem. Phys., 18, 7287–7312, https://doi.org/10.5194/acp-18-7287-2018, 2018.
Ciarelli, G., Aksoyoglu, S., Crippa, M., Jimenez, J.-L., Nemitz, E., Sellegri, K., Äijälä, M., Carbone, S., Mohr, C., O'Dowd, C., Poulain, L., Baltensperger, U., and Prévôt, A. S. H.: Evaluation of European air quality modelled by CAMx including the volatility basis set scheme, Atmos. Chem. Phys., 16, 10313–10332, https://doi.org/10.5194/acp-16-10313-2016, 2016.
Ciarelli, G., Aksoyoglu, S., El Haddad, I., Bruns, E. A., Crippa, M., Poulain, L., Äijälä, M., Carbone, S., Freney, E., O'Dowd, C., Baltensperger, U., and Prévôt, A. S. H.: Modelling winter organic aerosol at the European scale with CAMx: evaluation and source apportionment with a VBS parameterization based on novel wood burning smog chamber experiments, Atmos. Chem. Phys., 17, 7653–7669, https://doi.org/10.5194/acp-17-7653-2017, 2017a.
Ciarelli, G., El Haddad, I., Bruns, E., Aksoyoglu, S., Möhler, O., Baltensperger, U., and Prévôt, A. S. H.: Constraining a hybrid volatility basis-set model for aging of wood-burning emissions using smog chamber experiments: a box-model study based on the VBS scheme of the CAMx model (v5.40), Geosci. Model Dev., 10, 2303–2320, https://doi.org/10.5194/gmd-10-2303-2017, 2017b.
Ciarelli, G., Colette, A., Schucht, S., Beekmann, M., Andersson, C., Manders-Groot, A., Mircea, M., Tsyro, S., Fagerli, H., Ortiz, A. G., Adani, M., Briganti, G., Cappelletti, A., D'Isidoro, M., Cuvelier, C., Couvidat, F., Meleux, F., and Bessagnet, B.: Long-term health impact assessment of total PM2.5 in Europe during the 1990–2015 period, Atmos. Environ., 3, 100032, https://doi.org/10.1016/j.aeaoa.2019.100032, 2019.
Cohen, A. J., Brauer, M., Burnett, R., Anderson, H. R., Frostad, J., Estep, K., Balakrishnan, K., Brunekreef, B., Dandona, L., Dandona, R., Feigin, V., Freedman, G., Hubbell, B., Jobling, A., Kan, H., Knibbs, L., Liu, Y., Martin, R., Morawska, L., Pope, C. A., Shin, H., Straif, K., Shaddick, G., Thomas, M., van Dingenen, R., van Donkelaar, A., Vos, T., Murray, C. J. L., and Forouzanfar, M. H.: Estimates and 25-year trends of the global burden of disease attributable to ambient air pollution: an analysis of data from the Global Burden of Diseases Study 2015, Lancet, 389, 1907–1918, https://doi.org/10.1016/s0140-6736(17)30505-6, 2017.
Crippa, M., Canonaco, F., Slowik, J. G., El Haddad, I., DeCarlo, P. F., Mohr, C., Heringa, M. F., Chirico, R., Marchand, N., Temime-Roussel, B., Abidi, E., Poulain, L., Wiedensohler, A., Baltensperger, U., and Prévôt, A. S. H.: Primary and secondary organic aerosol origin by combined gas-particle phase source apportionment, Atmos. Chem. Phys., 13, 8411–8426, https://doi.org/10.5194/acp-13-8411-2013, 2013.
Crippa, M., Canonaco, F., Lanz, V. A., Äijälä, M., Allan, J. D., Carbone, S., Capes, G., Ceburnis, D., Dall'Osto, M., Day, D. A., DeCarlo, P. F., Ehn, M., Eriksson, A., Freney, E., Hildebrandt Ruiz, L., Hillamo, R., Jimenez, J. L., Junninen, H., Kiendler-Scharr, A., Kortelainen, A.-M., Kulmala, M., Laaksonen, A., Mensah, A. A., Mohr, C., Nemitz, E., O'Dowd, C., Ovadnevaite, J., Pandis, S. N., Petäjä, T., Poulain, L., Saarikoski, S., Sellegri, K., Swietlicki, E., Tiitta, P., Worsnop, D. R., Baltensperger, U., and Prévôt, A. S. H.: Organic aerosol components derived from 25 AMS data sets across Europe using a consistent ME-2 based source apportionment approach, Atmos. Chem. Phys., 14, 6159–6176, https://doi.org/10.5194/acp-14-6159-2014, 2014.
Daellenbach, K. R., Bozzetti, C., Křepelová, A., Canonaco, F., Wolf, R., Zotter, P., Fermo, P., Crippa, M., Slowik, J. G., Sosedova, Y., Zhang, Y., Huang, R.-J., Poulain, L., Szidat, S., Baltensperger, U., El Haddad, I., and Prévôt, A. S. H.: Characterization and source apportionment of organic aerosol using offline aerosol mass spectrometry, Atmos. Meas. Tech., 9, 23–39, https://doi.org/10.5194/amt-9-23-2016, 2016.
Daellenbach, K. R., Stefenelli, G., Bozzetti, C., Vlachou, A., Fermo, P., Gonzalez, R., Piazzalunga, A., Colombi, C., Canonaco, F., Hueglin, C., Kasper-Giebl, A., Jaffrezo, J.-L., Bianchi, F., Slowik, J. G., Baltensperger, U., El-Haddad, I., and Prévôt, A. S. H.: Long-term chemical analysis and organic aerosol source apportionment at nine sites in central Europe: source identification and uncertainty assessment, Atmos. Chem. Phys., 17, 13265–13282, https://doi.org/10.5194/acp-17-13265-2017, 2017.
Dee, D. P., Uppala, S. M., Simmons, A. J., Berrisford, P., Poli, P., Kobayashi, S., Andrae, U., Balmaseda, M. A., Balsamo, G., Bauer, P., Bechtold, P., Beljaars, A. C. M., van de Berg, I., Biblot, J., Bormann, N., Delsol, C., Dragani, R., Fuentes, M., Greer, A. J., Haimberger, L., Healy, S. B., Hersbach, H., Holm, E. V., Isaksen, L., Kallberg, P., Kohler, M., Matricardi, M., McNally, A. P., Mong-Sanz, B. M., Morcette, J.-J., Park, B.-K., Peubey, C., de Rosnay, P., Tavolato, C., Thepaut, J. N., and Vitart, F.: The ERA-Interim reanalysis: Configuration and performance of the data assimilation system, Q. J. Roy. Meteorol. Soc., 137, 553–597, https://doi.org/10.1002/qj.828, 2011.
Denier van der Gon, H. A. C., Bergström, R., Fountoukis, C., Johansson, C., Pandis, S. N., Simpson, D., and Visschedijk, A. J. H.: Particulate emissions from residential wood combustion in Europe – revised estimates and an evaluation, Atmos. Chem. Phys., 15, 6503–6519, https://doi.org/10.5194/acp-15-6503-2015, 2015.
Donahue, N. M., Robinson, A. L., Stanier, C. O., and Pandis, S. N.: Coupled Partitioning, Dilution, and Chemical Aging of Semivolatile Organics, Environ. Sci. Technol., 40, 2635–2643, https://doi.org/10.1021/es052297c, 2006.
Donahue, N. M., Epstein, S. A., Pandis, S. N., and Robinson, A. L.: A two-dimensional volatility basis set: 1. organic-aerosol mixing thermodynamics, Atmos. Chem. Phys., 11, 3303–3318, https://doi.org/10.5194/acp-11-3303-2011, 2011.
Emery, C.: Enhanced Meteorological Modeling and Performance Evaluation for Two Texas Ozone Episodes, ENVIRON International Corporation, Novato, CA, 2001.
EPA: Guidance on the use of models and other analyses for demonstrating attainment of air quality goals for ozone, PM2.5, and regional haze, U.S. Environmental Protection Agency, Office of Air Quality Planning and Standards, Research Triangle Park, North Carolina, 2007.
Ervens, B., Turpin, B. J., and Weber, R. J.: Secondary organic aerosol formation in cloud droplets and aqueous particles (aqSOA): a review of laboratory, field and model studies, Atmos. Chem. Phys., 11, 11069–11102, https://doi.org/10.5194/acp-11-11069-2011, 2011.
Fountoukis, C., Megaritis, A. G., Skyllakou, K., Charalampidis, P. E., Pilinis, C., Denier van der Gon, H. A. C., Crippa, M., Canonaco, F., Mohr, C., Prévôt, A. S. H., Allan, J. D., Poulain, L., Petäjä, T., Tiitta, P., Carbone, S., Kiendler-Scharr, A., Nemitz, E., O'Dowd, C., Swietlicki, E., and Pandis, S. N.: Organic aerosol concentration and composition over Europe: insights from comparison of regional model predictions with aerosol mass spectrometer factor analysis, Atmos. Chem. Phys., 14, 9061–9076, https://doi.org/10.5194/acp-14-9061-2014, 2014.
Gentner, D. R., Isaacman, G., Worton, D. R., Chan, A. W. H., Dallmann, T. R., Davis, L., Liu, S., Day, D. A., Russell, L. M., Wilson, K. R., Weber, R., Guha, A., Harley, R. A., and Goldstein, A. H.: Elucidating secondary organic aerosol from diesel and gasoline vehicles through detailed characterization of organic carbon emissions, P. Natl. Acad. Sci. USA, 109, 18318–18323, https://doi.org/10.1073/pnas.1212272109, 2012.
Gentner, D. R., Jathar, S. H., Gordon, T. D., Bahreini, R., Day, D. A., El Haddad, I., Hayes, P. L., Pieber, S. M., Platt, S. M., de Gouw, J., Goldstein, A. H., Harley, R. A., Jimenez, J. L., Prévôt, A. S. H., and Robinson, A. L.: Review of Urban Secondary Organic Aerosol Formation from Gasoline and Diesel Motor Vehicle Emissions, Environ. Sci. Technol., 51, 1074–1093, https://doi.org/10.1021/acs.est.6b04509, 2016.
Gilardoni, S., Massoli, P., Giulianelli, L., Rinaldi, M., Paglione, M., Pollini, F., Lanconelli, C., Poluzzi, V., Carbone, S., Hillamo, R., Russell, L. M., Facchini, M. C., and Fuzzi, S.: Fog scavenging of organic and inorganic aerosol in the Po Valley, Atmos. Chem. Phys., 14, 6967–6981, https://doi.org/10.5194/acp-14-6967-2014, 2014.
Gilardoni, S., Massoli, P., Paglione, M., Giulianelli, L., Carbone, C., Rinaldi, M., Decesari, S., Sandrini, S., Costabile, F., Gobbi, G. P., Pietrogrande, M. C., Visentin, M., Scotto, F., Fuzzi, S., and Facchini, M. C.: Direct observation of aqueous secondary organic aerosol from biomass-burning emissions, P. Natl. Acad. Sci. USA, 113, 10013–10018, https://doi.org/10.1073/pnas.1602212113, 2016.
Gordon, T. D., Tkacik, D. S., Presto, A. A., Zhang, M., Jathar, S. H., Nguyen, N. T., Massetti, J., Truong, T., Cicero-Fernandez, P., Maddox, C., Rieger, P., Chattopadhyay, S., Maldonado, H., Maricq, M. M., and Robinson, A. L.: Primary Gas- and Particle-Phase Emissions and Secondary Organic Aerosol Production from Gasoline and Diesel Off-Road Engines, Environ. Sci. Technol., 47, 14137–14146, https://doi.org/10.1021/es403556e, 2013.
Hallquist, M., Wenger, J. C., Baltensperger, U., Rudich, Y., Simpson, D., Claeys, M., Dommen, J., Donahue, N. M., George, C., Goldstein, A. H., Hamilton, J. F., Herrmann, H., Hoffmann, T., Iinuma, Y., Jang, M., Jenkin, M. E., Jimenez, J. L., Kiendler-Scharr, A., Maenhaut, W., McFiggans, G., Mentel, Th. F., Monod, A., Prévôt, A. S. H., Seinfeld, J. H., Surratt, J. D., Szmigielski, R., and Wildt, J.: The formation, properties and impact of secondary organic aerosol: current and emerging issues, Atmos. Chem. Phys., 9, 5155–5236, https://doi.org/10.5194/acp-9-5155-2009, 2009.
Hildebrandt, L., Engelhart, G. J., Mohr, C., Kostenidou, E., Lanz, V. A., Bougiatioti, A., DeCarlo, P. F., Prevot, A. S. H., Baltensperger, U., Mihalopoulos, N., Donahue, N. M., and Pandis, S. N.: Aged organic aerosol in the Eastern Mediterranean: the Finokalia Aerosol Measurement Experiment – 2008, Atmos. Chem. Phys., 10, 4167–4186, https://doi.org/10.5194/acp-10-4167-2010, 2010.
Hildebrandt Ruiz, L. and Yarwood, G.: Interactions between organic aerosol and NOy: Influence on oxidant production., University of Texas at Austin, and ENVIRON International Corporation, Novato, CA, 2013.
Hodzic, A., Jimenez, J. L., Madronich, S., Canagaratna, M. R., DeCarlo, P. F., Kleinman, L., and Fast, J.: Modeling organic aerosols in a megacity: potential contribution of semi-volatile and intermediate volatility primary organic compounds to secondary organic aerosol formation, Atmos. Chem. Phys., 10, 5491–5514, https://doi.org/10.5194/acp-10-5491-2010, 2010.
Hodzic, A., Kasibhatla, P. S., Jo, D. S., Cappa, C. D., Jimenez, J. L., Madronich, S., and Park, R. J.: Rethinking the global secondary organic aerosol (SOA) budget: stronger production, faster removal, shorter lifetime, Atmos. Chem. Phys., 16, 7917–7941, https://doi.org/10.5194/acp-16-7917-2016, 2016.
Horowitz, L. W., Walters, S., Mauzerall, D. L., Emmons, L. K., Rasch, P. J., Granier, C., Tie, X. X., Lamarque, J. F., Schultz, M. G., Tyndall, G. S., Orlando, J. J., and Brasseur, G. P.: A global simulation of tropospheric ozone and related tracers: Description and evaluation of MOZART, version 2, J. Geophys. Res.-Atmos, 108, 4784, https://doi.org/10.1029/2002jd002853, 2003.
Jathar, S. H., Farina, S. C., Robinson, A. L., and Adams, P. J.: The influence of semi-volatile and reactive primary emissions on the abundance and properties of global organic aerosol, Atmos. Chem. Phys., 11, 7727–7746, https://doi.org/10.5194/acp-11-7727-2011, 2011.
Jathar, S. H., Gordon, T. D., Hennigan, C. J., Pye, H. O. T., Pouliot, G., Adams, P. J., Donahue, N. M., and Robinson, A. L.: Unspeciated organic emissions from combustion sources and their influence on the secondary organic aerosol budget in the United States, P. Natl. Acad. Sci. USA, 111, 10473–10478, https://doi.org/10.1073/pnas.1323740111, 2014.
Jathar, S. H., Woody, M., Pye, H. O. T., Baker, K. R., and Robinson, A. L.: Chemical transport model simulations of organic aerosol in southern California: model evaluation and gasoline and diesel source contributions, Atmos. Chem. Phys., 17, 4305–4318, https://doi.org/10.5194/acp-17-4305-2017, 2017.
Jiang, J. and Aksoyoglu, S: Dataset for “Sources of organic aerosols in Europe: A modelling study using CAMx with modified volatility basis set scheme”, https://doi.org/10.5281/zenodo.3540796, last access: 6 December, 2019a.
Jiang, J. and Aksoyoglu, S: Source code of PSI-VBS module based on CAMx v6.3, https://doi.org/10.5281/zenodo.3540826, last access: 6 December, 2019b.
Jiang, J., Aksoyoglu, S., Ciarelli, G., Oikonomakis, E., El-Haddad, I., Canonaco, F., O'Dowd, C., Ovadnevaite, J., Minguillón, M. C., Baltensperger, U., and Prévôt, A. S. H.: Effects of two different biogenic emission models on modelled ozone and aerosol concentrations in Europe, Atmos. Chem. Phys., 19, 3747–3768, https://doi.org/10.5194/acp-19-3747-2019, 2019.
Jimenez, J. L., Canagaratna, M. R., Donahue, N. M., Prevot, A. S. H., Zhang, Q., Kroll, J. H., DeCarlo, P. F., Allan, J. D., Coe, H., Ng, N. L., Aiken, A. C., Docherty, K. S., Ulbrich, I. M., Grieshop, A. P., Robinson, A. L., Duplissy, J., Smith, J. D., Wilson, K. R., Lanz, V. A., Hueglin, C., Sun, Y. L., Tian, J., Laaksonen, A., Raatikainen, T., Rautiainen, J., Vaattovaara, P., Ehn, M., Kulmala, M., Tomlinson, J. M., Collins, D. R., Cubison, M. J., Dunlea, E. J., Huffman, J. A., Onasch, T. B., Alfarra, M. R., Williams, P. I., Bower, K., Kondo, Y., Schneider, J., Drewnick, F., Borrmann, S., Weimer, S., Demerjian, K., Salcedo, D., Cottrell, L., Griffin, R., Takami, A., Miyoshi, T., Hatakeyama, S., Shimono, A., Sun, J. Y., Zhang, Y. M., Dzepina, K., Kimmel, J. R., Sueper, D., Jayne, J. T., Herndon, S. C., Trimborn, A. M., Williams, L. R., Wood, E. C., Middlebrook, A. M., Kolb, C. E., Baltensperger, U., and Worsnop, D. R.: Evolution of Organic Aerosols in the Atmosphere, Science, 326, 1525–1529, https://doi.org/10.1126/science.1180353, 2009.
Kanakidou, M., Seinfeld, J. H., Pandis, S. N., Barnes, I., Dentener, F. J., Facchini, M. C., Van Dingenen, R., Ervens, B., Nenes, A., Nielsen, C. J., Swietlicki, E., Putaud, J. P., Balkanski, Y., Fuzzi, S., Horth, J., Moortgat, G. K., Winterhalter, R., Myhre, C. E. L., Tsigaridis, K., Vignati, E., Stephanou, E. G., and Wilson, J.: Organic aerosol and global climate modelling: a review, Atmos. Chem. Phys., 5, 1053–1123, https://doi.org/10.5194/acp-5-1053-2005, 2005.
Knote, C., Brunner, D., Vogel, H., Allan, J., Asmi, A., Äijälä, M., Carbone, S., van der Gon, H. D., Jimenez, J. L., Kiendler-Scharr, A., Mohr, C., Poulain, L., Prévôt, A. S. H., Swietlicki, E., and Vogel, B.: Towards an online-coupled chemistry-climate model: evaluation of trace gases and aerosols in COSMO-ART, Geosci. Model Dev., 4, 1077–1102, https://doi.org/10.5194/gmd-4-1077-2011, 2011.
Koo, B., Wilson, G. M., Morris, R. E., Dunker, A. M., and Yarwood, G.: Comparison of Source Apportionment and Sensitivity Analysis in a Particulate Matter Air Quality Model, Environ. Sci. Technol., 43, 6669–6675, https://doi.org/10.1021/es9008129, 2009.
Koo, B., Knipping, E., and Yarwood, G.: 1.5-Dimensional volatility basis set approach for modeling organic aerosol in CAMx and CMAQ, Atmos. Environ., 95, 158–164, https://doi.org/10.1016/j.atmosenv.2014.06.031, 2014.
Kortelainen, A., Hao, L. Q., Tiitta, P., Jaatinen, A., Miettinen, P., Kulmala, M., Smith, J. N., Laaksonen, A., Worsnop, D. R., and Virtanen, A.: Sources of particulate organic nitrates in the boreal forest in Finland, Boreal Environ. Res., 22, 13–26, 2017.
Kuenen, J. J. P., Visschedijk, A. J. H., Jozwicka, M., and Denier van der Gon, H. A. C.: TNO-MACC_II emission inventory; a multi-year (2003–2009) consistent high-resolution European emission inventory for air quality modelling, Atmos. Chem. Phys., 14, 10963–10976, https://doi.org/10.5194/acp-14-10963-2014, 2014.
Kwok, R. H. F., Napelenok, S. L., and Baker, K. R.: Implementation and evaluation of PM2.5 source contribution analysis in a photochemical model, Atmos. Environ., 80, 398–407, https://doi.org/10.1016/j.atmosenv.2013.08.017, 2013.
Lane, T. E., Donahue, N. M., and Pandis, S. N.: Simulating secondary organic aerosol formation using the volatility basis-set approach in a chemical transport model, Atmos. Environ., 42, 7439–7451, https://doi.org/10.1016/j.atmosenv.2008.06.026, 2008.
Lanz, V. A., Prévôt, A. S. H., Alfarra, M. R., Weimer, S., Mohr, C., DeCarlo, P. F., Gianini, M. F. D., Hueglin, C., Schneider, J., Favez, O., D'Anna, B., George, C., and Baltensperger, U.: Characterization of aerosol chemical composition with aerosol mass spectrometry in Central Europe: an overview, Atmos. Chem. Phys., 10, 10453–10471, https://doi.org/10.5194/acp-10-10453-2010, 2010.
Lelieveld, J., Evans, J. S., Fnais, M., Giannadaki, D., and Pozzer, A.: The contribution of outdoor air pollution sources to premature mortality on a global scale, Nature, 525, 367–371, https://doi.org/10.1038/nature15371, 2015.
Lin, C. S., Huang, R. J., Ceburnis, D., Buckley, P., Preissler, J., Wenger, J., Rinaldi, M., Facchini, M. C., O'Dowd, C., and Ovadnevaite, J.: Extreme air pollution from residential solid fuel burning, Nat. Sustain., 1, 512–517, https://doi.org/10.1038/s41893-018-0125-x, 2018.
Meroni, A., Pirovano, G., Gilardoni, S., Lonati, G., Colombi, C., Gianelle, V., Paglione, M., Poluzzi, V., Riva, G. M., and Toppetti, A.: Investigating the role of chemical and physical processes on organic aerosol modelling with CAMx in the Po Valley during a winter episode, Atmos. Environ., 171, 126–142, https://doi.org/10.1016/j.atmosenv.2017.10.004, 2017.
Meteorological Office: Met Office integrated data archive system (MIDAS) land and marine surface stations data (1853–current), available at: http://badc.nerc.ac.uk/data/ukmo-midas, 2013 (last access: 6 December 2019), 2013.
Mol, W. and Leeuw, F.: AirBase: a valuable tool in air quality assessments, Proceedings of the 5th International Conference on Urban Air Quality, Valencia, Spain, 2005.
Murphy, B. N. and Pandis, S. N.: Simulating the Formation of Semivolatile Primary and Secondary Organic Aerosol in a Regional Chemical Transport Model, Environ. Sci. Technol., 43, 4722-4728, https://doi.org/10.1021/es803168a, 2009.
NCAR: The Tropospheric Visible and Ultraviolet (TUV) Radiation Model web page, National Center for Atmospheric Research, Atmospheric Chemistry Division, Boulder, Colorado, 2011.
Nenes, A., Pandis, S. N., and Pilinis, C.: ISORROPIA: A new thermodynamic equilibrium model for multiphase multicomponent inorganic aerosols, Aquat. Geochem., 4, 123–152, https://doi.org/10.1023/a:1009604003981, 1998.
Oderbolz, D. C., Aksoyoglu, S., Keller, J., Barmpadimos, I., Steinbrecher, R., Skjøth, C. A., Plaß-Dülmer, C., and Prévôt, A. S. H.: A comprehensive emission inventory of biogenic volatile organic compounds in Europe: improved seasonality and land-cover, Atmos. Chem. Phys., 13, 1689–1712, https://doi.org/10.5194/acp-13-1689-2013, 2013.
Oikonomakis, E., Aksoyoglu, S., Ciarelli, G., Baltensperger, U., and Prévôt, A. S. H.: Low modeled ozone production suggests underestimation of precursor emissions (especially NOx) in Europe, Atmos. Chem. Phys., 18, 2175–2198, https://doi.org/10.5194/acp-18-2175-2018, 2018.
Ovadnevaite, J., Ceburnis, D., Leinert, S., Dall'Osto, M., Canagaratna, M., O'Doherty, S., Berresheim, H., and O'Dowd, C.: Submicron NE Atlantic marine aerosol chemical composition and abundance: Seasonal trends and air mass categorization, J. Geophys. Res.-Atmos, 119, 11850–11863, https://doi.org/10.1002/2013jd021330, 2014.
Paglione, M., Gilardoni, S., Rinaldi, M., Decesari, S., Zanca, N., Sandrini, S., Giulianelli, L., Bacco, D., Ferrari, S., Poluzzi, V., Scotto, F., Trentini, A., Poulain, L., Herrmann, H., Wiedensohler, A., Canonaco, F., Prévôt, A. S. H., Massoli, P., Carbone, C., Facchini, M. C., and Fuzzi, S.: The impact of biomass burning and aqueous-phase processing on air quality: a multi-year source apportionment study in the Po Valley, Italy, Atmos. Chem. Phys. Discuss., https://doi.org/10.5194/acp-2019-274, in review, 2019.
Passant, N. R.: Speciation of UK emissions of non-methane volatile organic compounds, AEA Technology, Culham, Abingdon, Oxon, UK, 2002.
Petit, J.-E., Favez, O., Sciare, J., Canonaco, F., Croteau, P., Močnik, G., Jayne, J., Worsnop, D., and Leoz-Garziandia, E.: Submicron aerosol source apportionment of wintertime pollution in Paris, France by double positive matrix factorization (PMF2) using an aerosol chemical speciation monitor (ACSM) and a multi-wavelength Aethalometer, Atmos. Chem. Phys., 14, 13773–13787, https://doi.org/10.5194/acp-14-13773-2014, 2014.
Petit, J.-E., Favez, O., Sciare, J., Crenn, V., Sarda-Estève, R., Bonnaire, N., Močnik, G., Dupont, J.-C., Haeffelin, M., and Leoz-Garziandia, E.: Two years of near real-time chemical composition of submicron aerosols in the region of Paris using an Aerosol Chemical Speciation Monitor (ACSM) and a multi-wavelength Aethalometer, Atmos. Chem. Phys., 15, 2985–3005, https://doi.org/10.5194/acp-15-2985-2015, 2015.
Platt, S. M., El Haddad, I., Pieber, S. M., Zardini, A. A., Suarez-Bertoa, R., Clairotte, M., Daellenbach, K. R., Huang, R. J., Slowik, J. G., Hellebust, S., Temime-Roussel, B., Marchand, N., de Gouw, J., Jimenez, J. L., Hayes, P. L., Robinson, A. L., Baltensperger, U., Astorga, C., and Prévôt, A. S. H.: Gasoline cars produce more carbonaceous particulate matter than modern filter-equipped diesel cars, Sci. Rep., 7, 4926, https://doi.org/10.1038/s41598-017-03714-9, 2017.
Qi, L., Chen, M., Stefenelli, G., Pospisilova, V., Tong, Y., Bertrand, A., Hueglin, C., Ge, X., Baltensperger, U., Prévôt, A. S. H., and Slowik, J. G.: Organic aerosol source apportionment in Zurich using an extractive electrospray ionization time-of-flight mass spectrometer (EESI-TOF-MS) – Part 2: Biomass burning influences in winter, Atmos. Chem. Phys., 19, 8037–8062, https://doi.org/10.5194/acp-19-8037-2019, 2019.
Ramboll: User's guide: the Comprehensive Air Quality Model with extensions (CAMx) version 6.5, California, 2018.
Ramboll Environ: User's guide: the Comprehensive Air Quality Model with extensions (CAMx) version 6.3, California, USA, 2016.
Ripoll, A., Minguillón, M. C., Pey, J., Jimenez, J. L., Day, D. A., Sosedova, Y., Canonaco, F., Prévôt, A. S. H., Querol, X., and Alastuey, A.: Long-term real-time chemical characterization of submicron aerosols at Montsec (southern Pyrenees, 1570 m a.s.l.), Atmos. Chem. Phys., 15, 2935–2951, https://doi.org/10.5194/acp-15-2935-2015, 2015.
Robinson, A. L., Donahue, N. M., Shrivastava, M. K., Weitkamp, E. A., Sage, A. M., Grieshop, A. P., Lane, T. E., Pierce, J. R., and Pandis, S. N.: Rethinking Organic Aerosols: Semivolatile Emissions and Photochemical Aging, Science, 315, 1259–1262, https://doi.org/10.1126/science.1133061, 2007.
Schmale, J., Henning, S., Henzing, B., Keskinen, H., Sellegri, K., Ovadnevaite, J., Bougiatioti, A., Kalivitis, N., Stavroulas, I., Jefferson, A., Park, M., Schlag, P., Kristensson, A., Iwamoto, Y., Pringle, K., Reddington, C., Aalto, P., Äijälä, M., Baltensperger, U., Bialek, J., Birmili, W., Bukowiecki, N., Ehn, M., Fjæraa, A. M., Fiebig, M., Frank, G., Fröhlich, R., Frumau, A., Furuya, M., Hammer, E., Heikkinen, L., Herrmann, E., Holzinger, R., Hyono, H., Kanakidou, M., Kiendler-Scharr, A., Kinouchi, K., Kos, G., Kulmala, M., Mihalopoulos, N., Motos, G., Nenes, A., O'Dowd, C., Paramonov, M., Petäjä, T., Picard, D., Poulain, L., Prévôt, A. S. H., Slowik, J., Sonntag, A., Swietlicki, E., Svenningsson, B., Tsurumaru, H., Wiedensohler, A., Wittbom, C., Ogren, J. A., Matsuki, A., Yum, S. S., Myhre, C. L., Carslaw, K., Stratmann, F., and Gysel, M.: Collocated observations of cloud condensation nuclei, particle size distributions, and chemical composition, Sci. Data, 4, 170003, https://doi.org/10.1038/sdata.2017.3, 2017.
Shrivastava, M., Fast, J., Easter, R., Gustafson Jr., W. I., Zaveri, R. A., Jimenez, J. L., Saide, P., and Hodzic, A.: Modeling organic aerosols in a megacity: comparison of simple and complex representations of the volatility basis set approach, Atmos. Chem. Phys., 11, 6639–6662, https://doi.org/10.5194/acp-11-6639-2011, 2011.
Shrivastava, M., Zelenyuk, A., Imre, D., Easter, R., Beranek, J., Zaveri, R. A., and Fast, J.: Implications of low volatility SOA and gas-phase fragmentation reactions on SOA loadings and their spatial and temporal evolution in the atmosphere, J. Geophys. Res.-Atmos, 118, 3328–3342, https://doi.org/10.1002/jgrd.50160, 2013.
Shrivastava, M., Easter, R. C., Liu, X. H., Zelenyuk, A., Singh, B., Zhang, K., Ma, P. L., Chand, D., Ghan, S., Jimenez, J. L., Zhang, Q., Fast, J., Rasch, P. J., and Tiitta, P.: Global transformation and fate of SOA: Implications of low-volatility SOA and gas-phase fragmentation reactions, J. Geophys. Res.-Atmos, 120, 4169–4195, https://doi.org/10.1002/2014jd022563, 2015.
Shrivastava, M., Cappa, C. D., Fan, J. W., Goldstein, A. H., Guenther, A. B., Jimenez, J. L., Kuang, C., Laskin, A., Martin, S. T., Ng, N. L., Petaja, T., Pierce, J. R., Rasch, P. J., Roldin, P., Seinfeld, J. H., Shilling, J., Smith, J. N., Thornton, J. A., Volkamer, R., Wang, J., Worsnop, D. R., Zaveri, R. A., Zelenyuk, A., and Zhang, Q.: Recent advances in understanding secondary organic aerosol: Implications for global climate forcing, Rev. Geophys., 55, 509–559, https://doi.org/10.1002/2016rg000540, 2017.
Shrivastava, M., Andreae, M. O., Artaxo, P., Barbosa, H. M. J., Berg, L. K., Brito, J., Ching, J., Easter, R. C., Fan, J. W., Fast, J. D., Feng, Z., Fuentes, J. D., Glasius, M., Goldstein, A. H., Alves, E. G., Gomes, H., Gu, D., Guenther, A., Jathar, S. H., Kim, S., Liu, Y., Lou, S. J., Martin, S. T., McNeill, V. F., Medeiros, A., de Sa, S. S., Shilling, J. E., Springston, S. R., Souza, R. A. F., Thornton, J. A., Isaacman-VanWertz, G., Yee, L. D., Ynoue, R., Zaveri, R. A., Zelenyuk, A., and Zhao, C.: Urban pollution greatly enhances formation of natural aerosols over the Amazon rainforest, Nature Communications, 10, 1046, https://doi.org/10.1038/s41467-019-08909-4, 2019.
Skamarock, W. C., Klemp, J. B., Dudhia, J., Gill, D. O., Barker, D. M., Duda, M. G., Huang, X.-Y., Wang, W., and Powers, J. G.: A Description of the Advanced Research WRF Version 3, Mesoscale and Microscale Meteorology Division, National Center for Atmospheric Research, Boulder, Colorado, USA, 2008.
Skyllakou, K., Fountoukis, C., Charalampidis, P., and Pandis, S. N.: Volatility-resolved source apportionment of primary and secondary organic aerosol over Europe, Atmos. Environ., 167, 1–10, https://doi.org/10.1016/j.atmosenv.2017.08.005, 2017.
Srivastava, D., Favez, O., Perraudin, E., Villenave, E., and Albinet, A.: Comparison of Measurement-Based Methodologies to Apportion Secondary Organic Carbon (SOC) in PM2.5: A Review of Recent Studies, Atmosphere, 9, 452, https://doi.org/10.3390/atmos9110452, 2018.
Theodoritsi, G. N. and Pandis, S. N.: Simulation of the chemical evolution of biomass burning organic aerosol, Atmos. Chem. Phys., 19, 5403–5415, https://doi.org/10.5194/acp-19-5403-2019, 2019.
Tsigaridis, K., Daskalakis, N., Kanakidou, M., Adams, P. J., Artaxo, P., Bahadur, R., Balkanski, Y., Bauer, S. E., Bellouin, N., Benedetti, A., Bergman, T., Berntsen, T. K., Beukes, J. P., Bian, H., Carslaw, K. S., Chin, M., Curci, G., Diehl, T., Easter, R. C., Ghan, S. J., Gong, S. L., Hodzic, A., Hoyle, C. R., Iversen, T., Jathar, S., Jimenez, J. L., Kaiser, J. W., Kirkevåg, A., Koch, D., Kokkola, H., Lee, Y. H., Lin, G., Liu, X., Luo, G., Ma, X., Mann, G. W., Mihalopoulos, N., Morcrette, J.-J., Müller, J.-F., Myhre, G., Myriokefalitakis, S., Ng, N. L., O'Donnell, D., Penner, J. E., Pozzoli, L., Pringle, K. J., Russell, L. M., Schulz, M., Sciare, J., Seland, Ø., Shindell, D. T., Sillman, S., Skeie, R. B., Spracklen, D., Stavrakou, T., Steenrod, S. D., Takemura, T., Tiitta, P., Tilmes, S., Tost, H., van Noije, T., van Zyl, P. G., von Salzen, K., Yu, F., Wang, Z., Wang, Z., Zaveri, R. A., Zhang, H., Zhang, K., Zhang, Q., and Zhang, X.: The AeroCom evaluation and intercomparison of organic aerosol in global models, Atmos. Chem. Phys., 14, 10845–10895, https://doi.org/10.5194/acp-14-10845-2014, 2014.
Tsimpidi, A. P., Karydis, V. A., Zavala, M., Lei, W., Molina, L., Ulbrich, I. M., Jimenez, J. L., and Pandis, S. N.: Evaluation of the volatility basis-set approach for the simulation of organic aerosol formation in the Mexico City metropolitan area, Atmos. Chem. Phys., 10, 525–546, https://doi.org/10.5194/acp-10-525-2010, 2010.
Tuet, W. Y., Chen, Y., Xu, L., Fok, S., Gao, D., Weber, R. J., and Ng, N. L.: Chemical oxidative potential of secondary organic aerosol (SOA) generated from the photooxidation of biogenic and anthropogenic volatile organic compounds, Atmos. Chem. Phys., 17, 839–853, https://doi.org/10.5194/acp-17-839-2017, 2017.
Vlachou, A., Daellenbach, K. R., Bozzetti, C., Chazeau, B., Salazar, G. A., Szidat, S., Jaffrezo, J.-L., Hueglin, C., Baltensperger, U., Haddad, I. E., and Prévôt, A. S. H.: Advanced source apportionment of carbonaceous aerosols by coupling offline AMS and radiocarbon size-segregated measurements over a nearly 2-year period, Atmos. Chem. Phys., 18, 6187–6206, https://doi.org/10.5194/acp-18-6187-2018, 2018.
Wang, Z. S., Chien, C. J., and Tonnesen, G. S.: Development of a tagged species source apportionment algorithm to characterize three-dimensional transport and transformation of precursors and secondary pollutants, J. Geophys. Res.-Atmos, 114, D21206, https://doi.org/10.1029/2008jd010846, 2009.
Woody, M. C., Baker, K. R., Hayes, P. L., Jimenez, J. L., Koo, B., and Pye, H. O. T.: Understanding sources of organic aerosol during CalNex-2010 using the CMAQ-VBS, Atmos. Chem. Phys., 16, 4081–4100, https://doi.org/10.5194/acp-16-4081-2016, 2016.
Yttri, K. E., Simpson, D., Bergström, R., Kiss, G., Szidat, S., Ceburnis, D., Eckhardt, S., Hueglin, C., Nøjgaard, J. K., Perrino, C., Pisso, I., Prevot, A. S. H., Putaud, J.-P., Spindler, G., Vana, M., Zhang, Y.-L., and Aas, W.: The EMEP Intensive Measurement Period campaign, 2008–2009: characterizing carbonaceous aerosol at nine rural sites in Europe, Atmos. Chem. Phys., 19, 4211–4233, https://doi.org/10.5194/acp-19-4211-2019, 2019.
Zhang, Q. J., Beekmann, M., Drewnick, F., Freutel, F., Schneider, J., Crippa, M., Prevot, A. S. H., Baltensperger, U., Poulain, L., Wiedensohler, A., Sciare, J., Gros, V., Borbon, A., Colomb, A., Michoud, V., Doussin, J.-F., Denier van der Gon, H. A. C., Haeffelin, M., Dupont, J.-C., Siour, G., Petetin, H., Bessagnet, B., Pandis, S. N., Hodzic, A., Sanchez, O., Honoré, C., and Perrussel, O.: Formation of organic aerosol in the Paris region during the MEGAPOLI summer campaign: evaluation of the volatility-basis-set approach within the CHIMERE model, Atmos. Chem. Phys., 13, 5767–5790, https://doi.org/10.5194/acp-13-5767-2013, 2013.
Zhang, Q. J., Beekmann, M., Freney, E., Sellegri, K., Pichon, J. M., Schwarzenboeck, A., Colomb, A., Bourrianne, T., Michoud, V., and Borbon, A.: Formation of secondary organic aerosol in the Paris pollution plume and its impact on surrounding regions, Atmos. Chem. Phys., 15, 13973–13992, https://doi.org/10.5194/acp-15-13973-2015, 2015.
Zhang, Y., Favez, O., Petit, J.-E., Canonaco, F., Truong, F., Bonnaire, N., Crenn, V., Amodeo, T., Prévôt, A. S. H., Sciare, J., Gros, V., and Albinet, A.: Six-year source apportionment of submicron organic aerosols from near-continuous highly time-resolved measurements at SIRTA (Paris area, France), Atmos. Chem. Phys., 19, 14755–14776, https://doi.org/10.5194/acp-19-14755-2019, 2019.
Zhao, Y., Saleh, R., Saliba, G., Presto, A. A., Gordon, T. D., Drozd, G. T., Goldstein, A. H., Donahue, N. M., and Robinson, A. L.: Reducing secondary organic aerosol formation from gasoline vehicle exhaust, P. Natl. Acad. Sci. USA, 114, 6984–6989, https://doi.org/10.1073/pnas.1620911114, 2017.