the Creative Commons Attribution 4.0 License.
the Creative Commons Attribution 4.0 License.
The role of aerosol–radiation–cloud interactions in linking anthropogenic pollution over southern west Africa and dust emission over the Sahara
Paolo Tuccella
Cyrille Flamant
Adrien Deroubaix
Marco Gaetani
The aerosol direct and indirect effects are studied over west Africa in the summer of 2016 using the coupled WRF-CHIMERE regional model including aerosol–cloud interaction parameterization. First, a reference simulation is performed and compared with observations acquired during the Dynamics-aerosol-chemistry-cloud interactions in West Africa (DACCIWA) field campaign which took place in June and July 2016. Sensitivity experiments are also designed to gain insights into the impact of the aerosols dominating the atmospheric composition in southern west Africa (one simulation with halved anthropogenic emissions and one with halved mineral dust emissions). The most important effect of aerosol–cloud interactions is found for the mineral dust scenario, and it is shown that halving the emissions of mineral dust decreases the 2 m temperature by 0.5 K and the boundary layer height by 25 m on a monthly average (July 2016) and over the Saharan region. The presence of dust aerosols also increases (decreases) the shortwave (longwave) radiation at the surface by 25 W m−2. It is also shown that the decrease of anthropogenic emissions along the coast has an impact on the mineral dust load over west Africa by increasing their emissions in the Saharan region. It is due to a mechanism where particulate matter concentrations are decreased along the coast, imposing a latitudinal shift of the monsoonal precipitation and, in turn, an increase of the surface wind speed over arid areas, inducing more mineral dust emissions.
- Article
(18993 KB) - Full-text XML
- BibTeX
- EndNote
Megacities in the Gulf of Guinea are under frequent and intense air pollution episodes, with pollutants mostly originating from local anthropogenic emissions as well as form a variety of remote sources such as the Sahara and the Sahel (mineral dust), and central Africa (biomass burning products). This atmospheric pollution has an impact on human health (Bauer et al., 2019) and climate but also, in the short term, on meteorology and radiation through the direct and indirect effects of aerosols (Haywood and Boucher, 2000; Andreae and Rosenfeld, 2008). These interactions are complex and not completely known, and many studies are currently investigating this relationship to quantify how aerosols can affect meteorology and radiation. These studies cover many different scientific questions from hourly air quality (Yu et al., 2014; Forkel et al., 2015; Zhao et al., 2017) to long-term climate impacts (Mahowald et al., 2003; Luo et al., 2003).
Emitted mainly from Sahara and Sahel, mineral dust is of great interest for the aerosol–radiation–cloud interactions (ARCIs). Its abundance as well as its absorbing properties in the shortwave and longwave massively affect the radiation in the atmospheric column. Helmert et al. (2007) quantified the direct and semi-direct effects of Saharan dust over northern Africa and Europe and showed a decrease of 2 m temperature. After correction of the dust absorption used in models, Balkanski et al. (2007) showed, with the LMDz-INCA global model, that the dust radiative effect strongly depends on the brightness of the surface: over oceans and deciduous surfaces (albedo <0.15), dust will cool the atmospheric column. Over desert (albedo >0.3), dust will warm the atmospheric column. Using measurements, di Sarra et al. (2011) showed a large dust effect on shortwave and longwave radiation when dust plumes pass over Lampedusa. Rémy et al. (2015) quantified the feedbacks between free-troposphere dust layers and boundary layer meteorology and showed that maximum temperatures are reduced, increasing atmospheric stability, then decreasing 10 m wind speed during daytime. The increase in atmospheric stability was also studied by Guo and Yin (2015), showing a decrease in east Asian precipitation as well as a reduction of the monsoon intensity due to a decrease of the land–sea temperature gradient. Mineral dust impacts precipitation because it is a large contributor to cloud condensation nuclei (CCN) and ice-nucleating particle (INP) formation (DeMott et al., 2010; Andreae and Rosenfeld, 2008). Heinold et al. (2011) studied the radiative impact of mineral dust and biomass burning on the dynamics in Africa with the Consortium for Small-Scale Modeling – Multi-Scale Chemistry Aerosol Transport (COSMO-MUSCAT) regional coupled model. They showed that the presence of these aerosols significantly modifies the dynamics close to the Gulf of Guinea by enhancing the Hadley circulation and creating convergence zones. Other recent studies show a variable impact on clouds and precipitation depending on the dust composition, size of the particles or altitude of the plume. In the upper troposphere, Hande et al. (2015), Nickovic et al. (2016) and Weger et al. (2018) showed the importance of mineral dust to create ice clouds.
During the West African Monsoon (WAM) (Parker et al., 2005), the ARCIs are more complex than during the boreal winter and are not currently well known. This is partly due to the installation of deep convection inland leading to the development of mesoscale convective systems (MCSs) and frequent precipitation events. It was studied during the AMMA project (Redelsperger et al., 2006) and was at the heart of the recent Dynamics-aerosol-chemistry-cloud interactions in West Africa (DACCIWA) project (Knippertz et al., 2015a, b, 2017; Flamant et al., 2018). Zhao et al. (2011) showed that mineral dust has a cooling effect at the surface and a warming effect in the troposphere. This leads to an increase of atmospheric stability during the day but a decrease at night. It has an impact (but moderate) on precipitation by reducing the late afternoon precipitation but increasing that of the morning. Shi et al. (2014) studied the impact of a MCS and quantified the decrease in precipitation due to the indirect effect and a delay in the precipitation event due to the direct effect. The large-scale effect of aerosol on precipitation of the WAM was studied by Huang et al. (2009), where they showed a reduction of precipitation of 1.5 mm d−1 (at the maximum). Using Moderate Resolution Imaging Spectroradiometer (MODIS) and Cloud-Aerosol Lidar and Infrared Pathfinder Satellite Observation (CALIPSO) satellite measurements, Costantino and Bréon (2013) also studied the aerosol indirect impact on warm clouds over the southeast Atlantic and showed a decrease of the cloud droplet radius but also in cloud liquid water path probably due to a dry air entrainment at cloud top.
In the framework of the DACCIWA project, the impact of long-range transport of dust and biomass burning on surface pollution (gas and aerosols) was quantified using measurements and the WRF-CHIMERE model in Menut et al. (2018). However, this was done without taking into account the interactions between aerosols and clouds, and for the summer of 2014, so a comparison with extensive measurements was not possible. Deetz et al. (2018a) used the COSMO Aerosols and Reactive Trace gases (ART) online coupled model and analysed the radiative impact of aerosols on liquid water content during the month of July 2016 and over the Gulf of Guinea. They quantified the important impact of aerosol on shortwave radiation (a decrease of −20 W m−2), whereas the impact on longwave radiation was found to be negligible. In the continuity of this work, Deetz et al. (2018b) showed that the amount of aerosols over southern west Africa impacts the dynamics of the daytime coastal moist front generated along the Gulf of Guinea and the intensity of its inland propagation, with this feature modulating the transport of anthropogenic aerosols emitted at the coast (Deroubaix et al., 2019).
In the present study, we use the coupled regional model WRF-CHIMERE, including an aerosol–cloud interaction parameterization, to quantify the ARCIs over the Gulf of Guinea within a modelled domain much larger than in Menut et al. (2018), in order to take into account the spatial and temporal variability of remote aerosol sources such as the Sahara or central Africa. In Sect. 2, we present the observations used to estimate the realism of our simulations. In Sect. 3, we present the details of the online coupled model used, as well as the different ways that are designed to quantify the ARCIs. In Sect. 4, the reference simulation is compared to observations. In Sect. 5, we perform simulations using emissions scenarios to estimate the ARCIs when individual sources (dust and anthropogenic aerosols) are modified in a realistic manner. Conclusions are presented in Sect. 7.
A large part of this study is focused on model–model comparisons. However, in order to evaluate the realism of the reference simulation, we compare the modelled outputs to the AErosol RObotic NETwork (AERONET) and Met Office Integrated Data Archive System (MIDAS) measurements. The data of these stations were previously used in Menut et al. (2018) for the study of biomass burning plumes transport in the Gulf of Guinea, and it has been shown that they are well adapted for these kinds of studies with large modelled domains.
Aerosol optical depth (AOD) level 2 measurements are used from the AERONET dataset (Holben et al., 2001). Comparisons between measurements and model outputs are performed using hourly time series of AOD at a wavelength of λ=550 nm.
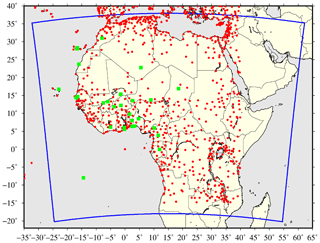
Figure 1Map of the studied domain. The blue frame represents the modelled domain. The red dots correspond to the Met Office MIDAS meteorological surface stations. The green dots correspond to the AERONET stations.
The MIDAS meteorological surface station data (MetOffice, 2012) are used for precipitation rate, 2 m temperature and 10 m wind speed measurements. These observations are available in a 3-hourly format and for many locations. For 10 m wind speed and 2 m temperature, instantaneous values are provided, while for precipitation rates, cumulated data over varying durations are proposed. All stations are displayed in Fig. 1, even if data are not always available for all stations and all hours.
The DACCIWA radiosounding campaign took place between 11 June and 31 July 2016, while the aircraft campaign spanned from 29 June to 16 July 2016. Details on the radiosounding and aircraft strategies are fully described in Flamant et al. (2018). In the following, we shall compare the simulations to airborne measurements acquired from the German Deutsches Zentrum für Luft- und Raumfahrt (DLR) Falcon 20 and the French Service des Avions Francais Instrumentés pour la Recherche en Environnement (SAFIRE) ATR 42 on 13 July 2016. Likewise, comparison with radiosoundings is carried for the period 1–31 July 2016.
3.1 The WRF and CHIMERE models
To quantify interactions between aerosols, clouds and radiation, numerous online models were recently developed. These models are extensively presented and discussed in the reference papers of Zhang (2008) and Baklanov et al. (2014). In this study, we use a new online access model built with the Weather and Research Forecasting (WRF) (Powers et al., 2017) and CHIMERE (Mailler et al., 2017) regional models. This coupling was developed following two phases: the direct effect by Briant et al. (2017) and the indirect effect by Tuccella et al. (2019). The choice for the coupling approach was to be the least intrusive possible in the two models and to implement a dialogue between them by using an external coupler, the Ocean Atmosphere Sea Ice Soil – Model Coupling Toolkit (OASIS-MCT) (Craig et al., 2017). For the direct effects, CHIMERE sends to WRF the AOD, single-scattering albedo (calculated with the Fast-JX online model) and asymmetry factor. For the indirect effects, CHIMERE sends to WRF the aerosol number size distribution, the hygroscopic aerosol number size distribution, the aerosol bulk hygroscopicity and the ice nuclei. The variables are exchanged with a frequency of 30 min.
The WRF version 3.7.1 regional model is used and calculates the meteorological variables. The model configuration is the same as in Menut et al. (2018). The global meteorological analyses from the National Centers for Environmental Prediction (NCEP) with the Global Forecast System (GFS) products are used to nudge regional fields for pressure, temperature, humidity and wind. The spectral nudging approach is used (von Storch et al., 2000) for wavelengths greater than ≈2000 km, corresponding to wavenumbers less than 3 in latitude and longitude, for wind, temperature and humidity, and only above 850 hPa. This configuration allows the regional model to create its own thermodynamics within the boundary layer. The large scale follows the thermodynamic fields from the NCEP analyses.
The CHIMERE chemistry–transport model calculates the concentrations of the gaseous and aerosols species. WRF and CHIMERE use the same horizontal grid with a 60 km×60 km resolution to avoid interpolation during the coupling. The output results are issued hourly. The modelled period ranges from 15 June to 31 July 2016. We consider the first 2 weeks as spin-up time, and the results are analysed from 1 to 31 July 2016.
3.2 The aerosol–radiation–cloud interactions
The direct effect considers the scattering and absorption of solar and telluric radiation by aerosols (Haywood and Boucher, 2000; Helmert et al., 2007; Zhang, 2008). It impacts the atmospheric dynamics below an aerosol layer by modifying the temperature and wind speed. In our model configuration, the direct effect is taken into account by estimating the AOD, the single scattering albedo (SSA) and the asymmetry factor with CHIMERE and sending them to WRF and the Rapid Radiative Transfer Model for General Circulation Models (RRTMG) radiative transfer scheme (Iacono et al., 2008). Some direct effects were already quantified with WRF-CHIMERE in Briant et al. (2017), studying the interactions between mineral dust concentrations and temperature in Africa.
The indirect effect takes into account the aerosol-induced increase in CCN and INPs, as well as the subsequent changes in cloud properties. An increase of CCN induces an enhanced cloud albedo, a longer lifetime of clouds (first indirect effect) and an enhanced cloud reflectivity due to suppression of precipitation (second indirect effect) (Andreae and Rosenfeld, 2008). The grid-resolved cloud microphysics parameterization used in WRF is the aerosol-aware scheme of Thompson and Eidhammer (2014). This scheme calculates the cloud droplet nucleation rate using the aerosol size distribution calculated in CHIMERE. The change in cloud optical properties due to aerosol–cloud interaction feeds the short- and longwave radiation schemes as described in Tuccella et al. (2019). Following Thompson and Eidhammer (2014), the radiative transfer is forced by cloud optical depth calculated from cloud droplet and INP concentration and their effective radius. The effective radii of liquid and frozen cloud water are computed with the parameterization of Slingo (1989) and Stephens et al. (1990), respectively. With CHIMERE using a sectional approach for aerosol, the activation scheme of Thompson and Eidhammer (2014) is replaced by the one of Abdul-Razzak and Ghan (2002) in the present version of the coupled model. For the cloud ice formation, it is calculated in Thompson and Eidhammer (2014) using the INPs calculated in CHIMERE. For INP estimation, only mineral dust concentrations with mean mass median diameter Dp>0.5 µm are taken into account. The scheme for heterogeneous ice nucleation is the one of DeMott et al. (2015). Homogeneous freezing of deliquesced aerosols is parameterized as in Thompson and Eidhammer (2014), following the method of Koop et al. (2001). The climatology of deliquesced aerosol number concentration is replaced with the CHIMERE prediction and is based on a mixture of hygroscopic particles with the diameter larger than 0.1 µm. Further details about the implementation of the aerosol indirect effects within WRF-CHIMERE are provided by Tuccella et al. (2019).
Finally, it is important to notice that there are several limitations in the way the coupling is modelled, due to several scientific and technical locks. These limitations mainly concern the indirect effects and will all lead to an underestimation of the indirect effects in the simulations presented in the following. Aerosol indirect effects are implemented only in the grid-scale resolved clouds via the Thompson and Eidhammer (2014) scheme. Convective (subgrid) clouds are not affected by aerosol effects. Over areas such as the Gulf of Guinea, clouds are mainly generated by convection and thus calculated by convection parameterizations. In our model configuration, convective clouds are treated by using the aerosol-aware parameterization of Grell and Freitas (2014), but the indirect effect is not yet implemented in this scheme (as in many regional models). Some other schemes were also developed to take into account indirect effects in cumulus parameterizations such as Lim et al. (2013) and Berg et al. (2015). One can expect to underestimate the indirect effect due to the missing part of coupling in the convective scheme. Another point is the use of the nudging: the regional model is nudged in the global model, with this one not considering interactive aerosol effects (He et al., 2017).
3.3 Definition of the simulations
There are several ways to quantify the effect of aerosols on meteorology. It depends on the definition of the simulation dedicated to compare the results to the reference simulation (which uses aerosol–radiation–cloud interactions). In this study, we will focus on a scenario approach. This methodology sends modified aerosol concentrations to the meteorological model. This approach was used, for example, by Lim et al. (2013) to investigate the indirect effect. With this approach, results have the order of magnitude of realistic changes in the atmosphere. Differences are calculated between a reference simulation and scenario simulations. The reference simulation is called CPLfull and contains the full emissions and the ARCIs. The two scenario simulations are CPLanthro and CPLdust, with the ARCIs and halved anthropogenic and mineral dust emissions, respectively.
The first step is to compare the CPLfull simulation results to available MIDAS, AERONET radiosoundings and aircraft observations. The main goal of this comparison to observations is to assess if the model is realistic enough in order for us to be confident in the results of the simulations made under different scenarios. The observations are selected because they are spatially homogeneous in the studied area (for MIDAS and AERONET) and automatically acquired so that they are available every day and for the whole studied period. Given the low resolution of the simulation ( km), we favoured observations with a large spatial extent and for the longer possible period. In addition to these surface observations, we added the vertical soundings acquired during the DACCIWA experiment in Abidjan, Accra, Cotonou, Savè, Lamto and Parakou. Even if they provide a more limited spatial and temporal coverage, they give precious information about the vertical structure of the boundary layer and the troposphere in the studied area. Finally, aircraft measurements are used to assess the quality of some of the key chemical species over southern west Africa (O3, NO2 and CO).
4.1 Definition of statistical scores
Three statistical indicators are used: the spatial Pearson correlation, the temporal Pearson correlation and the normalized RMSE. The temporal correlation, Rt, is computed for each station and is directly related to the hourly variability. Ot,i and Mt,i represent the observed and modelled values, respectively, at time t and for the station i, for a total of T days and a total of I stations. The mean time averaged value is
The temporal correlation Rt,i for each station i is calculated as
The mean temporal correlation (Rt) used in this study is thus
The spatial correlation, denoted Rs, uses the same formula type, except it is calculated from the temporal mean averaged values of observations and model for each location where observations are available.
The spatiotemporal mean averaged value is calculated as
and the spatial correlation (Rs) as
The normalized root mean square error (nRMSE) is expressed as
for all stations i and all times t.
4.2 MIDAS
The comparison between model and observations is made on a daily basis. As data from some stations are not always continuously available, the comparison is carried out on a day-by-day basis, keeping in mind that some days may average a more complete diurnal cycle than others.
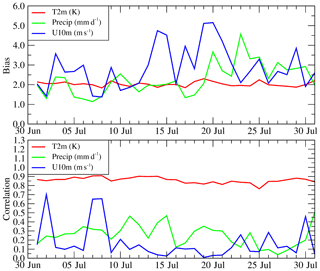
Figure 2Time series of bias “CPLfull minus observations” and spatial correlation between CPLfull and observations for 2 m temperature (K), 10 m wind speed (m s−1) and total (convective plus stratiform) precipitation rate (mm d−1) for the month of July 2016.
Results of statistical scores are presented in Fig. 2 as time series of daily averaged variables. For the 2 m temperature, the bias is around 2 K and fairly constant. The spatial correlation has high values (between 0.75 and 0.9), showing that this variable is well simulated (also knowing that correlation is positively influenced by the latitudinal effect). For the 10 m wind speed, statistical scores are less good than those for 2 m temperature. The bias is important, between 1 and 5 m s−1, and varies a lot from one day to another. The same behaviour is noted for the spatial correlation, with low values of correlation (mostly around 0.1) and a high day-to-day variability. For the total precipitation, there is no general tendency, the bias being between 1 and 5 mm d−1.
Compared to the state of the art of simulations over this domain, there is no large statistical improvement when adding the effect of aerosols on wind and temperature. It is not completely surprising, with the region being under a meteorology where convection and precipitation are important. Thus, the impact of aerosols is not the predominant process in the atmosphere during the monsoon period. The same kind of conclusion was presented by Baró et al. (2017) for analysis and comparison to E-OBS data over Europe: they showed the bias and RMSE scores for 2 m temperature were improved when ARCI is taken into account (using a large set of regional online coupled models) but not enough to explain the gap between model and observations.
4.3 AERONET
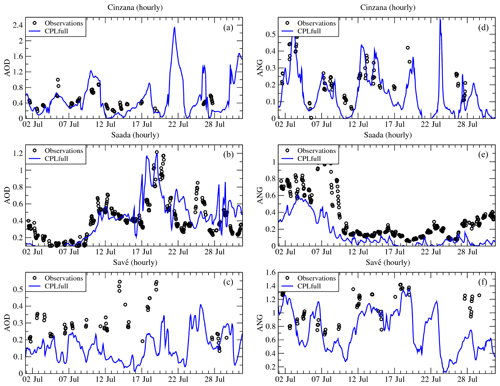
The AOD time series are presented in Fig. 3 for some selected stations where hourly model results are compared to AERONET data: Cinzana, Saada and Savè. These stations are selected for their location representative of different environments (for Cinzana and Saada) and for Savè because it was a supersite during the DACCIWA campaign. The order of magnitude is correctly reproduced, except in Savè, where a significant low bias appears (ranging between 0 and 0.5) associated with fine particles (Ångström exponent >0.5), which suggests an underestimation of anthropogenic aerosol concentration rather than dust or black carbon concentrations. For all sites, all peaks are well modelled, showing that transport of aerosols is correctly performed. The Ångström exponent (ANG) is well modelled, showing that the nature of the aerosols is also well estimated.
4.4 Soundings
Comparisons between observations and model output in the first 4 km of the troposphere are presented in Fig. 4. Observations are in the left panel and represent soundings made in several places: Abidjan, Accra, Cotonou, Savè, Lamto and Parakou. For each location, all soundings recorded between 1 and 31 July are averaged. The same is done for the model outputs, where hourly gridded data are interpolated to fit the time and location of the observations (central panel). This methodology was already used in (Deroubaix et al., 2019) for similar vertical profiles. All information about the soundings and the experimental campaign are in (Flamant et al., 2018). Finally, the difference (mod–obs) is displayed in the right panel.
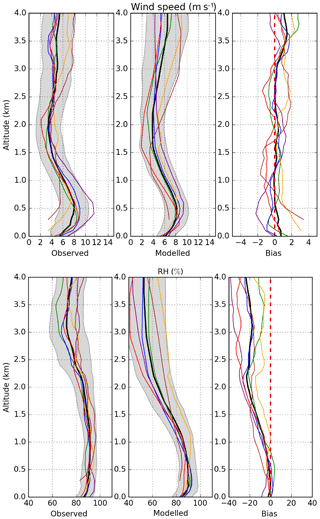
Figure 4Observed and modelled mean vertical profiles of wind speed (in m s−1) and relative humidity (RH in %) averaged of all profiles over the period 1–31 July 2016 at Abidjan in Côte d'Ivoire (green line), Accra in Ghana (blue line), Cotonou in Benin (purple line), Savè in Benin (orange line), Lamto in Côte d'Ivoire (red line) and Parakou in Benin (brown line). The mean and standard deviation at the four locations are represented by the black line and the gray shading, respectively. Outputs from the WRF model are interpolated along the radiosonde positions. The right panel presents the (mod–obs) mean vertical bias at each location and the average of the four locations. The dashed line materializes the boundary between negative and positive biases.
For the wind speed, and at all sites, it is shown that a local maximum is present at 500 m above ground level (a.g.l.) with values between 8 and 12 m s−1. These profiles present the same structure as described in Deroubaix et al. (2019) with three clearly defined vertical layers from the surface to 4 km a.g.l.: (i) the monsoon layer in the first kilometre (with a maximum at 0.5 km a.g.l.); (ii) a vertical wind shear layer from 1 to 2 km a.g.l. in which wind speed decreases with altitude to a minimum around 2 km a.g.l. and (iii) a layer above in which wind speed is increasing with altitude and is influenced by the presence of the African easterly jet (AEJ). The overall structure of the wind speed profile is well reproduced in the simulation. The bias is comprised between −2 and 2 m s−1, and highly variable in terms of location and height. In addition to the mean averaged profiles and their associated standard deviations, the coloured profiles correspond to the mean averaged profile for each launching location. It enables to see if systematic biases depend on the launching site location or not. For the wind speed and close to the surface, a positive bias (i.e. model overestimates measurements) is diagnosed for Savè and Parakou (Bénin) and not for the other locations, mostly coastal ones, where an underestimation is diagnosed. The boundary layer wind speed is thus too low close to the coast but too large inland.
The relative humidity is well reproduced in the monsoon layer but there is a systematic dry bias from 1 to 4 km in the simulation, which leads to a probable underestimation of liquid water content and thus the cloud cover and the indirect effects. This is the case for all soundings, whether the sites are close to the coast or inland.
4.5 Aircraft measurements
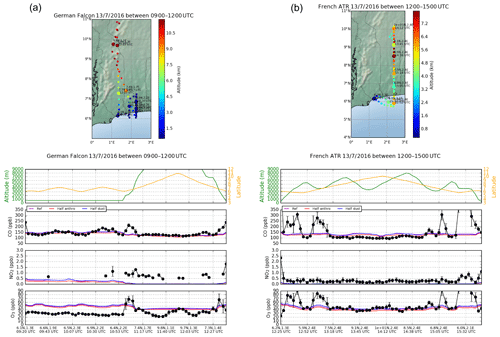
Figure 5 presents the comparison between aircraft measurements and the model results with the reference case (CPLfull) and the two scenarios (CPLanthro and CPLdust). The two flights were operated on 13 July 2016, from 09:00 to 12:00 UTC for the German DLR Falcon aircraft and from 12:00 to 15:00 UTC for the French ATR aircraft. Details about these flights are presented in Flamant et al. (2018). These flights were selected because (i) they were done at constant longitude and are thus well designed to discuss the monsoon latitudinal behaviour; (ii) they are among the latest flights performed during the campaign and thus in the later part of so-called monsoon post-onset phase 2 (22 June–20 July 2016) (Knippertz et al., 2017) characterized by a significant increase in low-level cloudiness and unusually dry conditions. Results show that the background values are well modelled for CO, NO2 and O3. The comparison failed when observations showed a large temporal variability: in this case, the coarse model resolution, not designed to make this type of comparison, shows its limits, and the model is not able to retrieve this high variability. For these species, it is also shown that the three simulations, including the two scenarios, give similar values, suggesting that scenarios have a lower impact in altitude than close to the surface.
4.6 Synthesis of scores
The statistical results are calculated with hourly data over the whole month of July 2016. They are presented in Table 1 for 2 m temperature, 10 m wind speed, precipitation rate, AOD and ANG.
Table 1Statistical scores (correlation, RMSE and bias) for the 2 m temperature, 10 m wind speed, precipitation rate, aerosol optical depth (AOD) and Ångström exponent (ANG). Calculations are performed for the whole month of July 2016 and are based on hourly data. The bias is computed as model minus observation.
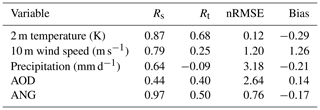
Results show that the spatial correlation has globally high values (between 0.44 and 0.97), showing that the horizontal gradients of meteorological variables or aerosols are correctly modelled. The 2 m temperature is probably the less meaningful indicator despite very good results, with the diurnal cycle and the latitudinal effect having an important weight in the estimation of this parameter. It is not the case for the wind speed for which the spatial correlation of Rs=0.79 shows that the model is able to reproduce the regions characterized by low and high wind speeds. On the other hand, the temporal correlation (Rt=0.25) shows that the diurnal cycle of the wind speed could be improved. A positive bias is diagnosed (bias =1.26), and this could induce a slight overestimation of transport close to the surface as well as mineral dust emissions. Regarding the total precipitation, the spatial correlation (Rs=0.64) is rather high, showing that the cloud front of the monsoon is well modelled. However, the temporal correlation () is very low and shows that precipitation is not modelled at the right time. In addition, a negative bias of 0.21 is calculated, showing that the WRF model underestimates the precipitation for this period and region. Finally, the statistical scores for the aerosols (AOD and ANG) have values showing that the modelling of aerosols is correct. For the spatial correlation, we obtain Rs=0.44 and Rs=0.97 for AOD and ANG, respectively, meaning that the relative part of fine/coarse particles is well modelled, but the plumes may be misplaced. The bias is positive for AOD (bias =0.14) and negative for ANG (bias ), meaning that there is too much aerosol with the diameter corresponding to the optically active wavelength of the AOD calculation, and it also corresponds to the negative bias, showing there is too many fine particles in comparison to coarse particles.
These comparisons to observations show that the simulation is realistic for the whole region and during the studied period. The spatial structure of the main meteorological variables is well modelled (for wind speed, temperature and precipitation) even if the day-to-day variability is not always well represented. The aerosols are mostly well modelled: AOD and ANG scores show that the simulated aerosol amount is realistic. The aerosol plumes are also spatially well located, showing that the conjunction of meteorology and emissions is considered realistic enough for us to be confident in scenario studies.
Results are presented as a monthly map of averaged model results for July 2016. All variables are bidimensional except the surface concentrations of ozone and PM2.5 (the map represents the concentrations at the first model vertical level, i.e. between the surface and 20 m a.g.l.). For each variable, results are presented as CPLfull values and as values of differences (CPLanthro–CPLfull) and (CPLdust–CPLfull).
5.1 Significance of differences
To quantify the statistical significance of differences, the Mann–Whitney test is applied (also called Wilcoxon signed rank test) (von Storch and Zwiers, 2001). This test is non-parametric: there are less restrictive assumptions, for example, the fact that the distribution does not have to be normal. This test examines the two sets of data (in our case, two different simulations) by combining all data and by sorting them in ascending order.
The first and second simulations, denoted x1,i and x2,i, have the same dimension here (N). We first calculate the difference between the two datasets:
A reduced dataset with dimension Nr is built by removing data where di=0. The remaining data di are sorted in ascending order and their rank (Ri) is stored. The statistic test W is calculated as
A z score is calculated as
with, when Nr≥20,
The null hypothesis H0 is rejected (i.e. the differences are significant and not due to hazard) if . For a level of significance of 0.05, we have the value zcritical≈1.645. In the following, figures present crosses at the points where the difference was found to be significant.
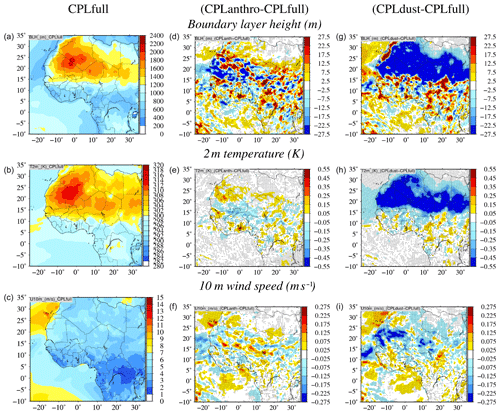
Figure 6Left column (from top to bottom): maps of the monthly mean boundary layer height (m), 2 m temperature (K) and 10 m wind speed (m s−1) for July 2016. Middle column: maps of the monthly mean of daily averaged differences between CPLanthro and CPLfull for the same variables as the left row. Right row: maps of the monthly mean of daily averaged differences between CPLdust and CPLfull for the same variables as the left row. The tiny crosses on the map indicate where the difference was found to be significant.
5.2 Meteorology
Results for boundary layer height, 2 m temperature and 10 m wind speed are presented in Fig. 6. The boundary layer height (BLH) is higher over land, more specifically over desert areas. Due to the cooler monsoon, the BLH is lower than 1000 m over sea and for latitude <15∘ N and may reach ≈2000 m over the Sahara and even greater depth in the region of the heat low (recall that these are daily averaged values). The differences range in the interval ±30 m. Values are alternatively positive and negative. There is no mean tendency, except over the Saharan desert where the differences are always negative in the case of the CPLdust vs. CPLfull comparison, indicating that the response is related to the direct effect of aerosols and the reduction of 2 m temperature.
As BLH, the 2 m temperature is higher over land than over sea, and the largest values are modelled over the Saharan desert. For the differences (CPLanthro–CPLfull), 2 m temperature differences are small, at maximum ±0.5 K. They are negligible over the sea and positive along the coast, then negative for latitude ≈15∘ N, then positive for latitude up to ≈20∘ N. For CPLdust, the impact is negative north of ≈15∘ N, i.e. where mineral dust is present. Reducing dust emissions leads to a decrease of 2 m temperature. This result is close to the ones of Han et al. (2013), who showed a decrease in temperature and wind speed during the daytime and the opposite effect during the night, when the dominant aerosol is mineral dust.
The 10 m wind speed is lower over land than over sea on average. The differences between the different simulations are very variable in space. For CPLanthro, there is some increase of the wind speed in the desert which is not present in CPLdust. Interestingly, we are able to identify a line of enhanced wind speed spanning from the southeast corner of Mauritania to the southern part of Chad, across the Sahel. This feature is seen in the same region where the 2 m temperature is consistently negative in the CPLanthro–CPLfull differences. As for temperature and depending on the location of the dust plume, the impact is different on wind speed: as shown by Miller et al. (2004) and confirmed by Rémy et al. (2015), the temperature decreases under the plume, increasing atmospheric stability and reducing the wind speed. But, at the edge of the dust plume, a horizontal thermal gradient is more pronounced, leading locally to an increase of the surface wind speed. Thus, depending on the location of the dense mineral dust plume, it is expected to have an increase or decrease of the 10 m wind speed.
These results first show that, for all locations where values are non-negligible, results are all significant. Second, even if emissions (anthropogenic or dust) are located in specific areas only, the impact of their changes affects the whole simulated domain. The differences are very patchy and alternate between negative and positive values. The difference values are not very high and represent a few percent only for each variable.
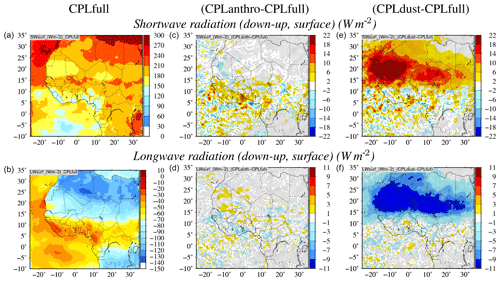
Figure 7(a, b) Maps of the monthly mean shortwave radiation (down–up, surface) (W m−2) and longwave radiation (down–up, surface) (W m−2) for July 2016. (c, d) Maps of the monthly mean of daily averaged differences between CPLanthro and CPLfull for the same variables as the left row. (e, f) Maps of the monthly mean of daily averaged differences between CPLdust and CPLfull for the same variables as the left row. The tiny crosses on the map indicate where the difference was found to be significant.
5.3 Radiation
Results are presented in Fig. 7. For radiation, we compare the effects of the coupling on shortwave (SWsurf) and longwave (LWsurf) radiation net fluxes at the surface. SWsurf and Lwsurf are estimated by subtracting the upwelling from the downwelling flux at the surface. The coupling shows low effect for CPLanthro, with SWsurf and LWsurf differences showing an alternation of negative and positive values over most of the domain. However, there is an indication of consistent enhancement of SWsurf over the Sudanian region bordering the Gulf of Guinea between Senegal and Nigeria, i.e. south of the rain band displaced northward in CPLanthro. In the case of CPLdust, the decrease of dust emissions induces an increase of SWsurf and a decrease of LWsurf over the Saharan region. Nevertheless, in the rest of the domain, the differences in SWsurf and LWsurf exhibit noisy behaviour. At the maximum, the increase of SWsurf may reach W m−2, representing 10 % of the maximum flux (averaged over the month). The change is also ≈10 % for LWsurf. This aerosol effect was already presented, among other regions, over Australia in Choobari et al. (2013) and over Europe in Bangert et al. (2012). It was also discussed over Africa in Briant et al. (2017). Depending on the size distribution, mineral dust may absorb or scatter the radiation. During the day, aerosol absorbs the shortwave (i.e. solar) radiation, inducing a heating of the atmosphere, a cooling at the surface and a decrease in the cloud coverage. During the night, aerosol increase induces a longwave radiation increase, then an increase in temperature close to the surface.
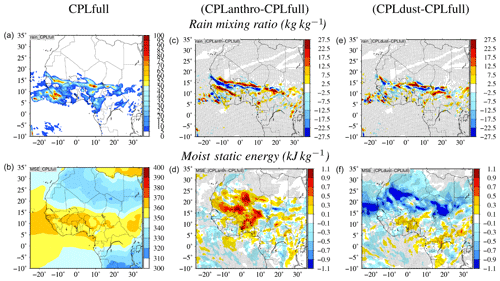
Figure 8(a, b) Maps of the monthly mean rain mixing ratio (kg kg−1) and moist static energy (kJ kg−1) for July 2016. (c, d) Maps of the monthly mean of daily averaged differences between CPLanthro and CPLfull for the same variables as the left row. (e, f) Maps of the monthly mean of daily averaged differences between CPLdust and CPLfull for the same variables as the left row. The tiny crosses on the map indicate where the difference was found to be significant.
5.4 Rain and moist static energy
The rain mixing ratio is first presented in Fig. 8. This corresponds to the first vertical model level of the rain profile, then to the amount of water finally reaching the surface. It is non-zero mainly in the band of 5–15∘ N, as expected during the monsoon installation in this period. The northernmost rain belt between 10 and 15∘ N shows the post-onset location of the monsoonal precipitation in the Sahel (Sultan and Janicot, 2003). A rain belt located south of 10∘ N indicates that the WAM is not yet fully developed in the Sahel. Indeed, Knippertz et al. (2017) reported a coastal phase accompanying the installation of the WAM in the Sahel during July 2016.
The two scenario simulations provide similar responses: the values are alternatively positive and negative, showing that the precipitation front moves northward. Differences are in the range of ±20 kg kg−1, representing 25 % of the maximum modelled values. All calculated differences are significant. It is worth noting that in the monthly averaged CPLanthro–CPLfull difference, the linear-shaped intense response in wind speed seen in Fig. 6 is located to the north of the linear-shaped response of the rainfall in Fig. 8. Such a clear match between the positive rain and wind speed anomaly is not seen in the CPLdust–CPLfull differences.
The second set of figures represents the moist static energy (MSE) at the first model level, which corresponds roughly to a vertical level of 20 m a.g.l. MSE is defined as
with g the gravitational acceleration (g=9.81 m s−2), z the geopotential height (m), Cp the specific heat of dry air at constant pressure (1005 J kg−1 K−1), T the temperature (K), L the latent heat of evaporation of water (2256 kJ kg−1) and q the specific humidity (kg kg−1). MSE is a direct indicator of monsoonal precipitation: the transformation of enthalpy and latent heat in the lower troposphere into geopotential energy aloft is a key ingredient of tropical deep convection (Neelin and Held, 1987). The MSE is then expressed in kJ kg−1, and in west Africa it is characterized by values around 350–370 kJ kg−1 in the lower troposphere, associated with high temperature and humidity, and around 350 kJ kg−1 at the tropopause, associated with high geopotential, with a minimum in the mid-troposphere (Fontaine and Philippon, 2000). In July 2016, a MSE maximum between 5 and 15∘ N well describes the simulated precipitation (Fig. 8), while a MSE minimum characterizes the dry Sahara.
The MSE response in the CPLanthro simulation shows a significant increase north of 15∘ N, associated with the increase in the longwave (LW) radiation, which accounts for the latent heat flux (Figs. 7 and 8). Conversely, the simulated MSE increase south of 15∘ N can be explained by the increase in the shortwave (SW) radiation. The MSE response in the CPLdust simulation shows an increase limited to coastal west Africa, while the response in the Saharan region is negative (Fig. 8). This pattern can be explained with the simulated LW radiation response shown in Fig. 7. Overall, the differences in the MSE response in the different scenarios account for the simulated differences in the monsoonal precipitation, i.e. a stronger and better-organized response of convection in CPLanthro than in CPLdust.
5.5 Atmospheric composition
Finally, results for mineral dust emissions, surface concentrations of O3 and PM2.5 and AOD are presented in Fig. 9. On average, surface ozone concentrations are the most important over the sea. Low values are modelled for latitudes between +5 and +15∘ N, showing the impact of precipitation and low shortwave radiation on ozone production and deposition. The two emissions scenarios have completely different impacts on ozone. The CPLanthro shows that reducing anthropogenic emissions would decrease ozone over land, mainly due to a decrease of available reactive volatile organic compounds (VOCs). But it also increases ozone over sea and it could be due to a change in radiation and cloud cover change, as pointed out by Forkel et al. (2012), over Europe. For CPLdust, less dust emissions lead to less AOD, then more radiation and thus more photochemistry. The variability on ozone is ≈3 µg m−3, corresponding to ≈5 % of the maximum of the monthly averaged concentration. All calculated values are significant.
The second result concerns the impact of ARCI on PM2.5. For this figure, we have chosen to present PM2.5 without the mineral dust contribution. These fine particles are then representative of contributions from anthropogenic and biogenic emissions only. For CPLanthro, less anthropogenic emissions lead to less surface PM2.5 concentrations, essentially where the particles are emitted. For CPLdust, some positive and negative differences are present over Central Africa. Complex feedbacks between radiation, meteorology and emissions exist and are difficult to identify. The values are low but remain significant.
For mineral dust emissions, the differences show very interesting results. First, the map of emissions shows their location: up to 15∘ N in latitude, northward of the precipitation identified previously. The scenario of CPLdust on mineral dust gives a linear impact: less emissions are visible on the map of difference, then less surface concentrations, then less AOD over the Sahara. Non-zero differences are of course spatially limited to the area where dust is emitted. More surprising, the scenario of CPLanthro has an impact on mineral dust emissions. Emissions decrease close to the coast, leading to more mineral dust concentrations over the Sahara.
With the CPLanthro scenario, the increase of mineral dust emissions in the Sahara leads to more AOD. The impact is not very important (+0.1) but remains significant. The enhanced dust emissions are seen to coincide with the enhanced linear 10 m wind feature ahead of the northward displaced rain band seen in Fig. 6 and 8. A more thorough explanation is proposed in the next section.
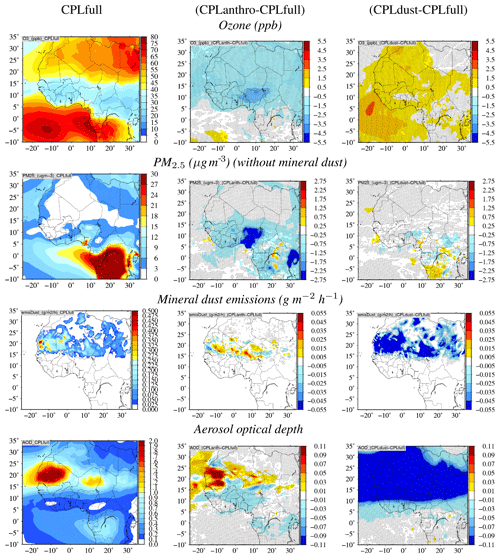
Figure 9Left column (from top to bottom): maps of the monthly mean of ozone (ppb), PM2.5 (µg m−3) (without mineral dust), mineral dust emissions (g m−2 h−1) and aerosol optical depth for July 2016. Middle column: maps of the monthly mean of daily averaged differences between CPLanthro and CPLfull for the same variables as the left row. Right row: maps of the monthly mean of daily averaged differences between CPLdust and CPLfull for the same variables as the left row. The tiny crosses on the map indicate where the difference was found to be significant.
6.1 Correlations between differences
As displayed in Fig. 9 and for the scenario on anthropogenic emissions, the map of differences for mineral dust emissions and AOD shows a significant increase in the Sahara. Knowing there is no significant anthropogenic emissions in this area, there is no reason to directly increase PM and AOD in this region. The only possible reason is a change in the meteorology, propagating across the domain and impacting the mineral dust emissions. The explanation probably comes from the changes in 10 m wind speed as shown in Fig. 6: a decrease in emissions leads to an increase of wind speed over the Sahara.
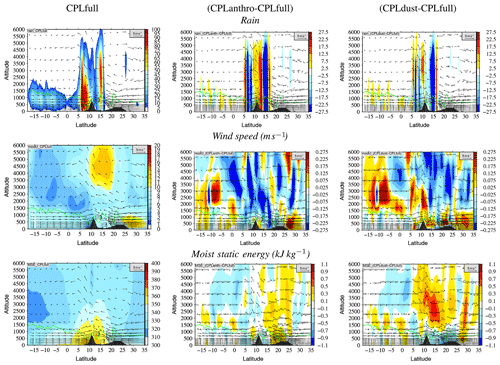
Figure 10Vertical cross section of rain and wind speed vertical profiles, averaged from 1 to 31 July 2016 and for longitude −10∘. The mean value for CPLfull and the differences (CPLanthro–CPLfull) and (CPLdust–CPLfull) are presented. Crosses indicate locations where the differences are significant.
The fact that changes in wind speed leads to an increase of mineral dust emissions is likely related to the non-linear relation between wind and mineral dust in the physics of the emissions fluxes. These emissions depend on a threshold value for wind speed. Up to this value, they increase exponentially with wind speed. Wind gusts are more efficient at producing large dust emission than a steady flow for which the mean speed is just above the velocity threshold.
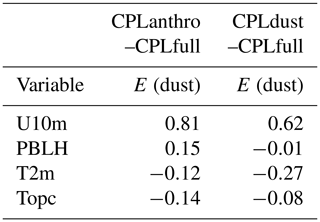
The impact of an increase of wind speed is a good candidate to explain the increase in dust emissions. In order to prove this, we performed spatiotemporal correlation calculations between the change in dust emissions and the change in 10 m wind speed, boundary layer height, 2 m temperature and total precipitation for each of the scenario, based on the maps of differences shown in Fig. 6. Correlations are computed for each hourly output of the simulation and for the whole month of July 2016. They are presented in Table 2.
The best correlation between a meteorological parameter and mineral dust emissions is for 10 m wind speed. For emissions reduction CPLanthro, a high correlation of 0.81 is calculated. The correlation for CPLdust is less important with a value of 0.62. The reason is that the decrease of mineral dust emissions here is not due to a meteorological parameter but to the scenario choice itself. The correlations between differences in emissions and differences in the planetary boundary layer height (PBLH), 2 m temperature (T2m) and precipitation are low, meaning that their changes are not the cause of mineral dust emissions changes.
6.2 Vertical cross sections
In order to better understand the impact of anthropogenic emissions, we analyse in Fig. 10 the monthly averaged (between −12 and ) vertical cross sections of rain and wind speed.
The rain is mainly located over the sea and over land at two distinct locations, in a band between 5 and 10∘ N, and around 15∘ N, respectively. In the scenario simulations, dipoles of negative and positive differences appear at the latitudes where the reference simulation shows maximum precipitation, indicating a shift in the precipitation maxima. Specifically, the rain band located at 15∘ N moves northward in the two simulations. However, the response in the CPLanthro simulation is stronger and better organized than in CPLdust.
The mean wind speed along the north–south transect shows the presence of the AEJ at 15∘ N between 3500 and 5500 m a.g.l. Close to the surface, maximum wind speeds are seen between 25 and 30∘ N, over northern Africa. The wind speed increases in this region, in both sensitivity experiments, so that reducing emissions tends to increase wind speed in the northern part of the domain. In the CPLdust simulation, the wind speed is also increased over the Sahara. In both simulations, we see an increase in near-surface wind speed where the shift of rain band is most pronounced. In the mid-troposphere, over the continent, the difference patterns are quite noisy but suggest a northward shift of the AEJ in CPLanthro and a southward shift of the AEJ in CPLdust.
Finally, vertical cross sections of MSE are presented (Fig. 10). In the reference simulation, MSE maxima are located near the surface, in correspondence with the precipitation maxima. In the CPLanthro scenario, the MSE profile shows a positive anomaly between 15 and 25∘ N, creating favourable conditions to the convection shift northwards. Conversely, the MSE response in the CPLdust scenario shows a positive anomaly in the mid-troposphere, contrasting a negative anomaly at the surface, making the environment less favourable for a meridional migration of convection.
Table 2Monthly averaged correlations between changes in dust emissions and changes in 10 m wind speed (U10m), planetary boundary layer height (PBLH), 2 m temperature (T2m) and total precipitation (Topc).
Nevertheless, the cross sections of differences between the reference simulation and the sensitivity experiments are difficult to interpret: in the next section, we will thus represent the data as Hovmöller diagrams (Hovmoller, 1949).
6.3 Hovmöller diagrams
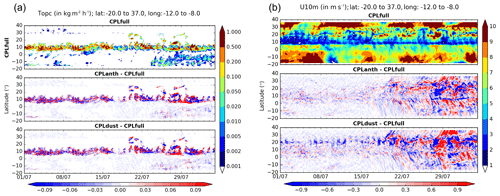
Hovmöller diagrams are presented for the total precipitation and 10 m wind speed in Fig. 11. Temporally, the data are daily averaged. Spatially, they are averaged in longitude between −12 and as for the vertical cross section previously presented. The main area with precipitation, between 10 and 15∘ N, is clearly shown. The progression in time of precipitation shows that in July 2016 the coastal phase of the monsoon still coexists with the Sahelian phase (Knippertz et al., 2017). In particular, an intense event in the Sahel is simulated on 27 July, synchronous with an intense counterpart around 5∘ N (i.e. at the coast). This occurred during a period of enhanced westerly moisture transport into southwestern Africa (SWA) and extraordinarily wet conditions (Knippertz et al., 2017) which started around 20 July and are associated with increased precipitation over the ocean between 10∘ S and the Equator in Fig. 11. Finally, on 30–31 July, a breakdown of the Sahelian phase is also simulated. Additional moderate precipitation between −10 and 0∘ N appears after 20 July only for a few days, which does not appear on the monthly averaged maps (Fig. 8). It is not due to or influenced by the ARCI since it is are not visible in the Hovmöller diagrams of differences. These differences have variability (with alternate negative and positive values) mainly when the precipitation is the more important, for latitude between 10 and 15∘ N, all along the period. There is no significant difference between the two scenarios (CPLanthro and CPLdust).
Results are completely different for the 10 m wind speed. The time evolution for CPLfull shows several regimes but the most important values are always for latitude corresponding to the sea (between −20 and N) and over the Sahara (between 25 and 40∘ N), while the weakest winds are seen at the coast and up to 15∘ N, on average, in spite of a few episodes of strong winds around 18, 22 and 27 July. The diagrams of the differences show that the main differences are at the end of the studied period, after 15 July 2016. As for other variables, the negative and positive values alternate depending on the latitude. Nevertheless, there is a coherent positive 10 m wind feature around 17∘ N between 21 and 27 July, that is consistent with the horizontal wind anomaly shown in Fig. 6. The linear structure of the positive and negative anomalies north of the coastline also suggests a northward displacement of the wind anomalies with time. Similar propagating anomalous features are seen in CPLdust, with the positive anomalies being more pronounced than in CPLanthro. For instance, the strong wind episode seen around 20∘ N in CPLfull is enhanced on CPLdust, as opposed to CPLanthro in which it is damped. It shows that the ARCIs change the atmospheric flow during the latter part of the simulated period and most of the domain, including the ocean where wind anomalies are seen to propagate southward. The impact of the ARCI on the wind speed is more important for the CPLdust scenario than for CPLanthro. It is linked to the fact that the CPLdust scenario reduces much more the content of aerosols in the boundary layer and troposphere than CPLanthro. Nevertheless, the link between the anomalous precipitation, surface net shortwave flux, 10 m wind speed and dust emissions is more coherent and more enhanced in CPLanthro.
The months of June–July 2016 were modelled using the WRF-CHIMERE regional models over a large domain centred on the Gulf of Guinea. The modelled period corresponds to the DACCIWA intensive observation periods. The modelling system was used with the addition of the meteorology–aerosol coupling to describe the aerosol direct and indirect effects. The model outputs from a reference simulation were first compared to surface observations. It was shown that the model represents the meteorology and the aerosol concentrations in a realistic manner.
Two scenarios were used to compute additional simulations with halved emissions of mineral dust and anthropogenic sources. By comparison between the reference case and these scenarios, the direct and indirect effects of aerosol were quantified. Overall, results show a moderate impact of the direct and indirect effects, as also quantified over Europe in Forkel et al. (2015). This impact represents a few percent of the monthly mean value, i.e. % for the boundary layer height, the temperature and wind speed, and % for the rain mixing ratio, the shortwave and longwave radiation, as well as the maximum of MSE.
Due to the larger amount of aerosol injected in the troposphere, the mineral dust scenario induces the most important changes in the meteorology. The scenario of anthropogenic emissions reduction leads to patchy impacts with alternating positive and negative changes in the maps of differences between the scenario and the reference simulation outputs. This is mostly due to stochastic changes in clouds. On the other hand, the mineral dust is at the origin of important changes, homogeneous and over the whole Saharan region.
A surprising feedback was identified with these scenarios. When anthropogenic emissions are reduced along the Gulf of Guinea, the precipitation front moves northward and the 10 m wind speed increases in the Sahel and Sahara regions. Consequently, the mineral dust emissions are enhanced, leading to more important surface concentrations of aerosols, then enhanced AOD. By changing the meteorology and the precipitation, a decrease of anthropogenic emissions would increase mineral dust several thousands of kilometres northward. These changes are not very important but are statistically significant. One also has to note that anthropogenic emissions evolve and increase quickly in the Gulf of Guinea, and simulations were probably performed with underestimated anthropogenic emissions. About the feedback of the emissions reduction linked to a dust emissions increase, the same mechanism also applies for the dust scenario. But in this case, the scenario is already about mineral dust emissions reduction. Thus, the potential impact on wind speed and then emissions is completely masked by the effect of the scenario, leading to a decrease.
All data are available upon request to Laurent Menut.
LM designed the experiments and performed the simulations. PT and LM developed the model code. LM prepared the manuscript with contributions from all co-authors for the analysis of the results, the preparation of the figures and the manuscript.
The authors declare that they have no conflict of interest.
This article is part of the special issue “Results of the project “Dynamics-aerosol-chemistry-cloud interactions in West Africa” (DACCIWA) (ACP/AMT inter-journal SI)”. It is not associated with a conference.
The authors are thankful to the two anonymous referees whose comments helped improve the overall quality of the paper. Paolo Tuccella was supported by an AXA Research Fund postdoctoral grant.
The DACCIWA project has received funding from the European Union Seventh Framework Programme (FP7/2007-2013) under grant agreement no. 603502. The Centre National d'Etudes Spatiales (CNES) also provided financial support to the project. The Service des Avions Francais Instrumentés pour la Recherche en Environnement (SAFIRE, a joint entity of CNRS, Météo-France and CNES, and operator of the ATR 42) and the Deutsches Zentrum für Luft- und Raumfahrt (operator of the Falcon 20) are thanked for their support. The authors acknowledge their colleagues in charge of the radiosounding station network during DACCIWA. Marco Gaetani has been supported by the LABEX project funded by the Agence Nationale de la Recherche (French National Research Agency, grant ANR-10-LABX-18-01).
This paper was edited by Pedro Jimenez-Guerrero and reviewed by two anonymous referees.
Abdul-Razzak, H. and Ghan, S. J.: A parameterization of aerosol activation 3. Sectional representation, J. Geophys. Res.-Atmos., 107, AAC 1-1–AAC 1-6, https://doi.org/10.1029/2001JD000483, 2002. a
Andreae, M. and Rosenfeld, D.: Aerosol-cloud-precipitation interactions. Part 1. The nature and sources of cloud-active aerosols, Earth-Sci. Rev., 89, 13–41, https://doi.org/10.1016/j.earscirev.2008.03.001, 2008. a, b, c
Baklanov, A., Schlünzen, K., Suppan, P., Baldasano, J., Brunner, D., Aksoyoglu, S., Carmichael, G., Douros, J., Flemming, J., Forkel, R., Galmarini, S., Gauss, M., Grell, G., Hirtl, M., Joffre, S., Jorba, O., Kaas, E., Kaasik, M., Kallos, G., Kong, X., Korsholm, U., Kurganskiy, A., Kushta, J., Lohmann, U., Mahura, A., Manders-Groot, A., Maurizi, A., Moussiopoulos, N., Rao, S. T., Savage, N., Seigneur, C., Sokhi, R. S., Solazzo, E., Solomos, S., Sørensen, B., Tsegas, G., Vignati, E., Vogel, B., and Zhang, Y.: Online coupled regional meteorology chemistry models in Europe: current status and prospects, Atmos. Chem. Phys., 14, 317–398, https://doi.org/10.5194/acp-14-317-2014, 2014. a
Balkanski, Y., Schulz, M., Claquin, T., and Guibert, S.: Reevaluation of Mineral aerosol radiative forcings suggests a better agreement with satellite and AERONET data, Atmos. Chem. Phys., 7, 81–95, https://doi.org/10.5194/acp-7-81-2007, 2007. a
Bangert, M., Nenes, A., Vogel, B., Vogel, H., Barahona, D., Karydis, V. A., Kumar, P., Kottmeier, C., and Blahak, U.: Saharan dust event impacts on cloud formation and radiation over Western Europe, Atmos. Chem. Phys., 12, 4045–4063, https://doi.org/10.5194/acp-12-4045-2012, 2012. a
Baró, R., Palacios-Peña, L., Baklanov, A., Balzarini, A., Brunner, D., Forkel, R., Hirtl, M., Honzak, L., Pérez, J. L., Pirovano, G., San José, R., Schröder, W., Werhahn, J., Wolke, R., Žabkar, R., and Jiménez-Guerrero, P.: Regional effects of atmospheric aerosols on temperature: an evaluation of an ensemble of online coupled models, Atmos. Chem. Phys., 17, 9677–9696, https://doi.org/10.5194/acp-17-9677-2017, 2017. a
Bauer, S. E., Im, U., Mezuman, K., and Gao, C. Y.: Desert Dust, Industrialization, and Agricultural Fires: Health Impacts of Outdoor Air Pollution in Africa, J. Geophys. Res.-Atmos., 124, 4104–4120, https://doi.org/10.1029/2018JD029336, 2019. a
Berg, L. K., Shrivastava, M., Easter, R. C., Fast, J. D., Chapman, E. G., Liu, Y., and Ferrare, R. A.: A new WRF-Chem treatment for studying regional-scale impacts of cloud processes on aerosol and trace gases in parameterized cumuli, Geosci. Model Dev., 8, 409–429, https://doi.org/10.5194/gmd-8-409-2015, 2015. a
Briant, R., Tuccella, P., Deroubaix, A., Khvorostyanov, D., Menut, L., Mailler, S., and Turquety, S.: Aerosol–radiation interaction modelling using online coupling between the WRF 3.7.1 meteorological model and the CHIMERE 2016 chemistry-transport model, through the OASIS3-MCT coupler, Geosci. Model Dev., 10, 927–944, https://doi.org/10.5194/gmd-10-927-2017, 2017. a, b, c
Choobari, O. A., Zawar-Reza, P., and Sturman, A.: Simulation of the spatial distribution of mineral dust and its direct radiative forcing over Australia, Tellus B, 65, 19856, https://doi.org/10.3402/tellusb.v65i0.19856, 2013. a
Costantino, L. and Bréon, F.-M.: Aerosol indirect effect on warm clouds over South-East Atlantic, from co-located MODIS and CALIPSO observations, Atmos. Chem. Phys., 13, 69–88, https://doi.org/10.5194/acp-13-69-2013, 2013. a
Craig, A., Valcke, S., and Coquart, L.: Development and performance of a new version of the OASIS coupler, OASIS3-MCT_3.0, Geosci. Model Dev., 10, 3297–3308, https://doi.org/10.5194/gmd-10-3297-2017, 2017. a
Deetz, K., Vogel, H., Haslett, S., Knippertz, P., Coe, H., and Vogel, B.: Aerosol liquid water content in the moist southern West African monsoon layer and its radiative impact, Atmos. Chem. Phys., 18, 14271–14295, https://doi.org/10.5194/acp-18-14271-2018, 2018a. a
Deetz, K., Vogel, H., Knippertz, P., Adler, B., Taylor, J., Coe, H., Bower, K., Haslett, S., Flynn, M., Dorsey, J., Crawford, I., Kottmeier, C., and Vogel, B.: Numerical simulations of aerosol radiative effects and their impact on clouds and atmospheric dynamics over southern West Africa, Atmos. Chem. Phys., 18, 9767–9788, https://doi.org/10.5194/acp-18-9767-2018, 2018b. a
DeMott, P. J., Prenni, A. J., Liu, X., Kreidenweis, S. M., Petters, M. D., Twohy, C. H., Richardson, M. S., Eidhammer, T., and Rogers, D. C.: Predicting global atmospheric ice nuclei distributions and their impacts on climate, P. Natl. Acad. Sci. USA, 107, 11217–11222, https://doi.org/10.1073/pnas.0910818107, 2010. a
DeMott, P. J., Prenni, A. J., McMeeking, G. R., Sullivan, R. C., Petters, M. D., Tobo, Y., Niemand, M., Möhler, O., Snider, J. R., Wang, Z., and Kreidenweis, S. M.: Integrating laboratory and field data to quantify the immersion freezing ice nucleation activity of mineral dust particles, Atmos. Chem. Phys., 15, 393–409, https://doi.org/10.5194/acp-15-393-2015, 2015. a
Deroubaix, A., Menut, L., Flamant, C., Brito, J., Denjean, C., Dreiling, V., Fink, A., Jambert, C., Kalthoff, N., Knippertz, P., Ladkin, R., Mailler, S., Maranan, M., Pacifico, F., Piguet, B., Siour, G., and Turquety, S.: Diurnal cycle of coastal anthropogenic pollutant transport over southern West Africa during the DACCIWA campaign, Atmos. Chem. Phys., 19, 473–497, https://doi.org/10.5194/acp-19-473-2019, 2019. a, b, c
di Sarra, A., Di Biagio, C., Meloni, D., Monteleone, F., Pace, G., Pugnaghi, S., and Sferlazzo, D.: Shortwave and longwave radiative effects of the intense Saharan dust event of 25–26 March 2010 at Lampedusa (Mediterranean Sea), J. Geophys. Res.-Atmos., 116, D23209, https://doi.org/10.1029/2011JD016238, 2011. a
Flamant, C., Knippertz, P., Fink, A. H., Akpo, A., Brooks, B., Chiu, C. J., Coe, H., Danuor, S., Evans, M., Jegede, O., Kalthoff, N., Konaré, A., Liousse, C., Lohou, F., Mari, C., Schlager, H., Schwarzenboeck, A., Adler, B., Amekudzi, L., Aryee, J., Ayoola, M., Batenburg, A. M., Bessardon, G., Borrmann, S., Brito, J., Bower, K., Burnet, F., Catoire, V., Colomb, A., Denjean, C., Fosu-Amankwah, K., Hill, P. G., Lee, J., Lothon, M., Maranan, M., Marsham, J., Meynadier, R., Ngamini, J.-B., Rosenberg, P., Sauer, D., Smith, V., Stratmann, G., Taylor, J. W., Voigt, C., and Yoboué, V.: The Dynamics-Aerosol-Chemistry-Cloud Interactions in West Africa Field Campaign: Overview and Research Highlights, B. Am. Meteorol. Soc., 99, 83–104, https://doi.org/10.1175/BAMS-D-16-0256.1, 2018. a, b, c, d
Fontaine, B. and Philippon, N.: Seasonal evolution of boundary layer heat content in the West African monsoon from the NCEP/NCAR reanalysis (1968–1998), Int. J. Climatol., 20, 1777–1790, https://doi.org/10.1002/1097-0088(20001130)20:14<1777::AID-JOC568>3.0.CO;2-S, 2000. a
Forkel, R., Werhahn, J., Hansen, A. B., McKeen, S., Peckham, S., Grell, G., and Suppan, P.: Effect of aerosol-radiation feedback on regional air quality – A case study with WRF/Chem, Atmos. Environ., 53, 202–211, https://doi.org/10.1016/j.atmosenv.2011.10.009, 2012. a
Forkel, R., Balzarini, A., Baro, R., Bianconi, R., Curci, G., Jimenez-Guerrero, P., Hirtl, M., Honzak, L., Lorenz, C., Im, U., Perez, J. L., Pirovano, G., Jose, R. S., Tuccella, P., Werhahn, J., and Zahbkar, R.: Analysis of the WRF-Chem contributions to AQMEII phase2 with respect to aerosol radiative feedbacks on meteorology and pollutant distributions, Atmos. Environ., 115, 630–645, https://doi.org/10.1016/j.atmosenv.2014.10.056, 2015. a, b
Grell, G. A. and Freitas, S. R.: A scale and aerosol aware stochastic convective parameterization for weather and air quality modeling, Atmos. Chem. Phys., 14, 5233–5250, https://doi.org/10.5194/acp-14-5233-2014, 2014. a
Guo, J. and Yin, Y.: Mineral dust impacts on regional precipitation and summer circulation in East Asia using a regional coupled climate system model, J. Geophys. Res.-Atmos., 120, 10378–10398, https://doi.org/10.1002/2015JD023096, 2015. a
Han, Z., Li, J., Guo, W., Xiong, Z., and Zhang, W.: A study of dust radiative feedback on dust cycle and meteorology over East Asia by a coupled regional climate-chemistry-aerosol model, Atmos. Environ., 68, 54–63, https://doi.org/10.1016/j.atmosenv.2012.11.032, 2013. a
Hande, L. B., Engler, C., Hoose, C., and Tegen, I.: Seasonal variability of Saharan desert dust and ice nucleating particles over Europe, Atmos. Chem. Phys., 15, 4389–4397, https://doi.org/10.5194/acp-15-4389-2015, 2015. a
Haywood, J. and Boucher, O.: Estimates of the direct and indirect radiative forcing due to tropospheric aerosols: A review, Rev. Geophys., 38, 513–543, 2000. a, b
He, J., Glotfelty, T., Yahya, K., Alapaty, K., and Yu, S.: Does temperature nudging overwhelm aerosol radiative effects in regional integrated climate models?, Atmos. Environ., 154, 42–52, https://doi.org/10.1016/j.atmosenv.2017.01.040, 2017. a
Heinold, B., Tegen, I., Bauer, S., and Wendisch, M.: Regional modelling of Saharan dust and biomass-burning smoke, Tellus B, 63, 800–813, https://doi.org/10.1111/j.1600-0889.2011.00574.x, 2011. a
Helmert, J., Hinold, B., Tegen, I., Hellmuth, O., and Wendish, M.: On the direct and semidirect effects of Saharan dust over Europe: A modeling study, J. Geophys. Res., 112, D13208, https://doi.org/10.1029/2006JD007444, 2007. a, b
Holben, B., Tanre, D., Smirnov, A., Eck, T. F., Slutsker, I., Abuhassan, N., Newcomb, W. W., Schafer, J., Chatenet, B., Lavenu, F., Kaufman, Y. J., Vande Castle, J., Setzer, A., Markham, B., Clark, D., Frouin, R., Halthore, R., Karnieli, A., O'Neill, N. T., Pietras, C., Pinker, R. T., Voss, K., and Zibordi, G.: An emerging ground-based aerosol climatology: Aerosol Optical Depth from AERONET, J. Geophys. Res., 106, 12067–12097, 2001. a
Hovmoller, E.: The Trough-and-Ridge diagram, Tellus, 1, 62–66, https://doi.org/10.1111/j.2153-3490.1949.tb01260.x, 1949. a
Huang, J., Zhang, C., and Prospero, J. M.: Large-scale effect of aerosols on precipitation in the West African Monsoon region, Q. J. Roy. Meteor. Soc., 135, 581–594, https://doi.org/10.1002/qj.391, 2009. a
Iacono, M. J., Delamere, J. S., Mlawer, E. J., Shephard, M. W., Clough, S. A., and Collins, W. D.: Radiative forcing by long-lived greenhouse gases: Calculations with the AER radiative transfer models, J. Geophys. Res.-Atmos., 113, D13103, https://doi.org/10.1029/2008JD009944, 2008. a
Knippertz, P., Coe, H., Chiu, J. C., Evans, M. J., Fink, A. H., Kalthoff, N., Liousse, C., Mari, C., Allan, R. P., Brooks, B., Danour, S., Flamant, C., Jegede, O. O., Lohou, F., and Marsham, J. H.: The DACCIWA Project: Dynamics-Aerosol-Chemistry-Cloud Interactions in West Africa, B. Am. Meteorol. Soc., 96, 1451–1460, https://doi.org/10.1175/BAMS-D-14-00108.1, 2015a. a
Knippertz, P., Evans, M. J., Field, P. R., Fink, A. H., Liousse, C., and Marsham, J. H.: The possible role of local air pollution in climate change in West Africa, Nat. Clim. Change, 5, 815, https://doi.org/10.1038/nclimate2727, 2015b. a
Knippertz, P., Fink, A. H., Deroubaix, A., Morris, E., Tocquer, F., Evans, M. J., Flamant, C., Gaetani, M., Lavaysse, C., Mari, C., Marsham, J. H., Meynadier, R., Affo-Dogo, A., Bahaga, T., Brosse, F., Deetz, K., Guebsi, R., Latifou, I., Maranan, M., Rosenberg, P. D., and Schlueter, A.: A meteorological and chemical overview of the DACCIWA field campaign in West Africa in June–July 2016, Atmos. Chem. Phys., 17, 10893–10918, https://doi.org/10.5194/acp-17-10893-2017, 2017. a, b, c, d, e
Koop, T., Luo, B., Tsias, A., and Peter, T.: Water activity as the determinant for homogeneous ice nucleation in aqueous solutions, Nature, 406, 611–614, https://doi.org/10.1038/35020537, 2001. a
Lim, K.-S. S., Fan, J., Leung, L. R., Ma, P.-L., Singh, B., Zhao, C., Zhang, Y., Zhang, G., and Song, X.: Investigation of aerosol indirect effects using a cumulus microphysics parameterization in a regional climate model, J. Geophys. Res.-Atmos., 119, 906–926, https://doi.org/10.1002/2013JD020958, 2013. a, b
Luo, C., Mahowald, N., and del Corral, J.: Sensitivity study of meteorological parameters on mineral aerosol mobilization, transport, and distribution, J. Geophys. Res.-Atmos., 108, 4447–4468, 2003. a
Mahowald, N., Luo, C., and del Corral, J.: Interannual variability in atmospheric mineral aerosols from a 22-year model simulation and observational data, J. Geophys. Res., 108, 4352–4372, 2003. a
Mailler, S., Menut, L., Khvorostyanov, D., Valari, M., Couvidat, F., Siour, G., Turquety, S., Briant, R., Tuccella, P., Bessagnet, B., Colette, A., Létinois, L., Markakis, K., and Meleux, F.: CHIMERE-2017: from urban to hemispheric chemistry-transport modeling, Geosci. Model Dev., 10, 2397–2423, https://doi.org/10.5194/gmd-10-2397-2017, 2017. a
Menut, L., Flamant, C., Turquety, S., Deroubaix, A., Chazette, P., and Meynadier, R.: Impact of biomass burning on pollutant surface concentrations in megacities of the Gulf of Guinea, Atmos. Chem. Phys., 18, 2687–2707, https://doi.org/10.5194/acp-18-2687-2018, 2018. a, b, c, d
MetOffice: Met Office Integrated Data Archive System (MIDAS) Land and Marine Surface Stations Data (1853–current), NCAS British Atmospheric Data Centre, 2012. a
Miller, R. L., Perlwitz, J. P., and Tegen, I.: Feedback upon dust emission by dust radiative forcing through the planetary boundary layer, J. Geophys. Res., 109, D24209, https://doi.org/10.1029/2004JD004912, 2004. a
Neelin, J. D. and Held, I. M.: Modeling Tropical Convergence Based on the Moist Static Energy Budget, Mon. Weather Rev., 115, 3–12, https://doi.org/10.1175/1520-0493(1987)115<0003:MTCBOT>2.0.CO;2, 1987. a
Nickovic, S., Cvetkovic, B., Madonna, F., Rosoldi, M., Pejanovic, G., Petkovic, S., and Nikolic, J.: Cloud ice caused by atmospheric mineral dust – Part 1: Parameterization of ice nuclei concentration in the NMME-DREAM model, Atmos. Chem. Phys., 16, 11367–11378, https://doi.org/10.5194/acp-16-11367-2016, 2016. a
Parker, D. J., Burton, R. R., Diongue-Niang, A., Ellis, R. J., Felton, M., Taylor, C. M., Thorncroft, C. D., Bessemoulin, P., and Tompkins, A. M.: The diurnal cycle of the West African monsoon circulation, Q. J. Roy. Meteor. Soc., 131, 2839–2860, https://doi.org/10.1256/qj.04.52, 2005. a
Powers, J. G., Klemp, J. B., Skamarock, W. C., Davis, C. A., Dudhia, J., Gill, D. O., Coen, J. L., Gochis, D. J., Ahmadov, R., Peckham, S. E., Grell, G. A., Michalakes, J., Trahan, S., Benjamin, S. G., Alexander, C. R., Dimego, G. J., Wang, W., Schwartz, C. S., Romine, G. S., Liu, Z., Snyder, C., Chen, F., Barlage, M. J., Yu, W., and Duda, M. G.: The Weather Research and Forecasting Model: Overview, System Efforts, and Future Directions, B. Am. Meteorol. Soc., 98, 1717–1737, https://doi.org/10.1175/BAMS-D-15-00308.1, 2017. a
Redelsperger, J., Thorncroft, C., Diedhiou, A., Lebel, T., Parker, D., and Polcher, J.: African Monsoon Multidisciplinary Analysis (AMMA): An International Research Project and Field Campaign, BAMS, 1739–1746, 2006. a
Rémy, S., Benedetti, A., Bozzo, A., Haiden, T., Jones, L., Razinger, M., Flemming, J., Engelen, R. J., Peuch, V. H., and Thepaut, J. N.: Feedbacks of dust and boundary layer meteorology during a dust storm in the eastern Mediterranean, Atmos. Chem. Phys., 15, 12909–12933, https://doi.org/10.5194/acp-15-12909-2015, 2015. a, b
Shi, J. J., Matsui, T., Tao, W.-K., Tan, Q., Peters-Lidard, C., Chin, M., Pickering, K., Guy, N., Lang, S., and Kemp, E. M.: Implementation of an aerosol-cloud-microphysics-radiation coupling into the NASA unified WRF: Simulation results for the 6-7 August 2006 AMMA special observing period, Q. J. Roy. Meteor. Soc., 140, 2158–2175, https://doi.org/10.1002/qj.2286, 2014. a
Slingo, A.: A GCM Parameterization for the Shortwave Radiative Properties of Water Clouds, J. Atmos. Sci., 46, 1419–1427, https://doi.org/10.1175/1520-0469(1989)046<1419:AGPFTS>2.0.CO;2, 1989. a
Stephens, G. L., Tsay, S.-C., Stackhouse, P. W., and Flatau, P. J.: The Relevance of the Microphysical and Radiative Properties of Cirrus Clouds to Climate and Climatic Feedback, J. Atmos. Sci., 47, 1742–1754, https://doi.org/10.1175/1520-0469(1990)047<1742:TROTMA>2.0.CO;2, 1990. a
Sultan, B. and Janicot, S.: The West African Monsoon Dynamics. Part II: The Preonset and Onset of the Summer Monsoon, J. Climate, 16, 3407–3427, https://doi.org/10.1175/1520-0442(2003)016<3407:TWAMDP>2.0.CO;2, 2003. a
Thompson, G. and Eidhammer, T.: A study of aerosols impacts on clouds and precipitation development in a large winter cyclone, J. Atmos. Sci., 71, 3636–3659, https://doi.org/10.1175/JAS-D-13-0305.1, 2014. a, b, c, d, e, f
Tuccella, P., Menut, L., Briant, R., Deroubaix, A., Khvorostyanov, D., Mailler, S., Siour, G., and Turquety, S.: Implementation of Aerosol-Cloud Interaction within WRF-CHIMERE Online Coupled Model: Evaluation and Investigation of the Indirect Radiative Effect from Anthropogenic Emission Reduction on the Benelux Union, Atmosphere, 10, 20, https://doi.org/10.3390/atmos10010020, 2019. a, b, c
von Storch, H. and Zwiers, F.: Statistical Analysis in Climate Research, Cambridge University Press, 2001. a
von Storch, H., Langenberg, H., and Feser, F.: A spectral nudging technique for dynamical downscaling purposes, Mon. Weather Rev., 128, 3664–3673, 2000. a
Weger, M., Heinold, B., Engler, C., Schumann, U., Seifert, A., Fößig, R., Voigt, C., Baars, H., Blahak, U., Borrmann, S., Hoose, C., Kaufmann, S., Krämer, M., Seifert, P., Senf, F., Schneider, J., and Tegen, I.: The impact of mineral dust on cloud formation during the Saharan dust event in April 2014 over Europe, Atmos. Chem. Phys., 18, 17545–17572, https://doi.org/10.5194/acp-18-17545-2018, 2018. a
Yu, S., Mathur, R., Pleim, J., Wong, D., Gilliam, R., Alapaty, K., Zhao, C., and Liu, X.: Aerosol indirect effect on the grid-scale clouds in the two-way coupled WRF–CMAQ: model description, development, evaluation and regional analysis, Atmos. Chem. Phys., 14, 11247–11285, https://doi.org/10.5194/acp-14-11247-2014, 2014. a
Zhang, Y.: Online-coupled meteorology and chemistry models: history, current status, and outlook, Atmos. Chem. Phys., 8, 2895–2932, https://doi.org/10.5194/acp-8-2895-2008, 2008. a, b
Zhao, B., Liou, K., Gu, Y., Li, Q., Jiang, J., Su, H., He, C., Tseng, H.-L., Wang, S., Liu, R., Qi, L., Lee, W.-L., and Hao, J.: Enhanced PM2.5 pollution in China due to aerosol-cloud interactions, Nature, 7, 4453, https://doi.org/10.1038/s41598-017-04096-8, 2017. a
Zhao, C., Liu, X., Ruby Leung, L., and Hagos, S.: Radiative impact of mineral dust on monsoon precipitation variability over West Africa, Atmos. Chem. Phys., 11, 1879–1893, https://doi.org/10.5194/acp-11-1879-2011, 2011. a
- Abstract
- Introduction
- The measurement data
- The modelling system
- Comparison to observations
- Impact of emissions scenarios
- Focus on the mineral dust emissions
- Conclusions
- Data availability
- Author contributions
- Competing interests
- Special issue statement
- Acknowledgements
- Financial support
- Review statement
- References


