the Creative Commons Attribution 4.0 License.
the Creative Commons Attribution 4.0 License.
 | 27 Nov 2019
Sulfate formation during heavy winter haze events and the potential contribution from heterogeneous SO2 + NO2 reactions in the Yangtze River Delta region, China
Ling Huang
Jingyu An
Bonyoung Koo
Greg Yarwood
Rusha Yan
Yangjun Wang
Rapid sulfate formation is recognized as a key characteristic of severe winter haze in China. However, air quality models tend to underestimate sulfate formation during heavy haze periods, and heterogeneous formation pathways have been proposed as promising mechanisms to reduce gaps between observation and model simulation. In this study, we implemented a reactive SO2 uptake mechanism through the SO2+NO2 heterogeneous reactions in the Comprehensive Air Quality Model with Extensions (CAMx) to improve simulation of sulfate formation in the Yangtze River Delta (YRD) region. Parameterization of the SO2+NO2 heterogeneous reactions is based on observations in Beijing and considered both the impact of relative humidity and aerosol pH on sulfate formation. Ammonia is reported to be critical for the formation of secondary inorganic aerosols. Estimation of ammonia emissions is usually associated with large uncertainties and models tend to underestimate ammonia concentrations substantially. Sensitivity tests were conducted to evaluate the influence of the SO2+NO2 heterogeneous reactions as well as ammonia emissions on modeled sulfate concentrations during a period with several heavy haze episodes in the YRD region. Base case model results show large underestimation of sulfate concentrations by 36 % under polluted conditions in the YRD region. Adding the SO2+NO2 heterogeneous reactions or doubling ammonia emissions alone leads to slight model improvement (∼6 %) on simulated sulfate concentrations in the YRD region. However, model performance significantly improved when both the SO2+NO2 heterogeneous reactions and doubled ammonia emissions were included in the simulation: predicted sulfate concentrations during polluted periods increased from 23.1 µg m−3 in the base scenario to 29.1 µg m−3 (representing an increase of 26 %). Aerosol pH is crucial for the SO2+NO2 heterogeneous reactions, and our calculated aerosol pH is always acidic and increased by 0.7 with doubled ammonia emissions. Modeling results also show that this reactive SO2 uptake mechanism enhanced sulfate simulations by 1 to 5 µg m−3 for the majority of the eastern and central parts of China, with more than 20 µg m−3 increase in sulfate concentrations over the northeastern plain. These findings suggest that the SO2+NO2 heterogeneous reactions could be potentially important for sulfate formation in the YRD region as well as other parts of China. Further studies are needed to constrain the uncertainties associated with the parameterization of the SO2+NO2 heterogeneous reactions based on local data as well as to evaluate this mechanism in other regions. In addition, ammonia emissions were found to be a key driving variable of the spatial patterns of sulfate enhancement due to the new pathway. Substantial efforts are needed to improve the accuracy of the ammonia emission inventory.
- Article
(11773 KB) - Full-text XML
-
Supplement
(1485 KB) - BibTeX
- EndNote


Rapid sulfate () formation has been reported to be a key characteristic of severe winter haze in China. However, most air quality models tend to underestimate sulfate formation during severe winter haze episodes in China, because standard SO2 oxidation pathways, including gas-phase chemistry (i.e., oxidized by hydroxyl radical OH) and aqueous-phase chemistry (i.e., oxidized by ozone (O3) and hydrogen peroxide (H2O2)), are suppressed by weak photochemical activity and low ozone concentrations (Quan et al., 2014). Meanwhile, analysis of severe haze events in China shows enhanced secondary inorganic aerosols, especially sulfate concentrations. For example, Quan et al. (2014) found that observed sulfate accounted for 13 % of PM2.5 (particulate matter with dynamic equivalent diameter less than 2.5 µm) on normal clean days and increased to 25 % on haze days during the infamous January 2013 Beijing haze period. For the same haze episode, Cheng et al. (2016) used concentration ratios of sulfate to sulfur dioxide ([] ∕ [SO2]) to diagnose sulfate production rate; this ratio increased with PM2.5 levels and was 6 times higher under the most polluted conditions compared to normal conditions. Most current air quality models (e.g., CMAQ, GEOS-Chem, WRF-Chem, CAMx), which only include the traditional gaseous- or aqueous-phase mechanisms for sulfate formation, do not show very good model performances for sulfate concentrations against observations during haze periods in China (Wang et al., 2014; B. Zheng et al., 2015; Gao et al., 2016a, b; Li et al., 2015). The underprediction of sulfate concentrations could be related to uncertainties in the emission inventory, bias of simulated meteorological fields, and/or some missing sulfate formation mechanisms that are not included in the current models.
Heterogeneous sulfate production chemistry has been proposed by several studies to explain the high concentrations and rapid formation of sulfate during haze episodes in China (e.g., He et al., 2014; Wang et al., 2014, 2016; B. Zheng et al., 2015; Cheng et al., 2016; Guo et al., 2017). He et al. (2014) suggested a synergistic effect between NO2 and SO2 on the surface of mineral dust (i.e., mineral oxides) as an important source of sulfate in China and emphasized the essential role of O2 involved in this process. More generally, heterogeneous loss of SO2 on aerosol surfaces (not limited to mineral dust) or deliquescent aerosols is discussed by many studies, although the exact underlying mechanism is still unknown (e.g., Wang et al., 2014; G. Zheng et al., 2015). For these kinds of heterogeneous reactions, the sulfate production rate has been parameterized as a pseudo 1st-order reaction with respect to the gaseous SO2 concentration with the SO2 reactive uptake coefficient (γ) on aerosol surfaces being the key parameter. This uptake coefficient, representing the probability that a SO2 gas molecule colliding with an aerosol surface results in sulfate formation, is reported to be heavily dependent on relative humidity (RH) (B. Zheng et al., 2015; Wang et al., 2016). Parameterized reactive uptake of SO2 has been implemented in several current air quality models, including GEOS-Chem, WRF-Chem, CMAQ, and CAMx, and generally improved model performance of sulfate concentrations during haze episodes in China (e.g., Wang et al., 2014; B. Zheng et al., 2015; Gao et al., 2016b). Two more recent papers, Wang et al. (2016) and Cheng et al. (2016), further suggested that reaction between NO2 and SO2 in aerosol water may contribute substantially to sulfate formation during haze events in China. Both studies emphasized the importance of higher aerosol pH (5.4–6.2 reported by Cheng et al., 2016, and 6.0–7.6 by Wang et al., 2016) sustained by abundant gas-phase ammonia (NH3) during haze periods being an essential precondition for this mechanism. However, the near-neutralized aerosol pH that facilities SO2 oxidation by NO2 is questioned by Guo et al. (2017), who concluded from a thermodynamic analysis that aerosol pH was always acidic (4.5–5) regardless of the ambient NH3 concentrations and that the NO2-mediated oxidation of SO2 was unlikely to be important in China or any other region of the world. Guo et al. (2017) pointed out that within low-pH ranges (up to 4.5), SO2 oxidation catalyzed by transition metals (i.e., Fe(III) and Mn(II)) might become a dominant sulfate formation pathway in aerosol water, and they suggested it as an alternative to SO2+NO2 reactive uptake, being a potential sulfate contributor under haze conditions. A similar conclusion is also made from the most recent work by Shao et al. (2019), who implemented four heterogeneous sulfate formation mechanisms in GEOS-Chem and assessed model performance using sulfate oxygen isotope data in Beijing. They found that SO2 oxidation catalyzed by transition metal ion (TMI) to be the dominant sulfate formation mechanism. On the contrary, another slightly earlier study by Ye et al. (2018) concluded that SO2 oxidation by H2O2 was the dominant pathway based on observations of atmospheric H2O2 concentrations in Beijing. Song et al. (2019) suggested the heterogeneous hydroxymethanesulfonate (HMS) chemistry to be a potentially important contributor to heavy haze pollution in northern China. Hung et al. (2018) reported on the interfacial SO2 oxidation on the surface of aqueous micro-droplets as a potential pathway to explain fast conversion of SO2 to sulfate.
To investigate whether the SO2+NO2 reactions in aerosol water could help better predict the enhanced sulfate formation during haze periods in the Yangtze River Delta (YRD) region, we implemented a parameterized SO2+NO2 reactive uptake mechanism in the Comprehensive Air Quality Model with Extensions (CAMx), which is a widely used air quality model in China (e.g., Wang et al., 2009; Huang et al., 2012; Li et al., 2013, 2015; Jia et al., 2017). Our parameterization specifically incorporated RH and aerosol pH dependencies derived from measurement data during the 2015 Beijing haze event (Wang et al., 2016). Although the RH dependency of the SO2 uptake rate has already been implemented in previous studies (e.g., B. Zheng et al., 2015; Wang et al., 2014), the effect of aerosol pH has not been explicitly included in most of the previous modeling studies, except for the most recent study by Shao et al. (2019), who also considered aerosol pH in their model parameterization. While most of the previous studies were trying to improve model predictions in the northern part of China, especially the Beijing–Tianjin–Hebei region (e.g., Gao et al., 2016b; B. Zheng et al., 2015), this work is one of the few studies that focus on the Yangtze River Delta region, which has also suffered from severe haze problems in recent years due to urban expansion and industrialization (e.g., Li et al., 2011; M. Wang et al., 2015; Xu et al., 2016; Ming et al., 2017). In addition to the SO2+NO2 heterogeneous reactions, we also investigated model sensitivities to ammonia emissions, which have been reported to be crucial for the formation of secondary inorganic aerosols and because large uncertainties exist with current ammonia emission inventory (Huang et al., 2011; Fu et al., 2013).
2.1 Current sulfate formation pathways in CAMx
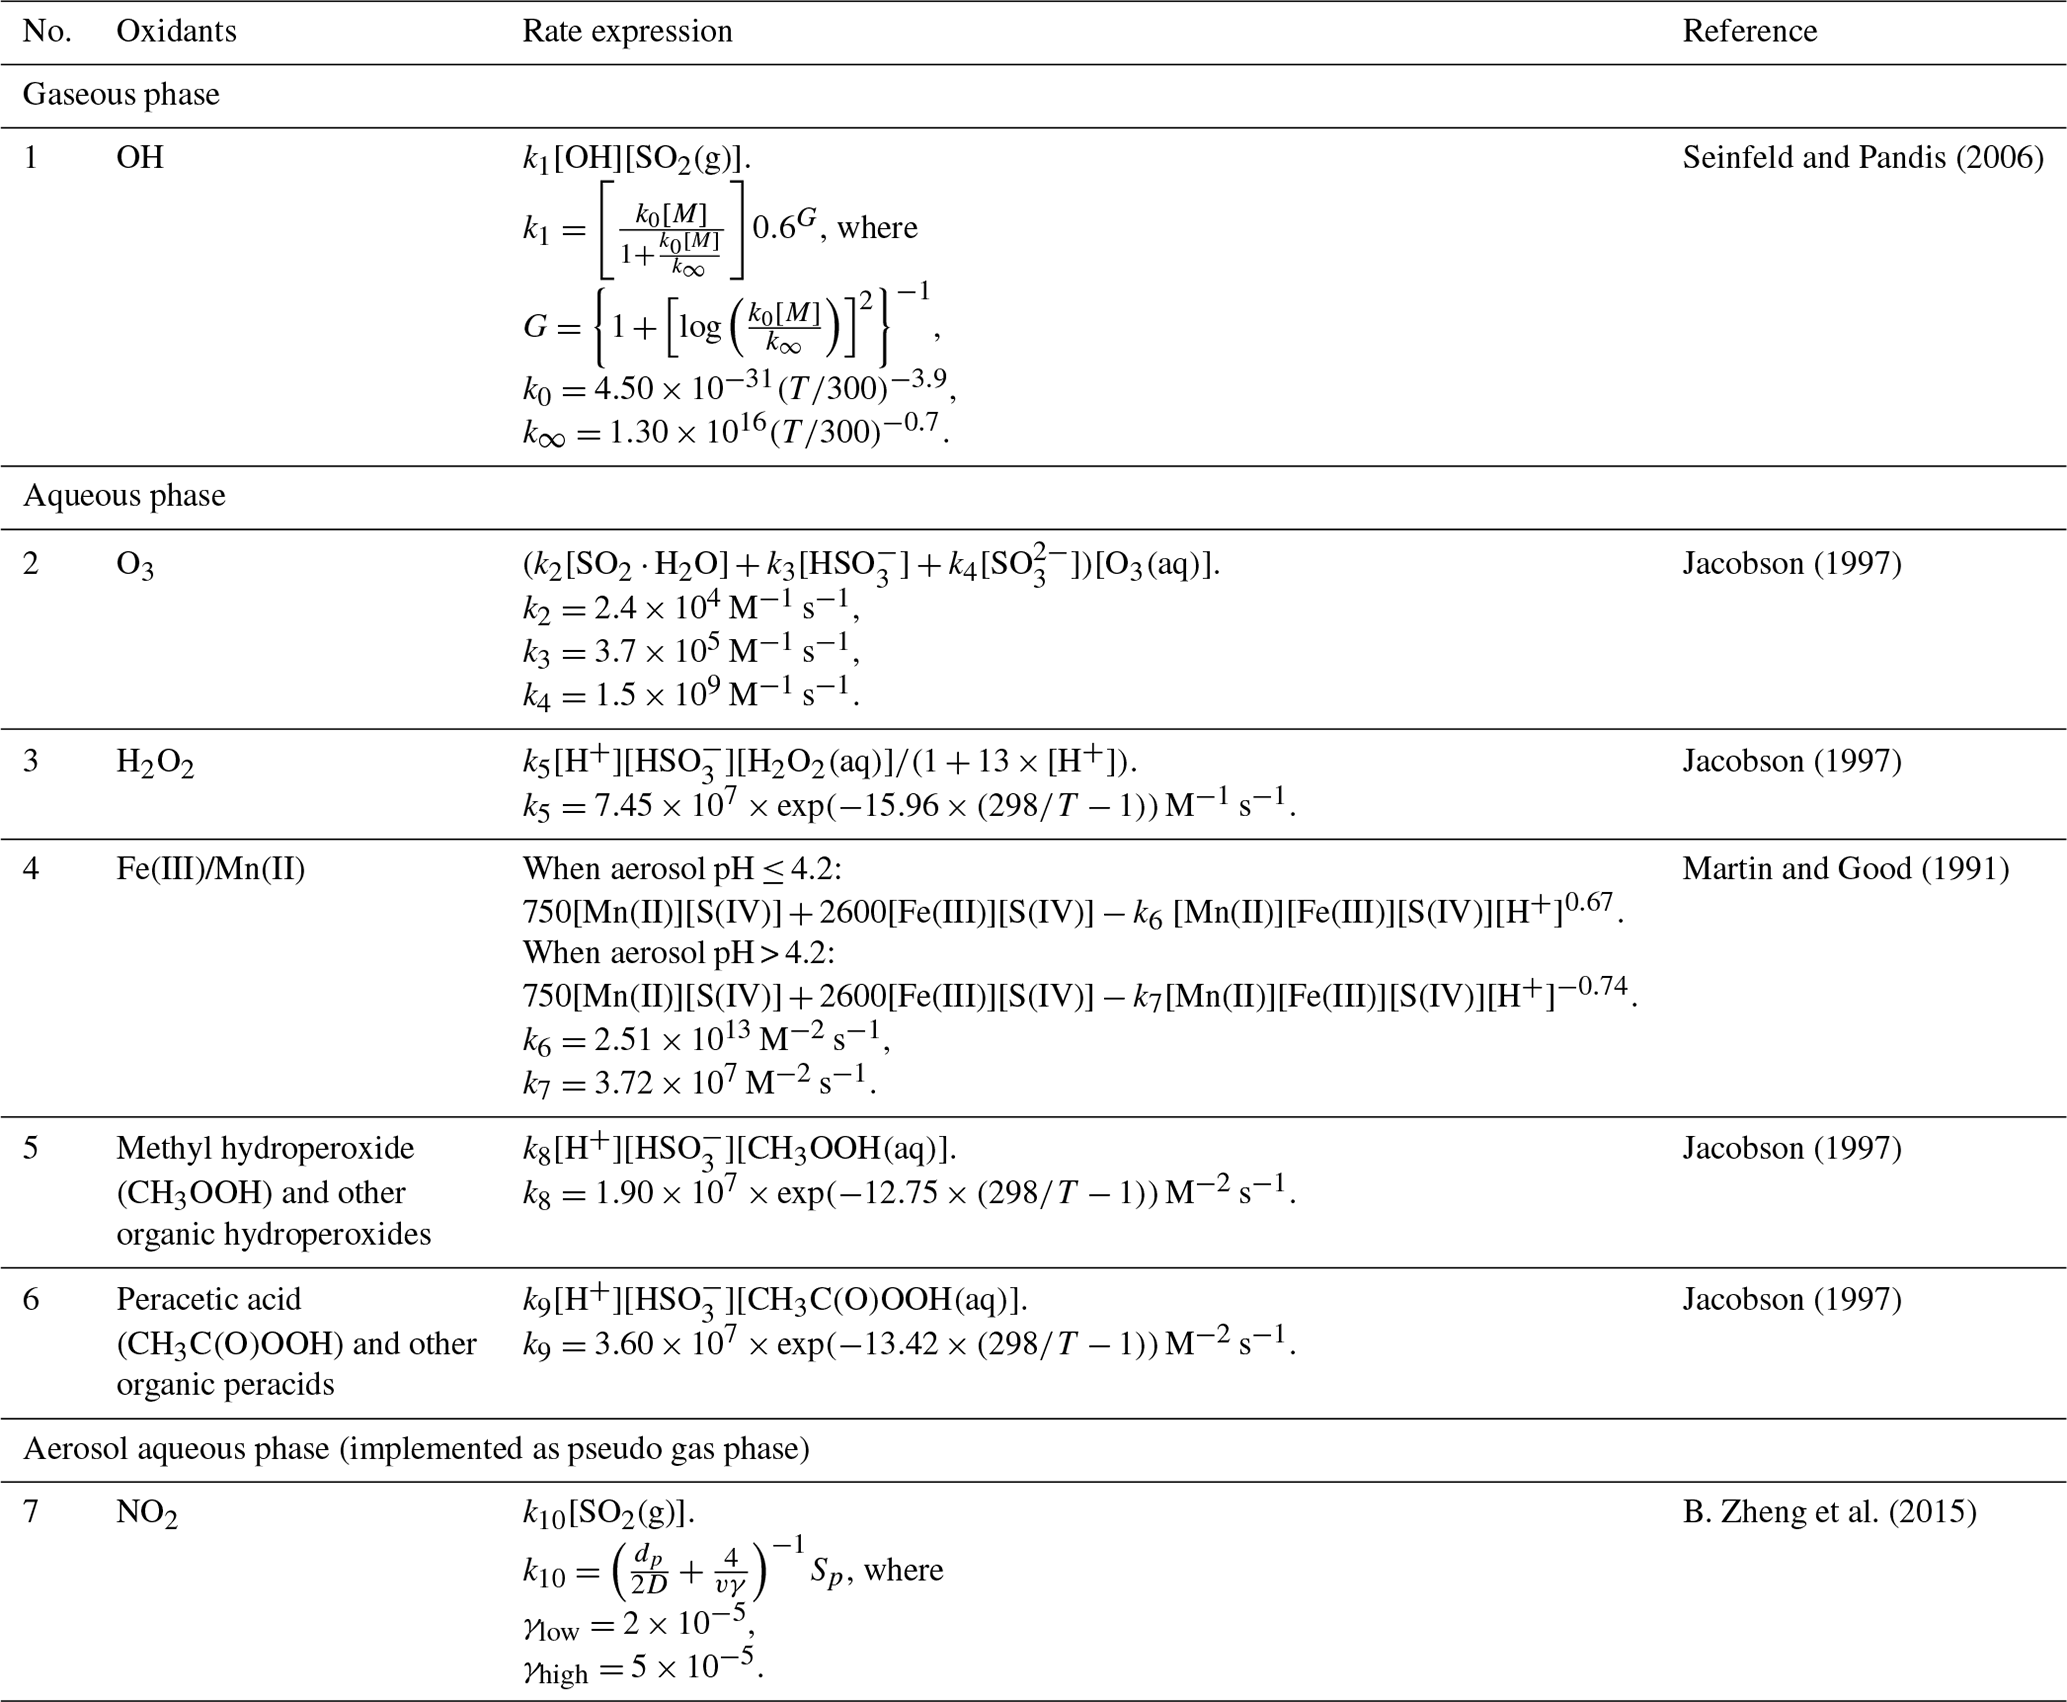
In this study, CAMx version 6.40 (Ramboll Environ, 2016) was used as the base model to simulate sulfate formation. Table 1 lists the sulfate formation pathways that are currently considered implemented in standard CAMx source code. In addition to the traditional SO2 oxidation by OH in the gas phase and O3, H2O2, and O2 (catalyzed by Fe(III)/Mn(II)) in cloud droplets, sulfate formation through reactions with methyl hydroperoxide (MHP) and other organic hydroperoxides, as well as peracetic acid (PAA) and other organic peracids in the aqueous phase, is also included. For the heterogeneous formation pathway, the SO2+NO2 reaction is currently considered and implemented as a pseudo gas-phase reaction with the rate parameterization based on results from B. Zheng et al. (2015), where the key parameter (i.e., gamma) is bounded between lower and upper limits and changes linearly in response to RH. This relatively simple parameterization of the SO2+NO2 heterogeneous reaction has been included in many previous studies, e.g., Wang et al. (2014), B. Zheng et al. (2015).
Table 1Sulfate formation pathways currently implemented in CAMx version 6.40.
2.2 SO2+NO2 mechanism in CAMx
In this study, we implemented the SO2+NO2 reactive uptake mechanism in CAMx version 6.40 (Ramboll Environ, 2016) as a pseudo gas-phase reaction:
Since the vapor pressure of sulfuric acid is very low, we assumed all sulfuric acid partitions to the aerosol phase. The rate constant khet is related to the reactive uptake coefficient γ for SO2 as follows:
where is the mean molecular speed (m s−1), and S is the aerosol surface area concentration (m2 m−3). Based on the observations during the Chinese haze events (Wang et al., 2016), this uptake coefficient γ depends on aerosol pH, RH, and NO2 concentration. Therefore, we assumed a functional form of γ as the product of each of these dependencies:
where k0 (ppm−1) is the RH-dependent parameter; NO2(g) is the NO2 gas concentration and df is the pH-dependent distribution factor of SO2, i.e., the ratio of SO2 concentration in the aqueous phase to the gaseous phase and is calculated as Eq. (4) in the model:
where Heff is the effective Henry's law constant of SO2 (M atm−1), R is the universal gas constant (L atm mol−1 K−1), T is air temperature (K), and wL is the aerosol water content (µg m−3). We used the data in Tables S2 and S5 by Wang et al. (2016) to back calculate the RH dependency of k0 under clean (observed sulfate concentration less than 10 µg m−3), transition (sulfate between 10 and 20 µg m−3), and polluted (sulfate more than 20 µg m−3) conditions during Beijing 2015 episodes. The reactive uptake coefficient γ derived by Wang et al. (2016) contains an assumption that all sulfate formation was due to the SO2+NO2 heterogeneous reactions due to low photochemical reactivity and low Fe∕Mn concentrations during the measurement period. Thus we started with an upper bound estimate of the SO2+NO2 heterogeneous reactions. Aerosol pH was calculated using the ISORROPIA (Fountoukis and Nenes, 2007) thermodynamic equilibrium model implemented in CAMx assuming a metastable aerosol liquid phase, which is an appropriate assumption for most ambient conditions including the Chinese haze events (Guo et al., 2017). Wang et al. (2016) only reported NOx (not NO2) concentrations in Beijing during the 2015 haze event. We simply assumed a NO2∕NOx ratio of 0.5. Inserting NO2 concentrations, γ values from Wang et al. (2016), and calculated aerosol pH from ISORROPIA into Eq. (3), we obtained the expression of k0 depending upon RH as follows (parameters for k0 calculation is shown in Table S1):
Due to a lack of observation data at high RH values, as a conservative assumption we set a constant k0 value when RH increases from 56 % and up. This would lead to underestimated sulfate formation due to the SO2+NO2 heterogeneous reactions at high RH values, which is a favorable condition for the heterogeneous sulfate production. In addition, the differences in aerosol hygroscopicity in Beijing vs. Shanghai could add more uncertainties in the dependency of k0 on RH. Reported values of hygroscopicity parameter κ were 0.25–0.31 for Shanghai (Ye et al., 2011, 2013), which are higher than values reported for Beijing (0.14–0.24; Massling et al., 2009). Our conservative assumption that the heterogeneous reaction rate does not increase with RH above 56 % most likely tends to offset the upper bound estimate of the γ values derived by Wang et al. (2016). The rate constant khet of SO2+NO2 is formulated as
SO2 lifetime (h) associated with the SO2+NO2 reactive uptake mechanism is calculated as
Figure 1 shows the SO2 lifetime as a function of aerosol pH for clean, transition, and polluted conditions, with other variables kept constant. The SO2 lifetime shortens as aerosol pH becomes more neutralized, indicating faster conversion of SO2 to sulfate by SO2+NO2 reactive uptake on aerosol. For pH from 2 to 7, one unit increase in aerosol pH shortens SO2 lifetime by about 1 order of magnitude. The blue, orange, and red symbols in Fig. 1 correspond to the clean, transition, and polluted conditions during Beijing 2015 based on data in Table S1. As shown in Fig. 1, the aerosol pH values calculated by ISORROPIA are 5.5 (for clean conditions) and 4.1–4.2 (for transition and polluted conditions), all lower than the value (7.6) reported by Wang et al. (2016). As noted by Guo et al. (2017), it is important to make a consistent assumption for aerosol state (i.e., metastable) in deriving and implementing the parameterization for reactive uptake. The most recent paper by Song et al. (2018) identified coding errors with the ISORROPIA model, which resulted in unrealistic pH values of 7.7 using the standard ISORROPIA model with the stable state assumption in previous studies. Nevertheless, our results are not compromised by this coding error, because the metastable assumption was chosen in our ISORROPIA calculation.
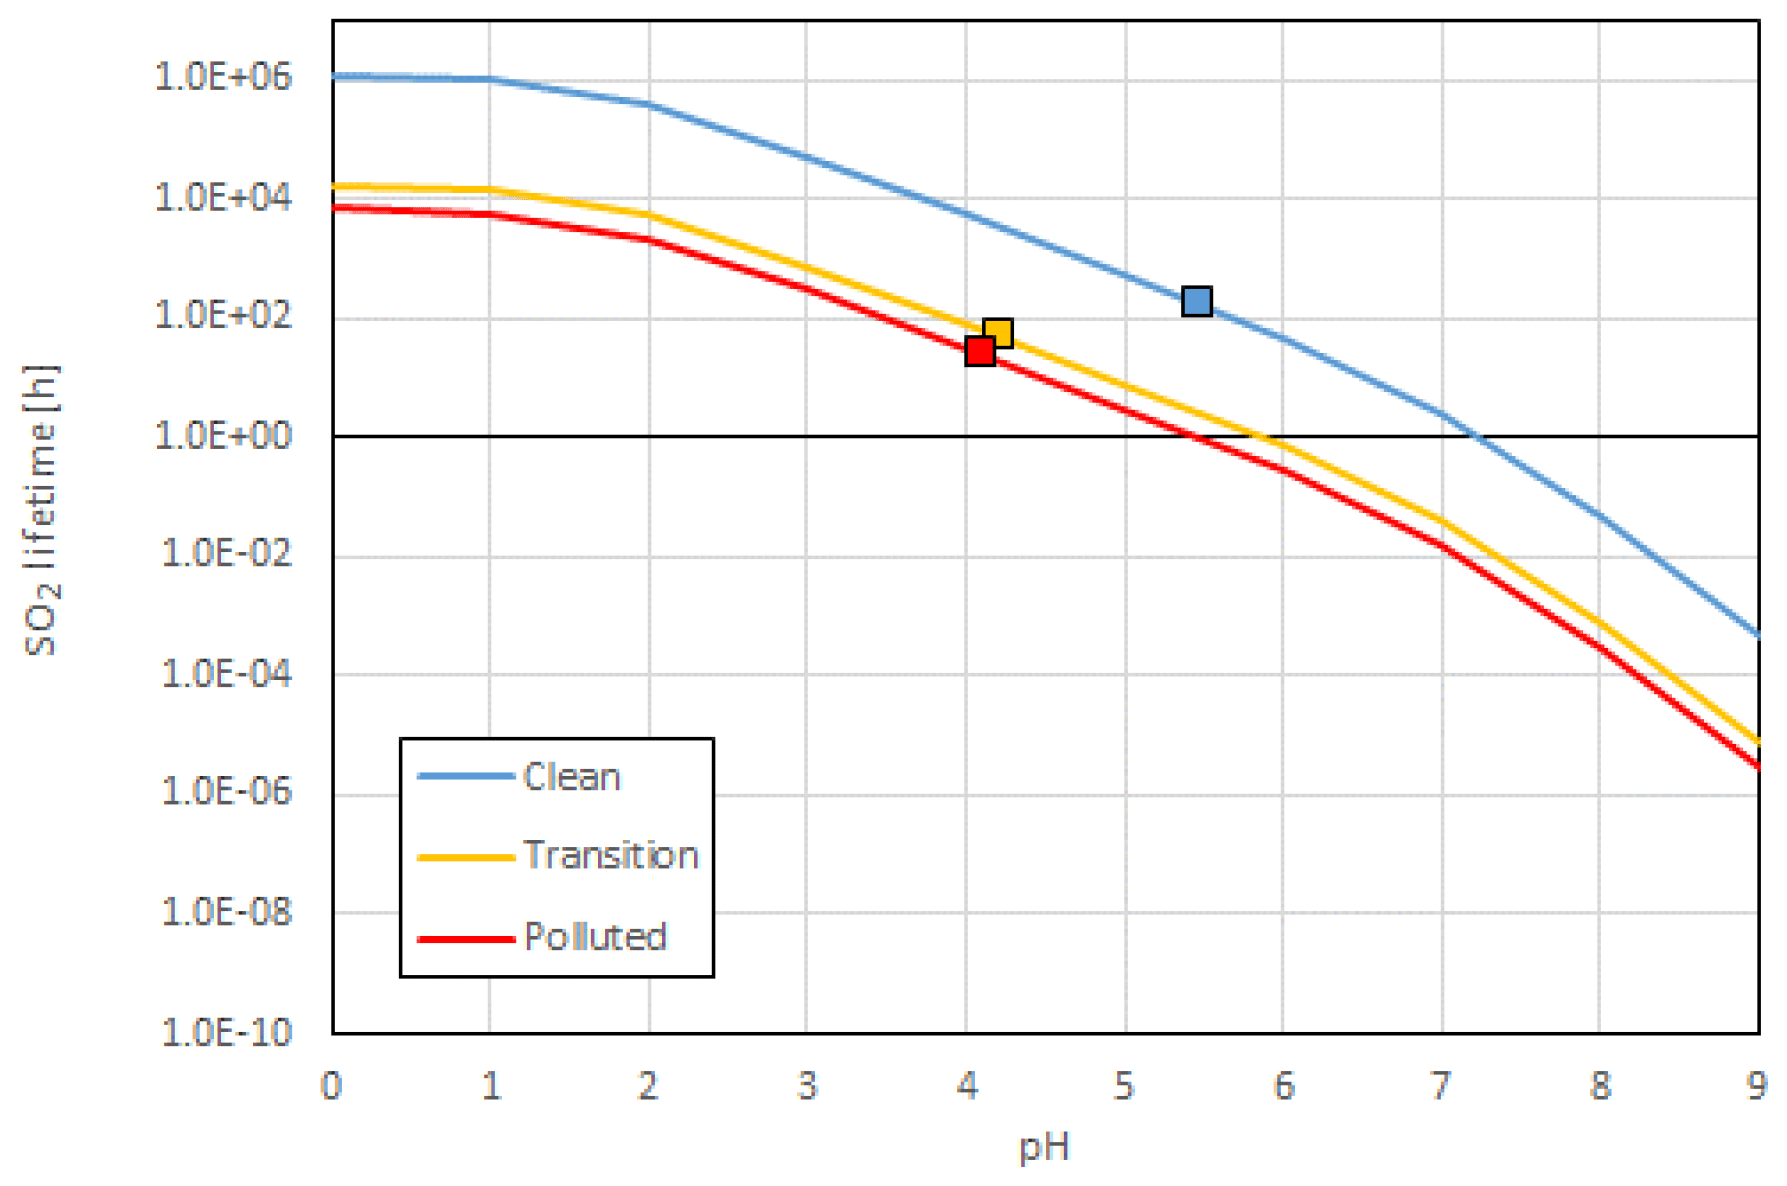
Figure 1SO2 lifetime (h−1) due to SO2+NO2 reactive uptake mechanism as a function of aerosol pH under clean, transition, and polluted conditions. Values of relative humidity, temperature, and NO2(g) concentrations are based on values in Table S1.
2.3 Model configuration
Two versions of the Comprehensive Air Quality Model with Extensions (CAMx), modified based on the original version 6.40 (Ramboll Environ, 2016), were used in this study: one with the SO2+NO2 heterogeneous reactions (described in Sect. 2.1) and one without (forcing khet equals zero). The modeling domain consists of three nested grids (Fig. 2): the outer 36 km domain (D01) covers most of China, Japan, Korean Peninsula, parts of India, and southeast Asia; the 12 km domain (D02) covers eastern China; and the inner 4 km domain (D03) covers Shanghai, Jiangsu province, Zhejiang province, Anhui province, and parts of the surrounding provinces, together referred to as the Yangtze River Delta (YRD) region. Meteorological fields were based on simulation results from the Weather Research and Forecasting (WRF) model (version 3.7) driven by the National Centers for Environmental Prediction (NCEP) National Center for Atmospheric Research (NCAR) Operational Global Analysis data (http://dss.ucar.edu/datasets/ds083.2/, last access: 23 November 2019). Details of the WRF configurations can be found in previous studies (Liu et al., 2018). Boundary conditions for D01 were generated from the Model for OZone And Related chemical Tracers (MOZART) global chemistry model (Emmons et al., 2010). The Carbon Bond 6 (CB6) mechanism (Yarwood et al., 2010) was used for the gas-phase chemistry and the static two-mode coarse/fine (CF) scheme was used to represent particle size distribution. The Zhang dry deposition (Zhang et al., 2003) and default wet deposition scheme was used to for removal processes. Anthropogenic emissions for areas outside the YRD region were from the Multi-resolution Emission Inventory for China (MEIC, http://www.meicmodel.org/, last access: 23 November 2019). For emissions within the YRD region, a YRD-specific emission inventory (Huang et al., 2011; Li et al., 2011) was updated to the year 2014 and utilized in this study. This YRD-specific emission inventory includes emissions from sources of combustion, such as industry, transport and residential sectors. Primary sulfate emissions over the 4 km domain are estimated to be 994 t d−1 for December 2013 (accounting for 14.8 % of primary PM2.5) with dense emissions from Shanghai and southern Jiangsu province (see Fig. S1 for spatial distribution). At the Shanghai Academy of Environmental Sciences (SAES) site, primary sulfate emissions were estimated to be 757 kg per month (only accounting for 1.0 % of primary PM2.5). Biogenic emissions were simulated using the Model of Emissions of Gases and Aerosols from Nature (MEGAN, version 2.1; Guenther et al., 2012) based on the WRF simulation results. The modeling episode is December 2013, during which several heavy haze events with hourly PM2.5 concentration higher than 500 µg m−3 were observed in the YRD region.

Figure 2CAMx model domains.
Four simulations with identical model configurations and input data including meteorology, initial and boundary conditions, and emission inventory (except ammonia emissions) were conducted using the two abovementioned different CAMx versions:
-
noHet (base case). Simulation based on CAMx version without the SO2+NO2 heterogeneous reactions (this is also our base case). Note that this CAMx version differs from the distributed CAMx v6.40 in that we removed the original heterogeneous sulfate formation reaction with NO2 which only included a simple parameterization based on RH (ref. reaction no. 7 in Table 1) in the distributed version. This is done on purpose to quantify the influence of the newly parameterized SO2+NO2 heterogeneous reactions on sulfate formation.
-
Het. Simulation based on CAMx with the SO2+NO2 heterogeneous reactions. Other model configurations were identical to scenario noHet.
-
noHet_2NH3. CAMx version and model configurations were the same as scenario noHet except ammonia emissions were doubled for the 4 km domain.
-
Het_2NH3. CAMx version and model configurations were the same as scenario Het but ammonia emissions were doubled for the 4 km domain.
We first ran CAMx for 36 and 12 km domains with a two-way nested mode; for the 4 km domain, we used boundary conditions extracted from the 12 km model outputs and conducted the four abovementioned scenarios. Fourteen vertical layers were used extending from the surface to 100 mbar. In addition to default CAMx outputs, we modified the source code to generate additional diagnostic variables (e.g., aerosol pH, RH, and khet) to evaluate the SO2+NO2 heterogeneous reactions.
2.4 Observations
Hourly observations of ozone, SO2, NO2, PM2.5 and its components including sulfate, nitrate, ammonium, organic carbon (OC), and elemental carbon (EC) are available between 1 and 29 December 2013 at a monitoring site located at the center of the urban area of Shanghai (referred to as the SAES site; 31.1695∘ N, 121.4305∘ E; Fig. 3). Hourly PM2.5 observations are also available at another 23 monitoring sites across the YRD region (Fig. 3; see locations in Table S2). During this period, the YRD region experienced relatively clean days as well as several heavy haze episodes with peak PM2.5 exceeding 600 µg m−3 during the most heavily polluted period of 5 to 7 December. At the SAES site, maximum hourly PM2.5 concentration reached 540.3 µg m−3 on 6 December with a monthly average of 118.7 µg m−3. We followed the method in Wang et al. (2016) to divide the period into clean (observed sulfate < 10 µg m−3), transition (10–20 µg m−3), and polluted (> 20 µg m−3) periods based on observed hourly sulfate concentration at the SAES site. Compared with clean period, all PM species increased by more than 3 times (sulfate, nitrate, and ammonium (SNA) increase by more than 5 times) during the polluted period as indicated by the enhancement ratio (calculated as the ratio of average concentrations during the polluted period divided by those during the clean period). In terms of fraction of PM2.5, SNA increased from 44 % during clean period to 69 % during polluted period while carbonaceous aerosols (OC and EC) decreased from 32 % to 24 %. This is consistent with the commonly observed characteristics of winter haze periods in China reported by many previous studies (e.g., Wang et al., 2014; B. Zheng et al., 2015; Cheng et al., 2016), i.e., SNA is playing a more important role during the heavy haze periods. Average sulfate concentration of clean, transition, and polluted periods was 6.7, 14.2, and 36.1 µg m−3, respectively, accounting for 17 %–23 % of PM2.5 (Fig. S2).
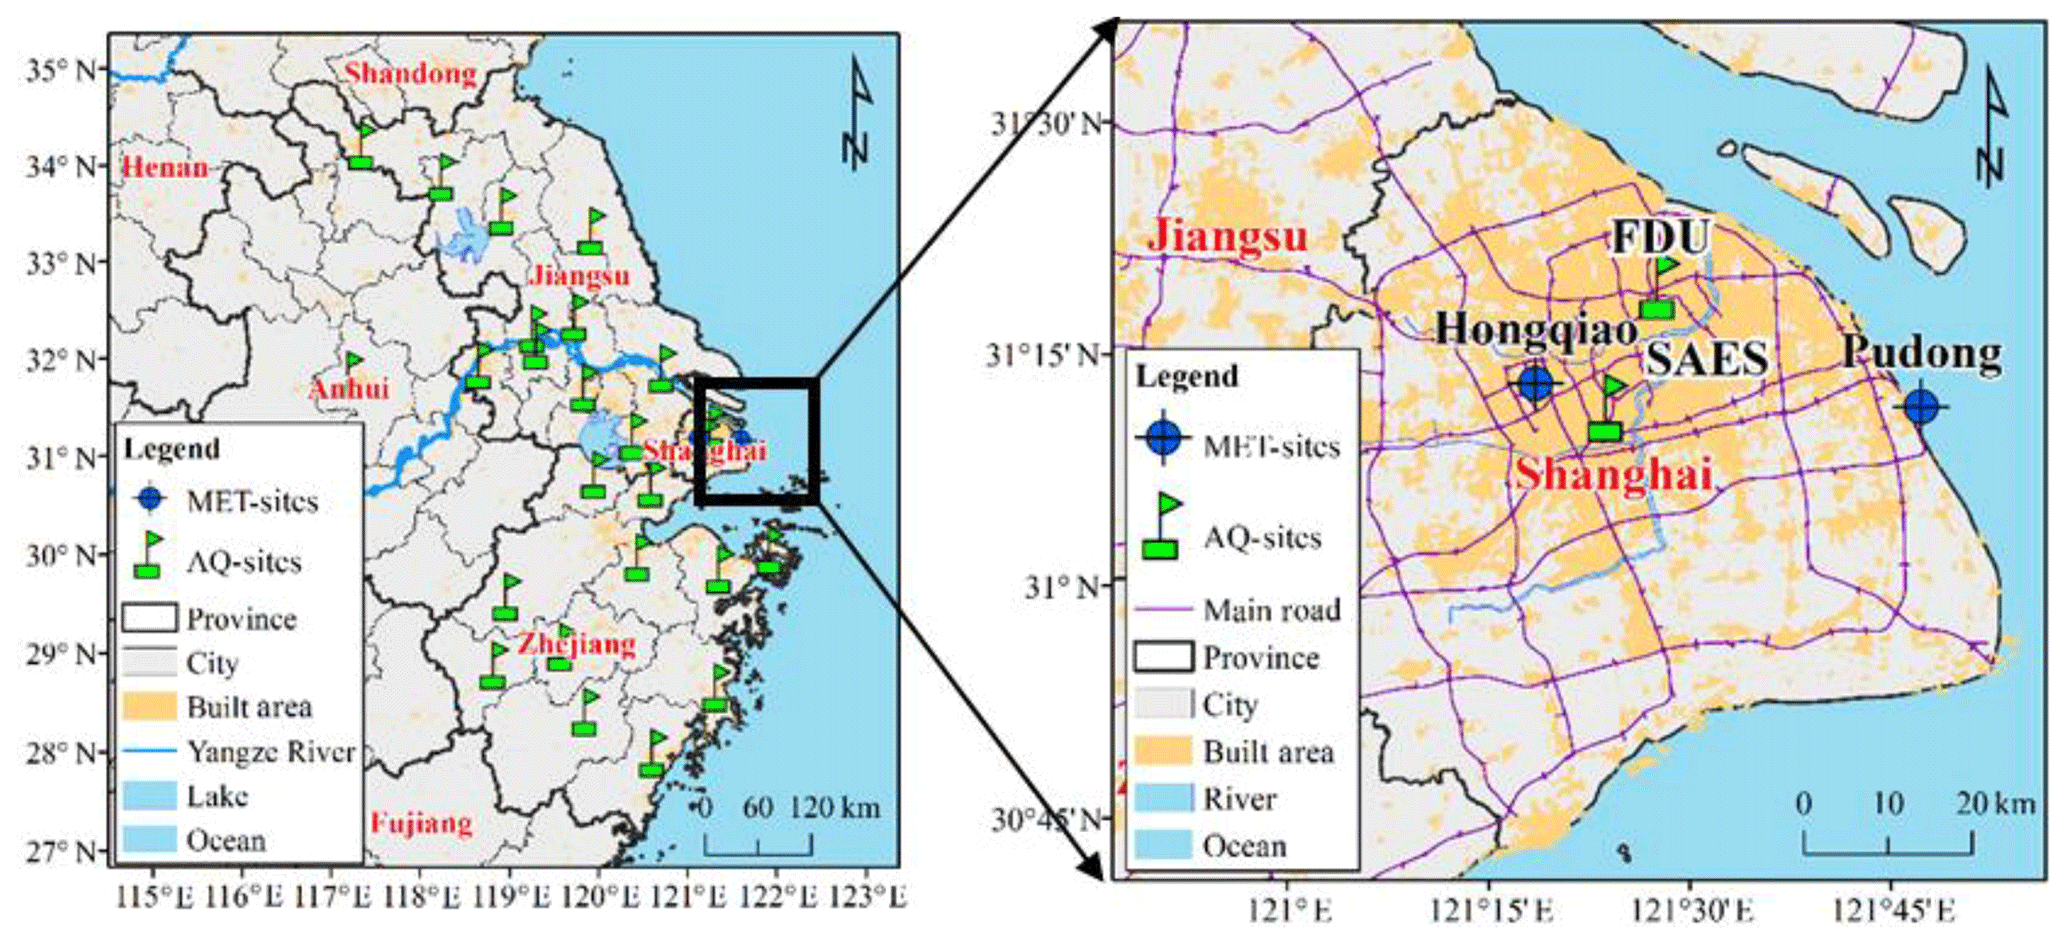
Figure 3Locations of observation sites for WRF (two meteorology sites) and CAMx model performance evaluation (SAES site and Fudan University (FDU) site within Shanghai; another 23 air quality (AQ) sites distributed over Jiangsu, Zhejiang, and Anhui provinces with locations shown in Table S2).
Observations of ambient ammonia concentrations are also available at the SAES site; however, the quality of measurements is questionable. Therefore, we used ammonia observations from a similar urban site nearby (referred to as the FDU site, ∼15 km north of the SAES site; 31.3005∘ N, 120.9778∘ E; Fig. 3) for analysis in this study. Observations at the FDU site have been discussed by S. Wang et al. (2015) and demonstrated data reliability. Diurnal NH3 concentrations at the FDU site during our modeling period showed a weak bimodal pattern with an average of 7.3 ppb (ranging 1.6–25 ppb) during this period (Fig. S3). This two-peak diurnal variation is caused by vehicle emissions and evolution of the boundary layer (S. Wang et al., 2015). In summary, observations for gases species (except NH3) and PM species at the SAES site and NH3 at the FDU site were used for model validation in this study.
2.5 Statistical metrics for model validation
For WRF and CAMx model performance evaluation, mean bias (MB), normalized mean bias (NMB), and index of agreement (IOA) were used in this study. Calculations of these selected metrics are shown below:
where Pj and Oj are predicted and observed hourly concentrations or values, respectively; N is the number of paired model and observation data; is the average concentration or value of observations; and IOA ranges from 0 to 1 with 1 indicating perfect agreement between model and observation.
3.1 Model evaluation
3.1.1 WRF results evaluation
Model performance of WRF results is generally acceptable in this study. Table S3 summarizes the meteorological performance statistics of WRF during December 2013 at Pudong and Hongqiao airport stations in Shanghai (Fig. 3). Temperature and relative humidity were well reproduced with NMB and normalized mean error (NME) within 37 % and 41 %, respectively; IOA values are above 0.8. Wind speed is overestimated with a MB of 1.5 m s−1 at Pudong and 0.5 m s−1 at Hongqiao station; NMB of predicted wind direction at the two stations is −36 % and −27 %, respectively. Comparisons of hourly observed and simulated relative humidity, wind speed, and temperature at these two stations suggest reasonable model results in terms of temporal variations (Fig. S4). Overall, the WRF simulated results are acceptable to be used in subsequent CAMx simulations.
3.1.2 CAMx base scenario (noHet) evaluation
Figure 4 depicts the time series of simulated and observed concentrations for sulfate and PM2.5 during 1 to 29 December 2013 at the SAES site (see Fig. S5 in the Supplement for other species). Overall, the model is successful in capturing the temporal variations of ozone and PM species with IOA values above 0.5 (Table S4). Nevertheless, the model tends to systematically underestimate all gaseous and PM species with NMB values ranging from −5 % for NO2 to −68 % for NH3. This could be partially explained by the higher simulated wind speeds compared with observed values, especially at Pudong station where the observed average wind speed during the modeling period was 4.5 m s−1, while simulated wind speed was 6.0 m s−1, representing an overprediction by 33 %. For sulfate, the model captured the day-to-day sulfate variations reasonably well with an overall MB of −2.8 µg m−3 and IOA of 0.80. For clean and transition periods, the model showed slight overprediction with MB of 1.1 and 0.5 µg m−3 (Table S5). However, during the polluted period when observed sulfate concentrations are higher than 20 µg m−3, the model significantly underestimated sulfate formation with a MB of −13.0 µg m−3 (NMB of −36 %). Observed maximum sulfate concentration reached 93.4 µg m−3 but the model only predicted 52.2 µg m−3. Nitrate and ammonium concentrations were also underestimated by 20 % on average and exacerbated to more than 40 % during polluted periods. For carbonaceous aerosols, elemental carbon (EC) was underestimated by 32 % while organic carbon (OC) exhibited even more underestimation of almost 50 %. Underestimation of OC is usually associated with underestimation of secondary organic aerosols (SOAs). Discussion of OC underprediction is beyond the scope of the current work and will be addressed in future studies. Results of the four CAMx simulations in this study showed negligible changes in predicted EC/OC concentrations and thus are excluded in the following discussions.
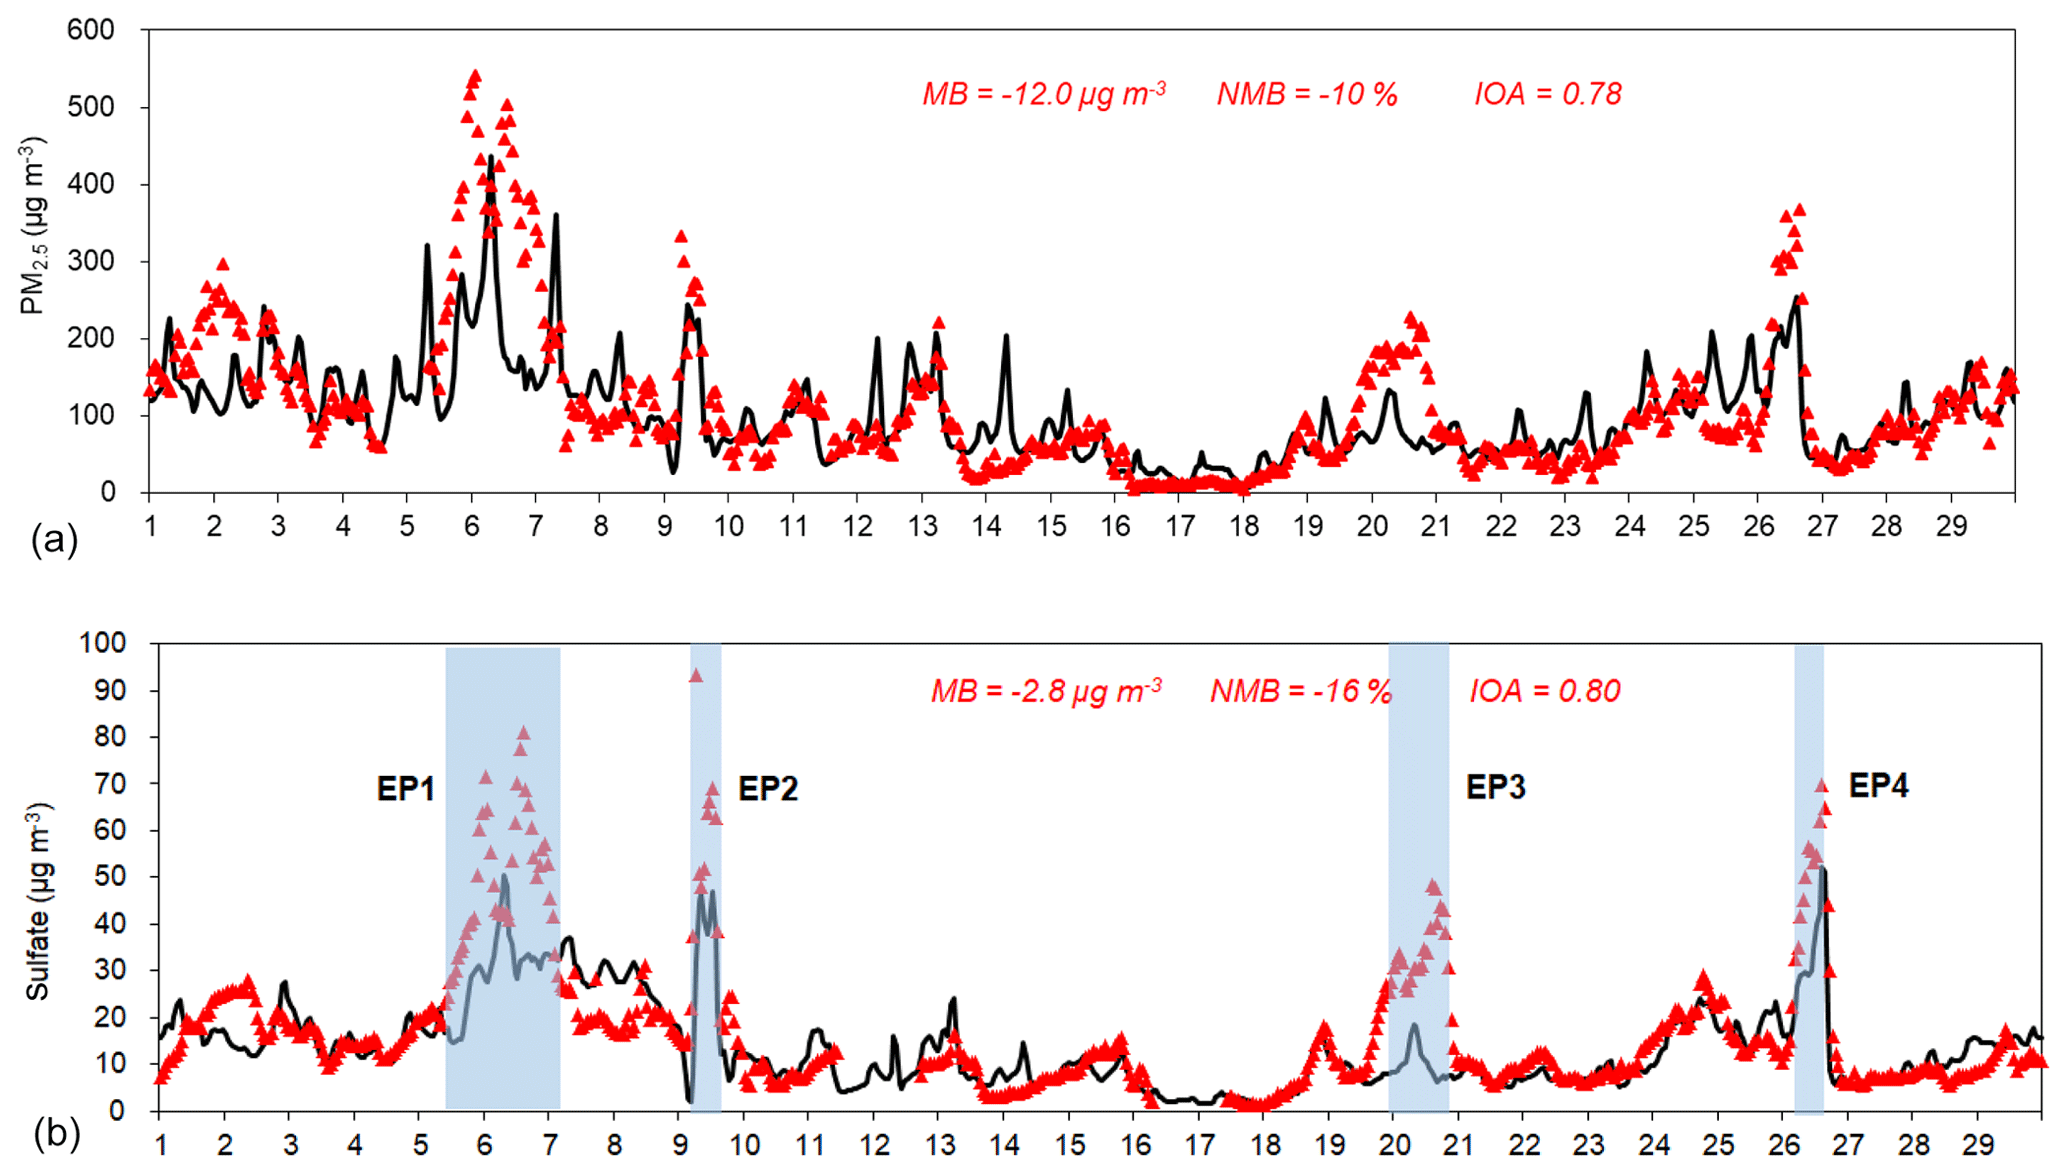
Figure 4Simulated and observed PM2.5 (a) and sulfate (b) concentrations (µg m−3) at the SAES site during 1 to 29 December 2013.
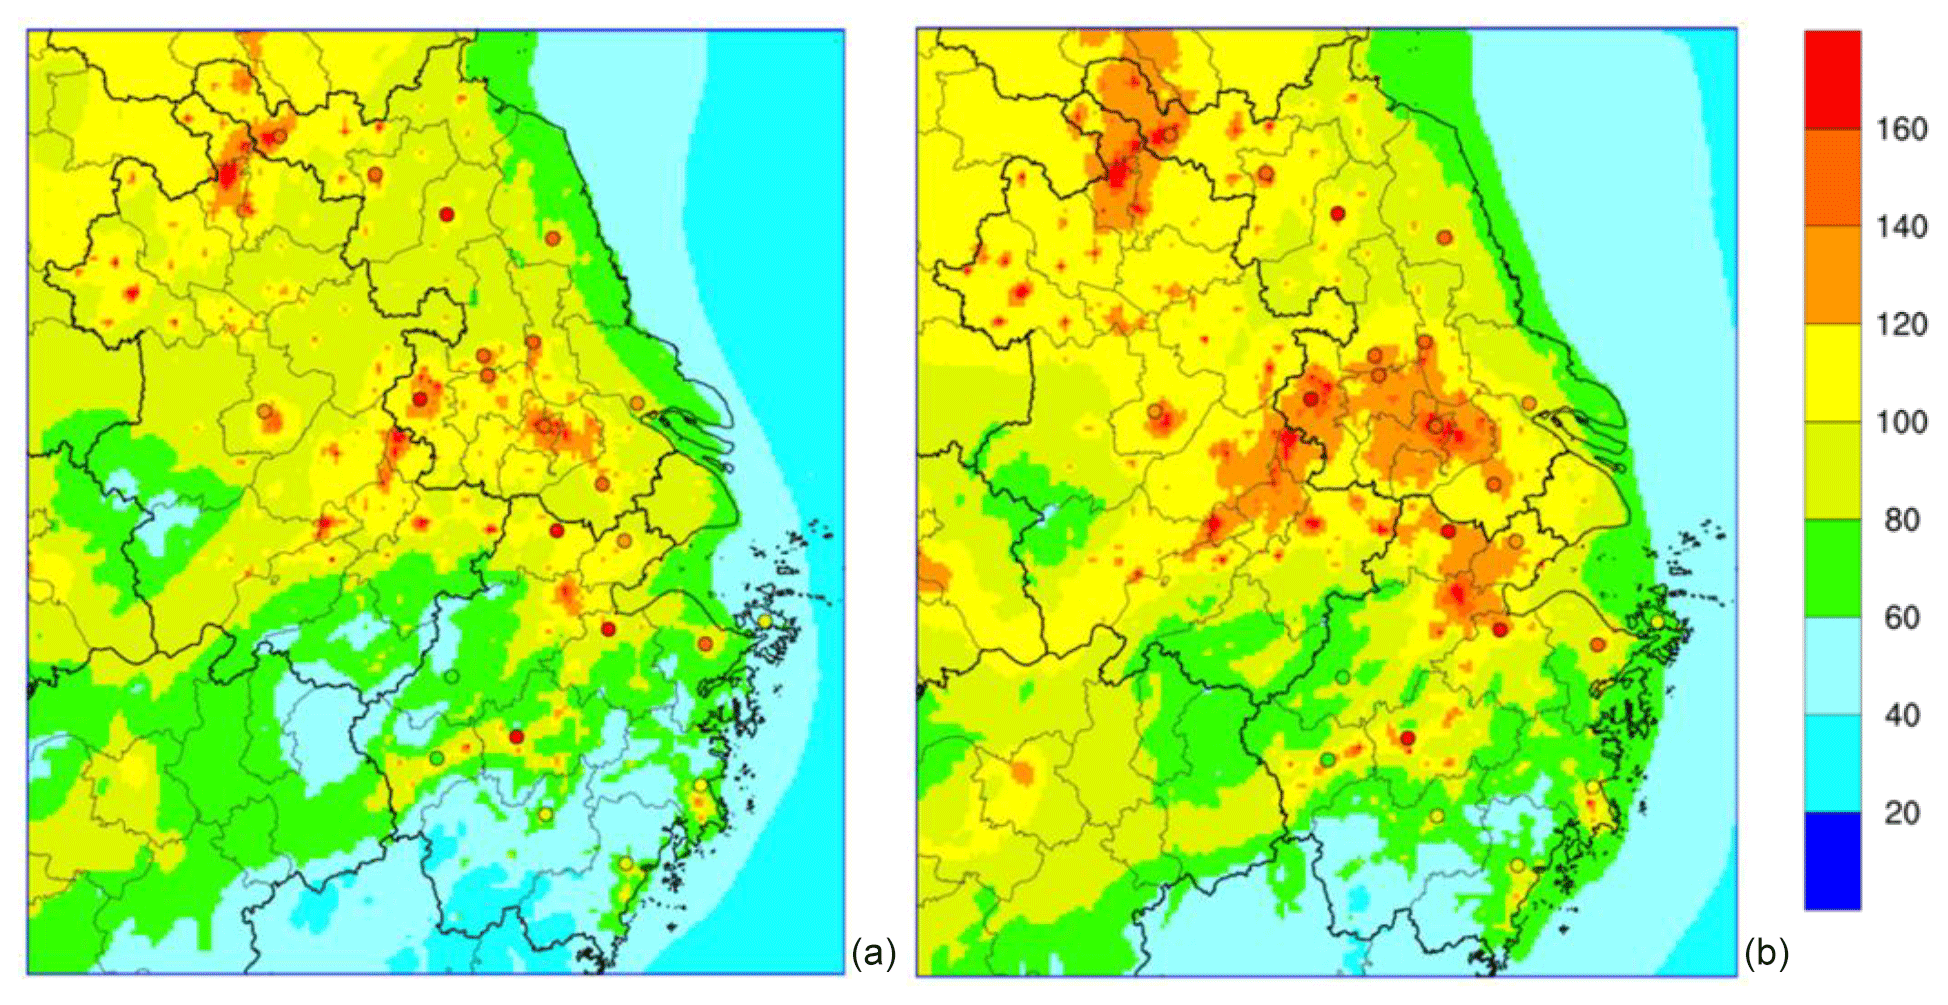
Figure 5Spatial distribution of observed and simulated monthly average PM2.5 concentrations (µg m−3) over the YRD region for the base case scenario (a) and Het_2NH3 scenario (b). Locations of the monitoring sites are listed in Table S2.
Figure 5 depicts the averaged PM2.5 during the modeling episode over the YRD region with observations at 24 monitoring sites. Observed PM2.5 concentrations generally showed a decreasing trend from north to south of the YRD region, which was well captured by the model. For sites located in southern Jiangsu and southern Zhejiang provinces, the model showed favorable agreement with the observations. Underestimations existed for sites located in the northern part of Jiangsu and Zhejiang provinces. MB across all 24 monitoring sites ranged from as low as −90.4 µg m−3 (site in north Jiangsu province) to a slight overestimation of 11.4 µg m−3 (site in south Zhejiang province); corresponding NMB ranged from −46 % to 16 % (Table S2).
3.2 Simulated sulfate concentrations at the SAES site
Four scenarios – noHet, Het, noHet_2NH3 and Het_2NH3 – were conducted to evaluate the impact of the SO2+NO2 heterogeneous reactions and ammonia emissions on sulfate simulation. We first analyzed the modeled sulfate results at the SAES site; then we discussed the spatial patterns over the YRD region. Similar discussions of nitrate, ammonium, and PM2.5 are included in the Supplement. Table 2 shows the average sulfate concentration for different scenarios by clean, transition, and polluted periods; corresponding scatter plots are shown in Fig. 6. A complete summary of statistical metrics for each scenario or period is presented in Table S5.
Table 2Observed and simulated sulfate concentrations (µg m−3) for different scenarios by clean, transition, and polluted periods at the SAES site during 1 to 29 December 2013.
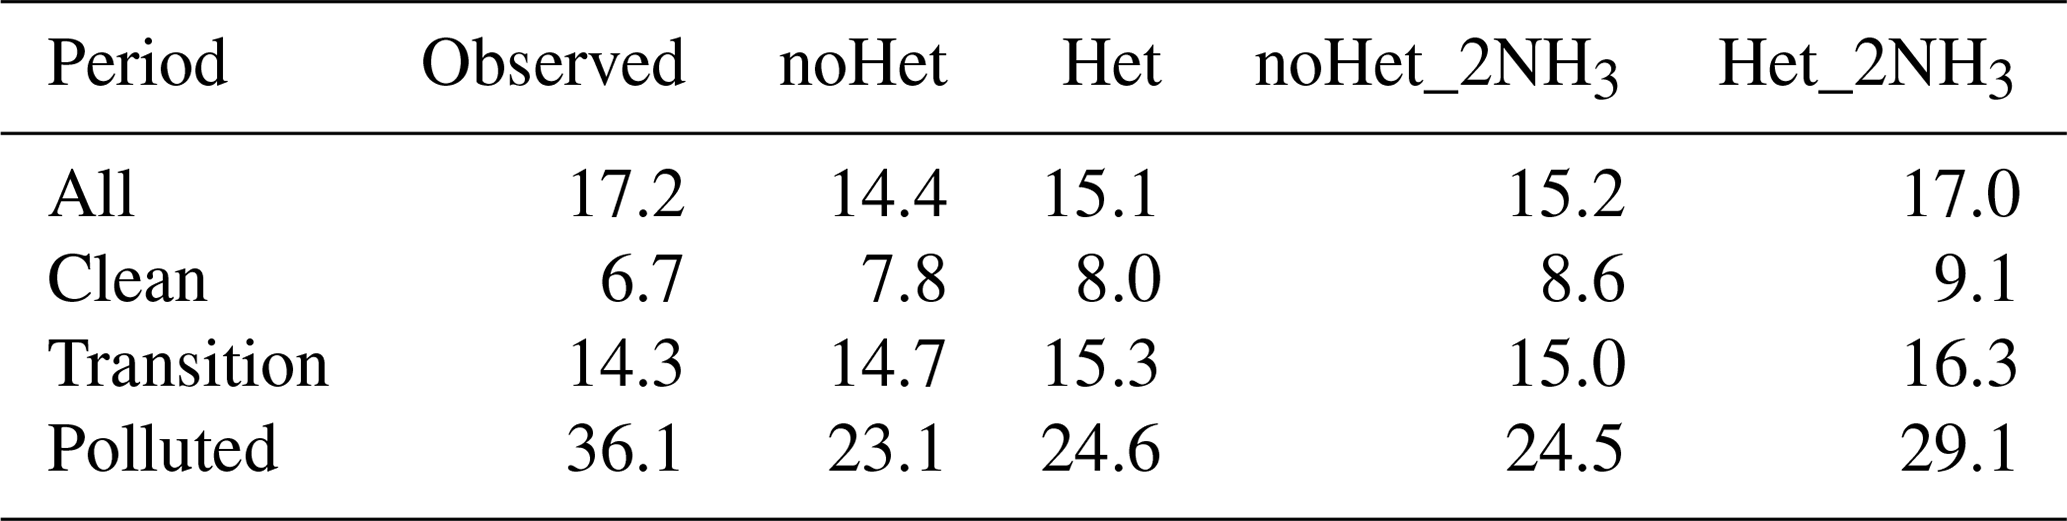

Figure 6Scatter plots of hourly sulfate concentrations for different scenarios at the SAES site during 1 to 29 December 2013. Solid lines indicate 1:1 lines and dashed lines are 1:2 and 2:1 lines.
Impact of SO2+NO2 heterogeneous reactions (noHet vs. Het)
As shown in Fig. 6, simulated sulfate concentrations compared well with observations under clean and transition conditions in the noHet scenario with overprediction by 16 % and 4 %, respectively. By contrast, large underprediction of sulfate concentration existed during polluted periods (MB of −13.0 µg m−3, NMB of −36 %). Adding the SO2+NO2 heterogeneous reactions showed small enhancement on sulfate formation, reducing the overall NMB from −16 % to −12 %. If only polluted periods are considered, simulated sulfate concentrations increased from 23.1 to 24.6 µg m−3 with the heterogeneous reactions, corresponding to an increase of 6.5 %. Thus even with the SO2+NO2 heterogeneous reactions, model was still underpredicting sulfate concentrations on heavy haze days with a NMB of −32 %. This is because aerosol pH was always acidic (pH < 3; this will be discussed in the following section) and the SO2+NO2 heterogeneous reactions were not being appreciable within this pH range (Fig. 1). Model performances for clean and transition periods were slightly compromised with the SO2+NO2 heterogeneous reactions since the base scenario was already overestimating sulfate concentrations.
Impact of NH3 emissions (noHet vs. noHet_2NH3)
Being the dominant base gas in the atmosphere, ammonia plays an essential role in the formation of secondary inorganic aerosols, and estimation of ammonia emissions is usually associated with large uncertainties (e.g., Huang et al., 2011; Fu et al., 2013). With the base case ammonia emissions, NH3 concentration was underpredicted by 3.0 ppb (NMB of −60 %). With doubled ammonia emissions, ammonia concentration was overpredicted by 1.7 ppb with NMB of 34 %, but the MB values of the total ammonia (NH3 + ammonium) concentrations were reduced from −6.9 µg m−3 (NMB of −36 %) in the base case scenario to −1.9 µg m−3 (NMB of −10 %). NMB of sulfate concentrations during polluted period is −32 %, which is similar to the enhancement caused by that of the SO2+NO2 heterogeneous reactions. Clearly, doubling ammonia emissions is not enough to close the gap between observed and simulated sulfate concentrations during heavy haze periods. We performed additional sensitivity tests with even higher ammonia emissions and found that 10 times ammonia emissions would be needed to achieve an average sulfate concentration (33.2 µg m−3) that is comparable with observation (36.1 µg m−3) under polluted conditions (with no heterogeneous reactions). However, in that case, model performance of ammonia is significantly compromised with overprediction by 32.3 ppb. These results indicate that the uncertainties associated with the ammonia emissions are not enough to fully explain the underprediction of sulfate formation during heavy haze periods in the YRD region.
Impact of both (noHet vs. Het_2NH3)
A fourth scenario (Het_2NH3) with the SO2+NO2 heterogeneous reactions as well as doubled ammonia emissions gave the best model performance of sulfate concentrations with an overall MB of −0.2 µg m−3 (NMB of −1 %, Fig. 6). During polluted periods, average sulfate concentration was predicted to be 29.1 µg m−3 (representing an increase of 26 % from the base case) and NMB was reduced from −36 % in the base scenario to −19 % in the Het_2NH3 scenario. Maximum sulfate concentration simulated under scenario Het_2NH3 was 97.2 µg m−3, which compared well with the observed maximum of 93.4 µg m−3 at the SAES site. With doubled ammonia emissions, the heterogeneous reactions were playing an increasingly important role in sulfate formation by boosting average sulfate concentrations from 24.5 (noHet_2NH3) to 29.1 µg m−3 (Het_2NH3) under polluted conditions, representing an increase of 19 %. This is because with more ammonia available, aerosol pH was elevated by ∼0.7, pushing it closer to the actual pH (as discussed more in Sect. 3.3); the rate of heterogeneous reactions is positively correlated with aerosol pH (Fig. 1), therefore leading to the best model performances from the Het_2NH3 scenario. These results indicate that the SO2+NO2 heterogeneous reactions and sufficient ammonia emissions are both needed to greatly improve model simulation of sulfate formation under polluted conditions. However, it is important to mention that model performance under clean and transition periods was compromised most under scenario Het_2NH3.
Figure S6 shows a Q–Q plot of modeled versus observed sulfate concentrations for the four scenarios. Underestimations of sulfate concentrations become noticeable around 35 µg m−3 in all scenarios, and between 35 and 55 µg m−3 there appears to be a systematically low bias in predicted sulfate concentrations that neither doubled ammonia emissions nor the heterogeneous reactions, or both, could stimulate notable sulfate formation. Scenario Het_2NH3 gives the best model performance with an overall MB of −0.2 µg m−3 but still underpredicts sulfate formation under heavy haze periods by −19 %. This could be related to still biased ammonia emissions, less direct emissions of sulfate and/or SO2, and/or other missing sulfate formation pathways that need further investigation. For example, Shao et al. (2019) included heterogeneous sulfate formation via oxidations by O3, H2O2, and Fe(III)/Mn(II), in addition to the aqueous-phase reactions, and concluded that the metal-catalyzed reactions dominated the heterogeneous sulfate formation. These heterogeneous reactions were not included in the current study and could lead to some underestimate of sulfate formation. As mentioned above, the parameterization of the k0 values is relatively conservative at high-RH conditions, which are favorable for sulfate formation. In addition, reported aerosol hygroscopicity bias in meteorology could also play some roles here as we are seeing systematic underestimation of all gaseous and PM species. Another explanation is that although the SO2+NO2 heterogeneous reactions implemented in this study were parameterized based on observations in Beijing, the simulation is performed over the YRD region. It would be ideal to use local observations for model parameterization in future studies.
Sulfate formation budget
To gain a closer look at the sulfate formation via different pathways (e.g., gas phase vs. aqueous phase vs. heterogeneous phase, Table 1), we constructed a sulfate formation budget in a similar manner as Shao et al. (2019). Figure 7 shows the relative contribution of primary sulfate emissions as well as the individual sulfate formation pathways to the total sulfate concentrations at the SAES site under different conditions. Overall, primary sulfate emissions and secondary formation accounted for half of the total sulfate concentrations. Of the secondary sulfate, gas-phase reactions always dominated secondary sulfate formation, with relatively consistent contributions around 38 %–39 % under different conditions. As pollution developed, contributions from secondary formation exceeded that of primary emissions, accounting for 60 % of total sulfate abundances under polluted conditions. In contrast to the relatively consistent contribution from the gas-phase formation, both aqueous and heterogeneous sulfate formation doubled from clean to polluted periods, and relative contributions increased from 4.1 % to 9.4 % for the former and from 5.0 % to 12.6 % for the latter.
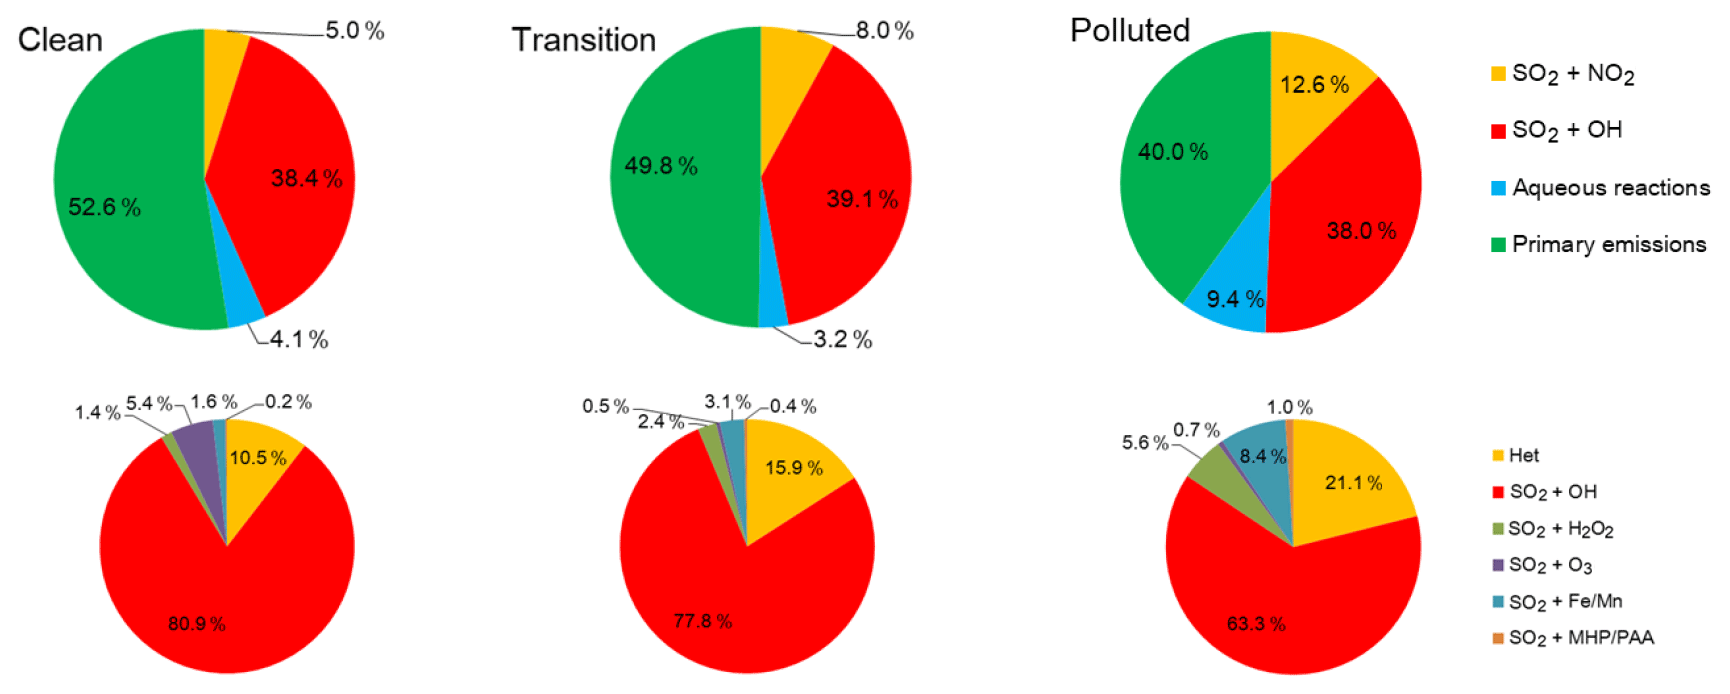
Figure 7Relative contribution of different pathways to sulfate concentrations at the SAES site during clean, transition, and polluted periods. Primary sulfate emissions were excluded in the bottom row.
If we exclude the contribution of primary sulfate emissions (i.e., bottom row in Fig. 7), the absolute sulfate formation via the gas-phase reactions more than doubled from clean (1.59 µg m−3) to polluted (3.61 µg m−3) periods; however, the relative contribution from gas-phase formation among all formation pathways dropped from 80.9 % to 63.3 % as pollution developed. Sulfate formation from all aqueous-phase reactions increased from 0.17 µg m−3 under clean conditions to 0.89 µg m−3 under polluted conditions, corresponding to an increase in relative contribution from 8.6 % to 15.6 %. Under all conditions, aqueous oxidation due to MHP and PAA is negligible, with less than 1 % of sulfate contribution. The rest of the three aqueous pathways in turn dominated aqueous sulfate formation depending on the specific condition. For instance, under clean conditions, oxidation by O3 was the dominant aqueous contributor (accounting for 5.4 % of all sulfate formation pathways) but ignorable (< 1 %) under polluted conditions. While modeled SO2 concentrations increased from 33.2 to 53.5 µg m−3 as pollution developed, simulated O3 concentrations dropped by almost half from 8.7 ppb (∼18.7 µg m−3) under clean conditions to 5.2 ppb (∼11 µg m−3) under polluted conditions, leading to reduced sulfate formation from aqueous oxidation by O3 under more severe haze. Predicted O3 concentrations in this study are much higher than the values (∼1 ppb) assumed by Cheng et al. (2016) and Wang et al. (2016) but are comparable to values reported by Shao et al. (2019; 9 ppb) for a haze episode in Beijing.
Sulfate formation associated with H2O2 and Fe(III)/Mn(II) showed the opposite trend: the H2O2 pathway only contributed 1.4 % (0.03 µg m−3) of total sulfate formation under clean conditions and increased to 5.6 % (0.12 µg m−3) under polluted conditions, representing an increase by a factor of 3. Predicted H2O2 concentration at the SAES site was 0.03 ppb on average and the maximum value could reach 0.29 ppb. These values are slightly lower than the values observed in Beijing (average around 0.05 ppb and maximum of 0.90 ppb) by Ye et al. (2018) but are comparable in terms of the magnitude. However, without any H2O2 observations in Shanghai, it would be inappropriate to conclude whether the model is over- or underpredicting H2O2 levels in Shanghai. Based on our current results, H2O2 oxidation is not the dominant contributor to sulfate formation during our study period.
Oxidation pathway involving Fe(III)/Mn(II) also contributed more to sulfate formation as polluted developed. Under polluted conditions, Fe(III)/Mn(II)-catalyzed sulfate oxidation is the dominant aqueous formation pathway, accounting for 8.4 % (0.48 µg m−3) of secondary sulfate formation. CAMx estimates the Fe(III) and Mn(II) concentrations by assuming a constant mass fraction (3.355 % for Fe(III) and 1.15 % for Mn(II)) based on the dust and primary PM2.5 concentrations. Values of 10 % for Fe (III) and 50 % for Mn (II) were set to represent the soluble fractions in the cloud water. Values of 10 % for Fe(III) during the day and 90 % for Fe(III) during the night as well as all Mn(II) were assumed to be in the oxidized ionic state. Based on these assumptions, modeled soluble concentrations during December 2013 were 1.51±1.68 µM for Fe(III) and 0.51±0.31 µM for Mn(II); the ranges of estimated soluble Fe(III) and Mn(II) were 0.1–10.7 and 0.05–2.47 µM, respectively. These results are somewhat lower than the values reported by Shao et al. (2019) and other studies cited in the paper, but the overall magnitudes are well comparable. We realize that assuming constant Fe and Mn mass fraction is a simplification, and the latest CAMx version has the option to treat Fe and Mn as primary species. However, using this option would put even more burden on the emission inventory to have accurate source speciation profiles for different source sectors. Nevertheless, although this Fe(III)/Mn(II)-catalyzed pathway stands out among all aqueous pathways under polluted conditions, the relative contribution (8.4 %) is only about one of that from the SO2+NO2 heterogeneous reactions (21.1 %). As for the SO2+NO2 heterogeneous reactions, its contribution to sulfate formation doubled from 10.5 % (0.21 µg m−3) under clean conditions to 21.1 % (1.2 µg m−3) under polluted conditions. Under all conditions, the relative contribution of the SO2+NO2 heterogeneous reactions exceeds the sum of all aqueous pathways, indicating the importance of heterogeneous oxidation pathways compared to aqueous pathways.
Sulfate formation under selected episodes
We further selected four heavy haze episodes (EP1-EP4) with observed sulfate concentrations continuously exceeding 30 µ g m−3 (as highlighted in Fig. 4) at the SAES site. These episodes lasted from 9 h (EP2) to as long as 37 h (EP1) with episode average sulfate concentrations all above 50 µg m−3 (Fig. S7), except for EP3 (36.2 µg m−3) (Table S6). Maximum hourly sulfate concentrations ranged from 48.6 µg m−3 for EP3 to 93.4 µg m−3 for EP2. The averaged molar sulfate and SO2 ratio ([] ∕ [SO2]) for EP1 and EP2 are higher (0.52 and 0.70, respectively) than those for EP3 (0.17) and EP4 (0.19). In the base case scenario, sulfate formation was significantly underestimated for all four episodes with NMB ranging from −39 % to −72 %. Figure S8 shows the sulfate formation budget for the four episodes of the base case scenario. The gas-phase oxidation pathway was the dominant contributor, accounting for 52 % (EP2) to 79 % (EP3) of total secondary sulfate formation, followed by the SO2+NO2 heterogeneous reactions with contributions of 20 %–39 %. For EP1 and EP2, the Fe/Mn-catalyzed oxidation pathway contributed ∼10 % of sulfate formation but were negligible for the other two episodes. It is interesting to note that for all selected episodes, except EP3, sulfate formation was enhanced in scenario Het_2NH3 by 10.4 to 14.6 µg m−3, while EP3 only exhibits minimal increase in modeled sulfate concentrations by only 0.8 µg m−3. We performed additional sensitivity tests and found that even with 10 times ammonia emissions, modeled sulfate concentration during EP3 is enhanced by only 2.3 µg m−3, which is still much lower compared to the observed values. We suspect that other factors, e.g., meteorology, might be biased during EP3 and lead to the underpredicted sulfate concentrations. For instance, we looked at the model performance of WRF predictions for individual episodes. All four episodes had some overprediction of wind speeds with NMB values ranging from 4 % for EP2 to as much as 43 % for EP3. Clearly, the large overprediction of wind speeds during EP3 contributed partially to the underestimated sulfate concentrations by the model. Another potential cause for sulfate underprediction could be a failure to capture episodic primary sulfate emissions during EP3. When EP3 is excluded, modeled sulfate concentrations during heavy pollution episodes are greatly enhanced from 33.5 µg m−3 in the base scenario to 46.2 µg m−3 in scenario Het_2NH3 (increase of 38 %), due to the combined influences of the SO2+NO2 heterogeneous reactions and doubled ammonia emissions.
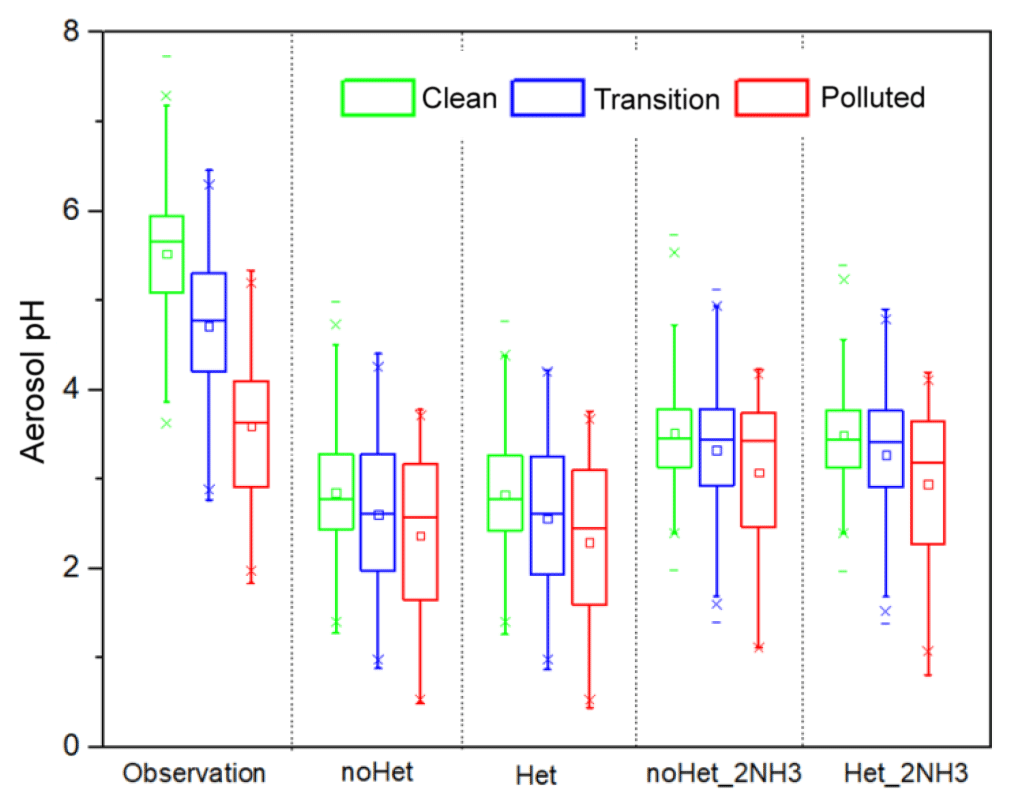
3.3 Observed and predicted aerosol pH at the SAES site
Aerosol pH, which is calculated from ISORROPIA either based on observations or within CAMx, is crucial for the heterogeneous SO2+NO2 reactions to be effective. Observation-based aerosol pH was calculated using forward metastable mode by ISORROPIA to be consistent with the CAMx ISORROPIA configuration. Figure 8 shows the distribution of observation-based and modeled aerosol pH at the SAES site by scenario or period. As indicated by both observation-based and modeled pH values, aerosols become more acidic as pollution develops. This is consistent with the higher SO2 concentrations observed under polluted conditions (Fig. S9). For observation-based values, aerosol pH dropped by 35 % from clean to polluted conditions, while modeled aerosol pH dropped by 13 %–17 % under different scenarios. As also shown by Fig. 8, observation-based aerosol pH values are consistently higher than modeled values for all scenarios. Averaged observed-based pH values during clean, transition, and polluted periods are 5.5, 4.7, and 3.6, while corresponding values for the base scenario (noHet) are 2.8, 2.6, and 2.3, each representing an underestimation by 48 %, 45 %, and 34 %. Maximum aerosol pH reached 5.0, 4.4, and 3.8 under clean, transition, and polluted periods in the base scenario in contrast to observation-based values of 7.7, 6.5, and 5.3. Adding the SO2+NO2 heterogeneous reactions causes a small decrease (0.03–0.07) in predicted aerosol pH. The discrepancies between observation-based and model-based aerosol pH values might be due to significant underprediction of NH3 and ammonium concentrations. Therefore, when NH3 emissions are doubled, modeled aerosol pH increases by ∼0.7 to 3.0–3.5 and underestimation of aerosol pH for scenario noHet_2NH3 is reduced to 36 % during clean periods and 15 % during polluted periods. Maximum aerosol pH during clean, transition, and polluted periods is 5.7, 5.1, and 4.2 under scenario noHet_2NH3. Again, adding the SO2+NO2 reactions on top of doubled NH3 emissions slightly decreases the aerosol pH by 0.03–0.12, with stronger reduction associated with further enhancement of sulfate formation. Both observation-based and model-based aerosol pH values at the SAES site indicate that aerosol pH is acidic, which is lower than the more neutralized values reported in previous studies for the Beijing–Tianjin–Hebei region (e.g., values of 5.4 to 6.2 reported by Cheng et al. (2016) and values of 6.0 to 7.6 by Wang et al. (2016); the latter were later found to be associated with a coding bug in ISORROPIA). This difference might be due to lower ammonia levels in Shanghai compared with Beijing (S. Wang et al., 2015). However, even when ammonia emissions are increased by 10 times, the maximum modeled aerosol pH value is 4.8 under polluted conditions, which is still lower than the values reported for north China. Our results indicate that the aerosol pH at the SAES site tends to be moderately acidic regardless of the ambient ammonia concentrations. However, the acidity of aerosols in China still remains to be subject to vigorous debate. For example, Shi et al. (2017) reported a wide range of pH values between 0.33 and 13.6, depending on the source contributions. Xie et al. (2019) found that the predicted particulate pH values increased from moderately acidic to nearly neutral with the increase in nitrate-to-sulfate molar ratio.
3.4 Spatial impact of the SO2+NO2 heterogeneous reactions and ammonia emissions
Figure 9 shows the spatial distribution of monthly mean sulfate, SO2, ammonia concentrations, and aerosol pH simulated in the base case and the differences between base case and three other sensitivity runs in the YRD region. Similar plots of nitrate, ammonium, and PM2.5 are shown in Fig. S10. Overall, impacts of the heterogeneous reactions and ammonia emissions over the YRD region are similar to that observed at the SAES site. With the SO2+NO2 heterogeneous reactions only, predicted monthly mean sulfate concentrations show a ubiquitous increase of 0.1–5 µg m−3 across the domain with a larger increase observed in the north and northwest directions. Regions with a relatively higher increase in predicted sulfate concentrations closely track regions with relatively high aerosol pH and high ammonia concentrations. Aerosol pH decreases slightly because more SO2 is pulled into the aerosol phase. For nitrate concentrations (Fig. S10), however, the heterogeneous reactions lead to an increase in the northwest region but decrease for the rest of the YRD region, and magnitudes of changes in both directions are within 1 µg m−3. Predicted ammonium concentrations show a less than 1 µg m−3 increase over the majority of the domain. Domain-averaged PM2.5 concentrations increased by 1.2 µg m−3 with spatial patterns similar to sulfate.
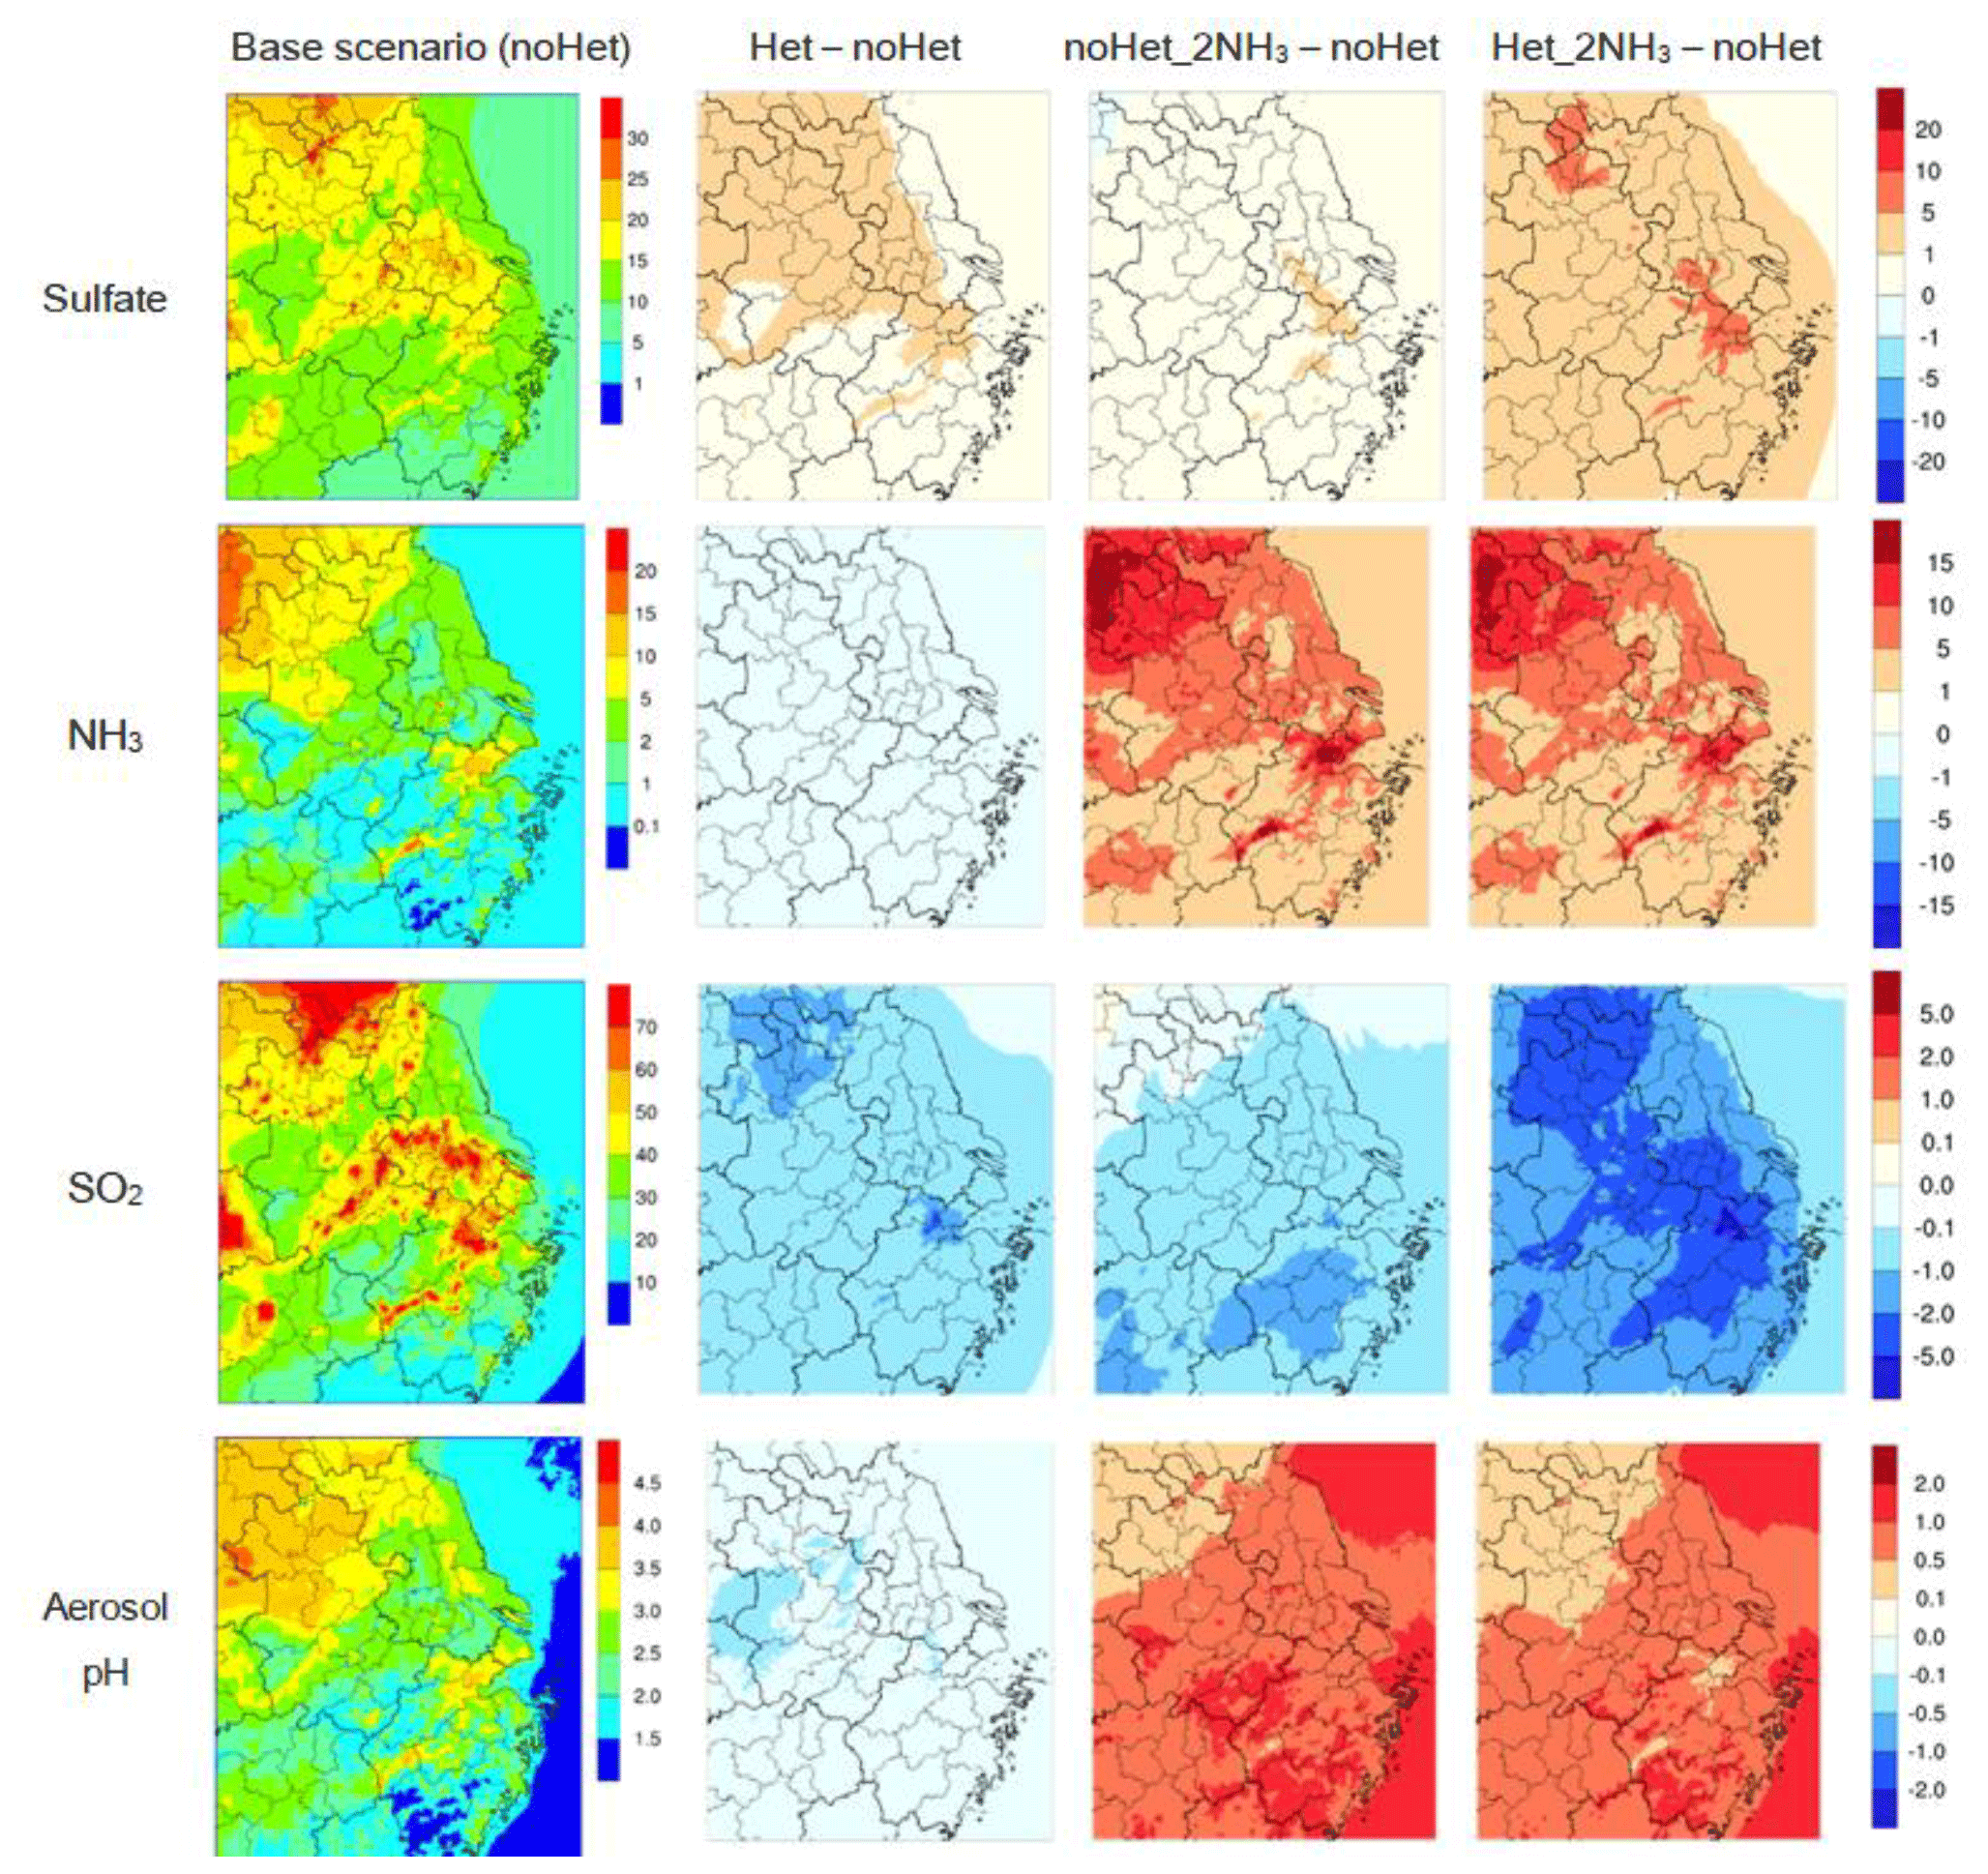
Figure 9Spatial distribution of simulated monthly sulfate (top row), NH3 (second row), and SO2 (third row) concentrations (µg m−3) and aerosol pH (bottom row) over the YRD region for the base case scenario (first column) and the differences (µg m−3 for concentrations) between the base case and other three scenarios: Het (second column), noHet_2NH3 (third column), and Het_2NH3 (fourth column).
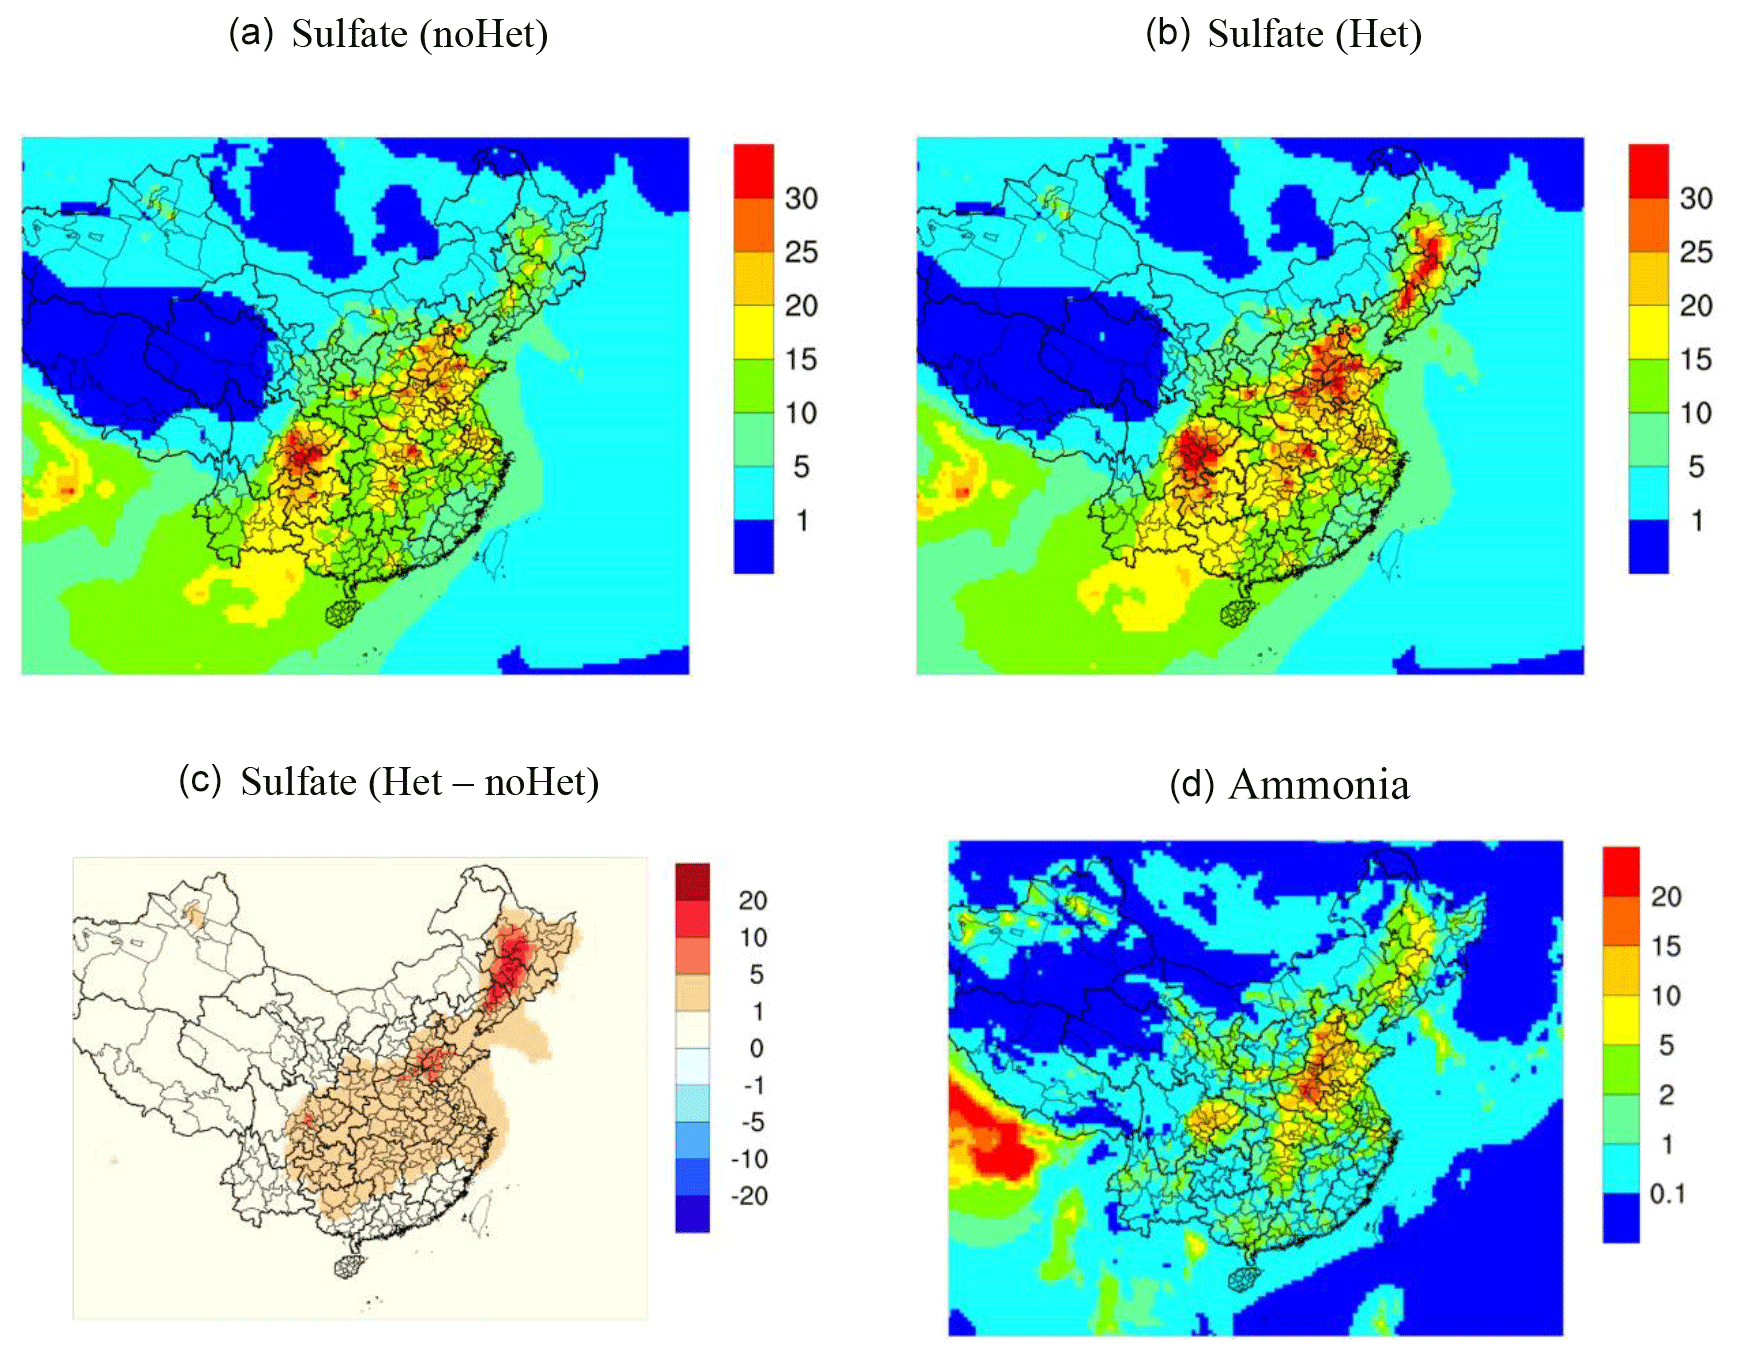
Figure 10Spatial distribution of simulated monthly sulfate concentrations (µg m−3) over the 36 km domain for the base case scenario (a), Het (b) and the differences between the two scenarios (c) and ammonia concentrations (µg m−3; d).
With doubled ammonia emissions, predictions of all three inorganic PM species are enhanced with most profound impacts observed for nitrate (Figs. 8 and S10). A uniform increase across the YRD region is observed for predicted sulfate concentrations; for nitrate and ammonium, an increase in predicted concentrations is more significant towards the south. Domain-averaged sulfate, nitrate, ammonium, and PM2.5 concentrations increase of 0.5, 6.2, 0.3, and 8.0 µg m−3, respectively. Aerosol pH is also elevated (on average by 0.3) with more ammonia available. In south Anhui and south Zhejiang provinces, elevation of aerosol pH exceeds one unit. Areas with larger pH increase are also areas with relatively lower pH values in the base scenario, indicating that aerosol pH responds nonlinearly to changes in ammonia emissions.
When both the heterogeneous reactions and doubled ammonia emissions are considered, simulated sulfate concentrations are enhanced by 2.7 µg m−3 across the YRD region. Again, areas with relatively larger enhancement of sulfate concentrations are regions with relatively high aerosol pH values and not necessarily regions with maximum increase in aerosol pH. Minimal changes in nitrate and ammonium concentrations are observed with and without the heterogeneous reactions when ammonia emissions are doubled. For PM2.5, domain-averaged concentrations increase of 11.6 µg m−3. Simulated PM2.5 concentrations show better agreement with observations at the 24 monitoring sites (Fig. 5); averaged NMB is reduced from −21 % in the base scenario to −11 % in scenario Het_2NH3.
Figure 10 further compares the average simulated sulfate concentrations between the base case and Het scenarios for the outer 36 km domain during the modeling period. In the base case simulation, high sulfate concentrations were noticed at scattered cities over the North China Plain, central China, and the central part of the Sichuan Basin, corresponding to regions with elevated SO2 concentrations. Implementing the SO2+NO2 heterogeneous reactions enhanced simulated sulfate concentrations by at least 1–5 µg m−3 for regions to the east of the “Hu Line”. In particular, the Northeast China Plain shows the most significant sulfate enhancement of more than 10 µg m−3; simulated average sulfate concentrations in the Northeast China Plain increased from less than 20 µg m−3 during the base case scenario to more than 30 µg m−3 in the Het scenario. For other regions, including the North China Plan and Sichuan Basin that show relatively high sulfate concentrations in the base case scenario, sulfate concentrations were increased by 5–10 µg m−3 due to the implementation of the reactive SO2 uptake mechanism. The spatial pattern of sulfate enhancement generally follows that of predicted ammonia concentrations, once again suggesting the important role of ammonia emissions for this mechanism. Future studies and local sulfate observations are needed to evaluate this mechanism for other parts of China, especially for the Northeast China Plain.
A new parameterization of the SO2+NO2 heterogeneous reactions based on observations in Beijing to improve model simulation of sulfate formation under heavy haze conditions in the YRD region was implemented in this study. Unlike previous studies that only considered the influence of relative humidity on sulfate formation, we included the impact of aerosol pH in our parameterization. Four CAMx sensitivity runs were conducted to evaluate the importance of the SO2+NO2 heterogeneous reactions as well as ammonia emissions on simulated sulfate concentrations in the YRD region. Base case simulation showed reasonable model performance of sulfate with an overall MB of −2.7 µg m−3 but significantly underpredicted sulfate concentrations by 36 % during polluted conditions. Implementation of the SO2+NO2 heterogeneous reactions alone showed a slight improvement in sulfate simulation (increase of 6.5 %) under polluted conditions due to acidic aerosol pH. Ammonia concentrations were significantly underestimated by the model. Doubling ammonia emissions alone exhibited a similar impact (sulfate increase of 5.6 %) with that of the SO2+NO2 heterogeneous reactions alone. Nevertheless, aerosol pH increased by 0.7 with doubled ammonia emissions, which enabled the SO2+NO2 heterogeneous reactions to become effective. Thus, in a fourth scenario where both the SO2+NO2 heterogeneous reactions and doubled ammonia emissions were considered, simulated sulfate concentrations during polluted periods increased from 23.1 µg m−3 in the base case to 29.1 µg m−3, representing an increase of 26 %. Results for sulfate simulations over entire China shows that for some parts of China, especially the Northeast China Plain, implementing the SO2+NO2 heterogeneous reactions could lead to an as much as 20 µg m−3 increase in sulfate concentrations and the spatial pattern of sulfate enhancement follows closely to that of ammonia concentrations.
In this study, we considered two questions. First, is the observation-based estimate from Beijing compatible with data from Shanghai? The answer is yes. Based on the observed data of our modeling period in Shanghai, heavy winter haze events share many similarities between Beijing and Shanghai; for example, increased sulfate fraction under polluted conditions and sulfate to SO2 ratio increases with RH. If the parameterization based on Beijing data generates too much sulfate in Shanghai, we could conclude that the parameterization is inconsistent with the data for Shanghai. However, this was not the case, even with increased ammonia emissions. So the parameterization is consistent with the data for Shanghai. The second question we wanted to answer is the following. When we apply the rate estimate for Beijing to Shanghai, do we find that NO2+SO2 can be potentially important in Shanghai? The answer is also yes, depending on the pH level, which depends on the NH3 emission. However, underprediction of sulfate concentration still exists (by 20 %) in the YRD region under polluted conditions even with the SO2+NO2 heterogeneous reactions and doubled ammonia emissions, which urges further efforts to better constrain the parameterization of the SO2+NO2 heterogeneous reactions using local data and to improve the accuracy of the ammonia emission inventory. For instance, we would ideally like to have observed sulfate and precursor concentrations at a pair of sites oriented upwind and downwind (so that the differences between the two sites constrain sulfate production), observed particle characterization (e.g., particle diameter, number concentrations), and robust NH3 concentrations to constrain aerosol pH. Follow-up studies can be conducted once these data become available. The analysis of the modeled sulfate formation budget shows that transition metal (Fe and Mn) concentrations are influential on sulfate production and therefore improving the emission inventory for PM2.5, Fe, and Mn will improve model performance for sulfate and could also influence model assessments of how sulfate concentrations respond to emission management strategies that reduce PM2.5, Fe, and Mn concentrations in the YRD region.
All data and modified CAMx code are available upon request from the corresponding authors.
The supplement related to this article is available online at: https://doi.org/10.5194/acp-19-14311-2019-supplement.
LH, JA, LL, CH, and GY designed the research; BK and LH modified the code; RY conducted the WRF simulation; JA conducted the CAMx simulations; LH and JA analyzed the data; LL, GY, CH, and YW provided important academic guidance; LH and JA wrote the paper with contributions from all authors.
The authors declare that they have no conflict of interest.
This article is part of the special issue “Multiphase chemistry of secondary aerosol formation under severe haze”. It is not associated with a conference.
We thank Qi Zhang, Qian Wang, and Hongli Li from Shanghai University for helping with the data analysis.
This research has been supported by the Shanghai Sail Program (grant no. 19YF1415600), the National Natural Science Foundation of China (grant no. 41875161), and the Chinese National Key Technology R&D Program (grant nos. 2014BAC22B03 and 2018YFC0213800).
This paper was edited by Hang Su and reviewed by two anonymous referees.
Cheng, Y., Zheng, G., Wei, C., Mu, Q., Zheng, B., Wang, Z., Gao, M., Zhang, Q., He, K., Carmichael, G., Pöschl1, U., and Su, H.: Reactive nitrogen chemistry in aerosol water as a source of sulfate during haze events in China, Sci. Adv., 2, e1601530, https://doi.org/10.1126/sciadv.1601530, 2016.
Emmons, L. K., Walters, S., Hess, P. G., Lamarque, J.-F., Pfister, G. G., Fillmore, D., Granier, C., Guenther, A., Kinnison, D., Laepple, T., Orlando, J., Tie, X., Tyndall, G., Wiedinmyer, C., Baughcum, S. L., and Kloster, S.: Description and evaluation of the Model for Ozone and Related chemical Tracers, version 4 (MOZART-4), Geosci. Model Dev., 3, 43–67, https://doi.org/10.5194/gmd-3-43-2010, 2010.
Fountoukis, C. and Nenes, A.: ISORROPIA II: a computationally efficient thermodynamic equilibrium model for K+----Na+--NO3-Cl−-H2O aerosols, Atmos. Chem. Phys., 7, 4639–4659, https://doi.org/10.5194/acp-7-4639-2007, 2007.
Fu, X., Wang, S., Zhao, B., Xing, J., Cheng, Z., Liu, H., and Hao, J.: Emission inventory of primary pollutants and chemical speciation in 2010 for the Yangtze River Delta region, China, Atmos. Environ., 70, 39–50, https://doi.org/10.1016/j.atmosenv.2012.12.034, 2013.
Gao, M., Carmichael, G. R., Wang, Y., Ji, D., Liu, Z., and Wang, Z.: Improving simulations of sulfate aerosols during winter haze over Northern China: the impacts of heterogeneous oxidation by NO2, Front. Environ. Sci. Eng., 10, 16, https://doi.org/10.1007/s11783-016-0878-2, 2016a.
Gao, M., Carmichael, G. R., Wang, Y., Saide, P. E., Yu, M., Xin, J., Liu, Z., and Wang, Z.: Modeling study of the 2010 regional haze event in the North China Plain, Atmos. Chem. Phys., 16, 1673–1691, https://doi.org/10.5194/acp-16-1673-2016, 2016b.
Guenther, A. B., Jiang, X., Heald, C. L., Sakulyanontvittaya, T., Duhl, T., Emmons, L. K., and Wang, X.: The Model of Emissions of Gases and Aerosols from Nature version 2.1 (MEGAN2.1): an extended and updated framework for modeling biogenic emissions, Geosci. Model Dev., 5, 1471–1492, https://doi.org/10.5194/gmd-5-1471-2012, 2012.
Guo, H., Weber, R. J., and Nenes, A.: High levels of ammonia do not raise fine particle pH sufficiently to yield nitrogen oxide-dominated sulfate production, Sci. Rep., 7, 12109, https://doi.org/10.1038/s41598-017-11704-0, 2017.
He, H., Wang, Y., Ma, Q., Ma, J., Chu, B., Ji, D., Tang, G., Liu, C., Zhang, H., and Hao, J.: Mineral dust and NOx promote the conversion of SO2 to sulfate in heavy pollution days, Sci. Rep., 4, 4172, https://doi.org/10.1038/srep04172, 2014.
Huang, C., Chen, C. H., Li, L., Cheng, Z., Wang, H. L., Huang, H. Y., Streets, D. G., Wang, Y. J., Zhang, G. F., and Chen, Y. R.: Emission inventory of anthropogenic air pollutants and VOC species in the Yangtze River Delta region, China, Atmos. Chem. Phys., 11, 4105–4120, https://doi.org/10.5194/acp-11-4105-2011, 2011.
Huang, Q., Cheng, S., Li, J., Chen, D., Wang, H., and Guo, X.: Assessment of PM10 emission sources for priority regulation in urban air quality management using a new coupled MM5-CAMx-PSAT modeling approach, Environ. Eng. Sci., 29, 343–349, https://doi.org/10.1089/ees.2011.0229, 2012.
Hung, H. M., Hsu, M. N., and Hoffmann, M. R.: Quantification of SO2 Oxidation on Interfacial Surfaces of Acidic Micro-Droplets: Implication for Ambient Sulfate Formation, Environ. Sci. Technol., 52, 9079–9086, https://doi.org/10.1021/acs.est.8b01391, 2018.
Jacobson, M. Z.: Development and application of a new air pollution modeling system – II, Aerosol module structure and design, Atmos. Environ., 31, 131–144, 1997.
Jia, J., Cheng, S., Liu, L., Lang, J., Wang, G., Chen, G., and Liu, X.: An Integrated WRF-CAMx Modeling Approach for Impact Analysis of Implementing the Emergency PM2.5 Control Measures during Red Alerts in Beijing in December 2015, Aerosol Air Qual. Res., 17, 2491–2508, https://doi.org/10.4209/aaqr.2017.01.0009, 2017.
Li, L., Chen, C. H., Fu, J. S., Huang, C., Streets, D. G., Huang, H. Y., Zhang, G. F., Wang, Y. J., Jang, C. J., Wang, H. L., Chen, Y. R., and Fu, J. M.: Air quality and emissions in the Yangtze River Delta, China, Atmos. Chem. Phys., 11, 1621–1639, https://doi.org/10.5194/acp-11-1621-2011, 2011.
Li, L., Cheng, S., Li, J., Lang, J., and Chen, D.: Application of MM5-CAMx-PSAT Modeling Approach for Investigating Emission Source Contribution to Atmospheric Pollution in Tangshan, Northern China, Math. Probl. Eng., 2013, 1–12, https://doi.org/10.1155/2013/136453, 2013.
Li, L., An, J. Y., Zhou, M., Yan, R. S., Huang, C., Lu, Q., Lin, L., Wang, Y. J., Tao, S. K., Qiao, L. P., Zhu, S. H., and Chen, C. H.: Source apportionment of fine particles and its chemical components over the Yangtze River Delta, China during a heavy haze pollution episode, Atmos. Environ., 123, 415–429, https://doi.org/10.1016/j.atmosenv.2015.06.051, 2015.
Liu, Y., Li, L., An, J., Huang, L., Yan, R., Huang, C., Wang, H., Wang, Q., Wang, M., and Zhang, W.: Estimation of biogenic VOC emissions and its impact on ozone formation over the Yangtze River Delta region, China, Atmos. Environ., 186, 113–128, https://doi.org/10.1016/j.atmosenv.2018.05.027, 2018.
Martin, L. R. and Good, T. W.: Catalyzed oxidation of sulfur dioxide in solution: The iron-manganese synergism, Atmos. Environ. A Gen. Top., 25, 2395–2399, 1991.
Massling, A., Stock, M., Wehner, B., Wu, Z. J., Hu, M., Bruggemann, E., Gnauk, T., Herrmann, H., and Wiedensohler, A.: Size segregated water uptake of the urban submicrometer aerosol in Beijing, Atmos. Environ., 43, 1578–1589, 2009.
Ming, L., Ling, J., Li, J., Fu, P., Yang, W., Di, L., Gan, Z., Wang, Z., and Li, X.: PM2.5 in the Yangtze River Delta, China: Chemical compositions, seasonal variations, and regional pollution events, Environ. Pollut., 223, 200–212, https://doi.org/10.1016/j.envpol.2017.01.013, 2017.
Quan, J., Tie, X., Zhang, Q., Liu, Q., Li, X., Gao, Y., and Zhao, D.: Characteristics of heavy aerosol pollution during the 2012–2013 winter in Beijing, China, Atmos. Environ., 88, 83–89, https://doi.org/10.1016/j.atmosenv.2014.01.058, 2014.
Ramboll Environ.: User's Guide for Comprehensive Air Quality Model with Extensions Version 6.40, Ramboll Environ, Novato, California, available at: http://www.camx.com/files/camxusersguide_v6-40.pdf (last access: 23 November 2019), 2016.
Seinfeld, J. H. and Pandis, S. N.: Atmospheric chemistry and physics: from air pollution to climate change, Atmospheric chemistry and physics: from air pollution to climate change, John Wiley & Sons, Chichester, 2006.s
Shao, J., Chen, Q., Wang, Y., Lu, X., He, P., Sun, Y., Shah, V., Martin, R. V., Philip, S., Song, S., Zhao, Y., Xie, Z., Zhang, L., and Alexander, B.: Heterogeneous sulfate aerosol formation mechanisms during wintertime Chinese haze events: air quality model assessment using observations of sulfate oxygen isotopes in Beijing, Atmos. Chem. Phys., 19, 6107–6123, https://doi.org/10.5194/acp-19-6107-2019, 2019.
Shi, G., Xu, J., Peng, X., Xiao, Z., Chen, K., Tian, Y., Guan, X., Feng, Y., Yu, H., Nenes, A., and Russell, A. G.: pH of aerosols in a polluted atmosphere: source contributions to highly acidic aerosol, Environ. Sci. Technol., 51, 4289–4296, 2017.
Song, S., Gao, M., Xu, W., Shao, J., Shi, G., Wang, S., Wang, Y., Sun, Y., and McElroy, M. B.: Fine-particle pH for Beijing winter haze as inferred from different thermodynamic equilibrium models, Atmos. Chem. Phys., 18, 7423–7438, https://doi.org/10.5194/acp-18-7423-2018, 2018.
Song, S., Gao, M., Xu, W., Sun, Y., Worsnop, D. R., Jayne, J. T., Zhang, Y., Zhu, L., Li, M., Zhou, Z., Cheng, C., Lv, Y., Wang, Y., Peng, W., Xu, X., Lin, N., Wang, Y., Wang, S., Munger, J. W., Jacob, D. J., and McElroy, M. B.: Possible heterogeneous chemistry of hydroxymethanesulfonate (HMS) in northern China winter haze, Atmos. Chem. Phys., 19, 1357–1371, https://doi.org/10.5194/acp-19-1357-2019, 2019.
Wang, G., Zhang, R., Gomez, M. E., Yang, L., Zamora, M. L., Hu, M., Lin, Y.,Peng, J., Guo, S., Meng J and Li, J.: Persistent sulfate formation from London Fog to Chinese haze, P. Natl. Acad. Sci. USA, 113, 13630–13635, https://doi.org/10.1073/pnas.1616540113, 2016.
Wang, M., Cao, C., Li, G., and Singh, R. P.: Analysis of a severe prolonged regional haze episode in the Yangtze River Delta, China, Atmos. Environ., 102, 112–121, https://doi.org/10.1016/j.atmosenv.2014.11.038, 2015.
Wang, S., Nan, J., Shi, C., Fu, Q., Gao, S., Wang, D., Cui, H., Saiz-Lopez, and Zhou, B.: Atmospheric ammonia and its impacts on regional air quality over the megacity of Shanghai, China, Sci. Rep., 5, 15842, https://doi.org/10.1038/srep15842, 2015.
Wang, Y., Zhang, Q., Jiang, J., Zhou, W., Wang, B., He, K., Duan, F., Zhang, Q., Philip, S., and Xie, Y.: Enhanced sulfate formation during China's severe winter haze episode in January 2013 missing from current models, J. Geophys. Res.-Atmos., 119, 10425–10440, https://doi.org/10.1002/2013jd021426, 2014.
Wang, X., Li, J., Zhang, Y., Xie, S., and Tang, X.: Ozone source attribution during a severe photochemical smog episode in Beijing, China, Sci. China B Chem., 52, 1270–1280, https://doi.org/10.1007/s11426-009-0137-5, 2009.
Xie, Y., Wang, G., Wang, X., Chen, J., Chen, Y., Tang, G., Wang, L., Ge, S., Xue, G., Wang, Y., and Gao, J.: Observation of nitrate dominant PM2.5 and particle pH elevation in urban Beijing during the winter of 2017, Atmos. Chem. Phys. Discuss., https://doi.org/10.5194/acp-2019-541, in review, 2019.
Xu, J. S., Xu, H. H., Xiao, H., Tong, L., Snape, C. E., Wang, C. J., and He, J.: Aerosol composition and sources during high and low pollution periods in Ningbo, China, Atmos. Res., 178–179, 559–569, https://doi.org/10.1016/j.atmosres.2016.05.006, 2016.
Yarwood, G., Jung, J., Whitten, G. Z., Heo, G., Mellberg, J., and Estes, E.: Updates to the Carbon Bond Mechanism for Version 6 (CB6), Presented at the 9th Annual CMAS Conference, Chapel Hill, October, 2010.
Ye, X. N., Ma, Z., Hu, D. W., Yang, X., and Chen, J. M.: Size-resolved hygroscopicity of submicrometer urban aerosols in Shanghai during wintertime, Atmos. Res., 99, 353e364, https://doi.org/10.1016/j.atmosres.2010.11.008, 2011.
Ye, X., Tang, C., Yin, Z., Chen, J., Ma, Z., Kong, L., Yang, X., Gao, W., and Geng, F.: Hygroscopic growth of urban aerosol particles during the 2009 Mirage-Shanghai Campaign, Atmos. Environ., 64, 263–269, 2013.
Ye, C., Liu, P., Ma, Z., Xue, C., Zhang, C., Zhang, Y., Liu, J., Liu, C., Sun, X., and Mu, Y.: High H2O2 concentrations observed during haze periods during the winter in Beijing: importance of H2O2 oxidation in sulfate formation, Environ. Sci. Tech. Lett., 5, 757–763, 2018.
Zhang, L., Brook, J. R., and Vet, R.: A revised parameterization for gaseous dry deposition in air-quality models, Atmos. Chem. Phys., 3, 2067–2082, https://doi.org/10.5194/acp-3-2067-2003, 2003.
Zheng, B., Zhang, Q., Zhang, Y., He, K. B., Wang, K., Zheng, G. J., Duan, F. K., Ma, Y. L., and Kimoto, T.: Heterogeneous chemistry: a mechanism missing in current models to explain secondary inorganic aerosol formation during the January 2013 haze episode in North China, Atmos. Chem. Phys., 15, 2031-2049, https://doi.org/10.5194/acp-15-2031-2015, 2015.
Zheng, G. J., Duan, F. K., Su, H., Ma, Y. L., Cheng, Y., Zheng, B., Zhang, Q., Huang, T., Kimoto, T., Chang, D., Pöschl, U., Cheng, Y. F., and He, K. B.: Exploring the severe winter haze in Beijing: the impact of synoptic weather, regional transport and heterogeneous reactions, Atmos. Chem. Phys., 15, 2969-2983, https://doi.org/10.5194/acp-15-2969-2015, 2015.